 Thibaut Bouveroux
- 1Dauphin Island Sea Laboratory, Dauphin Island, AL, United States
- 2Department of Marine Sciences, University of South Alabama, Mobile, AL, United States
- 3MARBEC, Université de Montpellier, CNRS, IFREMER, IRD, Montpellier, France
- 4College of Science and Engineering, James Cook University, Townsville, QLD, Australia
- 5Marine Data Technology Hub, James Cook University, Townsville, QLD, Australia
- 6Beqa Adventure Divers, Pacific Harbor, Fiji
- 7Independent Researcher, Zurich, Switzerland
Provisioning activities in wildlife tourism often lead to short-term animal aggregations during the feeding events. However, the presence of groups does not necessarily mean that individuals interact among each other and form social networks. At the Shark Reef Marine Reserve in Fiji, several dozen bull sharks (Carcharhinus leucas) regularly visit a site, where direct feeding is conducted during tourism driven shark dives. On 3,063 shark feeding dives between 2003 and 2016, we visually confirmed the presence of 91 individual bull sharks based on external and long-lasting identification markings. We measured the intensity of associations between pairs of individuals by calculating the Simple Ratio Index (SRI) and calculated Generalized Affiliation Indices (GAIs) to distinguish true associations between dyads from structural predictor factors. Although the resulting mean SRIs were low, ranging from 0.01 to 0.12 (SRImean = 0.06; mean SRImax = 0.21), preferred long-term companionships were observed between individuals. Avoidances were also observed within pairs of individuals during the second half of the study. The best fitting model describing the temporal association patterns of bull sharks revealed a social structure which is characterized by preferred companionships and casual acquaintances. Our results suggest that the aggregation resulting from direct feeding has served to facilitate the development of social associations.
Introduction
The formation of aggregations and groups can be found occurring in taxa throughout the animal kingdom with considerable intra- and interspecific variation (Elgar, 1989; Whitehead, 1997). The two types of formations however, differ. The first type is driven by non-mutualistic forces, whereas the latter by forces which are typically mutualistic, in that some benefits are derived from group membership (Whitehead, 2008a). Aggregations can form for a multitude of underlying non-social reasons ranging from attraction to a food resource or specific habitat requirements (Johnson et al., 2002) to synchronized patterns of daily or seasonal activity (Guttal and Couzin, 2010). In contrast, animal groups, often termed “social groups” arise by way of underlying social drivers, with individuals actively preferring to associate with each other, therefore displaying social preferences. Within animal social networks, group members are more highly connected with other members in the group than with other individuals within the broader network (Croft et al., 2008). Social groups have been empirically investigated in a wide range of taxonomic groups including insects, fish, birds, and mammals (Chepko-Sade et al., 1989; Elena et al., 1999; Fewell, 2003; Lusseau and Newman, 2004; Cross et al., 2005; Wittemyer et al., 2005; Croft et al., 2006; Naug, 2008; McDonald, 2009; Vital and Martins, 2011).
Historically, sharks have been perceived as solitary predators, however, according to recent studies, some species may exhibit both aggregation and social grouping (Clua et al., 2013; Bass et al., 2016). Moreover aggregation may well lay the important groundwork for the development of social groups (Sims et al., 2000). Currently, it is understood that sharks have the potential to form complex social structures (Mourier et al., 2019; Papastamatiou et al., 2020). For example, blacktip reef sharks, (Carcharhinus melanopterus), were shown to form stable social groups over multiple years through the use of social network analysis (Mourier et al., 2012, 2017). This pattern of social group formation is likely characteristic of reef shark species which have relatively small core home ranges (consisting of a single reef or multiple reefs in close proximity) where these sharks aggregate during the day and range further at night (Barnett et al., 2012). In another reef shark species, gray reef sharks (Carcharhinus amblyrhynchos), formed large groups during the day which dispersed into smaller groups and individuals at night, most likely for foraging (Papastamatiou et al., 2020). Aggregation and dispersion behavior such as these can be explained by two theoretical frameworks: fission-fusion dynamics and central place foraging (CPF) (Kirkwood and Arnould, 2011; Sueur et al., 2011; Jones et al., 2020). In fission-fusion dynamics, “fission” is where individuals split from a larger group (e.g., reef sharks dispersing at night), and “fusion” is where individuals rejoin the larger group (e.g., reef sharks returning to core area the following day) (Papastamatiou et al., 2020). Conceptually similar, yet slightly nuanced, CPF theory describes behavior where animals periodically move in and out of a central place, normally associated with resting and foraging (Orians and Pearson, 1979; Papastamatiou et al., 2018). The two frameworks are non-mutually exclusive as central place foragers can display fission-fusion dynamics over short temporal periods (Papastamatiou et al., 2020).
Wildlife tourism can facilitate the formation of aggregations through provisioning activities such as using bait to attract and/or feed different shark species. Provisioning activities may be seasonal, short-term or even long-term, for example in locations such as Fiji or South Australia where direct and incidental shark feeding (Meyer et al., in press) have occurred regularly over many years or even decades (Brunnschweiler et al., 2014; Meyer et al., 2019). As such, long-term shark tourism sites offer unique platforms to collect baseline data, test specific hypotheses and more generally observe individual and group behavior and interactions in these artificial aggregations. For example, in Mourier et al. (2012) feeding was shown to promote sociality among blacktip reef sharks by attracting more potential social partners. Indeed, shark feeding may drive fission-fusion and CPF as Mourier et al. (2012) appears to indicate, however, the drivers are reversed, the central place is now a feeding location as opposed to a location used for resting.
The bull shark (Carcharhinus leucas) is a large, mobile species that undertakes long-range movements (Heupel et al., 2015) and is not commonly known for displaying aggregating behavior associated with CPF or fission-fusion, nor for displaying social associations under natural conditions [but see Daly et al. (2014) for example of aggregating]. Nevertheless, in the only such study for the species to date utilizing social network analysis, Loiseau et al. (2016) documented social interactions and relatively strong paired associations for two pairs of females suggesting some level of sociality among bull sharks. The study, conducted at an aquaculture farm around Reunion Island, although pioneering, was limited both in terms of sampling time (22 days) and number of identifiable individuals (n = 8). These constraints are not applicable to the Shark Reef Marine Reserve (SRMR), a long-term, multi-species shark provisioning site located on the southern coast of Viti Levu, Fiji (Brunnschweiler et al., 2014). At the SRMR, up to ∼80 bull sharks per day form short-term aggregations with individuals displaying different degrees of site fidelity. Visitation patterns vary with some individuals present almost year round while others remain absent for extended periods of time (Brunnschweiler and Barnett, 2013). The general pattern in diel movements for the bull sharks is to use the area around the provisioning site during the morning hours before dispersing over the broader neighboring reef systems at night (Brunnschweiler and Barnett, 2013). Direct shark feeding (Meyer et al., in press) has taken place since 2003, occurring up to five mornings per week, thus providing a unique opportunity for the assessment of long-term association patterns among individual bull sharks in an isolated insular ecosystem. The specific aims of this study were: (i) to investigate whether this artificial aggregation has facilitated social links between individuals, and (ii) if so, whether the associations persist temporally (i.e., are individuals reconnecting repeatedly at the provisioning events).
Materials and Methods
Study Area, Data Collection, and Focal Observation
Data were collected between January 2003 and June 2016 at the SRMR (Brunnschweiler, 2010). For a detailed description of the dive and data collection protocols and for information regarding species composition, sex identification and the relative abundance of sharks at this provisioning site see Brunnschweiler and Baensch (2011) and Brunnschweiler et al. (2014). Briefly, shark feeding dives [direct feeding; see Meyer et al. (in press) for definition of the term] take place during the morning hours, 4–5 days per week. Using direct observation sampling methods (Altmann, 1974), trained observers accompany the tourist dives to collect data on the sharks encountered, which includes total number of individuals, species, identifiable individuals present on the site as well as behavioral data (Brunnschweiler and Barnett, 2013; Brunnschweiler et al., 2014). Cues and marks used to identify individual bull sharks included missing or deformed fins, notches, scratches and coloration patterns (Brunnschweiler and Baensch, 2011). This information collected is then recorded in a database.
For this study, we used the presence-absence data for 91 individual bull sharks (77 females, 14 males; see below) encountered during 3,063 dives taking place on 1,736 diving days between 26 January 2003 and 23 June 2016 (Supplementary Table 1), with a mean number of diving days per year of 129.3 (SD = ± 49.6). The degree of residency to the feeding site for each individual was quantified by dividing the number of days the individual was observed by the number of days data was collected at the SRMR (site fidelity index SFI). Site fidelity values range from 0 to 1, with values closer to 0 indicating low site fidelity and values closer to 1 indicating high site fidelity.
Social Network Analyses
Associations were based on “co-occurrence,” such that individuals present during the same dive were considered as part of the same group (Mourier et al., 2012). For statistical procedures, we chose a daily sampling period (i.e., the period of time within which associations are examined) to remove demographic effects occurring during the study period such as birth, death, immigration, and emigration, as well as to minimize environmental bias (e.g., tidal phase, tidal range, lunar phase, turbidity) (Whitehead and Dufault, 1999; Whitehead, 2008b; Findlay et al., 2016). In studies of social organization, restrictive observation thresholds are often applied to avoid the potential for weak and non-relevant associations between pairs of individuals and/or to reduce biases associated with small sample sizes (Baird and Whitehead, 2000; Whitehead, 2008a). In this study, out of 125 cataloged bull sharks we included only individuals which were encountered on ≥34 dives which signified the first quartile (Q1 = the median of the lower half of the dataset) (mean ± SD = 151 ± 152; median = 102). Thirty-four individuals did not meet the Q1 threshold, thus the remaining 91 individuals (77 females and 14 males) who qualified were included in analyses. Because of the large number of individuals that were added to the database during the years 2009 and 2010 (Supplementary Table 1), we further divided the study period into a time series as follows: the entire study period from 2003 to 2016 (91 individuals, 3,063 dives), before 2009 (27 individuals, 1,098 dives), between 2009 and 2010 (64 individuals, 609 dives), and from 2011 (88 individuals, 1,356 dives). This allowed us to investigate the effect of a significant increase in individuals observed at the feeding site, and determine what if any variations had occurred in the nature of the associations during the discrete time series.
To measure the intensity of associations between pairs of individuals we calculated the Simple Ratio Index (SRI), the recommended association index when calibration data are not available (Hoppitt and Farine, 2018; Mourier and Planes, 2021), in SOCPROG 2.9 (Whitehead, 2009; Whitehead et al., 2019) as follows:
where, X represents the number of times sharks a and b were observed together, Yab the total number of times shark a and b were identified during separate dives, Ya the number of times shark a was identified and Yb the number of times shark b was identified (Cairns and Schwager, 1987). The SRI ranges from 0 for two sharks never seen together, to 1 for two individuals always encountered together.
An association matrix between individuals was constructed by cumulating the co-occurrences over the study period. To quantify the accuracy of associations, we utilized the correlation coefficient between the true association index (AI = true SRI matrix) and the estimated values as follows:
where S (social differentiation) is the measure of the variation of the social system and equals the coefficient of variation (CV) of true AIs (S = CVtrue), and CVest is the CV of the measured SRIs (Whitehead, 2008b). An r value > 0.4 indicates a good representation of the true social patterns, while an S value close to 0 reveals a very homogeneous society, and an S value close or higher to 1 indicates a highly differentiated society (Whitehead, 2008b). Social differentiation was estimated by maximizing the likelihood of observed dyadic associations using the algorithm available in SOCPROG 2.9 (Whitehead, 2009; Whitehead et al., 2019).
We then calculated Generalized Affiliation Indices (GAIs) to distinguish true associations between dyads (i.e., active preferences) from structural predictor factors such as the temporal overlap within the SRMR or differential association rates among sexes, within the social networks. GAIs are calculated as the raw residuals of a generalized linear model, where the response variables are the SRI values, and potential predictors are the structural factors (Whitehead and James, 2015). Three structural factors were considered in the analyses: temporal overlap in association patterns, the influence of sex and the difference in gregariousness between pairs of individuals following Whitehead and James (2015). First, we created a temporal overlap matrix based on the proportion of months that two individuals were found to be associated at the SRMR. This resulting index yields values ranging from 0 to 1, with a value of 0 indicating two individuals never observed together, and a value of 1 indicating two individuals seen together throughout the totality of months. We then created a sex similarity matrix where a value of 1 indicates the existence of a same sex pair and a value of 0 indicates two individuals of different sexes. Lastly, the gregariousness predictor amongst two individuals (a and b) was calculated using the log of the sum of the association indices involving a (except the ab index) multiplied by the sum of those involving b (except the ba index) (Whitehead and James, 2015). High positive values for GAIs indicate that pairs of individuals are more associated than expected given the structural predictor variables, while negative values indicate avoidance. Finally, multiple regression quadratic assignment procedure tests (MRQAP) were used to identify the relative influences of each predictor factor on associations (Whitehead and James, 2015).
Cluster Analyses and Community Division by Modularity
Average linkage hierarchical cluster analysis was used to characterize and illustrate social bonds between observed individuals. To determine the best type of cluster analysis to perform we used the cophenetic correlation coefficient (CCC), which is the correlation between real AIs and the levels of clustering between individuals. The CCC also indicates the effectiveness of the analysis (Bridge, 1993). It is assumed that a cluster with a CCC value higher than 0.8 is representative of a reliable separation among clusters (Whitehead, 2008b). To investigate whether the population of bull sharks in this study was divided into social clusters of individuals or communities based on social affiliations, we used the modularity clustering technique (Newman, 2004, 2006). This option allows for exploring the possibility that the population under study is usefully divided into clusters, such that association indices are generally high among individuals in the same cluster, and generally low among individuals in different clusters (Whitehead, 2009). The modularity coefficient (Q) for a defined set of clustered individuals represents the difference between the observed and expected proportion of the total of the association indices within clusters, where the expected AIs are calculated as proportional to a dyad’s product gregariousness. Modularity analyses were assessed using the maximum modularity type 1 in SOCPROG 2.9, which controls for gregariousness by focusing on association preferences. Q-values of 0.3 or higher indicate strong community divisions in the population (Newman, 2004). Sociograms were drawn using qgraph() function in qgraph packages in R V.4.0.3.
Test for Preferred and/or Avoided Associations
To determine whether the patterns of associations between individuals differed from random, we used a permutation test (Bejder et al., 1998). The permutation test option “permute associations within samples” in SOCPROG 2.9 was used to test for the presence of long-term preferred and/or avoided companionships using the SRIs (co-occurrence). This procedure tests the null hypothesis that there are no preferred companions between sampling periods, given the number of associations each individual has in each sampling period (Whitehead, 2008a). In this test, the elements of the symmetric association matrix are permuted for each sampling period keeping the total number of rows and columns constant by first choosing two individuals for the rows, and then two more individuals, different from the first pair, for the columns. Significantly higher SD of the real association indices compared with the random associations reveal the presence of non-random associations in the studied population. This test is generally the most robust test because it takes into account that not all individuals are present in each sampling interval (e.g., migration or death) or have similar gregariousness (Whitehead, 2009). This test was performed starting with 1,000 permutations which were increased in a stepwise manner by 5,000 at each step until the p-value became stabilized (Bejder et al., 1998; Whitehead, 2009). For the analyses, the number of permutations was leveled up to 40,000 permutations for the three time periods before 2009, 2009–2010 and from 2011, and at 100,000 permutations for the entire study period (2003–2016). Similar permutation tests were applied to the GAIs to investigate social preferences amongst sharks (active decisions to interact). Significantly higher SD of the observed GAIs than expected indicates the presence of social preference amongst sharks.
Temporal Variation of Associations
The temporal stability of associations between bull sharks was investigated using the standardized lagged association rates (SLARs) available in SOCPROG 2.9 that were compared with the null association rates (Whitehead, 2008a). The SLAR analysis provides an estimate of the probability of two individuals that are associating at any given time, also the probability of being associated after various time lags (Baird and Whitehead, 2000; Whitehead, 2008a). Lagged and null association rates were standardized to take into account individuals who were actually present during a dive but were not identified for whatever reason. Temporal association patterns were then compared to four different models of lagged association rates available in SOCPROG 2.9 (preferred companions, casual acquaintances, preferred companions + casual acquaintances and two levels of casual acquaintances) (Whitehead, 2009). The best-fitting model was identified using the Quasi-Akaike Information Criterion value (QAIC) (Whitehead, 2008a).
Results
Site Fidelity
Observation periods were defined as the cumulative number of days (including non-diving days) between the date an individual bull shark was first observed at the SRMR and recorded in the database, and the last day the individual was observed visiting the site. Observation periods within the database ranged from 128 days (ID# 91) to 4,885 days (ID# 2) with a median of 2,194 days (mean ± SD = 2,143 ± 1411) (Supplementary Figure 1). Presence data with respect to individual bull sharks varied greatly, with the least site visits recorded being 21 days (ID# 88) and the most site visits recorded being 554 days (ID# 2) (Supplementary Table 1). Site fidelity indexes (SFI) ranged from 0.03 (ID# 1 and ID# 16) to 0.84 (ID# 89) (mean ± SD = 0.23 ± 0.13).
Social Network and Cluster Analyses
Over the course of the entire study period (2003–2016), mean SRIs ranged between 0.01 (e.g., ID# 16 and ID# 27) and 0.12 (ID# 71 and ID# 89) resulting in a low overall mean association index between individuals (SRImean = 0.06; Table 1). Maximum SRIs ranged between 0.05 (ID# 6 and ID# 16) and 0.56 (ID# 71 and ID# 89) (mean SRImax = 0.21; Table 1). Over the entire study period, social differentiation (S) using the likelihood method was estimated at 0.989 (SE = 0.009), indicative of a socially well-differentiated population evidenced by high variations in the dyadic probability of associations. Social differentiation was higher between 2009 and 2010 (S = 0.920, SE = 0.020) in comparison to the time periods before 2009 (S = 0.894, SE = 0.020) and from 2011 (S = 0.910, SE = 0.012). The estimated correlation between the true and estimated association indices was 0.952 (SE = 0.011) revealing the power of analysis in detecting the true social system (1 indicates maximal correlation, 0 no correlation).

Table 1. Temporal variations of the average mean and maximum association indices (Simple Ratio Index SRI).
MRQAP indicated that both factors of temporal overlap and of gregariousness were good predictors for explaining association patterns of bull sharks at the SRMR, and these were included in GAIs analyses (Table 2). Sex class was removed by the stepwise procedure from the model. Sociograms were constructed using GAIs for the three distinct time periods and presented in Figure 1: before 2009 (Figure 1A), between 2009 and 2010 (Figure 1B), and from 2011 (Figure 1C). CCC values were higher than 0.8 (CCC = 0.8273 before 2009; CCC = 0.8309 between 2009 and 2010; and CCC = 0.8266 from 2011) indicating an adequate social structure representation. The bull shark population exhibited a homogeneity for each time period as each modularity value (Q) was lower than 0.3 (Qbefore2009 = 0.175; Q2009–2010 = 0.201; Qfrom 2011 = 0.189).
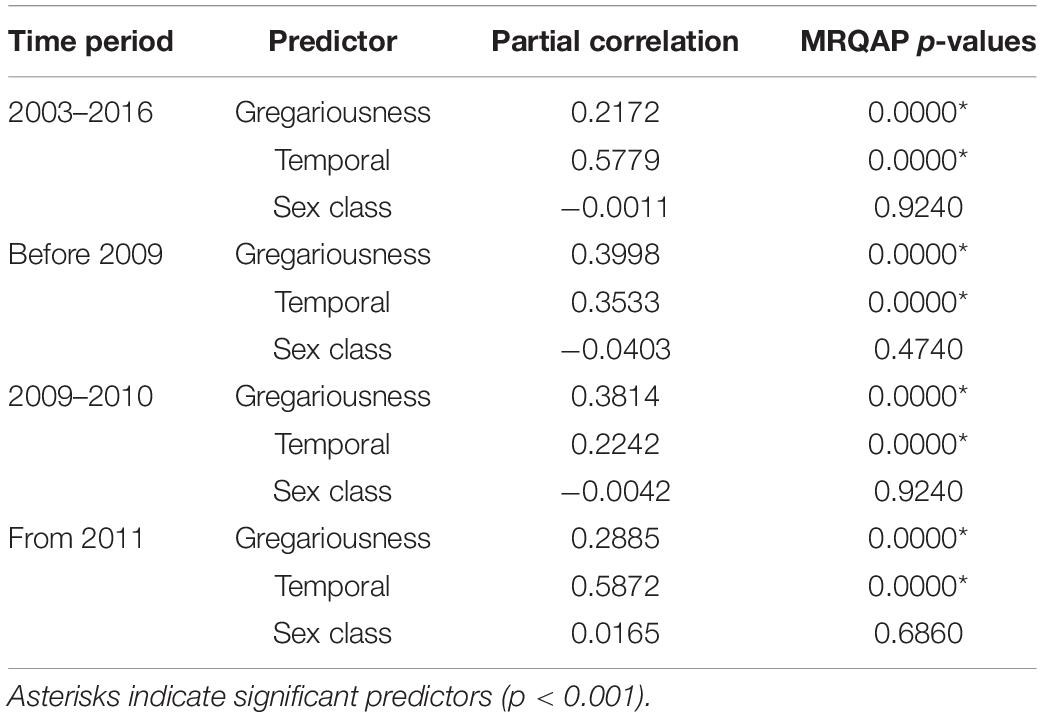
Table 2. Efficiency of predictor variables in explaining association indices between bull sharks, indicated by partial correlation coefficients and results of multiple regression quadratic assignment procedures test (MRQAP).
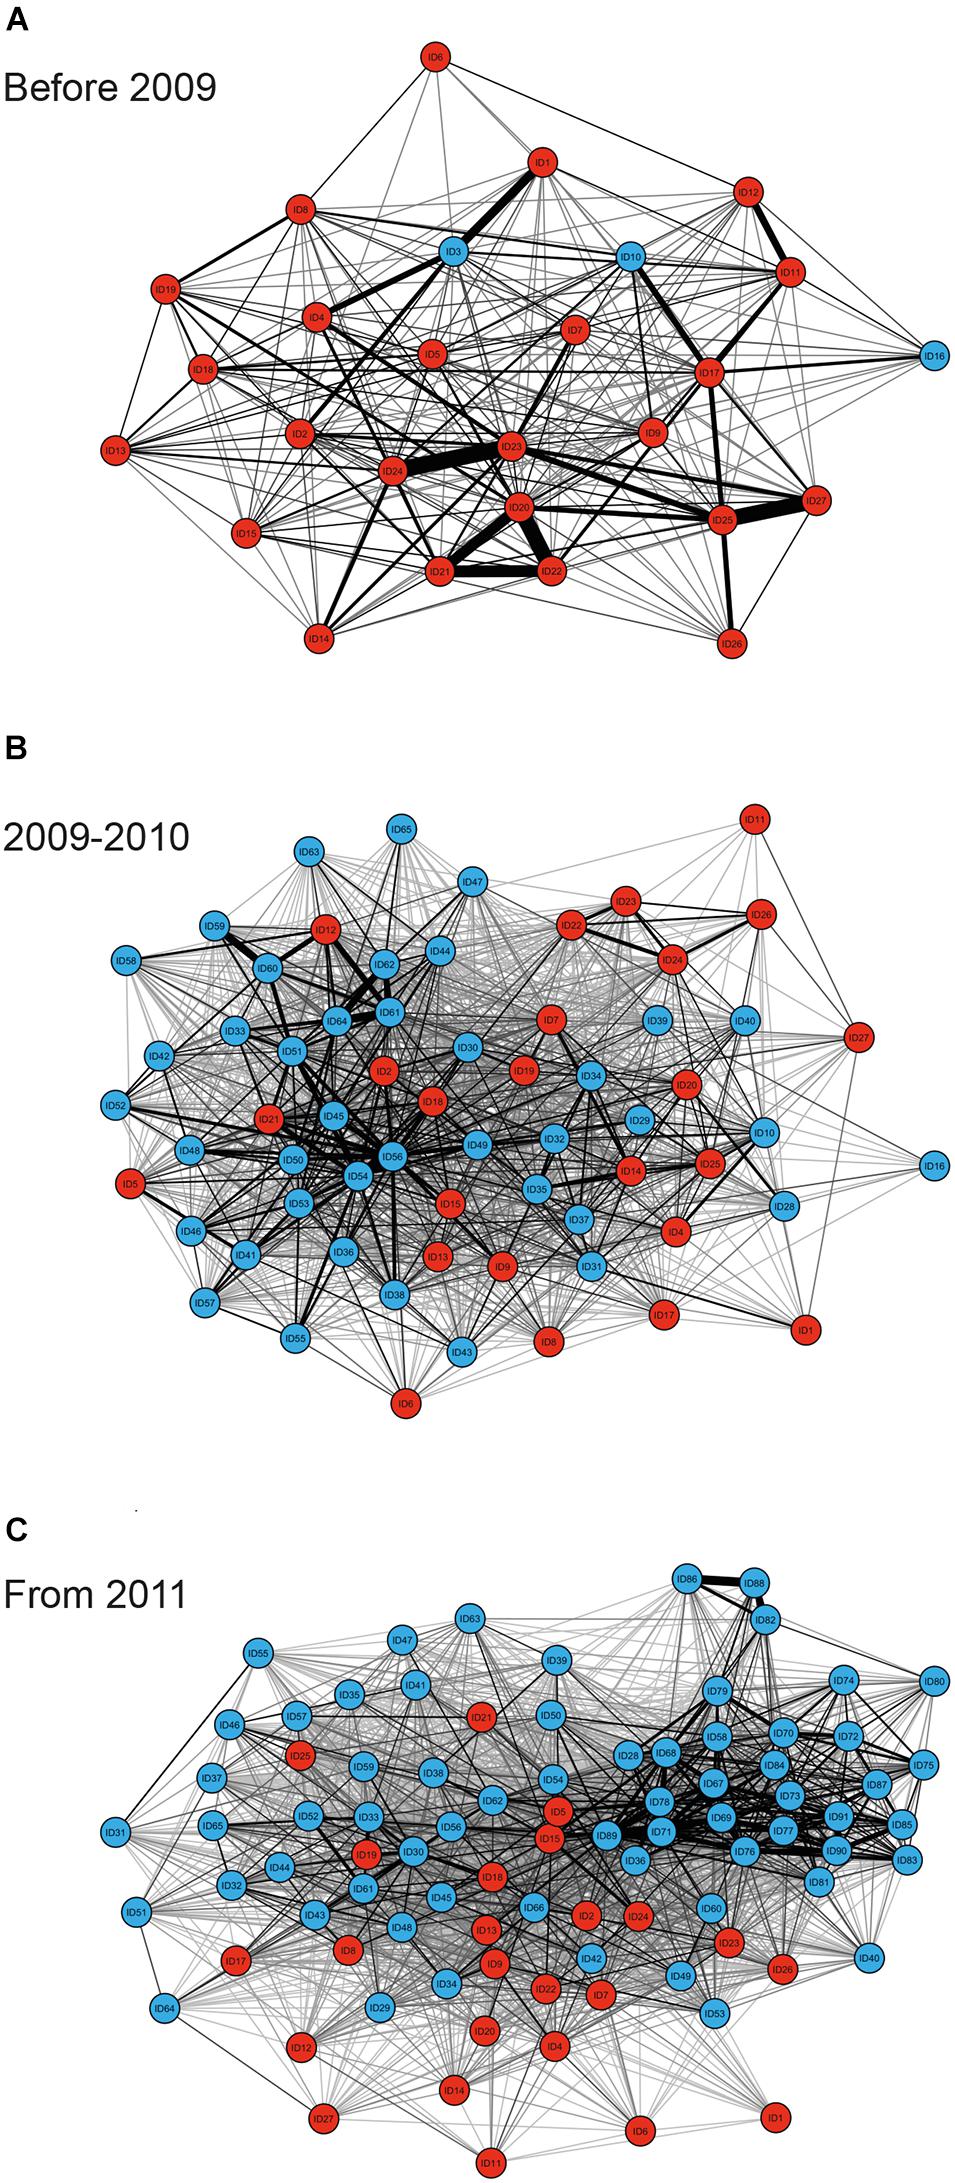
Figure 1. Sociograms depicting the social ties between individual bull sharks observed on the study site on ≥34 dives for the time periods before 2009 (A), between 2009 and 2010 (B), and from 2011 (C). Only GAI values in the highest 30% were included to highlight the strongest associations between dyads, with thicker edges indicating higher GAIs for both individuals observed throughout the entire sampling period (red nodes), and individuals which were not observed throughout the entire sampling period (blue nodes).
Preferred and/or Avoided Associations
Preferred long-term companionships were observed as indicated by significantly higher SD and CV values of the real dataset compared to randomly permuted data for the entire study period, between 2009 and 2010, and from 2011 (Table 3). After 2011, avoided associations can be observed as the proportion of non-zero association indices are lower in the real dataset compared to the randomly permuted data, indicating that some individuals avoid others. Social preferences that investigate the active decision to interact or not were measured by GAIs (Table 3). Since GAIs gave similar results to SRIs, social preferences were also common and occurred within the same time series (2009–2010 and from 2011) than preferred associations. For all time series, the mean of GAI values was positive, indicating that preferred companionships were common. The SD of all observed GAIs was significantly higher, and the mean significantly lower than expected, indicating that social preferences occurred between individuals, particularly over short time periods.
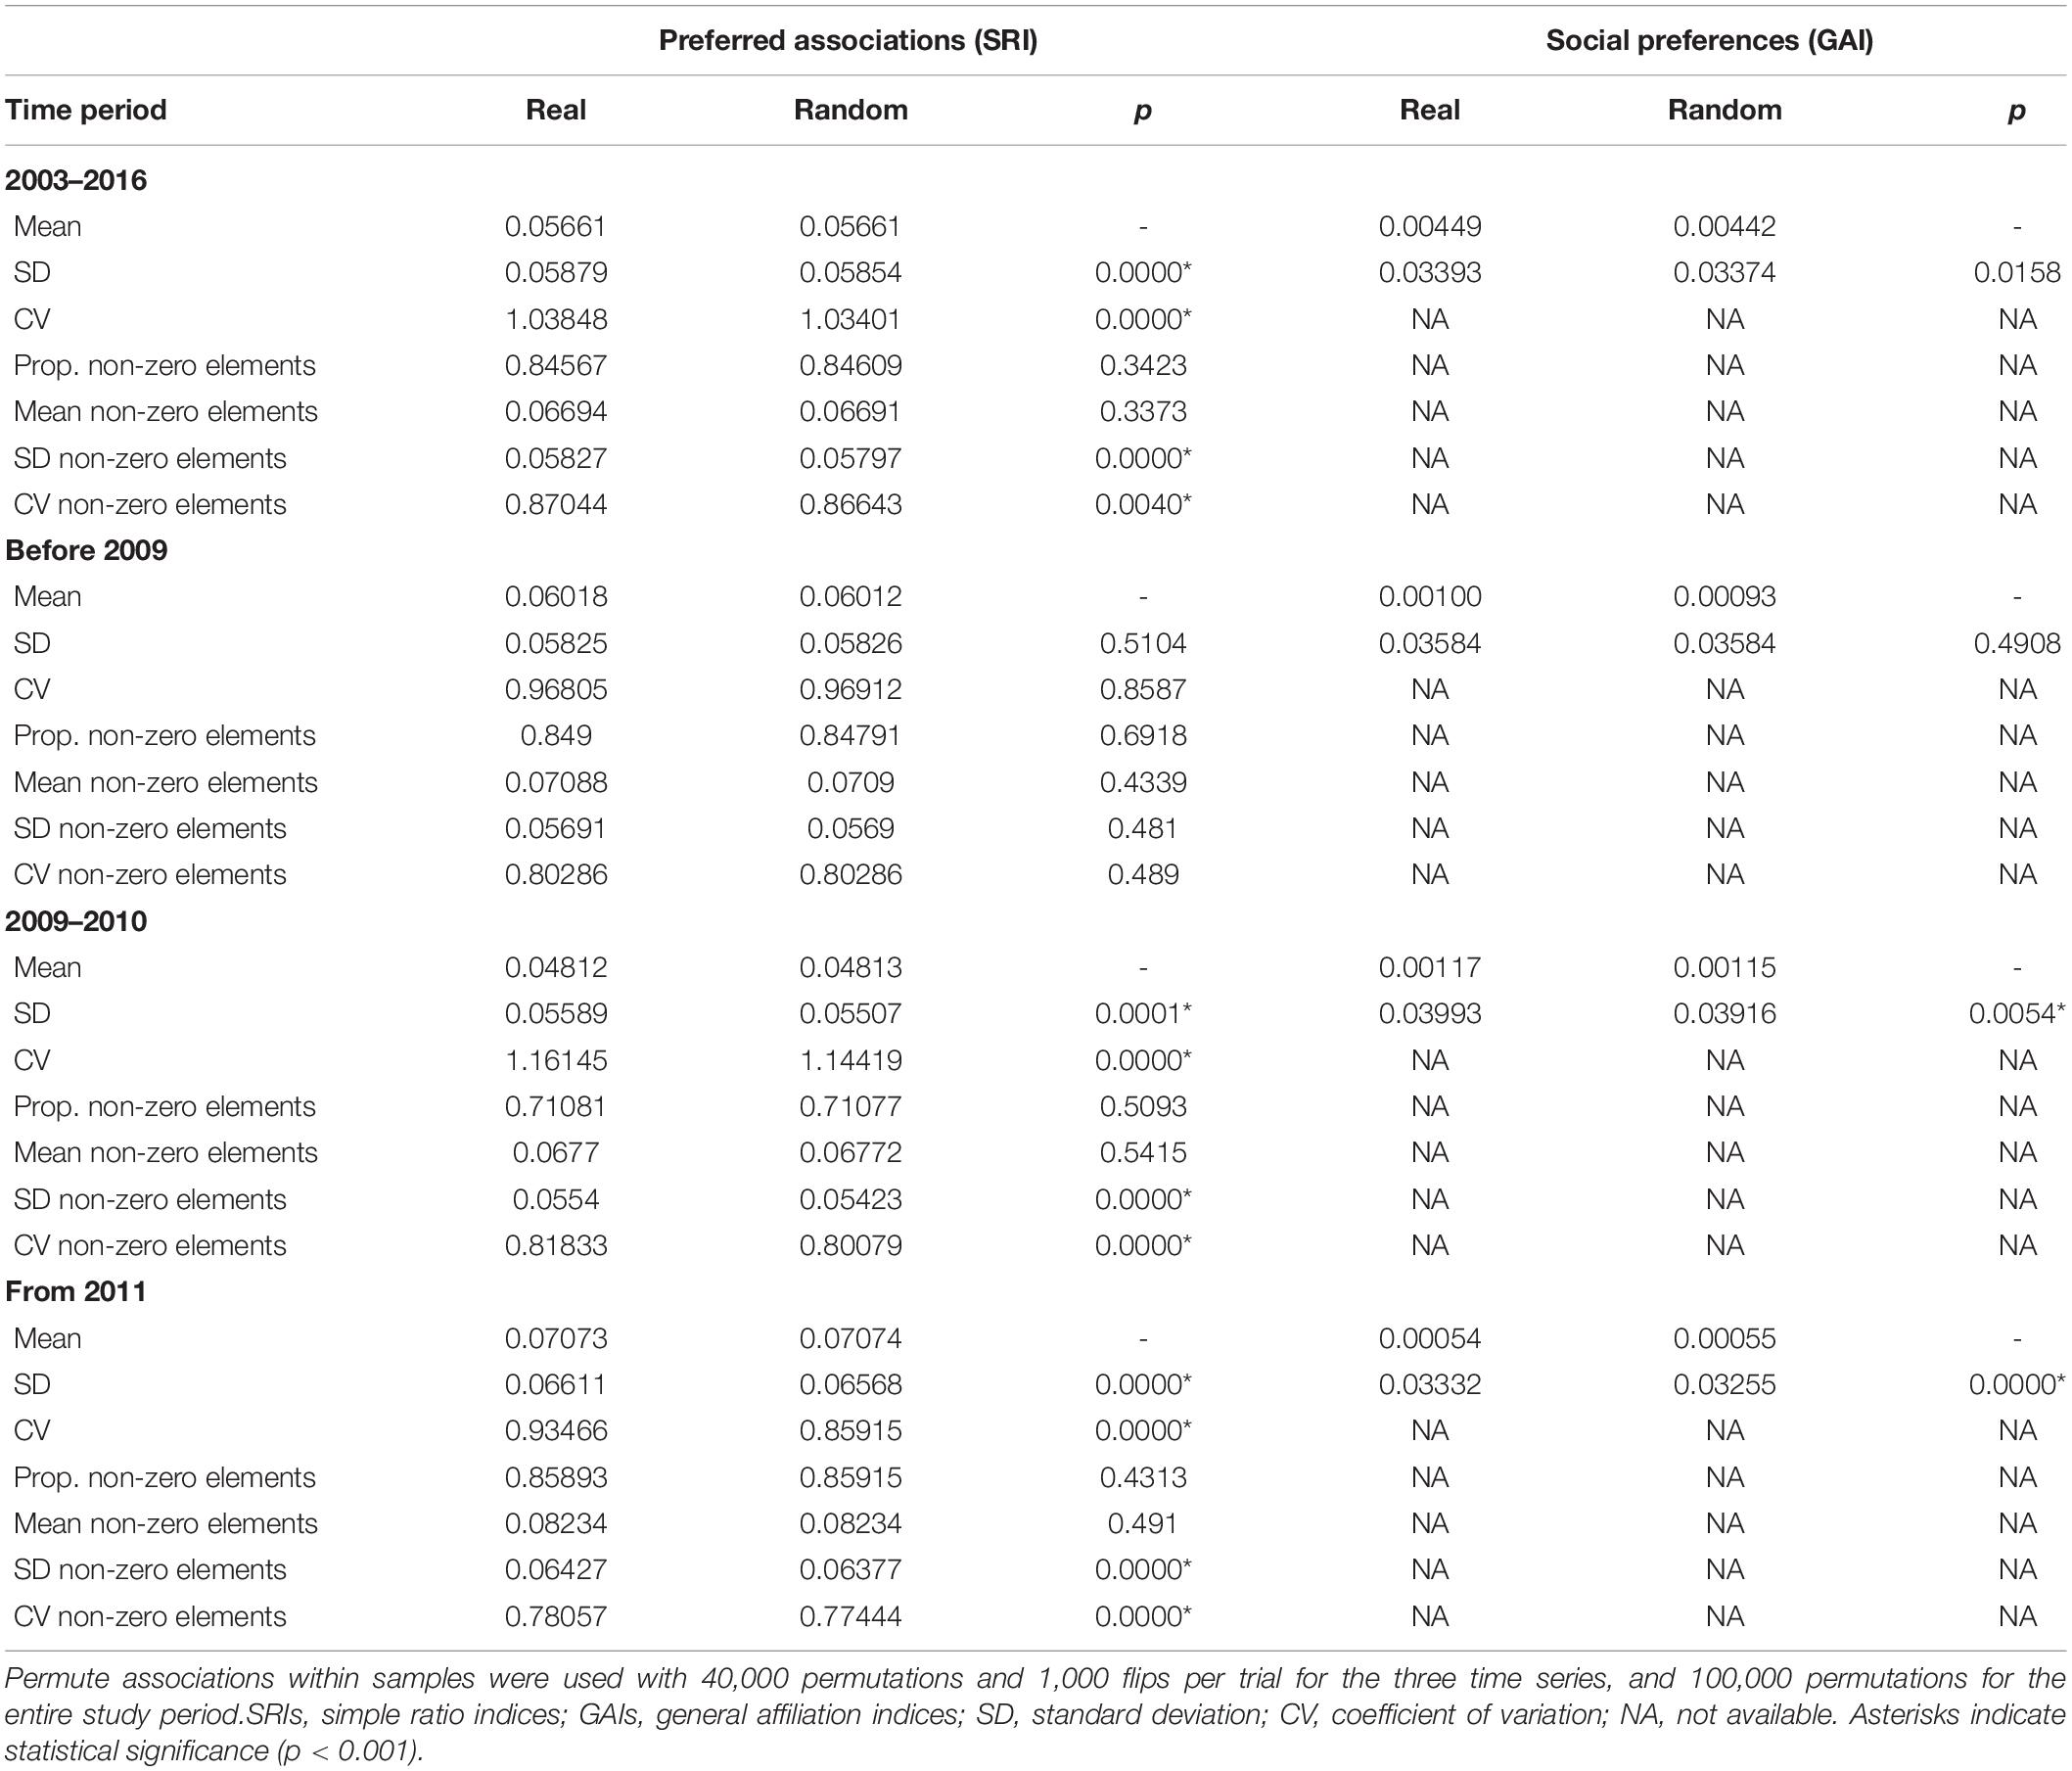
Table 3. Tests for preferred and avoided associations of bull sharks.
Temporal Variation of Associations
The SLARs of bull sharks remained above the null association rates for the entire study period (Figure 2) indicating the existence of preferred associations amongst individuals in the network. However, there was a steady decay in the duration of associations for each of the four time periods without dropping below the null association rates except in 2010 when after slightly dropping below, the SLAR increased again quickly (Figure 2C). For the entire study period and before 2009, the best fitting model describing the temporal association pattern for these bull sharks is one of preferred companionships and casual acquaintances, with two levels of casual acquaintances characterizing the network for the time period between 2009 and 2010, and from 2011 (Table 4).
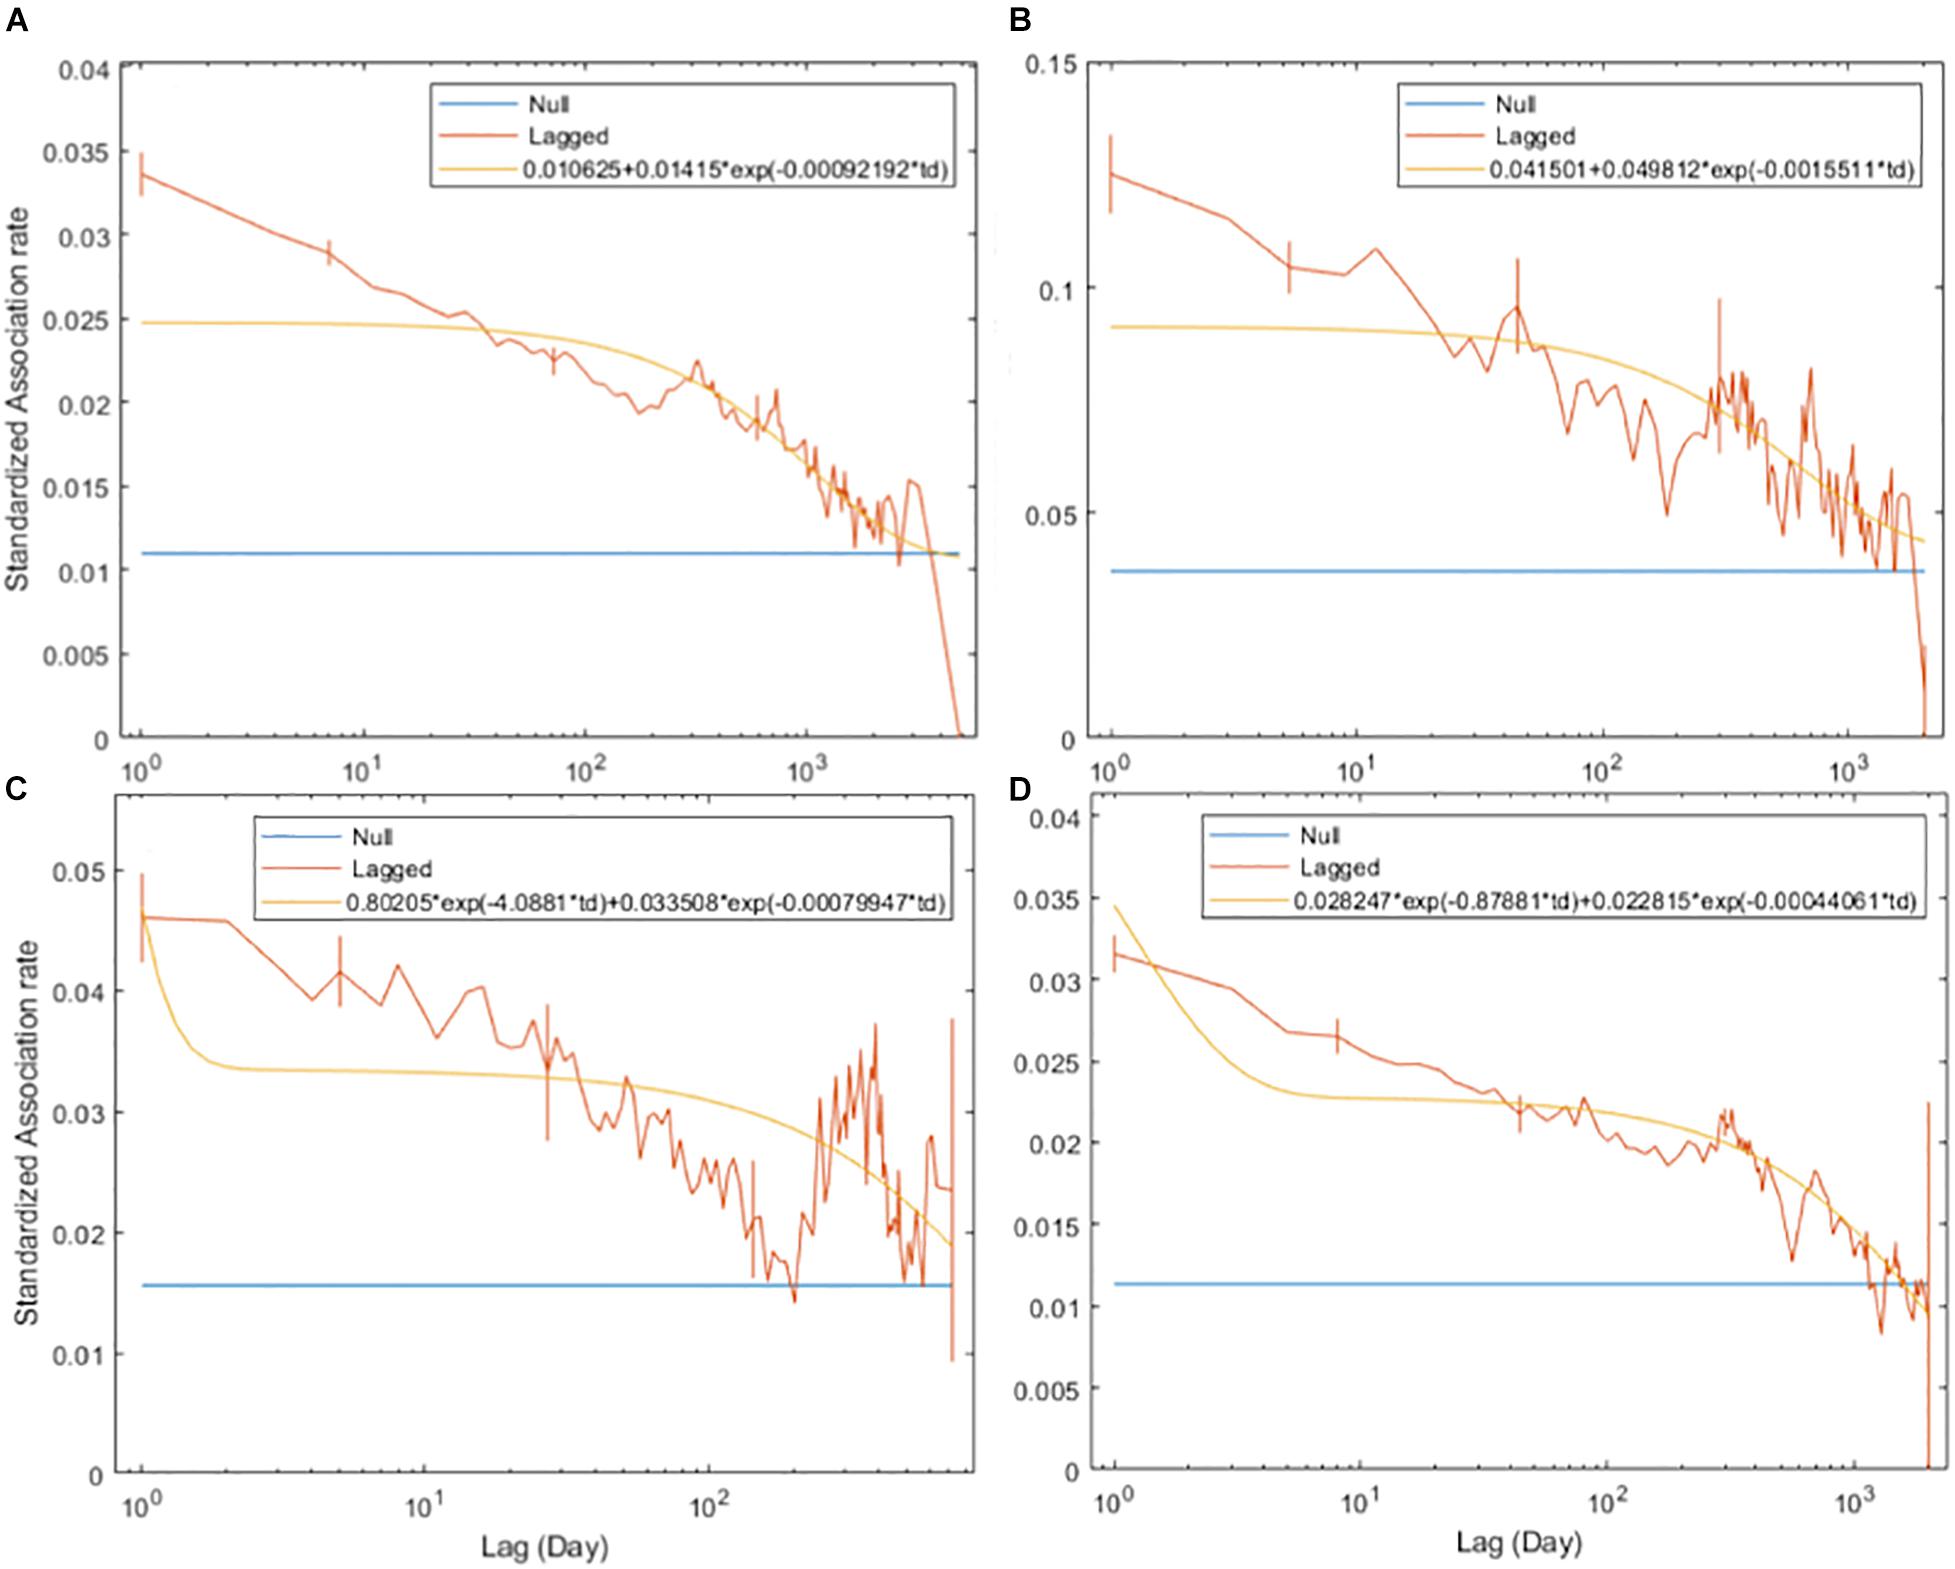
Figure 2. Standardized lagged association rates (SLARs) of individual bull sharks encountered for the time periods 2003–2016 (A), before 2009 (B), between 2009 and 2010 (C), and from 2011 (D). Vertical bars indicate standard errors calculated using the temporal Jackknife method. The yellow line illustrates the best fit model characterizing the social system within the network whilst the blue line represents the null association rate, which is the theoretical SLAR if individual bull sharks were randomly associated.
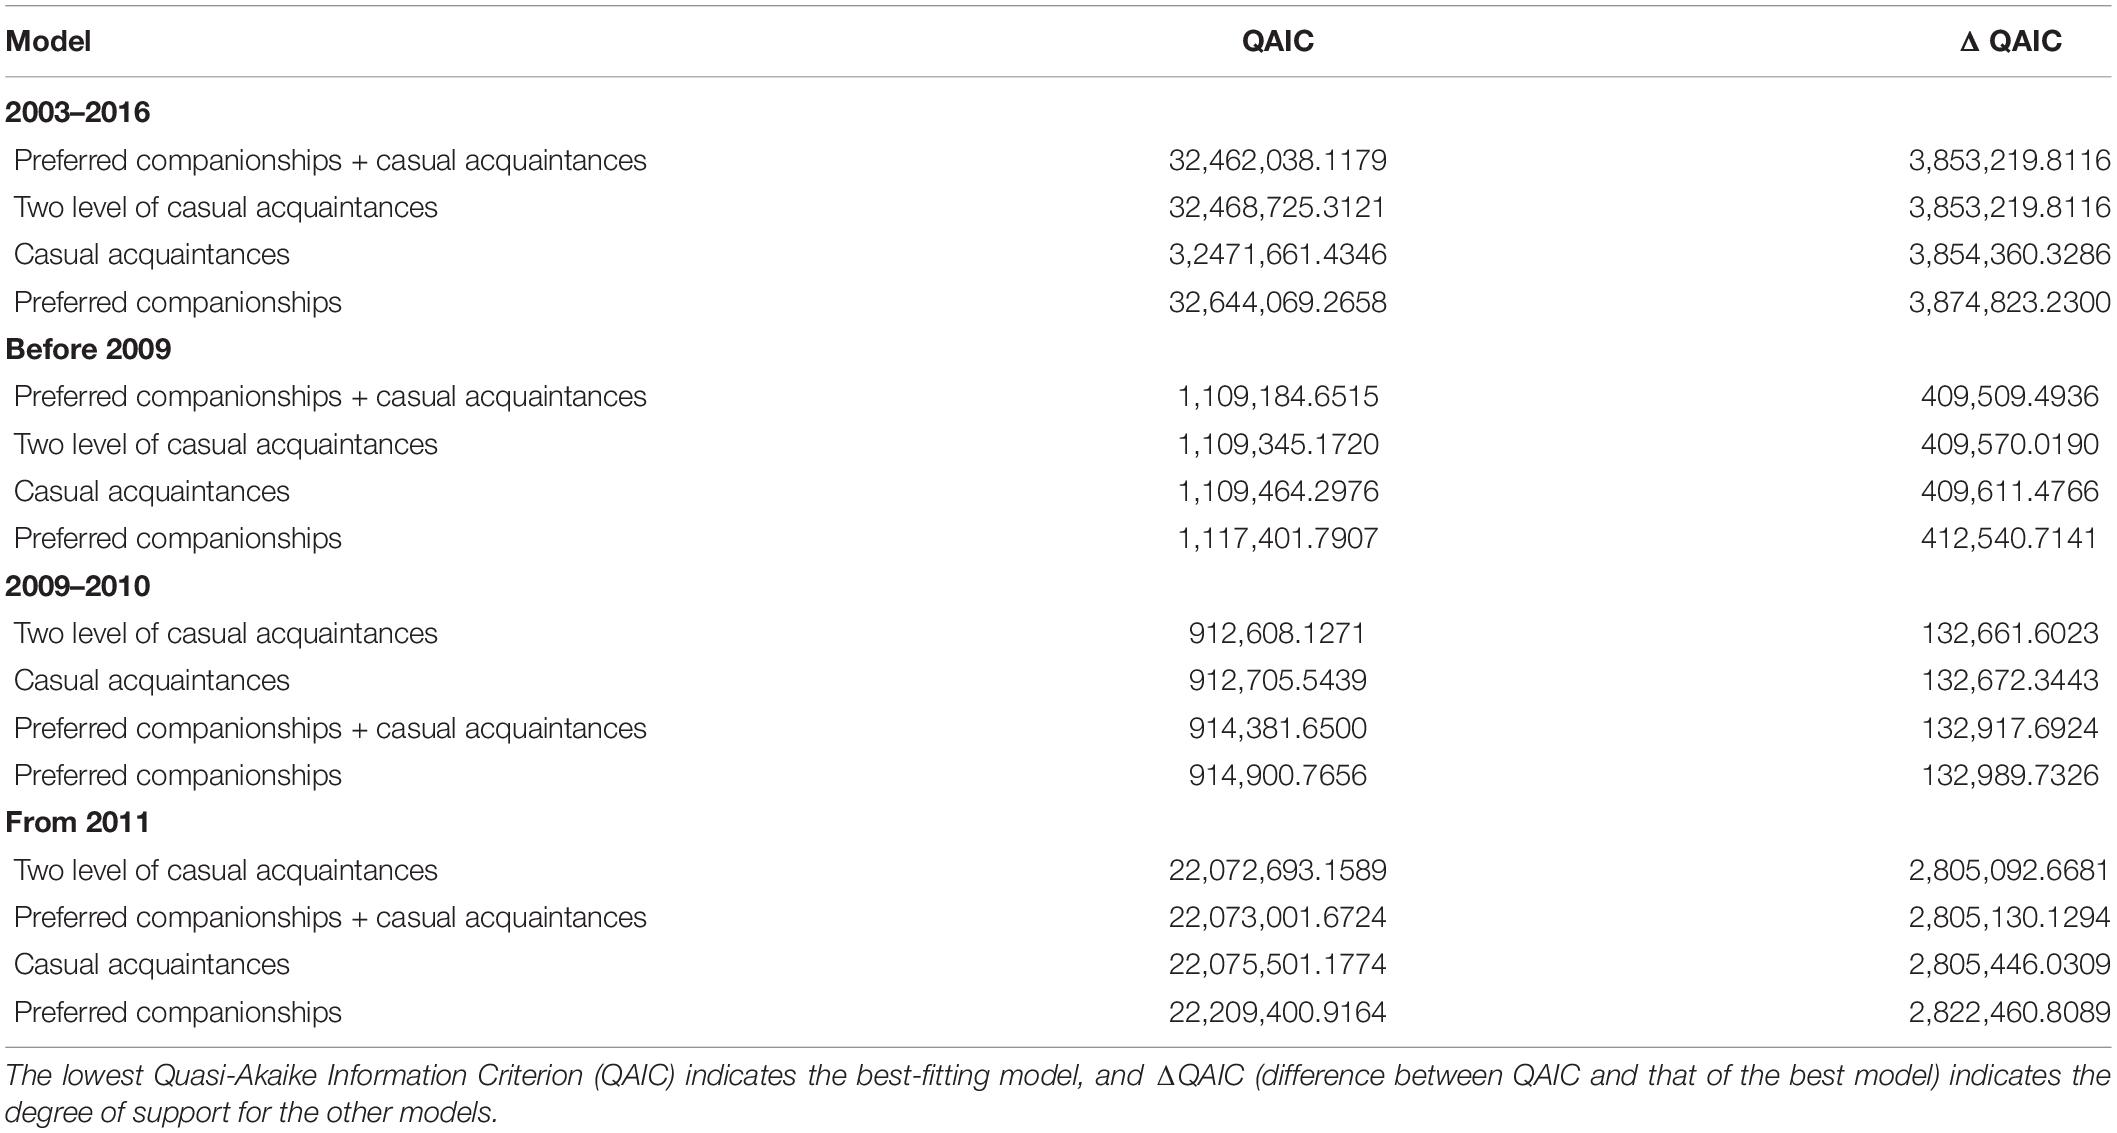
Table 4. Model fitting to standardized lagged association rates (SLARs) among bull shark individuals for the entire study period, before 2009, between 2009 and 2010, and from 2011.
Discussion
At the Shark Reef Marine Reserve, the ongoing wildlife tourism activity of shark diving has resulted in the formation of temporary aggregations of bull sharks. This aggregation was artificially contrived, by virtue of a non-social driving factor: that of direct feeding. Our results appear to indicate that the ongoing nature of these feeding activities, and the aggregations which ensue, have served to facilitate the development of social associations, some of which are temporally stable. With numbers reaching nowadays ∼80 individuals on a single dive, the conditions are prime for social behaviors to occur such as agonistic interactions.
Long-term preferred companionships and strong affinity between individuals were observed throughout the study. Overall and before 2009, the temporal stability of the associations was best described by preferred companionships (i.e., associations occurring more often than expected by chance) and casual acquaintances (i.e., associations lasting from a few days to a few years wherein individuals may dissociate and reassociate again), and for the time periods between 2009 and 2010, and from 2011 by two levels of casual acquaintances. This transformation within the social parameters can be explained by the numerical increase of newly identified bull sharks (Brunnschweiler and Baensch, 2011). Apart from the steady increase over time in numbers of bull sharks (whether named or unnamed) visiting the SRMR (Brunnschweiler et al., 2014), an unusually high number of individuals were identified at the beginning of 2009 (Brunnschweiler and Baensch, 2011). We can only speculate about the reasons underlying such an influx of new individuals in a relatively short period of time, but find it noteworthy. There is anecdotal evidence supporting the notion that bull sharks are indeed gregarious to an extent and travel together. Contrary to other large, apex predator species such as tiger (Galeocerdo cuvier) or white (Carcharodon carcharias) sharks, juvenile and adult bull sharks are rarely seen alone but more often observed in pairs or small groups (Brunnschweiler and Compagno, 2008; Loiseau et al., 2016). Therefore it is possible that a group of bull sharks new to the SRMR show up together at the provisioning site, causing a temporary alteration of the existing social structure by reconfiguring the nature of associations.
In natural settings, individuals form groups and associate to benefit from reduced predation risk, improved foraging efficiency or individual fitness (Krause and Ruxton, 2002). At the level of the individual, associating with conspecifics can provide a number of benefits, from increased access to resources and potential mates, social learning, and information dissemination (Krützen et al., 2005; Croft et al., 2006). Drivers of association amongst conspecifics can include overlapping core ranges, relatedness, behavioral phenotype, and familiarity (Krause and Ruxton, 2002; Croft et al., 2009). At the SRMR where bull sharks temporarily aggregate because of repeated direct feeding (Brunnschweiler and Barnett, 2013), the observed network structure and perceived possible sociality may likely be an artifact of spatio-temporal overlap and not attributed to active social interactions or behavioral strategies in grouping patterns. Hence, finding non-random associations does not necessarily mean that individuals actively choose to group with preferred social partners. The SRMR is not a natural setting, namely bull sharks form artificial aggregations solely in response to feeding by the tourism operator. This is contrary to, for example, white sharks which aggregate naturally around seal colonies and are then lured to cage-diving operators through the use of chum (Schilds et al., 2019). Yet despite the artificial driver in this instance, bull sharks aggregating to exploit a food source could be considered natural, identical to ephemeral natural feeding aggregations at whale carcasses or spawning aggregations (Graham and Castellanos, 2012; Lea et al., 2019). In this regard, the SRMR being an artificial aggregation site could have laid the groundwork for natural social interactions between sharks by simply providing regular and consistent opportunities for those interactions to occur (Clua et al., 2010; Pini-Fitzsimmons et al., 2021).
The results from this study are based on the reliable long-term identification of individual bull sharks at a single site, hence our findings come with some caveats. The individual identification of sharks using distinctive markings and coloration has its limitations (Marshall and Pierce, 2012). For example, while all individuals in this study were identified using permanent identifiable features such as scars, wounds, missing and/or damaged fins, and images and video footage was collected throughout the entire study period, it is inevitable that human error in observation, identification and recording occurred. For example, depending on the uniqueness and/or obviousness of natural marks, identification of individuals can be challenging (Brunnschweiler and Barnett, 2013). Misidentification of an individual or the failure to confirm an individual which was actually present but not recorded could also be due to ocean conditions impeding visibility or the level of experience of the trained observer. In addition, we only observed bull sharks at a single feeding site; therefore, the validity of our results is limited when compared to studies that include multiple sites (e.g., an acoustic receiver network; Armansin et al., 2016; Papastamatiou et al., 2020) or those investigating multiple areas and sampling both provisioning and non-feeding sites (Mourier et al., 2012). However, the large numbers of sharks and the long study period provides a robust data set that adequately characterizes the associations of bull sharks aggregating at the SRMR, laying the foundation for further investigating sociality in this species. For example, although kinship appears not to drive associations and affiliations among blacktip reef sharks (Mourier and Planes, 2021), group assortment in bull sharks may be influenced by genetic relatedness. Unlike most other shark species, bull sharks spend the first few years of their lives in estuaries and rivers before moving out to the ocean. Consequently, further work investigating genetic relatedness of individual bull sharks encountered at the SRMR as well as those found in known nurseries (Glaus et al., 2019) is warranted in order to explore the possibility that during those first crucial years of their lives, long lasting relationships are formed within cohorts.
Direct shark feeding at the SRMR appears to drive fission-fusion dynamics, where the feeding event temporarily fuses a large number of individual bull sharks in a central place. In terms of CPF theory, of interest is bull shark behavior following dispersion from the central place (feeding event). If bull sharks indeed choose to group with preferred associates, namely turn up together at the feeding site, specific paired associations or groups of bull sharks observed at the SRMR would be expected to be observed together at other locations as well. This hypothesis could be tested by monitoring other dive sites, feeding and not, in Fiji where bull sharks are encountered. Ward-Paige et al. (2020) reported bull shark groups of variable sizes from six areas in Fiji. Individuals would need to be independently identified at these sites to ensure that they are also visitors to the SRMR and vice versa. Anecdotal reports show that several bull sharks visually identified at the SRMR were also recorded in Kuata, an island of the Yasawa Group approx. 200 km away, where a shark feeding site was established back in 2015. In the absence of direct observation data collection at each dive site, the joint movement of individuals may be monitored using acoustic telemetry. Brunnschweiler and Barnett (2013) found that the overall diel patterns in movement are for acoustically tagged bull sharks to use the area around the feeding site in the morning before spreading out over Shark Reef throughout the day and dispersing over a larger coastal area at night. Trophic information suggests that they continue to forage on natural prey (Abrantes et al., 2018), quite possibly in the Navua estuary at night (Brunnschweiler and Barnett, 2013), nevertheless we are lacking key information including regarding resting behavior (e.g., where, when or if they rest in groups). Unfortunately, our data from acoustically tagged bull sharks are inconclusive with respect to the existence of pairs or groups free ranging together as a result of small numbers of individuals tagged together for longer time periods (Brunnschweiler and Barnett, 2013). To better understand and explore the depth and breadth of sociality within the SRMR bull shark population and determine how group behavior and dynamics align with CPF, a network analysis study including focal observations combined with tracking data should be undertaken in Fiji. A tangential study could be conducted at a location such as Mozambique where adult bull sharks aggregate without being fed (Daly et al., 2014) and the results compared and contrasted. This would provide for a more thorough examination of the associative nature of this species.
Data Availability Statement
The raw data supporting the conclusions of this article will be made available by the authors, without undue reservation.
Ethics Statement
Ethical review was not required for this study; field work was carried out in the Shark Reef Marine Reserve with the knowledge and the approval of the Ministry of Fisheries and the traditional owners of Shark Reef. No animals were caught or handled.
Author Contributions
JB designed the study. TB, NL, and JB analyzed the data. All authors contributed to drafting the manuscript and its revisions and read and approved the submitted version.
Conflict of Interest
The authors declare that the research was conducted in the absence of any commercial or financial relationships that could be construed as a potential conflict of interest.
Acknowledgments
We would like to thank Hal Whitehead and Bruno Diaz-Lopez for their advice on SOCPROG and social analyses. We would also like to thank the staff of Beqa Adventure Divers for data acquisition and for logistical support. Mike Neumann is acknowledged for implementing and maintaining the database, the content of which is the foundation of this manuscript.
Supplementary Material
The Supplementary Material for this article can be found online at: https://www.frontiersin.org/articles/10.3389/fmars.2021.678074/full#supplementary-material
References
Abrantes, K. G., Brunnschweiler, J. M., and Barnett, A. (2018). You are what you eat: examining the effects of provisioning tourism on shark diets. Biol. Conserv. 224, 300–308. doi: 10.1016/j.biocon.2018.05.021
Altmann, J. (1974). Observational study of behavior: sampling methods. Behaviour 49, 227–267. doi: 10.1163/156853974x00534
Armansin, N. C., Lee, K. A., Huveneers, C., and Harcourt, R. G. (2016). Integrating social network analysis and fine-scale positioning to characterize the associations of a benthic shark. Anim. Behav. 115, 245–258. doi: 10.1016/j.anbehav.2016.02.014
Baird, R. W., and Whitehead, H. (2000). Social organization of mammal-eating killer whales: group stability and dispersal patterns. Can. J. Zool. 78, 2096–2105. doi: 10.1139/z00-155
Barnett, A., Abrantes, K. G., Seymour, J., and Fitzpatrick, R. (2012). Residency and spatial use by reef sharks of an isolated seamount and its implications for conservation. PLoS One 7:e36574. doi: 10.1371/journal.pone.0036574
Bass, N. C., Mourier, J., Knott, N. A., Day, J., Brown, C., and Guttridge, T. (2016). Long-term migration patterns and bisexual philopatry in a benthic shark species. Mar. Freshw. Res. 68, 1414–1421. doi: 10.1071/mf16122
Bejder, L., Fletcher, D., and Bräger, S. (1998). A method for testing association patterns of social animals. Anim. Behav. 56, 719–725. doi: 10.1006/anbe.1998.0802
Bridge, P. D. (1993). “Classification,” in Biological Data Analysis, ed. J. C. Fry (Oxford: Oxford University Press), 219–242.
Brunnschweiler, J. M. (2010). The shark reef marine reserve: a marine tourism project in Fiji involving local communities. J. Sustain. Tour. 18, 29–42. doi: 10.1080/09669580903071987
Brunnschweiler, J. M., Abrantes, K. G., and Barnett, A. (2014). Long-term changes in species composition and relative abundances of sharks at a provisioning site. PLoS ONE 9:e86682. doi: 10.1371/journal.pone.0086682
Brunnschweiler, J. M., and Baensch, H. (2011). Seasonal and long-term changes in relative abundance of bull sharks from a tourist shark feeding site in Fiji. PLoS One 6:e16597. doi: 10.1371/journal.pone.0016597
Brunnschweiler, J. M., and Barnett, A. (2013). Opportunistic visitors: long-term behavioural response of bull sharks to food provisioning in Fiji. PLoS One 8:e58522. doi: 10.1371/journal.pone.0058522
Brunnschweiler, J. M., and Compagno, L. J. V. (2008). First record of Carcharhinus leucas from Tonga, South Pacific. Mar. Biodivers. Rec. 1:e51.
Cairns, S. J., and Schwager, S. J. (1987). A comparison of association indices. Anim. Behav. 35, 1454–1469. doi: 10.1016/s0003-3472(87)80018-0
Chepko-Sade, B. D., Reitz, K. P., and Sade, D. S. (1989). Sociometrics of Macaca mulatto IV: network analysis of social structure of a pre-fission group. Soc. Netw. 11, 293–314. doi: 10.1016/0378-8733(89)90007-5
Clua, E., Buray, N., Legendre, P., Mourier, J., and Planes, S. (2010). Behavioural response of sicklefin lemon sharks Negaprion acutidens to underwater feeding for ecotourism purposes. Mar. Ecol. Prog. Ser. 414, 257–266. doi: 10.3354/meps08746
Clua, E., Chauvet, C., Read, T., Werry, J., and Lee, S. Y. (2013). Behavioural patterns of tiger shark (Galeocerdo cuvier) feeding aggregation at a blue whale carcass in Pony Bay, New Caledonia. Mar. Freshwat. Behav. Physiol. 46, 1–20. doi: 10.1080/10236244.2013.773127
Croft, D., Krause, J., Darden, S., Ramnarine, I., Faria, J., and James, R. (2009). Behavioural trait assortment in a social network: patterns and implications. Behav. Ecol. Sociobiol. 63, 1495–1503. doi: 10.2307/40295532
Croft, D. P., James, R., and Krause, J. (2008). Exploring Animal Social Networks. Princeton: Princeton University Press.
Croft, D. P., James, R., Thomas, P., Hathaway, C., Mawdsley, D., Laland, K., et al. (2006). Social structure and co-operative interactions in a wild population of guppies (Poecilia reticulata). Behav. Ecol. Sociobiol. 59, 644–650. doi: 10.1007/s00265-005-0091-y
Cross, P. C., Lloyd-Smith, J. O., and Getz, W. M. (2005). Disentangling association patterns in fission-fusion societies using African buffalo as an example. Anim. Behav. 69, 499–506. doi: 10.1016/j.anbehav.2004.08.006
Daly, R., Smale, M. J., Cowley, P. D., and Froneman, P. W. (2014). Residency patterns and migration dynamics of adult bull sharks (Carcharhinus leucas) on the east coast of southern Africa. PLoS One 9:e109357. doi: 10.1371/journal.pone.0109357
Elena, V. P., Thomas, C. G., Patricia, G. P., and Paul, F. D. (1999). Patch size and composition of social groups in wintering tufted titmice. Auk 116, 1152–1155. doi: 10.2307/4089699
Elgar, M. (1989). Predator vigilance and group size in mammals and birds: a critical review of the empirical evidence. Biol. Rev. Camb. Philos. Soc. 64, 13–33. doi: 10.1111/j.1469-185X.1989.tb00636.x
Findlay, R., Gennari, E., Cantor, M., and Tittensor, D. P. (2016). How solitary are white sharks: social interactions or just spatial proximity? Behav. Ecol. Sociobiol. 70, 1735–1744. doi: 10.1007/s00265-016-2179-y
Glaus, K. B. J., Brunnschweiler, J. M., Piovano, S., Mescam, G., Genter, F., Fluekiger, P., et al. (2019). Essential waters: young bull sharks in Fiji’s largest riverine system. Ecol. Evol. 9, 7574–7585. doi: 10.1002/ece3.5304
Graham, R. T., and Castellanos, D. (2012). Apex predators target mutton snapper spawning aggregation. Coral Reefs 31:1017. doi: 10.1007/s00338-012-0921-0
Guttal, V., and Couzin, I. D. (2010). Social interactions, information use, and the evolution of collective migration. Proc. Natl. Acad. Sci. U.S.A. 107, 16172–16177. doi: 10.1073/pnas.1006874107
Heupel, M. R., Simpfendorfer, C. A., Espinoza, M., Smoothey, A. F., Tobin, A., and Peddemors, V. (2015). Conservation challenges of sharks with continental scale migrations. Front. Mar. Sci. 2:12. doi: 10.3389/fmars.2015.00012
Hoppitt, W. J. E., and Farine, D. R. (2018). Association indices for quantifying social relationships: how to deal with missing observations of individuals or groups. Anim. Behav. 136, 227–238. doi: 10.1016/j.anbehav.2017.08.029
Johnson, D. D. P., Kays, R., Blackwell, P. G., and Macdonald, D. W. (2002). Does the resource dispersion hypothesis explain group living? Trends Ecol. Evol. 17, 563–570. doi: 10.1016/s0169-5347(02)02619-8
Jones, T. B., Green, J. A., Patrick, S. C., Evans, J. C., Wells, M. R., Rodríguez-Malagón, M. A., et al. (2020). Consistent sociality but flexible social associations across temporal and spatial foraging contexts in a colonial breeder. Ecol. Lett. 23, 1085–1096. doi: 10.1111/ele.13507
Kirkwood, R., and Arnould, J. P. Y. (2011). Foraging trip strategies and habitat use during late pup rearing by lactating Australian fur seals. Aust. J. Zool. 59, 216–226. doi: 10.1071/zo11080
Krützen, M., Mann, J., Heithaus, M. R., Connor, R. C., Bejder, L., and Sherwin, W. B. (2005). Cultural transmission of tool use in bottlenose dolphins. Proc. Natl. Acad. Sci. U.S.A. 102, 8939–8943. doi: 10.1073/pnas.0500232102
Lea, J. S. E., Daly, R., Leon, C., Daly, C. A. K., and Clarke, C. R. (2019). Life after death: behaviour of multiple shark species scavenging a whale carcass. Mar. Freshw. Res. 70, 302–306. doi: 10.1071/mf18157
Loiseau, N., Kiszka, J. J., Bouveroux, T., Heithaus, M. R., Soria, M., and Chabanet, P. (2016). Using an unbaited stationary video system to investigate the behaviour and interactions of bull sharks Carcharhinus leucas under an aquaculture farm. Afr. J. Mar. Sci. 38, 73–79. doi: 10.2989/1814232x.2016.1156578
Lusseau, D., and Newman, M. E. J. (2004). Identifying the role that animals play in their social networks. Proc. R. Soc. Lond. B. 271, 477–481.
Marshall, A. D., and Pierce, S. J. (2012). The use and abuse of photographic identification in sharks and rays. J. Fish Biol. 80, 1361–1379. doi: 10.1111/j.1095-8649.2012.03244.x
McDonald, D. B. (2009). Young-boy networks without kin clusters in a lek-mating manakin. Behav. Ecol. Sociobiol. 63, 1029–1034. doi: 10.1007/s00265-009-0722-9
Meyer, L., Barry, C., Araujo, G., Barnett, A., Brunnschweiler, J. M., Chin, A., et al. (in press). Redefining provisioning in marine wildlife tourism. J. Ecotourism. doi: 10.1080/14724049.2021.1931253
Meyer, L., Pethybridge, H., Beckmann, C., Bruce, B., and Huveneers, C. (2019). The impact of wildlife tourism on the foraging ecology and nutritional condition of an apex predator. Tour. Manag. 75, 206–215. doi: 10.1016/j.tourman.2019.04.025
Mourier, J., Brown, C., and Planes, S. (2017). Learning and robustness to catch-and-release fishing in a shark social network. Biol. Lett. 13:20160824. doi: 10.1098/rsbl.2016.0824
Mourier, J., Lédée, E., Guttridge, T., and Jacoby, D. M. P. (2019). “Network analysis and theory in shark ecology–methods and applications,” in Shark Research: Emerging Technologies and Applications for the Field and Laboratory, eds J. C. Carrier, M. R. Heithaus, and C. A. Simpfendorfer (Boca Raton: CRC Press), 337–356.
Mourier, J., and Planes, S. (2021). Kinship does not predict the structure of a shark social network. Behav. Ecol. 32, 211–222. doi: 10.1093/beheco/araa119
Mourier, J., Vercelloni, J., and Planes, S. (2012). Evidence of social communities in a spatially structured network of a free-ranging shark species. Anim. Behav. 83, 389–401. doi: 10.1016/j.anbehav.2011.11.008
Naug, D. (2008). Structure of the social network and its influence on transmission dynamics in a honeybee colony. Behav. Ecol. Sociobiol. 62, 1719–1725. doi: 10.1007/s00265-008-0600-x
Newman, M. E. J. (2006). Modularity and community structure in networks. Proc. Natl. Acad. Sci. U.S.A. 103, 8577–8582.
Orians, G. H., and Pearson, N. E. (1979). “On the theory of central place foraging,” in Analysis of Ecological Systems, eds D. J. Horn, R. D. Mitchell, and G. R. Stairs (Columbus: Ohio State University Press), 154–177.
Papastamatiou, Y. P., Bodey, T. W., Caselle, J. E., Bradley, D., Freeman, R., Friedlander, A. M., et al. (2020). Multiyear social stability and social information use in reef sharks with diel fission–fusion dynamics. Proc. R. Soc. B 287:20201063. doi: 10.1098/rspb.2020.1063
Papastamatiou, Y. P., Watanabe, Y. Y., Demsar, U., Leos-Barajas, V., Bradley, D., Langrock, R., et al. (2018). Activity seascapes highlight central place foraging strategies in marine predators that never stop swimming. Mov. Ecol. 6:9.
Pini-Fitzsimmons, J., Knott, N. A., and Brown, C. (2021). Heterarchy reveals social organization of a smooth stingray (Bathytoshia brevicaudata) population in a provisioned food context. Front. Mar. Sci. 8:641761. doi: 10.3389/fmars.2021.641761
Schilds, A., Mourier, J., Huveneers, C., Nazimi, L., Fox, A., and Leu, S. T. (2019). Evidence for non-random co-occurrences in a white shark aggregation. Behav. Ecol. Sociobiol. 73:138.
Sims, D. W., Southall, E. J., Quayle, V. A., and Fox, A. M. (2000). Annual social behaviour of basking sharks associated with coastal front areas. Proc. R. Soc. B 267, 1897–1904. doi: 10.1098/rspb.2000.1227
Sueur, C., King, A. J., Conradt, L., Kerth, G., Lusseau, D., Mettle-Hofmann, C., et al. (2011). Collective decision-making and fission-fusion dynamics: a conceptual framework. Oikos 120, 1608–1617. doi: 10.1111/j.1600-0706.2011.19685.x
Vital, C., and Martins, E. P. (2011). Strain differences in zebrafish (Danio rerio) social roles and their impact on group task performance. J. Comp. Psychol. 125, 278–285. doi: 10.1037/a0023906
Ward-Paige, C. A., Brunnschweiler, J. M., and Skyes, H. (2020). Tourism-driven ocean science for sustainable use: a case study of sharks in Fiji. bioRxiv [Preprint] Available online at: https://doi.org/10.1101/2020.02.04.932236 (accessed March 7, 2021).
Whitehead, H. (1997). Analysing animal social structure. Anim. Behav. 53, 1053–1067. doi: 10.1006/anbe.1996.0358
Whitehead, H. (2008a). Analyzing Animal Societies: Quantitative Methods for Vertebrate Social Analysis. Chicago, IL: University of Chicago Press.
Whitehead, H. (2008b). Precision and power in the analysis of social structure using associations. Anim. Behav. 75, 1093–1099. doi: 10.1016/j.anbehav.2007.08.022
Whitehead, H. (2009). SOCPROG programs: analysing animal social structures. Behav. Ecol. Sociobiol. 63, 765–778. doi: 10.1007/s00265-008-0697-y
Whitehead, H., and Dufault, S. (1999). Techniques for analyzing vertebrate social structure using identified individuals: review and recommendations. Adv. Stud. Behav. 28, 33–74. doi: 10.1016/S0065-3454(08)60215-6
Whitehead, H., and James, R. (2015). Generalized affiliation indices extract affiliations from social network data. Methods Ecol. Evol. 6, 836–844. doi: 10.1111/2041-210x.12383
Whitehead, H., Laland, K. N., Rendell, L., Thorogood, R., and Whiten, A. (2019). The reach of gene–culture coevolution in animals. Nat. Commun. 10:2405. doi: 10.1038/s41467-019-10293-y
Keywords: social bonds, co-occurrence, insular marine predators, fission-fusion, central place foragers, shark feeding
Citation: Bouveroux T, Loiseau N, Barnett A, Marosi ND and Brunnschweiler JM (2021) Companions and Casual Acquaintances: The Nature of Associations Among Bull Sharks at a Shark Feeding Site in Fiji. Front. Mar. Sci. 8:678074. doi: 10.3389/fmars.2021.678074
Received: 08 March 2021; Accepted: 31 May 2021;
Published: 23 June 2021.
Edited by:
Mourier Johann, Institut de Recherche Pour le Développement (IRD), FranceReviewed by:
Valeria Senigaglia, Murdoch University, AustraliaQuinn Webber, University of Colorado Boulder, United States
Copyright © 2021 Bouveroux, Loiseau, Barnett, Marosi and Brunnschweiler. This is an open-access article distributed under the terms of the Creative Commons Attribution License (CC BY). The use, distribution or reproduction in other forums is permitted, provided the original author(s) and the copyright owner(s) are credited and that the original publication in this journal is cited, in accordance with accepted academic practice. No use, distribution or reproduction is permitted which does not comply with these terms.
*Correspondence: Thibaut Bouveroux, tbouveroux@gmail.com; Juerg M. Brunnschweiler, juerg@gluecklich.net