
94% of researchers rate our articles as excellent or good
Learn more about the work of our research integrity team to safeguard the quality of each article we publish.
Find out more
ORIGINAL RESEARCH article
Front. Mar. Sci., 06 July 2021
Sec. Physical Oceanography
Volume 8 - 2021 | https://doi.org/10.3389/fmars.2021.672210
This article is part of the Research TopicImpact of Deep Oceanic Processes on Circulation and Climate Variability: Examples from the Mediterranean Sea and the Global OceanView all 17 articles
 Hrvoje Mihanović1*
 Ivica Vilibić1,2
 Jadranka Šepić3
 Frano Matić1
 Zrinka Ljubešić4
 Elena Mauri5
 Riccardo Gerin5
 Giulio Notarstefano5
 Pierre-Marie Poulain5
The paper aims to describe the preconditioning and observations of exceptionally high salinity values that were observed in summer and autumn of 2017 in the Adriatic. The observations encompassed CTD measurements carried out along the well-surveyed climatological transect in the Middle Adriatic (the Palagruža Sill, 1961–2020), Argo profiling floats and several glider missions, accompanied with satellite altimetry and operational ocean numerical model (Mediterranean Forecasting System) products. Typically, subsurface salinity maximum, with values lower than 39.0, is observed in the Southern Adriatic (usually between 200 and 400 m), related to ingressions of saltier and warmer waters originating in the eastern Mediterranean (Levantine Intermediate Water—LIW). However, seasonally strong inflow of warm and high salinity waters (S > 38.8) has been observed much closer to the surface since spring 2015. The main LIW core deepened at the same time (to 400–700 m). Such double-maxima vertical pattern was eventually disturbed by winter convection at the beginning of 2017, increasing salinities throughout the water column. A new episode of very strong inflow of high salinity waters from the Northern Ionian was observed in late winter and spring of 2017, this time restricted almost to the surface. As most of 2017 was characterized by extremely dry conditions, low riverine inputs and warmer than usual summer over the Adriatic and Northern Ionian, salinity values above the sharp and shallow (15–40 m) thermocline significantly increased. The maximum recorded salinity was 39.26, as measured by the Argo float in the Southern Adriatic. Surface salinity maximum events, but with much lower intensity, have been documented in the past. Both past events and the 2017 event were characterized by (i) concurrence with overall high salinity conditions and cyclonic or transitional phase of the Adriatic-Ionian Bimodal Oscillating System, (ii) very low river discharges preconditioning the events for a year or more, (iii) higher-than-average heat fluxes during most of the summer and early autumn periods, forming a stable warm layer above the thermocline, and (iv) higher-than-average E-P (evaporation minus precipitation) acting on this warm surface layer. Importantly, the 2017 event was also preceded by strong near-surface inflow of very saline waters from the Northern Ionian in early 2017.
For almost 70 years it has been known that the thermohaline and biogeochemical conditions oscillate substantially in the Adriatic Sea—the northernmost embayment of the Mediterranean Sea (Figure 1)—over a decadal timescale (Buljan, 1953; Buljan and Zore-Armanda, 1976; Civitarese et al., 2010; Batistić et al., 2014; Dautović et al., 2017). These oscillations reflect changes in the Adriatic-Ionian thermohaline circulation and are partly controlled by (i) the fresher waters originating from Northern Adriatic rivers, advected south-eastwards along the western Adriatic shore (Western Adriatic Coastal Current, WACC, Orlić et al., 1992; Artegiani et al., 1997), and (ii) deep outflow driven by the dense water formation (DWF) events in the South Adriatic Pit (SAP) through wintertime open ocean convection (Gačić et al., 2002) and on the Northern Adriatic shelf through extensive cooling (Bergamasco et al., 1999; Mihanović et al., 2013). The DWF processes generate both the North Adriatic Dense Water (NAdDW) and the Adriatic Deep Water (AdDW) that flow along the western slope of the Adriatic (Artegiani and Salusti, 1987; Vilibić and Mihanović, 2013) and out of the Adriatic (Gačić et al., 1996), supplying oxygen and other tracers to the deepest Eastern Mediterranean layers (Roether and Schlitzer, 1991; Malanotte-Rizzoli et al., 1997). In turn, warmer and high salinity ultraoligotrophic waters from the Levantine basin (Krom et al., 1991, 2004), the so-called Levantine Intermediate Water (LIW, Zore-Armanda, 1963; Artegiani et al., 1997), are advected toward the Northern Adriatic, along the eastern coastline within the Eastern Adriatic Current (EAC, Orlić et al., 1992).
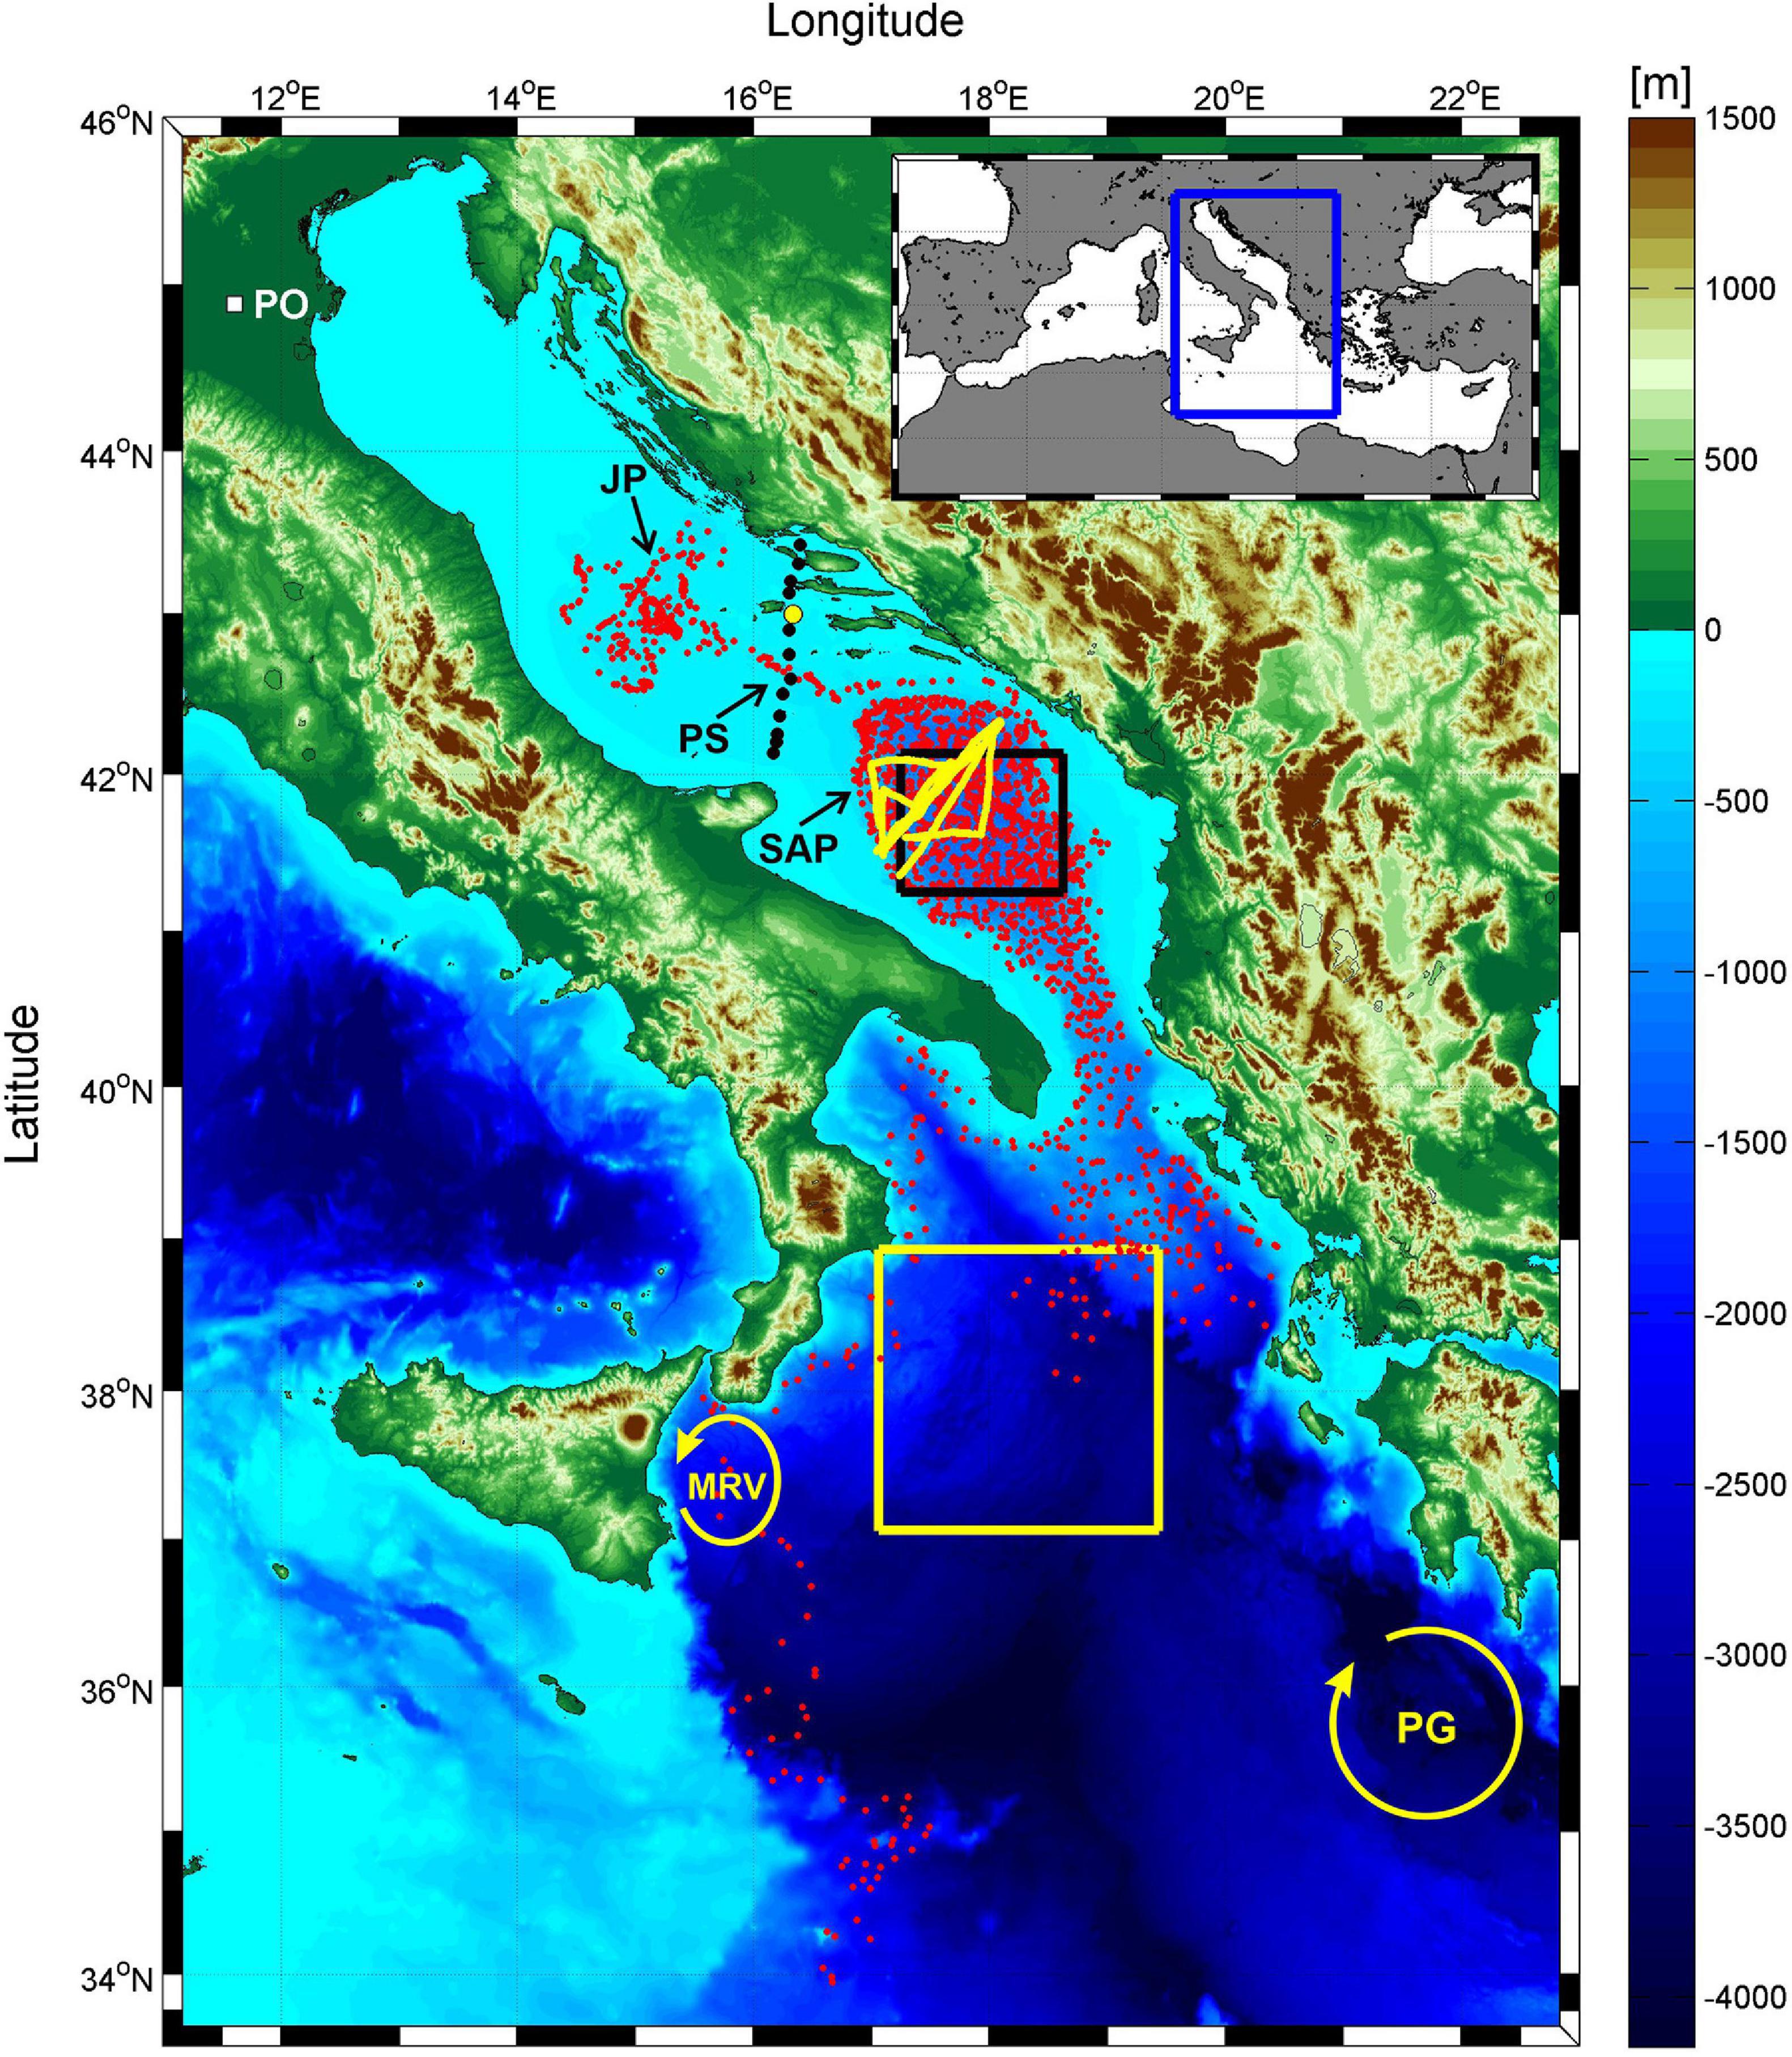
Figure 1. The bathymetry of the Adriatic-Ionian basin. The positions of Argo profiles used in the study are denoted by small red dots. CTD stations at the Palagruža Sill transect are indicated by black dots, with Stončica station (CJ009) denoted by larger yellow dot. Glider trajectories in the Southern Adriatic are marked by yellow lines. JP, PS and SAP stand for the Jabuka Pit, the Palagruža Sill and the South Adriatic Pit, respectively. The black rectangle in the Southern Adriatic indicates the area over which heat and water fluxes were estimated. The yellow rectangle in the Northern Ionian represents the area used for computation of vorticity. The positions and the sense of rotation of the Messina Rise Vortex (MRV) and the Pelops Gyre (PG) are also indicated. Pontelagoscuro station, at which Po River discharge are measured, is indicated by the white square in the upper left part of the figure.
This complex thermohaline circulation is subject to significant decadal variability which is related to the basin-wide circulation reversals that occur in the Northern Ionian Sea. Many studies show that these reversals are driven by the dense waters generated in the Adriatic that change the internal vorticity in the Northern Ionian Sea (Gačić et al., 2010, 2014; Rubino et al., 2020) and may alternate at quasi-regular time intervals with the Aegean DWF site, affecting the upper eastern Mediterranean Sea thermohaline cell and influencing the circulation in the Northern Ionian Sea (Theocharis et al., 2014; Reale et al., 2017). This mechanism is called the Adriatic-Ionian Bimodal Oscillating System (BiOS, Gačić et al., 2010). Another hypothesis states that the local wind curl changes are responsible for the observed decadal circulation changes (Pinardi et al., 2015; Nagy et al., 2019). In any case, periodical reversals of the North Ionian Gyre (NIG) bring either ultraoligotrophic highly saline waters from the Eastern Mediterranean or less oligotrophic waters of lower salinity from the Western Mediterranean to the Adriatic, flushing the Adriatic within a few years at maximum (Mosetti, 1983; Vilibić and Orlić, 2002; Franić, 2005; Vilibić et al., 2020). Such a self-sustainable reversals of circulation regimes may be impacted and modified by: (i) extraordinary Mediterranean-wide events like the Eastern Mediterranean Transient (EMT, Klein et al., 1999; Incarbona et al., 2016), which occurred from the late-1980s to the mid-1990s and additionally strengthened anticyclonic BiOS, resulting in an unprecedented change in biogeochemical properties in the Adriatic (Grbec et al., 2009; Vilibić et al., 2012), (ii) local wind-driven vortices (like Messina Rise Vortex and Pelops Gyre—see Figure 1), that may redirect the path of the Mid-Ionian Jet and therefore re-shape the circulation in the Northern Ionian Sea (Menna et al., 2019), (iii) climate change, as weakening of the Adriatic-Ionian thermohaline circulation has been observed (Vilibić et al., 2013), or other.
Substantial changes in thermohaline properties were observed in both Adriatic and Eastern Mediterranean basins during the recent decades, which might be a reflection of ongoing climate change in the Mediterranean (Giorgi, 2006; Gualdi et al., 2013). This includes the increase of sea surface temperatures throughout the basin (Pastor et al., 2018), largely related to both climate warming and multidecadal oscillations originating from the North Atlantic (Marullo et al., 2011; Skliris et al., 2012; Macias et al., 2013). Further, the substantial increase in surface salinity, especially after 2006, has been observed, conjoined with the reduction in advection of less saline Atlantic waters toward the Eastern Mediterranean (Kassis and Korres, 2020). The salinity increase has peaked in recent years (0.14 over a year between 2015 and 2018, Grodsky et al., 2019). Such an increase might be relevant for the change of the LIW source characteristics (Kubin et al., 2019), which in turn may change characteristics of the Western Mediterranean intermediate waters and alter the thermohaline characteristics of the whole basin (Ben Ismail et al., 2014; Vargas-Yáñez et al., 2017). This can also impact salinity distribution in the Adriatic Sea, where a substantial increase in salinity and change in its structure have been recently recorded (Kokkini et al., 2020).
Recent Adriatic observations, mostly by Argo profilers in the SAP between 2013 and 2016 and by CTD probes, reveal: (i) deepening of the saline LIW core from near-surface layers (50–100 m) in 2013 to 200–400 m in 2014 and further to 400–700 m in 2015–2016, while (ii) new surface and subsurface high salinity waters started to enter the SAP in spring 2015, with surface salinity as high as 38.9 in 2016, creating two salinity maxima in vertical profile (Babić et al., 2017; Hure et al., 2018; Kokkini et al., 2020). The wintertime conditions during 2013 were in favor of DWF, while 2014–2016 period was characterized by relatively mild winters. Additionally, a large freshwater load through rivers and precipitation, that created haline-driven stratification, was documented during 2014 (Mihanović et al., 2018; Kokkini et al., 2020). The surface inflow of high salinity waters from the Eastern Mediterranean continued in early 2017, preconditioning the record-breaking salinities observed in summer and autumn at the coastal Stončica station (CJ009 – see Figure 1 for the location of the station) off the eastern Middle Adriatic coast, characterized by unusual “inverse” salinity vertical structure (with the highest salinities observed in the surface and near-surface layers, Beg Paklar et al., 2020). Such a vertical structure is uncommon in the Adriatic, but it regularly appears in the Levantine basin, preconditioning (among other) the LIW formation (Kubin et al., 2019). A sharp negative halocline is collocated with a sharp seasonal thermocline there, to the depths of 20 to a 100 m (Kubin et al., 2019; Kassis and Korres, 2020). The thermocline is developed and maintained by extensive heat gain and low wind conditions, while evaporation mostly affects surface waters, in particular during summer and autumn, increasing the surface salinity. Both thermocline and halocline deteriorate during the LIW formation in winter. Surface salinity maxima are also known to occur in subtropical regions where they are related to extensive heating and evaporation (Bingham et al., 2014; Chen et al., 2018; Wang et al., 2019) during stable (low wind) weather conditions.
An interesting consequence of the unusual salinity conditions, hypothesized to be governed by local (heat and water fluxes) and remote (BiOS) drivers, documented in the eastern Middle Adriatic in 2017, was their effect on the microbial food web (Beg Paklar et al., 2020), in particular to the substantially lower bacterial production and abundance. In this manuscript we intend to provide a wider basin-scale picture of the air-sea interactions and circulation in the Adriatic-Ionian basin during the appearance of surface and near-surface high salinity maxima. Moreover, the availability of historic thermohaline data enabled us to investigate similar events, which occurred previously in the Adriatic Sea, and to determine more precisely the preconditioning and processes responsible for the occurrence of high salinities. Section “Data and methods” overviews measurements and other tools used to quantify thermohaline changes during 2017 and the respective preconditioning period, and during occurrences of historical high surface salinity events (1961–2016). Section “Thermohaline properties in 2017” displays basin-wide thermohaline observations and outputs of the Mediterranean Forecasting System operational numerical model for 2017. The processes contributing to anomalous thermohaline properties in 2017, occurring from decadal to daily scales, are documented in Section “Processes contributing to anomalous thermohaline properties in 2017”. Section “Past high surface and near-surface salinity events in the Adriatic” focuses on the analysis of historical data in order to detect past events of surface salinity maximum and inverse subsurface halocline, and on investigation of the respective background processes. The results are discussed and the study is concluded in Section “Discussion and Conclusion,” which also briefly documents the most recent (2018–2020) thermohaline observations in the Adriatic.
Temperature and salinity data collected at the Palagruža Sill transect were acquired during five cruises in 2017, at 10–12 stations (Figure 1 and Table 1). The sampling at the transect was done with Seabird 25 probe1, which has accuracy of ± 0.002°C for temperature and ± 0.002 for salinity.
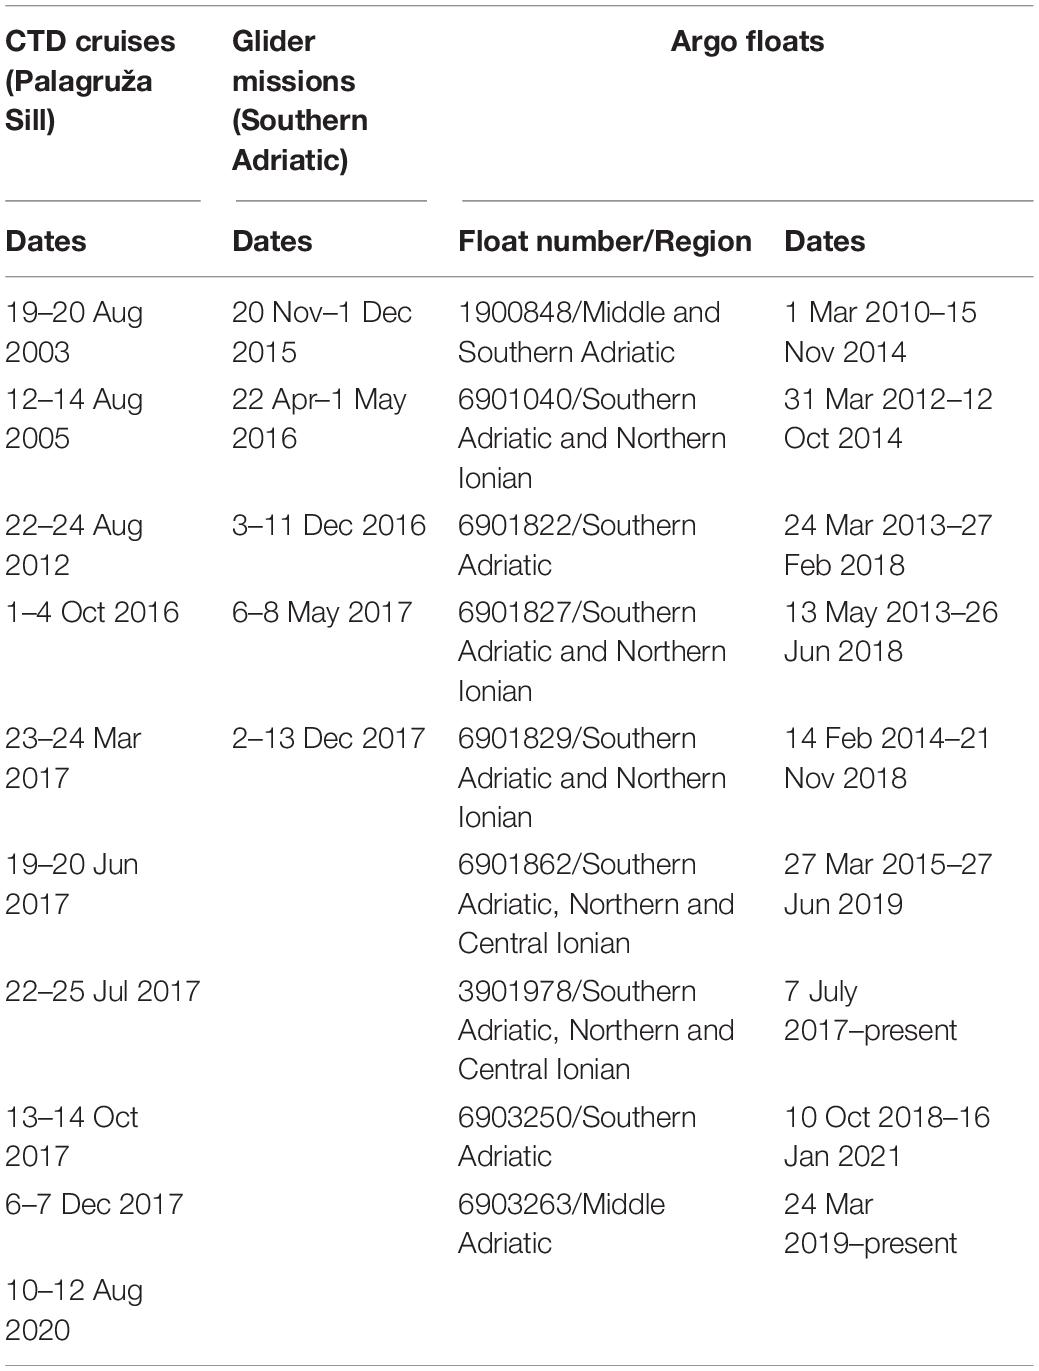
Table 1. The list of CTD cruises (Palagruža Sill), glider missions (Southern Adriatic), and Argo profilers (Northern and Central Ionian Sea, Middle and Southern Adriatic) presented in the study, including their deployment periods.
Long-term temperature and salinity data at the Palagruža Sill transect collected between 1961 and 2017 were analyzed and episodes of vertical salinity distributions that resemble the 2017 salinity distributions were extracted. These data were collected with monthly to seasonal resolution, using different sampling techniques (reversing thermometers and various CTD probes for temperature; titration with AgNO3, portable induction salinometers and various CTD probes for salinity). The series were homogenized and used in different studies (e.g., Vilibić et al., 2013; Beg Paklar et al., 2020), in which more details on the measurements procedures can be found. We focused on episodes with surface salinity values higher than 38.8 observed on at least one station along the transect, between 0 and 20 m (considering them as high surface salinity events). This threshold was based on long-term monthly measurements at the Stončica station (CJ009), as it is at least one standard deviation above long-term average for any month of the year (Beg Paklar et al., 2020).
Three winter (November/December) and two spring (April/May) glider missions were carried out across the SAP between 2015 and 2017, roughly from Bari to Dubrovnik (Figure 1 and Table 1). Teledyne Slocum gliders2 were used, sampling temperature and salinity down to 1,000 m, using a Sea-Bird pumped payload CTD (GPCTD) with accuracies of ± 0.002°C and ± 0.002, respectively (Stommel, 1989; Merckelbach et al., 2008; Rudnick et al., 2012). The sensors were calibrated prior to each deployment. More details on glider campaigns may be found in Kokkini et al. (2020).
Thermohaline data from seven Argo floats that were profiling in the Adriatic and Northern Ionian between 2010 and 2017 were used in our study (Argo, 2021). The WMO numbers of the floats are: 1900848, 6901040, 6901822, 6901827, 3901978, 6901829, and 6901862. These measurements were conducted within the framework of the MedArgo programme (Poulain et al., 2007) and the European MOCCA project. Sea-Bird CTD sensors (model 41/41 CP) with initial accuracies of ± 0.002°C and ± 0.003 were used for temperature and salinity measurements, respectively, while all floats had cycle duration between 1 and 5 days and a parking pressure of 350 dbar. Initial accuracies indicate accuracies of Argo float sensors after their initial deployment, usually assessed by comparing the temperature and salinity values measured in the first few cycles to CTD data obtained shortly after the Argo float deployments (Nezlin et al., 2020). The parking depth for float 1900848 was changed to 150 dbar when it drifted to the Middle Adriatic area in the second part of 2010 (Vilibić and Mihanović, 2013). Moreover, recent data from Argo floats 3901978 (Southern Adriatic and Ionian), 6903250 (Southern Adriatic) and 6903263 (Jabuka Pit) were also analyzed, to document salinity properties in recent years (2018—2020). The parking depth of the float 6903250 was set to 1,000 dbar, as this is a Bio-Argo float and larger parking depth is usually set in order to limit the drift of the float in other zones with different biogeochemical characteristics. Therefore, it mostly remained within the inner perimeter of the South Adriatic Pit. On the other hand, the Jabuka Pit float 6903263 profiled the entire water column in a relatively small area during most cycles, as it was configured with a parking depth close to the bottom.
Daily heat and water (evaporation minus precipitation, E-P) fluxes were computed from the European Centre for Medium-Range Weather Forecasts (ECMWF) ERA-Interim dataset (3 Dee et al., 2011) and averaged over the central part of the Southern Adriatic, representing open sea conditions in the area (Figure 1). Daily averaged data of Po River collected at the Pontelagoscuro sampling station were used to present variability in river discharges (Figure 1). Finally, to detect anomalous conditions, the averages and standard deviations were computed for the period between 1979 and 2017 and compared versus actual values, all averaged on monthly time scale.
Mean absolute dynamic topography (ADT) data were used to quantify both seasonal variability in the surface circulation and the BiOS. ADT is AVISO+ (Gridded Sea Level Heights and derived variables – Mediterranean Sea) product with a 1/8° resolution that has been available since 1993 and can be accessed at http://marine.copernicus.eu. In order to quantify BiOS-driven variability, vorticity was estimated from the surface currents and averaged over the central part of the Northern Ionian Sea (Figure 1), following the procedure described by Shabrang et al. (2016).
The Mediterranean Forecasting System (MFS) results available at http://marine.copernicus.eu were used to assess the surface thermohaline properties and the circulation during 2017 (Clementi et al., 2019). The MFS numerical analysis and short-term forecasts are available since 2000 (Pinardi et al., 2003; Pinardi and Coppini, 2010). The MFS hydrodynamic system is implemented over the entire Mediterranean basin including tides and is composed of two elements: the Nucleus for European Modeling of the Ocean (NEMO v3.6) and third generation Wave Model (Wave Watch-III). Numerical solutions are corrected by a variational data assimilation scheme based on 3DVAR. The horizontal resolution of the model is 1/24° (around 4 km) and the model has 141 unevenly spaced vertical levels. It is forced by momentum, water and heat fluxes interactively computed using operational analysis and forecast fields from the ECMWF and the model predicted surface temperatures (Pettenuzzo et al., 2010).
The temperature and salinity observations taken at the Palagruža Sill transect (Figure 2) indicate high salinity conditions throughout 2017, in respect to values/data presented in previous Adriatic climatologies and literature (Buljan and Zore-Armanda, 1976; Artegiani et al., 1997; Lipizer et al., 2014; Beg Paklar et al., 2020). The bilinear interpolation (e.g., Kirkland, 2010) was used to plot these transects from available CTD casts, still likely resulting in some artifacts due to small number of CTD profiles along the transect, such as somewhat peculiar salinity vertical structures between the first three CTD casts on the right, which are likely generated by not accounting for the seamount in our interpolation. On 23–24 March 2017 (Figure 2A), the very surface waters started to warm up, while the NAdDW outflow, characterized by temperatures lower than 13°C and salinities lower than 38.8, was detected near the bottom. The outflow followed the DWF on the Northern Adriatic shelf which likely occurred in January 2017, when extreme cold periods, with severe bora events, were recorded in the Adriatic (DHMZ, 2018). Salinity in the Middle Adriatic in March 2017 was high, between 38.8 and 38.93 at the transect stations, except close to the eastern (entire water column) and western (near the surface) Adriatic coast. Salinity values near the bottom, at the core of the NAdDW flow, were around 38.8, which is much higher than the average of ∼38.6 in the period 1952–2010 (Vilibić et al., 2013). On 19–20 June 2017 (Figure 2B), the thermocline was well developed and relatively shallow (15–25 m), while salinity reached the maximum in the intermediate layers (∼38.94) where the LIW normally crosses the Palagruža Sill (Buljan and Zore-Armanda, 1976; Martin et al., 2009). Surface salinity in the central part of the transect (38.8–38.9) was slightly lower than in the intermediate layer (38.85–38.93), as was salinity in the deepest parts (∼38.8), where the NAdDW outflow can still be seen.
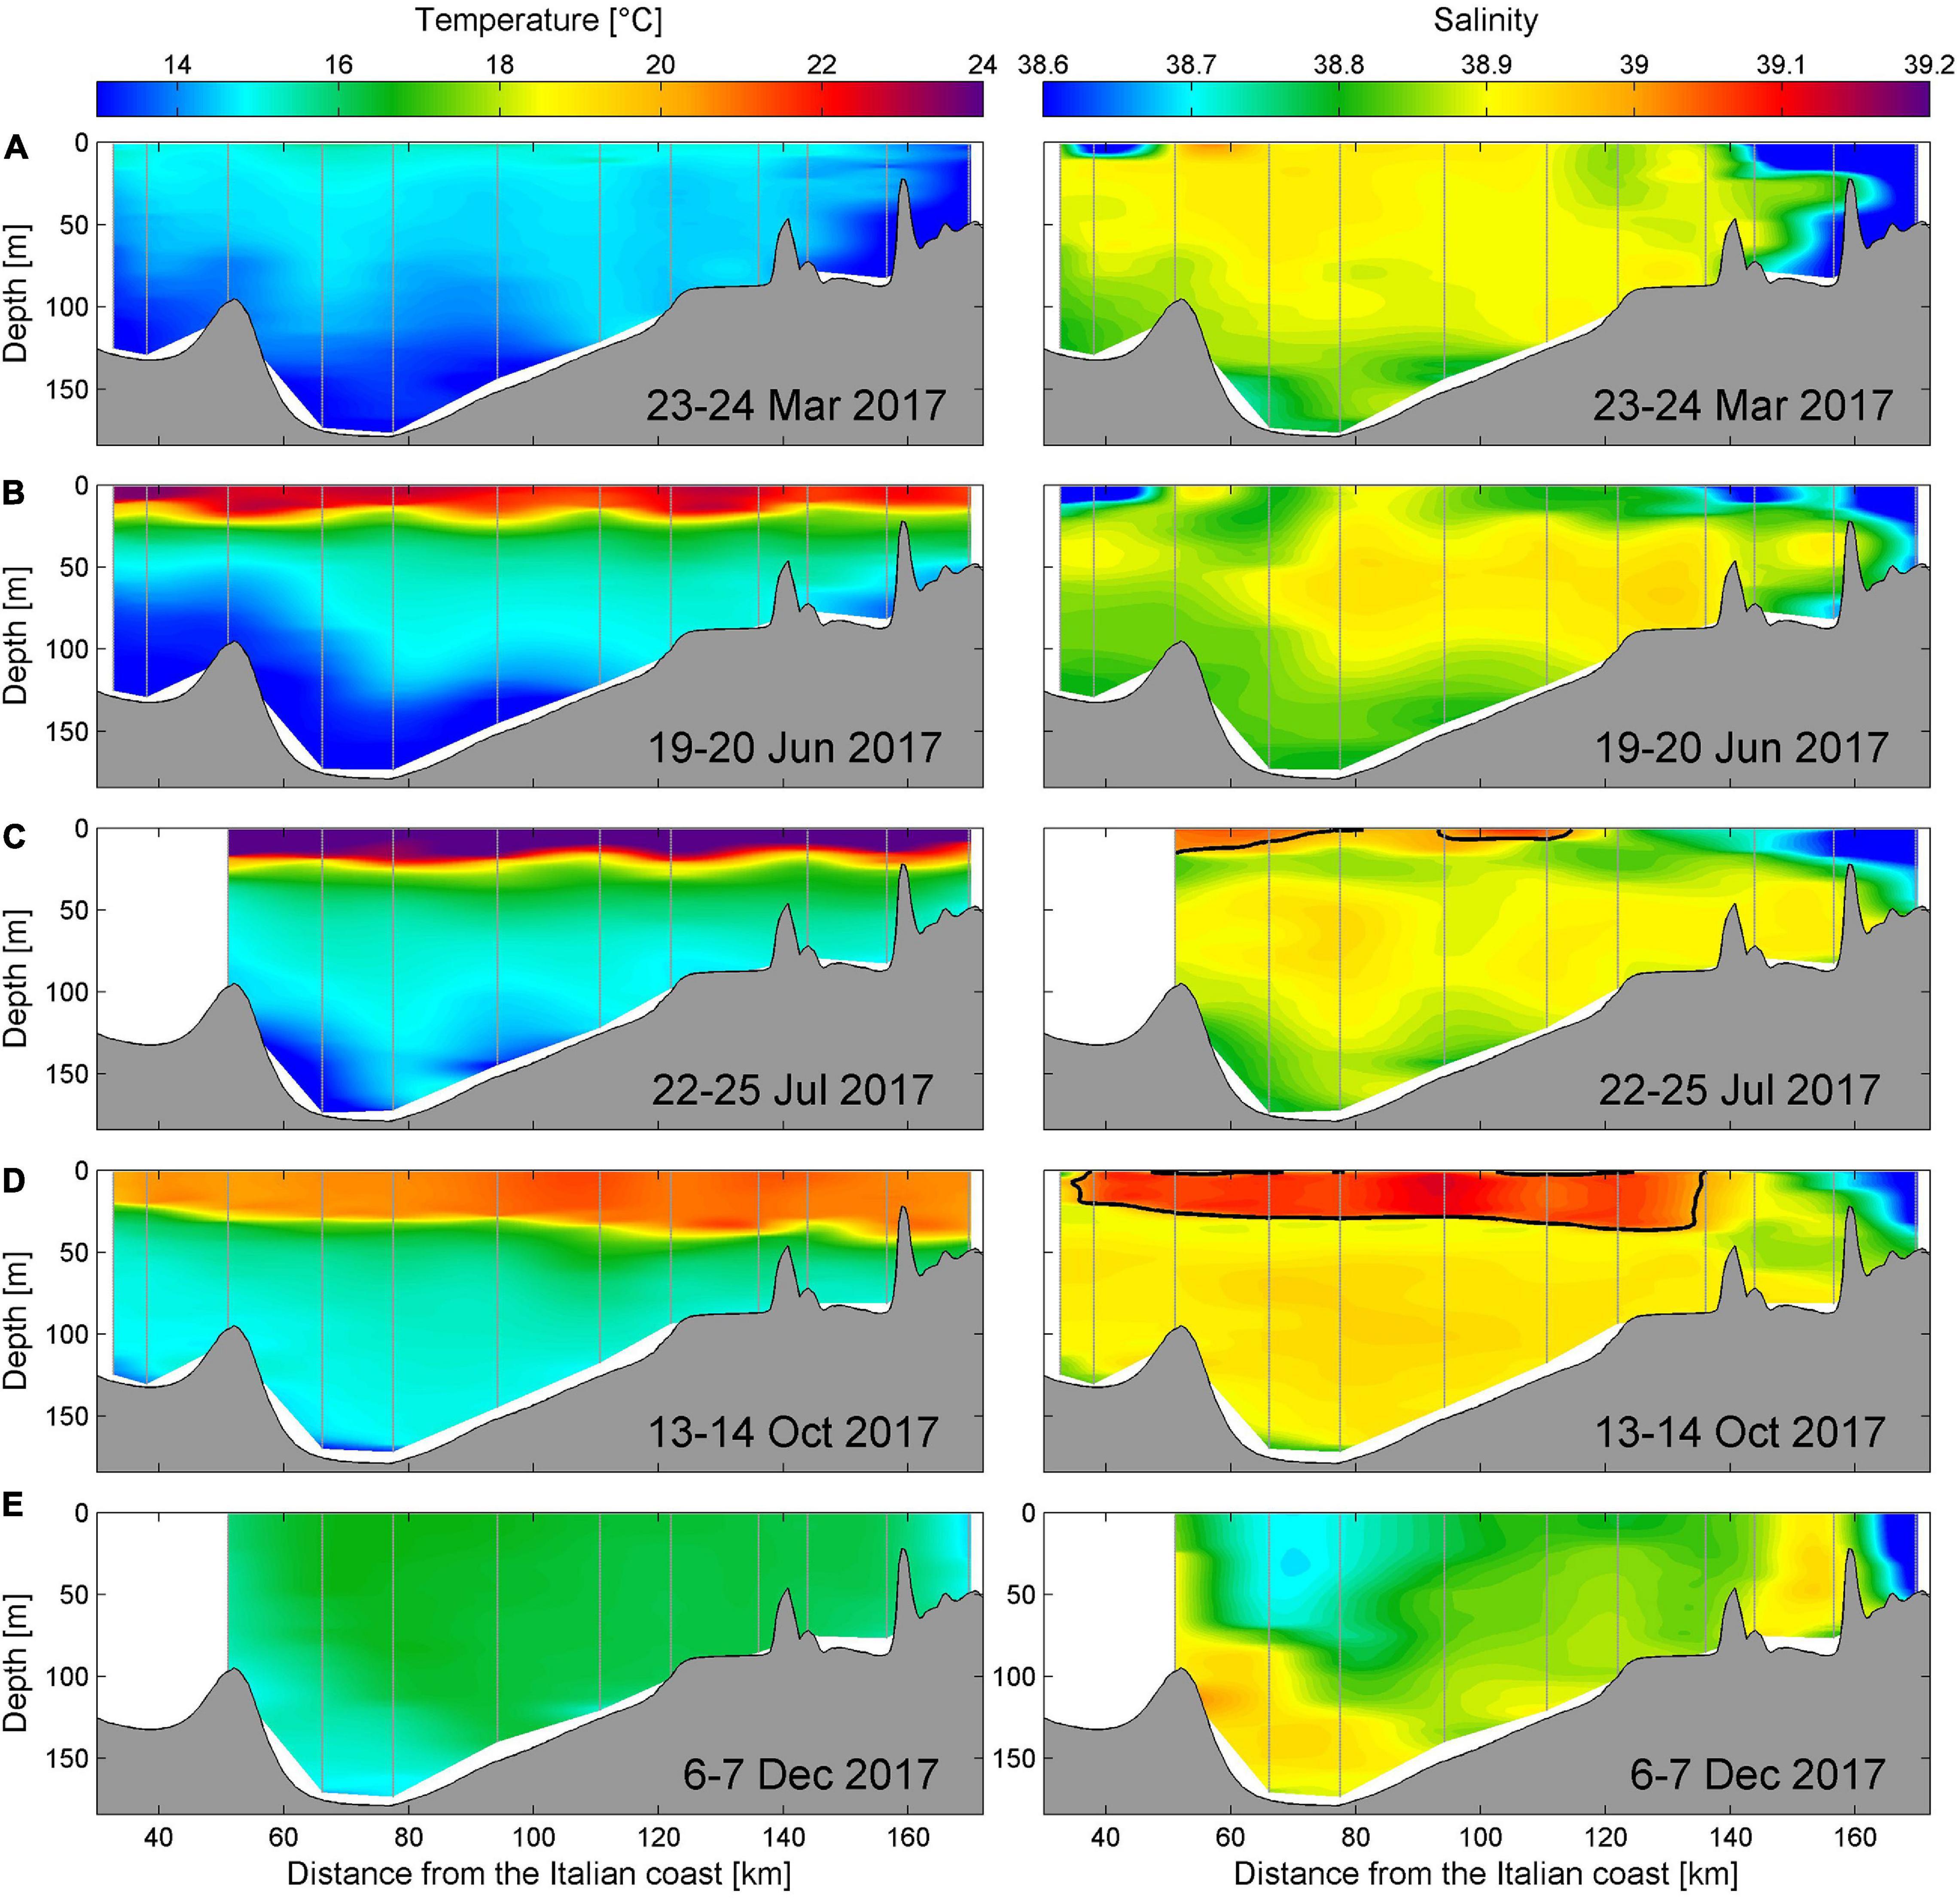
Figure 2. Temperature and salinity measured at the Palagruža Sill transect: (A) 23–24 March 2017, (B) 19–20 June 2017, (C) 22–25 July 2017, (D) 13–14 October 2017 and (E) 6–7 December 2017. Salinity values higher than 39.0 are encircled with black line in salinity plots. Vertical gray lines denote CTD casts.
A month later, on 22–25 July 2017 (Figure 2C), the salinity and temperature measurements were still reflecting the LIW inflow at depths between 50 and 100 m and weakened NAdDW outflow in the intermediate and deep layers of the transect, respectively. However, the upper-layer temperature increased significantly, reaching almost 26°C. This very strong thermocline did not deepen compared to June measurements and was still at depths of around 15–25 m. Interestingly, the salinity maximum started to develop at the very surface of the transect, surpassing 39.0 at some stations. Such conditions continued to develop, peaking on 13–14 October 2017, when a clear surface pool of highly saline and warm waters was observed along most of the transect (Figure 2D). The depth of thermocline and halocline ranged from 20 m at the southern section of the transect to about 40 m off the coastal region of the northern part of the transect. The intensity of the thermocline and halocline was −2°C m–1 and −0.18 m–1, respectively. The highest values of salinity in the central part of the transect exceeded 39.1.
The last 2017 cruise along the Palagruža Sill transect, carried out on 6–7 December (Figure 2E), indicated vertical homogenization of the waters along the whole transect, except in its deepest parts. The salinity decreased substantially in the surface layer (38.7–38.85), while high values of salinity (up to 38.94) were still observed near the bottom. The surface salinity recorded on monthly basis at the Stončica station (CJ009) was higher than 38.8 throughout 2017, and it was 2–2.5 standard deviations above the long-term average between June and November 2017, revealing exceptional conditions not previously documented for the Middle Adriatic (Beg Paklar et al., 2020).
Trajectories and Hovmöller diagrams of salinity in the upper 600 m of five Argo profiling floats active during 2017 in the Southern Adriatic, the Strait of Otranto and the Northern Ionian Sea are displayed in Figure 3. Interestingly, all floats recorded an exceptional maximum in the surface and near-surface salinity during summer and autumn seasons, peaking in values higher than 39.2 at the very surface. In particular, very high salinity values (above 38.9) can be detected in the upper 100 m in the Southern Adriatic (Figures 3A,B) since early March 2017 and down to 200–300 m in the Strait of Otranto (Figure 3E) and the Northern Ionian Sea (Figure 3D) during most of 2017.
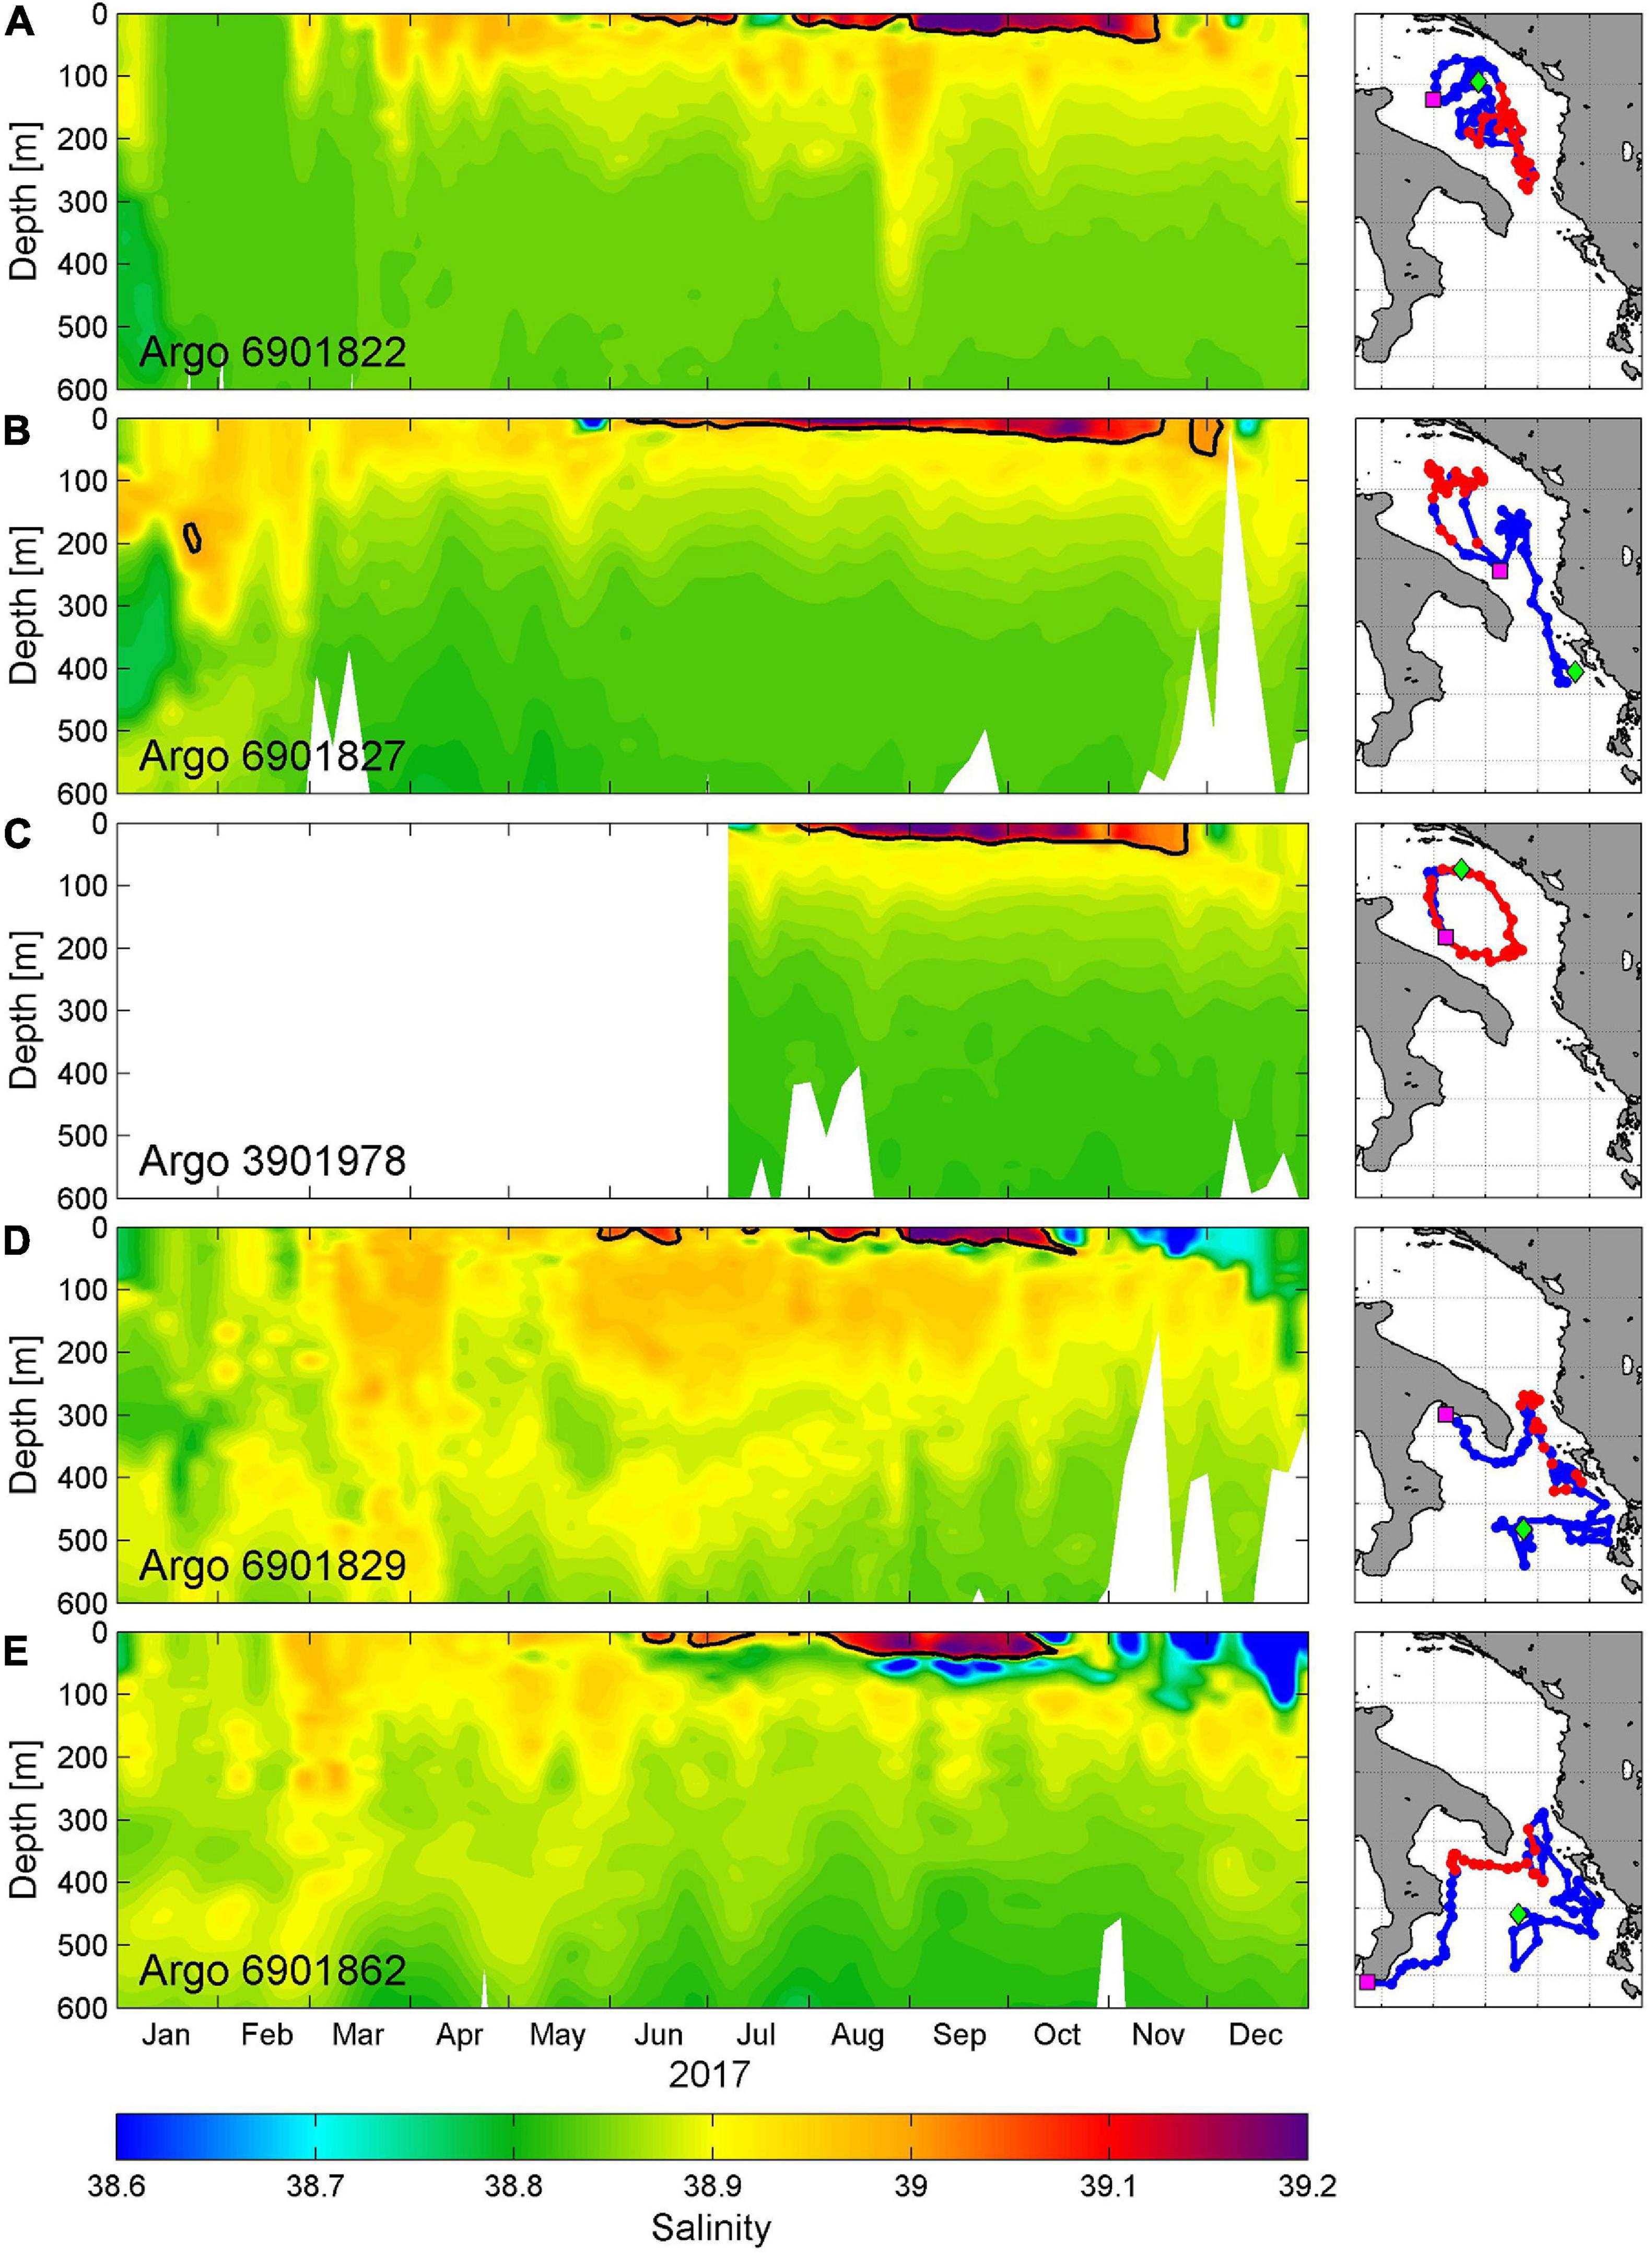
Figure 3. (A) Hovmöller diagram of salinity data for Argo float 6901822 in the first 600 m in 2017 (left panel) with corresponding float trajectory (right panel). Thick black line in the left panel denotes 39.0 salinity contour, while the corresponding part of the trajectory is colored in red in the right panel. The location of the first vertical profile in 2017 is denoted by green diamond in right panel, while the last vertical profile in 2017 is marked with magenta square. (B–E) As in panel (A) except for Argo floats 6901827, 3901978, 6901829, and 6901862, respectively.
The surface pools of exceptionally high salinity waters (thick black line in left panels in Figure 3 denotes 39.0 salinity contour) were first observed in the Argo profiling float data from the northeastern Ionian Sea, just southeast of the Strait of Otranto (Argo float 6901829; Figure 3D), at the end of May 2017. Then, during June these pools were observed by the Southern Adriatic floats (6901822 and 6901827; Figures 3A,B) and by another Northern Ionian float (6901862; Figure 3E). Surface salinity values were slightly lower than 39.0 at locations of most of the analyzed floats during most of July 2017 (except 6901827; Figure 3B). However, from late July all floats observed exceptionally high surface salinity values. Some of them were sampled till mid-October in the Northern Ionian (Figures 3D,E). Surface salinity in the Southern Adriatic peaked between August and October, and gradually decreased through November, as seen in the data of three Southern Adriatic floats (Figures 3A–C), likely pointing to enhanced vertical mixing.
Glider campaigns carried out in the Southern Adriatic during 2017 indicated the surface salinity maximum as early as May (Figure 4A), with values slightly lower than 39.0 in the layer between the surface and 50 m depth. This relatively short glider campaign (2 days) documented the surface salinity increase in the central part of the SAP, as saline waters from the Northern Ionian were entering in the Southern Adriatic already in March 2017 (Figures 3A,B). The surface/subsurface salinity maximum was still present in the first 70–80 m along the central part of the Southern Adriatic transect (Figure 4B) between 2 and 6 December 2017, with values close to 39.0. Interestingly, the upper layer of warmer and highly saline waters deepened to 120 m toward the end of the glider mission, between 8 and 13 December 2017, elucidating the ongoing mixing, cooling and deepening of the surface salinity pool, most probably due to the atmospheric forcing (the crossing point between the “A-B” and “C-D” segments of the glider mission is indicated by letter “X,” as this was the location that was sampled twice during this glider mission, on 4 December and on 12 December 2017).
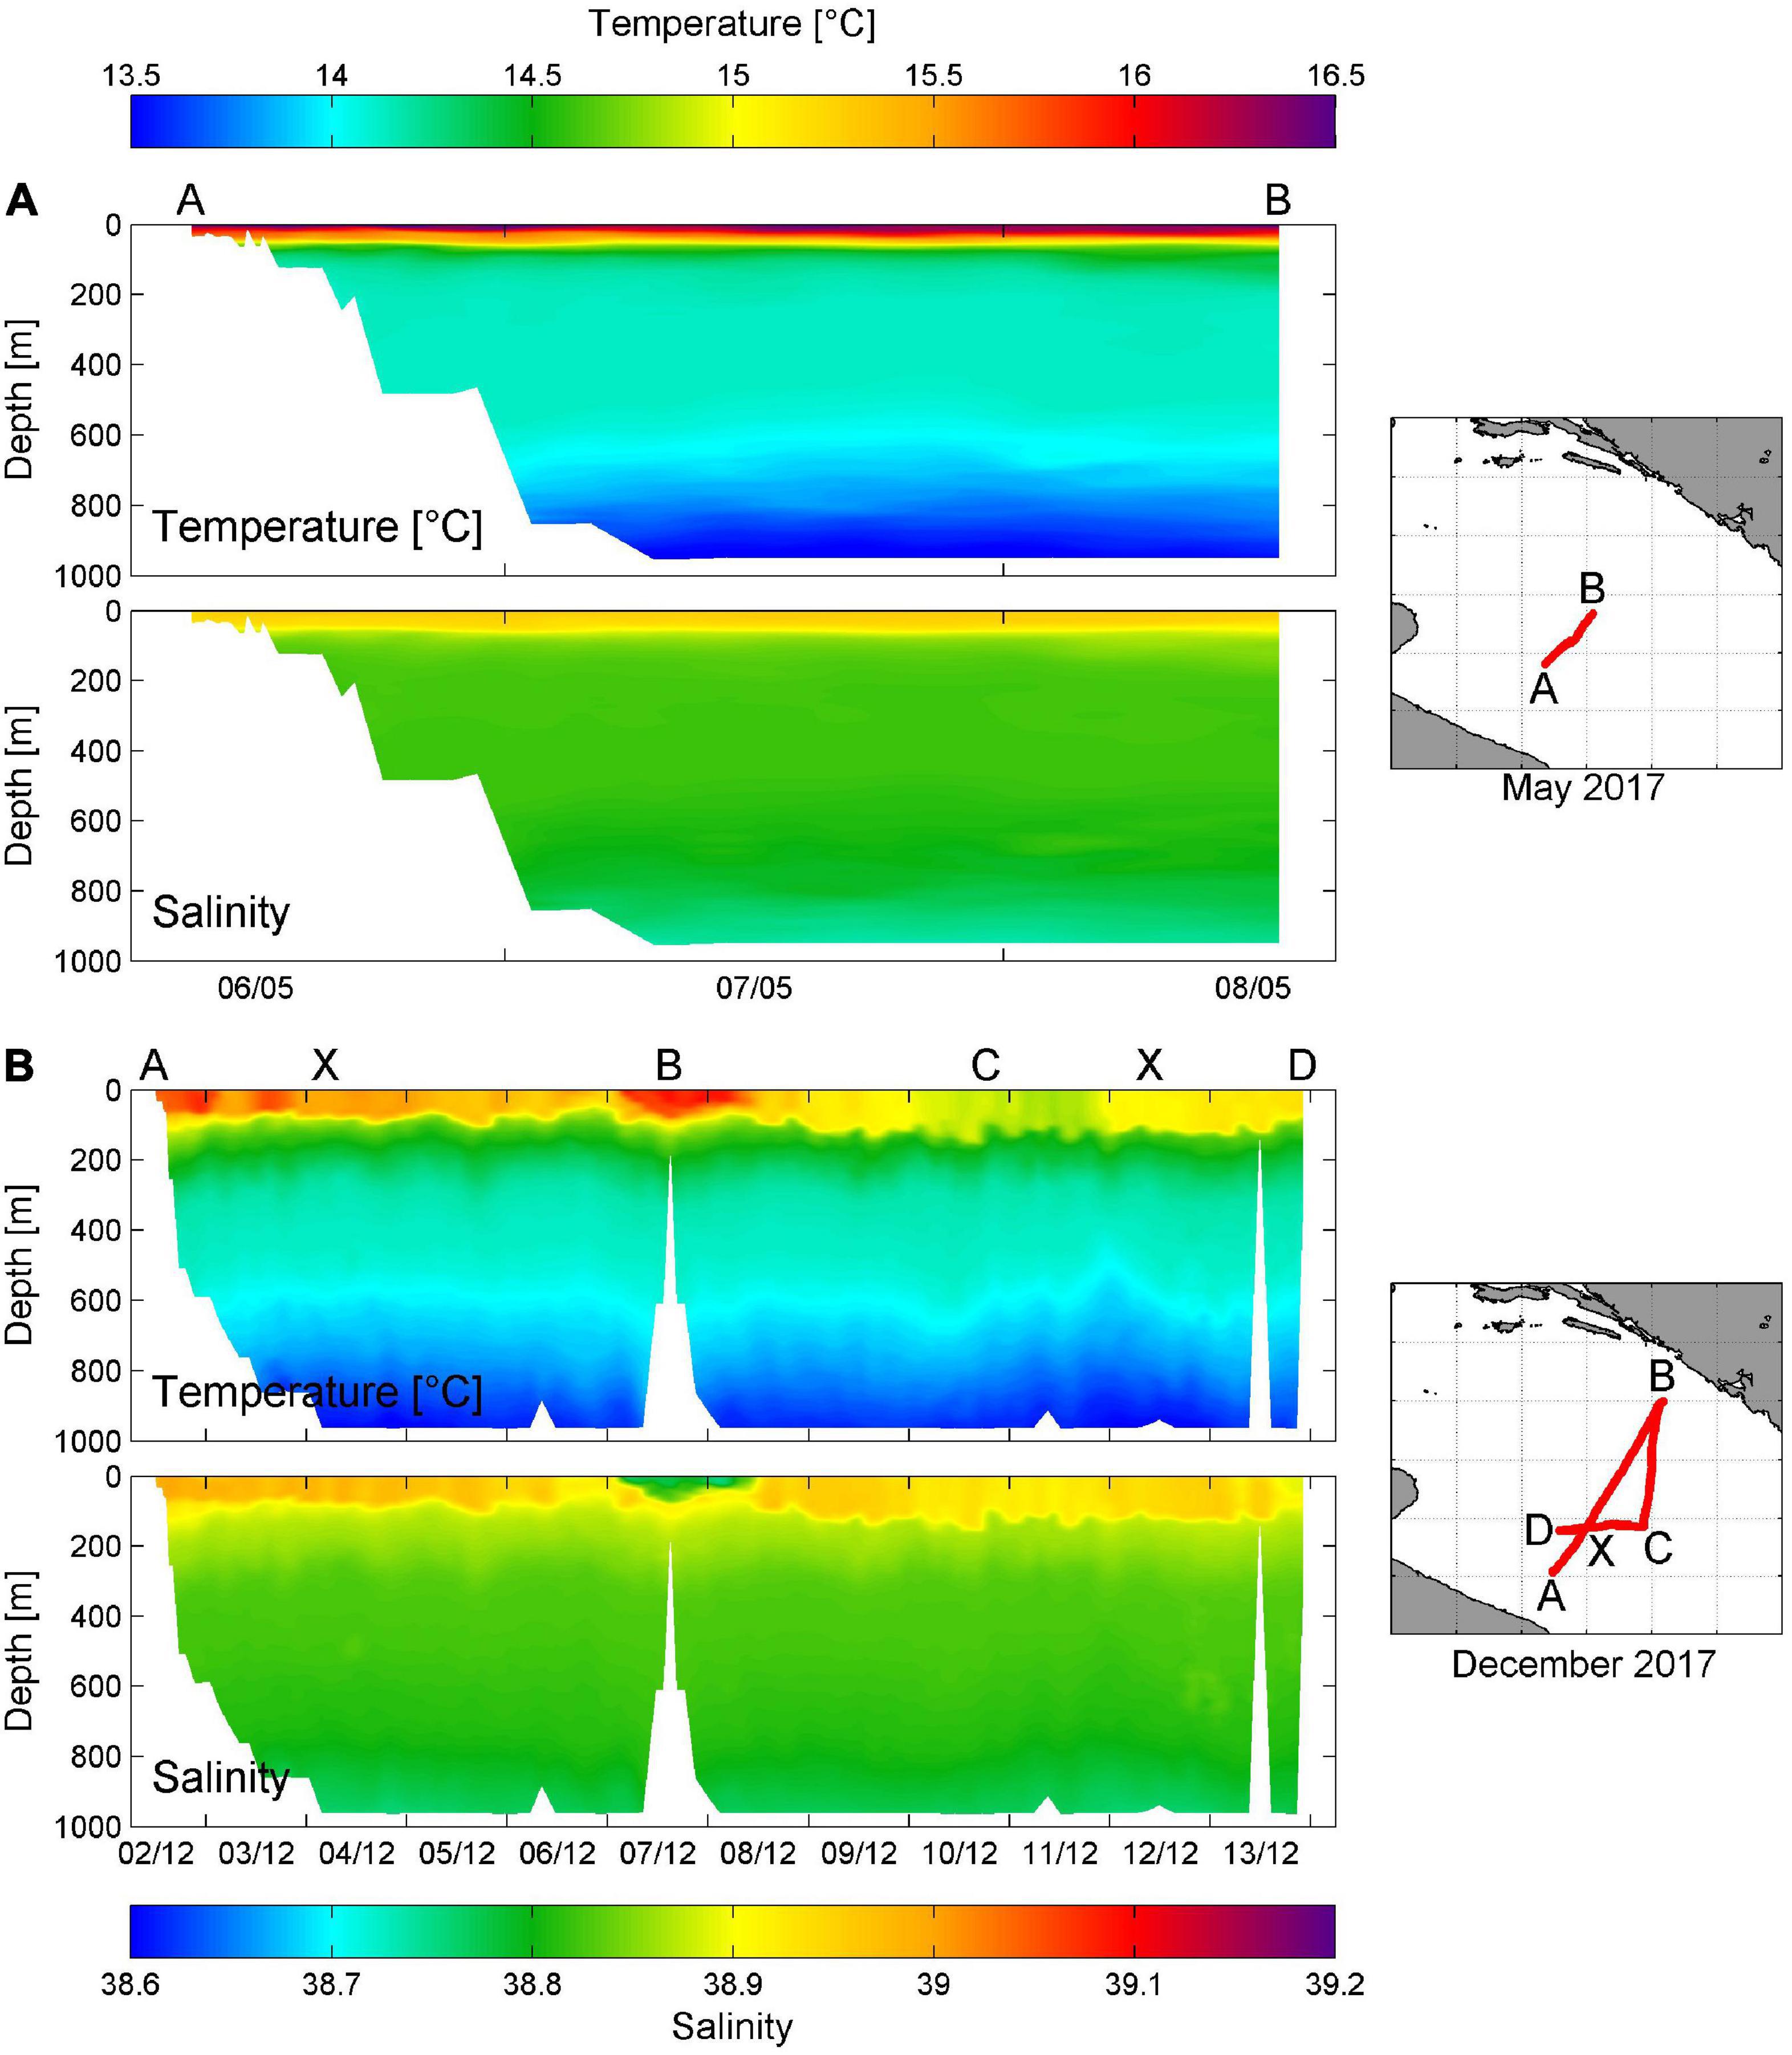
Figure 4. (A) Glider temperature and salinity transects in the in the Southern Adriatic between 6 and 8 May 2017 (left panels) and the corresponding trajectory of the glider (right panel). (B) As in panel (A) except for glider transect from 2 to 13 December 2017. The crossing point between the “A–B” and “C–D” segments of the December 2017 glider mission is indicated by letter “X.”
The model outputs from the Mediterranean Forecasting System show monthly evolution of surface salinity and current fields during 2017 (Figure 5). The model indicated that surface inflow of very saline surface waters (salinities above 38.9) was present from January to April 2017 between the Northern Ionian and Southern Adriatic, and that spread across the Southern Adriatic. This process is also reflected in two Argo floats measurements (Figures 3A,B) and in the May 2017 glider data (Figure 4). Surface waters with such a high salinity values were then exposed to intense heating and evaporation during May and June (as it will be shown later) and a pool of exceptionally highly saline surface and near-surface waters (salinities surpassing 39.0) in the southwestern part of the SAP was already present in June 2017 (Figure 5). According to the model results, the transport between Adriatic and Ionian Seas was blocked by several gyres within the Strait of Otranto in June 2017. The high-salinity waters in the SAP were accompanied with weak currents, indicating their relative stationarity. Exceptionally high surface salinity (>39.0) could also be seen in the Northern Ionian Sea in June 2017, particularly in the cyclonic gyre just south of the Strait of Otranto.
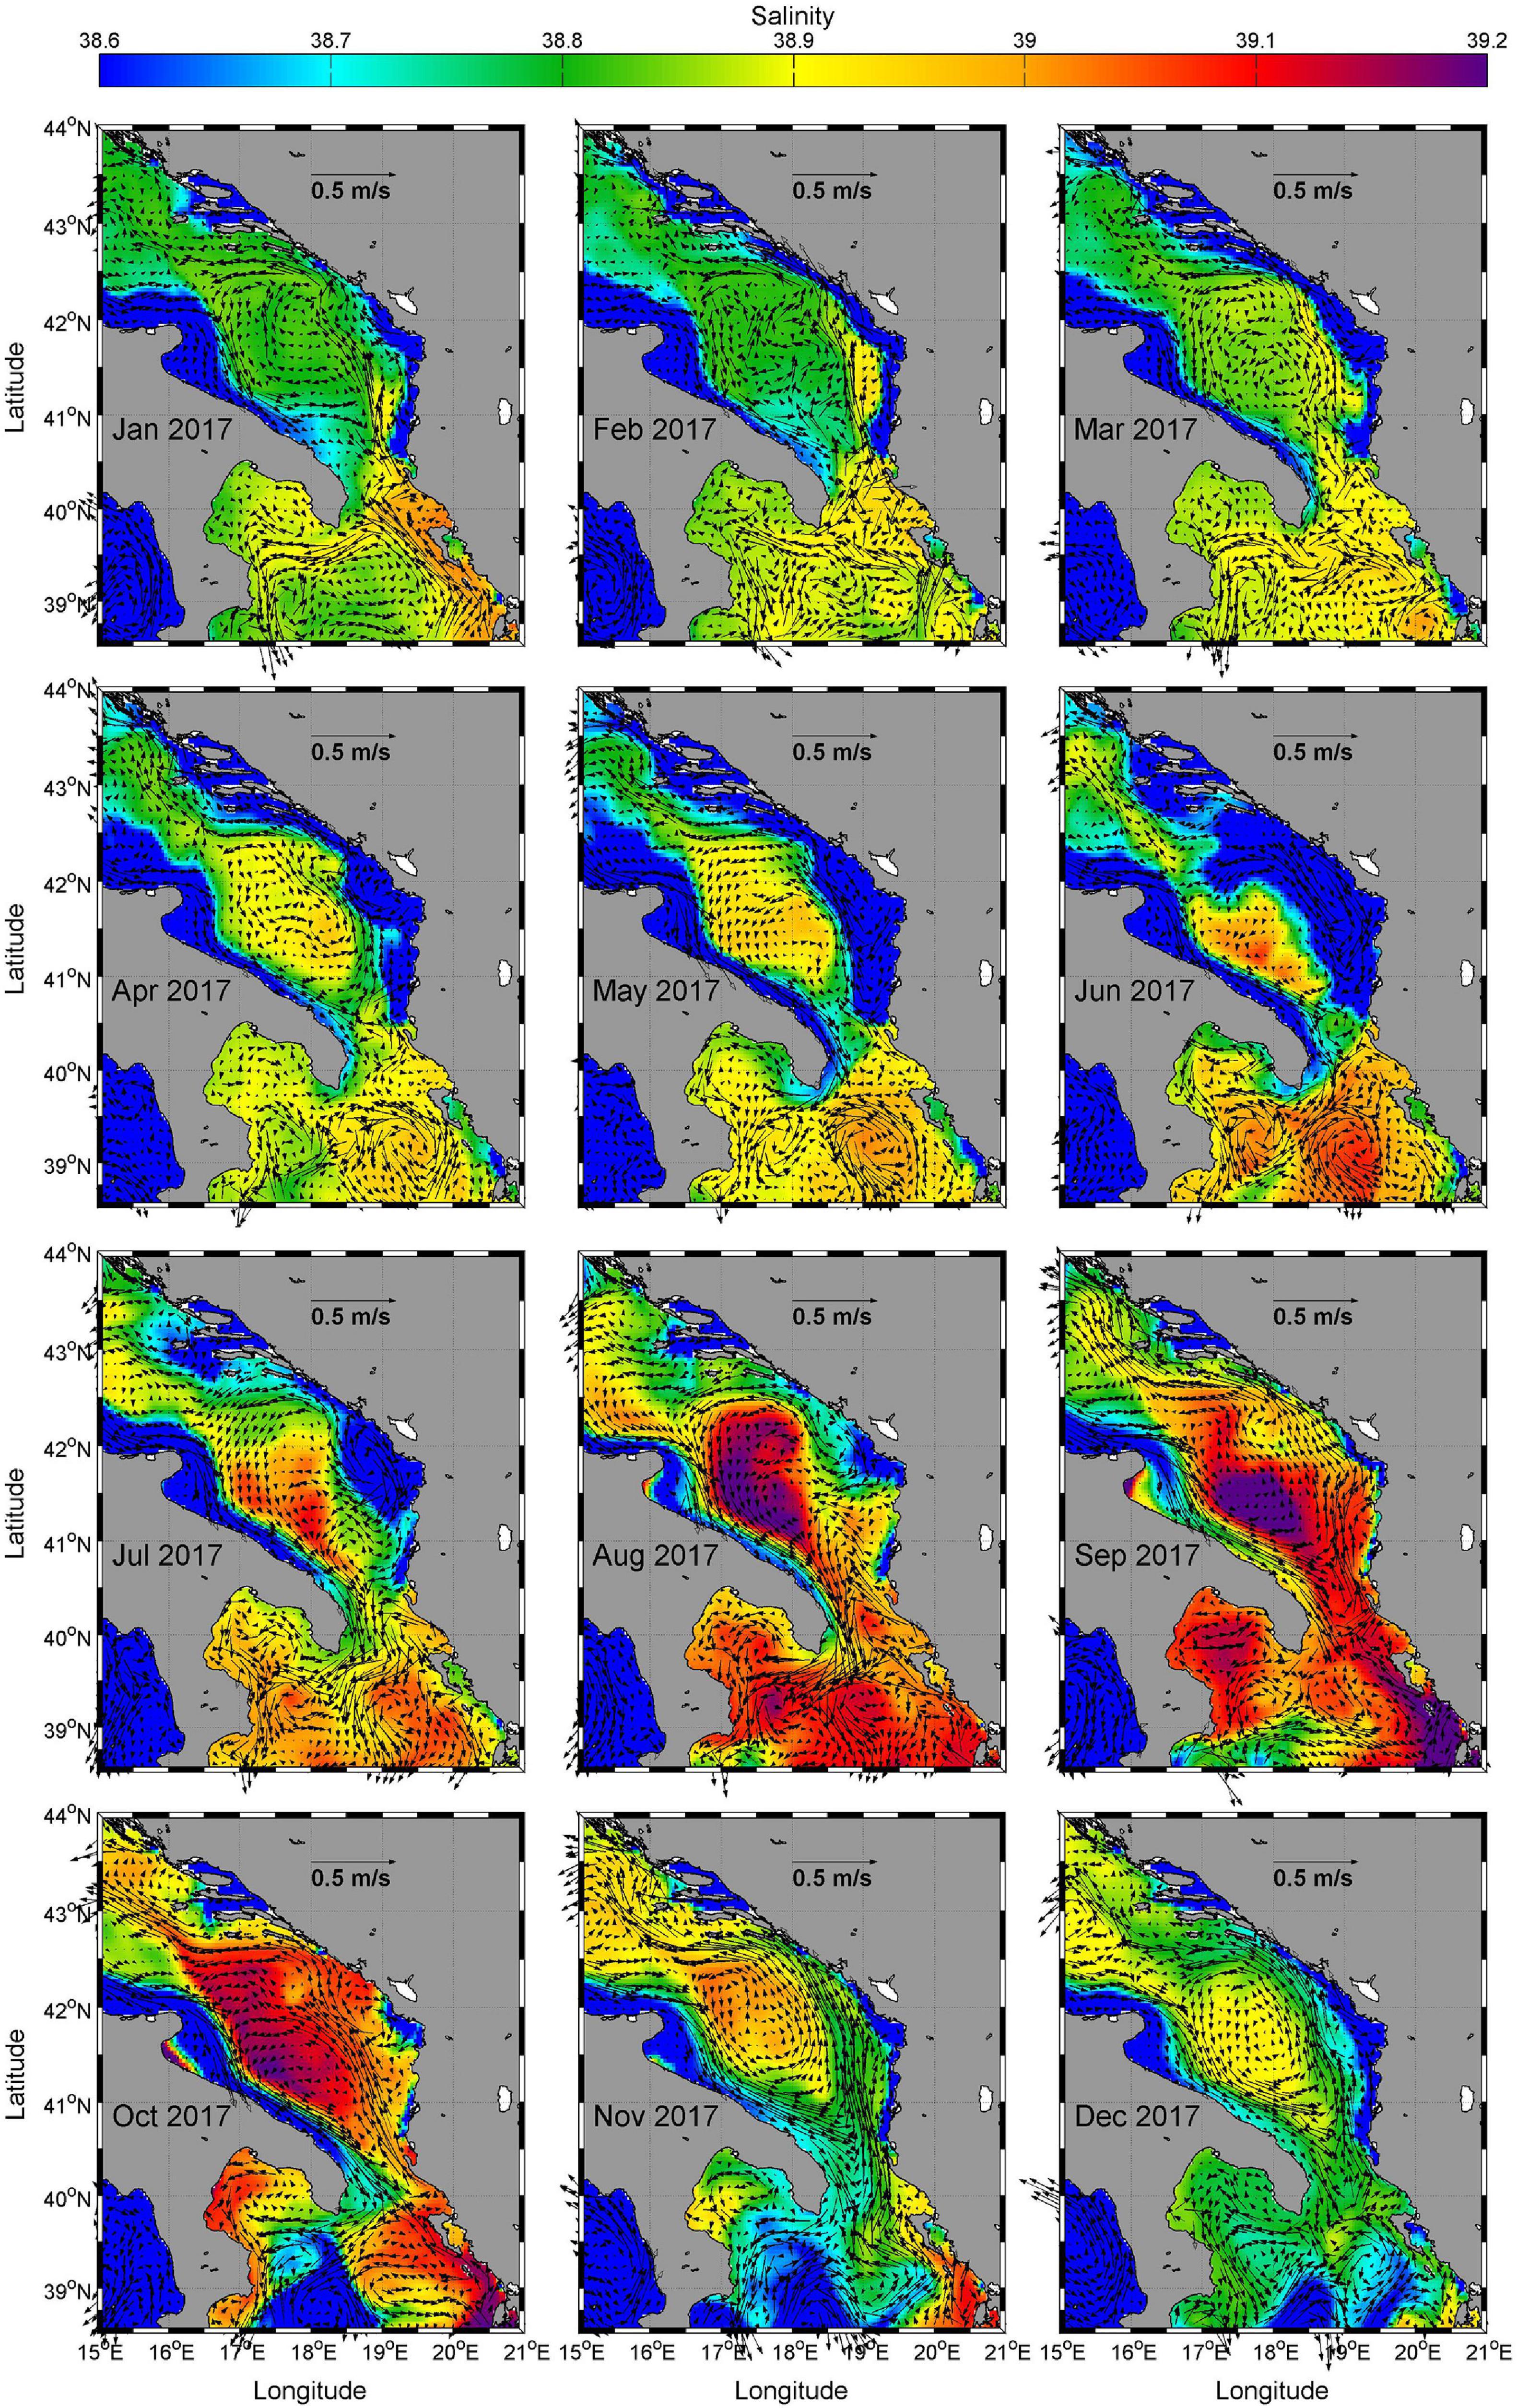
Figure 5. Modeled surface currents (Mediterranean Forecasting System) and salinities, monthly averaged between January and December 2017.
The pool of high surface salinity waters in the SAP further developed and widened in July (Figure 5), while the modeled currents in the western part of the SAP were mostly southward oriented and the majority of these waters was leaving the Adriatic Sea. However, CTD measurements at the Palagruža Sill transect in July 2017 indicated exceptionally high surface salinity in the central and southern part of the transect (Figure 2C), possibly related to the inflow from the Southern Adriatic and local salinification above the thermocline. The surface salinity reached 39.2 in the central and southwestern parts of the SAP in August. The core of the exceptionally highly saline salinity waters remained in the SAP throughout September, and the enhanced EAC started to bring some of these waters northwestward over the Palagruža Sill. Simultaneously, the exchange between the Adriatic and the Northern Ionian significantly increased, enabling additional salt advection to the Southern Adriatic. The advection of highly saline surface waters toward the Palagruža Sill reached the maximum in October (Figures 2D, 5) during which the overall along-basin surface transport was the highest. Signs of the surface salinity decrease began in November (Figure 5), but still keeping the maximum value in the central SAP.
The thermohaline variability in the Adriatic Sea is driven by a number of processes acting on daily to decadal timescales. Among these are quasi-decadal oscillations driven by the Adriatic-Ionian Oscillating Bimodal System (BiOS). Following Shabrang et al. (2016), who quantified the BiOS oscillations by computing vorticity in the Northern Ionian Sea, we computed surface vorticity in the Northern Ionian rectangle depicted in Figure 1 for the 1993–2020 period using satellite altimetry geostrophic currents. It was found that it oscillated between positive and negative values, where positive values indicate cyclonic and negative values anticyclonic BiOS regimes in the Northern Ionian Sea. When analyzing the vorticity between 2004 and 2020 (Figure 6A) i.e., during the period with a frequent (quasi-monthly) high quality CTD measurements available at the Palagruža Sill transect station CJ009 (Figure 6B), it appears that the cyclonic BiOS regime was present until 2005, switching to anticyclonic BiOS regime until the beginning of 2010, then again returning to cyclonic regime between the second half of 2010 and 2016 (with a weakening in 2012–2013, due to extraordinary DWF in winter of 2012, Gačić et al., 2014). Predominantly transient and anticyclonic regime was then observed during 2017 and 2018, shifting again to cyclonic circulation in 2019. Simultaneously, salinity at the station CJ009 (Figure 6B) exhibited a period with high values in 2004 and 2005 (reaching almost 38.9 in the intermediate and bottom layers), then it decreased to 38.2–38.6 between 2006 and 2010. New increase in salinity occurred during 2011, reaching maximum values close to 38.9 in 2012 in the intermediate and bottom layers (also exceeding 38.8 at the surface by the end of the year). Salinity values higher than 38.9 were also observed in 2013. The salinity then decreased in 2014 (36.7–38.7 in the intermediate and bottom layers), as it was a year characterized by abundant precipitation and higher than usual river discharges in the Adriatic Sea area (Kokkini et al., 2020; see also Section “Physical setting in 2017” for higher than usual Po River discharges during 2014). The salinity in the following 2 years rose again, surpassing 38.9 in the second part of 2016. During all these phases salinity mostly followed the BiOS-driven vorticity with a lag of 1–2 years, relating high salinity values with positive vorticity and vice versa. However, such an interaction was not clearly present in the 2017–2018 period, as exceptionally high salinities (above 39.0 in 2017) observed at the Palagruža Sill transect were associated with a weakening cyclonic BiOS phase switching to negative vorticity values and predominantly transient and anticyclonic BiOS regime.
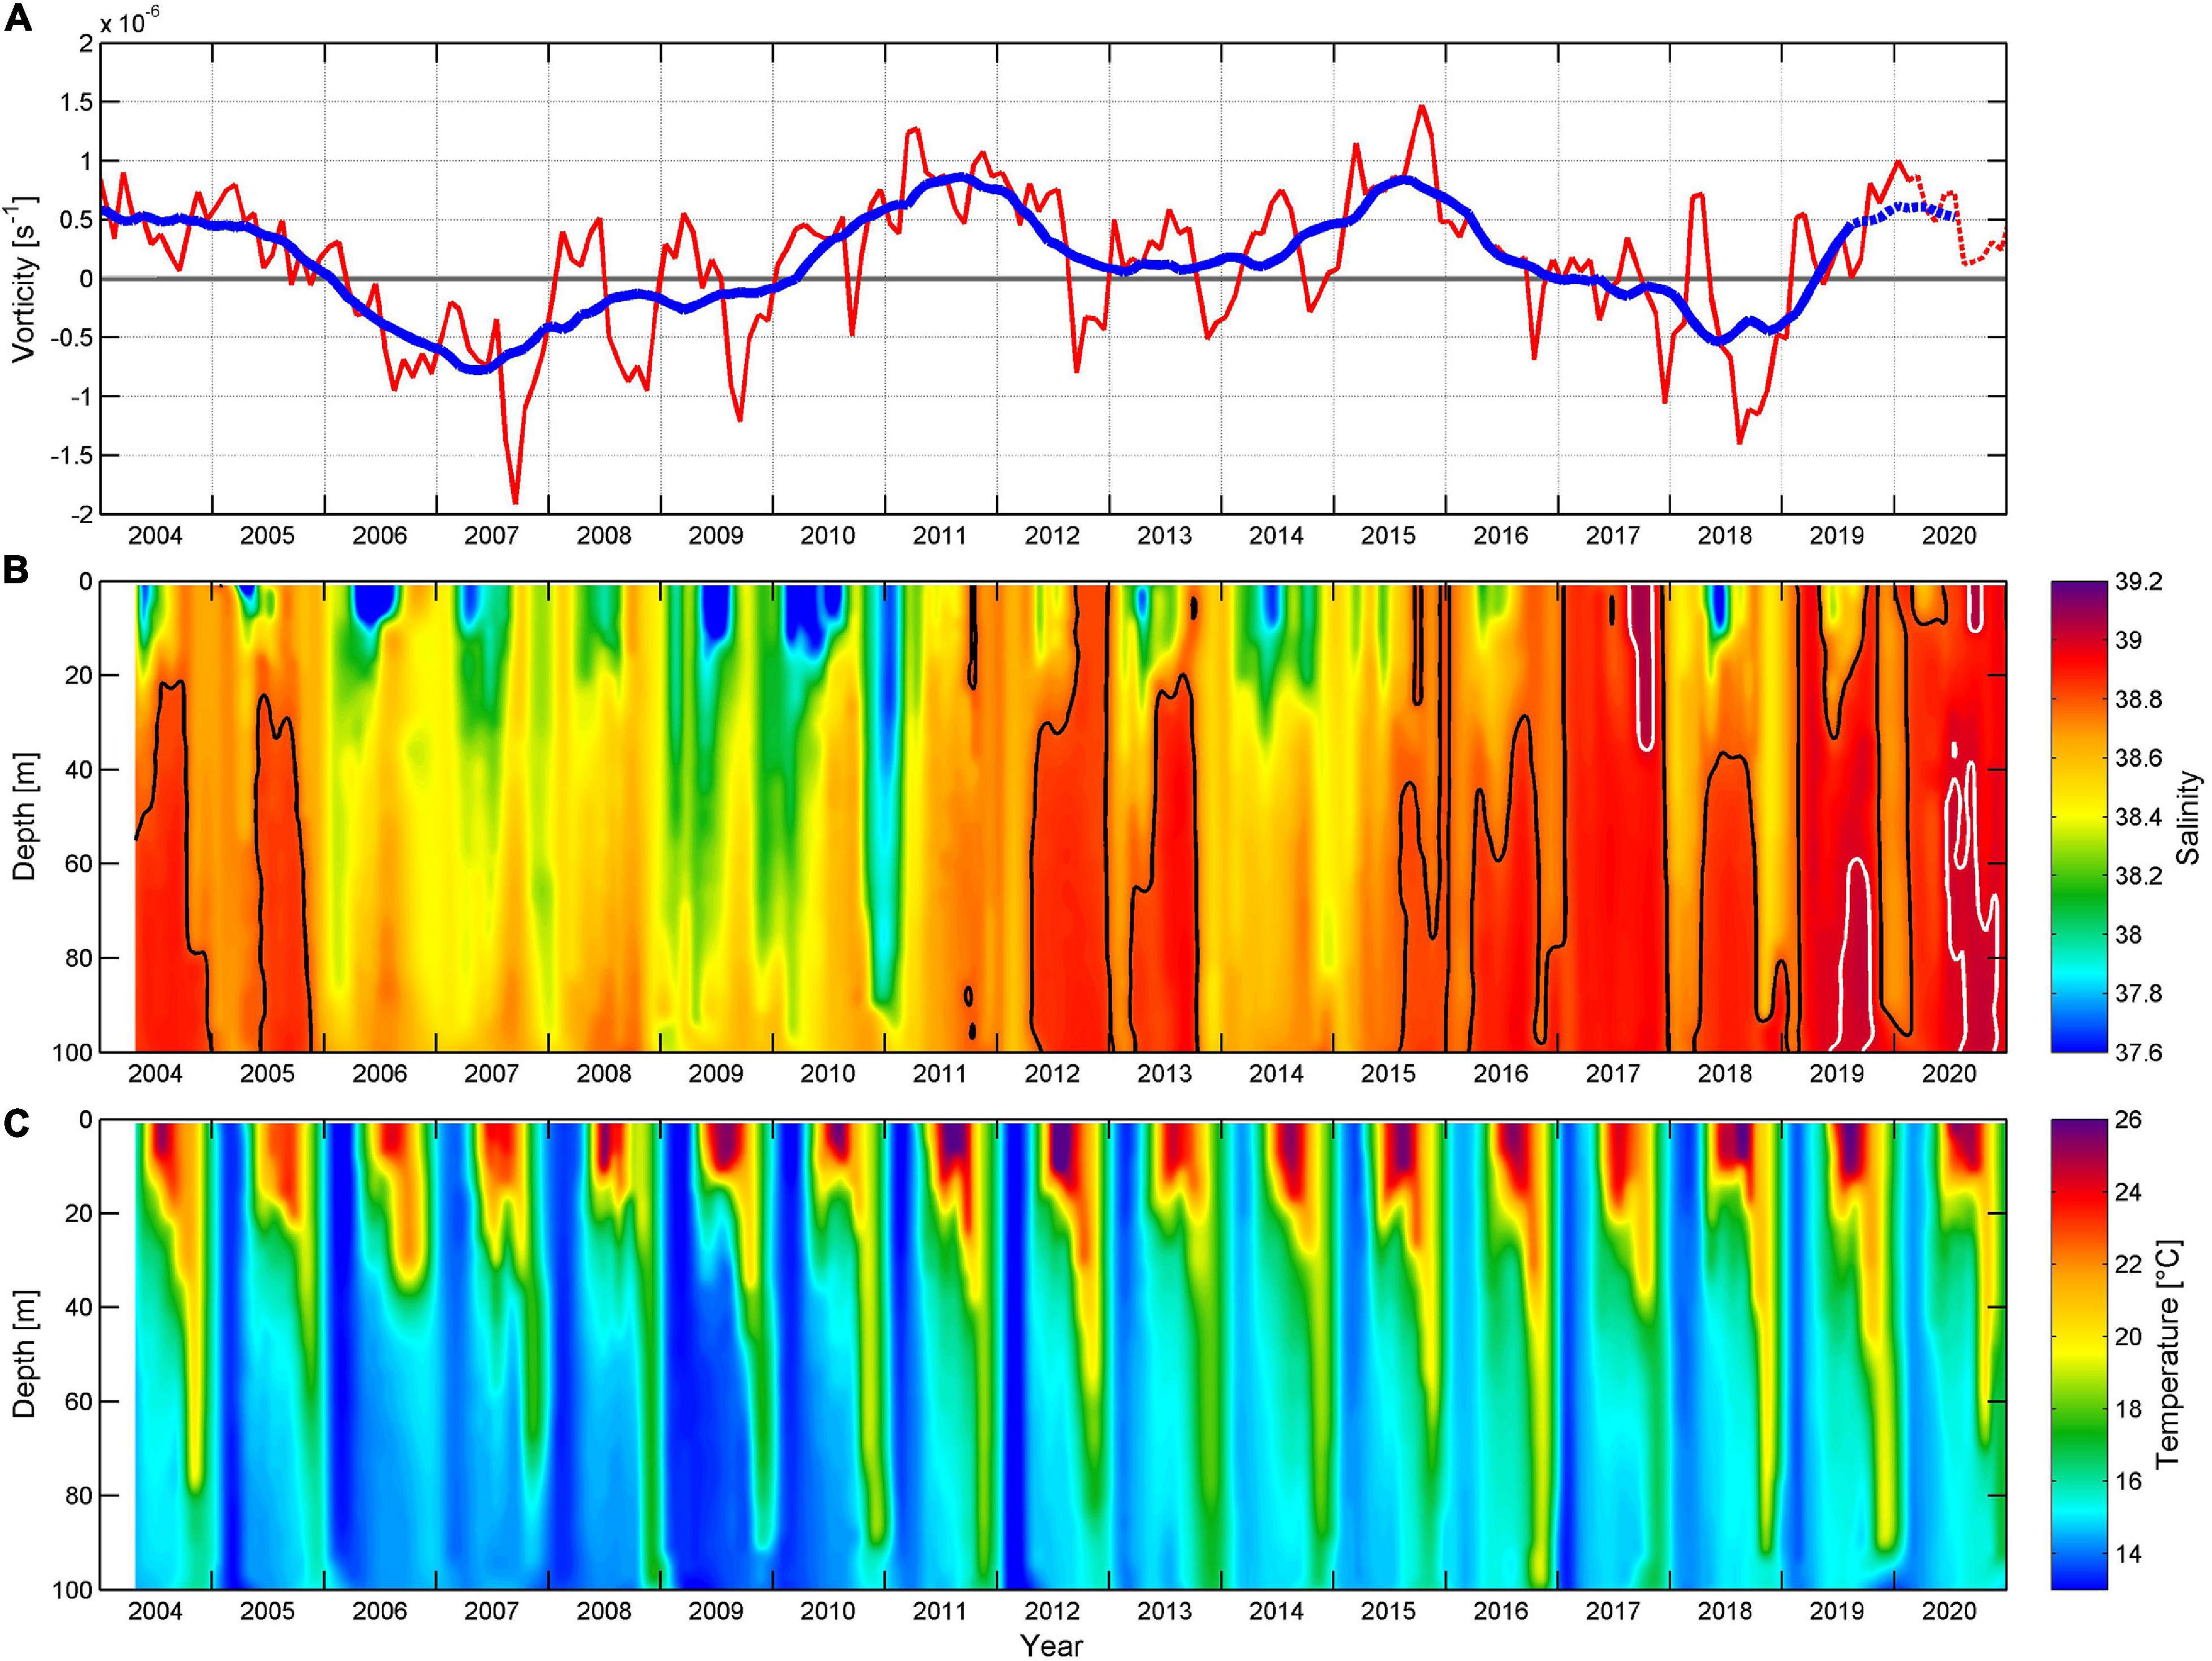
Figure 6. (A) Monthly time series of the spatially averaged current vorticity (red line) and low-pass filtered (13 months) current vorticity (thick blue line) computed in the Northern Ionian Sea (37–39°N; 17–19.5°E) between January 2004 and December 2020. Dashed parts in panel (A) denote vorticity data based on near real time AVISO+ product. (B) Hovmöller diagram of salinity measurements at station CJ009 between April 2004 and December 2020. Thick black line in panel (B) indicates 38.8 salinity contour (high salinity conditions), while thick white line denotes 39.0 contour (exceptionally high salinities). (C) Hovmöller diagram of temperature measurements at station CJ009 between April 2004 and December 2020.
As for temperature measurements at CJ009 (Figure 6C), seasonal signal is dominant, particularly close to the surface, indicating well developed seasonal thermocline. Moreover, intermediate and bottom temperatures followed salinity variations during BiOS regimes, as the Western Mediterranean intermediate waters that enter the Adriatic are characterized by lower temperature and salinity than waters originating in the Eastern Mediterranean (Vilibić et al., 2012).
The corresponding changes in salinity, as measured by Argo profiling floats between 2010 and 2017 in the Adriatic (the Adriatic Argo measurements are available since 2010), indicate the period of relatively lower salinity (below 38.6 in the upper 100 meters) observed in the Southern and Middle Adriatic in 2010 (Figure 7A). The salinity started to increase at the end of 2011 and during 2012 in both Middle (Argo float 1900848; Figure 7A) and Southern Adriatic (Argo float 6901040; Figure 7B), following the change to the cyclonic phase of the BiOS. Surface salinity maximum and a surface pool of saline waters were observed in the Strait of Otranto and the Northern Ionian Sea in summer and autumn 2012 (Figure 7B), and shortly during the summer in the Middle Adriatic (by the Argo float 1900848, Figure 7A). The vertical salinity profile (and vertical temperature profile, not shown) exhibited homogenization of the water column in the winter of 2013, apparently due to open-ocean convection (Mihanović et al., 2018). This mechanism and subsequent dense water outflow presumably triggered the Adriatic-Ionian thermohaline circulation (Orlić et al., 2006), inducing the subsurface LIW inflow in autumn 2013, at depths of 100–200 m. The LIW inflow gradually deepened in 2014 and 2015 to depths of about 200–400 m (Figures 7A–C), presumably driven by a weak open convection that pushed the LIW to even greater depths in 2015 and 2016 (400–700 m, Lučić et al., 2017; Hure et al., 2018; Kokkini et al., 2020). Simultaneously, a subsurface high salinity core started to be observed in the Adriatic at depths between 50 and 200 m, with a patch firstly visible in the second part of 2015 and even stronger inflow in 2016 (Figure 7C).
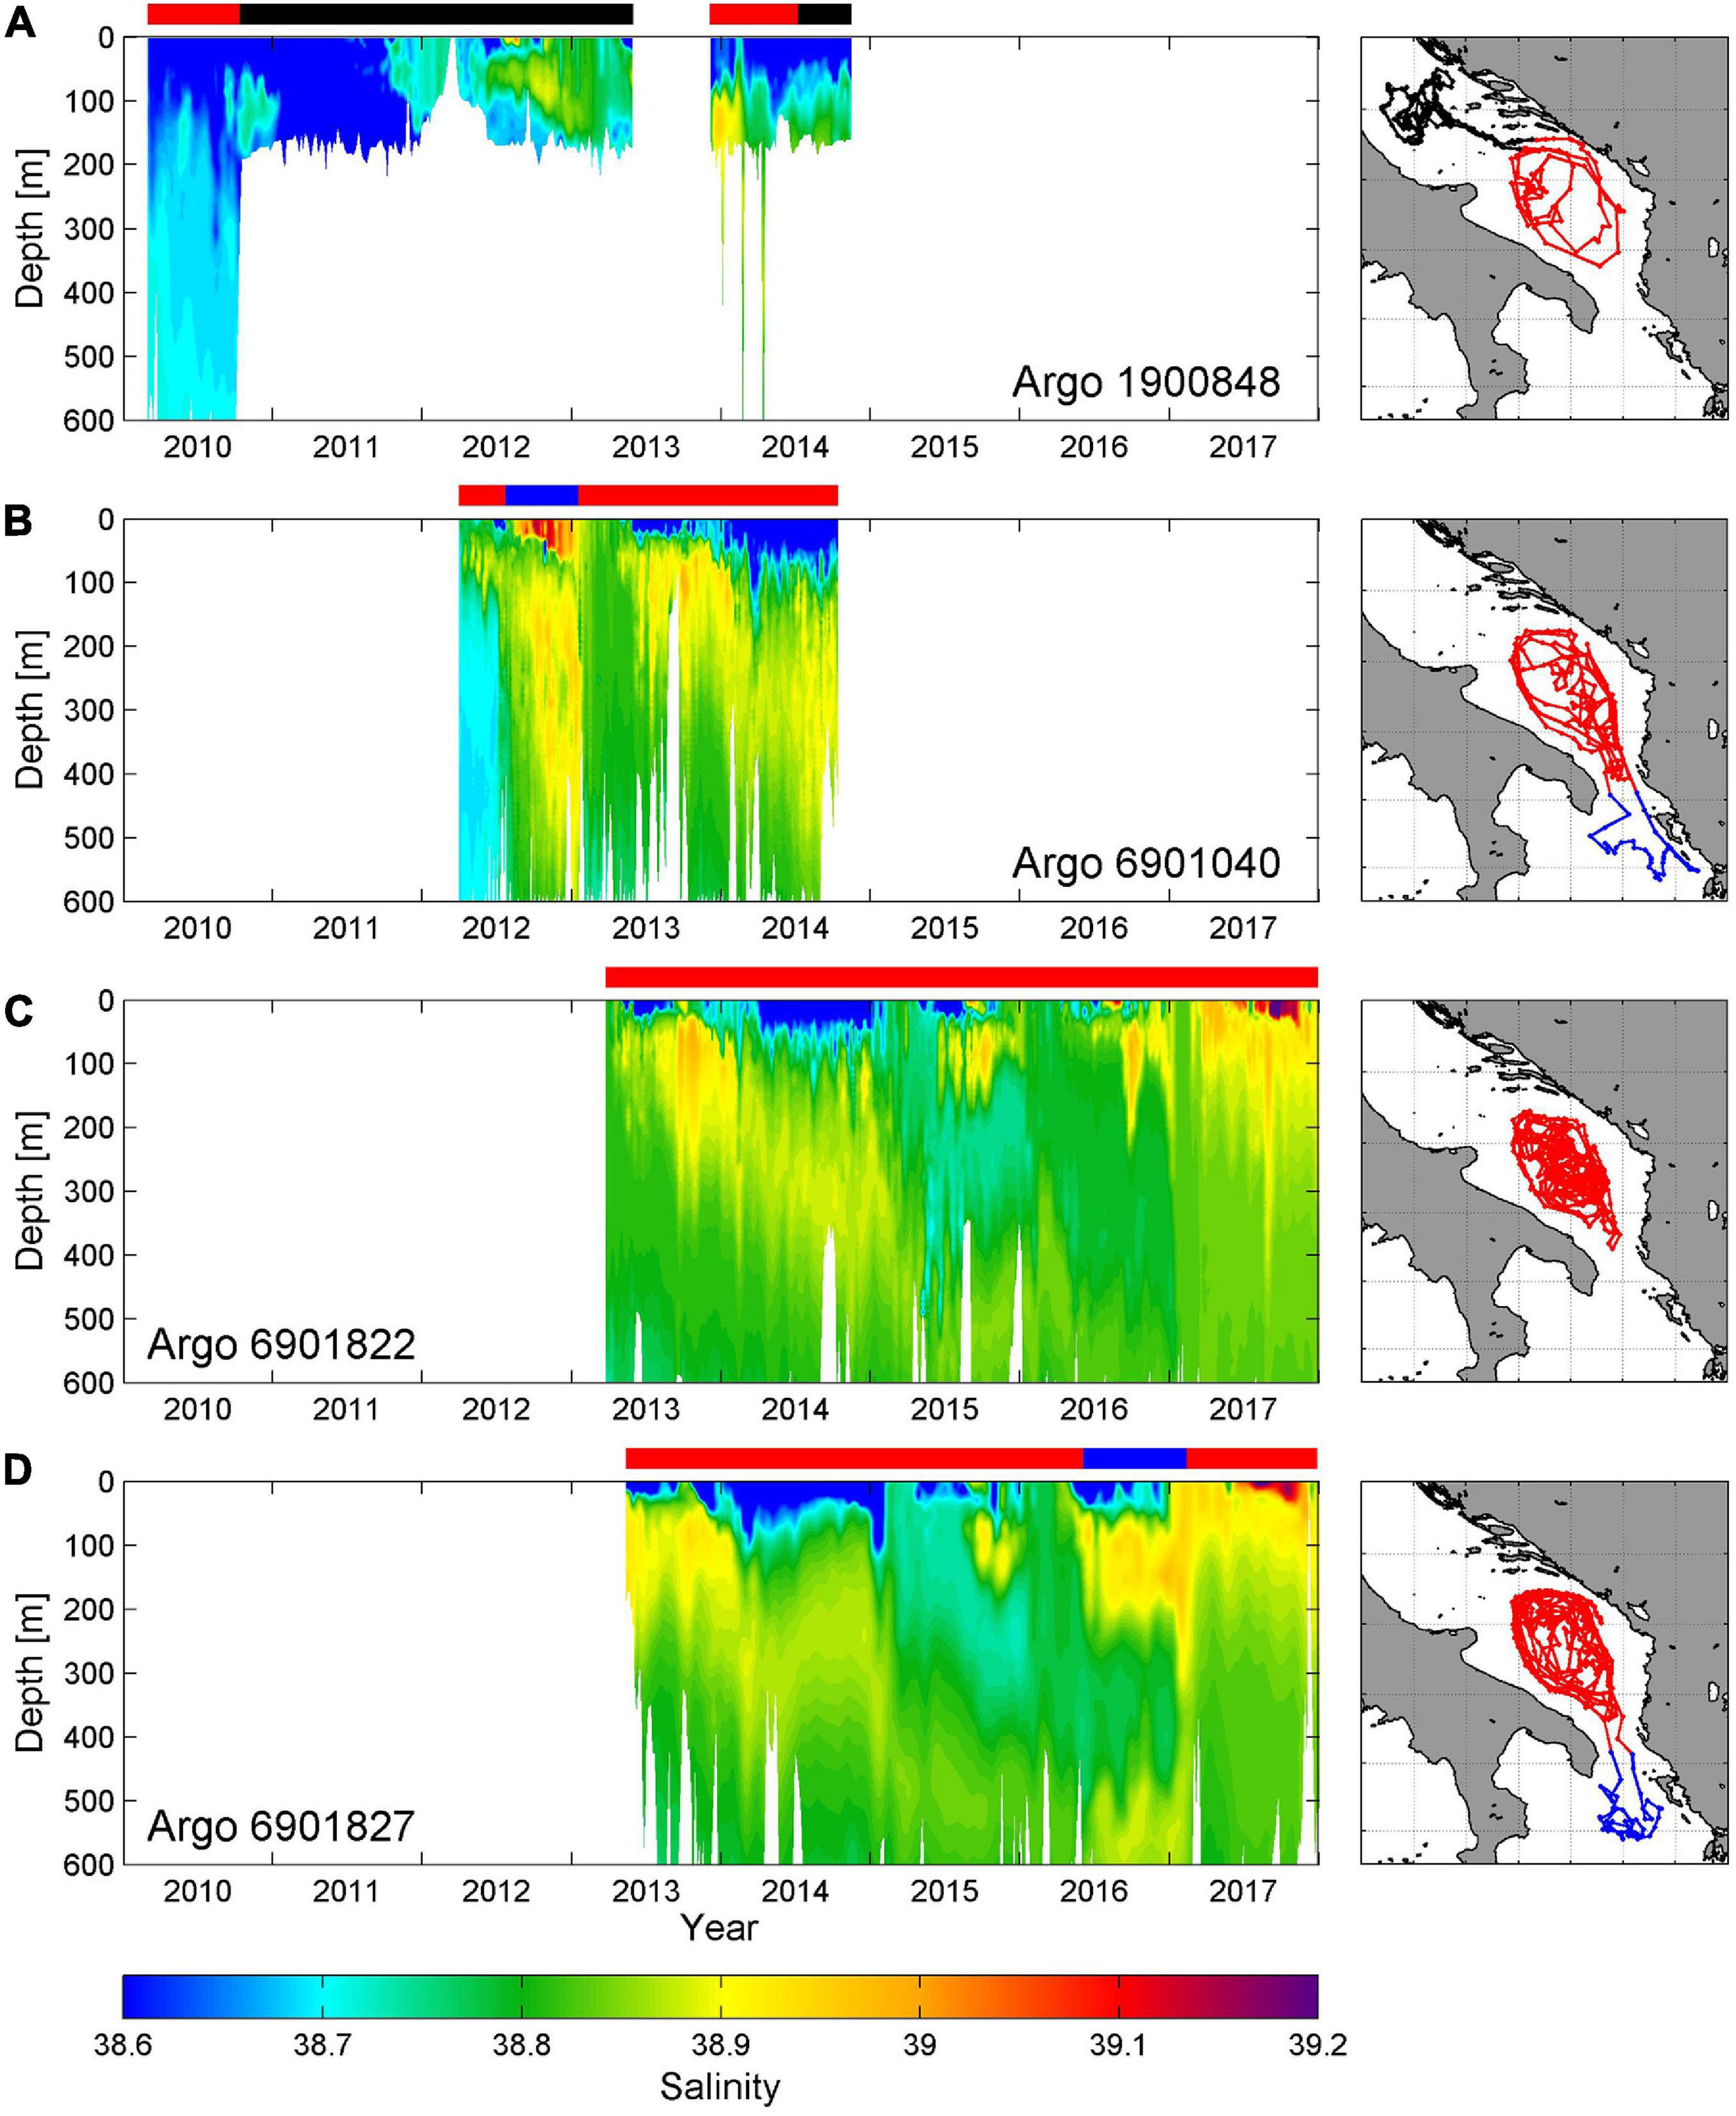
Figure 7. (A) Hovmöller diagram of salinity data for Argo float 1900848 in the first 600 m in the period 2010–2014 (left panel) with corresponding float trajectory (right panel). (B–D) As in panel (A) except for Argo floats 6901040 (2012–2014), 6901822 (2013–2017) and 6901827 (2013–2017), respectively. Argo trajectories are colored depending on the location of the float (black–Middle Adriatic, red–Southern Adriatic, blue–Northern Ionian). The same color notation is used in horizontal bars above left panels, indicating periods during which Argos were profiling in respective areas.
The double salinity maxima that preceded high salinity conditions in 2017 were also observed during the BIOTA project (Bio-tracing Adriatic Water Masses) campaigns, that encompassed the eastern section of the SAP (Babić et al., 2017; Lučić et al., 2017; Hure et al., 2018), and in glider missions in the central SAP in 2015 and 2016 (Figure 8). The BIOTA measurements in late February/early March 2015 were the first indication of the double maxima pattern in the Southern Adriatic (e.g., Babić et al., 2017), with near-surface maximum values present in a narrow band along the northeastern shelf break (therefore not detected so early by Argo floats, which usually remained further offshore). These near-surface salinities were slightly lower than contemporaneous deep-water salinity maximum values. The salinity distribution in November 2015 (Figure 8A), prior to the winter period in which open convection may take place in the SAP, reproduces the double salinity maxima pattern across the whole SAP, i.e., subsurface salinity maximum (50–100 m) occasionally exceeding 38.9 and the deep salinity maximum at 400 to 600 m (with values up to 38.85). Interestingly, the subsurface salinity maximum value in the second part of 2015 dominated over the deep salinity maximum, although restricted to a narrower layer. The subsurface salinity maximum indicated a subsurface advection of saline waters from the Levantine basin, while the deep salinity maximum did not show large changes in the salt content. After a weak winter convection period in early 2016, the deep salinity maximum was still present, but it deepened to 550 to 700 m in the open Adriatic (Figure 8B). The near-surface salinity maximum moved toward the surface, with high salinity waters encompassing the first 100 m of the water column in the open sea. The maximum was deeper at the perimeter of the SAP (points A and D in Figure 8B). Very similar salinity distribution remained till the end of 2016 (Figure 8C), with a large salt content in the layer that is normally mixed by the open sea convection during severe wintertime forcing (the mixing can extend to 900 m, Gačić et al., 2002; Dunić et al., 2019).
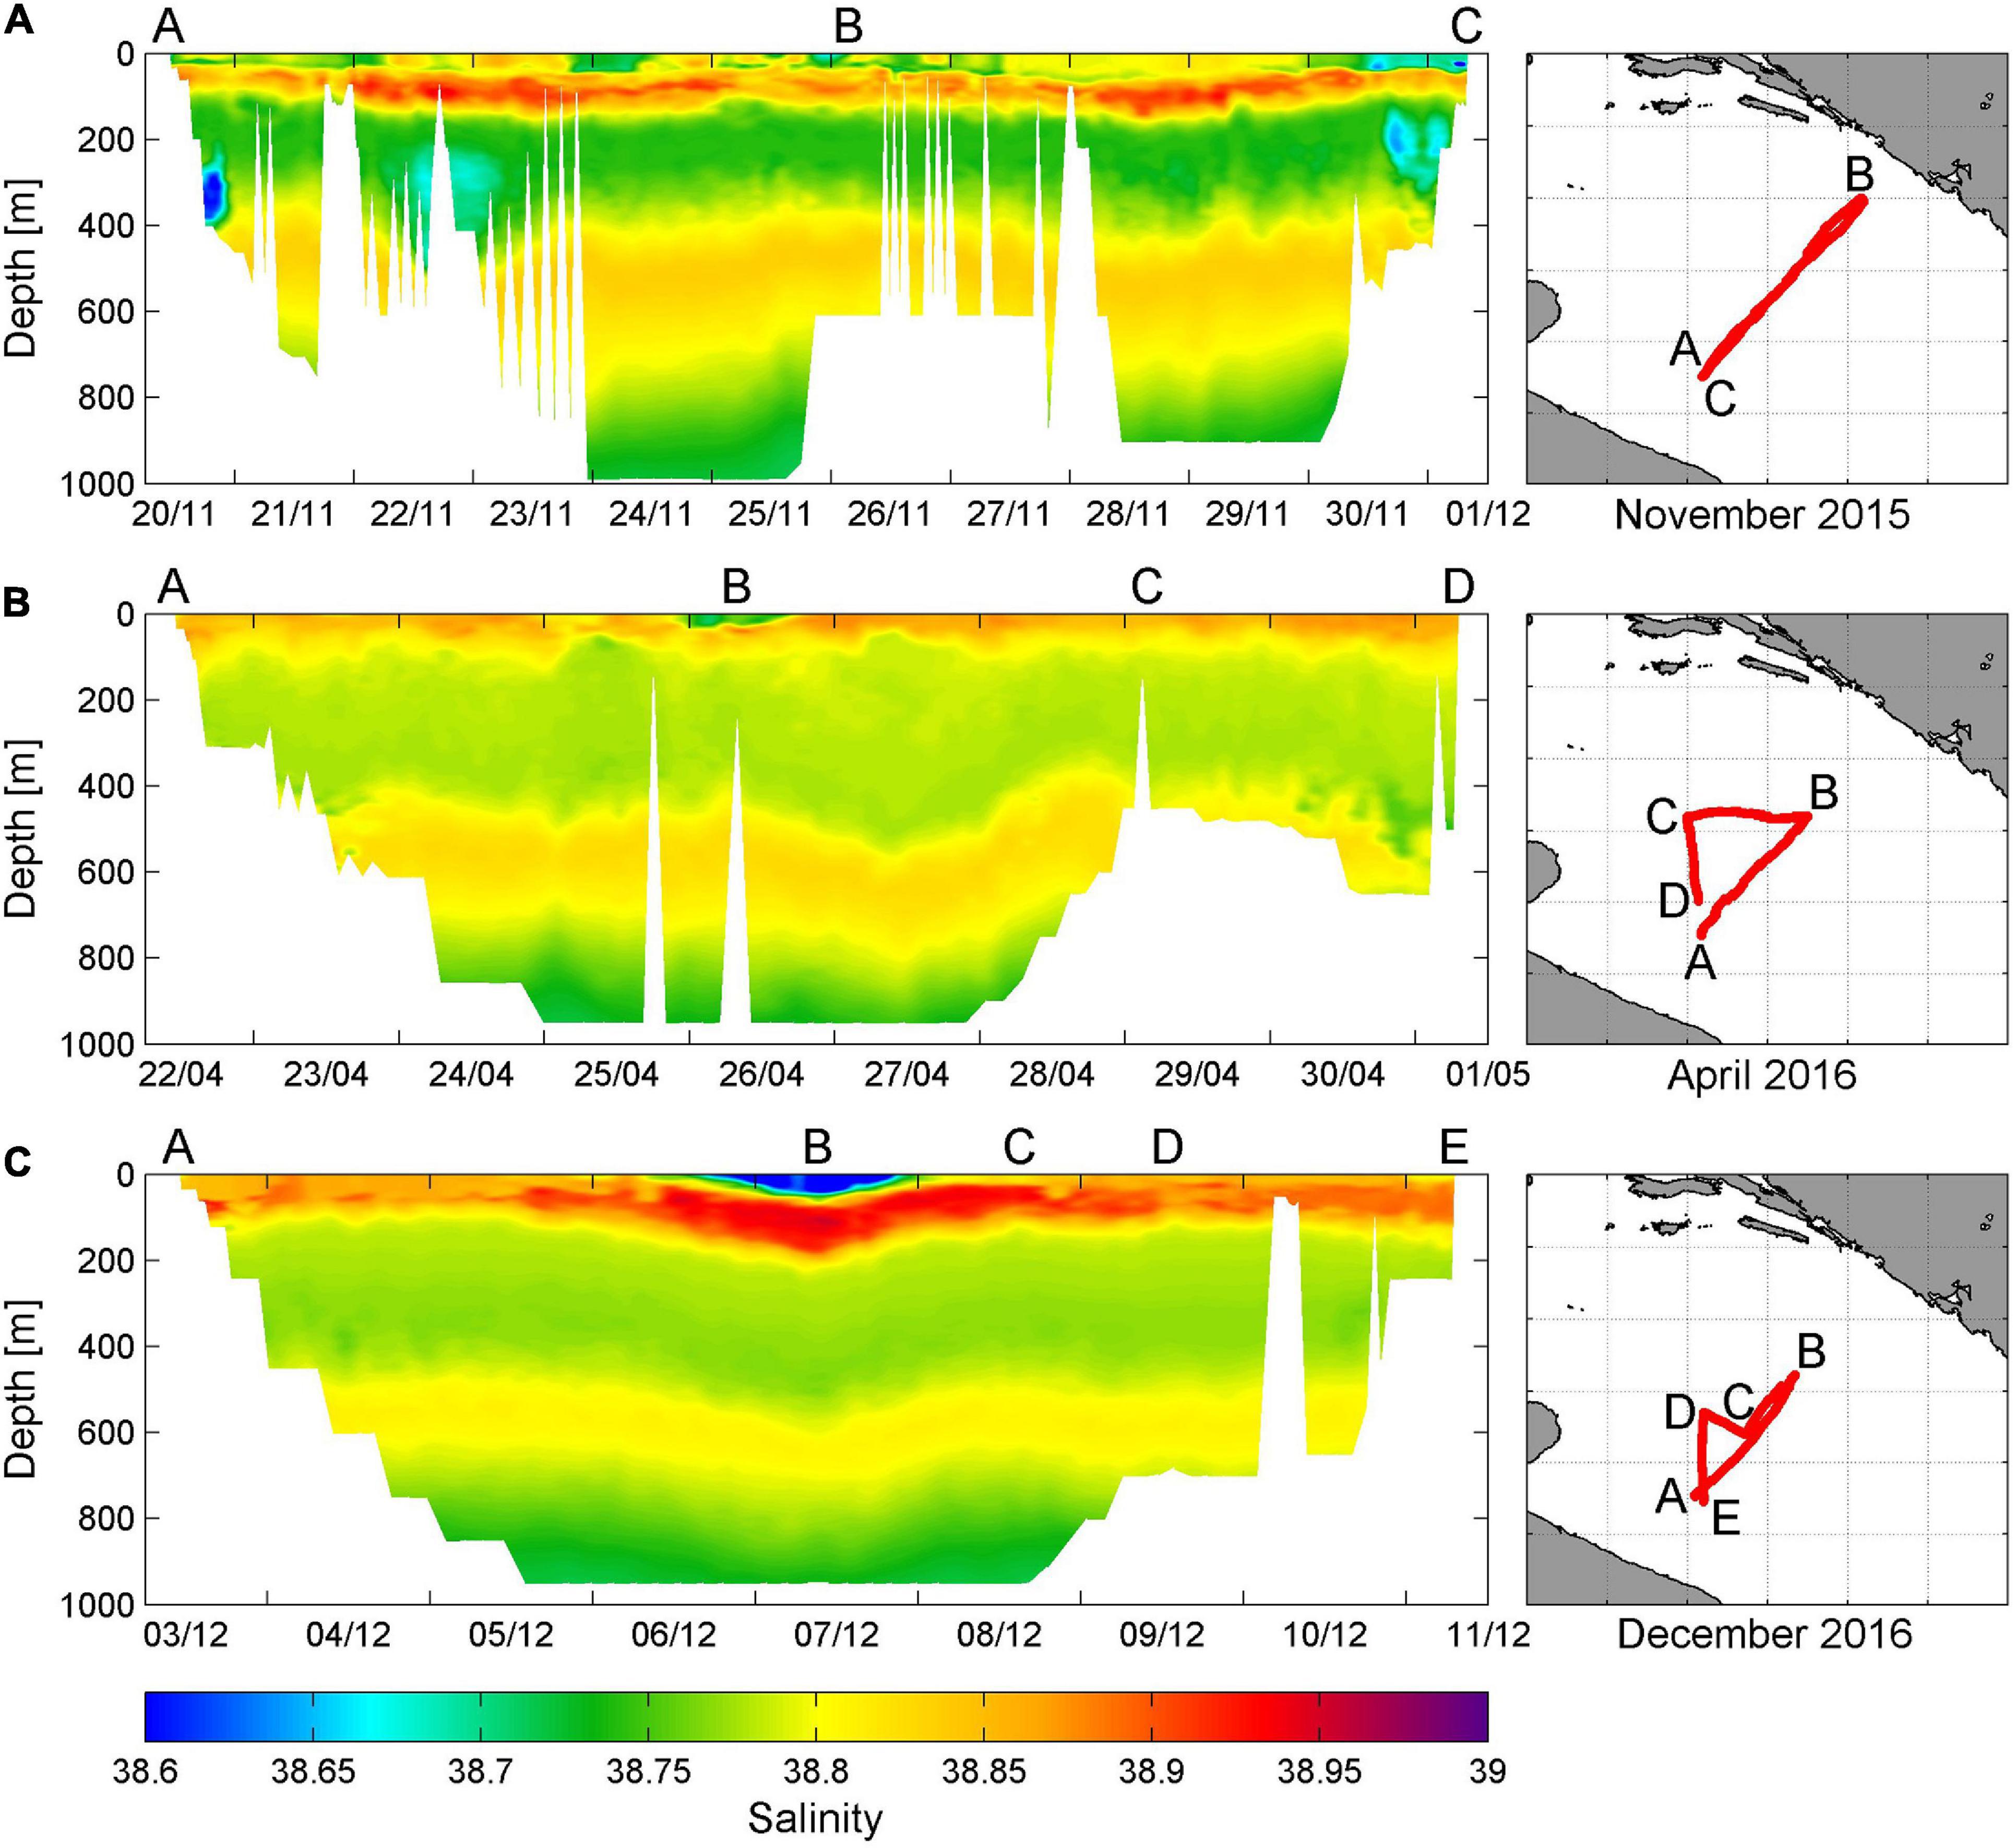
Figure 8. (A) Glider salinity transect in the in the Southern Adriatic between 20 November and 1 December 2015 (left panel) and the corresponding trajectory of the glider (right panel). (B) As in panel (A) except for glider transect from 22 April to 1 May 2016. (C) As in panel (A) except for glider transect from 3 to 11 December 2016. Please note that the salinity scale for these glider transects is different than in Figure 4.
In summary, the BiOS cyclonic regime in the Northern Ionian was increasing the salt content in the Adriatic for several years prior to 2017 by advecting more saline waters, presumably originating in the Levantine basin or/and the Aegean Sea, through the Strait of Otranto. This was particularly true for 2015–2016, following the cyclonic regime maximum in 2015 (Figure 6A), thus preconditioning the 2017 high salinity event. Moderate open ocean convection events between 2014 and 2016 deepened the salinity maximum to greater depths (below 500 m). At the same time, a new inflow of high salinity waters to the Adriatic took place near the surface in 2015 and 2016, i.e., at much shallower depths than was previously documented during Adriatic salt ingressions (e.g., Gačić et al., 1996; Vilibić and Orlić, 2001).
A very strong open ocean convection episode occurred in January 2017, characterized by severe bora wind and extremely cold weather along the Adriatic Sea (DHMZ, 2018). The severity of the event can be observed from the surface heat anomalies averaged from ERA-Interim reanalysis over the open Southern Adriatic (Figure 9B), which were the second most negative (after December 2001) during the entire satellite altimetry era (1993–2017). Heat losses in the Southern Adriatic were even stronger than the losses during the severe winter of 2012, which peaked in the Northern Adriatic but was of moderate intensity in the Southern Adriatic, causing a vertical mixing in the SAP that reached only 500 m depth (Mihanović et al., 2013). In 2017 the open ocean convection in the SAP was indeed much stronger and the water column was mixed to 700–800 m (Figure 3A; see also Kokkini et al., 2020). The mixing effectively destroyed the double salinity maxima vertical pattern that was present in 2015–2016 period, and high salinities were measured throughout the water column (above 38.8 between the surface and 700 m). The convection was preceded by high and positive E-P anomalies (Figure 9C) that additionally increased the salinity in the surface layer, while freshwater inflow by rivers was lower than average during most of 2016 (Figure 9D). This event enhanced the Adriatic-Ionian thermohaline circulation during late winter and spring 2017, but the inflow of warmer and highly saline waters from the Northern Ionian remained close to the surface, in the upper 100 m (see also Figures 3A,B, 5 and Section “Thermohaline properties in 2017”).
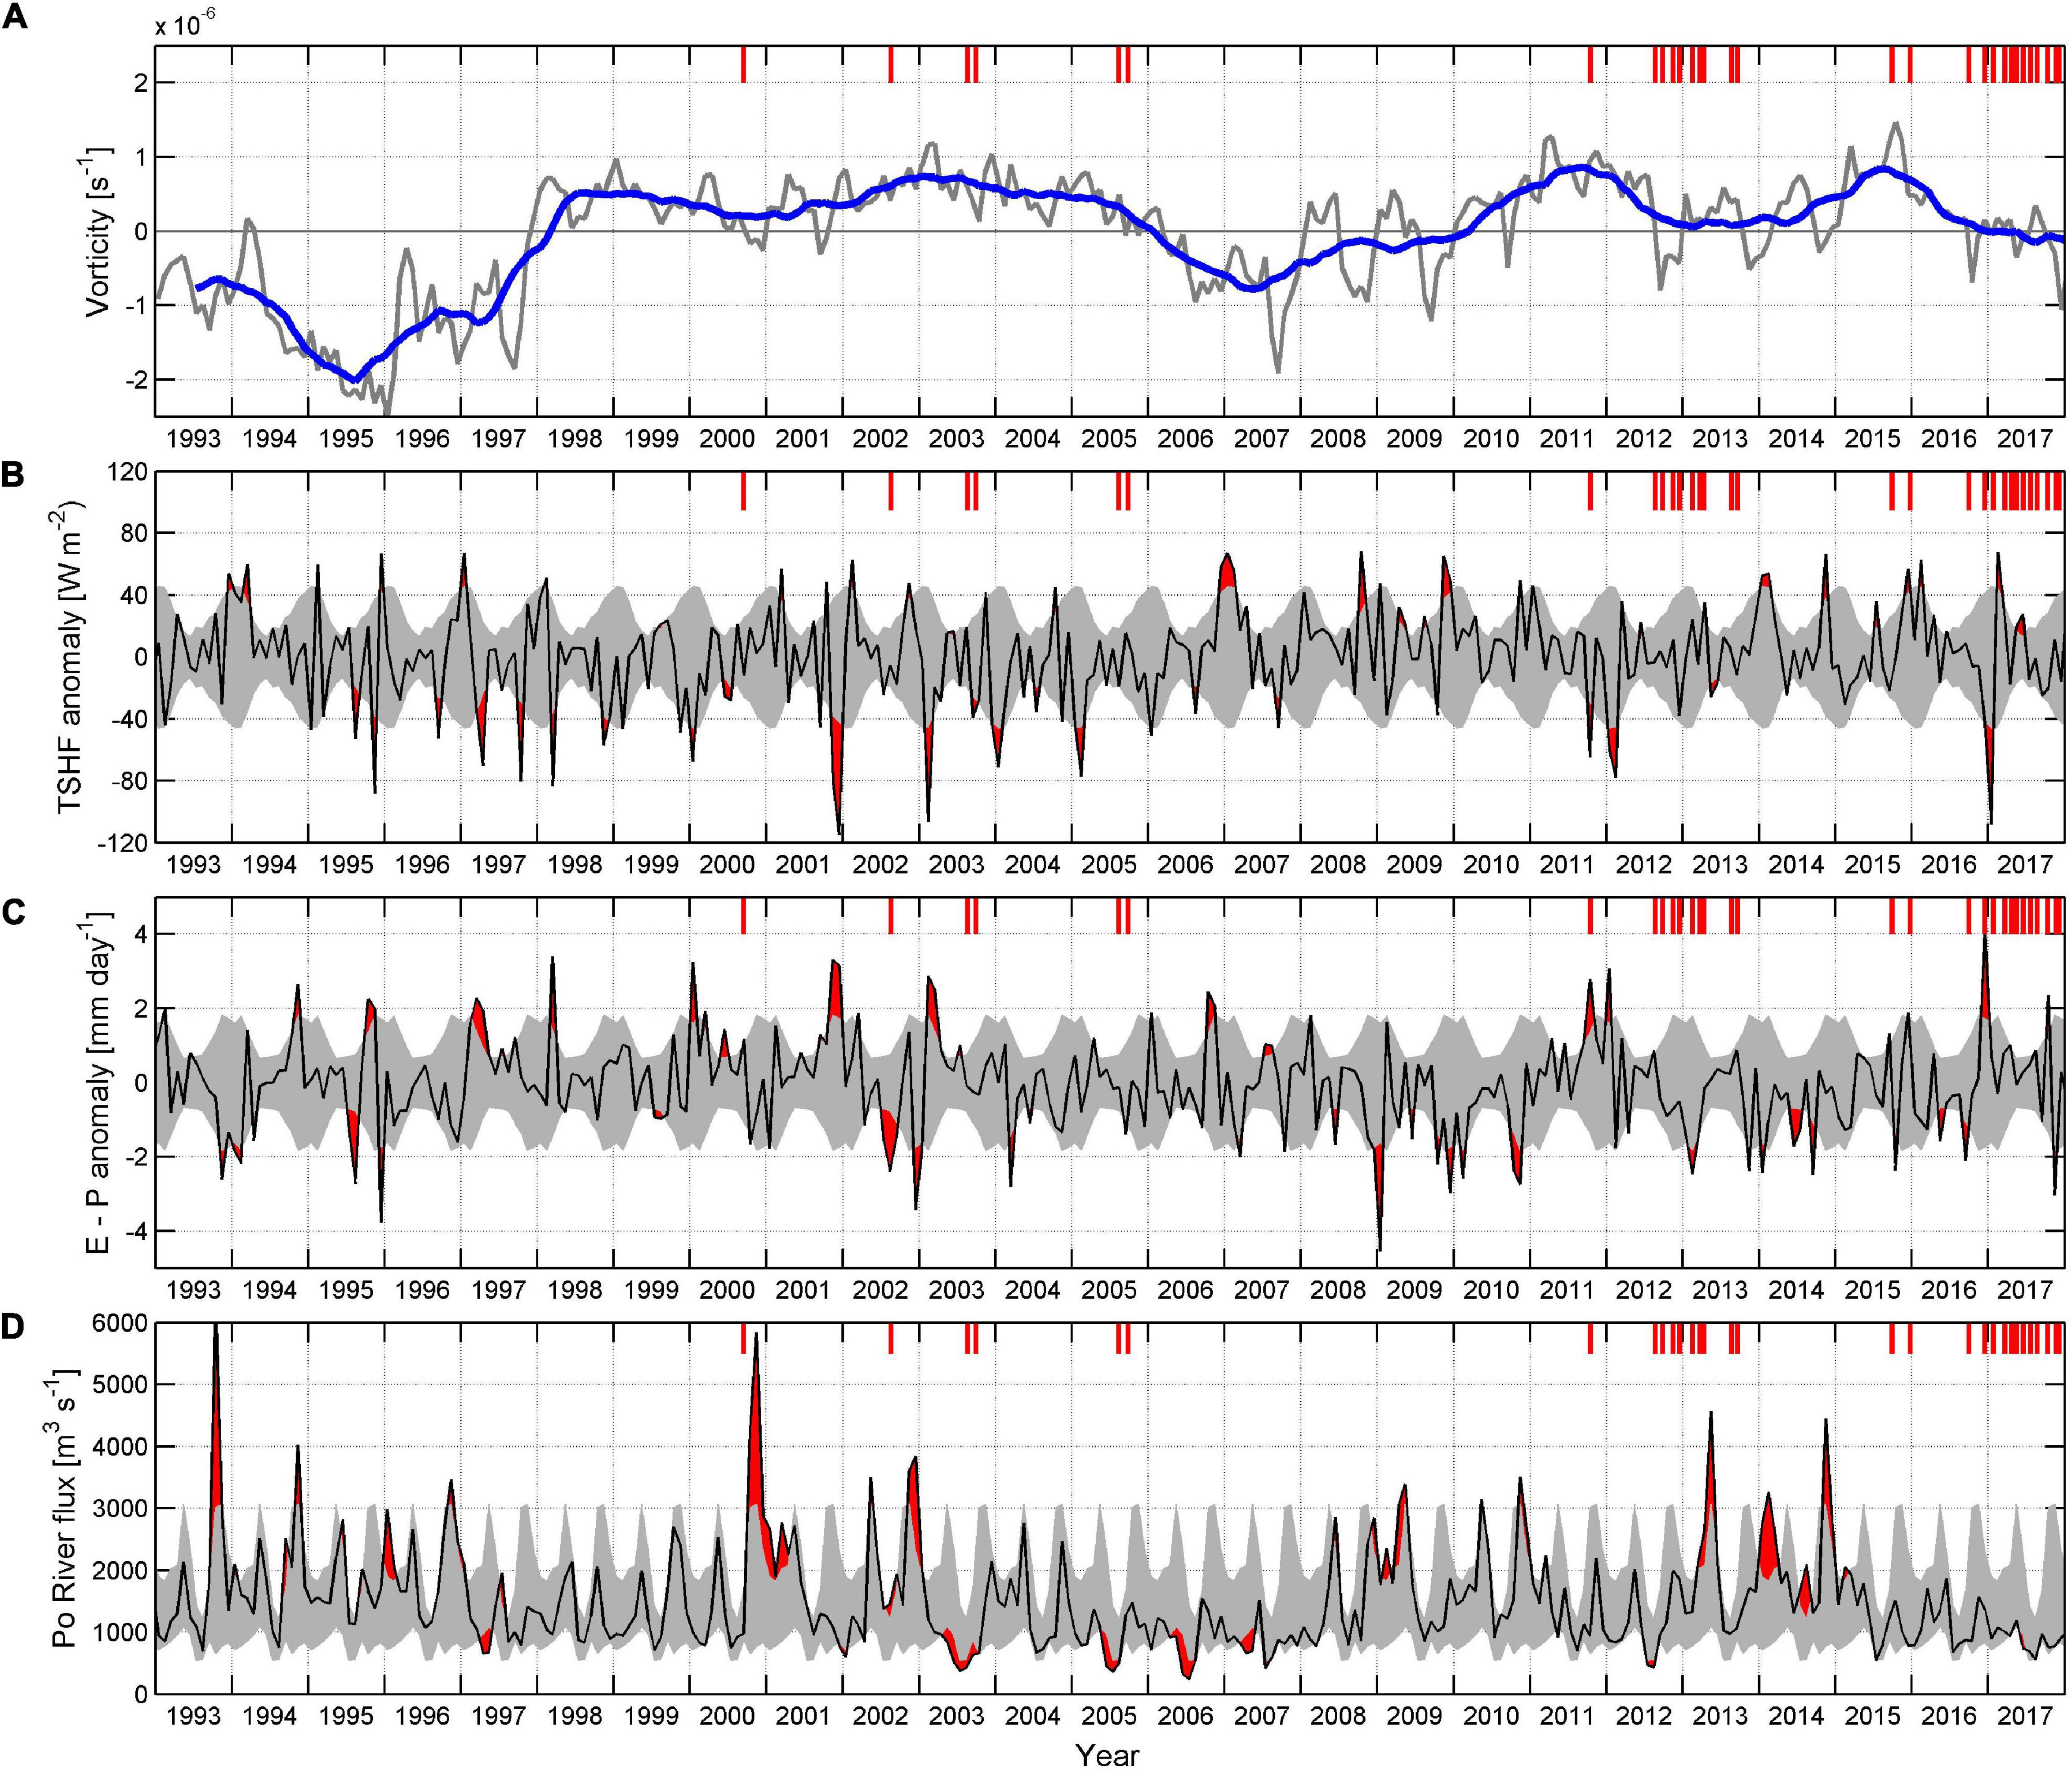
Figure 9. (A) Monthly time series of the spatially averaged current vorticity (gray line) and low-pass filtered (13 months) current vorticity (blue line) computed in the Northern Ionian Sea (37–39°N; 17–19.5°E) between January 1993 and December 2017. (B) Monthly ERA-Interim total surface heat flux anomalies and (C) evaporation minus precipitation (E-P) anomalies averaged over the Southern Adriatic, together with (D) monthly Po River discharge between 1993 and 2017. Standard deviations (shaded in gray) were estimated for the period 1979–2017. Red shadings indicate values above or below one standard deviation. Red ticks in the upper part of each panel denote occurrence of surface or near-surface (0–20 m) salinity values higher than 38.8 observed on at least one station along the Palagruža Sill transect.
Very low river discharges were also present during the whole 2017 (Figure 9D), while heat fluxes were higher than average in late spring and summer (Figure 9B), having the capacity to substantially heat the surface layer during the seasonal maximum in thermocline intensity in the summer (Buljan and Zore-Armanda, 1976). Precisely, heat fluxes in May and June 2017 were both above one standard deviation estimated over the period 1979–2017 and the largest in the period 1993–2017 for that part of the year (Figure 9B).
To summarize, one of the most intense cooling during the winter and heating in the following summer were present over most of the Southern Adriatic in 2017. They were related to an inflow of highly saline waters from the Northern Ionian in the surface layer during late winter and early spring 2017, together with a very low precipitation rate and extremely low river discharges between mid-2015 and the end of 2017.
It is well known that the DWF and the respective outflow of the NAdDW and AdDW within and from the Adriatic strengthen the thermohaline circulation and cause seasonal oscillations of the inflow from the Ionian Sea, with maximum salinity values in summer and autumn in the Adriatic (Buljan and Zore-Armanda, 1976; Vilibić and Orlić, 2001; Orlić et al., 2006; see also Figure 6B). The strength of this seasonal cycle is evidenced by seasonal variations of monthly surface geostrophic currents, as estimated from the AVISO+ dataset (Figure 10A). The seasonal cycle was extracted from the data by least-squares fitting of the annual (12 months) and semi-annual (6 months) cosine functions separately for each grid point, following the general harmonic regression model (Wilks, 2020). The percentage of the seasonal circulation explaining total variance may surpass 40% in the Strait of Otranto (Figure 10A), reflecting seasonal variability in the exchange of water masses between the Adriatic and Ionian Seas. The seasonal oscillations in northward flow dominate there and may range from 10 to 20 cm/s (Figure 10B), reaching peak values during autumn and winter when they rapidly advect waters from the Northern Ionian to the Southern Adriatic. Interestingly, seasonal signal in surface geostrophic currents is also quite high in the area west of Cephalonia Island (Greece), and seasonal currents there are mostly in phase with currents in the Strait of Otranto (Figures 10B,C). The percentage of total geostrophic velocity variance explained by the seasonal signal in northward surface geostrophic currents may reach 30% in that area. Seasonal oscillations in surface currents have a range of about 10–20 cm/s (the same range as in the Strait of Otranto), peaking in autumn and winter.
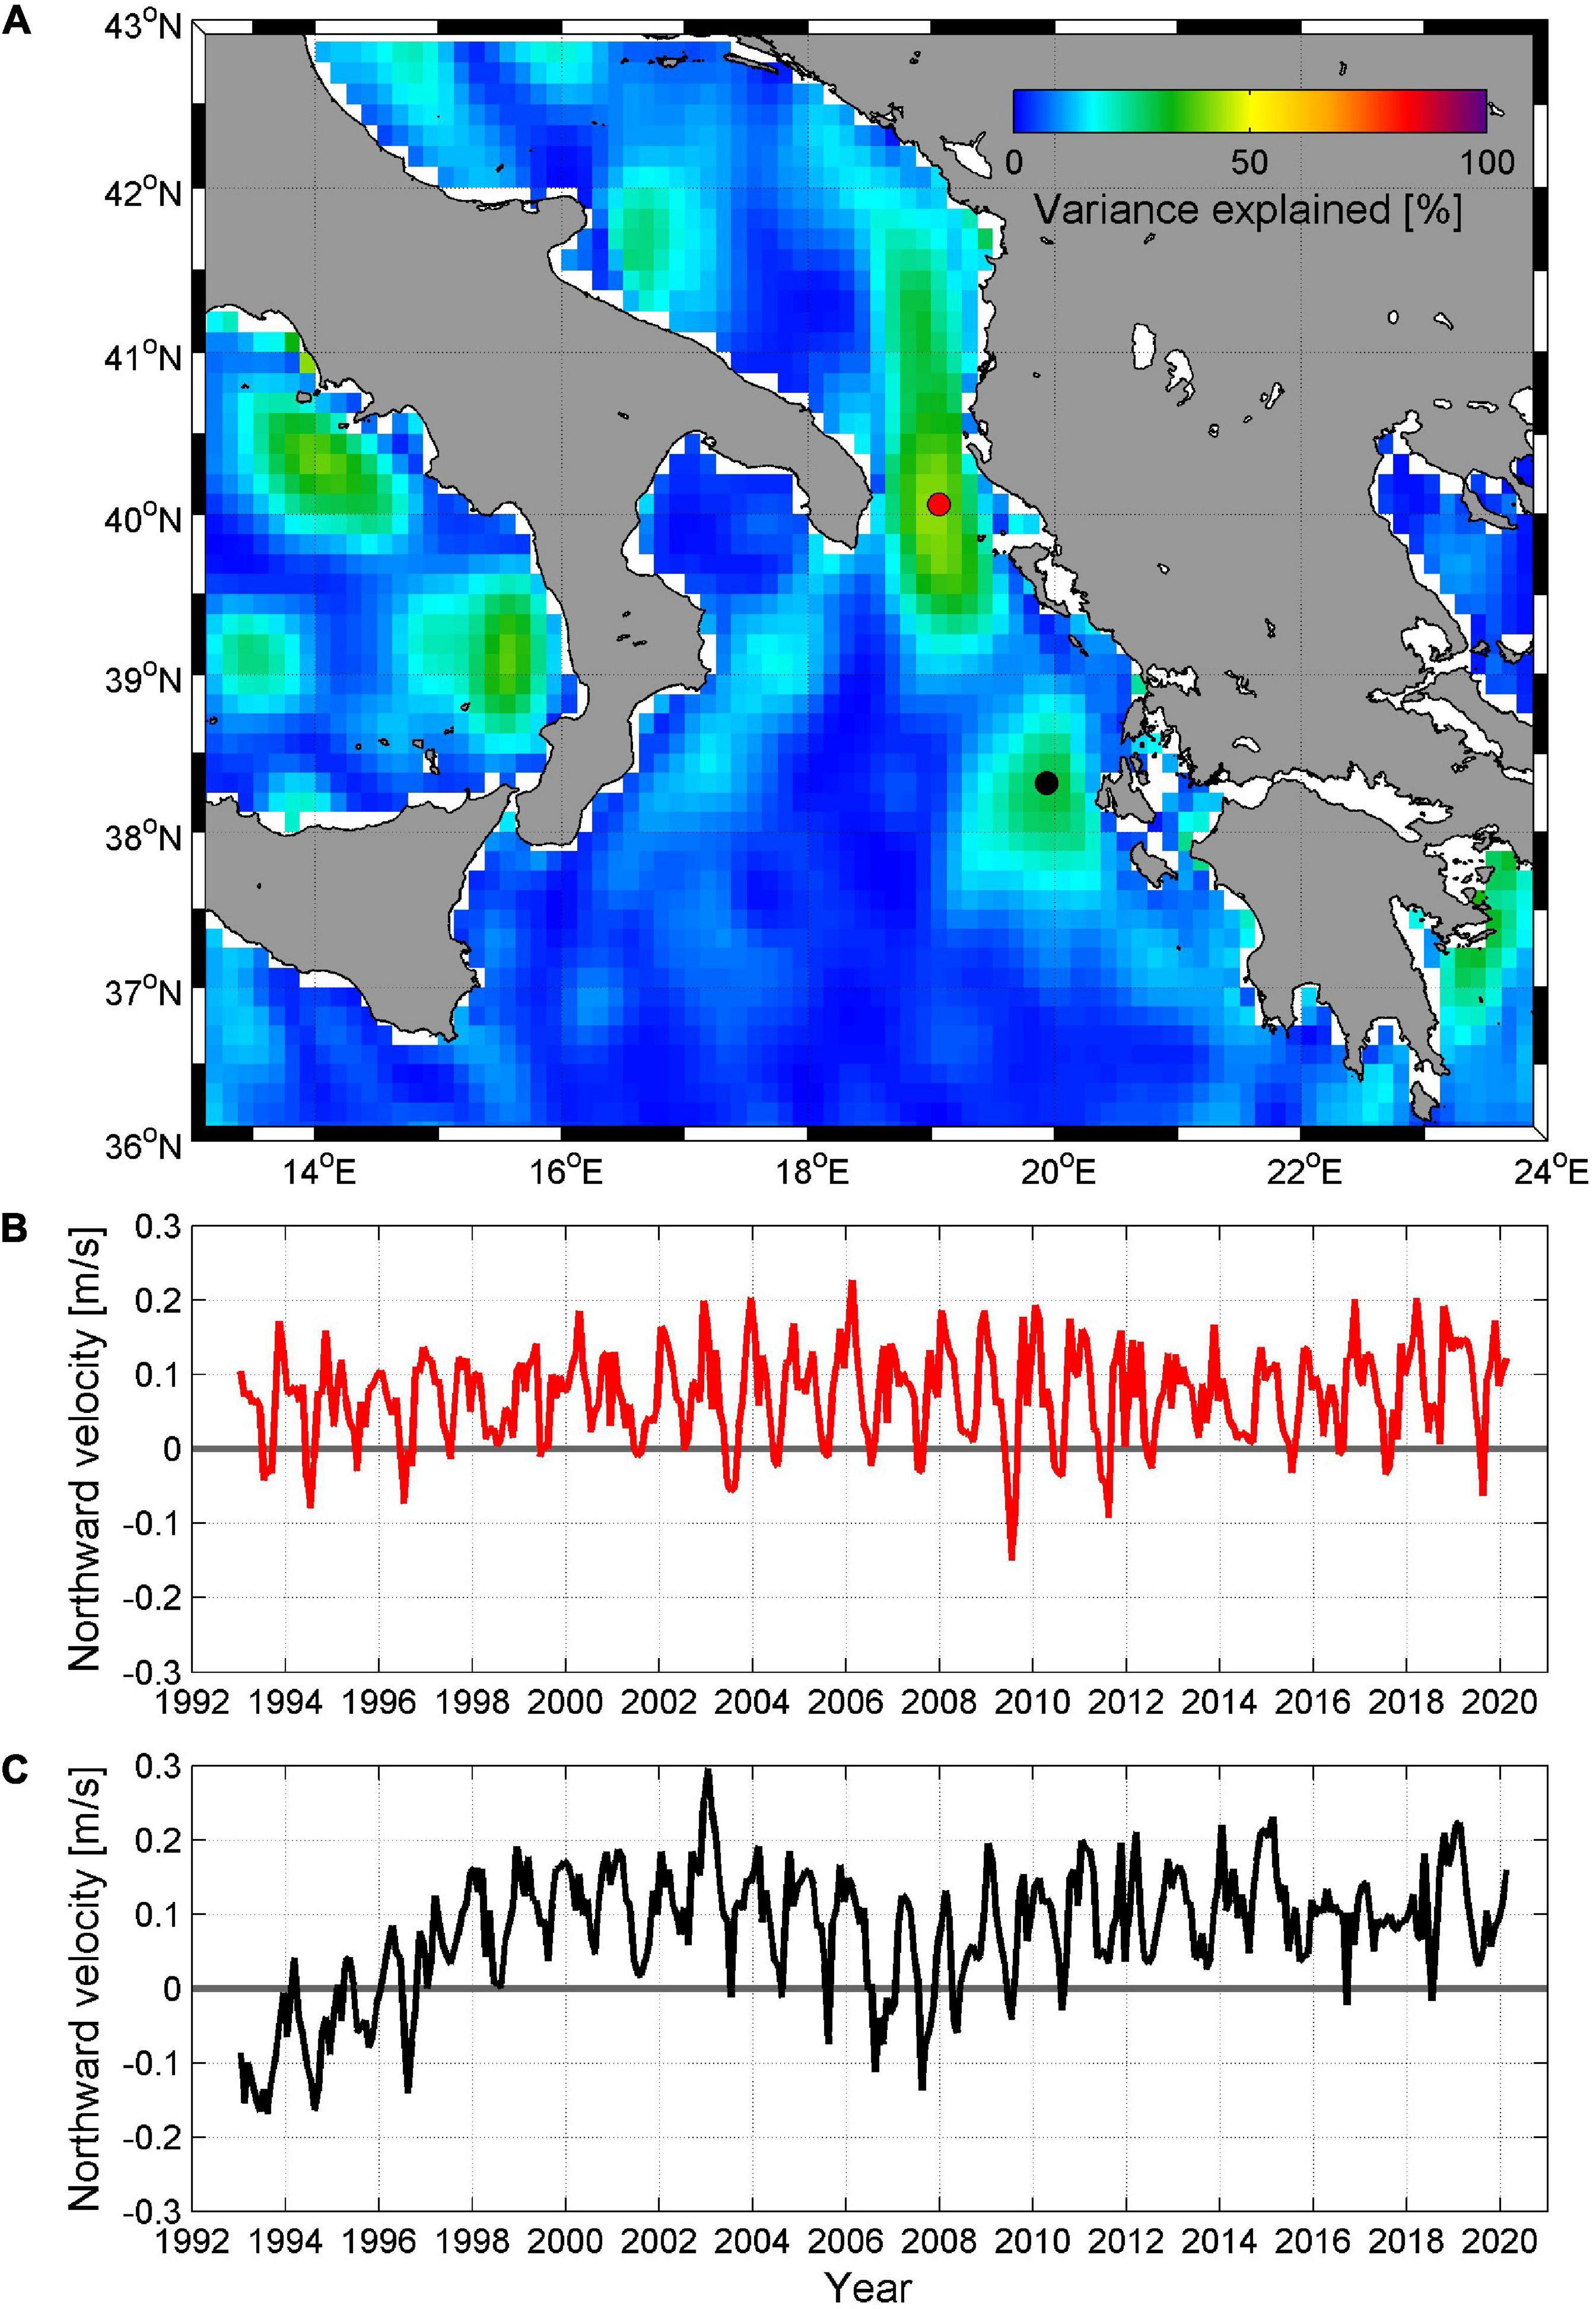
Figure 10. (A) Percentage of total geostrophic velocity variance explained by the seasonal signal, with two grid points denoted by red (Otranto Strait) and black (west of Cephalonia Island, Greece). (B) AVISO+ northward monthly geostrophic currents at the Otranto Strait grid point. (C) AVISO+ northward monthly geostrophic currents at the grid point west of Cephalonia.
These seasonal oscillations west of Cephalonia Island (i.e., in the eastern part of the Northern Ionian) are embedded on the decadal signal that strongly resembles the BiOS-driven changes in vorticity in the central part of the Northern Ionian Sea. The positive vorticity implies cyclonic BiOS regime (Figure 9A) and stronger northward currents in the eastern part of the Northern Ionian (Figure 10C) and the negative vorticity implies anticyclonic BiOS regime, and southward currents in the eastern part of the Northern Ionian (Figure 10C). However, the characteristics of the NIG reversals are also affected by the interaction between basin-wide and mesoscale circulation (Menna et al., 2019). Namely, the first two anticyclonic phases of the BiOS regime observed from satellite altimetry data (1993–1996 and 2006–2010) had some differences in basin-wide circulation, depending on the mesoscale characteristics of the Messina Rise Vortex and the Pelops Gyre. The effects of these differences were visible in changes of the northward flow west of Cephalonia, with much stronger southward currents present during the 1993–1996 anticyclonic mode, which was more negative (in terms of vorticity) than during the 2006–2010 anticyclonic mode (Figure 10C). During the 2005–2010 anticyclonic phase, the Messina Vortex Rise was zonally elongated (Menna et al., 2019), and the size and intensity of the NIG was reduced, therefore having lower impact on the currents in the eastern part of the Northern Ionian.
The matching between NIG reversals (Figure 6A) and northward flow along the eastern Ionian Sea (Figure 10C) was not preserved in the 2017–2018 period, when a relatively short reversal of the NIG (from cyclonic to anticyclonic) occurred in the Northern Ionian (Figure 6A). However, the northward currents west of Cephalonia Island remained steady (Figure 10C), implying that waters of higher salinities were still advected to the northernmost part of the Ionian Sea, and from there further to the Adriatic Sea (Figures 3, 5). It appears that during this period variations of the Adriatic thermohaline properties, in particular of salinity, were more related to the persistence of the northward coastal flow along the western coast of Greece than to the BiOS regime occurring in the central Northern Ionian Sea. The latter may not always affect the eastern coastal regions of the Northern Ionian (Menna et al., 2019), where the flow of warm and highly saline waters originating from the Levantine region can continue to bring high salinity waters to the Adriatic even during transient or anticyclonic BiOS phase.
Here, we present the analysis of surface and near-surface salinity maxima observed over the Palagruža Sill transect between 1961 and 2016. The analysis was based on long-term measurements at the historical Stončica station (CJ009, Figure 1), which is the most regularly surveyed station at the Palaguža Sill transect. We looked at the transect observations characterized by surface or near-surface (0–20 m) salinities which were at least one standard deviation above the 1961–2016 mean summer values (Beg Paklar et al., 2020). This threshold was very close to 38.8. For an assessment of the processes eventually contributing to the maxima, we analyzed heat fluxes and E-P over the Southern Adriatic—using the ERA Interim dataset (available from 1979), discharges of the major Adriatic river, Po River (available from 1961, Raicich, 1996; Vilibić et al., 2016), and the decadal oscillations driven by the BiOS regime (based on satellite altimetry data available since 1993). In general, from 1961 to 2016 several periods with high salinities along the Palagruža Sill transect were observed: 1968–1971, 1975–1976, 1978–1982, 1987–1990, and 1999–2005 (Mihanović et al., 2015; Matić et al., 2017) and in the 2011–2016 period (Figure 7). These periods (at least after 1993, when altimetry data became available) were mostly related to cyclonic circulation regime in the Northern Ionian Sea (with 1–2 years phase shift).
However, surface and near-surface high salinity events as defined above (with values higher than 38.8 observed between 0 and 20 m) were relatively rarely observed along the Palagruža Sill transect before 2000. More precisely, they occurred in December 1978, December 1981, October 1986, March 1987 and September 1989. Salinity conditions during the 1990s in the Middle Adriatic were mostly influenced by the very strong anticyclonic circulation regime in the Northern Ionian Sea, that probably started in late 1980s (Demirov and Pinardi, 2002), and lasted until 1997 (Gačić et al., 2010), additionally strengthened by the Eastern Mediterranean Transient. As satellite altimetry measurements are available since 1993, we focused on high salinity events corresponding to this period. The BiOS regime phase shifted to cyclonic by the end of 1997 and warm and saline waters from the Eastern Mediterranean started entering the Adriatic. However, it took several years before this continuous increase of the salinity in the Adriatic enabled values higher than 38.8 to be observed in the upper 20 m of the water column (high surface and near-surface salinity events that occurred at the Palagruža Sill transect are indicated by red ticks in the upper part of each panel in Figure 9). Therefore, high salinity events were not observed during 1990s along the Palagruža Sill transect. They occurred again during several summer-autumn periods between 2000 and 2005 (September 2000, August 2002, August and October 2003, August and September 2005), coinciding with the cyclonic phase of the BiOS and prolonged dry periods in the region, usually with warm summers. Several drought events were documented during this period, among them the infamous European heat wave of 2003 (Grbec et al., 2007; Spinoni et al., 2015, 2019). Preceding this summer, heat losses were quite high in February 2003, pointing to a possibility of the open ocean convection in the SAP, while the Northern Adriatic DWF also occurred, strongly affecting Adriatic-Ionian thermohaline circulation (Dorman et al., 2006; Orlić et al., 2006). Salinity distribution over the Palagruža Sill transect in August 2003 is shown in Figure 11A. Surface salinities over southern part of the transect surpassed 38.9, with the vertical extension to depths of about 10 m. Another salinity maximum was observed between 40 and 70 m, with values reaching almost 38.85. Such conditions continued at least till October 2003, with the deepening of the second maximum (not shown). Another dry year was 2005, when surface salinities higher than 38.8 were again observed at the transect in August (Figure 11B) and September.
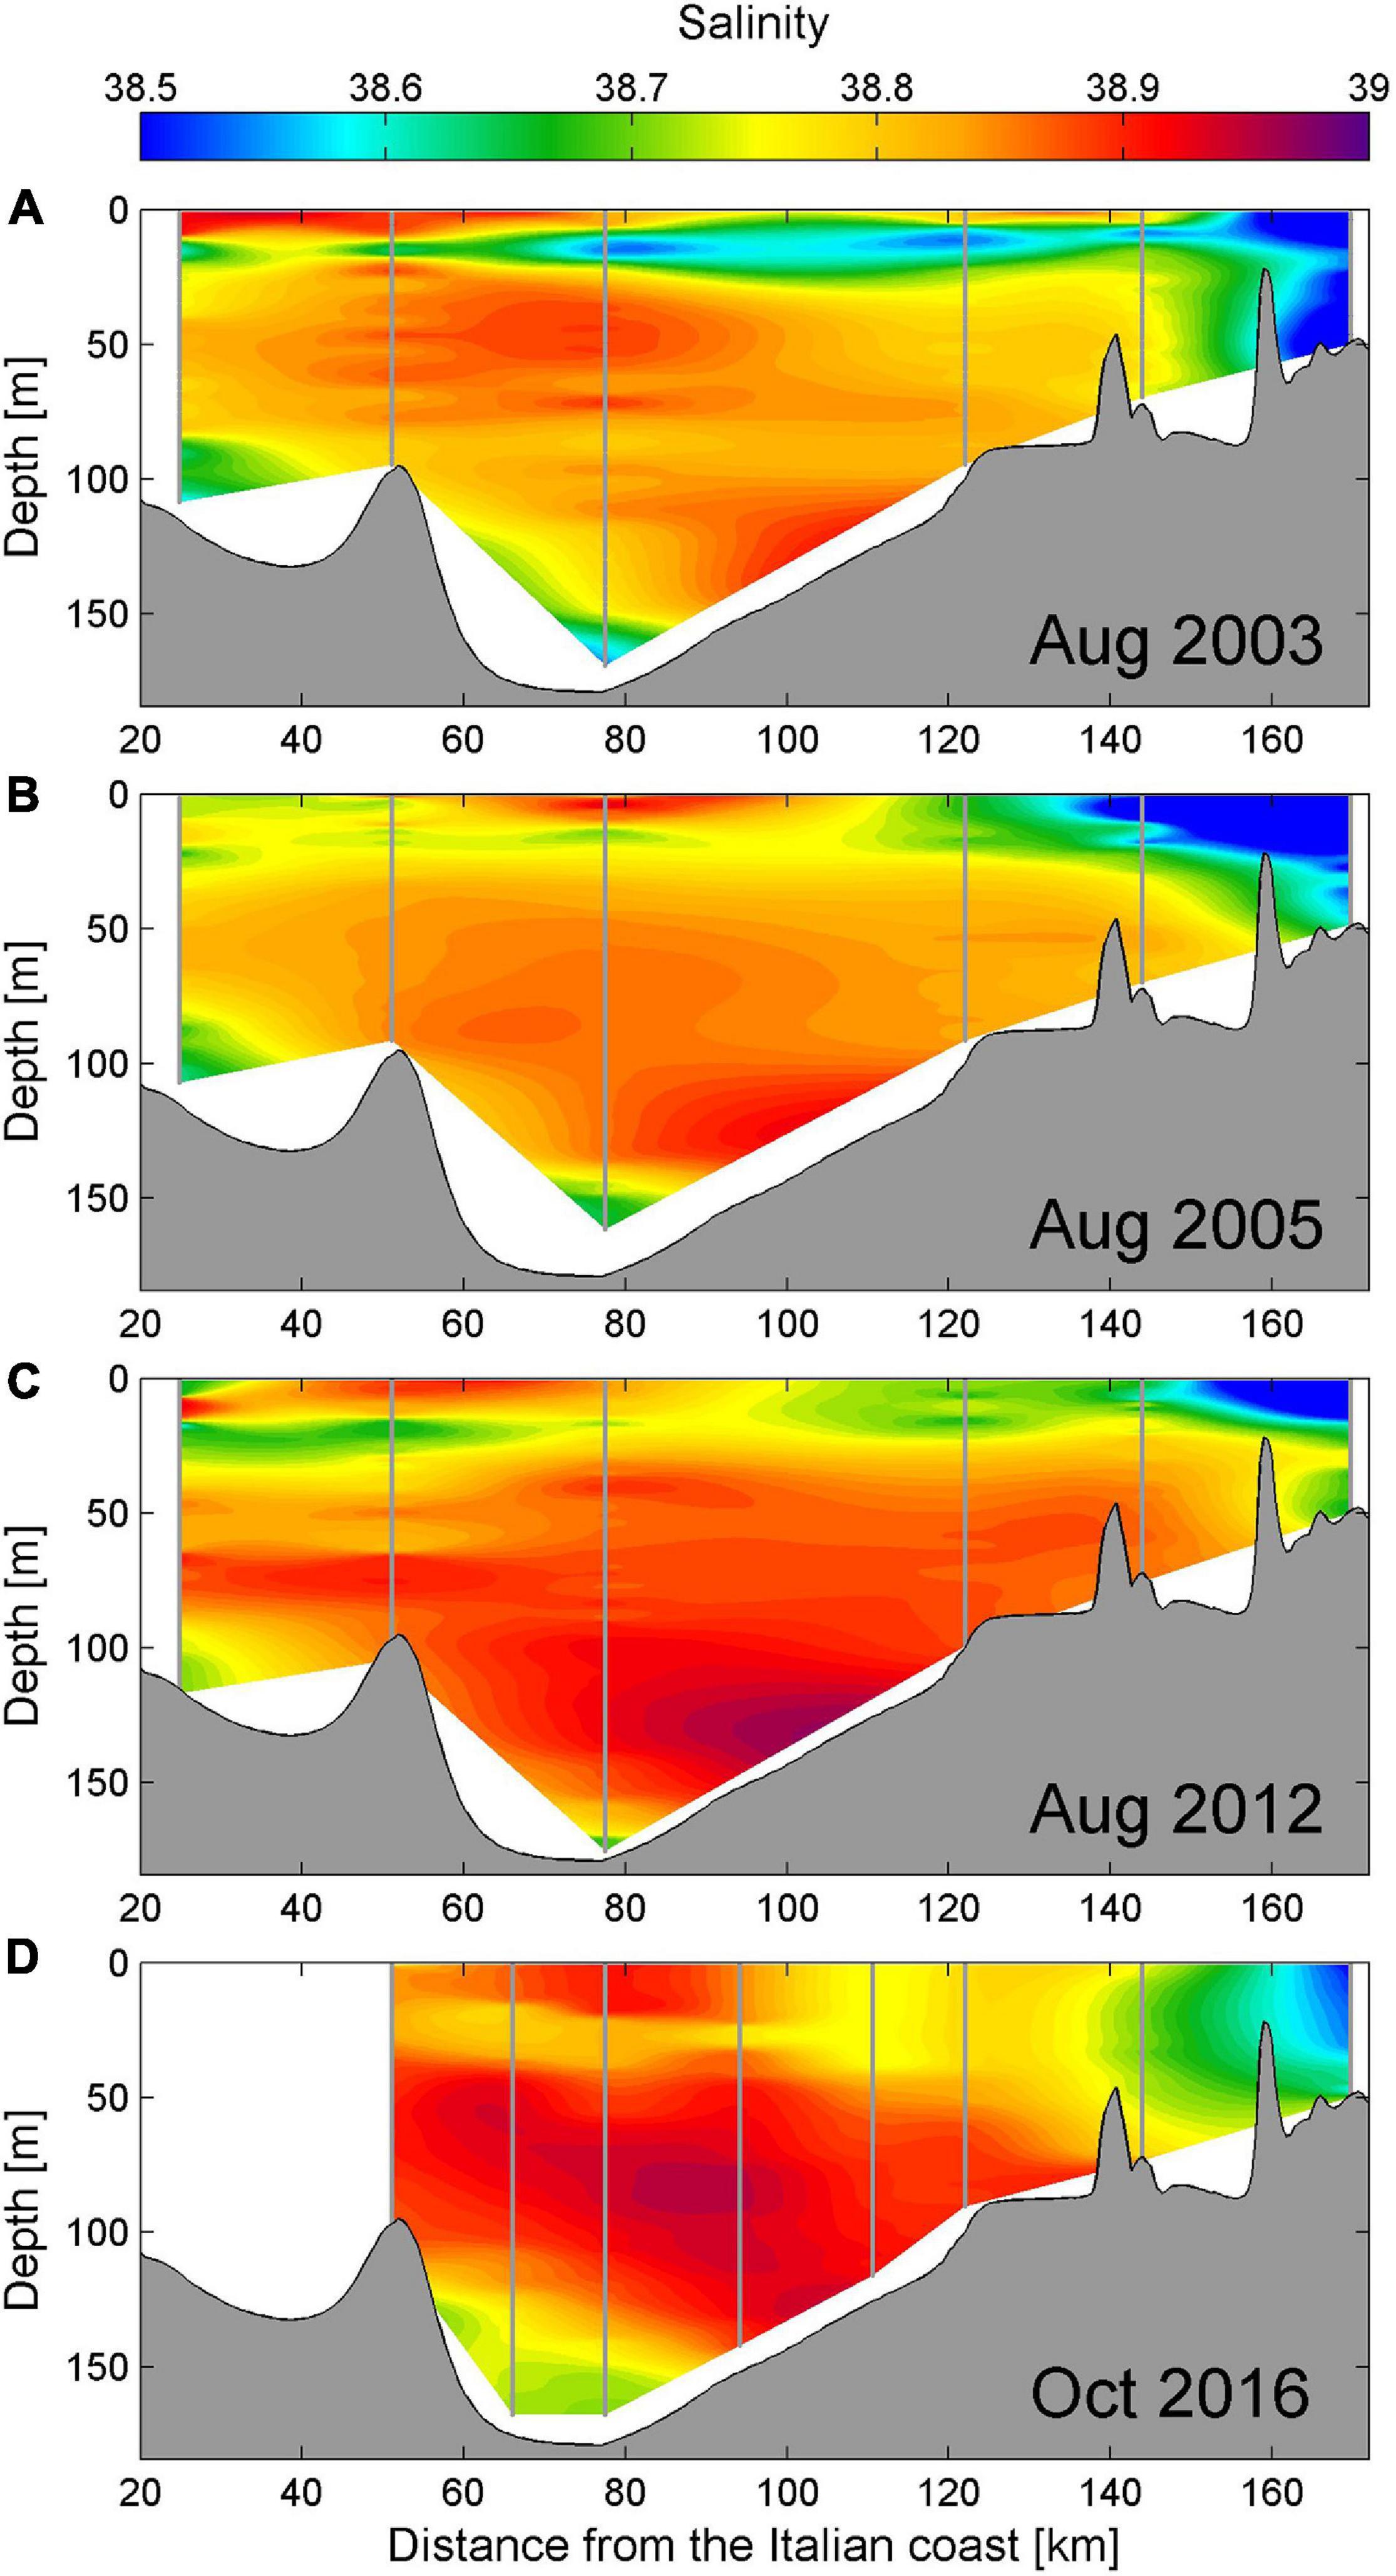
Figure 11. (A) Salinity profile at the Palagruža Sill transect in the second half of August 2003. (B–D) As in panel (A) except for mid-August 2005, the second part of August 2012 and the beginning of October 2016, respectively. Vertical gray lines denote CTD casts.
During the successive anticyclonic BiOS phase (2006–early 2010) the near-surface salinities along the Palagruža Sill transect remained below 38.8. Additionally, Stončica station (CJ009) salinity values were lower than 38.8 at all sampled depths throughout this period (Figure 6B). The next change in the Northern Ionian circulation (from anticyclonic to cyclonic) started in 2010 (Bessiéres et al., 2013), which resulted in renewed increase of salinity in the Southern and Middle Adriatic (Figures 6B, 7). Near-surface salinities higher than 38.8 at the transect were first documented in October 2011. Severe winter conditions and resulting DWF in the Northern and Middle Adriatic during the winter of 2012 enhanced the Adriatic-Ionian thermohaline circulation, and a significant increase in salinities in the Adriatic was observed in the following months, resulting in several-months long period with salinity values higher than 38.8 at the Stončica station in the second half of 2012 (Figure 6B). Moreover, the summer of 2012 was very dry and hot (Figures 9B–D), which again resulted in specific salinity distribution, with two salinity maxima present, one at the surface with values of about 38.9 in the southern section of the transect, and the other with values surpassing 38.92 between 100 and 140 m depth (Figure 11C). The discharges of the Po River were below average during most of 2011 and through the entire 2012 (Figure 9D) with extremely low values during the summer of 2012. In addition, a severe drought was present in the southeastern Europe (Spinoni et al., 2019). Summer heat fluxes in 2012 were much higher than average, and extremely high air temperatures were observed (DHMZ, 2014). The surface salinity maximum was also clearly seen in Argo profiling float measurements in the Northern Ionian Sea (Argo float 6901040; Figure 7B) and briefly in the Middle Adriatic, between mid-July and the end of August 2012 (Argo float 1900848; Figure 7A).
The intense outflow of very dense Adriatic waters during 2012 resulted in the change of the bottom pressure gradient and significant weakening of the cyclonic circulation in the Northern Ionian between the second half of 2012 and the beginning of 2014 (Gačić et al., 2014). However, salinity values in the Adriatic continued to increase throughout 2013 (Figures 6B, 7) with high near-surface salinities observed in the central and southern part of the transect till April 2013 and another brief interval with salinities reaching 38.8 slightly above 20 m between August and September 2013. The following winter of 2014 was very mild and characterized by large freshwater load through rivers and precipitation that created haline-driven stratification (Mihanović et al., 2018; Kokkini et al., 2020). Therefore, salinities decreased in the upper 100 m of the water column, but remained high in the intermediate and bottom layer (Figure 7). Although cyclonic circulation decreased in the Northern Ionian, northward flow along its most eastern part remained relatively strong and coherent (Figure 10C).
As cyclonic regime regained strength in late 2014 and peaked in 2015, continuous increase in Adriatic salinities was observed, with double maxima structure observed in 2015–2016 period in the Southern Adriatic, as already discussed in Section “Processes contributing to anomalous thermohaline properties in 2017.” Surface salinity maximum (salinity values around 38.9) was present again in the central part of Palagruža Sill transect in early autumn 2016 (Figure 11D), with a subsurface layer of lower salinity (around 38.82) separating surface saline waters from the LIW inflow with even more saline waters in intermediate layers (values surpassing 39.94 around 80 m). Argo profiling float 6901822 also briefly captured a maximum in surface salinity in the central part of the SAP, with values of about 39.0 in the second half of August 2016 (Figure 7C). Similarly, as in previously presented cases, heating of surface layers (DHMZ, 2017) was higher than average during the summer season, but it was restricted mostly to June and July 2016 (Figure 9B). Thereafter, the surface heat fluxes were in the range of average values. Po River discharges were lower than average during most of the preconditioning period (Figure 9D), more precisely from the spring of 2015. This prolonged dry period between 2015 and 2017 was also essential preconditioning for the exceptionally high surface and near-surface salinity values in 2017. Finally, this surface salinity maximum in 2016, with values reaching 38.9, also corresponded to the cyclonic BiOS phase, as in several other examples shown above.
Record-breaking surface and near-surface salinities were measured in the Middle and Southern Adriatic Sea in summer and autumn of 2017 bringing to our attention processes that may contribute to such observations. The first glimpse coming from investigations at local scale (coastal eastern part of the Middle Adriatic, Beg Paklar et al., 2020) documented that dry conditions, strong evaporation and extensive heating sustain specific vertical conditions, during which a near-surface highly saline layer is observed, in most cases separated from the second, deeper haline layer (as in July 2017—Figure 2C and in events shown in Figure 11). The 2017 autumn salinity conditions were even more specific, as the highest salinity values were observed in a layer between the surface and 25 to 40 m (Figure 2D), supported by high temperatures and strong thermocline and an increased inflow of highly saline waters from the Southern Adriatic. We extended the analysis to the Southern Adriatic and Northern Ionian for the 2017 event in present study. In addition, we also documented previous situations characterized by surface and near-surface salinity maxima (from time series measured at Palagruža Sill between 1961 and 2016), and assessed processes responsible for their appearance. Several important conclusions can be derived from our analysis:
– All documented events occurred during overall high salinity conditions in the Adriatic, i.e., during cyclonic regime of the Adriatic-Ionian Bimodal Oscillating System (BiOS). The 2017 event was somewhat specific as it occurred during the transient phase of the BiOS, but it was still supported by the persistent northward flow (toward the Adriatic) along the eastern coast of the Northern Ionian Sea,
– Dry conditions in the region and very low river discharges, in particular of the Po River, were found to precede the high surface and near-surface salinity events for a year or more, and
– Near-surface salinity maxima mostly occur during prolonged and extensive heating periods in summer and early autumn, which normally results in an increase in stratification and effective separation of surface waters. Further, they can occur even during moderate summers if the Adriatic salinities are generally high and summer is preceded by very dry conditions (e.g., summers of 2000 and 2005, see Figure 11B), with relatively high evaporation minus precipitation rates (i.e., low precipitation conditions).
The observed intensity of the surface and near-surface salinity maximum in 2017, i.e., exceptionally high salinity values and the intensity of the inverse subsurface halocline, were not documented in the Adriatic Sea until recently (Beg Paklar et al., 2020). High salinity conditions continued to be observed there even after 2017, despite apparent, although relatively short, reversal of the North Ionian Gyre in 2017 and 2018 (Figure 6). Salinities at the Palagruža Sill transect station CJ009 exceeded 38.8 near the surface again in 2019, with values higher than 39.0 observed at depths below 60 m during summer and early autumn (Figure 6B). Moreover, the most recent CTD and Argo data from 2020 indicate that exceptionally high surface salinities occurred again both in the Southern and Middle Adriatic during summer and autumn 2020 (in excess of 39.2 in the Southern Adriatic and 39.1 in the Middle Adriatic, between the surface and 15–20 m, Figures 6B, 12).
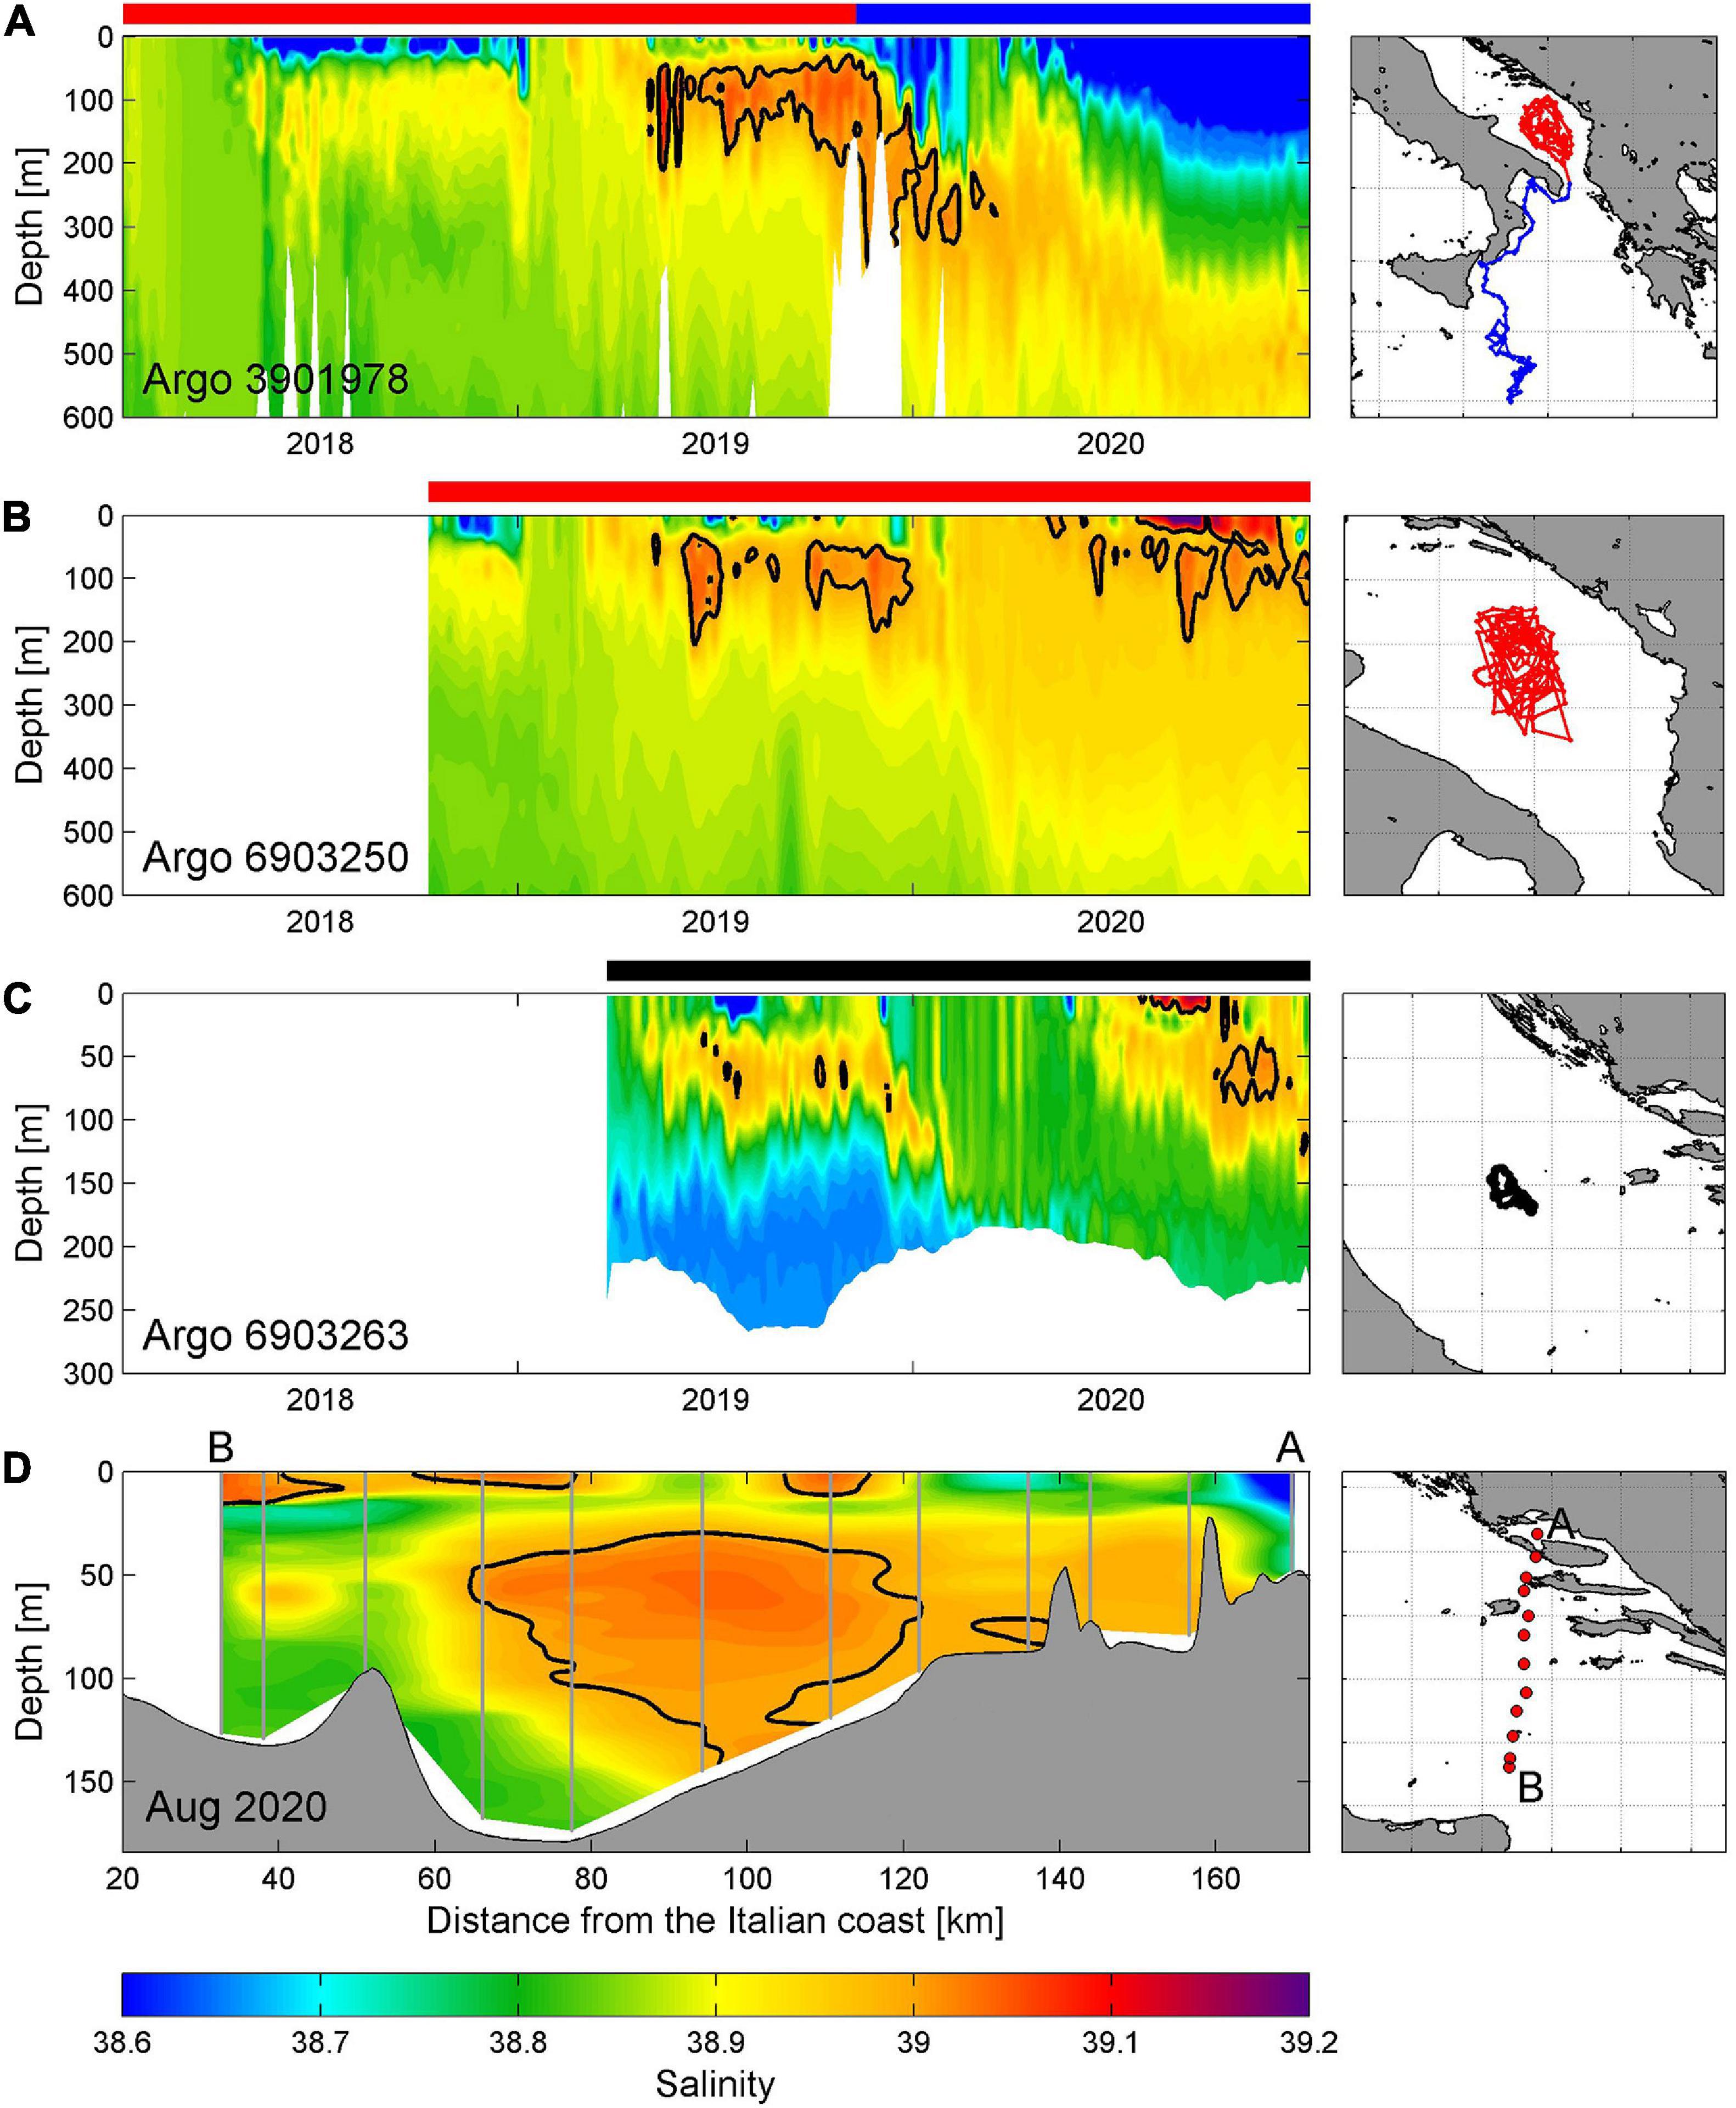
Figure 12. (A) Hovmöller diagram of salinity data for Argo float 3901978 in the first 600 m in the period 2018–2020 (left panel) with corresponding float trajectory (right panel). (B,C) As in panel (A) except for Argo floats 6903250 in the first 600 m (2018–2020) and 6903263 between the surface and the bottom (2019–2020), respectively. Note that the vertical scale in panel (C) is between 0 and 300 m. (D) Salinity profile at the Palagruža Sill transect in mid-August 2020, with the map of CTD stations. Argo trajectories are colored depending on the location of the float (black–Middle Adriatic, red–Southern Adriatic, and blue–Northern Ionian). The same color notation is used in horizontal bars above left panels, indicating periods during which Argos were profiling in respective areas. Thick black line in left panels denotes 39.0 salinity contour. Vertical gray lines in panel (D) denote CTD casts.
In contrast, surface and near-surface salinity maxima regularly occur in the Levantine basin, in particular in the LIW formation region (Kubin et al., 2019). As the LIW region has gone through an extensive salinity increase in the recent decade (Grodsky et al., 2019; Kassis and Korres, 2020), one may wonder if these long-term changes in the Eastern Mediterranean have a significant effect on the BiOS regimes and their impact on the thermohaline changes in the Adriatic Sea or similar local manifestation are related to the observed salinity maxima in the Adriatic Sea. Quantification of remote vs. local/regional effects needs to be further investigated in the future.
We can confirm that the BiOS-driven changes in the Northern Ionian Sea vorticity and alterations between cyclonic and anticyclonic BiOS regime were generally strongly aligned with Adriatic salinity changes since the start of the satellite altimetry measurements in 1993. However, the Adriatic salinities remained high even during the weak cyclonic BiOS regime (as in 2013–2014 period) or its relatively short reversal (2017–2018). What seems to be important during these periods as well is the coastal flow of saline Levantine waters along the eastern Ionian Sea, which mostly followed the BiOS regime till around 2010, but remained relatively stable (with seasonal fluctuations) during the past decade. Altimetry measurements in the Northern Ionian since 2010 indicate that these eastern flank flows might be less related to the general BiOS circulation pattern. Namely, this pattern was relatively weak in 2013–2014 period, and predominantly anticyclonic between 2017 and 2018 (Figure 6A), while northward flow persisted up until at least late 2019 (Figure 10). It is an open question whether such detachment between open sea and coastal processes in the Northern Ionian Sea will last for some time, or characteristic BiOS circulation patterns will restore at some time, once the inflow of Atlantic Water into the Eastern Mediterranean—restricted from mid-2000s (Kassis and Korres, 2020)—would eventually be re-established.
There might be several important consequences of salinity changes. The impact of exceptionally high salinities in the Middle Adriatic on the microbial food was already documented in 2017 (Beg Paklar et al., 2020). The documented anomalous physical conditions were conjoined with significantly lower bacterial production and lower abundance of the most studied picoplankton groups in comparison to values observed during the decade preceding 2017.
Another consequence is an extensive salinification of the Adriatic Sea, like the one observed during recent years, which might be less dependent on the BiOS regimes in the Northern Ionian Sea. The most recent Argo measurements—as of January 2021—indicate that salinities in the SAP are higher than 38.8 as deep as at least 1,000 m depth. Such conditions may substantially lower the advection of Western Mediterranean water to the Adriatic [as has been documented for the Eastern Mediterranean—Kassis and Korres (2020)]. These conditions may also precondition more frequent occurrences of exceptional surface and near-surface salinity maxima (with values higher than 39.0 close to the surface), as observed in 2017 and 2020, particularly since salinity increase has peaked in the Eastern Mediterranean in recent years (Grodsky et al., 2019). If such conditions become more frequent in the future, they might strongly change the microbial food web and beyond, as salinity is an important environmental factor for some picoplankton groups like Prochlorococcus (Mella-Flores et al., 2011).
Such salinity maxima and the overall increase in salinity in the Adriatic may affect the DWF in both Northern and Southern Adriatic (Mihanović et al., 2013), therefore impacting the thermohaline circulation and ventilation of deep Adriatic and Eastern Mediterranean layers. It is still not known how the recently observed salinization in subsurface and intermediate Adriatic layers, if it were to become more frequent in the future, would interplay with the bora-driven wintertime surface heat losses and the wind stress associated with the DWF, which are expected to remain the same or decrease in the future climate (Belušić Vozila et al., 2019; Denamiel et al., 2020). Namely, such high salinity conditions would lower the stability of the water column and therefore increase vertical mixing and the DWF. Both thermohaline data collected at the Palagruža Sill between 1952 and 2010 (Vilibić et al., 2013) and climate simulations (Somot et al., 2006) indicate a shallowing and/or weakening of the Adriatic thermohaline circulation, yet climate models are still far from providing reliable reproduction of thermohaline variability in the Adriatic Sea (Dunić et al., 2019). If the DWF decreases in the future climate, this might have a substantial impact on the deep Adriatic organisms, in particular on those residing along the perimeter of the Jabuka Pit depressions, which are known as nursery and spawning areas for a large number of Adriatic species (Zorica et al., 2020).
The original contributions presented in the study are included in the article/supplementary material, further inquiries can be directed to the corresponding author/s.
HM and IV developed the idea and the concept of the manuscript. HM, IV, and JS wrote the initial version of the manuscript. HM, FM, ZLJ, EM, RG, GN, and P-MP collected the data and performed the analyses. HM prepared the figures. All authors actively contributed to revisions of the manuscript, and read and approved the submitted version.
The authors declare that the research was conducted in the absence of any commercial or financial relationships that could be construed as a potential conflict of interest.
The Argo profiling float data were collected through the MedArgo programme and the European Maritime and Fisheries Fund MOCCA project (Project No: SI2.709624 | Call reference No: EASME/EMFF/2015/1.2.1.1) and made freely available under the International Argo Program in which the national programs contributed (https://www.ocean-ops.org/board?t=argo). The glider research was carried out by the National Institute of Oceanography and Applied Geophysics—OGS in the framework of ArgoItaly, funded by the Italian Ministry of University and Research. This work has been supported by the Croatian Science Foundation under projects ADIOS (IP-2016-06-1955), MAUD (IP-2018-01-9849), BivACME (IP-2019-04-8542), and ISLAND (IP-2020-02-9524). The research was also supported through the projects CAAT and HIDROLAB, funded by the European Union through European Structural and Investment Funds 2014–2020, with the respective contract numbers KK.01.1.1.04.0064 and KK.01.1.1.04.0053.
To all researchers, engineers, technicians, and research vessel crews that were engaged in field collection of the thermohaline data. Absolute dynamic topography and surface geostrophic current data are provided through AVISO+ programme and are available at Copernicus Marine Service pages (https://marine.copernicus.eu). The Mediterranean Forecasting System (MFS) results were also downloaded from Copernicus Marine Service pages (http://marine.copernicus.eu). Po River discharges at Pontelagoscuro station were kindly provided by the Regional Agency for Prevention, Environment and Energy of Emilia-Romagna, Italy (Arpae Emilia-Romagna). The comments raised by the two reviewers are greatly appreciated.
Argo (2021). Argo float data and metadata from Global Data Assembly Centre (Argo GDAC). SEANOE. doi: 10.17882/42182
Artegiani, A., and Salusti, E. (1987). Field observation of the flow of dense water on the bottom of the Adriatic Sea during the winter of 1981. Oceanol. Acta 10, 387–391.
Artegiani, A., Bregant, D., Paschini, E., Pinardi, N., Raicich, F., and Russo, A. (1997). The Adriatic Sea general circulation, part I: air– sea interactions and water mass structure. J. Phys. Oceanogr. 27, 1492–1514. doi: 10.1175/1520-0485(1997)027<1492:tasgcp>2.0.co;2
Babić, I., Petrić, I., Bosak, S., Mihanović, H., Dupčić Radić, I., and Ljubešić, Z. (2017). Distribution and diversity of marine picocyanobacteria community: targeting of Prochlorococcus ecotypes in winter conditions (southern Adriatic Sea). Mar. Genom. 36, 3–11. doi: 10.1016/j.margen.2017.05.014
Batistić, M., Garić, R., and Molinero, J. C. (2014). Interannual variations in Adriatic Sea zooplankton mirror shifts in circulation regimes in the Ionian Sea. Clim. Res. 61, 231–240. doi: 10.3354/cr01248
Beg Paklar, G., Vilibić, I., Grbec, B., Matić, F., Mihanović, H., Džoić, T., et al. (2020). Record-breaking salinities in the middle Adriatic during summer 2017 and concurrent changes in the microbial food web. Prog. Oceanogr. 185:102345. doi: 10.1016/j.pocean.2020.102345
Belušić Vozila, A., Güttler, I., Ahrens, B., Obermann-Hellhund, A., and Telišman Prtenjak, M. (2019). Wind over the Adriatic region in CORDEX climate change scenarios. J. Geophys. Res. Atmos. 124, 110–130. doi: 10.1029/2018jd028552
Ben Ismail, S., Schroeder, K., Sammari, C., Gasparini, G. P., Borghini, M., and Aleya, L. (2014). Interannual variability of water mass properties in the Tunisia–Sicily channel. J. Mar. Syst. 135, 14–28. doi: 10.1016/j.jmarsys.2013.06.010
Bergamasco, A., Oguz, T., and Malanotte-Rizzoli, P. (1999). Modelling dense water mass formation and winter circulation in the northern and central Adriatic Sea. J. Mar. Syst. 20, 279–300. doi: 10.1016/s0924-7963(98)00087-6
Bessiéres, L., Rio, M. H., Dufau, C., Boone, C., and Pujol, M. I. (2013). Ocean state indicators from MyOcean altimeter products. Ocean Sci. 9, 545–560. doi: 10.5194/os-9-545-2013
Bingham, F. M., Busecke, J., Gordon, A. L., Giulivi, C. F., and Li, Z. (2014). The North Atlantic subtropical surface salinity maximum as observed by Aquarius. J. Geophys. Res. Oceans 119, 7741–7755. doi: 10.1002/2014jc009825
Buljan, M. (1953). Fluctuations of salinity in the Adriatic, Izvještaj Republičke ribarstveno-biološke ekspedicije “Hvar” 1948–1949. Acta Adriat. 2, 1–64.
Buljan, M., and Zore-Armanda, M. (1976). Oceanographic properties of the Adriatic Sea. Oceanogr. Mar. Biol. Ann. Rev. 14, 11–98.
Chen, G., Peng, L., and Ma, C. (2018). Climatology and seasonality of upper ocean salinity: a three-dimensional view from argo floats. Clim. Dyn. 50, 2169–2182. doi: 10.1007/s00382-017-3742-6
Civitarese, G., Gačić, M., Lipizer, M., and Borzelli, G. L. E. (2010). On the impact of the Bimodal Oscillating System (BiOS) on the biogeochemistry and biology of the Adriatic and Ionian Seas (Eastern Mediterranean). Biogeosciences 7, 3987–3997. doi: 10.5194/bg-7-3987-2010
Clementi, E., Pistoia, J., Escudier, R., Delrosso, D., Drudi, M., Grandi, A., et al. (2019). Mediterranean Sea Physics Analysis and Forecast (CMEMS MED-Currents, EAS5 system) [Data set]. Copernicus Monitoring Environment Marine Service (CMEMS). Available Online at: https://doi.org/10.25423/CMCC/MEDSEA_ANALYSIS_FORECAST_PHY_006_013_EAS5 (accessed March 11, 2019).
Dautović, J., Vojvodić, V., Tepić, N., Ćosović, B., and Ciglenečki, I. (2017). Dissolved organic carbon as potential indicator of global change: a long-term investigation in the northern Adriatic. Sci. Total Environ. 587-588, 185–195. doi: 10.1016/j.scitotenv.2017.02.111
Dee, D. P., Uppala, S. M., Simmons, A. J., Berrisford, P., Poli, P., Kobayashi, S., et al. (2011). The ERA-Interim reanalysis: configuration and performance of the data assimilation system. Q. J. R. Meteorol. Soc. 137, 553–597.
Demirov, E., and Pinardi, N. (2002). Simulation of the Mediterranean Sea circulation from 1979 to 1993: part I. The interannual variability. J. Mar. Syst. 33-34, 23–50. doi: 10.1016/s0924-7963(02)00051-9
Denamiel, C., Tojčić, I., and Vilibić, I. (2020). Far future climate (2060–2100) of the northern Adriatic air–sea heat transfers associated with extreme bora events. Clim. Dyn. 55, 3043–3066. doi: 10.1007/s00382-020-05435-8
DHMZ (2014). Reviews No. 24. Climate Monitoring and assessment for 2012 (in Croatian). Croatian: Croatian Meteorological and Hydrological Service.
DHMZ (2017). Reviews No. 28. Climate Monitoring and assessment for 2016 (in Croatian). Croatian: Croatian Meteorological and Hydrological Service.
DHMZ (2018). Reviews No. 29. Climate Monitoring and assessment for 2017 (in Croatian). Croatian: Croatian Meteorological and Hydrological Service.
Dorman, C. E., Carniel, S., Cavaleri, L., Sclavo, M., Chiggiato, J., Doyle, J., et al. (2006). February 2003 marine atmospheric conditions and the bora over the northern Adriatic. J. Geophys. Res. 111:C03S03.
Dunić, N., Vilibić, I., Šepić, J., Mihanović, H., Sevault, F., Somot, S., et al. (2019). Performance of multi-decadal ocean simulations in the Adriatic Sea. Ocean Model. 134, 84–109. doi: 10.1016/j.ocemod.2019.01.006
Franić, Z. (2005). Estimation of the Adriatic sea water turnover time using fallout 90Sr as a radioactive tracer. J. Mar. Syst. 57, 1–12. doi: 10.1016/j.jmarsys.2004.11.005
Gačić, M., Borzelli, G. L. E., Civitarese, G., Cardin, V., and Yari, S. (2010). Can internal processes sustain reversals of the ocean upper circulation? the Ionian Sea example. Geophys. Res. Lett. 37:L09608.
Gačić, M., Civitarese, G., Kovačević, V., Ursella, L., Bensi, M., Menna, M., et al. (2014). Extreme winter 2012 in the Adriatic: an example of climatic effect on the BiOS rhythm. Ocean Sci. 10, 513–522. doi: 10.5194/os-10-513-2014
Gačić, M., Civitarese, G., Miserocchi, S., Cardin, V., Crise, A., and Mauri, E. (2002). The open-ocean convection in the Southern Adriatic: a controlling mechanism of the spring phytoplankton bloom. Cont. Shelf. Res. 22, 1897–1908. doi: 10.1016/s0278-4343(02)00050-x
Gačić, M., Kovačević, V., Manca, B., Papageorgiou, E., Poulain, P.-M., Scarazzato, P., et al. (1996). Thermohaline properties and circulation in the Otranto Strait. Bull. Institut Oceanographie Monaco 17, 117–145.
Grbec, B., Morović, M., Beg Paklar, G., Kušpilić, G., Matijević, S., Matić, F., et al. (2009). The relationship between the atmospheric variability and productivity in the Adriatic Sea area. J. Mar. Biol. Assoc. U. K. 89, 1549–1558. doi: 10.1017/s0025315409000708
Grbec, B., Vilibić, I., Bajić, A., Morović, M., Beg Paklar, G., Matić, F., et al. (2007). Response of the Adriatic Sea to the atmospheric anomaly in 2003. Ann. Geophys. 25, 835–846. doi: 10.5194/angeo-25-835-2007
Grodsky, S. A., Reul, N., Bentamy, A., Vandemark, D., and Guimbar, S. (2019). Eastern Mediterranean salinification observed in satellite salinity from SMAP mission. J. Mar. Syst. 198:103190. doi: 10.1016/j.jmarsys.2019.103190
Gualdi, S., Somot, S., May, W., Castellari, S., Déqué, M., Adani, M., et al. (2013). “Future climate projections,” in Regional Assessment of Climate Change in the Mediterranean, Advances in Global Change Research 50, eds A. Navarra and L. Tubiana (Dordrecht: Springer), 53–118.
Hure, M., Mihanović, H., Lučić, D., Ljubešić, Z., and Kružić, P. (2018). Mesozooplankton spatial distribution and community structure in the South Adriatic Sea during two winters (2015, 2016). Mar. Ecol. 39:e12488. doi: 10.1111/maec.12488
Incarbona, A., Martrat, B., Mortyn, P. G., Sprovieri, M., Ziveri, P., Gogou, A., et al. (2016). Mediterranean circulation perturbations over the last five centuries: Relevance to past Eastern Mediterranean Transient-type events. Sci. Rep. 6:29623.
Kassis, D., and Korres, G. (2020). Hydrography of the Eastern Mediterranean basin derived from argo floats profile data. Deep Sea Res. II 171:104712. doi: 10.1016/j.dsr2.2019.104712
Klein, B., Roether, W., Manca, B. B., Bregant, D., Beitzel, V., Kovačević, V., et al. (1999). The large deep water transient in the Eastern Mediterranean. Deep Sea Res. I 46, 37–414.
Kokkini, Z., Mauri, E., Gerin, R., Poulain, P.-M., Simoncelli, S., and Notarstefano, G. (2020). On the salinity structure in the South Adriatic as derived from float and glider observations in 2013–2016. Deep Sea Res. II 171:104625. doi: 10.1016/j.dsr2.2019.07.013
Krom, M. D., Herut, B., and Mantoura, R. F. C. (2004). Nutrient budget for the Eastern Mediterranean: implications for phosphorus limitation. Limnol. Oceanogr. 49, 1582–1592. doi: 10.4319/lo.2004.49.5.1582
Krom, M. D., Kress, N., Brenner, S., and Gordon, L. I. (1991). Phosphorus limitation of primary productivity in the eastern Mediterranean Sea. Limnol. Oceanogr. 36, 424–432. doi: 10.4319/lo.1991.36.3.0424
Kubin, E., Poulain, P.-M., Mauri, E., Menna, M., and Notarstefano, G. (2019). Levantine intermediate and Levantine deep water formation: an Argo float study from 2001 to 2017. Water 11:1781. doi: 10.3390/w11091781
Lipizer, M., Partescano, E., Rabitti, A., Giorgetti, A., and Crise, A. (2014). Qualified temperature, salinity and dissolved oxygen climatologies in a changing Adriatic Sea. Ocean Sci. 10, 771–797. doi: 10.5194/os-10-771-2014
Lučić, D., Ljubešić, Z., Babić, I., Bosak, S., Cetinić, I., Vilibić, I., et al. (2017). Unusual winter zooplankton bloom in the open southern Adriatic Sea. Turk. J. Zool. 41, 1024–1035. doi: 10.3906/zoo-1702-17
Macias, D., Garcia-Gorriz, E., and Stips, A. (2013). Understanding the causes of recent warming of Mediterranean waters. How much could be attributed to climate change? PLoS One 8:e81591. doi: 10.1371/journal.pone.0081591
Malanotte-Rizzoli, P., Manca, B. B., D’Alcala, M. R., Theocharis, A., Bergamasco, A., Bregant, D., et al. (1997). A synthesis of the Ionian Sea hydrography, circulation and water mass pathways during POEM-Phase I. Prog. Oceanogr. 39, 153–204. doi: 10.1016/s0079-6611(97)00013-x
Martin, P. J., Book, J. W., Burrage, D. M., Rowley, C. D., and Tudor, M. (2009). Comparison of model-simulated and observed currents in the central Adriatic during DART. J. Geophys. Res. Oceans 114:C01S05.
Marullo, S., Artale, V., and Santoleri, R. (2011). The SST multidecadal variability in the Atlantic-Mediterranean region and its relation to AMO. J. Clim. 24, 4385–4401. doi: 10.1175/2011jcli3884.1
Matić, F., Kovač, Ž, Vilibić, I., Mihanović, H., Morović, M., Grbec, B., et al. (2017). Oscillating Adriatic temperature and salinity regimes mapped using the Self-Organizing Maps method. Cont. Shelf Res. 132, 11–18. doi: 10.1016/j.csr.2016.11.006
Mella-Flores, D., Mazard, S., Humily, F., Partensky, F., Mahe, F., Bariat, L., et al. (2011). Is the distribution of Prochlorococcus and Synechococcus ecotypes in the Mediterranean Sea affected by global warming? Biogeosciences 8, 2785–2804. doi: 10.5194/bg-8-2785-2011
Menna, M., Reyes Suareza, N. C., Civitarese, G., Gačić, M., Rubino, A., and Poulain, P.-M. (2019). Decadal variations of circulation in the Central Mediterranean and its interactions with mesoscale gyres. Deep Sea Res. II 164, 14–24. doi: 10.1016/j.dsr2.2019.02.004
Merckelbach, L. M., Briggs, R. D., Smeed, D. A., and Griffiths, G. (2008). “Current measurements from autonomous underwater gliders,” in Proceedings of the 2008 IEEE/OES 9th Working Conference on Current Measurement Technology, (Piscataway, NJ: IEEE).
Mihanović, H., Janeković, I., Vilibić, I., Kovačević, V., and Bensi, M. (2018). Modelling interannual changes in dense water formation on the northern Adriatic shelf. Pure Appl. Geophys. 175, 4065–4081. doi: 10.1007/s00024-018-1935-5
Mihanović, H., Vilibić, I., Carniel, S., Tudor, M., Russo, A., Bergamasco, A., et al. (2013). Exceptional dense water formation on the Adriatic shelf in the winter of 2012. Ocean Sci. 9, 561–572. doi: 10.5194/os-9-561-2013
Mihanović, H., Vilibić, I., Dunić, N., and Šepić, J. (2015). Mapping of decadal middle Adriatic oceanographic variability and its relation to the BiOS regime. J. Geophys. Res. Oceans 120, 5615–5630. doi: 10.1002/2015jc010725
Mosetti, F. (1983). A tentative attempt at determining the water flow through the Otranto Strait: the mouth of the Adriatic Sea. Criterion for applying the computation of dynamic height anomalies on the water budget problems. Boll. Oceanol. Teor. Appl. I 1, 143–163.
Nagy, H., Di Lorenzo, E., and El-Gindy, A. (2019). The impact of climate change on circulation patterns in the Eastern Mediterranean Sea upper layer using Med-ROMS model. Prog. Oceanogr. 175, 226–244. doi: 10.1016/j.pocean.2019.04.012
Nezlin, N., Dever, M., Halverson, M., Leconte, J.-M., Maze, G., Richards, C., et al. (2020). Accuracy and long-term stability assessment of inductive conductivity cell measurements on Argo floats. J. Atmos. Ocean. Technol. 37, 2209–2223. doi: 10.1175/jtech-d-20-0058.1
Orlić, M., Dadić, V., Grbec, B., Leder, N., Marki, A., Matić, F., et al. (2006). Wintertime buoyancy forcing, changing seawater properties, and two different circulation systems produced in the Adriatic. J. Geophys. Res. Oceans 112:C03S07.
Orlić, M., Gačić, M., and La Violette, P. E. (1992). The currents and circulation of the Adriatic Sea. Oceanol. Acta 15, 109–124.
Pastor, F., Valiente, J. A., and Palau, J. L. (2018). Sea surface temperature in the Mediterranean: trends and spatial patterns (1982–2016). Pure Appl. Geophys. 175, 4017–4029. doi: 10.1007/s00024-017-1739-z
Pettenuzzo, D., Large, W. G., and Pinardi, N. (2010). On the corrections of ERA-40 surface flux products consistent with the Mediterranean heat and water budgets and the connection between basin surface total heat flux and NAO. J. Geophys. Res. Oceans 115:C06022.
Pinardi, N., Allen, I., Demirov, E., De Mey, P., Korres, G., Lascaratos, A., et al. (2003). The Mediterranean ocean forecasting system: first phase of implementation (1998-2001). Ann. Geophys. 21, 3–20. doi: 10.5194/angeo-21-3-2003
Pinardi, N., and Coppini, G. (2010). Operational oceanography in the Mediterranean Sea: the second stage of development. Ocean Sci. 6, 263–267. doi: 10.5194/os-6-263-2010
Pinardi, N., Zavatarelli, M., Adani, M., Coppini, G., Fratianni, C., Oddo, P., et al. (2015). Mediterranean Sea large-scale low-frequency ocean variability and water mass formation rates from 1987 to 2007: a retrospective analysis. Prog. Oceanogr. 132, 318–332. doi: 10.1016/j.pocean.2013.11.003
Poulain, P.-M., Barbanti, R., Font, J., Cruzado, A., Millot, C., Gertman, I., et al. (2007). MedArgo: a drifting profiler program in the Mediterranean Sea. Ocean Sci. 3, 379–395. doi: 10.5194/os-3-379-2007
Raicich, F. (1996). On the fresh water balance of the Adriatic sea. J. Mar. Syst. 9, 305–319. doi: 10.1016/s0924-7963(96)00042-5
Reale, M., Salon, S., Crise, A., Farneti, R., Mosetti, R., and Sannino, G. (2017). Unexpected covariant behavior of the Aegean and Ionian Seas in the period 1987–2008 by means of a nondimensional sea surface height index. J. Geophys. Res. Oceans 122, 8020–8033. doi: 10.1002/2017jc012983
Roether, W., and Schlitzer, R. (1991). Eastern Mediterranean deep water renewal on the basis of chlorofluoromethane and tritium data. Dyn. Atmos. Oceans 15, 333–354. doi: 10.1016/0377-0265(91)90025-b
Rubino, A., Gačić, M., Bensi, M., Kovačević, V., Malačič, V., Menna, M., et al. (2020). Experimental evidence of long-term oceanic circulation reversals without wind influence in the North Ionian Sea. Sci. Rep. 10:1905.
Rudnick, D. L., Baltes, R., Crowley, M., Schofield, O., Lee, C. M., and Lembke, C. (2012). “A national glider network for sustained observation of the coastal ocean,” in Proceedings of the Ocean. 2012 MTS/IEEE Harnessing Power Ocean, (Piscataway, NJ: IEEE).
Shabrang, L., Menna, M., Pizzi, C., Lavigne, H., Civitarese, G., and Gačić, M. (2016). Long-term variability of the southern Adriatic circulation in relation to North Atlantic Oscillation. Ocean Sci. 12, 233–241. doi: 10.5194/os-12-233-2016
Skliris, N., Sofianos, S., Gkanasos, A., Mantziafou, A., Vervatis, V., Axaopoulos, P., et al. (2012). Decadal scale variability of sea surface temperature in the Mediterranean sea in relation to atmospheric variability. Ocean Dyn. 62, 13–30. doi: 10.1007/s10236-011-0493-5
Somot, S., Sevault, F., and Déqué, M. (2006). Transient climate change scenario simulation of the Mediterranean Sea for the twenty-first century using a high-resolution ocean circulation model. Clim. Dyn. 27, 851–879. doi: 10.1007/s00382-006-0167-z
Spinoni, J., Barbosa, P., De Jager, A., McCormick, N., Naumann, G., Vogt, J. V., et al. (2019). A new global database of meteorological drought events from 1951 to 2016. J. Hydrol. Reg. Stud. 22:100593. doi: 10.1016/j.ejrh.2019.100593
Spinoni, J., Naumann, G., Vogt, J. V., and Barbosa, P. (2015). The biggest drought events in Europe from 1950 to 2012. J. Hydrol. Reg. Stud. 3, 509–524. doi: 10.1016/j.ejrh.2015.01.001
Theocharis, A., Krokos, G., Velaoras, D., and Korres, G. (2014). “An internal mechanism driving the alternation of the Eastern Mediterranean dense/deep water sources,” in The Mediterranean Sea: Temporal Variability and Spatial Patterns, Geophysical Monograph Series, eds G. L. Eusebi Borzelli, M. Gačić, P. Lionello, and P. Malanotte-Rizzoli (Washington, DC: AGU).
Vargas-Yáñez, M., García-Martínez, M. C., Moya, F., Balbín, R., López-Jurado, J. L., Serra, M., et al. (2017). Updating temperature and salinity mean values and trends in the Western Mediterranean: the RADMED project. Prog. Oceanogr. 157, 27–46. doi: 10.1016/j.pocean.2017.09.004
Vilibić, I., Matijević, S., Šepić, J., and Kušpilić, G. (2012). Changes in the Adriatic oceanographic properties induced by the Eastern Mediterranean Transient. Biogeosciences 9, 2085–2097. doi: 10.5194/bg-9-2085-2012
Vilibić, I., and Mihanović, H. (2013). Observing the bottom density current over a shelf using an Argo profiling float. Geophys. Res. Lett. 40, 910–915. doi: 10.1002/grl.50215
Vilibić, I., Mihanović, H., Janeković, I., and Šepić, J. (2016). Modelling the formation of dense water in the northern Adriatic: sensitivity studies. Ocean Model. 101, 17–29. doi: 10.1016/j.ocemod.2016.03.001
Vilibić, I., and Orlić, M. (2001). Least-squares tracer analysis of water masses in the South Adriatic (1967-1990). Deep Sea Res. I 48, 2297–2330. doi: 10.1016/s0967-0637(01)00014-0
Vilibić, I., and Orlić, M. (2002). Adriatic water masses, their rates of formation and transport through the Otranto Strait. Deep Sea Res. I 49, 1321–1340. doi: 10.1016/s0967-0637(02)00028-6
Vilibić, I., Šepić, J., and Proust, N. (2013). Weakening of the thermohaline circulation in the Adriatic sea. Clim. Res. 55, 217–225. doi: 10.3354/cr01128
Vilibić, I., Zemunik, P., Dunić, N., and Mihanović, H. (2020). Local and remote drivers of the observed thermohaline variability on the northern Adriatic shelf (Mediterranean Sea). Cont. Shelf Res. 199:104110. doi: 10.1016/j.csr.2020.104110
Wang, Y., Li, Y., and Wei, C. (2019). Subtropical sea surface salinity maxima in the South Indian Ocean. J. Oceanol. Limnol. 38, 16–29. doi: 10.1007/s00343-019-8251-5
Keywords: surface salinity maximum, heat fluxes, river discharges, decadal salinity oscillations, Adriatic Sea
Citation: Mihanović H, Vilibić I, Šepić J, Matić F, Ljubešić Z, Mauri E, Gerin R, Notarstefano G and Poulain P-M (2021) Observation, Preconditioning and Recurrence of Exceptionally High Salinities in the Adriatic Sea. Front. Mar. Sci. 8:672210. doi: 10.3389/fmars.2021.672210
Received: 25 February 2021; Accepted: 09 June 2021;
Published: 06 July 2021.
Edited by:
Katrin Schroeder, Institute of Marine Science (CNR), ItalyReviewed by:
Francesco Marcello Falcieri, Institute of Marine Science (CNR), ItalyCopyright © 2021 Mihanović, Vilibić, Šepić, Matić, Ljubešić, Mauri, Gerin, Notarstefano and Poulain. This is an open-access article distributed under the terms of the Creative Commons Attribution License (CC BY). The use, distribution or reproduction in other forums is permitted, provided the original author(s) and the copyright owner(s) are credited and that the original publication in this journal is cited, in accordance with accepted academic practice. No use, distribution or reproduction is permitted which does not comply with these terms.
*Correspondence: Hrvoje Mihanović, aHJ2b2plLm1paGFub3ZpY0Bpem9yLmhy
Disclaimer: All claims expressed in this article are solely those of the authors and do not necessarily represent those of their affiliated organizations, or those of the publisher, the editors and the reviewers. Any product that may be evaluated in this article or claim that may be made by its manufacturer is not guaranteed or endorsed by the publisher.
Research integrity at Frontiers
Learn more about the work of our research integrity team to safeguard the quality of each article we publish.