 Lauren Ashlock
 Marisol García-Reyes
 Chelle Gentemann
 Sonia Batten
 William Sydeman
- 1Department of Biology, The University of Vermont, Burlington, VT, United States
- 2Farallon Institute, Petaluma, CA, United States
- 3North Pacific Marine Science Organization (PICES), Sidney, BC, Canada
The Northeast Pacific is a highly heterogeneous and productive ecosystem, yet it is vulnerable to climate change and extreme events such as marine heat waves. Recent heat wave induced die-offs of fish, marine mammals, and seabirds in the Gulf of Alaska were associated with the loss of large, lipid-rich copepods, which are a vital food resource for forage fishes. The critical and temperature sensitive role of copepods in this ecosystem motivates our investigation into the impacts of temperature on copepod occurrence, abundance, and phenology. Here, we pair long term in situ copepod data from Continuous Plankton Recorder surveys with satellite temperature data to determine the influence of water temperature on three key copepod taxa: Neocalanus plumchrus, Calanus pacificus, and Oithona spp. Through the use of linear models and thermal threshold methods, we demonstrate that N. plumchrus is most vulnerable to warming and future marine heat waves in this region. Linear models demonstrate that N. plumchrus abundance is negatively related to temperature, and thermal threshold methods reveal that N. plumchrus has an upper thermal threshold of 11.5°C for occurrence, and 10.5°C for abundance. Additionally, examining N. plumchrus abundance before and during the 2014–2016 marine heat wave demonstrates reduced species abundance during past warming events. Oithona spp. and C. pacificus appear to be less vulnerable to warm temperatures. However, their presence will not be sufficient to supplement the loss of the larger-bodied and lipid-rich N. plumchrus. Our findings demonstrate the power of using long-term in situ data to determine thermal tolerances, and suggest the need to further examine the potential resilience of N. plumchrus to climate change.
Introduction
The Northeast Pacific’s highly productive and diverse ecosystems (Weingartner et al., 2002; Sousa et al., 2016) are marked by variation in temperature across regions, seasons, years, and long-term patterns of climate variability (Benson and Trites, 2002; Batten et al., 2006; Janout et al., 2010; Johnstone and Mantua, 2014; Hill et al., 2015). Recently, the Northeast Pacific (NEP) experienced increasingly frequent warm-water periods, including an intense marine heat wave (MHW) during 2014–2016 (Di Lorenzo and Mantua, 2016), and again in 2019 (Amaya et al., 2020). The biological effects of these MHWs were dramatic across trophic levels, with changes in plankton community composition and die-offs of fish, marine mammals, and seabirds (Cavole et al., 2016; Yang et al., 2018; Peña et al., 2019; Piatt et al., 2020). With the apparent increase in the magnitude and frequency of MHWs globally (Scheffers et al., 2016; Frolicher et al., 2018; Oliver et al., 2018), understanding the impact of these events is critical for predicting future ecosystem and fisheries health and productivity under changing conditions.
In the NEP, MHW induced die-offs of Coho salmon and Alaskan walleye pollock were attributed to the loss of large lipid-rich copepods in the diet of juvenile stages (Cavole et al., 2016). Additionally, mortality seen in marine mammals and seabirds was likely caused by losses of forage fishes, which also rely on copepods for food (Cavole et al., 2016; Piatt et al., 2020). A challenge in studying the impact of MHW on copepods is the availability of long-term in situ data. While there are many laboratory studies investigating thermal responses of copepods (Kelly et al., 2012; Pereira et al., 2017; Sasaki and Dam, 2019), geographically comprehensive in situ datasets can be cost prohibitive. In the NEP, the Continuous Plankton Recorder survey (CPR; Batten et al., 2003a; Reid et al., 2003) has collected consistent in situ data each year since 2000, providing a unique opportunity to study the responses of multiple copepod taxa to a wide range of thermal conditions. In this study, we pair 16 years of CPR data with temperature data to examine the impact of temperature on patterns of occurrence, abundance, and phenology of copepods in the Gulf of Alaska (GoA). This study spans the extreme MHW of 2014–2016, allowing us to examine the impacts of this event on copepods in the region.
To represent taxa with different life histories and biogeographic affinities, we examined the abundance of three dominant taxa in the NEP: Neocalanus plumchrus, Calanus pacificus, and Oithona spp. N. plumchrus are large-bodied (3.0–4.5 mm) and lipid-rich, dominating the mesoplankton biomass in the spring and early summer (Batten et al., 2003b; Batten and Mackas, 2009; McKinstry and Campbell, 2018). C. pacificus are medium-sized (1.5–2.5 mm), and found throughout the NEP, and in mid to high latitudes (Coyle and Pinchuk, 2003, 2005; Lee et al., 2006; Liu and Hopcroft, 2007; Nuwer et al., 2008). Oithona spp. are smaller (∼1 mm) and occur from tropical to polar environments (Hansen et al., 2004; Madsen et al., 2008; Dvoretsky and Dvoretsky, 2009). C. pacificus and Oithona spp. contain modest lipid stores, yet are an important food resource for fish after N. plumchrus exit the surface waters in mid-summer to diapause at depth (Coyle and Pinchuk, 2003, 2005; Kobari et al., 2004; Hopcroft et al., 2005; Ward and Hirst, 2007). These taxa also have different thermal affinities, with N. plumchrus favoring generally cooler waters, C. pacificus favoring warm waters, and Oithona spp. being found at a wide range of temperatures (Kobari and Ikeda, 2001; Coyle and Pinchuk, 2003; Batten and Walne, 2011; Castellani et al., 2016). While C. pacificus and Oithona spp. may be resilient to changing ocean temperatures, N. plumchrus seasonal abundance is sensitive to warming. N. plumchrus biomass peaks appeared earlier in warmer years, and narrowed in width in 2000–2007, as compared to 1957–1965 (Mackas et al., 1998, 2007; Batten and Mackas, 2009). The mechanism for this shift is not well-known, though it is likely that warmer environmental temperatures play a role (Batten and Mackas, 2009).
Here, we investigate temperature associated changes in copepod occurrence and abundance by: (1) Examining the relationship between copepod occurrence and abundance and temperature in the NEP through the use of General Linear Models (GLM) and thermal threshold methods, (2) Identifying how copepod abundance varies in space by subdividing our study area, and characterizing regional thermal regimes, and (3) Demonstrating how copepod abundance varies in time, both across seasons and years in relation to temperature. We hypothesize that Neocalanus plumchrus occurrence and abundance will decrease with warming, Calanus pacificus occurrence and abundance will increase with warming, and Oithona spp. occurrence and abundance will show no significant relationship with temperature. Additionally, we hypothesize that warming will impact the phenology (timing of abundance) of N. plumchrus, resulting in earlier and more narrow abundance peaks in warmer years. Results from this study have implications for the effects of continuous warming and MHWs on zooplankton, and the future health of this biologically diverse and vital marine ecosystem.
Materials and Methods
Data
We obtained copepod data from the North Pacific CPR Survey (Batten et al., 2003a; Reid et al., 2003). The CPR was towed behind commercial ships at about 7 m of depth, and filtered plankton from the water through a band of 270 um mesh. The continuous mesh record was divided into discrete samples, each representing 18.5 km of each sampling voyage. Every fourth sample was microscopically processed to provide taxonomically-resolved abundance data for the zooplankton retained on the filtering mesh (CPR; Batten et al., 2003a; Reid et al., 2003).
The North Pacific CPR survey consists of transects that span the Gulf of Alaska (Figure 1). Sampling along these transects began in March 2000, and samples have been processed through 2016. The first transect is 2,200 km long, sampling from Juan de Fuca Strait to Cook Inlet, Alaska, monthly from approximately April to September. Prior to 2004 this transect began in California and ended at the entrance to Prince William Sound, Alaska. The second transect is 6,500 km long and samples from Juan de Fuca Strait to Asia, typically passing through the Aleutian Islands. This transect is sampled three times a year in the spring, summer, and fall. Additionally, we used data from a subregion where two CPR transects overlap that were sampled at a higher temporal resolution (nine samplings over a six-month period) in the eastern Gulf of Alaska (48N to 55N and 145W to 130W). These data were analyzed by Batten and Mackas (2009), and were updated here to include data through 2018. The higher resolution samples from this subregion facilitated our analysis of seasonal shifts in Neocalanus plumchrus abundance with warming.
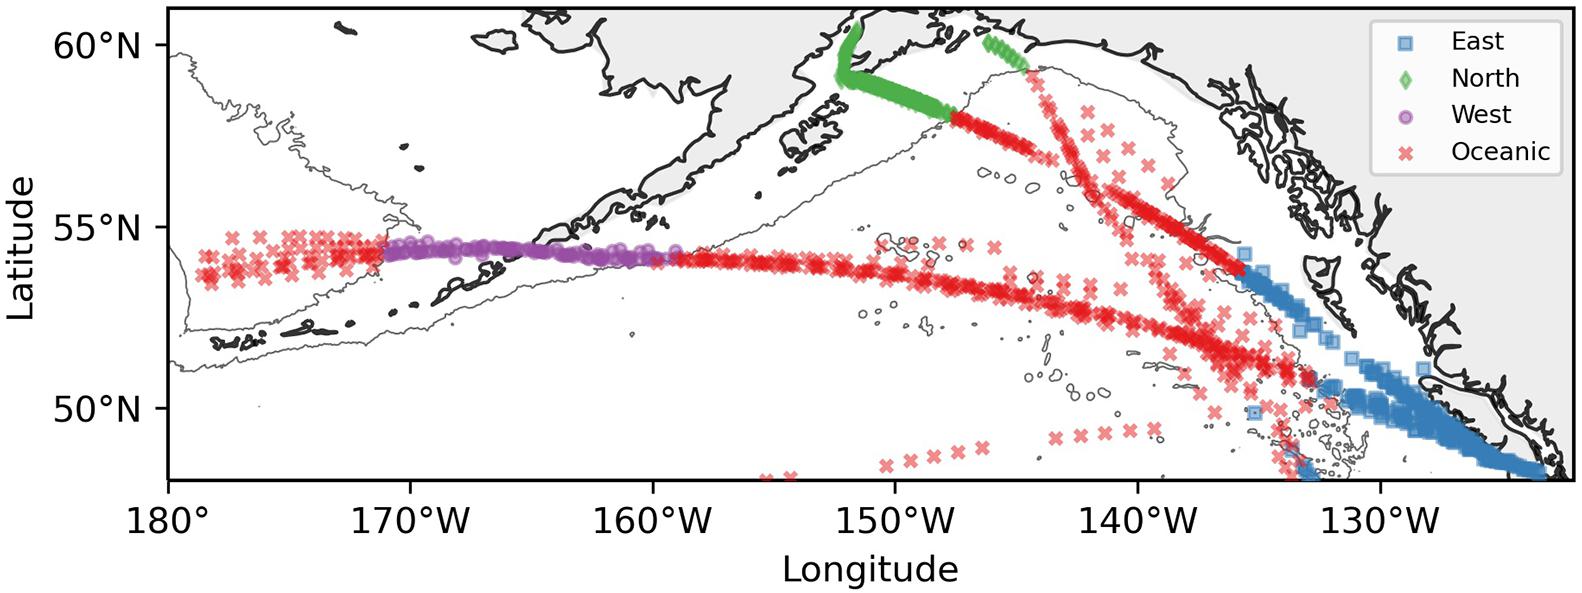
Figure 1. Map of the Gulf of Alaska and eastern Bering Sea with symbols representing locations of Continuous Plankton Recorder samples. Colors and symbols indicate region: eastern shelf/slope, northern shelf/slope, western shelf/slope, and oceanic. Shelf/slope regions include samples <3,000 m depth and oceanic regions include samples >3,000 m depth.
The plankton data were filtered to include only our three focal taxa: Neocalanus plumchrus, Calanus pacificus, and Oithona spp. Additionally, we filtered the data to include only samples from May through August, to capture warm months that may limit N. plumchrus occurrence and abundance.
Counts for Calanus pacificus and Oithona spp. were of late stage copepodites [Copepodite stage 5 (CV)] and adult copepods. However, Neocalanus plumchrus counts were only of CV copepodites, as adults are found exclusively in deep waters and are not sampled by the CPR (Batten et al., 2003b; Batten and Mackas, 2009).
Sea surface temperature (SST) data for this analysis came from two sources: the NASA Multi-Scale Ultra High Resolution SST dataset (JPL MUR MEaSUREs Project, 2015), and the Met Office Hadley Centre SST reanalysis dataset (HadISST 1, Rayner et al., 2003). MUR-SST merges multiple satellite datasets to obtain daily global SST at 1km resolution starting in 2002. The MUR-SST data was co-located with each CPR sample and averaged over a region of 0.5° for the 15 days prior to the sampling date. We used the MUR-SST data from May through August for GLM and thermal threshold analyses. The HadISST dataset provides global SST at 1° spatial resolution and monthly temporal resolution, with data available since the 1800’s. We used the HadISST dataset for our phenology and annual SST analyses because it spans a longer time frame, and Spearman’s correlation coefficient demonstrated that HadISST and MUR-SST are highly correlated (r = 0.96 at a 15-day resolution for MUR-SST, Supplementary Figure 1).
Bathymetric data to delimit regions were obtained from the ETOPO1 dataset, which has a 1 arc-minute resolution1. This dataset was also co-located with each CPR sample to determine which region each sample belonged to. The entire study region was then subdivided into four areas: three regions over the continental slope out to 3000 m depth and one oceanic region deeper than 3000 m. The shelf regions were divided into western (between −175W and −155W), northern (between −155W and −140W) and eastern regions (east of −136W). The continental shelf and slope are characterized by strong currents, with the meandering and ‘warm’ Alaska Coastal Current in the east, to the faster and narrower Alaska Stream in the north, and leading to the fast and cold current through the Unimak Pass into the Bering Sea in the west. The oceanic area has less water movement, as it is home to the Alaska Gyre and mesoscale eddies that are separate from the Alaska Coastal Current (Crawford et al., 2007; Henson and Thomas, 2008).
Modeling Abundance
To explore the relationship of copepod abundance to temperature, we log-transformed counts [log10(N + 1)], and performed a GLM (assuming normal distributions). We examined the relationships between taxon abundance and co-located MUR-SST, date, depth, and region. The Variance Inflation Factor was recorded for each model to identify the extent of multicollinearity in the data. While our emphasis is on the impact of temperature, date was included in the models because Neocalanus plumchrus are highly seasonal in their abundance. Additionally, region and depth were included due to the spatial heterogeneity of oceanographic characteristics in the study region. Regional definitions were the same as the ones used above (section “Data”). Water depth was defined as a binary variable, separating shelf/slope, and oceanic habitats as being less or greater than 3000 m of depth. The influence of two-way interaction terms was also explored in our models, when applicable.
To determine the impact of warm water years on Neocalanus plumchrus abundance, we used the marine heat wave of 2014–2016 as a natural experiment. This was done by categorizing years as marine heat wave years, or not, and running a one-way ANOVA to examine the effect of marine heat wave years on log10(N + 1) counts of N. plumchrus abundance.
Thermal Thresholds
Thermal thresholds were calculated by looking at rapid and large changes in occurrence and abundance with the co-located MUR-SST for each taxon (Carstensen et al., 2012). The temperature range was divided into 1°C bins, and for copepod data falling in each bin the we used two metrics: (i) percentage of occurrence relative to the total number of samples in the bin, and (ii) the 95th percentile of abundance. We used the 95th percentile for abundance because we were interested in how temperature limits occurrence and abundance, and because it summarized the shape of the distribution of the abundance data (Supplementary Figures 2–4). A cut-off of 20% of the maximum value of the abundance metric for all temperatures was designated as an effective lower limit. When the percent occurrence or the 95th percentile of abundance for a given temperature-bin crossed and stayed beyond this cut-off, we classified this point as the thermal threshold for that taxon. Thresholds were calculated across all regions, and also for each region separately. We also examined differences in thermal thresholds by month and depth. Additionally, regional HadISST time series data were analyzed to investigate how often upper thermal thresholds were crossed. This was done to indicate how often taxa were outside of their thermal threshold, allowing for the inference of potential impacts of warming to future copepod occurrence and abundance in this region.
Phenology of Neocalanus plumchrus With Temperature
As noted above, Neocalanus plumchrus are highly seasonal in surface waters. Additionally, data prior to 2009 indicate that peaks in N. plumchrus abundance narrowed and shifted earlier in warmer years (Mackas et al., 1998, 2007; Batten and Mackas, 2009). To identify if these shifts in phenology continued through 2018, changes in the timing and width of the N. plumchrus abundance peak were assessed. This was done by using the high temporal resolution data set described in section “Data”. The higher temporal resolution allowed for a more accurate depiction of the shape and timing of the abundance peak. Cumulative integration was performed through each year of the abundance vs. date curve. Abundance peak was taken to be the midpoint of the season, when the cumulative curve reached the 50th percentile. The cohort width was the number of days between the 25th and 75th percentile. These data were paired with annual mean HADISST and 1 year lagged annual mean HADISST to see the relationship between temperature and cohort width, and between temperature and the midpoint of the annual abundance peak (Batten and Mackas, 2009). This was done by running four separate linear models: one looking at the influence of annual SST on cohort width, one looking at the influence of lagged annual SST on cohort width, one looking at the influence of SST on abundance peak midpoint, and one looking at the influence of lagged annual SST on abundance peak midpoint. We examined annual 1 year lagged HadISST in addition to annual SST, because it was identified as the strongest determinant of cohort width and midpoint in Batten and Mackas (2009).
Results
Modeling Abundance
Neocalanus plumchrus abundance was best modeled by temperature, date, and water depth (Table 1). Increasing date and temperature reduced N. plumchrus abundance, and abundance was greater in oceanic habitats. In comparison, the best model for Calanus pacificus abundance included temperature and region as independent variables. C. pacificus abundance increased with increasing temperature, and the oceanic region had a higher abundance as compared to the shelf/slope regions in the east, north, and west. The best model for Oithona spp. abundance also included temperature and region as independent variables. Temperature was negatively related to Oithona spp. abundance, while the oceanic region had higher Oithona spp. abundance as compared to the eastern and northern regions. All models had relatively low explanatory power, with the model for N. plumchrus explaining the largest amount of variation in abundance, at 15%. The low explanatory power in these models is likely due to the large sample size and high variability in the data (Table 1).
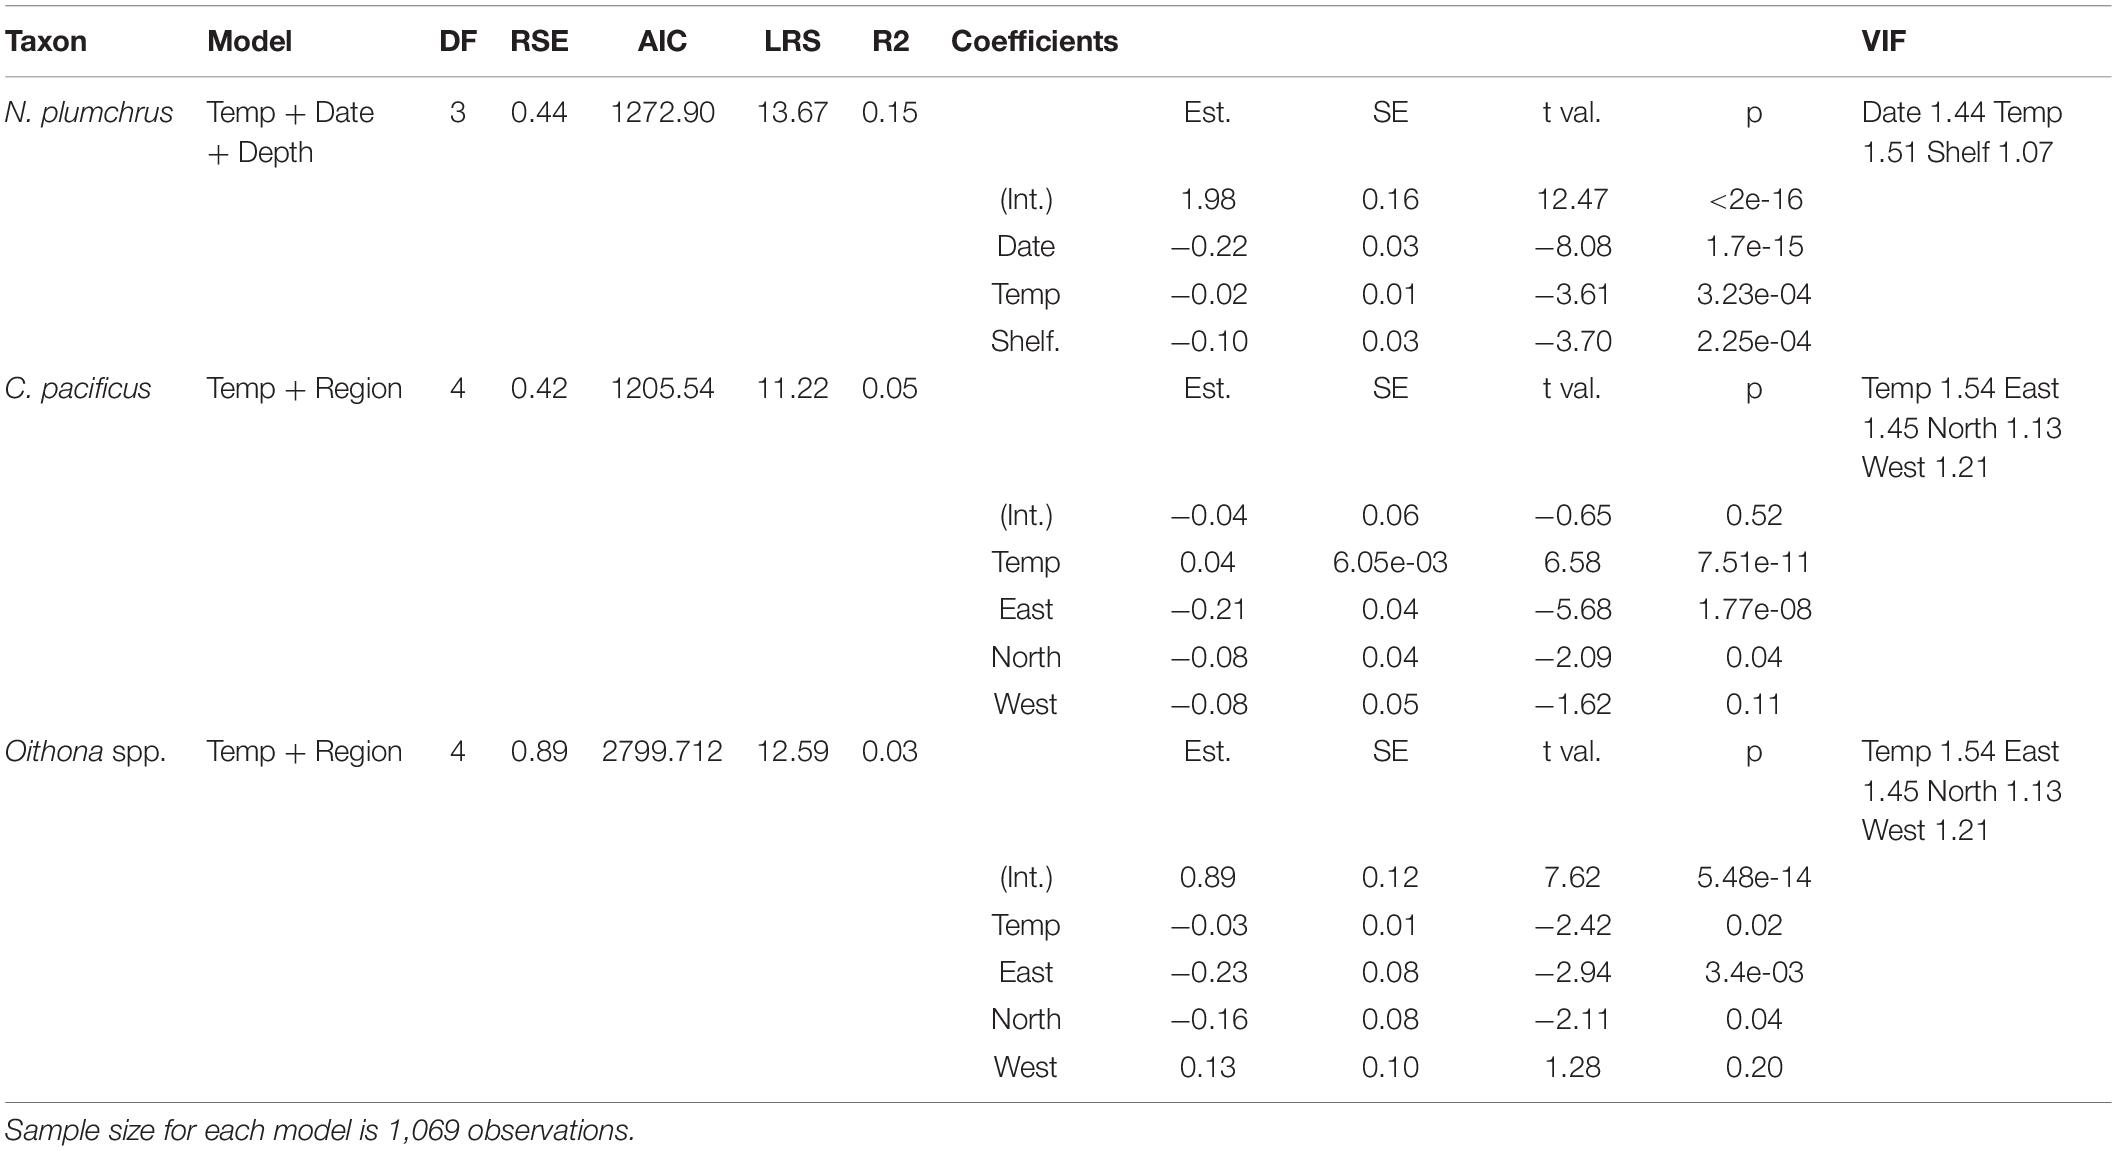
Table 1. Model selection for copepod abundance.
Results from our marine heat wave analysis demonstrated that Neocalanus plumchrus was less abundant during the 2014–2016 marine heat wave (p = 0.0006) (Supplementary Figure 5).
Thermal Thresholds
Neocalanus plumchrus was found at a range of temperatures from 3.68–12.99°C, with an upper-end abundance thermal threshold of 10.5°C (Figure 2), and an occurrence upper threshold of 11.5°C. Calanus pacificus was found at temperatures ranging from 4.25 to 15.56°C, with occurrence and abundance of C. pacificus showing a low-end thermal threshold of 7.5 and 8.5°C, respectively, (Figure 2). While C. pacificus abundance dipped below the 20% cut-off between 12 and 13°C, it did not have an upper thermal threshold (Figure 2) in this dataset. Oithona spp. was present at temperatures ranging from 3.68 to 15.66°C, with relatively low, but consistent occurrence across all temperatures (Figure 2). Oithona spp. abundance was variable, but overall lower for higher temperatures (Figure 2). While Oithona spp. abundance dipped below our 20% cut-off at 9.5°C and 12.5°C, it did not have an upper thermal threshold in this dataset. The profile of the 95th percentile of abundance with temperature was similar between shelf/slope and oceanic habitats for each taxon (Supplementary Figure 6). The 95th percentile of abundance did vary for taxa among regions (Supplementary Figure 7).
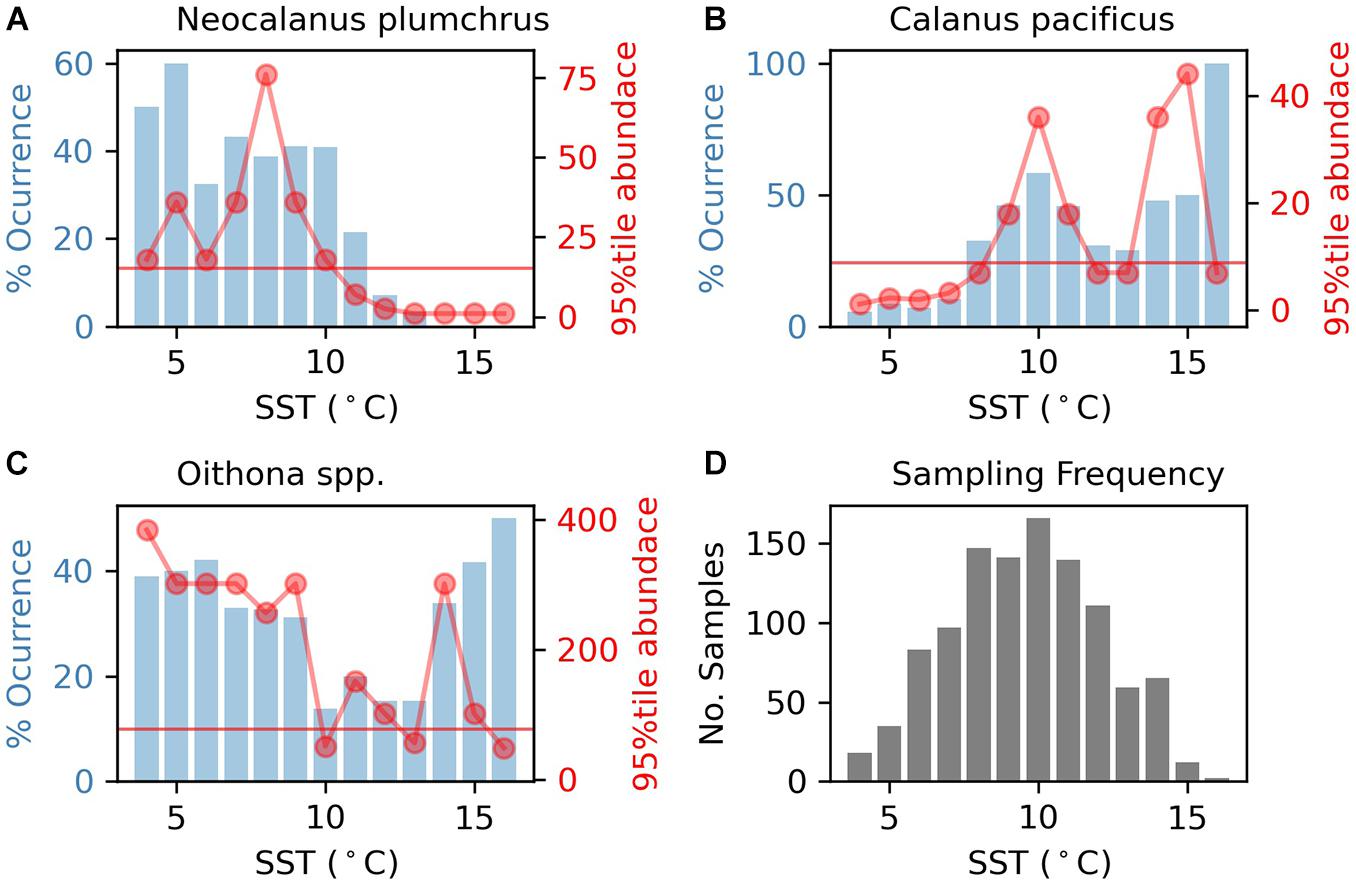
Figure 2. The blue bars represent taxon percent occurrence in samples. Red dots indicate the 95th percentile of taxon abundance. The horizontal line represents the thermal threshold based on the 95th percentile of abundance metric (20% of the maximum value of 95th percentile of abundance metric for the region). Percent occurrence and 95th percentile of abundance for each taxon are from the entire study region and span the entire seasonal period. All data are divided by 1°C SST (based on MUR-SST) bins. (A) Plot of Neocalanus plumchrus occurrence and abundance. (B) Plot of Calanus pacificus occurrence and abundance. (C) Plot of Oithona spp. occurrence and abundance. (D) Histogram of sample temperatures.
Interestingly, in years where mean temperature was above the regional thermal threshold, Neocalanus plumchrus had reduced mean abundance (Figure 3). These results corroborate our Marine Heat Wave analysis, by showing reduced N. plumchrus abundance during the Marine Heat Wave of 2014–2016. Thermal thresholds were relatively stable across months for N. plumchrus and Calanus pacificus (Supplementary Figures 8–11). Monthly changes in thermal thresholds revealed a dip in Oithona spp. abundance in July and August (Supplementary Figures 10, 11).
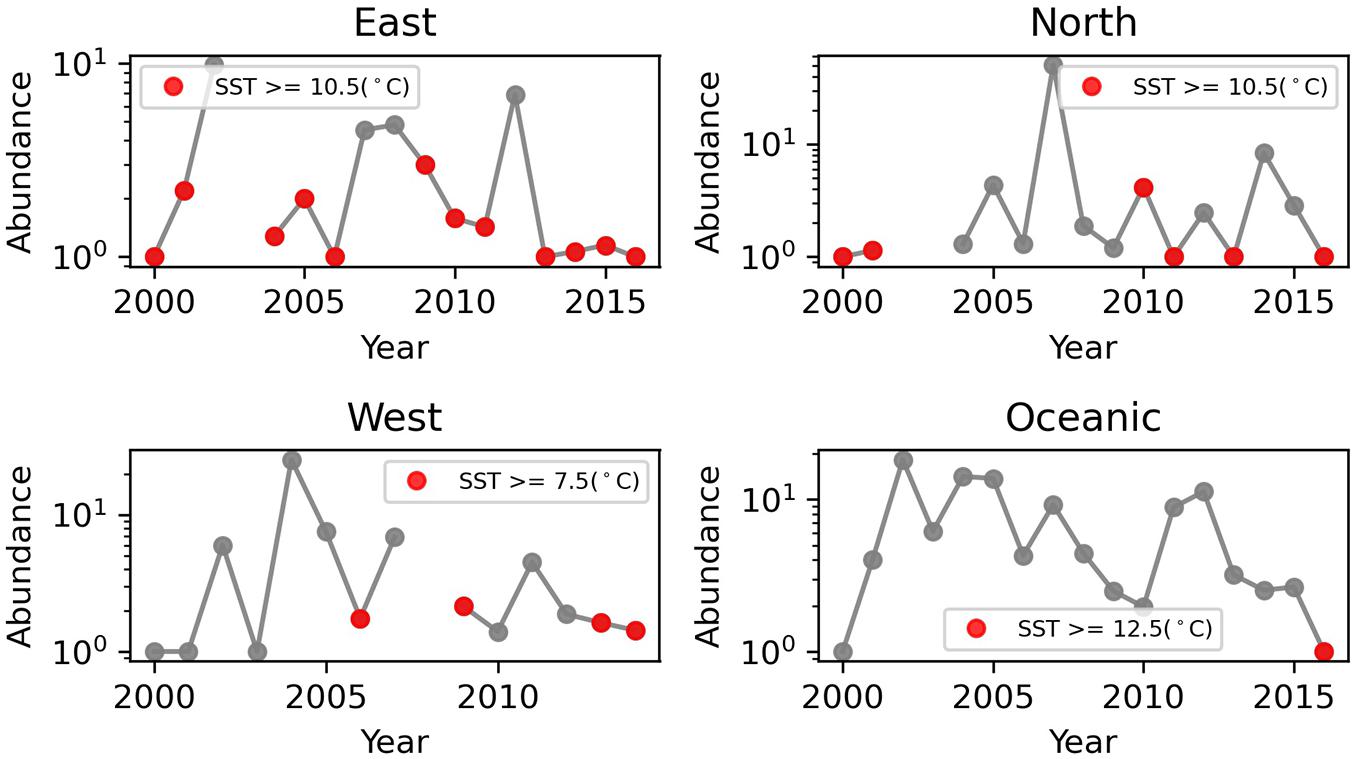
Figure 3. Annual mean Neocalanus plumchrus abundance plotted by region. Years where temperatures exceed regional thermal thresholds are marked in red.
Historical HadISST data demonstrated that temperatures in the eastern region rarely surpassed the 10.5°C Neocalanus plumchrus abundance threshold in May (Figure 4). However, temperatures in this region frequently exceeded the 10.5°C N. plumchrus abundance threshold and the 11.5°C N. plumchrus occurrence threshold in June. Temperatures in the eastern region were exclusively above both thresholds in July (Figure 4). In the northern, western, and oceanic regions temperatures never surpassed either thermal threshold in May. In June, the northern region rarely exceeded the 10.5°C abundance and 11.5°C occurrence thresholds, and the western and oceanic regions never exceeded these thresholds. Temperatures in the northern, and oceanic regions frequently surpassed both the 10.5°C abundance and 11.5°C occurrence threshold in July. However, temperatures in the western region rarely surpassed the 10.5°C abundance threshold in July.
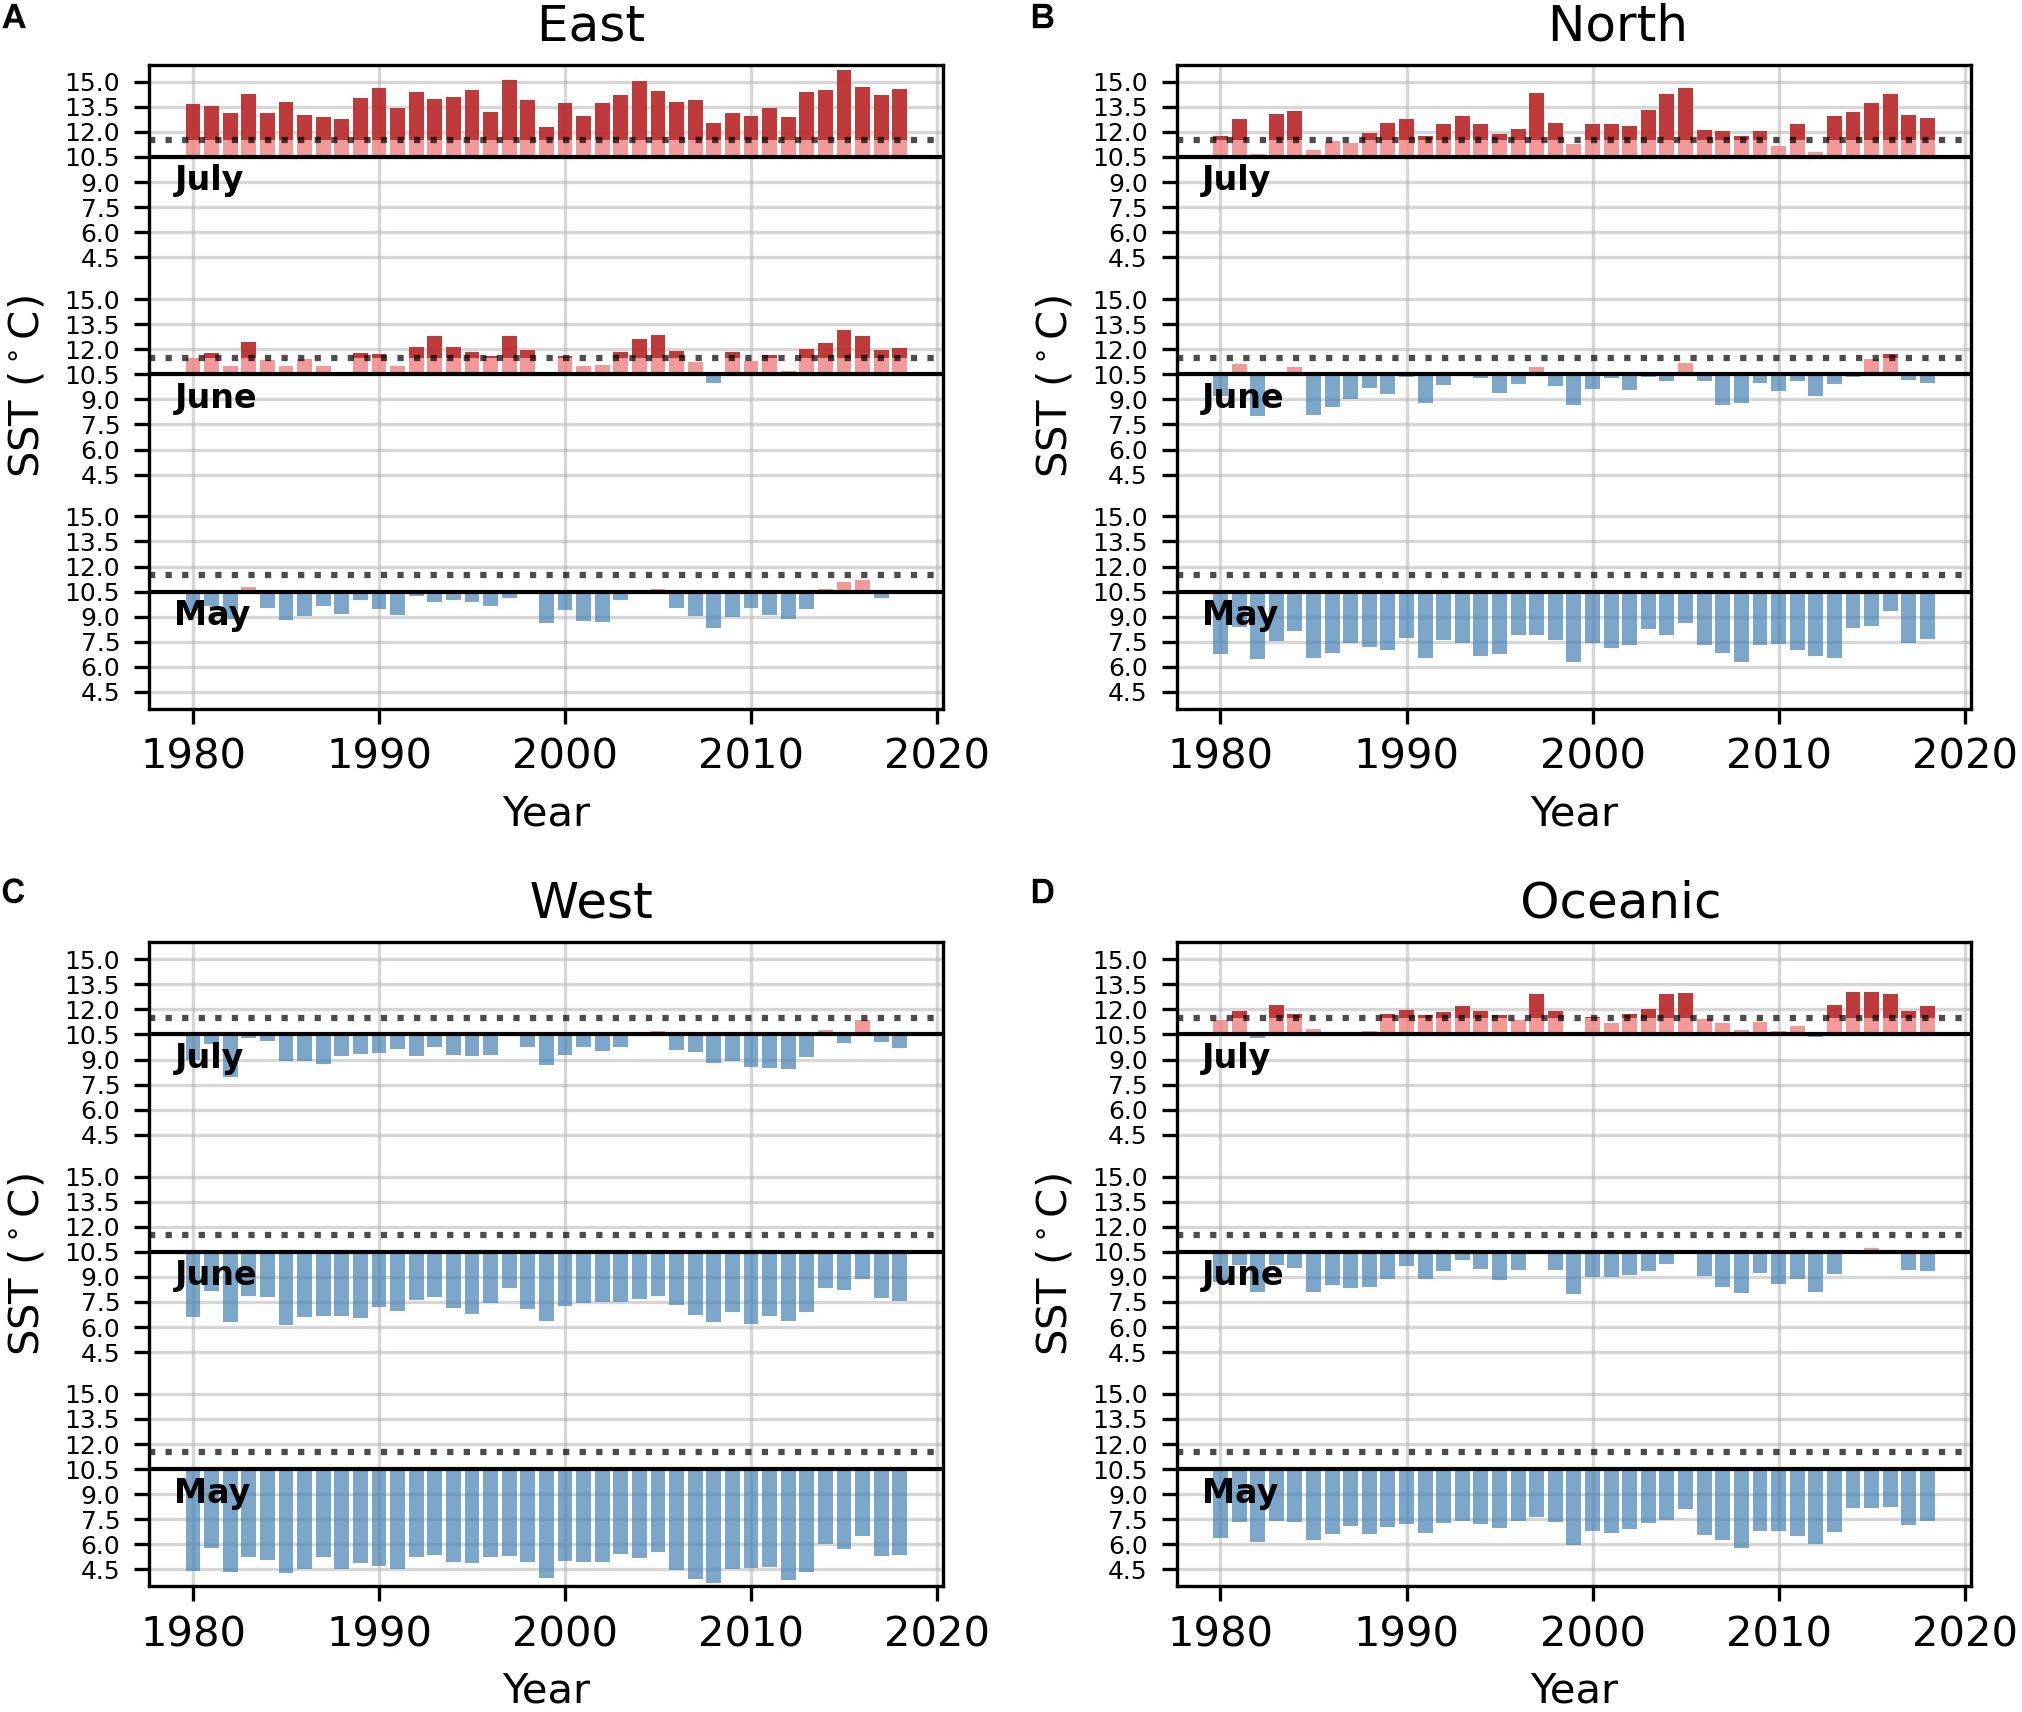
Figure 4. Monthly SST above (red) and below (blue) the 10.5°C threshold of abundance for Neocalanus plumchrus for the months of May, June, and July for each region. The horizontal dashed lines indicate 11.5°C threshold for occurrence. (A) Temperature plots for the eastern region. (B) Temperature plots for the northern region. (C) Temperature plots for the western region. (D) Temperature plots for the oceanic region.
Phenology of Neocalanus plumchrus With Warming
Our results supported those of Batten and Mackas (2009), with the midpoint of the Neocalanus plumchrus abundance peak appearing earlier in warmer years for both annual SST and 1 year lagged annual SST (p = 0.019 and p = 0.006, respectively) (Figure 5A). However, while Batten and Mackas (2009) saw a narrowing of cohort width, we did not find a significant relationship between annual mean SST or one-year lag mean HADISST and cohort width (p = 0.45 and p = 0.24, respectively) (Figure 5B). Interestingly our results show a more significant relationship between lagged annual mean SST than annual mean SST with no lag.
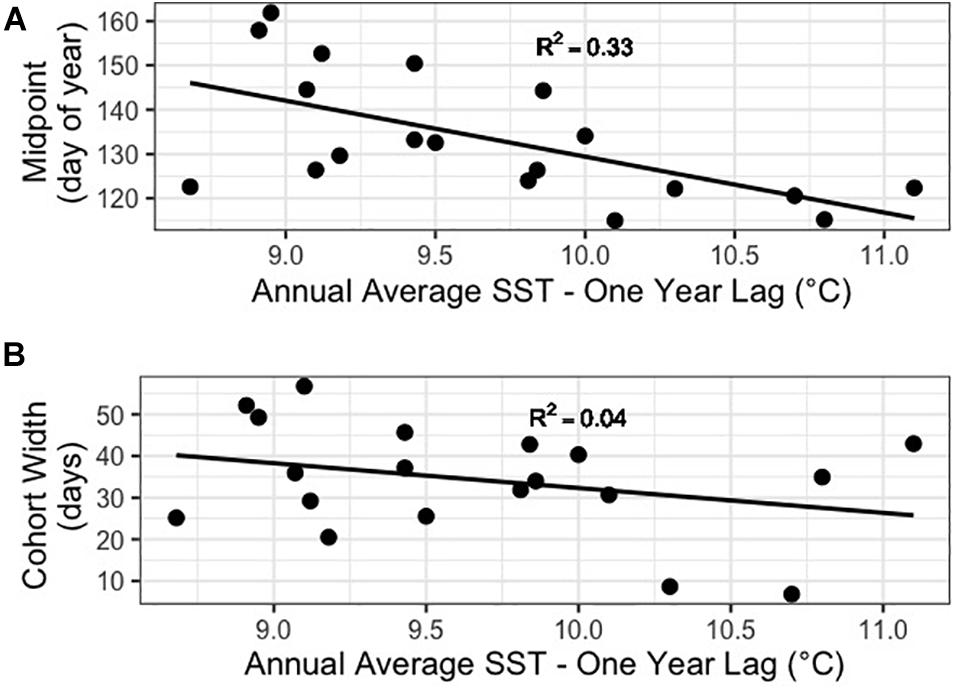
Figure 5. (A) Plot of cohort abundance midpoint against one-year lag mean HadISST. (B) Plot of cohort width against one-year lag mean HadISST.
Discussion
Results from our GLM and thermal threshold analyses supported hypotheses that Neocalanus plumchrus occurrence/abundance had a negative relationship, and Calanus pacificus occurrence/abundance had a positive relationship with temperature. However, our results did not support our hypothesis that Oithona spp. occurrence/abundance had no relationship with temperature, with Oithona spp. abundance decreasing with increasing temperatures. Importantly, results from our marine heat wave analysis indicated that N. plumchrus had reduced abundance during the marine heat wave of 2014–2016. Additionally, results from our N. plumchrus phenology analysis supported our hypothesis that warming affected the phenology of N. plumchrus. Overall, our results indicate that future warming may impact patterns of copepod occurrence/abundance, particularly for the subarctic-water favoring species N. plumchrus.
Modeling Occurrence and Abundance
Our GLM demonstrated that Neocalanus plumchrus abundance decreases with increasing temperature. Our analysis also showed a negative relationship between N. plumchrus abundance and date. This is in line with our hypothesis, as N. plumchrus has a strong seasonal expression in surface waters (Batten et al., 2003b; Batten and Mackas, 2009). We found that the N. plumchrus abundance increased with water depth. N. plumchrus is known to be a pelagic species that occupies areas off the shelf/slope (Mauchline, 1998). Therefore, it is not surprising that their occurrence increased with increasing water depth. Somewhat surprisingly, our results revealed that region did not explain any more of the variance in N. plumchrus abundance than water depth. Additionally, our marine heat wave and thermal threshold analyses demonstrated that N. plumchrus was less abundant in marine heat wave years (Figure 3 and Supplementary Figure 5). This aligns with our characterization of N. plumchrus as a cool water favoring species, and is supported by work done in the California Current demonstrating reductions in cool water favoring copepods during the 2014–2016 Marine Heatwave (Peterson et al., 2017). Together, this indicates that N. plumchrus and other cool water copepods may be vulnerable to increasing frequency and intensity of marine heat waves with warming.
While Oithona spp. abundance decreased with increasing temperature, Calanus pacificus abundance increased with increasing temperature. Neither C. pacificus or Oithona spp. had a significant relationship with date. However, region did add significant value to the models of C. pacificus and Oithona spp. abundance. Interestingly, C. pacificus had the highest abundance in the oceanic region, indicating that C. pacificus and Neocalanus plumchrus are both oceanic species. Oithona spp. also had increased abundance in the oceanic region.
It is important to note that our models explained only up to 15% of the variance in taxon abundance. Therefore, this analysis serves as an initial exploration of potential drivers of abundance, rather than a method for prediction. The low explanatory power of our models is primarily due to the very large sampling region and substantial variability observed in the data. The variability in this dataset may be related to patchiness in the spatial distribution of plankton (Mackas et al., 1985). There are other potential drivers of spatial variability that we did not examine, such as current patterns, primary production, and predator-prey dynamics (Mackas et al., 1985). While these other variables may contribute to patterns of abundance, we focused here on SST due to its importance in our study region, its ability to be accurately measured, and the direct and indirect effects it has on copepod abundance.
Thermal Thresholds and Implications for Climate Change
In support of our regression analyses, the thermal threshold analysis revealed an upper thermal threshold of 10.5°C for Neocalanus plumchrus abundance, and an upper threshold of 11.5°C for N. plumchrus occurrence. Our analysis demonstrated that thermal thresholds limit abundance, with years where mean temperature exceeded regional N. plumchrus thermal thresholds coinciding with reduced N. plumchrus abundance (Figure 3). Additionally, we found that temperatures in the eastern, northern, and oceanic regions regularly exceeded the occurrence and abundance thermal thresholds in months where N. plumchrus is known to occupy the surface waters (Figure 4). Together these results indicate that N. plumchrus may be vulnerable to continually warming water temperatures and future marine heatwaves. This potential vulnerability of N. plumchrus to warming is supported by other studies in the Northeast Pacific that have seen the loss of large lipid rich copepods with warming (Peterson et al., 2017).
Our threshold analysis revealed no upper thermal threshold for Calanus pacificus. This supports existing knowledge of C. pacificus as a warm water favoring species that has been shown to possess a positive relationship with temperature (Coyle and Pinchuk, 2003; Batten and Walne, 2011). Interestingly, there was a lower thermal threshold of occurrence at 7.5°C and abundance at 8.5°C. Regional climatology indicates that C. pacificus may appear earlier and in higher abundances in the western, northern, and oceanic regions with warming (Supplementary Figure 12). Our results align well with findings demonstrating increased abundances of C. pacificus in the Northeast Pacific in warm years associated with Marine Heat Waves (Peterson et al., 2017; Fisher et al., 2020). We did see a dip in abundance and occurrence for C. pacificus between temperatures 12–13°C. We hypothesize that this dip may correspond to the end of a first cohort and beginning of a second cohort in warmer shelf/slope regions in the north and the east (Supplementary Figure 3; Conover, 1988; Osgood and Frost, 1994).
Our thermal threshold analysis did not reveal any thresholds of occurrence or abundance for Oithona spp. This aligns well with the wide range of latitudes and temperatures that Oithona spp. is known to occupy (Ward and Hirst, 2007; Zamora-Terol et al., 2014; Castellani et al., 2016). There was a dip in abundance and occurrence between 10 and 13°C. This break in abundance may reflect reduced abundance values seen in July and August (Supplementary Figures 10, 11). Alternatively, gaps in abundance and occurrence could correspond with differing species within the Oithona genus. Data from our study region demonstrates that species O. similis dominates the water column at >50% abundance (Pers.Comm. Moira Galbraith). However, O. atlantica, O. setigera, and O. tenuis are also found in our study region (Pers.Comm. Moira Galbraith).
While warming temperatures may not limit Calanus pacificus and Oithona spp. occurrence or abundance, the vulnerability of Neocalanus plumchrus to warming could have dire consequences. N. plumchrus are a vital source of nutrient dense biomass that cannot be supplemented by smaller warm water species, such as C. pacificus or Oithona spp. (Mackas et al., 1998; Evanson et al., 2000; Batten et al., 2003b; Batten and Mackas, 2009; Cavole et al., 2016; McKinstry and Campbell, 2018). This is particularly concerning for the economically and culturally important fish, marine mammals, and seabirds that rely on N. plumchrus as a food source (Kawamura and Hirano, 1985; Mackas et al., 1998; McKinstry and Campbell, 2018).
Phenology of Neocalanus plumchrus With Warming
Our results demonstrated that the seasonal surface appearance of Neocalanus plumchrus was earlier with warmer temperatures. These results corroborate previous work demonstrating earlier shifts in the abundance peak of N. plumchrus (Batten and Mackas, 2009). Bertram et al. (2001) linked warm spring water temperatures, and the earlier appearance of copepods, with reduced reproductive success in Cassin’s auklet. With continued warming, we could see additional impacts of these seasonal shifts in abundance on upper trophic levels that rely on N. plumchrus as a primary food source. Unlike Batten and Mackas (2009), we did not see a statistically significant effect of temperature on cohort width in the longer time series examined here. However, with further temperature increases in this region there may be a stronger influence of temperature on cohort width in the future. Alternatively, there may be a limit to how narrow a cohort can be, or a limit to our power to detect changes in cohort width with our current sampling resolution.
Interestingly, we found 1 year lagged annual mean SST to be a stronger driver of abundance midpoint than annual mean SST. While same year mean SST influences the developmental time and time spent at the surface accumulating lipids for the current cohort, lagged annual mean SST reflects lipid stores and potential reproductive timing and success of adults that found the next generation. We hypothesize that temperatures experienced by the previous cohort have a stronger influence than temperatures experienced by earlier developmental stages of the same cohort due to the life history strategy of Neocalanus plumchrus. Sub-adult (copepodite stage V) and adult N. plumchrus spend the majority of time at depth, with only early to mid-copepodite stages occurring at the surface and experiencing the temperatures there (Batten and Mackas, 2009). At depth, animals are buffered from surface temperatures. Therefore, the temperatures and surface conditions experienced by copepodites of the previous annual cohort are likely to have a stronger impact on seasonal abundance timing of the next generation.
Conclusion
Here, we demonstrated that a critical species in the trophic and ecosystem dynamics of the Northeast Pacific, Neocalanus plumchrus, is vulnerable to continued warming of the oceans due to anthropogenic climate change. This is of particular concern in our region of study, because of the recent history of intense marine heat waves, and the trophic dominance and nutritional importance of this species. Our results indicate that with increasing temperatures, N. plumchrus biomass may decline and there may be changes in their phenology, which could impact fish, marine mammals, and seabirds that rely on N. plumchrus as a food resource.
Future research should be aimed at better understanding the thermal tolerance of this important species and the direct versus indirect effects of temperature. Acclimating Neocalanus plumchrus to a range of temperatures and assessing their upper thermal limits would provide valuable information regarding the isolated effect temperature has on survival and performance. In addition, it would be of great value to understand the capacity of N. plumchrus to adapt in response to warming in the Northeast Pacific. This would provide critical information regarding the potential of N. plumchrus to respond to and persist despite rapidly changing ocean conditions.
Data Availability Statement
The data and code underlying this study have been made available on GitHub: https://github.com/farallon-institute/ThermalPatterns_Copepods_NorthEastPacific.
Author Contributions
LA wrote the manuscript text. LA, MG-R, and WS designed the experiment. LA and MG-R made the manuscript figures. WS assisted with statistical analyses. SB provided and advised on plankton data and helped write sections on phenology of Neocalanus plumchrus with temperature. MG-R and CG processed satellite temperature data. All authors contributed to the article and approved the submitted version.
Funding
LA was funded by NSF-NRT QuEST program and the University of Vermont Biology Department (Grant # 1735316). MG-R, WS, and CG were funded by NASA’s Life in the Moving Oceans Initiative (Award # 80NSSC17K0557). The North Pacific CPR survey is supported by a consortium that includes the North Pacific Research Board, Exxon Valdez Oil Spill Trustee Council, Fisheries and Oceans Canada, Marine Biological Association of the United Kingdom, and the North Pacific Marine Science Organization (PICES).
Conflict of Interest
The authors declare that the research was conducted in the absence of any commercial or financial relationships that could be construed as a potential conflict of interest.
Publisher’s Note
All claims expressed in this article are solely those of the authors and do not necessarily represent those of their affiliated organizations, or those of the publisher, the editors and the reviewers. Any product that may be evaluated in this article, or claim that may be made by its manufacturer, is not guaranteed or endorsed by the publisher.
Acknowledgments
We thank past and present members of the CPR program for processing the taxonomic data used in this study, as well as the many volunteer vessels and crews that towed CPR device. We thank Moira Galbraith for data on Oithona spp. We thank Zoe Burr and Brian Hoover for conversations that moved the progress of this manuscript forward. We also thank Brian Hoover and Caitlin Kroeger for helpful edits of the manuscript.
Supplementary Material
The Supplementary Material for this article can be found online at: https://www.frontiersin.org/articles/10.3389/fmars.2021.670795/full#supplementary-material
Footnotes
References
Amaya, D. J., Miller, A. J., Xie, S. P., and Kosaka, Y. (2020). Physical drivers of the summer 2019 North Pacific marine heatwave. Nat. Commun. 11:1903.
Batten, S. D., Clark, R., Flinkman, J., Hays, G. C., John, E., John, A. W. G., et al. (2003a). CPR sampling: the technical background, materials and methods, consistency and comparability. Prog. Oceanogr. 58, 193–215. doi: 10.1016/j.pocean.2003.08.004
Batten, S. D., Hyrenbach, K. D., Sydeman, W. J., Morgan, K. H., Henry, M. F., Yen, P. P. Y., et al. (2006). Characterising meso-marine ecosystems of the North Pacific. Deep Sea Res. Part II Top. Stud. Oceanogr. 53, 270–290. doi: 10.1016/j.dsr2.2006.01.004
Batten, S. D., and Mackas, D. L. (2009). Shortened duration of the annual Neocalanus plumchrus biomass peak in the Northeast Pacific. Mar. Ecol. Prog. Ser. 393, 189–198. doi: 10.3354/meps08044
Batten, S. D., and Walne, A. W. (2011). Variability in northwards extension of warm water copepods in the NE Pacific. J. Plankton Res. 33, 1643–1653. doi: 10.1093/plankt/fbr065
Batten, S. D., Welch, D. W., and Jonas, T. (2003b). Latitudinal differences in the duration of development of Neocalanus plumchrus copepodites. Fish. Oceanogr. 12, 201–208. doi: 10.1046/j.1365-2419.2003.00233.x
Benson, A. J., and Trites, A. W. (2002). Ecological effects of regime shifts in the Bering Sea and eastern North Pacific Ocean. Fish Fish. 3, 95–113. doi: 10.1046/j.1467-2979.2002.00078.x
Bertram, D. F., Mackas, D. L., and McKinnell, S. M. (2001). The seasonal cycle revisited: interannual variation and ecosystem consequences. textitProgress in Oceanography Jan 49, 283–307.
Carstensen, J., Weydmann, A., Olszewska, A., and Kwasniewski, S. (2012). Effects of environmental conditions on the biomass of Calanus spp. in the Nordic Seas. J. Plankton Res. 34, 951–966. doi: 10.1093/plankt/fbs059
Castellani, C., Licandro, P., Fileman, E., Di Capua, I., and Mazzocchi, M. G. (2016). Oithona similis likes it cool: evidence from two long-term time series. J. Plankton Res. 38, 703–717. doi: 10.1093/plankt/fbv104
Cavole, L. M., Demko, A. M., Diner, R. E., Giddings, A., Koester, I., Pagniello, C., et al. (2016). Biological impacts of the 2013-2015 warm-water anomaly in the Northeast Pacific. Oceanography 29, 273–285.
Conover, R. J. (1988). Comparative life histories in the genera Calanus and Neocalanus in high latitudes of the northern hemisphere. Hydrobiologia 167, 127–142. doi: 10.1007/978-94-009-3103-9_11
Coyle, K. O., and Pinchuk, A. I. (2003). Annual cycle of zooplankton abundance, biomass and production on the northern Gulf of Alaska shelf, October 1997 through October 2000. Fish. Oceanogr. 12, 327–338. doi: 10.1046/j.1365-2419.2003.00256.x
Coyle, K. O., and Pinchuk, A. I. (2005). Seasonal cross-shelf distribution of major zooplankton taxa on the northern Gulf of Alaska shelf relative to water mass properties, species depth preferences and vertical migration behavior. Deep Sea Res. Part II Top. Stud. Oceanogr. 52, 217–245. doi: 10.1016/j.dsr2.2004.09.025
Crawford, W. R., Brickley, P. J., and Thomas, A. C. (2007). Mesoscale eddies dominate surface phytoplankton in northern Gulf of Alaska. Prog. Oceanogr. 75, 287–303. doi: 10.1016/j.pocean.2007.08.016
Di Lorenzo, E., and Mantua, N. (2016). Multi-year persistence of the 2014/15 North Pacific marine heatwave. Nat. Clim. Change 6, 1042–1047. doi: 10.1038/nclimate3082
Dvoretsky, V. G., and Dvoretsky, A. G. (2009). Life cycle of Oithona similis (Copepoda: Cyclopoida) in Kola Bay (Barents Sea). Mar. Biol. 156, 1433–1446. doi: 10.1007/s00227-009-1183-4
Evanson, M., Bornhold, E. A., Goldblatt, R. H., Harrison, P. J., and Lewis, A. G. (2000). Temporal variation in body composition and lipid storage of the overwintering, subarctic copepod Neocalanus plumchrus in the Strait of Georgia, British Columbia (Canada). Mar. Ecol. Prog. Ser. 192, 239–247. doi: 10.3354/meps192239
Fisher, J., Kimmel, D., Ross, T., Batten, S., Bjorkstedt, E., Galbraith, M., et al. (2020). Copepod Responses to, and Recovery From, the Recent Marine Heatwave in the NE Pacific. PICES Press. 28, 65–71.
Frolicher, T. L., Fischer, E. M., and Gruber, N. (2018). Marine heatwaves under global warming. Nature 560, 360–364. doi: 10.1038/s41586-018-0383-9
Hansen, F. C., Mollmann, C., Schutz, U., and Hinrichsen, H. H. (2004). Spatio-temporal distribution of Oithona similis in the Bornholm Basin (Central Baltic Sea). J. Plankton Res. 26, 659–668. doi: 10.1093/plankt/fbh061
Henson, S. A., and Thomas, A. C. (2008). A census of oceanic anticyclonic eddies in the Gulf of Alaska. Deep Sea Res. Part I Oceanogr. Res. Pap. 55, 163–176. doi: 10.1016/j.dsr.2007.11.005
Hill, D. F., Bruhis, N., Calos, S. E., Arendt, A., and Beamer, J. (2015). Spatial and temporal variability of freshwater discharge into the Gulf of Alaska. J. Geophys. Res. Oceans 120, 634–646. doi: 10.1002/2014jc010395
Hopcroft, R. R., Clarke, C., Nelson, R. J., and Raskoff, K. A. (2005). Zooplankton communities of the Arctic’s Canada Basin: the contribution by smaller taxa. Polar Biol. 28, 198–206. doi: 10.1007/s00300-004-0680-7
Janout, M. A., Weingartner, T. J., Royer, T. C., and Danielson, S. L. (2010). On the nature of winter cooling and the recent temperature shift on the northern Gulf of Alaska shelf. J. Geophys. Res. Oceans 115:5023.
Johnstone, J. A., and Mantua, N. J. (2014). Atmospheric controls on northeast Pacific temperature variability and change, 1900-2012. Proc. Natl. Acad. Sci. U. S. A. 111, 14360–14365. doi: 10.1073/pnas.1318371111
JPL MUR MEaSUREs Project (2015). GHRSST Level 4 MUR Global Foundation Sea Surface Temperature Analysis (v4.1). Ver. 4.1. PO.DAAC, CA, USA. Available online at: https://doi.org/10.5067/GHGMR-4FJ04 (accessed August, 2020)
Kawamura, A., and Hirano, K. (1985). The spatial scale of surface warms of Calanus plumchrus Marukawa observed from consecutive plankton net catches in the northwestern north pacific. Bull. Mar. Sci. 37, 626–633.
Kelly, M. W., Sanford, E., and Grosberg, R. K. (2012). Limited potential for adaptation to climate change in a broadly distributed marine crustacean. Proc. R. Soc. B Biol. Sci. 279, 349–356. doi: 10.1098/rspb.2011.0542
Kobari, T., and Ikeda, T. (2001). Ontogenetic vertical migration and life cycle of Neocalanus plumchrus (Crustacea: Copepoda) in the Oyashio region, with notes on regional variations in body sizes. J. Plankton Res. 23, 287–302. doi: 10.1093/plankt/23.3.287
Kobari, T., Nagaki, T., and Takahashi, K. (2004). Seasonal changes in abundance and development of Calanus pacificus (Crustacea: Copepoda) in the Oyashio-Kuroshio Mixed Region. Mar. Biol. 144, 713–721. doi: 10.1007/s00227-003-1244-z
Lee, R. F., Hagen, W., and Kattner, G. (2006). Lipid storage in marine zooplankton. Mar. Ecol. Prog. Ser. 307, 273–306. doi: 10.3354/meps307273
Liu, H., and Hopcroft, R. R. (2007). A comparison of seasonal growth and development of the copepods Calanus marshallae and C-pacificus in the northern Gulf of Alaska. J. Plankton Res. 29, 569–581. doi: 10.1093/plankt/fbm039
Mackas, D. L., Batten, S., and Trudel, M. (2007). Effects on zooplankton of a warmer ocean: recent evidence from the Northeast Pacific. Prog. Oceanogr. 75, 223–252. doi: 10.1016/j.pocean.2007.08.010
Mackas, D. L., Denman, K. L., and Abbott, M. R. (1985). Plankton patchiness – biology in the physical vernacular. Bull. Mar. Sci. 37, 652–674.
Mackas, D. L., Goldblatt, R., and Lewis, A. G. (1998). Interdecadal variation in developmental timing of Neocalanus plumchrus populations at Ocean Station P in the subarctic North Pacific. Can. J. Fish. Aquat. Sci. 55, 1878–1893. doi: 10.1139/f98-080
Madsen, S. D., Nielsen, T. G., and Hansen, B. W. (2008). Annual population development and production by small copepods in Disko Bay, western Greenland. Mar. Biol. 155, 63–77. doi: 10.1007/s00227-008-1007-y
McKinstry, C. A. E., and Campbell, R. W. (2018). Seasonal variation of zooplankton abundance and community structure in Prince William Sound, Alaska, 2009-2016. Deep Sea Res. Part II Top. Stud. Oceanogr. 147, 69–78. doi: 10.1016/j.dsr2.2017.08.016
Nuwer, M., Frost, B., and Armbrust, E. V. (2008). Population structure of the planktonic copepod Calanus pacificus in the North Pacific Ocean. Mar. Biol. 156, 107–115. doi: 10.1007/s00227-008-1068-y
Oliver, E. C. J., Donat, M. G., Burrows, M. T., Moore, P. J., Smale, D. A., Alexander, L. V., et al. (2018). Longer and more frequent marine heatwaves over the past century. Nat. Commun. 9:1324.
Osgood, K. E., and Frost, B. W. (1994). Comparative life histories of 3 species of planktonic calanoid copepods in Dabob bay, Washington. Mar. Biol. 118, 627–636. doi: 10.1007/bf00347510
Peña, M. A., Nemcek, N., and Robert, M. (2019). Phytoplankton responses to the 2014-2016 warming anomaly in the northeast subarctic Pacific Ocean. Limnol. Oceanogr. 64, 515–525. doi: 10.1002/lno.11056
Pereira, R. J., Sasaki, M. C., and Burton, R. S. (2017). Adaptation to a latitudinal thermal gradient within a widespread copepod species: the contributions of genetic divergence and phenotypic plasticity. Proc. R. Soc. B Biol. Sci. 284:20170236. doi: 10.1098/rspb.2017.0236
Peterson, W. T., Fisher, J. L., Strub, P. T., Du, X., Risien, C., Peterson, J., et al. (2017). The pelagic ecosystem in the Northern California Current off Oregon during the 2014–2016 warm anomalies within the context of the past 20 years. J. Geophys. Res. Oceans 122, 7267–7290. doi: 10.1002/2017jc012952
Piatt, J. F., Parrish, J. K., Renner, H. M., Schoen, S. K., Jones, T. T., Arimitsu, M. L., et al. (2020). Extreme mortality and reproductive failure of common murres resulting from the northeast Pacific marine heatwave of 2014-2016. PLoS One 15:e0226087. doi: 10.1371/journal.pone.0226087
Rayner, N. A., Parker, D. E., Horton, E. B., Folland, C. K., Alexander, L. V., Rowell, D. P., et al. (2003). Global analyses of sea surface temperature, sea ice, and night marine air temperature since the late nineteenth century. J. Geophys. Res. Atmos. 108:D14.
Reid, P. C., Colebrook, J. M., Matthews, J. B. L., and Aiken, J., Continuous Plankton Recorder Team (2003). The continuous plankton recorder: concepts and history, from plankton indicator to undulating recorders. Prog. Oceanogr. 58, 117–173. doi: 10.1016/j.pocean.2003.08.002
Sasaki, M. C., and Dam, H. G. (2019). Integrating patterns of thermal tolerance and phenotypic plasticity with population genetics to improve understanding of vulnerability to warming in a widespread copepod. Glob. Change Biol. 25, 4147–4164. doi: 10.1111/gcb.14811
Scheffers, B. R., De Meester, L., Bridge, T. C. L., Hoffmann, A. A., Pandolfi, J. M., Corlett, R. T., et al. (2016). The broad footprint of climate change from genes to biomes to people. Science 354:aaf7671.
Sousa, L., Coyle, K. O., Barry, R. P., Weingartner, T. J., and Hoperoft, R. R. (2016). Climate-related variability in abundance of mesozooplankton in the northern Gulf of Alaska 1998-2009. Deep Sea Res. Part II Top. Stud. Oceanogr. 132, 122–135. doi: 10.1016/j.dsr2.2016.04.006
Ward, P., and Hirst, A. G. (2007). Oithona similis in a high latitude ecosystem: abundance, distribution and temperature limitation of fecundity rates in a sac spawning copepod. Mar. Biol. 151, 1099–1110. doi: 10.1007/s00227-006-0548-1
Weingartner, T. J., Coyle, K., Finney, B., Hopcroft, R., Whitledge, T., Brodeur, R., et al. (2002). The northeast Pacific GLOBEC program: coastal Gulf of Alaska. Oceanography 15, 48–63. doi: 10.5670/oceanog.2002.21
Yang, B., Emerson, S. R., and Pena, M. A. (2018). The effect of the 2013-2016 high temperature anomaly in the subarctic Northeast Pacific (the “Blob”) on net community production. Biogeosciences 15, 6747–6759. doi: 10.5194/bg-15-6747-2018
Keywords: copepod, thermal threshold, in situ data, Continuous Plankton Recorder, marine heat wave, phenology, climate change, Northeast Pacific
Citation: Ashlock L, García-Reyes M, Gentemann C, Batten S and Sydeman W (2021) Temperature and Patterns of Occurrence and Abundance of Key Copepod Taxa in the Northeast Pacific. Front. Mar. Sci. 8:670795. doi: 10.3389/fmars.2021.670795
Received: 22 February 2021; Accepted: 16 August 2021;
Published: 07 September 2021.
Edited by:
Priscilla Licandro, Stazione Zoologica Anton Dohrn, ItalyReviewed by:
Erica Jane Howard Head, Department of Fisheries and Oceans (Canada), CanadaJan Marcin Weslawski, Institute of Oceanology, Polish Academy of Sciences, Poland
Copyright © 2021 Ashlock, García-Reyes, Gentemann, Batten and Sydeman. This is an open-access article distributed under the terms of the Creative Commons Attribution License (CC BY). The use, distribution or reproduction in other forums is permitted, provided the original author(s) and the copyright owner(s) are credited and that the original publication in this journal is cited, in accordance with accepted academic practice. No use, distribution or reproduction is permitted which does not comply with these terms.
*Correspondence: Lauren Ashlock, TGF1cmVuLkFzaGxvY2tAdXZtLmVkdQ==