 Kristen L. Omori
 Cindy A. Tribuzio2
 Elizabeth A. Babcock
- 1Department of Fisheries Science, Virginia Institute of Marine Science, William & Mary, Gloucester Point, VA, United States
- 2Auke Bay Laboratories, Alaska Fisheries Science Center, National Marine Fisheries Service, National Oceanic and Atmospheric Administration, Juneau, AK, United States
- 3Department of Marine Biology and Ecology, Rosenstiel School of Marine and Atmospheric Sciences, University of Miami, Miami, FL, United States
International and national laws governing the management of living marine resources generally require specification of harvest limits. To assist with the management of data-limited species, stocks are often grouped into complexes and assessed and managed as a single unit. The species that comprise a complex should have similar life history, susceptibility to the fishing gear, and spatial distribution, such that common management measures will likely lead to sustainable harvest of all species in the complex. However, forming complexes to meet these standards is difficult due to the lack of basic biological or fisheries data to inform estimates of biological vulnerability and fishery susceptibility. A variety of cluster and ordination techniques are applied to bycatch rockfish species in the Gulf of Alaska (GOA) as a case study to demonstrate how groupings may differ based on the multivariate techniques used and the availability and reliability of life history, fishery independent survey, and fishery catch data. For GOA rockfish, our results demonstrate that fishing gear primarily defined differences in species composition, and we suggest that these species be grouped by susceptibility to the main fishing gears while monitoring those species with high vulnerabilities to overfishing. Current GOA rockfish complex delineations (i.e., Other Rockfish and Demersal Shelf Rockfish) are consistent with the results of this study, but should be expanded across the entire GOA. Differences observed across species groupings for the variety of data types and multivariate approaches utilized demonstrate the importance of exploring a diversity of methods. As best practice in identifying species complexes, we suggest using a productivity-susceptibility analysis or expert judgment to begin groupings. Then a variety of multivariate techniques and data sources should be used to identify complexes, while balancing an appropriate number of manageable groups. Thus, optimal species complex groupings should be determined by commonality and consistency among a variety of multivariate methods and datasets.
Introduction
The requirement to implement catch limits for data-limited and previously unassessed stocks resulting from recent international policies, such as the Magnuson-Stevens Reauthorization Act of 2006 (MSRA, 2007) and Common Fisheries Policy (CFP, 2013), presents scientific and management challenges for regional fishery management entities. Managing an aggregation of fish stocks or species as a single unit is one approach utilized by fisheries managers in an attempt to comply with international and federal laws (Jiao et al., 2009), reduce the number of required stock assessments (Koutsidi et al., 2016), and create manageable harvest regulations. These aggregations, also known as stock or species complexes, are often determined by similarity in life history characteristics, vulnerability to the fishery, and geographic distributions (USOFR, 2009). Multiple stocks of a single species being managed together are likely to have strong similarities in life history and susceptibility, whereas complexes consisting of multiple species have more diverging characteristics in productivity (i.e., life history traits), behavior, and habitat preference. Species in a complex are typically caught in a multispecies fishery and often lack adequate data for a single species assessment (USOFR, 2009).
Assigning species to complexes can be a difficult, but critical task for implementing sustainable management of data-limited species. Complexes are often formed using a combination of life history traits, trophic roles, and fishing pressure (Shertzer and Williams, 2008). However, rarely is the full extent of this information available to adequately determine the appropriateness of a complex grouping, and there can be a mismatch in groupings when using life history traits compared to fishery susceptibility (i.e., species caught together by the same gear types). Grouping species based on life history characteristics, which represent the population’s productivity, is important because species with similar growth and maturity often demonstrate similar responses to fishing pressure (e.g., Farmer et al., 2016; DeMartini, 2019). From a management perspective, grouping by susceptibility to fishing gear (e.g., multispecies fisheries) is often simpler than grouping by life history traits, because management by gear type is less easily enforceable for complexes harvested by a variety of gears. Yet, the potential for disproportionate impacts on the species within the complex exists when complexes are formed using gear susceptibility and when selectivity or availability differs by species (DeMartini, 2019).
Aggregating species exclusively based on either life history or fishery traits can lead to unsuitable groupings. For example, a complex formed on fishing vulnerability may group species with divergent life history characteristics, and species that reproduce at earlier ages and are more fecund (i.e., have a higher productivity) are more resilient to fishing pressure compared to species that have lower fecundity and reproduce later in life (i.e., have a lower productivity). Alternatively, grouping species only on similarities in life history may be futile if the species are not vulnerable to the same fishing gear (e.g., Pikitch, 1991; Vinther et al., 2004).
Reconciling the need to balance fishery vulnerability and biological considerations for establishing species complexes remains a difficult scientific problem. No single method has proven robust for all species complex grouping approaches, and often development of species complexes relies on a combination of qualitative (i.e., expert judgement) and quantitative measures. Productivity-susceptibility analysis (PSA) has been proposed as a tool for grouping data-limited species based primarily on expert judgment (Patrick et al., 2010; Cope et al., 2011). A PSA bins information (i.e., life history values and impact by fisheries indicators) in productivity or susceptibility categories based on expert judgement. The rankings within each category are calculated into an overall vulnerability score, which is thereby used to summarize species into groups. However, PSA may not be as useful when forming complexes with closely related species with poor quality data, because vulnerability rankings are likely to be too similar despite having the possibility of scoring differently in the susceptibility categories. For example, Cope et al. (2011) determined that vulnerability rankings from a PSA could not alone be used to establish complexes for rockfish species in the United States West Coast groundfish fishery. A hierarchical tiered approach was implemented by applying clustering analyses first using ecological distribution (i.e., depth and latitude), followed by using the vulnerability scores. Yet, the use of expert judgment for scoring vulnerability was considered problematic for species with such poor quality data.
Alternately, multivariate techniques (e.g., cluster analyses and ordination methods) are a quantitative tool used for identifying similarities among species when adequate species-specific data are available. Of the few quantitative studies that have developed species complexes, the combination of expert judgment and multiple data sources or multivariate approaches (or both) have typically been used to assign species to appropriate groups. For example, both ordination and clustering methods can be used to examine species assemblages using one data source (e.g., Lee and Sampson, 2000; Williams and Ralston., 2002), or multiple data sources with each dataset being analyzed separately, summarized and compared to determine species groupings (e.g., Shertzer and Williams, 2008; Pennino et al., 2016). Other studies have developed methods to quantitatively synthesize findings of species co-occurrence when using multiple datasets. For example, Farmer et al. (2016) combined analysis of multiple catch data matrices along with a life history matrix to assign species to complexes by amalgamating the results from individual hierarchical cluster analyses into a weighted mean cluster association index. However, the weighted mean cluster association index depended on each cluster analyses from each data source to produce clear, sensible results (i.e., no chaining, which is when single units branch and form their own cluster). The array of quantitative studies used to identify species complexes have focused primarily on associations or similarities among species.
Conversely, other studies examining potential species complexes have grouped together similar catch units (i.e., within a specified area and temporal scale) based on similar species composition. Grouping species based on vulnerability to particular fishing gears allowed analysts to determine how different factors, such as depth (Rogers and Pikitch, 1992), influenced the species composition, while providing potential species assemblages based on fishery susceptibility that many east management and enforcement. Koutsidi et al. (2016) developed a unique method that combined biological traits with fishing operation data to examine how the different fishing sectors tended to catch species with similar biological traits. This study concluded that it could be advantageous to consider functional biological traits in management decisions for data-limited species that lack traditional assessments. The method that Koutsidi et al. (2016) applied required knowledge of a variety of life history, behavior, distribution, ecology and habitat attributes in addition to species-specific catch data from the fisheries, which may not be available for data-limited species.
Management of several of the Gulf of Alaska (GOA) rockfish species (Figure 1) is an example where managers have identified species complexes, but further quantitative analysis would be desirable to validate these assignments. GOA rockfish (genus Sebastes) are caught as bycatch (i.e., unintended catch that is either discarded or retained) in a variety of fisheries. Rockfish in the GOA pose a unique challenge due to their range in life history values, habitat preferences, and behavior. Optimally, the rockfish in each complex should withstand similar fishing pressures, have comparable distributions, and common productivity levels. Currently, most of the non-targeted rockfish in the GOA are assessed in two complexes: the Other Rockfish complex, which consists of species that are classified as the “slope,” “pelagic shelf,” and “demersal shelf” rockfish assemblages; and the Demersal Shelf Rockfish complex, which separates the group of seven “demersal shelf” species from the remaining rockfish species in one management area (North Pacific Fishery Management Council (NPFMC), 2019). These complex delineations often combine species with different habitat preferences, which ultimately affects their spatial distributions (i.e., based on gear selectivity and availability). Additionally, the species compositions of the GOA rockfish complexes have undergone multiple changes throughout their management history. In 2011, a PSA indicated that select GOA rockfish had high vulnerability scores due to their low productivity and medium susceptibility level in the fisheries (Ormseth and Spencer, 2011), which implies that the rockfish assemblages should be carefully monitored and managed judiciously. However, further quantitative analysis is warranted to identify whether current GOA complexes should be restructured.
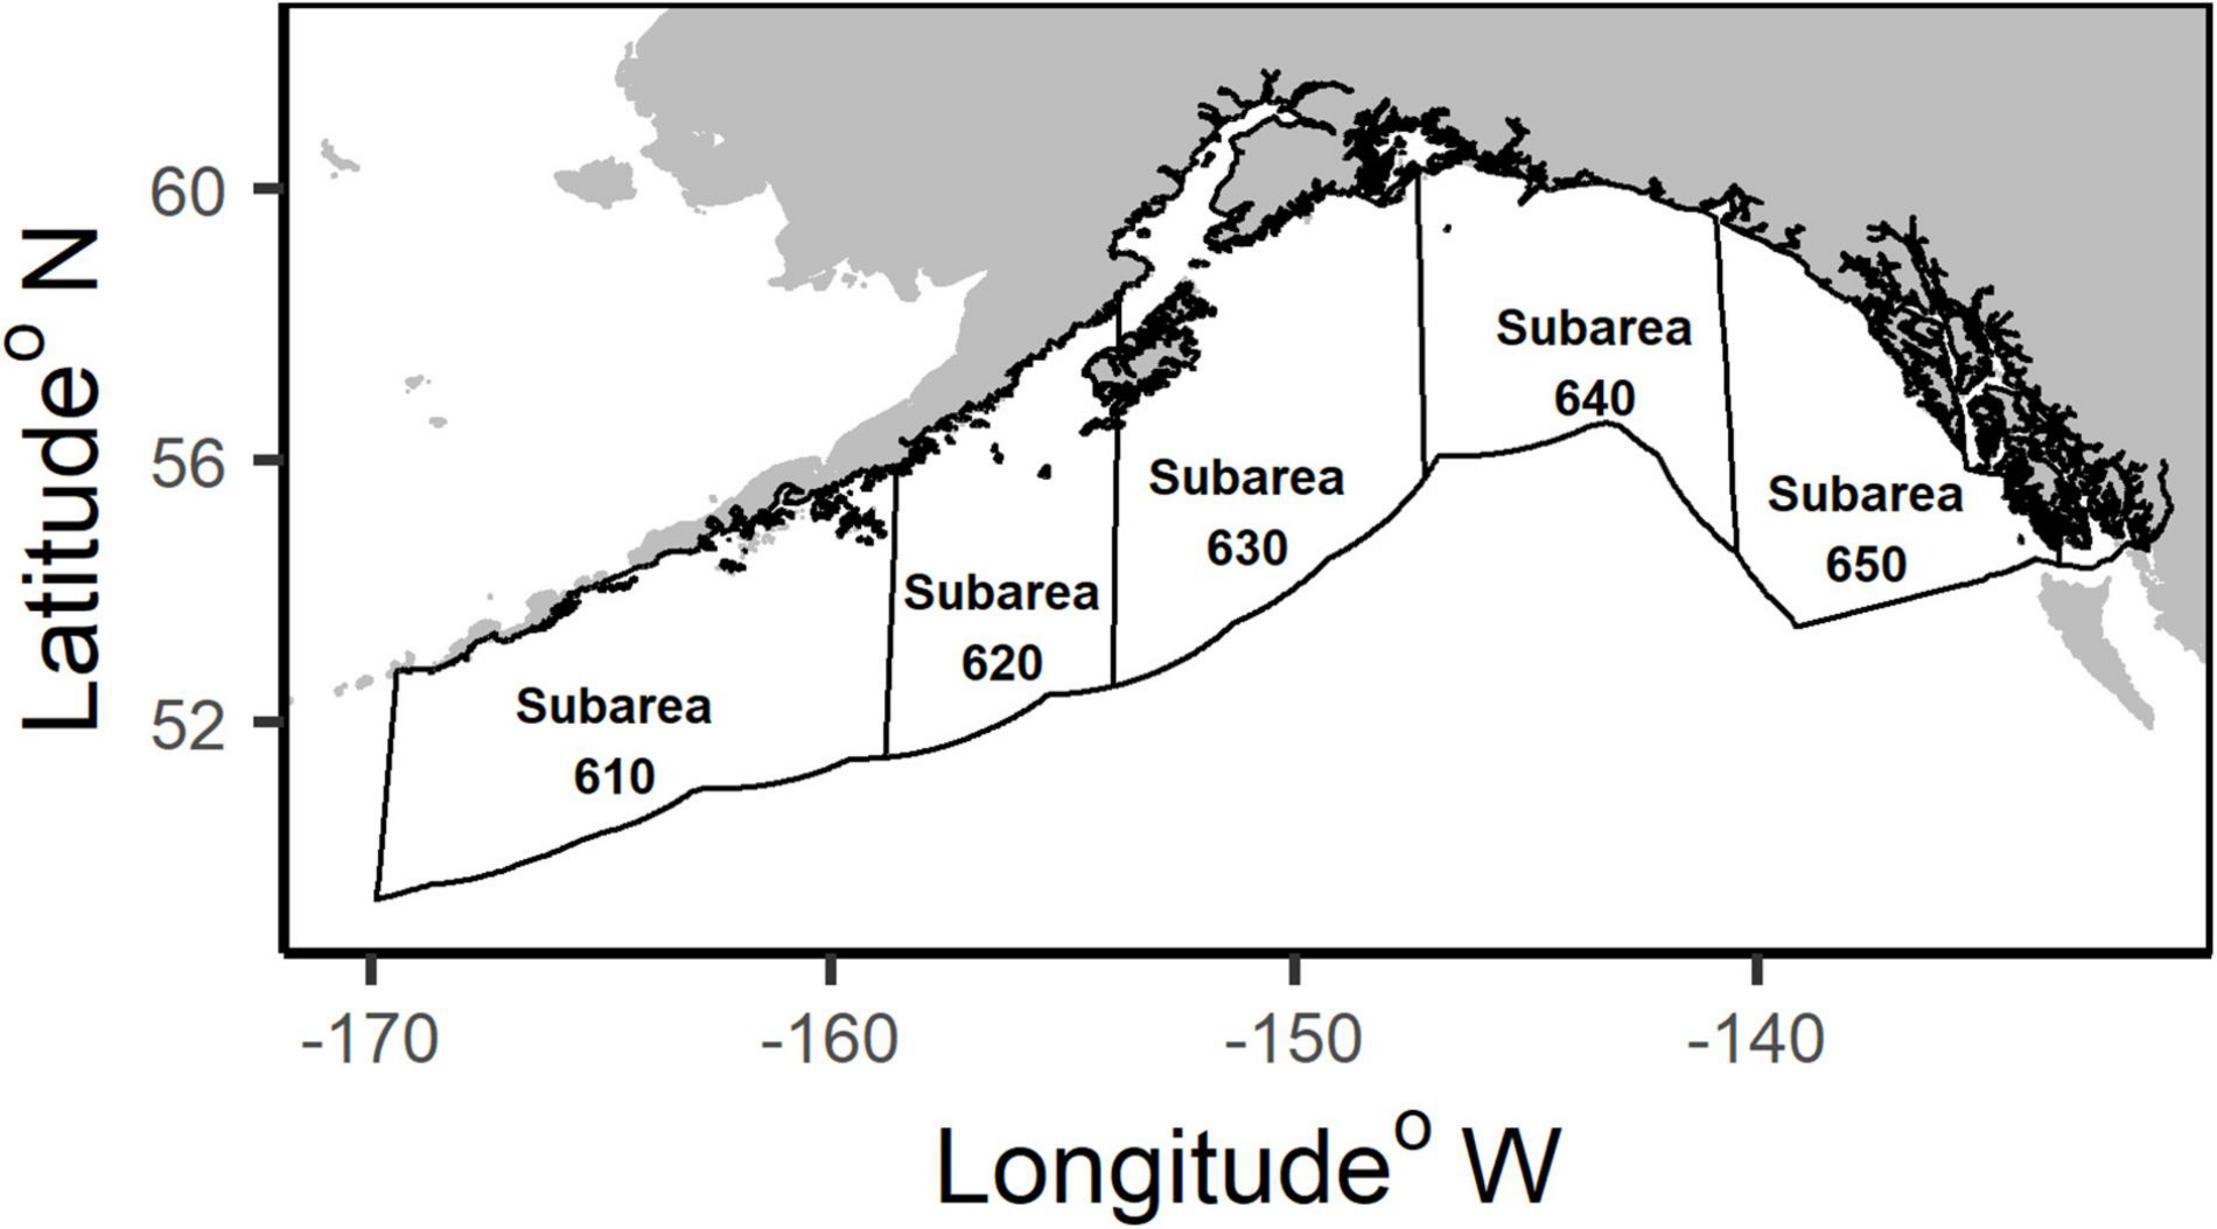
Figure 1. Map of the National Marine Fisheries Service (NMFS) management subareas in the Gulf of Alaska.
In this study, the goal is to explore the consistency of various quantitative methods for identifying species complexes, while also providing an approach to aggregate data across different spatial areas and gear types. The GOA Other Rockfish and Demersal Shelf Rockfish species are used as a case study, because identifying consistent species groupings has proven difficult for these species. Most of the GOA rockfish species are generally not targeted and have high discard rates due to little economic value. A combination of life history traits, fishery dependent, and fishery independent data sources are used to assemble species complexes with hierarchical and non-hierarchical clustering methods and ordination techniques. Two modes of analyses were implemented to the catch data for the clustering methods: (1) aggregate similar species together based on catch presence and abundance; (2) group similar sampling units based on common catch composition. The species assemblages are compared across multivariate techniques and data types to explore patterns of consistency and identify species complexes for management. These results provide new insight into how the data quality and quantitative methodology utilized may influence groupings for implementing species complexes. Additionally, this is the first quantitative analysis to identify species complexes in the GOA.
Materials and Methods
Management Units and Species
The GOA is partitioned into the National Marine Fisheries Service (NMFS) subareas: 610, 620, 630, 640 and 650 (Figure 1). These subareas are used in the analyses to examine differences in the species composition by area. The GOA Other Rockfish complex comprises 25 Sebastes species in the GOA management area. Seven of the 25 species are managed in a separate complex (Table 1), Demersal Shelf Rockfish, in subarea 650, but are included in the Other Rockfish complex in all other subareas in the GOA. The State of Alaska assesses the Demersal Shelf Rockfish in subarea 650, and manages their catch in parallel with state waters fisheries for these species. Additionally, northern rockfish (S. polyspinis) are only included in the Other Rockfish complex in subareas 640 and 650 for management, but they are assessed as part of a single species stock assessment for the entire GOA. Northern rockfish catch data from all subareas are included in our analyses for comparison, but are not a candidate for reassignment.

Table 1. Life history characteristics for each Gulf of Alaska Other Rockfish (GOA OR) and Demersal Shelf Rockfish (DSR) species.
Other Rockfish species vary widely in their distribution, habitat selection, and life history traits. With an exception of harlequin (S. variegatus), these rockfish in the GOA are at the northern limits of their distribution, which span the U.S. West Coast from Southern California to Alaska (Love et al., 2002). Harlequin are found primarily in northern waters from British Columbia to Alaska (Tribuzio and Echave, 2019). Species in the Other Rockfish complex occur in depths up to 800 m, but typical are found in depths ranging from 100 to 275 m (Love et al., 2002). Adult habitats include high relief rocks, reefs or crevices, low relief rocky bottoms, mudflats, vegetative areas, and mixed habitat (Johnson et al., 2003; Conrath et al., 2019). Some individuals are more solitary, whereas others tend to aggregate in mixed-species assemblages (Johnson et al., 2003). In general, rockfish species are characterized by their late maturity, longevity, and their ability to bear live young (Love et al., 2002; Beyer et al., 2015). However, there is a wide range of life history values within the Other Rockfish complex (Table 1; see section “Life History Data”).
The Other Rockfish complex consist of bycatch species captured in more lucrative rockfish and other groundfish fisheries using trawl and longline gear. More than half of the species belonging to the Other Rockfish complex are rarely caught (<1% of the total catch of the Other Rockfish complex). These rockfish have a low economic value (B. Fissel, AFSC, pers. comm.) resulting in a high discard rate estimated at 56% over the entire time series (Tribuzio and Echave, 2019). Based on biomass, most of the Other Rockfish are caught in the trawl fisheries. Within the complex, some species tend to be caught more on longline gear (e.g., yelloweye rockfish in in subarea 630), and others across gear types (e.g., redbanded rockfish), highlighting the variability within the complex. Species in the Demersal Shelf Rockfish complex managed in subarea 650 are commonly found in rocky, high relief habitats (Tribuzio and Echave, 2019), where trawling fishing gear is prohibited. Demersal Shelf Rockfish species are primarily caught by longline gear fisheries (i.e., hook-and-line and jig) targeting sablefish (Anoplopoma fimbria) and Pacific halibut (Hippoglossus stenolepis; Table 1).
Data Sources
Life History Data
The life history parameters were assembled from peer-reviewed articles, gray literature, assessment data from NMFS, and global predictions using FishLife (Thorson et al., 2017). Although species data from the GOA or northern ranges were used when available, most life history studies examining maximum age or age/length at maturity were completed in lower latitudes. When no data were available from the GOA, life history information from southern areas were utilized, despite the potential for differential growth rates by latitude (e.g., splitnose rockfish [S. diploproa]; Gertseva et al., 2010). Depending on data availability, the included life history data for the analyses were: age and length at maturity (Amat and Lmat, respectively), maximum age recorded (as a proxy for longevity, Amax), mean maximum length from the von Bertalanffy growth curve (L∞), and von Bertalanffy growth parameter (k; Table 1). Natural mortality, M, was not included in the life history analysis, because M is frequently derived from other life history traits, such as maximum age, for these species, and is thus directly correlated.
Fishery Catch Data
Fishery catch information from 2010 to 2018 was used to estimate presence/absence and catch-per-unit-effort (CPUE) for each of the species. Other Rockfish species are incidentally caught in other groundfish fisheries by five gear types including non-pelagic trawl (NPT), pelagic trawl (PTR), longline hook and line (LL), pot (POT), and jig (JIG). The majority of the rockfish bycatch species by biomass are caught in the trawling gear (NPT and PTR), which primarily targets pollock, Pacific cod, flounders, and target rockfish species, in all subarea except 650. They are also caught in fishery longline gear types (LL and JIG) in all subareas that target sablefish and Pacific halibut. Fisheries species-specific catch information is gathered from the Alaska Regional Office Catch Accounting System (CAS) using data from 2010 (when quality data were first available for these rockfish species) to 2018. The sampling unit for the catch data is determined by each unique vessel trip identifier each week for each subarea as reported by fishermen, ranging from < 10 to over 8,000 vessel trips for each gear type and subarea over the entire time period. The CPUE input data used for the analyses are defined as biomass (mt) caught per vessel trip for each species based on available fisheries data.
Survey Data
The NMFS Alaska Fisheries Science Center (AFSC) bottom trawl survey (von Szalay and Raring, 2018) and annual longline survey (Malecha et al., 2019) were used as fishery independent data sources. Other Rockfish species information has been collected on the Alaska bottom trawl survey in the GOA since 1980. The bottom trawl survey used a triennial time scale from 1984 - 1996, followed by a biannual basis (1999 - current). Years included in this dataset range from 1984 to 2017. The trawl survey covers depths up to 1000 m, sampling around 320,000 km2 from late May - early August using a stratified-random design including an average of 235 hauls that catch at least one species in the Other Rockfish complex. The sampling unit for the trawl survey is biomass (kg) per km2 calculated by the biomass caught per area swept by the trawl net. General habitat types (i.e., gully, shelf, and slope), depth and latitude and longitude are recorded.
The NMFS annual longline survey targets sablefish (Anoplopoma fimbria), but also catches Other Rockfish species. The longline survey can sample areas that are deemed untrawlable (e.g., areas with high relief and rocky habitat), providing catch information for species that might not be susceptible to the trawl gear. Data on rockfish from the longline survey used in this study range from 1995 to 2017. The sampling unit for the longline survey is number of individuals caught per set of hooks. Other factors that influence survey catch, such as depth bins, latitude and longitude, are available.
Multivariate Analyses Background
A variety of quantitative multivariate clustering and ordination methods were implemented to explore potential alternative species groupings. We considered a species complex ‘appropriate’ for management advice if there was high consistency in clustering among different multivariate methods and types of data. Two clustering methods and one ordination technique were applied to each data type as suggested by Lee and Sampson (2000) and Shertzer and Williams (2008). The two clustering methods conducted in this study are Ward’s minimum variance and k-mediods; the ordination technique that is implemented is either canonical correspondence analysis (CCA) or non-metric multidimensional scaling (NMDS). These methods are described in Manly (2005); Zuur et al. (2007) and Legendre and Legendre (2012). All analyses were conducted in the R software language (R Core Team, 2020).
Both hierarchical (Ward’s minimum variance) and non-hierarchical (k-mediods) cluster analysis are implemented to identify and compare consistency in species groupings. Ward’s minimum variance analysis is a hierarchical, agglomerative clustering technique, which uses the centroid method to iteratively group closest objects together (Ward, 1963). Ward’s analyses were conducted in R package “stats” (R Core Team, 2020), and a bootstrap resampling method was applied to determine the stability of each grouping with 1000 bootstrap samples in R package “fpc” (Hennig, 2007; Hennig, 2020). For each bootstrap sample, the new dataset was formed by drawing samples from the original dataset with replacement and applying the Ward’s clustering analysis. The Jaccard coefficient, J, was calculated to examine the similarity in the cluster membership between the original cluster with each bootstrap cluster. The mean Jaccard coefficient values, , were computed for each cluster, where a higher value indicated more stability in the cluster. A value of 0.75 or greater implies that the original cluster is stable; values ranging from 0.6 to 0.75 suggest there are patterns in the data, but uncertainty in the cluster (Hennig, 2007). Dendrograms were used to aid in the interpretation of the results. The non-hierarchical cluster method, k-mediods, is a more robust variant of the traditional k-means (Kaufman and Rousseeuw, 1990). This k-mediods method finds optimal groupings by minimizing the distance between all objects and their nearest cluster center (mediod). The k-mediods analyses were conducted using R package “stats” (R Core Team, 2020). The optimal number of desired groupings for k-mediods was determined a priori using the average silhouette width (Rousseeuw, 1987) in R package “factoextra” (Kassambara and Mundt, 2020). The silhouette width is the measure of quality of the clustering by examining the (dis)similarities of an object to the other objects within the same cluster compared to objects belonging to other clusters (Rousseeuw, 1987), where the number of k clusters selected is based on the highest average silhouette width. An average silhouette width less than 0.25 signifies that there is not enough structure in the data to support natural clusters (Kaufman and Rousseeuw, 1990).
Additionally, for either method it is possible to use either of two different clustering techniques: R-mode (comparing variables or descriptors) or Q-mode (comparing objects; see Figure 2; described in Legendre and Legendre, 2012). R-mode directly identifies relationships among species (variables) by examining species similarities based on the catch in each sampling unit, whereas Q-mode identifies clusters by grouping units based on commonality in species composition. Q-mode is particularly useful for identifying groupings of sampling units (e.g., year and gear combinations) in multispecies catch data, but requires further analysis to examine species composition groupings within sampling units (e.g., Rogers and Pikitch, 1992).
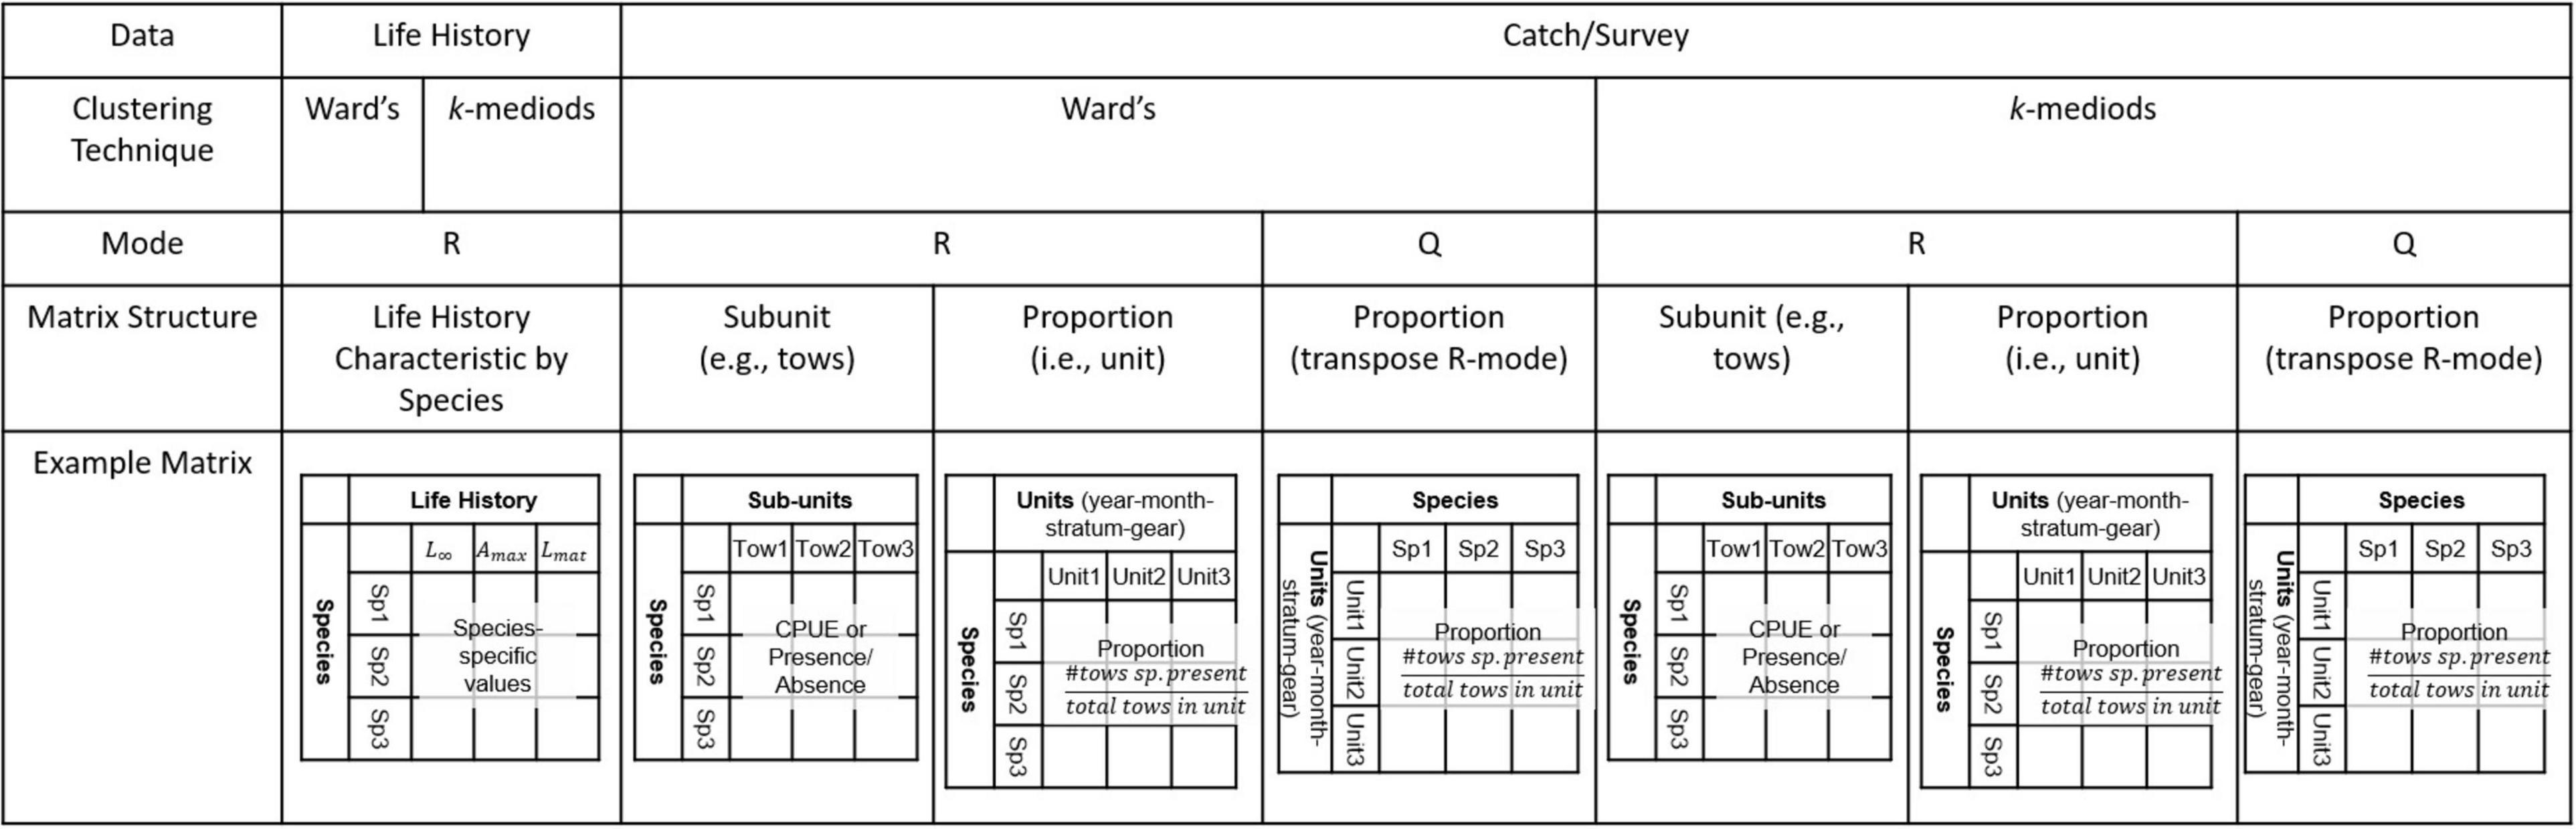
Figure 2. Design of the model analyses identifying data, clustering technique and input matrix structure for each aspect of the cluster analyses.
The ordination techniques that were utilized to identify relationships among species are CCA and NMDS. The CCA technique is commonly used to examine species relationships and environmental variables that influence community composition. This analysis uses a set of weighted linear regressions to describe the relationship among species catch and explanatory variables (e.g., gear, depth, or location). It assumes that the species data are unimodal and vary along the gradients of the explanatory variables. Here, depth or depth bins, general substrate type, gear, and NMFS subarea were included as factors in CCA when applicable. In contrast to CCA, NMDS accommodates different magnitudes in the data, because it preserves the order of the distances rather than the magnitude of the distances. The NMDS technique also does not assume an underlying response model (Legendre and Legendre, 2012). Both ordination methods were conducted using R package “vegan” (Oksanen et al., 2019) and the first two dimensions of ordination space were used for visual representation.
Application of Multivariate Analyses
Analyses of Life History Characteristics
Both Ward’s and k-mediods analyses were applied to identify species groupings based on life history characteristics using R-mode. The input life history table used in the analysis had species as the rows and life history characteristics as the columns with entries being the associated life history values. Three versions of the life history table were used for the analyses: species-specific values for each characteristic when data were available (species with no information were removed from this table, n = 21), species-specific values with missing values estimated from FishLife (Thorson et al., 2017, Table 1), and binned data based on four percentile bins (0–25, 26–50, 51–75, and 75–100%). Binned data allowed for data gaps and data uncertainty. The data in the species-specific life history tables were standardized by dividing each characteristic value by the mean for each life history characteristic. The standardization process ensures the magnitude of the data are similar so that the life history values are weighted the same in the analyses. The Euclidean distances were then calculated to develop the final dissimilarity matrix before Ward’s and k-mediods analyses were implemented. Lastly, NMDS was applied to the dissimilarity matrix to assist in visualizing the species groupings and show any relationships among species and life history characteristics.
Sub-Unit Matrices of Catch and Survey Data
There are two scales of aggregation of the data, sub-unit and a more aggregated ‘unit’ scale (Figure 2). At the ‘sub-unit’ scale, input data matrices had entries of presence/absence or CPUE of a species (represented in the rows) for a given sampling unit (i.e., the smallest sampling unit of either haul, tow, or set in the columns). A matrix was created for every area and gear combination for all years combined. The application of the multivariate methods for each individual data sub-unit matrix ensured that each gear in the fisheries and surveys and each area are treated independently.
Ward’s analysis, k-mediods and CCA were applied to the commercial catch and survey matrices. The R-mode for the cluster analyses was implemented for the sub-unit data matrices. The multivariate analyses using R-mode allowed direct identification of species groupings for each gear type and NMFS subarea in the GOA when using the sub-unit matrix. Once the data matrices were created, the CPUE sub-unit matrices were standardized using a root-root transformation to down-weight highly abundant and prevalent species. Subsequently, the dissimilarity matrices were computed using Sorensen distance for presence/absence data matrix and chi-square measure of distance for the standardized CPUE sub-unit matrix prior to the application of cluster analyses. Other data standardizations and distance measures were implemented, but did not change the results. The sub-unit CPUE input data matrices were assembled with the sub-units as rows and species as columns for the CCA. A chi-square transformation was applied on the data matrices before implementing a CCA. External factors, such as depth, latitude, longitude and substrate type, were included in the survey catch analyses for each sub-unit.
Proportion Matrix of Catch and Survey Data
The second scale of aggregation was the aggregated ‘unit’ scale, which developed an input ‘proportions’ matrix. This proportions matrix consolidated the individual sub-unit matrices into a combined matrix. While in the ‘sub-unit’ matrices the columns represented the smallest sampling unit (i.e., haul, tow, or set), the columns of the proportions matrix were defined as a ‘unit’, which encompassed a temporal, spatial, and gear component. Here, each column was a unique combination of year, month, subarea, and gear while rows were species. The gear indicates the gear types used in the commercial catch and fishery-independent surveys, such that the gear categories are: NPT, PTR, LL, POT, and JIG for the fisheries gear and “trawl survey” and “longline survey” for the NMFS surveys. The entries were the proportion of tows that a species was present within that unit (i.e., the sum of tows with a species present divided by the total number of tows within the unit). The proportions matrix combined data for all gear categories (i.e., commercial and survey gears) into a single matrix, which allowed the exploration of similarity in the species catch composition among different gears and areas. The proportions matrix can also be useful to limit the impact of abundant and frequently caught species by reducing the difference between the number of null or zero catches for less common species and high valued positive catches for prevalent species.
Ward’s analysis and k-mediods were applied to the proportions matrix using both R-mode and Q-mode. Similar to the R-mode application of the cluster analyses on the sub-unit matrices, the R-mode allows direct comparison of species relationships. The Q-mode, which used the transpose of the proportions matrix as the input data, required more detailed investigation to identify species groupings because clustering was by unit, not species. The species groupings that comprised each cluster were visually examined to determine which characteristics (i.e., gear, subarea, month, season, and year) influenced the clustering. The proportions matrix (or transpose thereof) already reduced the catch of species to comparable scales, thus, no standardization was necessary. Chord distances were calculated to obtain the dissimilarity matrices for the proportions matrix prior to applying the cluster analyses. The Chord distance is a type of Euclidean distance measure that can accommodate non-normalized data and is not sensitive to outliers (Shirkhorshidi et al., 2015). For the CCA, the proportions input matrix was assembled with the units as rows and species in the columns. A chi-square transformation was applied before implementing a CCA. Gear and subarea for each unit in the proportions matrix was included as external factors.
Results
Analyses of Life History Characteristics
The rockfish in the GOA have a wide range of life history values (Table 1). Results for Ward’s analysis and k-mediods on the life history tables differed slightly, but provided the same general conclusion. The multivariate analyses on the life history table supplemented with FishLife values are reported here; results based on the life history table with missing values and binned data are similar and reported in the Supplementary Material (Supplementary Figures 1, 2).
Results from Ward’s analysis had weakly supported groupings based on the bootstrap resampling for species with mid to lower values of length and ages associated with maturity, growth, and longevity (values ranging from 0.63 to 0.69). The bootstrap resampling suggested patterns in the data for the grouping of three or four clusters with similar -values ranging from 0.63 to 0.83, but the clusters lack stability. Only the low productive species (i.e., tiger, blackgill, and yelloweye) remained in their own grouping in both k = 3 or 4 clusters in Ward’s analysis with values of 0.73 and 0.83, respectively. The NMDS plot with results from Ward’s analysis represents three clusters, one with the low productivity group (i.e., high length and age values), one with relatively higher productivity (i.e., lower length and age values), and the third group with varying levels of productivity (Figure 3A). When k = 4 clusters, two species, redbanded and bocaccio, separate into their own group; these two species have low Amax and high Lmat and L∞ compared to the other species in their cluster when k = 3.
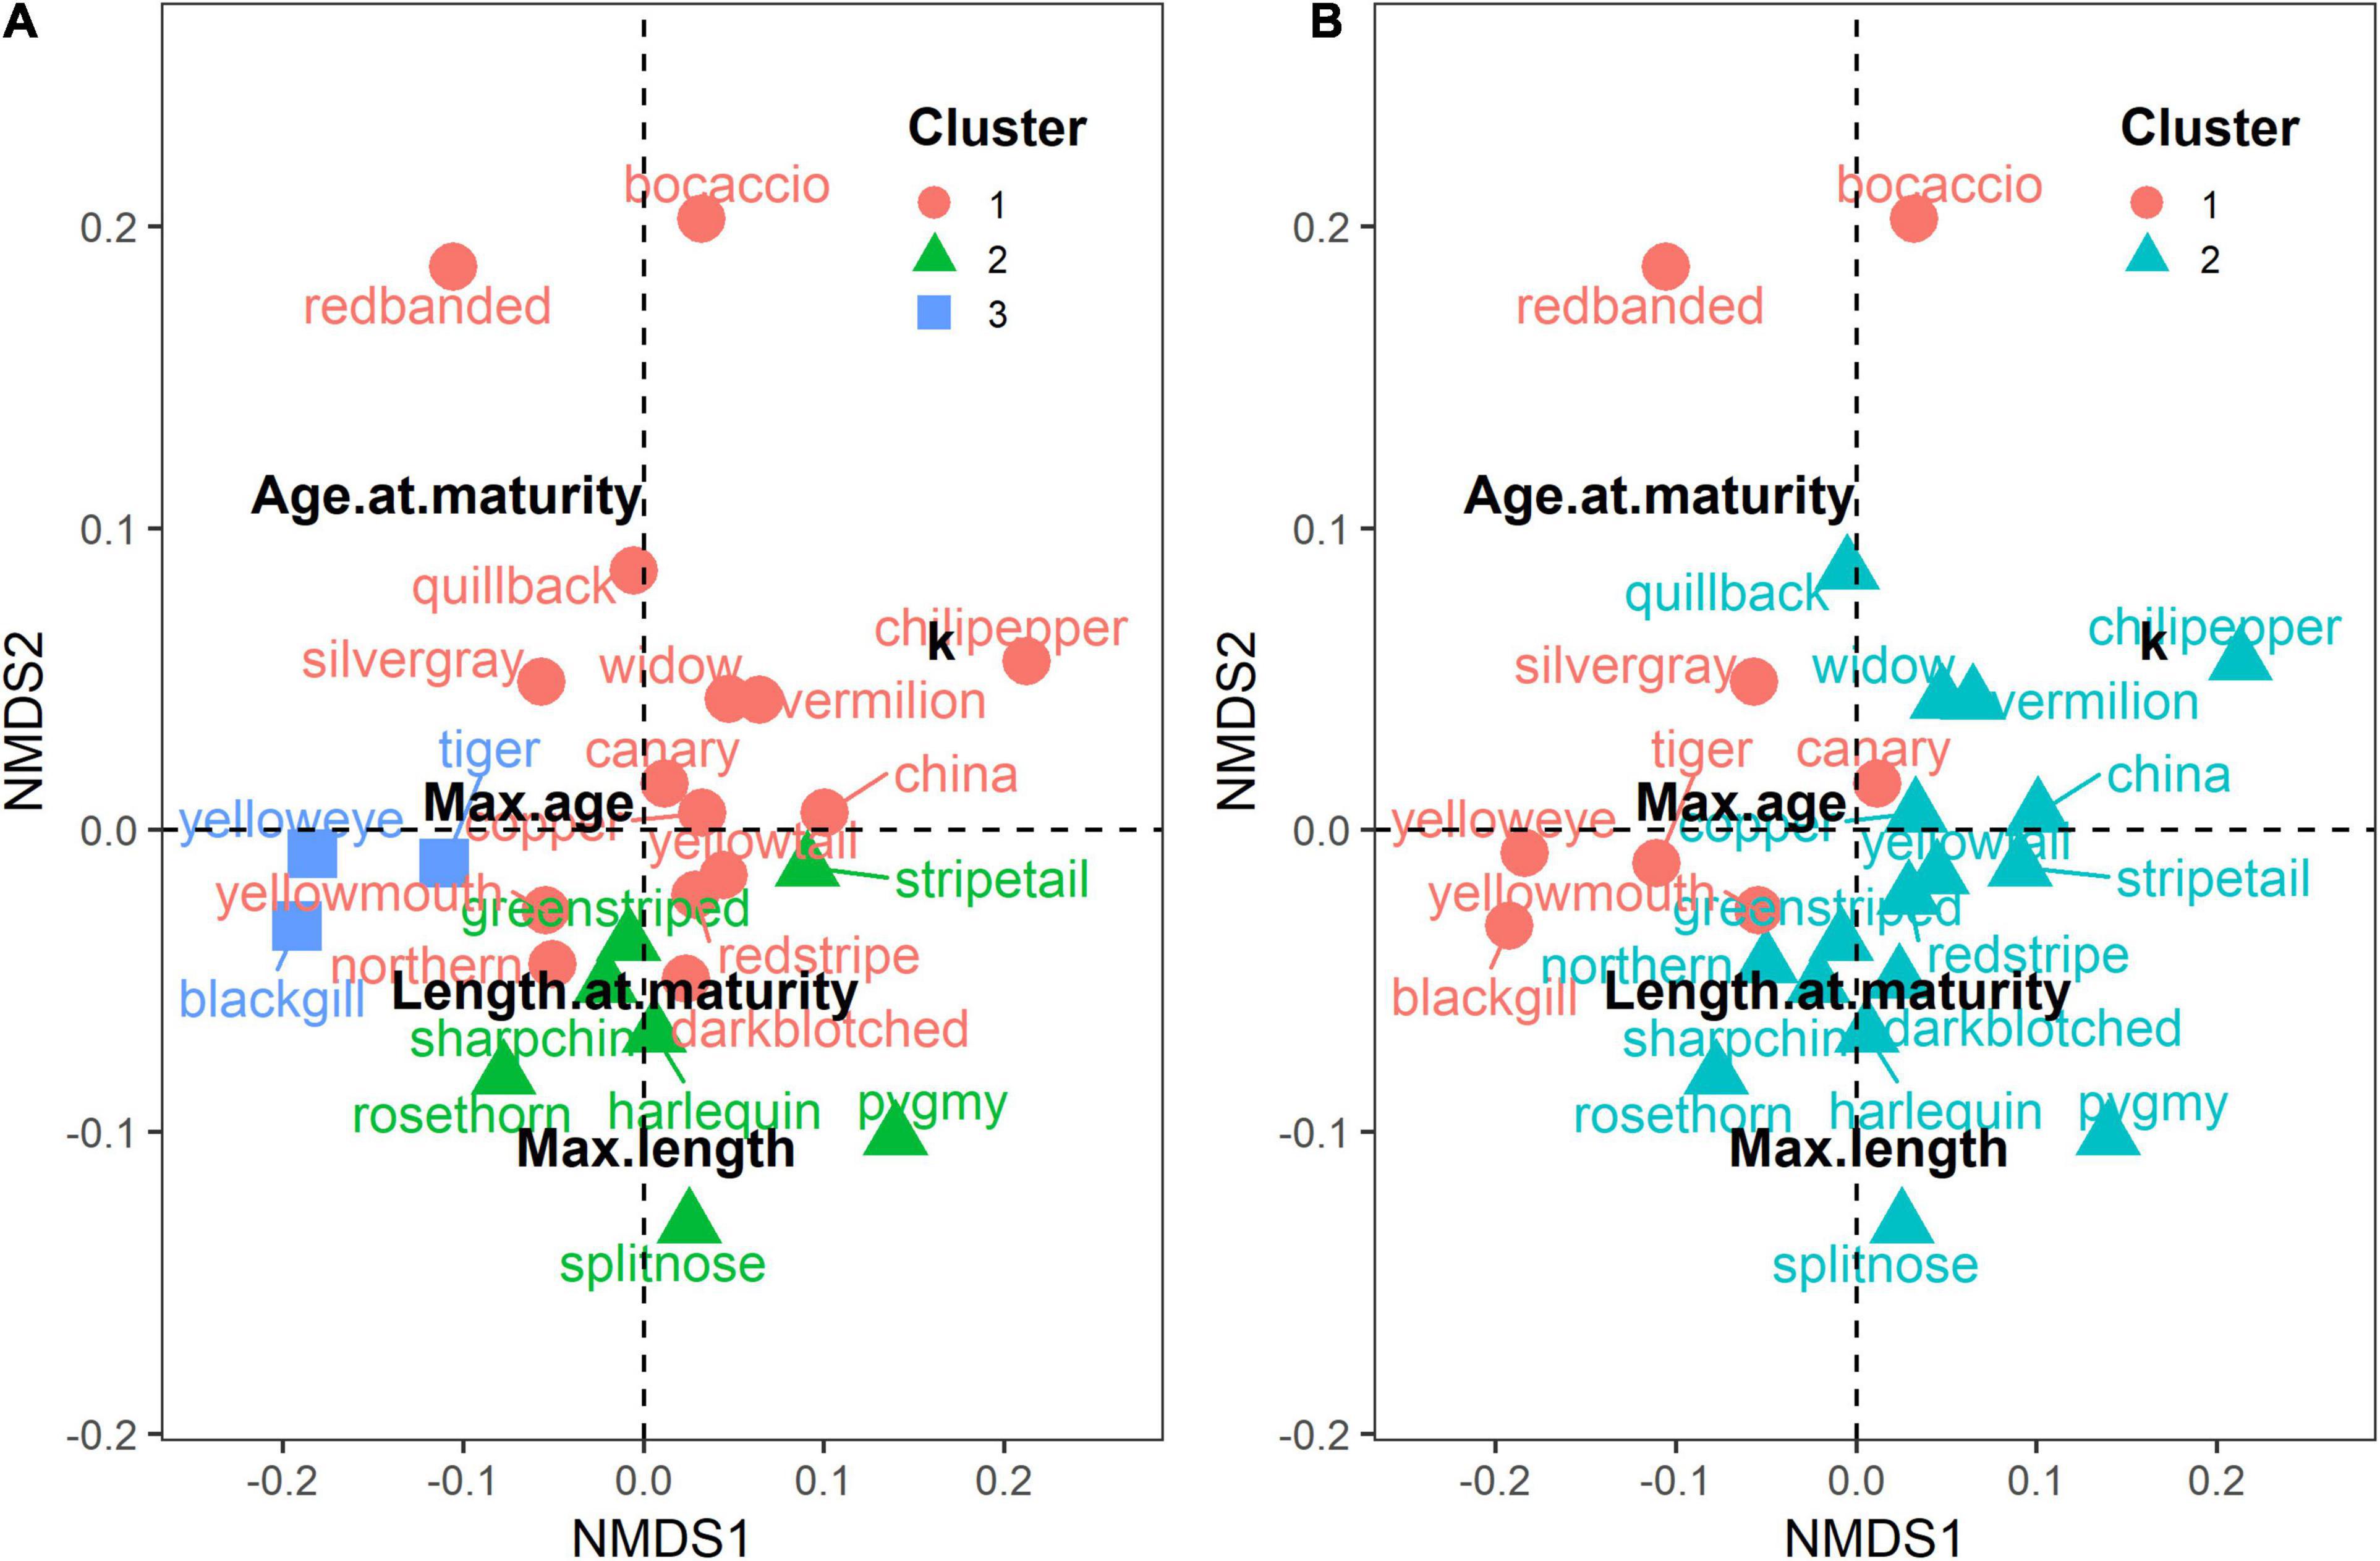
Figure 3. NMDS plot of species’ clusters identified from life history values estimated from FishLife for missing values from (A) Ward’s hierarchical cluster analysis and (B) k-mediods. In Ward’s analysis three or four clusters were supported by the bootstrapping resampling method; results with four clusters separated redbanded and bocaccio into their own cluster.
Results from k-mediods split the rockfish into two clusters based on the highest silhouette width of 0.30. The first cluster contained rockfish with life history values with high length and age values (i.e., low productivity). The second cluster consisted of rockfish with medium to high productivity (Figure 3B).
Comparing the results from the different clustering methods, the methods tended to group species by large or small lengths (L∞ and Lmat) and younger or older maximum age (Amax) and age at maturity (Amat), but most clusters were weakly supported. There were a few species that were placed in the same group regularly. These species tend to fall on the ends of the rockfish productivity spectrum (i.e., all high or low values for age and length associated with maturity, growth, and longevity). For example, tiger, blackgill, and yelloweye rockfishes all have high Lmat, Amat, L∞, and Amax values (i.e., low productivity) and were consistently clustered together for k-mediods and Ward’s analysis. There are other rockfish species that have opposing life history characteristics. For example, splitnose has a high Amax, but low L∞, while bocaccio has low Amax and Amat and high L∞ and Lmat. These species tended to waver between clusters depending on the method and suggested number of clusters. Overall, larger, older rockfish tended to cluster together, but there is a wide variation and spread of life history values among and within the clusters resulting in no distinct support for clusters.
Sub-Unit Matrices of Catch and Survey Data
Exploratory runs were performed with all methods applied to the catch and survey data to determine whether results were robust to the inclusion of rare species (i.e., species comprising less than 1% of total catch). Due to poor performance (i.e., lack of clustering and chaining in Ward’s analyses) in exploratory runs when rare species were included, it was determined that these species should be removed from further analyses of the catch and survey data. Species removal varied considerably for sub-unit analyses (see Supplementary Material 1 and Supplementary Figure 3 for species composition and sparseness across gears and subareas).
When each gear and area were analyzed separately using the sub-unit matrix, some analyses demonstrated poor performance (e.g., high prevalence of chaining or lack of clustering). Generally, results demonstrated that the more abundant and more frequently caught species tended to group together, while the less abundant species also commonly clustered together (Supplementary Figure 4). This pattern is demonstrated in both types of cluster analyses for all subareas of the GOA and all gear types for both presence/absence and CPUE data matrices. However, these results should be interpreted with care, given the performance issues encountered. The ordination analyses (CCA) did not yield discernable groupings nor strong associations with the additional explanatory information (e.g., depth, longitude, latitude, and substrate type; Supplementary Figure 5). Thus, the analyses using the sub-unit matrix were of limited insight for grouping of species complexes.
Proportions Matrix of Catch and Survey Data
The exploratory runs with the proportions matrix indicated that rare species should be excluded to provide better clustering performance. A total of 14 species remained in the unit proportions matrix after rare species were excluded. The total number of species remained the same across analyses and modes.
Aggregating the data into units (i.e., by year, month, subarea, and gear) in the proportions matrix enabled the cluster analyses to find stronger relationships among the species using R-mode. Although the groupings from the k-mediods analysis using the unit aggregation led to similar results as using the sub-unit matrix, Ward’s analyses tended to aggregate species by co-occurrence. The bootstrap resampling method indicated that k = 2 or 3 clusters were supported with values ranging from 0.69 to 0.84. For the two-cluster output, one stable cluster ( = 0.84) contained species that are only within the Other Rockfish complex with the exception of rosethorn (Figure 4). The other cluster aggregated species predominately found in the Demersal Shelf Rockfish group ( = 0.82). For the three-cluster output, the clustering data suggested that two species (i.e., canary and yellowtail could be weakly separated into their own group ( = 0.69), whereas these species are aggregated with the Demersal Shelf Rockfish cluster when k = 2 (Figure 4).
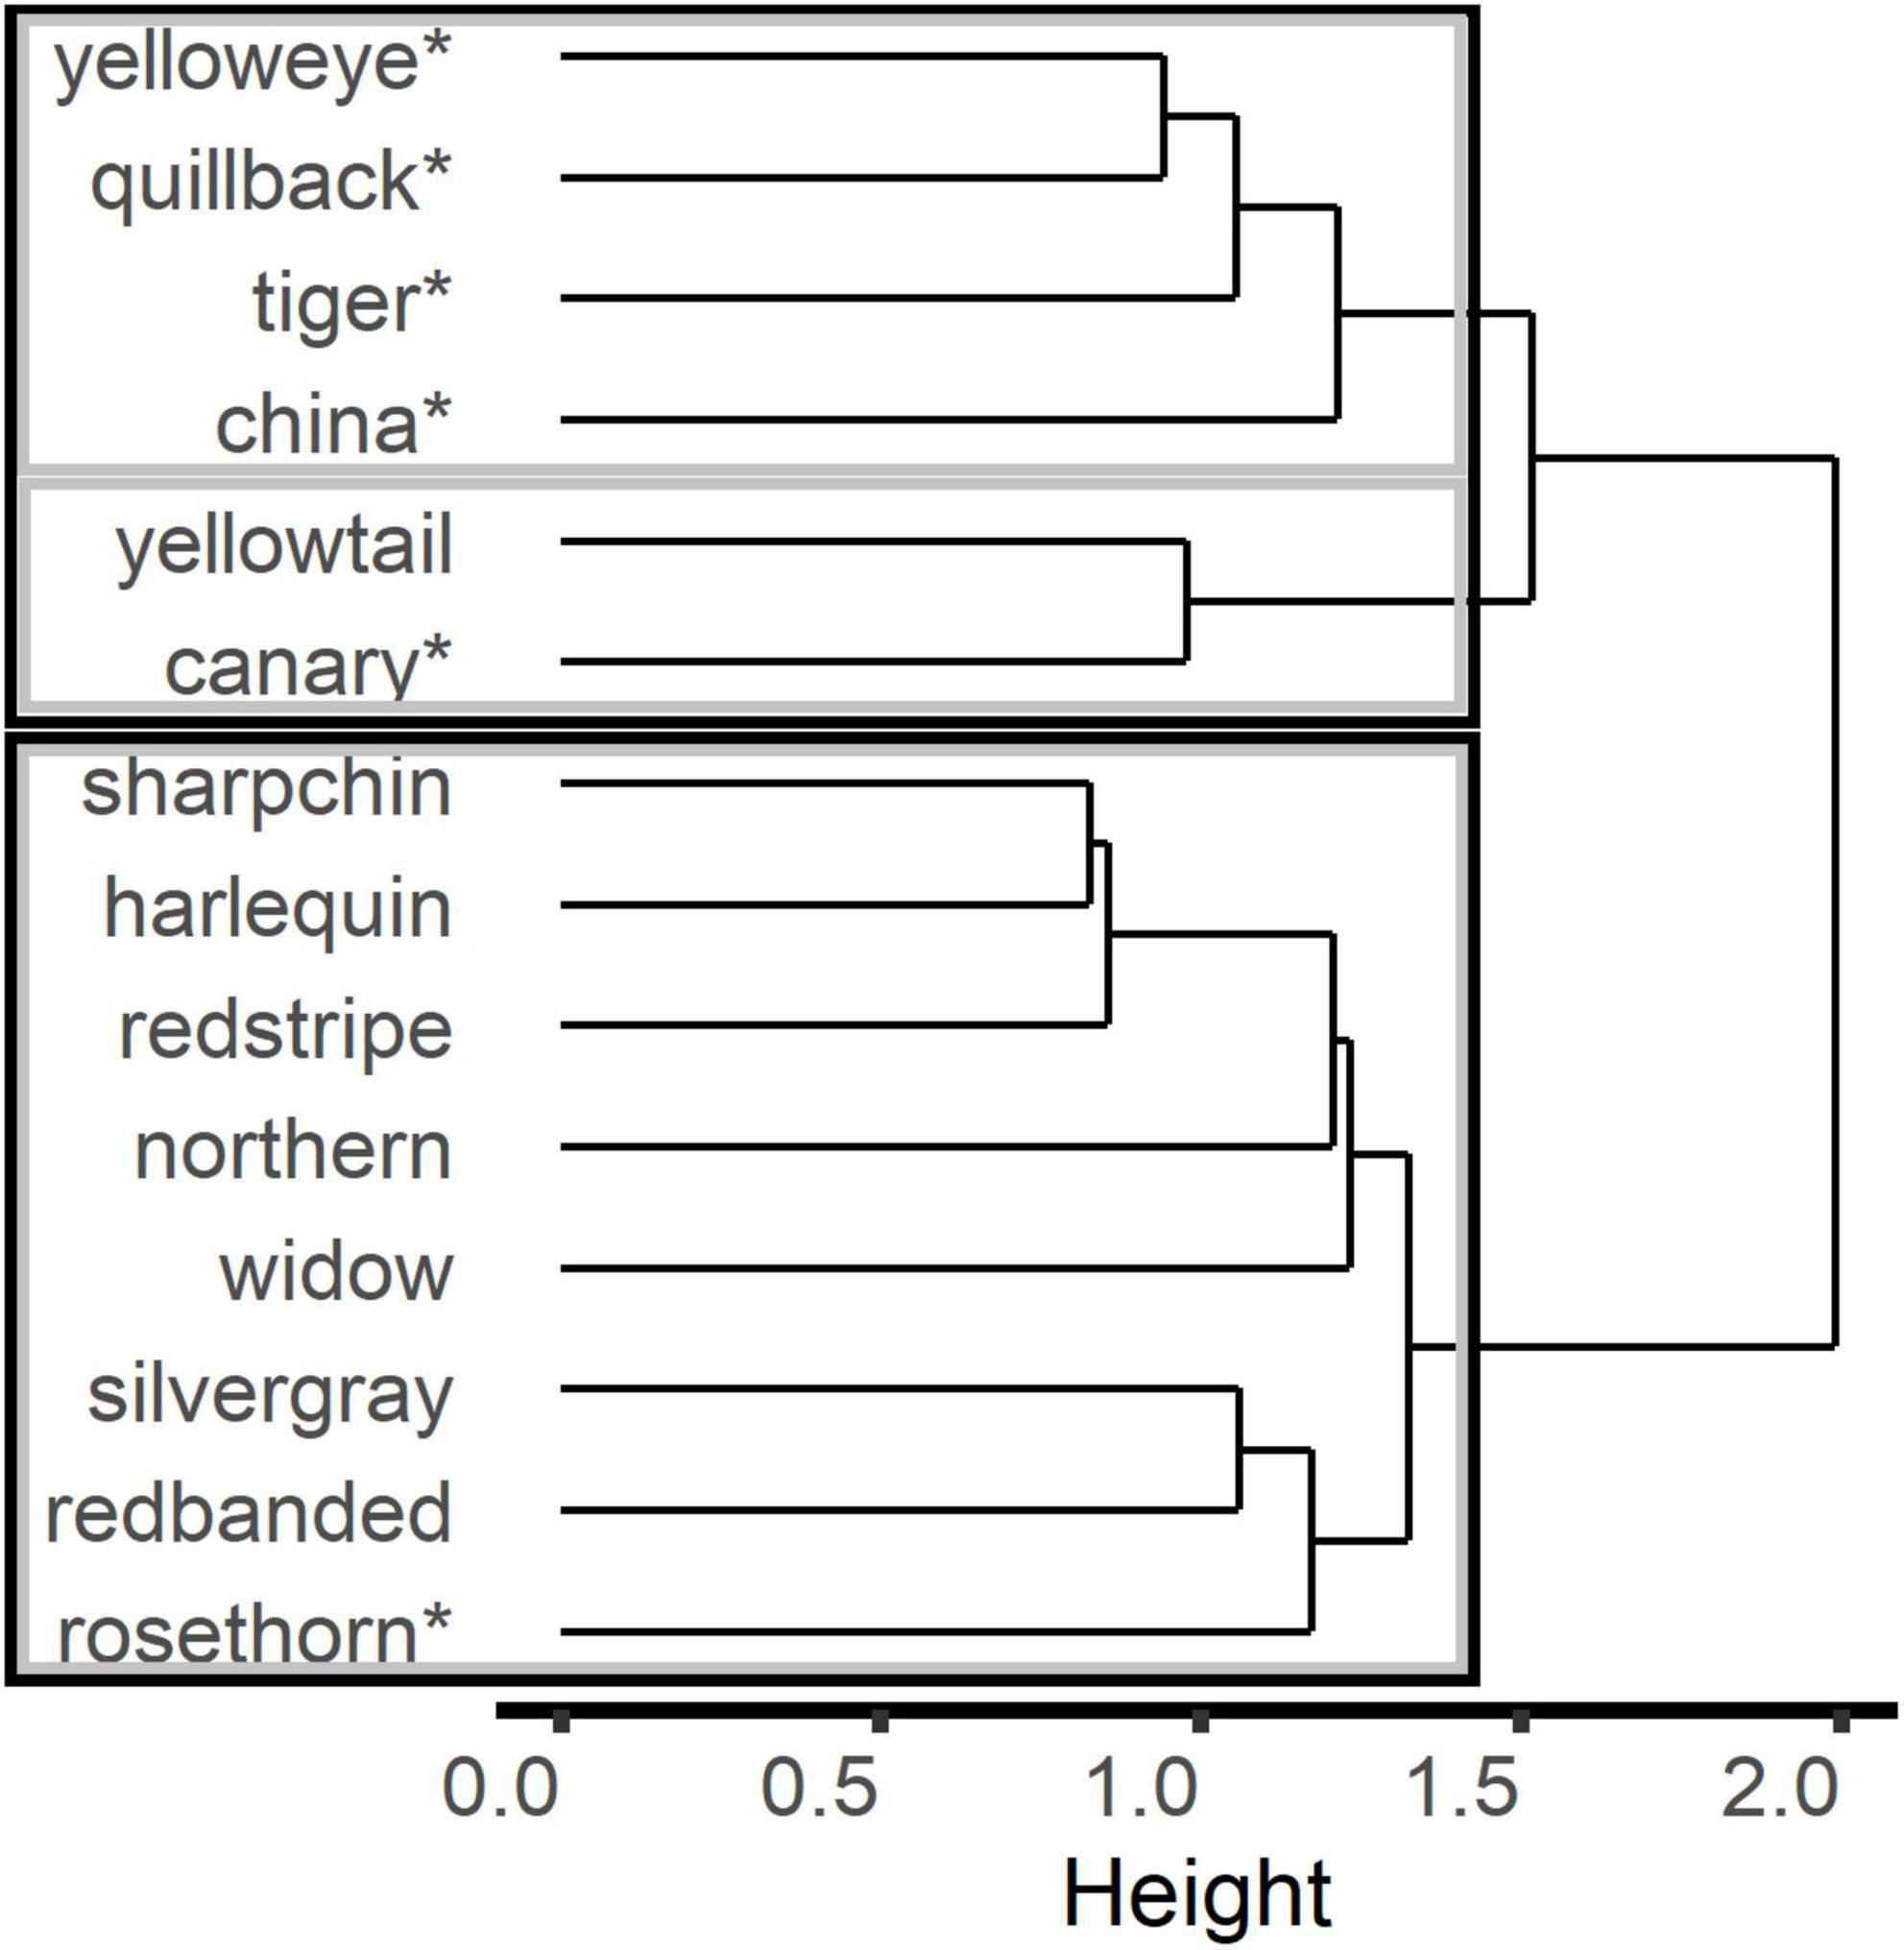
Figure 4. Results from Ward’s hierarchical cluster analysis using the proportions matrix with “units” (year-month-subarea-gear) in R-mode where 2 (black lines) or 3 (gray lines) clusters are supported by the bootstrap resampling method. The “*” indicates species that currently belong to the Demersal Shelf Rockfish complex.
The clustering and ordination analyses indicated that gear and occasionally subarea influenced the groupings using Q-mode. There did not appear to be any seasonal or temporal trends. Ward’s analysis performed poorly due to the common chaining issue and there was no appropriate number of groupings found based on the bootstrapping. Conversely, the k-mediods method provided discernable groupings. The optimal number of clusters (k) for k-mediods was 5 based on the average silhouette width of 0.32. However, the optimal number of clusters based on where the average silhouette width first reaches its asymptote was k = 2 at a silhouette width value of 0.29 (Figure 5). Thus, results from the k = 2 and k = 5 clusters are presented.
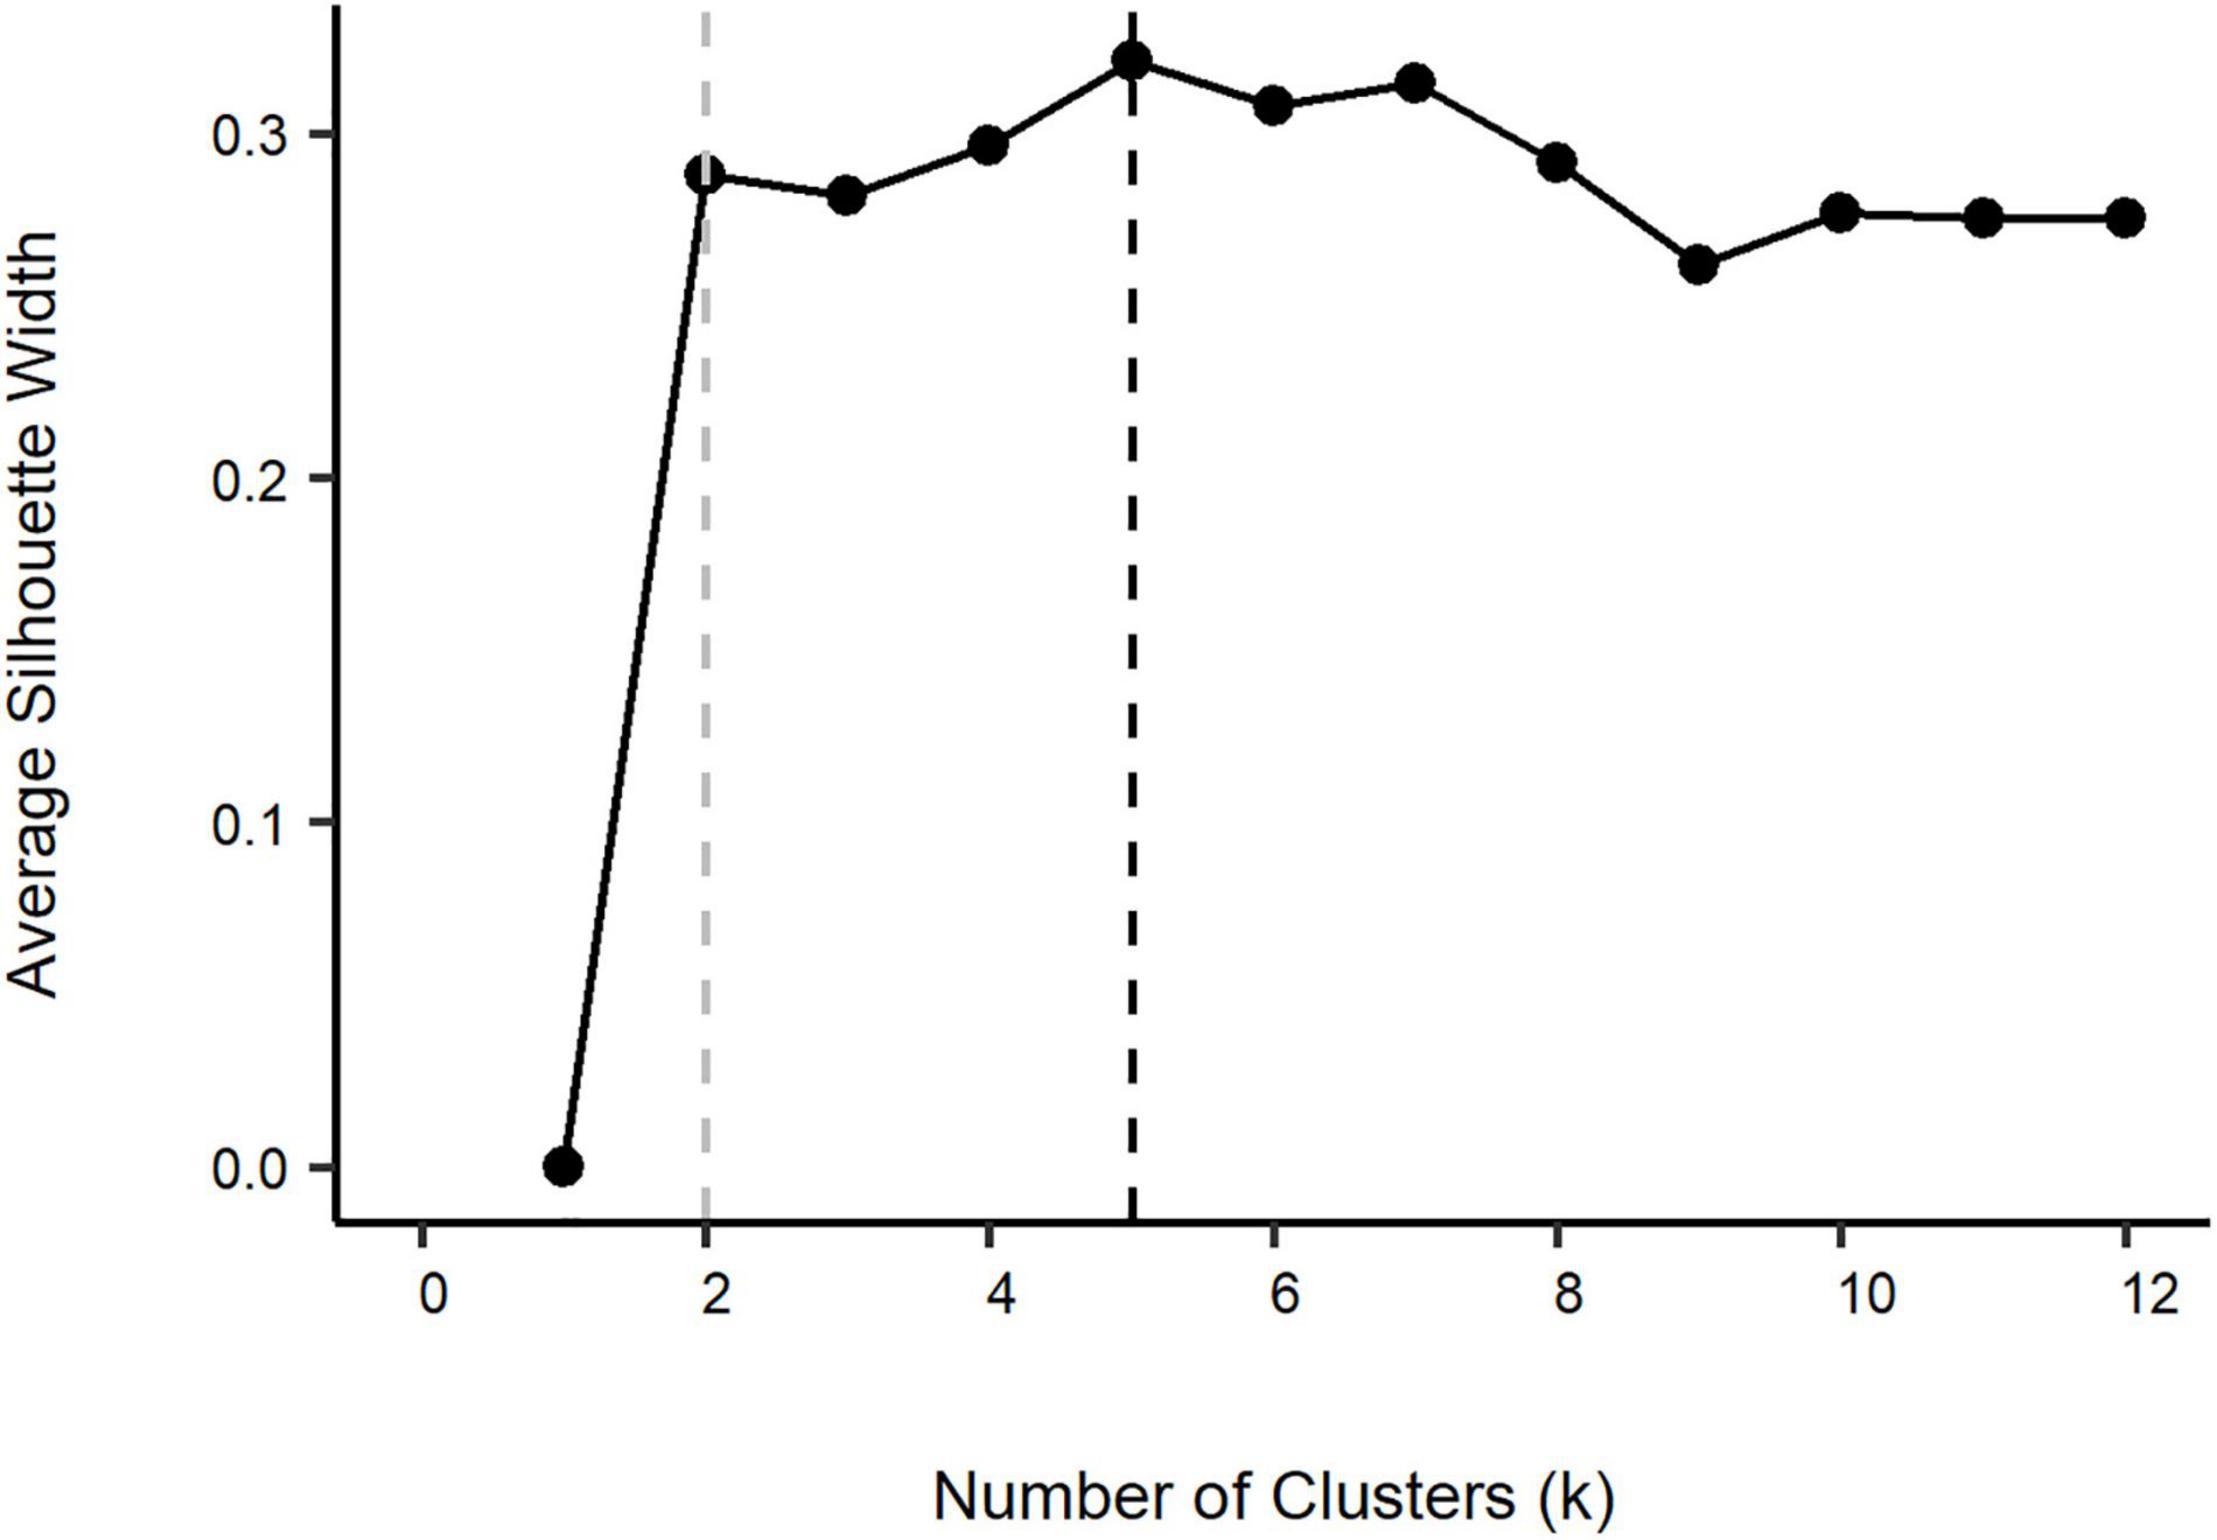
Figure 5. Average silhouette width from Q-mode k-mediods cluster analysis using the proportions matrix with “units” (year-month-subarea-gear). The suggested optimal number of clusters is k = 5 (black dashed line), but the average silhouette width plateaus at k = 2 (gray dashed line).
Results from k-mediods with k = 2 clusters yielded clearly defined groups differentiated primarily by gear type (Figure 6A). The first cluster contained trawling gears (i.e., NPT, PTR, and the trawl survey), as well as the pot gear (POT). The second cluster consisted of longline gear types (i.e., LL, JIG, and the longline survey). Differences in subareas could also be discerned (Figure 6B); the first cluster mostly contained subareas 610, 620, and 630, whereas cluster 2 comprised all subareas. The division of subareas can be attributed to specific fishing gear in certain subareas (Supplementary Figure 3). For example, NPT and PTR gear types do not fish in subarea 650, whereas JIG gear is primarily used in subareas 630 and 650.
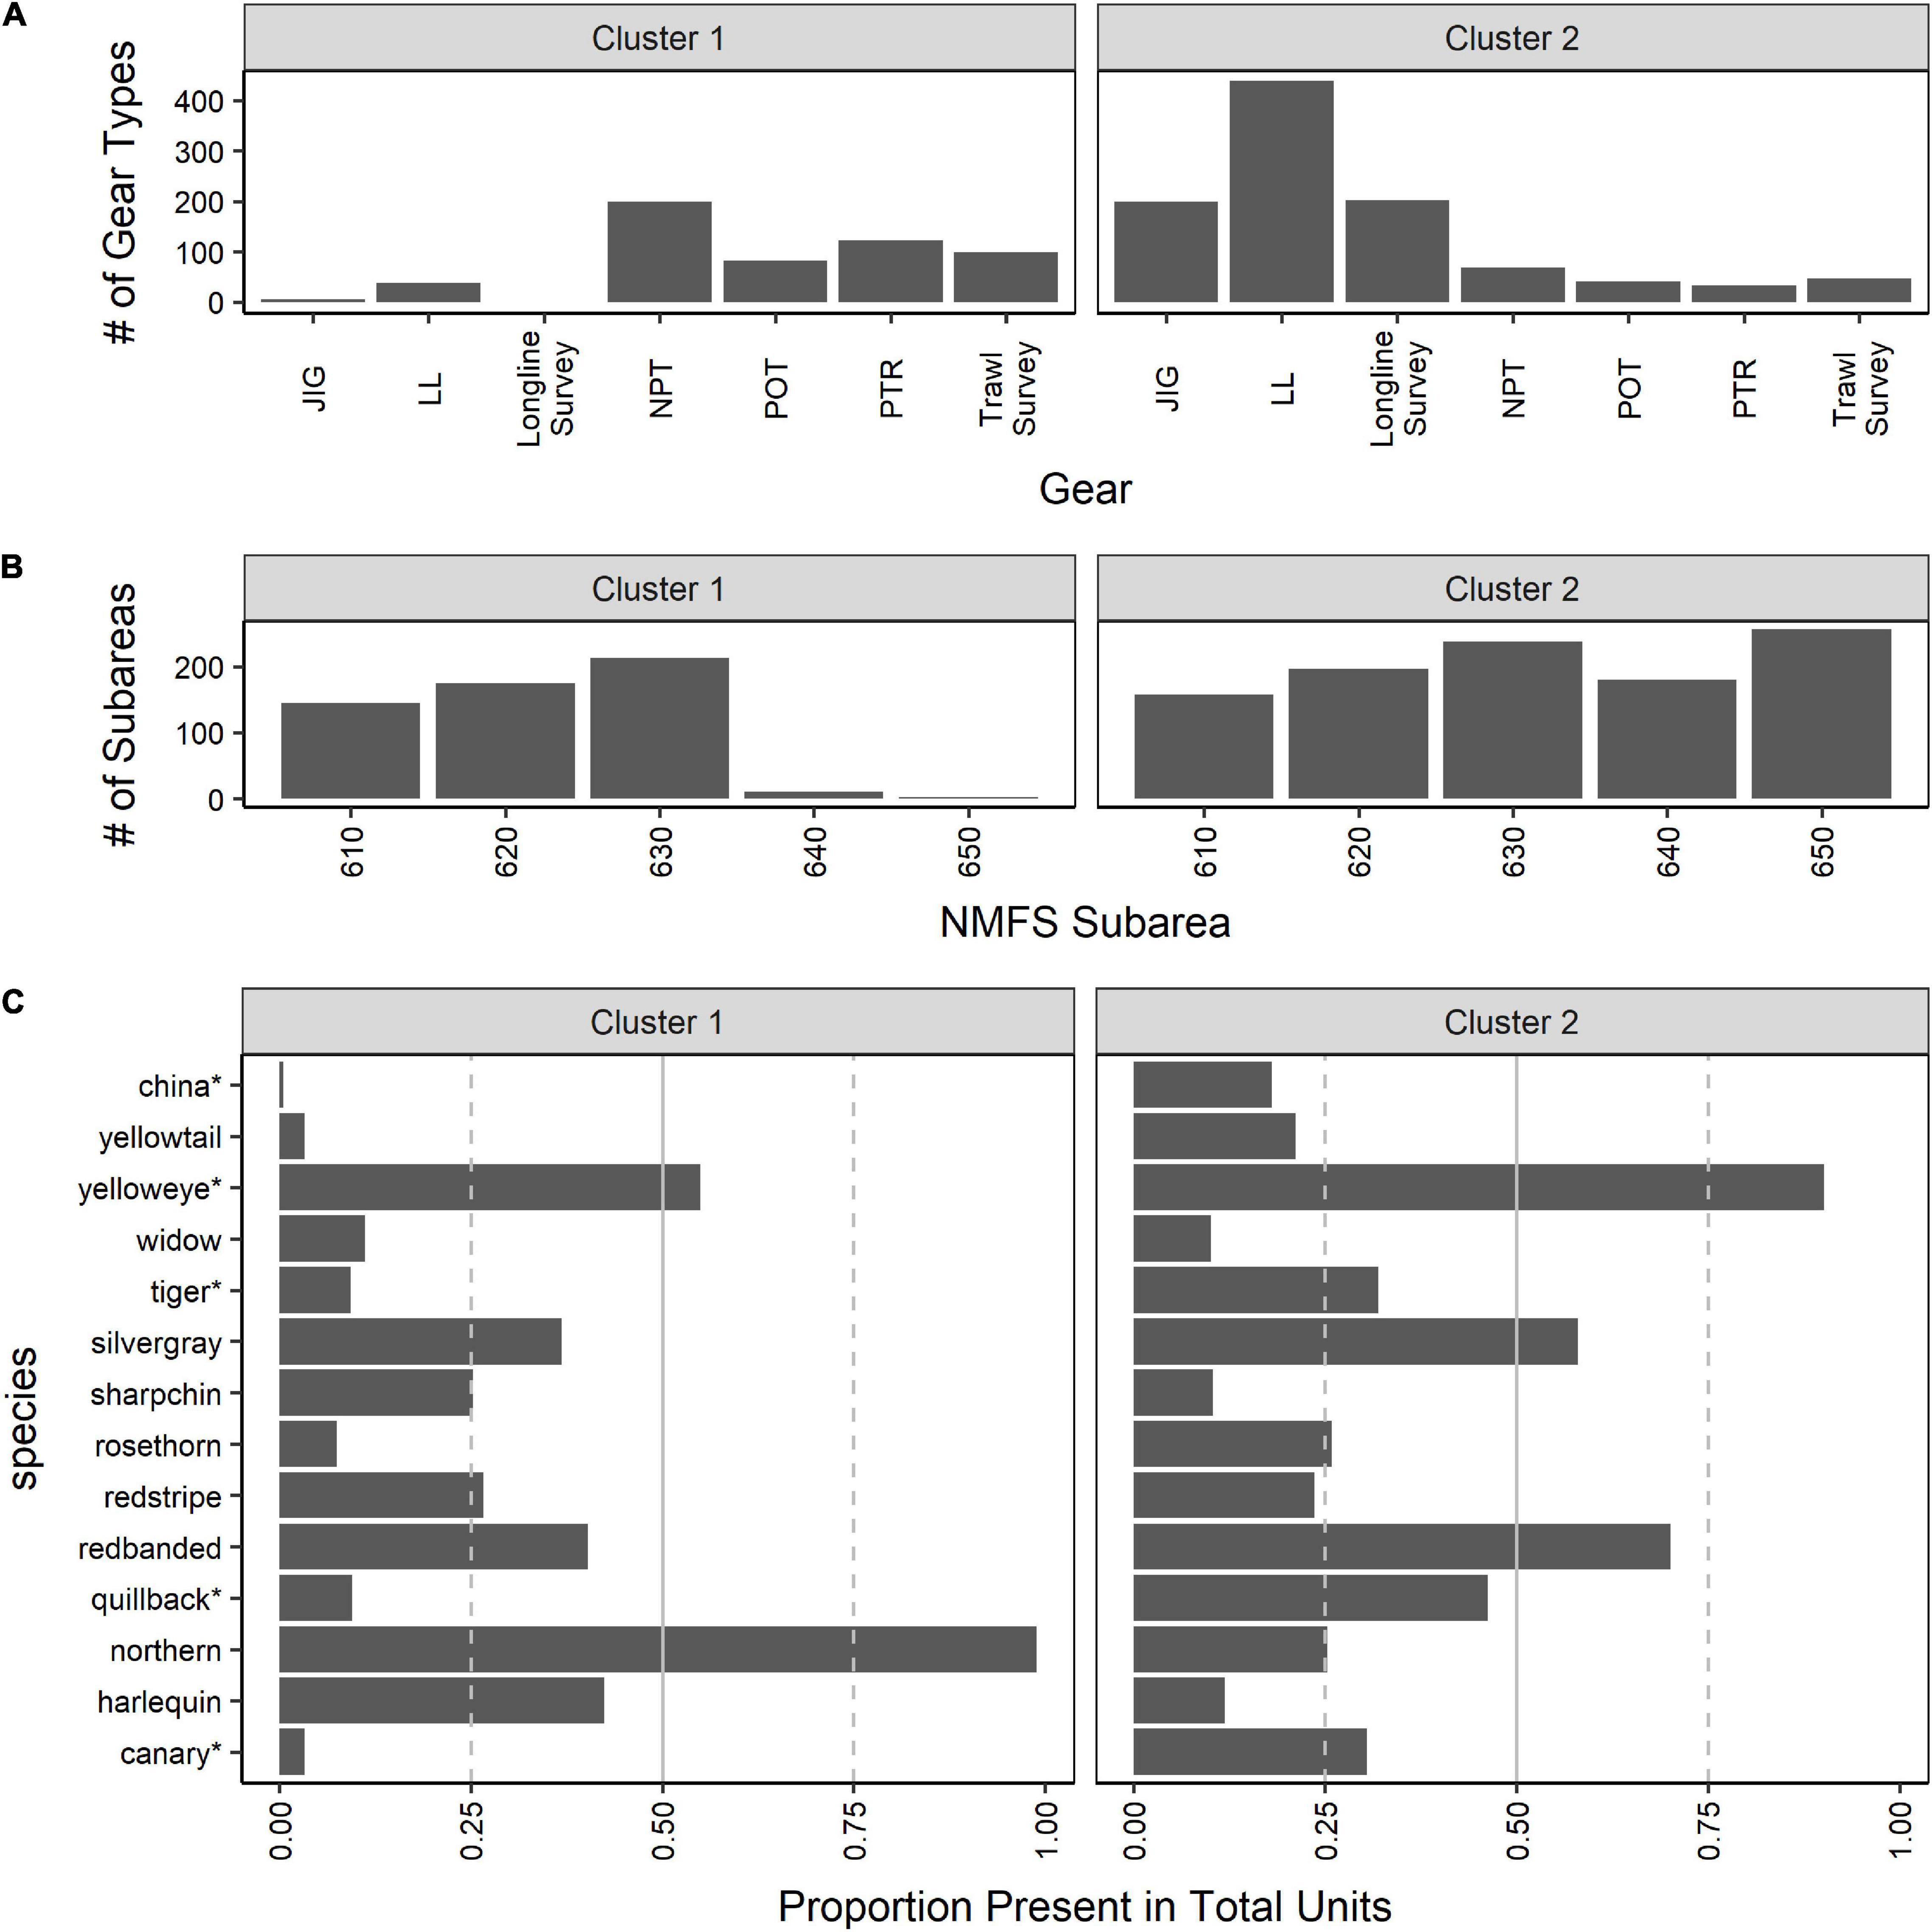
Figure 6. Results from Q-mode k-mediods using the proportions matrix with “units” (year-month-subarea-gear) to synthesize all gear types (fishing gear: jig [JIG], longline hook and line [LL], non-pelagic trawl [NPT], pot [POT], and pelagic trawl [PTR]; and surveys: longline and trawl) and subareas into one dataset when k = 2 clusters. In (A) the number of units where each gear type was present in each cluster is shown. In (B) the number of units where each subarea were present in each cluster is illustrated. In (C) the proportion of units (year-month-subarea-gear) that a species is present out of the total number of units assigned to each cluster is provided to represent the species composition in each suggested cluster when k = 2. Species that currently belong to the Demersal Shelf Rockfish complex are indicated by “*”.
The majority of the species belonging to the Demersal Shelf Rockfish complex (i.e., China, yelloweye, tiger, rosethorn, quillback and canary) had a higher proportion of presence in the cluster associated with the longline gear (cluster 2; Figure 6C). In comparison, most of the species that only belong to the Other Rockfish complex (i.e., widow, sharpchin, redstripe and harlequin) were present in higher proportion in the cluster that contained mostly all trawl gear and subareas 610, 620 and 630 (cluster 1; Figure 6C). For comparison, northern rockfish are caught in almost 100% of the units in cluster 1 (Figure 6C), which is as expected because the northern rockfish is a target species, assessed separately, and caught solely by trawl gears in subareas 610, 620, and 630. The northern rockfish results suggest that the clustering is accurately reflecting the data. There were some species that did not follow this pattern. Two species (i.e., silvergray and redbanded) that were commonly found in all gear types (Supplementary Figure 3), but belong only to the Other Rockfish complex, were found in 41% and 46%, respectively, of the total units in cluster 1 (affiliated with trawl gear; Figure 6C), whereas these two species were in 56% and 68% of the units in cluster 2 (affiliated with longline gear; Figure 6C). Additionally, yellowtail was present more frequently in the units in the cluster associated with longline gear (cluster 2; Figure 6C) than the cluster associated with trawl gear (cluster 1; Figure 6C), despite the species only being assigned to the Other Rockfish complex.
Although the results when k = 5 clusters generated more mixed groupings compared to k = 2, there was some separation among gear types (Figure 7A). The major fishery gears (i.e., NPT, JIG, and LL) each separated into their own clusters with some overlap between LL and JIG gear (i.e., clusters 3, 4, and 5, respectively, in Figure 7A). Cluster 1 consisted of a mix of all trawl gear (fishery and survey), while cluster 2 included mostly all longline survey and LL units (Figure 7A). The separation of subareas in the clusters followed a similar pattern to the k = 2 cluster results. Most clusters contained a mix of subareas (Figure 7B); however, some gear types do not fish in specific subareas.
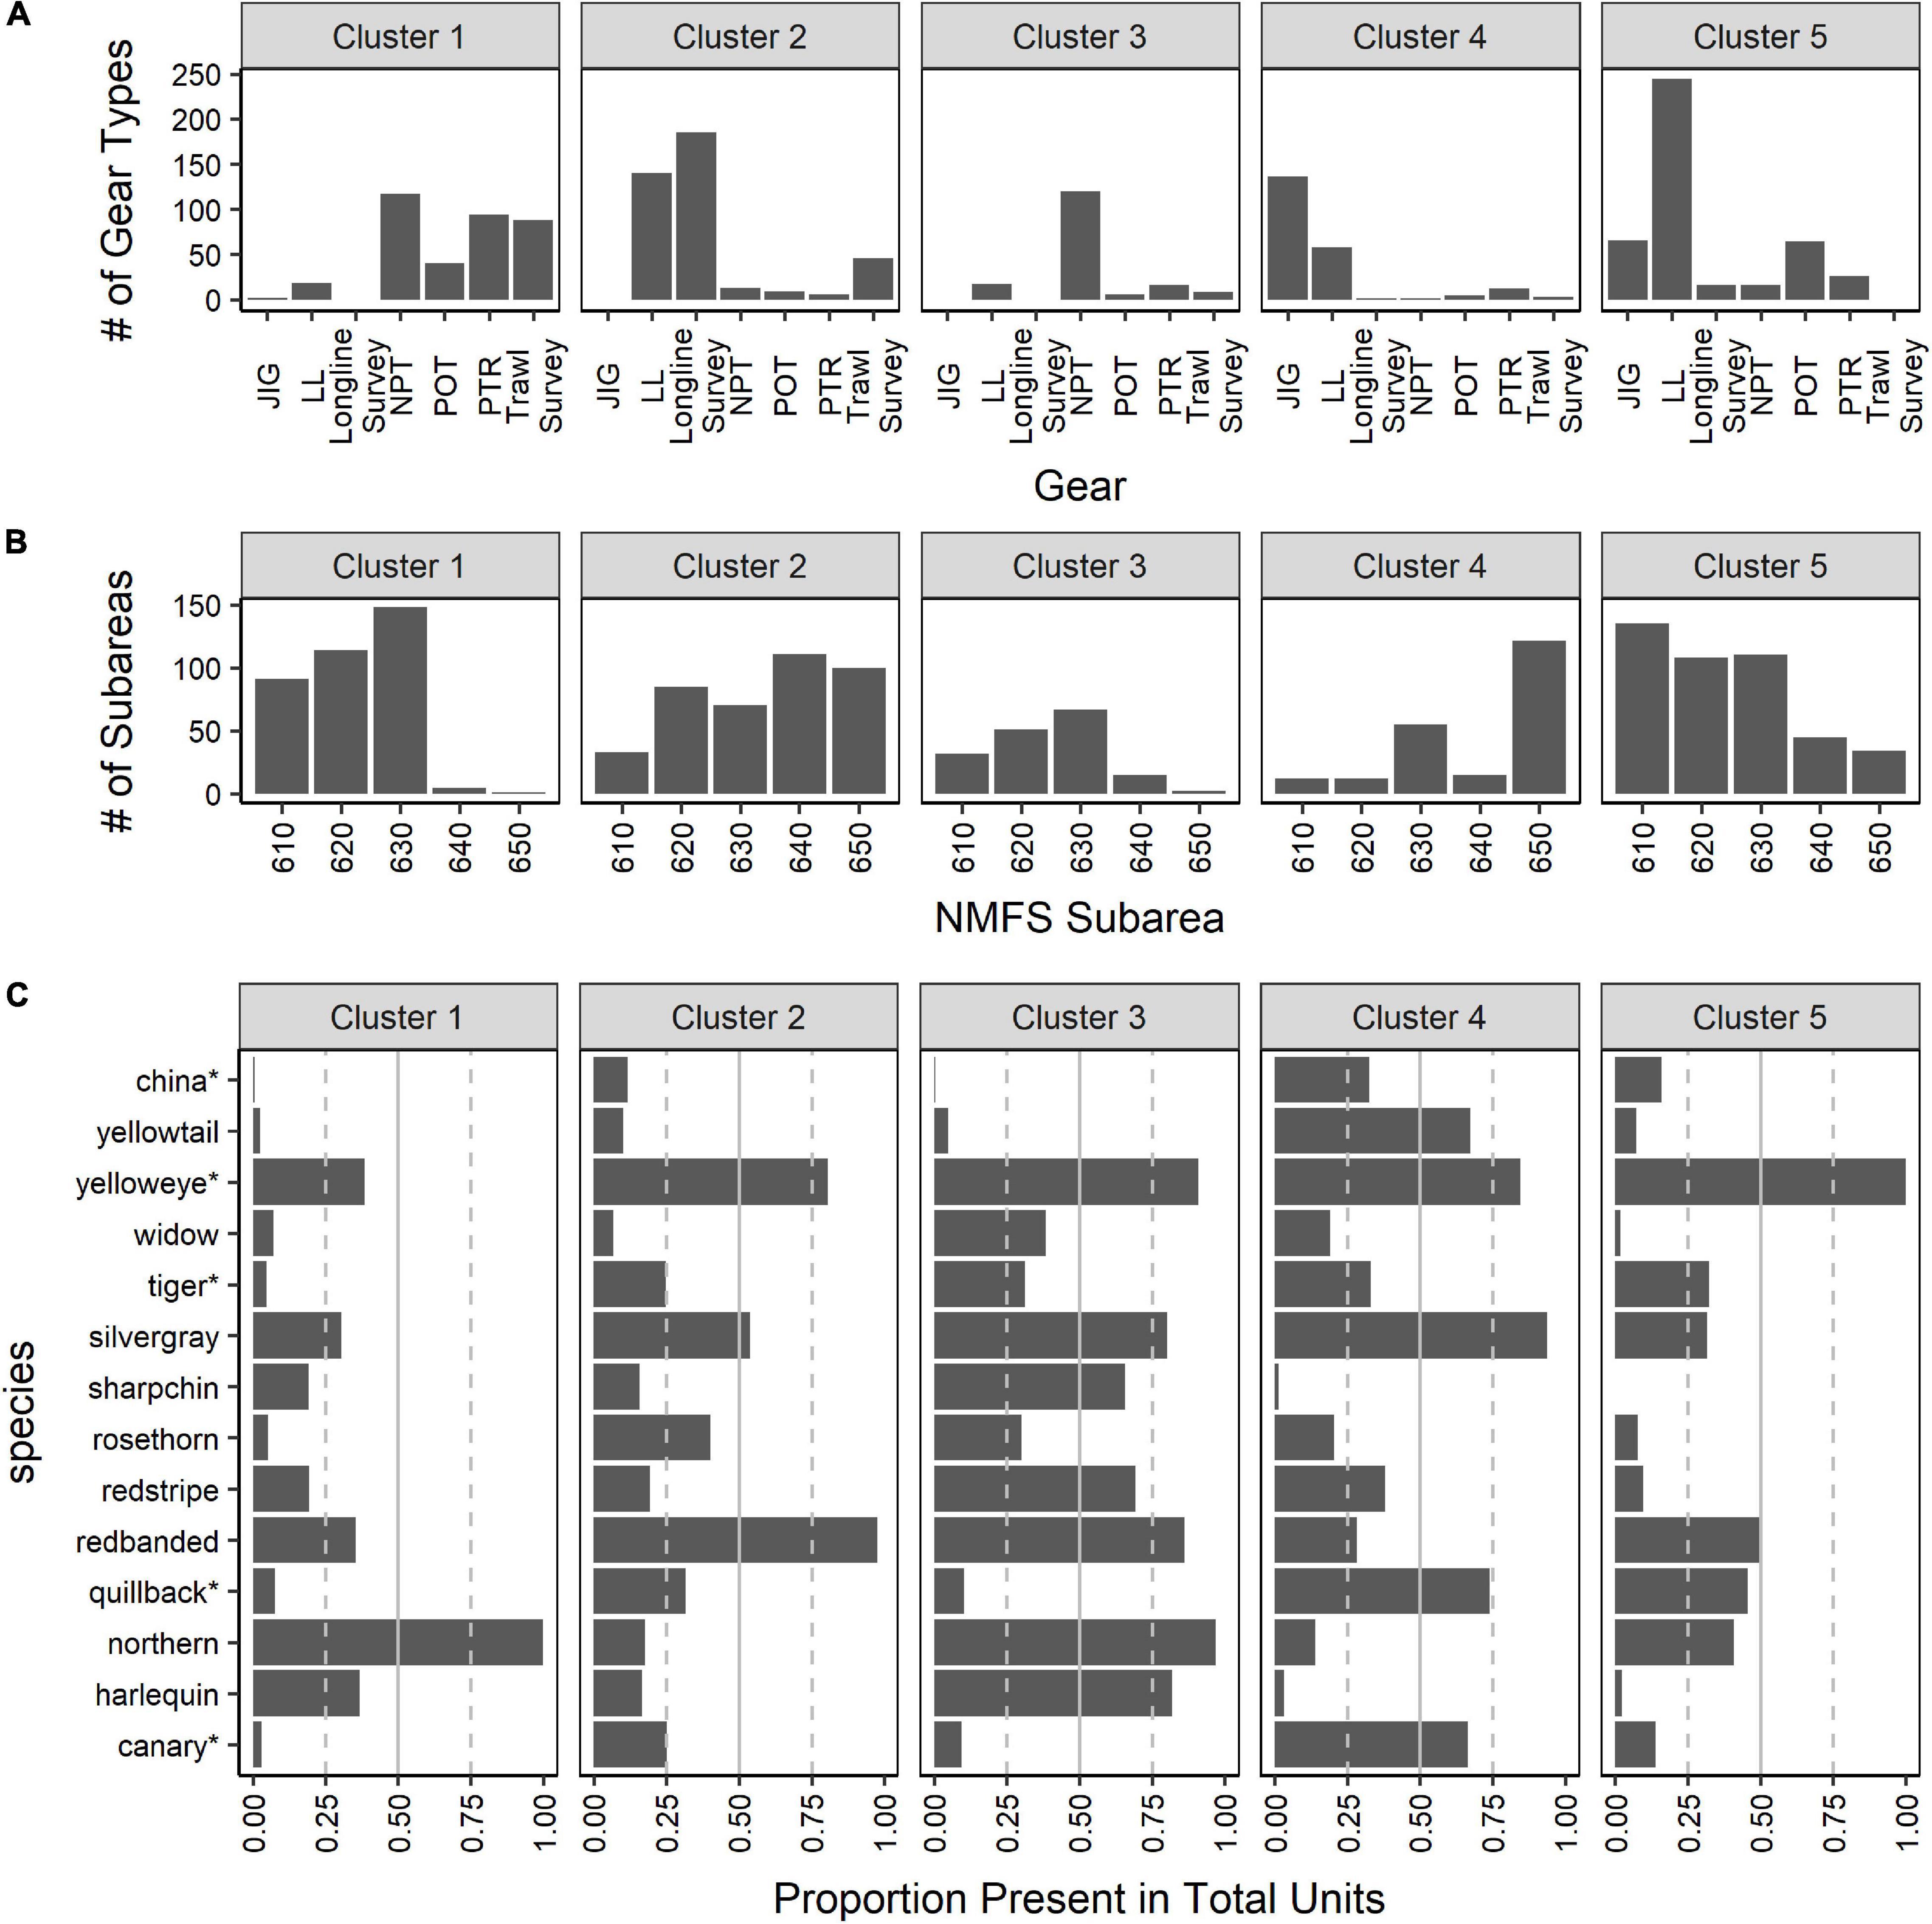
Figure 7. Results from Q-mode k-mediods using the proportions matrix with “units” (year-month-subarea-gear) to synthesize all gear types (fishing gear: jig [JIG], longline hook and line [LL], non-pelagic trawl [NPT], pot [POT], and pelagic trawl [PTR]; and surveys: longline and trawl) and subareas into one dataset when k = 5 clusters. In (A) the number of units where each gear type was present in each cluster is shown. In (B) the number of units where each subarea were present in each cluster is illustrated. In (C) the proportion of units (year-month-subarea-gear) that a species is present out of the total number of units assigned to each cluster is provided to represent the species composition in each suggested cluster when k = 5. Species that currently belong to the Demersal Shelf Rockfish complex are indicated by “*”.
There were several species that were abundant in most clusters and some species that were specific to a few clusters when k = 5 (Figure 7C). For example, yelloweye was present in 75% or more of the units in all but cluster 1 (Figure 7C). In contrast, harlequin was generally associated only with trawling gear types and subareas 610, 620 and 630 (i.e., clusters 1 and 3; Figure 7C). Similar to the species composition when k = 2 clusters, many of the Demersal Shelf Rockfish species were found in higher proportion in clusters associated with longline gear (LL, JIG, and longline survey in clusters 2, 4, and 5 covering all subareas; e.g., quillback). Yellowtail was found in higher proportion in clusters with JIG and LL (i.e., clusters 4; Figure 7C) and in low presence (i.e., < 10%) in clusters linked with longline survey and all trawl gear (Figure 7C).
Although CCA results from the proportions matrix did not reveal any species aggregations in ordination space, the results did reveal general groupings primarily by gear (Figure 8) and secondarily by subarea (Supplementary Figure 6). The groupings indicated that there were underlying differences in the species composition by gear and subarea. The other variables (i.e., year, month, and temporal factors) did not influence the groupings and were excluded from further CCA analyses. About a third (36%) of the variation could be explained by the gear and subarea variables, which suggested that these variables were correlated with the species composition. The first axis, CCA1, represented a strong gradient and explained ∼40% of the CCA variation. The second axis, CCA2, explained ∼25% of the CCA variation (Supplementary Table 1). Based on CCA1 and CCA2, the longline survey, LL and JIG all separated (Figure 8). The various trawl gear units (NPT, PTR and trawl survey) appeared to be mixed in ordination space along the CCA axes. The POT fisheries gear overlapped with both the trawl gears and LL (Figure 8). A few species are moderately associated to specific gears according to the CCA results, such as yellowtail, canary and China rockfish to JIG, longline survey, and LL. Axis CCA1 separated subarea 650 from the other subareas (Figure 8). However, all the other subareas were not affiliated with the CCA axes, indicating that gear types contributed to most of the variation.
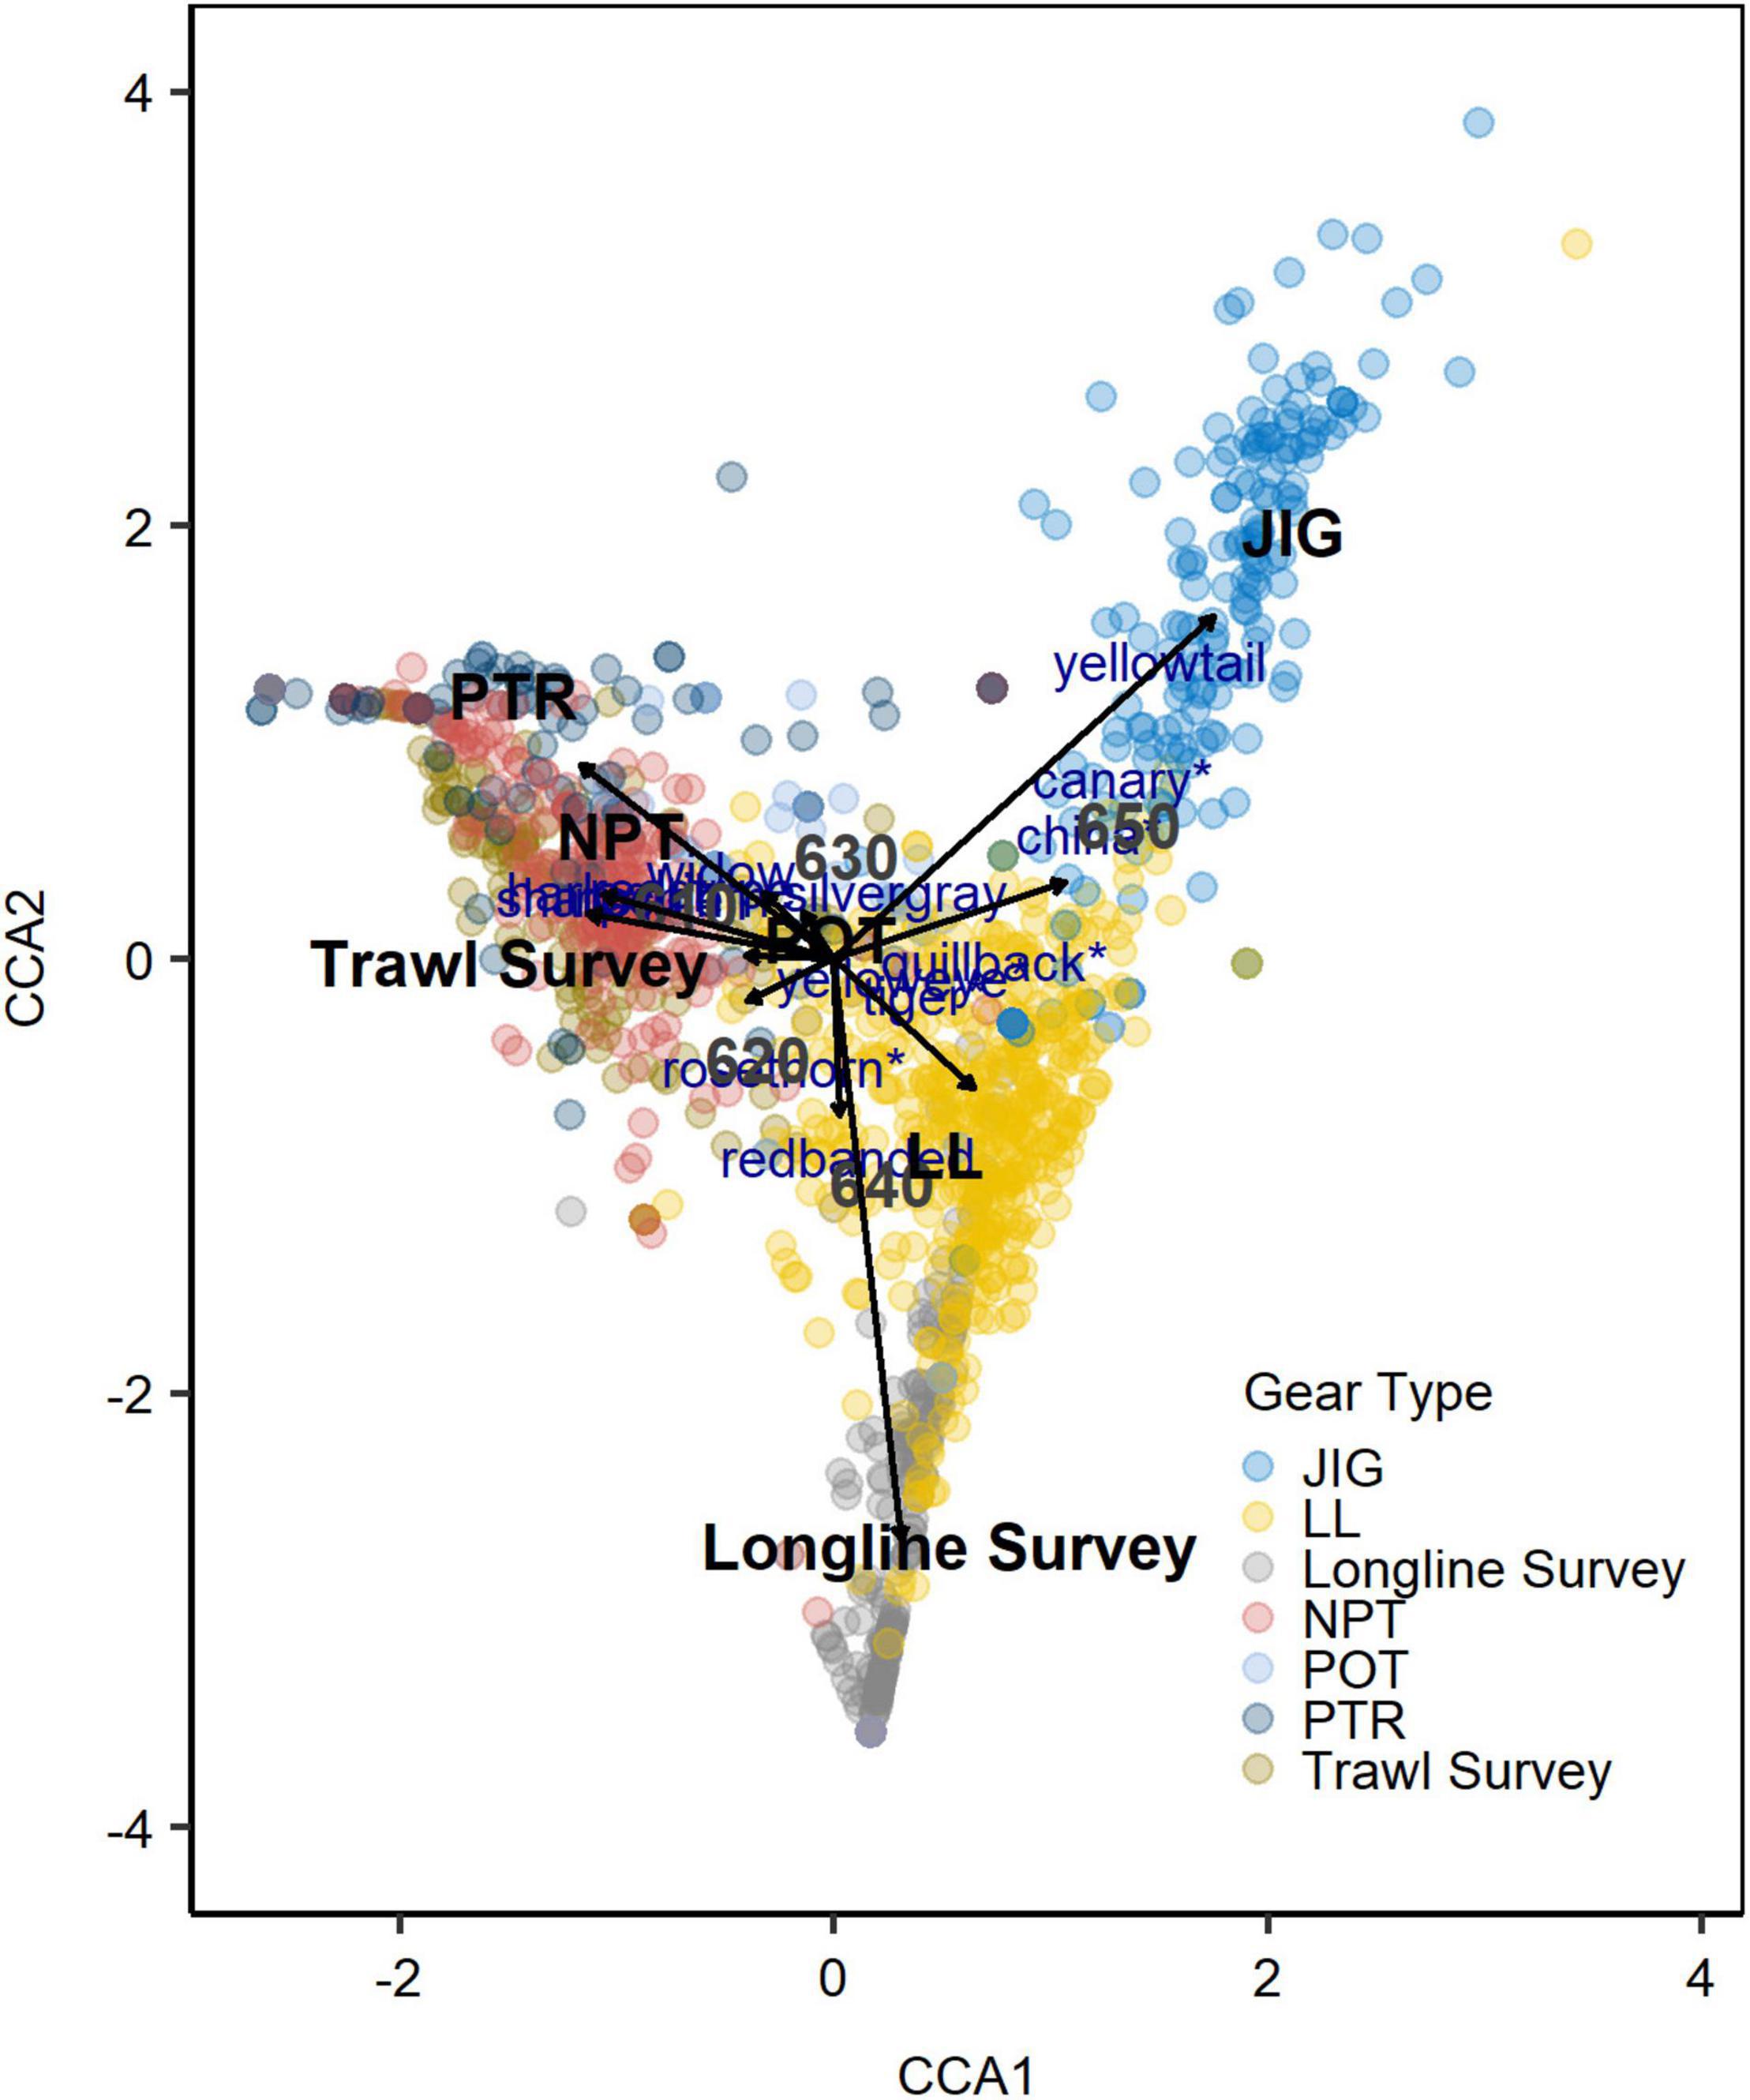
Figure 8. CCA results using the proportions matrix with units (year-month-subarea-gear) plotted on the first two CCA axes. Gear type is color coded, species are marked in blue text (with species currently assigned to the Demersal Shelf Rockfish marked with “*”) and factors (i.e., gear and subarea) provided in black bold text. Gear types include fishing gear (jig [JIG], longline hook and line [LL], non-pelagic trawl [NPT], pot [POT], and pelagic trawl [PTR]) and surveys (longline and trawl surveys).
Discussion
Our analyses demonstrate the importance of exploring a variety of quantitative methods for determining species complexes based on both life history and catch or survey data. Although each multivariate approach has associated pros and cons, utilizing multiple methods can help identify consistent trends across data and statistical approaches. The use of multiple data types and methods for identifying species complexes should be considered best practice for the management of data-limited fisheries. Our results demonstrate that reliance on single methods or a single type of data may provide limited interpretations that may lead to suboptimal species groupings and, ultimately, poor management performance.
Specific to our case study, our analyses indicate that an alteration in the complexes for management of these species may be warranted. We suggest that the Demersal Shelf Rockfish species should be separated from the remainder of the Other Rockfish complex in all subareas in the GOA for assessment purposes. The remaining bycatch rockfish from this study can be grouped together as one complex. There were no clear divisions of species based on the life history characteristics due to the uncertainty and diversity in values, and unstable clustering among methods. The application of multiple methods (clustering and ordination techniques, R- and Q-mode, and data structure) and examination of the catch and survey data provided a basis to develop possible complexes. Some methods were unsuccessful (e.g., sub-unit analyses), while others delivered sensible groupings (k-mediods in Q-mode for proportions matrix). The rockfish groupings separated mainly by gear in our analyses, which suggested that the assessment models providing management advice for these complexes should incorporate the associated survey gear.
GOA Bycatch Rockfish Results and Study Limitations
Wide ranges in productivity and resilience of species’ populations are not uncommon when applying methods to identify species complexes (DeMartini, 2019). The life history cluster analysis results indicated that rockfish in the GOA tended to group by higher (i.e., earlier age and smaller size at maturation) and lower (i.e., older age and larger size at maturation) productivity levels, but generally demonstrated a wide range in life history values. A few rockfish species had conflicting levels of productivity with different life history characteristics (e.g., long-lived with early age-at-maturity), which made it challenging to define a species with high or low productivity compared to other rockfish. The uncertainty in the life history values limits interpretation of the results. One source of uncertainty is that life history values were borrowed from outside of the GOA when data were not available and research suggests that there can be regional differences in values (Boehlert and Kappenman, 1980; Gertseva et al., 2010; Keller et al., 2012). Additionally, studies for a given species often showed variability, making it difficult to place a species into high or low productivity groupings. Given the uncertainties in the data, the results did not yield definitive groups and were deemed less reliable than the outputs of the cluster analysis using catch and survey data. Yet, based on PSA results, GOA rockfish, as a genus, fall in the lower productivity spectrum (Ormseth and Spencer, 2011). Rockfish results from Ormseth and Spencer (2011) concur with the United States West Coast groundfish PSA results (Cope et al., 2011) that included more rockfish species. Given that rockfish are generally less productive compared to the other species in the GOA, they tend to be more vulnerable to fishing pressure.
Each rockfish species faces different susceptibility to the widely varying fisheries that operate in the GOA, but one particular challenge is the placement of rare or ubiquitous species into a species group using cluster analyses. We had a range of 3 to 13 species included in the sub-unit cluster analyses depending on the gear type and subarea due to the exclusion of rare species (species with < 1% of total catch). There were 11 of the 25 species that made up < 1% of the units (year-month-subarea-gear) with positive catch for the proportions matrix. The multivariate methods in this study were unable to provide species association or coexistence relationships for these rare species. Likewise, species that are captured across many gear types and areas are difficult to assign to groups. The clustering results did not indicate specific species associations for these abundant rockfish.
Most of the clustering analyses also failed to provide consistent or reliable results when applied to each gear and subarea dataset separately through application to the sub-unit matrix. When the various methods were applied to the sub-unit matrices there were no clearly delineated relationships of commonly caught species or rarer species. We had anticipated that the finer-scale approach might provide insight into the co-occurrence among species. However, the lack of identified co-occurrence relationships (i.e., similarities among species) with the sub-unit matrices was likely because the R-mode groups by similar catch in each unit or sub-unit. As a result, the more abundant and more frequently caught species are commonly grouped. Thus, the differences in magnitude and frequency of the catch mask the less obvious relationships among species.
Aggregating all the datasets into a single data matrix enabled gears, subareas, and temporal components to be compared, while major categories that influenced the groupings could be identified. The challenge is determining logical and biologically informed clusters (e.g., balancing too few or too many clusters that may result in a narrow or wide range of species productivity), while balancing the practical management of species that are exploited across varying gear types and subarea. Using the k-mediods analysis, either two or five clusters were recommended. The suggested k = 5 clusters identified specific relationships among different gear types and occasionally subareas. Some species appeared to be associated with only a specific cluster (or clusters), whereas other species were commonly found in all clusters. The rockfish that occur in medium to high frequency in all or most of the clusters are species that are found ubiquitously in the GOA and are caught by most gear types. The results with k = 2 clusters indicated that the species composition caught by longline gear types clearly separated from trawling gear types. Overall, the analysis of the catch and survey data indicated that gear was the biggest contributing factor in grouping similar units of rockfish species composition. NMFS management subarea could have influenced the cluster results, as there was a strong interaction between fishery gear and subarea (i.e., certain gears only operate in specific subarea). These analyses suggest that rockfish species that are only predominately caught by a specific gear could be assigned to a rockfish complex that commonly associates with that gear for assessment and management purposes.
These analyses, particularly the proportions matrix analyses, provided a way to examine the species composition from the fishery catch with the survey data. Our results indicated that the trawl survey and trawl fisheries gear tended to be grouped together more frequently than the longline gear types (i.e., the longline survey, LL, and JIG). Williams and Ralston. (2002) found that the bottom trawl survey reflects the trawl fishery sector well off the coast of California and Oregon, United States, which includes non-pelagic and pelagic trawl, because it catches species that are typically found at the bottom (e.g., Keller, 2008) or distributed in the water column (e.g., widow rockfish, Wilkins, 1986). In contrast, the longline survey is a fixed station survey that targets primarily commercially important sablefish (Malecha et al., 2019). The longline survey did not always catch species typically caught in the longline fishery gear types (Supplementary Figure 3). Of the top five Other Rockfish species caught in the longline survey by numbers, only three are designated in the Demersal Shelf Rockfish complex. This result suggests that the longline survey alone is not representative of the populations within the complex or caught by the longline gear fisheries. If the Demersal Shelf Rockfish complex is extended to all subareas of the GOA, other data resources will be needed to assess this assemblage. For example, the Demersal Shelf Rockfish assessment utilizes submersibles to estimate abundance trends to set quotas in NMFS subarea 650 (Olson et al., 2018). Studies have identified that commercial catch data do not necessarily reflect the species composition in the survey data (i.e., species composition in the ecosystem; Lee and Sampson, 2000; Pennino et al., 2016), but surveys should include a broader diversity of species than that found in the commercial catch. Given the diversity of gear types utilized in the GOA, as well as specific gears fishing in habitat-specific areas (e.g., Rooper and Martin, 2012) and habitat-specific preferences of some rockfish (Laidig et al., 2009; Conrath et al., 2019), it is not surprising that the longline survey does not perfectly reflect the species composition of the various longline gear fisheries. Yet, the paucity of data available for the bycatch rockfish species in the GOA requires that any data on catch rates and composition should be utilized. We suggest the incorporation of the longline survey data in the analysis of species complexes in the GOA, despite some limitations in the overlap of the survey catch composition compared to the longline gear species composition. In the future, other survey types, such as submersibles, which are used in the current Demersal Shelf Rockfish assessment (Olson et al., 2018), should be investigated when survey data underrepresent the species composition of the fishery.
GOA Bycatch Rockfish Management Recommendations
The management of the bycatch of GOA rockfish poses a challenge because these species have a diverse range in life history values, habitat preferences, spatial distribution, and fishing vulnerability. Based on the summary of our analyses, as well as consideration of previous work with GOA rockfish complexes (e.g., the PSA of Ormseth and Spencer, 2011), we propose an alteration for management of the rockfish complexes in the GOA (Table 2). The current GOA Other Rockfish complex consists of species that are classified as the “slope,” “pelagic shelf,” and “demersal shelf” rockfish assemblages and the group of seven “demersal shelf” species are separated into the Demersal Shelf Rockfish complex in subarea 650. Our results indicated that the current delineation that split the GOA Other Rockfish and Demersal Shelf Rockfish complexes is appropriate. The analysis of catch and survey data indicated that these two complexes tended to separate by the main fishing gear types, trawl and longline, gulf-wide with the Demersal Shelf Rockfish more closely associated with the latter gear. We suggest that the Demersal Shelf Rockfish species be placed into their own complex for all subareas in the GOA.
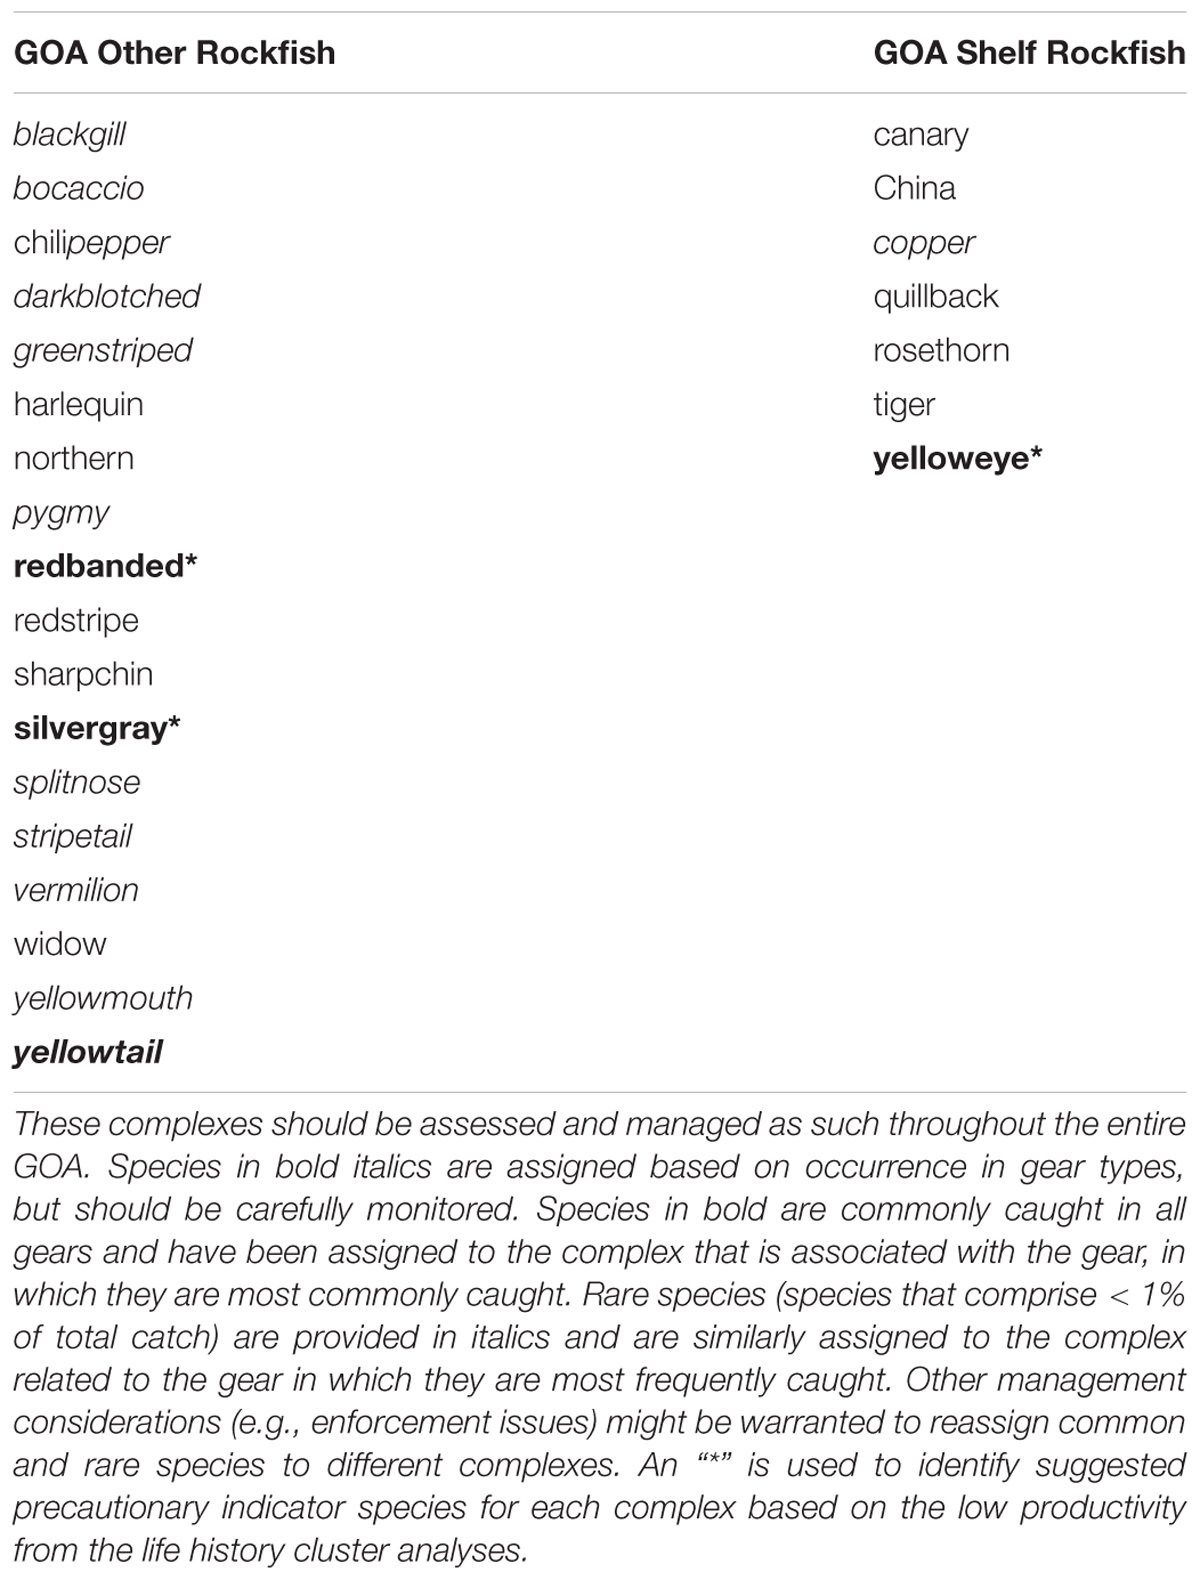
Table 2. Suggested assemblages for species complexes based on the analysis of all available data and clustering techniques.
Some alterations and considerations may be warranted, particularly for highly prevalent or rare species. For instance, silvergray and redbanded rockfish were commonly found in all gear types and were equally common in both the longline and trawl groupings. We suggest that the few species that are caught in high prevalence by all gear types should be placed in the group of species that associates with the gear that catches the species in the highest abundance (see Table 2 for these assignments). Although these bycatch rockfish are frequently caught, they do not have enough data to warrant a single-species assessment. Similar approaches will likely be appropriate for rare species, which were excluded from this analysis (but included in Table 2 based on gear association). We suggest placing rare species in the species group associated with the gear in which they are most commonly caught. By doing so will help ensure that the rare species are managed consistent with the fishing pressure that they encounter. However, rare species may be more prone to localized depletion or other conservation concerns and should be carefully monitored.
Further specific alterations to the current complexes also should be investigated. One species, yellowtail rockfish, which is assigned to the “pelagic shelf” assemblage by the North Pacific Fishery Management Council (North Pacific Fishery Management Council (NPFMC), 2019) and assessed in the Other Rockfish complex, was associated more closely with the longline gear grouping. However, this species was caught in both main fishery gear types, trawl and longline, but only caught in the trawl survey. We suggest that yellowtail rockfish remain in the Other Rockfish complex, but should be monitored due to its association with species from the Demersal Shelf rockfish complex (Table 2). Careful consideration should be applied to all species belonging to the “pelagic shelf” assemblage classified by the North Pacific Fishery Management Council (North Pacific Fishery Management Council (NPFMC), 2019), because results from this analysis split the “pelagic shelf” rockfish into opposing groups based on species association, but have different gear associations.
One method to help provide guidance for the management and sustainability of species in complexes is to identify indicator species. An indicator species should be commonly observed in the gear types associated with the clusters, demonstrate similar population trends, and share similar life history traits (e.g., reproductive success) as other species, and not have a noticeable competitive relationship with the rest of the species in the group (Landres et al., 1988; Simberloff, 1998; Zacharias and Roff, 2001). Additionally, they should exhibit the highest vulnerability or be near the lower end of the productivity spectrum for the complex (i.e., be a “weakest link” species; Shertzer and Williams, 2008). The community structure must also be relatively stable to manage a complex based on an indicator species; yet, studies often show large marine ecosystem shifts (Shertzer et al., 2009). Thus, these assumptions are often violated or no species is able to fulfill all the requirements for an appropriate indicator species (Niemi et al., 1997). However, an indicator species can still be useful by providing supplementary precautions and buffers for the complex by demonstrating potential instability within the group if the variation in the population of the indicator species increases or there are drastic changes to the population.
To help ensure sustainability for all rockfish in the complexes, it may be useful to select one or two precautionary indicator species that are on the lower end of the productivity spectrum for the complex, but are commonly observed by the predominant gear type (i.e., they are not rare species). Based on the PSA results from Ormseth and Spencer (2011); Cope et al. (2011), and our analyses on the life history characteristics, we suggest that redbanded and silvergray in the Other Rockfish complex and yelloweye in the Demersal Shelf rockfish complex may be appropriate indicator species given their low productivity and relatively high frequency of observation (Table 2). We believe that these general groupings are both practical for management advice (i.e., bycatch quotas can be enforced because groupings align by common gear types) and biologically relevant (i.e., all rockfish genus fall on the lower end of the productivity spectrum). We suggest that future research explore the possibility of identifying indicator species for the GOA Other Rockfish complex and whether redbanded and silvergray might be appropriate representatives.
Given the data limitations for the GOA Other Rockfish species (e.g., lack of consistent life history data, a number of diverse gear types, and the high occurrence of rare species that are seldom observed), the groupings for the complexes should be re-evaluated when new or updated data are available. In particular, the uncertainty in life history values used in these analyses hindered the ability to develop clusters based on productivity. For example, length data are not collected for many species in this study, but length data collection could inform key life history values. To be able to adequately represent these data-limited species, particularly rare species, improved data collection will be the only reliable solution to implement the type of species clustering approaches used in this study. Future focus on the collection of biological data from discards of rare species would be a helpful for better managing bycatch rockfish species.
In the current study, we were unable to include environmental or habitat features to the proportions matrix analyses due to the lack of data from the various fishery sectors, as well as, the problematic issue of identifying broad-scale features for entire management subareas. However, many studies examining species association or identifying species complexes have determined depth (Rogers and Pikitch, 1992; Lee and Sampson, 2000; Gomes et al., 2001; Williams and Ralston., 2002; Rooper, 2008), broad substrate or habitat structure (Anderson et al., 2009) or a combination of factors (Tolimieri and Levin, 2006) affect the species composition. Additionally, when multiple fishing gears are included in analyses to examine species composition in a given area, it is often found that different combinations of gear type, environmental, and spatial features influence the species catch (e.g., Vinther et al., 2004; Pennino et al., 2016; Tuda et al., 2016). Nonetheless, most of these studies focus on only one gear type or utilize survey data collected by submersibles, which enables researchers to determine main environmental or habitat features influencing the grouping. Further work is warranted to collect data and determine if habitat or environmental variables might help to better identify rockfish species complexes.
General Species Complex Recommendations
Appropriate methods for identifying species complexes are likely to vary on a case-by-case basis because each region and fishery has different attributes that need to be evaluated. Oftentimes, life history characteristics are unknown or complexes formed based on productivity do not necessarily align with vulnerability to the fishery or spatial distribution of the species. When there are conflicting results on groupings, managers must consider alternative options. A PSA or other risk assessment methods (e.g., Sustainability Assessment for Fishing Effects, Zhou et al., 2016) can help guide groupings for management as a preliminary tool (Cope et al., 2011), but this method may not accurately depict fishing dynamics in the susceptibility scores for all species (Hordyk and Carruthers, 2018). As previously discussed, Cope et al. (2011) recommend a step-wise method for assigning species to complexes using commonalities among species in depth preferences, spatial distribution, and vulnerability scores (i.e., based on levels of productivity and susceptibility to exploitation). Based on our analyses, we recommend that gear type needs to be considered in this step-wise grouping method, because certain species are more susceptible to specific gears than others. Incorporating gear types enables the comparison of species’ vulnerability to different fishing pressures due to differences in spatial distribution (McCully Phillips et al., 2015), patchy distributions (Silva et al., 2012), and habitat preferences (e.g., Jagielo et al., 2003; Conrath et al., 2019).
The use of a variety of multivariate methods helps validate the appropriateness of the suggested groupings. We recommend using a combination of multiple data types, data aggregation scales, and the application of several multivariate analyses to develop species complexes. Each data-limited situation requires context-specific methods tailored to intricacies of the species and fishery being managed. For example, the inadequacies of our analyses using the sub-unit matrices to identify species co-occurrence demonstrates the importance of applying multiple analyses at multiple data aggregation scales to develop robust groupings. Likewise, we suggest that exploring both R-mode and Q-mode multivariate methods is warranted, especially when fishery and survey catch are the primary sources of data. Although not as widely used for analysis of species complexes, Q-mode can be valuable to identify commonalities in species groupings across gear types and management subareas. R-mode analysis provides a more direct clustering approach by species, which is useful when reliable life history data are available or a limited number of gear types (or a single multispecies fleet) harvest the primary species of concern (e.g., reef fishes that are fished using longline gear types along the southeastern coast of the U.S. [Shertzer and Williams, 2008] and Gulf of Mexico [Farmer et al., 2016]). However, it can be difficult to get reliable outputs from R-mode when a variety of gears differentially exploit the diversity of species under consideration across a broad spatial range (i.e., management subareas). In our study, Q-mode analysis proved to be useful when determining manageable species complexes. Ultimately, there is not a single universal approach to determining species complexes that is robust to all species traits and data availability situations. Our study demonstrates that a diversity of quantitative multivariate approaches is warranted when exploring potential species complexes, while Q-mode analysis should be more widely explored, especially for situations where there are multiple gear types. Thus, the optimal groupings should be determined by commonality and consistency among a variety of different multivariate methods and datasets.
Conclusion
Managing data-limited species as a complex can be a practical approach for reducing the number of required stock assessments when insufficient data and ecological knowledge exists to perform individual stock assessments (Koutsidi et al., 2016), but the management of the complex is only as good as the information used to define the groupings (Fujita et al., 1998). We provide one of the first explorations of species complex groupings based on the combination of clustering from multiple data types (e.g., life history, catch, and survey data), multiple data aggregation scales (e.g., by sub-unit and at an aggregated “unit” scale), and a wide variety of multivariate methods (e.g., Ward’s analysis, k-mediods, CCA, and NMDS), as well as, different modes (e.g., R-mode and Q-mode). Exploration of each of these approaches was important for making management recommendations for the GOA Other Rockfish complex, because certain approaches (i.e., analyzing sub-unit matrices for the catch and survey data) failed their diagnostics of model adequacy, and data (i.e., life history characteristics) had varying levels of quality. By analyzing all of these approaches, we were able to address consistency and reliability across methods, thereby developing species complex advice that is likely more robust compared to using any single approach.
We found that the species designations for the Other Rockfish and Demersal Shelf Rockfish complexes appear to be appropriate, but these complexes should be extended across all management subareas in the GOA (i.e., the Demersal Shelf Rockfish complex is currently only delineated in subarea 650). Despite our methodology being more resource intensive and providing the same complex assignment as existing, less analytically thorough, approaches, these results are likely specific to this case study. We would expect that in other situations, using our suite of quantitative methods would result in different species assignment compared to more commonly used qualitative approaches. However, our approach does require increased resources, including both funding and personnel, which needs to be weighed against the desire to improve species assignment, assessment, and management of species complexes.
Although these results are based on the best data currently available, there is a clear need for improved data collection on bycatch species in the GOA. Collection and incorporation of other data could improve clustering analysis in the future by providing improved data on species distributions, habitat associations, and co-occurrence. As fish move poleward and into deeper depth subareas due to changing climactic conditions (e.g., Perry et al., 2005; Pinsky et al., 2013; Kleisner et al., 2017), there is likely to be a northward shift in the center of gravity for many of the GOA rockfish species examined here, which are at the northern extent of their range in the GOA. Improved data collection will be paramount for identifying changing distributions, which are likely to alter the frequency and abundance of rockfish catch by fisheries and surveys. Thus, the combination of new data collection approaches and further refinement of methods for identifying species complex groupings will be crucial to detect changes in species composition and abundance and implementing sustainable fisheries management.
Data Availability Statement
The data analyzed in this study is subject to the following licenses/restrictions: The raw survey data supporting the conclusions of this article will be made available by the author, without undue reservations. Data from the fisheries sector cannot be disclosed due to confidentiality regulations. Requests to access these datasets should be directed toYWZzYy53ZWJtYXN0ZXJAbm9hYS5nb3Y=. Analyses and code available at: https://github.com/klomori/Multivariate-Analyses-Species-Complexes.
Author Contributions
KO and CT conceived the study. KO analyzed and interpreted the data with the help and support of CT, EB, and JH and wrote the manuscript with contributions from all authors. All the authors contributed to the article and approved the submitted version. The statements, findings, conclusion, and recommendations are those of the authors and do not necessarily reflect the views of Virginia Sea Grant, NOAA, or the United States Department of Commerce.
Funding
This article was prepared by KO using Federal funds under award NMFS-Sea Grant Population Dynamics Fellowship (Award NA18OAR4170322), Virginia Sea Grant College Program Project [VASG project 721691], and from the National Oceanic and Atmospheric Administration’s (NOAA) National Sea Grant College Program, United States Department of Commerce. This article is Contribution No. 4035 of the Virginia Institute of Marine Science (VIMS), William & Mary.
Conflict of Interest
The authors declare that the research was conducted in the absence of any commercial or financial relationships that could be construed as a potential conflict of interest.
Publisher’s Note
All claims expressed in this article are solely those of the authors and do not necessarily represent those of their affiliated organizations, or those of the publisher, the editors and the reviewers. Any product that may be evaluated in this article, or claim that may be made by its manufacturer, is not guaranteed or endorsed by the publisher.
Acknowledgments
We express our gratitude to AFSC Bottom Trawl and Longline Survey Team for collecting the data, and the database management team for making the data assessible. We also thank Daniel Goethel, Andrew Scheld, Paul Spencer, Craig Faunce and reviewers for providing helpful comments and reviews on the manuscript.
Supplementary Material
The Supplementary Material for this article can be found online at: https://www.frontiersin.org/articles/10.3389/fmars.2021.663375/full#supplementary-material
References
Anderson, T. J., Syms, C., Roberts, D. A., and Howard, D. F. (2009). Multi-scale fish–habitat associations and the use of habitat surrogates to predict the organisation and abundance of deep-water fish assemblages. J. Exp. Mar. Biol. Ecol. 379, 34–42. doi: 10.1016/j.jembe.2009.07.033
Andrews, A. H., Cailliet, G. M., Coale, K. H., Munk, K. M., Mahoney, M. M., and O’Connell, V. M. (2002). Radiometric age validation of the yelloweye rockfish (Sebastes ruberrimus) from southeastern Alaska. Mar. Freshwater Res. 53, 139–146.
Andrews, A. H., Kerr, L. A., Cailliet, G. M., Brown, T. A., Lundstrom, C. C., and Stanley, R. D. (2007). Age validation of canary rockfish (Sebastes pinniger) using two independent otolith techniques: lead-radium and bomb radiocarbon dating. Mar. Freshwater Res. 58, 531–541. doi: 10.1071/mf07074
Bechtol, W. R. (1998). A synopsis of life history and assessment of Cook Inlet rockfish. Regional Information Report No. 2A98-40. Anchorage, AK: Alaska Dept. of Fish and Game.
Beyer, S. G., Sogard, S. M., Harvey, C. J., and Field, J. C. (2015). Variability in rockfish (Sebastes spp.) fecundity: species contrasts, maternal size effects, and spatial differences. Environ. Biol. Fishes 98, 81–100. doi: 10.1007/s10641-014-0238-7
Boehlert, G. W., and Kappenman, R. F. (1980). Variation of growth with latitude in two species of rockfish (Sebastes pinniger and S. diploproa) from the northeast Pacific Ocean. Mar. Ecol. Prog. Ser 3, 1–10. doi: 10.3354/meps003001
CFP (2013). Regulation (EU) No 1380/2013 of the European Parliament and of the Council of 11 December 2013 on the Common Fisheries Policy. Official J. Eur. U. 354, 22–61.
Chilton, D. E., and Beamish, R. J. (1982). Age Determination Methods for Fishes Studied by the Groundfish Program at the Pacific Biological Station. Ottawa: Dept. of Fisheries and Oceans, 102.
Conrath, C. L., Rooper, C. N., Wilborn, R. E., Knoth, B. A., and Jones, D. T. (2019). Seasonal habitat use and community structure of rockfishes in the Gulf of Alaska. Fish. Res. 219:105331. doi: 10.1016/j.fishres.2019.105331
Cope, J., Dick, E. J., MacCall, A., Monk, M., Soper, B., and Wetzel, C. (2015). Data-Moderate Stock Assessments for Brown, China, Copper, Sharpchin, Stripetail, and Yellowtail Rockfishes and English and Rex Soles in 2013. Portland, OR: Pacific Fishery Management Council, 298.
Cope, J. M., DeVore, J., Dick, E. J., Ames, K., Budrick, J., Erickson, D. L., et al. (2011). An approach to defining stock complexes for US West Coast groundfishes using vulnerabilities and ecological distributions. North Am. J. Fish. Manage. 31, 589–604. doi: 10.1080/02755947.2011.591264
DeMartini, E. E. (2019). Hazards of managing disparate species as a pooled complex: a general problem illustrated by two contrasting examples from Hawaii. Fish Fish. 20, 1246–1259. doi: 10.1111/faf.12404
Echeverria, T. W. (1987). Thirty-four species of California rockfishes: maturity and seasonality of reproduction. Fish. Bull. U.S. 85, 229–250.
Edwards, A. M., Haigh, R., and Starr, P. J. (2012). Stock Assessment and Recovery Potential Assessment for Yellowmouth Rockfish (Sebastes reedi) Along the Pacific Coast of Canada. DFO Can. Sci. Advis. Sec. Res. Doc. 2012/095. Ottawa, ON: Fisheries and Oceans Canada, iv+188.
Farmer, N. A., Malinowski, R. F., McGovern, M. F., and Rubec, P. J. (2016). Stock complexes for fisheries management in the Gulf of Mexico. Mar. Coast. Fish. 8, 177–201. doi: 10.1080/19425120.2015.1024359
Froese, R., and Pauly, D. (2010). FishBase. Available online at: https://fishbase.org (accessed May 25, 2020).
Fujita, R. M., Foran, T., and Zevos, I. (1998). Innovative approaches for fostering conservation marine fisheries. Ecol. Appl. 8, S139–S150. doi: 10.1007/978-3-319-78622-3_6
Gertseva, V. V., and Cope, J. M. (2011). Population dynamics of splitnose rockfish (Sebastes diploproa) in the Northeast Pacific Ocean. Ecol. Model. 222, 973–981. doi: 10.1016/j.ecolmodel.2010.12.003
Gertseva, V. V., Cope, J. M., and Matson, S. E. (2010). Growth variability in the splitnose rockfish Sebastes diploproa of the northeast Pacific Ocean: pattern revisited. Mar. Ecol. Prog. Ser. 413, 125–136. doi: 10.3354/meps08719
Gomes, M. C., Serrao, E., and de Fátima Borges, M. (2001). Spatial patterns of groundfish assemblages on the continental shelf of Portugal. ICES J. Mar. Sci. 58, 633–647. doi: 10.1006/jmsc.2001.1052
Gunderson, D. R., Zimmermann, M., Nichol, D. G., and Pearson, K. (2003). Indirect estimates of natural mortality rate for arrowtooth flounder (Atheresthes stomias) and darkblotched rockfish (Sebastes crameri). Fish. Bull., U.S. 101, 175–182.
Heifetz, J., Ianelli, J. N., and Clausen, D. M. (1997). Slope Rockfish. Stock Assessment and Fishery Evaluation (SAFE) Report for the Groundfish Resources of the Gulf of Alaska. Anchorage AK: North Pacific Fisheries Management Council, 247–288.
Hennig, C. (2007). Cluster-wise assessment of cluster stability. Comput. Stat. Data An. 52, 258–271. doi: 10.1016/j.csda.2006.11.025
Hennig, C. (2020). fpc: Flexible Procedures for Clustering. R package version 2.2-5. Available online at: https://CRAN.R-project.org/package=fpc (accessed December 06, 2020).
Hicks, A. C., Haltuch, M. A., and Wetzel, C. (2009). Status of Greenstriped Rockfish (Sebastes elongatus) Along the Outer Coast of California, Oregon, and Washington. Northwest Fishery Science Center, 2725 Montlake, Blvd. E. Seattle, WA: Northwest Fishery Science Center.
Hordyk, A. R., and Carruthers, T. R. (2018). A quantitative evaluation of a qualitative risk assessment framework: examining the assumptions and predictions of the Productivity Susceptibility Analysis (PSA). PLoS One 13:e0198298. doi: 10.1371/journal.pone.0198298
Jagielo, T., Hoffmann, A., Tagart, J., and Zimmermann, M. (2003). Demersal groundfish densities in trawlable and untrawlable habitats off Washington: implications for the estimation of habitat bias in trawl surveys. Fish. Bull., U.S. 101, 545–565.
Jiao, Y., Hayes, C., and Cortes, E. (2009). Hierarchical Bayesian approach for population dynamics modeling of fish complexes without species-specific data. ICES J. Mar. Sci. 66, 367–377. doi: 10.1093/icesjms/fsn162
Johnson, S. W., Murphy, M. L., and Csepp, D. J. (2003). Distribution, habitat, and behavior of rockfishes, Sebastes spp., in nearshore waters of southeastern Alaska: observations from a remotely operated vehicle. Environ. Biol. Fishes 66, 259–270. doi: 10.1023/a:1023981908146
Kassambara, A., and Mundt, F. (2020). Factoextra: Extract and Visualize the Results of Multivariate Data Analyses. R package version 1.0.7. Available online at: https://CRAN.R-project.org/package=factoextra (accessed April 1, 2020).
Kaufman, L. R., and Rousseeuw, P. J. (1990). Finding Groups in Data: An Introduction to Cluster Analysis. Hoboken NJ: John Wiley & Sons Inc, 725.
Keller, A. A. (2008). The 2005 US West Coast Bottom Trawl Survey of Groundfish Resources off Washington, Oregon, and California: Estimates of Distribution, Abundance, and Length Composition. Washington DC: NOAA.
Keller, A. A., Molton, K. J., Hicks, A. C., Haltuch, M., and Wetzel, C. (2012). Variation in age and growth of greenstriped rockfish (Sebastes elongatus) along the U.S. west coast (Washington to California). Fish. Res. 119–120, 80–88. doi: 10.1016/j.fishres.2011.12.012
Kerr, L. A., Andrews, A. H., Munk, K., Coale, K. H., Frantz, B. R., Cailliet, G. M., et al. (2005). Age validation of quillback rockfish (Sebastes maliger) using bomb radiocarbon. Fish. Bull. U.S. 103, 97–107.
Kleisner, K. M., Fogarty, M. J., McGee, S., Hare, J. A., Moret, S., Perretti, C. T., et al. (2017). Marine species distribution shifts on the US Northeast Continental Shelf under continued ocean warming. Prog. Oceanogr. 153, 24–36. doi: 10.1016/j.pocean.2017.04.001
Koutsidi, M., Tzanatos, E., Machias, A., and Vassilopoulou, V. (2016). Fishing for function: the use of biological traits to evaluate the effects of multispecies fisheries on the functioning of fisheries assemblages. ICES J. Mar. Sci. 73, 1091–1103. doi: 10.1093/icesjms/fsw006
Kramer, D. E., and O’Connell, V. M. (1988). Guide to Northeast Pacific Rockfishes: Genera Sebastes and Sebastolobus, Marine Advisory Bulletin 25. Alaska Sea Grant College Program. Fairbanks, AK: University of Alaska.
Laidig, T. E., Watters, D. L., and Yoklavich, M. M. (2009). Demersal fish and habitat associations from visual surveys on the central California shelf. Estuar. Coast. Shelf Sci. 83, 629–637. doi: 10.1016/j.ecss.2009.05.008
Landres, P. B., Verner, J., and Thomas, J. W. (1988). Ecological uses of vertebrate indicator species: a critique. Cons. Biol. 2, 316–328. doi: 10.1111/j.1523-1739.1988.tb00195.x
Lee, Y., and Sampson, B. (2000). Spatial and temporal stability of commercial groundfish assemblages off Oregon and Washington as inferred from Oregon trawl logbooks. Can. J. Fish. Aquat. Sci. 57, 2443–2454. doi: 10.1139/f00-223
Lenarz, W. (1987). Ageing and Growth of Widow Rockfish, pp. 31-35. In Widow Rockfish, Proceedings of a Workshop, Tiburon, California, December 11-12, 1980. U.S. Dep. Commer., NOAA Tech. Rep. NMFS-48. Tiburon CA: NOAA.
Love, M. S., Yoklavich, M., and Thorsteinson, L. (2002). The Rockfishes of the Northeast Pacific. Berkeley CA: Univ. Calif. Press.
MacCall, A. D. (2005). Assessment of Vermilion Rockfish in Southern and Northern California. Portland, OR: Pacific Fishery Management Council.
Malecha, P. W., Hanselman, D. H., and Heifetz, J. (2007). Growth and Mortality of Rockfishes (Scorpaenidae) from Alaska Waters. U.S. Dep. Commer., NOAA Tech. Memo. NMFS-AFSC-172, 61. Washington, D.C: NOAA.
Malecha, P. W., Rodgveller, C. J., Lunsford, C. R., and Siwicke, K. A. (2019). The 2018 Longline Survey of the Gulf of Alaska and Eastern Aleutian Islands on the FV Alaskan Leader: Cruise Report AL-18-01. AFSC Processed Rep. 2019-02, 30 p. Alaska Fish. Sci. Cent., NOAA, Natl. Mar. Fish. Serv., 7600 Sand Point Way NE. Seattle WA: NOAA, 98115.
Manly, B. F. J. (2005). Multivariate Statistical Methods: a Primer, 3rd Edn. London: Chapman & Hall and CRC Press.
McCully Phillips, S. R., Scott, F., and Ellis, J. R. (2015). Having confidence in productivity susceptibility analyses: A method for underpinning scientific advice on skate stocks? Fish. Res. 171, 87–100. doi: 10.1016/j.fishres.2015.01.005
MSRA (Magnuson-Stevens Fishery Conservation and Management Reauthorization Act of 2006) (2007). Public Law no. 109-479, 120 Stat. 3575. Available online at: https://www.fisheries.noaa.gov/resource/document/magnuson-stevens-fishery-conservation-and-management-act.
Munk, K. M. (2001). Maximum ages of groundfishes in waters off Alaska and British Columbia and considerations of age determination. AK Fish. Bull. 8, 12–21.
Nichol, D. G. (1990). Life History Examination of Darkblotched Rockfish (Sebastes crameri) off the Oregon Coast. Master’s Thesis. Corvallis: Oregon State University.
Nichol, D. G., and Pikitch, E. K. (1994). Reproduction of darkblotched rockfish off the Oregon Coast. Trans. Am. Fish. Soc. 123, 469–481. doi: 10.1577/1548-8659(1994)123<0469:rodrot>2.3.co;2
Niemi, G. J., Hanowski, J. M., Lima, A. R., Nicholls, T., and Weiland, N. (1997). A critical analysis on the use of indicator species in management. J Wildl. Manage. 61, 1240–1252. doi: 10.2307/3802123
North Pacific Fishery Management Council (NPFMC) (2019). North Pacific Fisheries Management Plan for Groundfish of the Gulf of Alaska, 605 W. 4th Ave, Suite 306, Anchorage, AK 99501. Anchorage, AK: NPFMC, 130.
Oksanen, J., Blanchet, F. G., Friendly, M., Kindt, R., Legendre, P., McGlinn, D., et al. (2019). vegan: Community Ecology Package. R package version 2.5-6. Available online at: https://CRAN.R-project.org/package=vegan (accessed November 28, 2020).
Olson, A., Williams, B., and Jaenicke, M. (2018). Assessment of the Demersal Shelf Rockfish Stock Complex in the Southeast Outside Subdistrict of the Gulf of Alaska. In Stock Assessment and Fishery Evaluation Report for the Groundfish Resources of the Gulf of Alaska, North Pacific Fishery Management Council, 605 W 4th Ave, Suite 306. Anchorage, AK 99501. Anchorage, AK: North Pacific Fishery Management Council, 47.
Ormseth, O. A., and Spencer, P. D. (2011). An assessment of vulnerability in alaska groundfish. Fish. Res. 112, 127–133. doi: 10.1016/j.fishres.2011.02.010
Patrick, W. S., Spencer, P., Link, J., Cope, J., Field, J., Kobayashi, D., et al. (2010). Using productivity and susceptibility indices to assess the vulnerability of United States fish stocks to overfishing. Fish. Bull. U.S. 108, 305–322.
Pennino, M. G., Thomé-Souza, M. J. F., Carvalho, A. R., da Silveira Fontes, L. C., Parente, C., and Lopes, P. F. M. (2016). A spatial multivariate approach to understand what controls species catch composition in small-scale fisheries. Fish. Res. 175, 132–141. doi: 10.1016/j.fishres.2015.11.028
Perry, A. L., Low, P. J., Ellis, J. R., and Reynolds, J. D. (2005). Climate change and distribution shifts in marine fishes. Science 308, 1912–1915. doi: 10.1126/science.1111322
Phillips, J. B. (1964). Life History Studies on ten Species of Rockfish (genus Sebastodes). Cal. Dep. Fish Game Fish Bull. 126. San Diego CA: University of California.
Pikitch, E. K. (1991). Technological interactions in the U.S. West Coast groundfish fishery and their implications for management. ICES Mar. Sci. Symp. 193, 253–263.
Piner, K. R., Wallace, J. R., Hamel, O. S., and Mikus, R. (2006). Evaluation of ageing accuracy of bocaccio (Sebastes paucispinis) rockfish using bomb radiocarbon. Fish. Res. 77, 200–206. doi: 10.1016/j.fishres.2005.10.003
Pinsky, M. L., Worm, B., Fogarty, M. J., Sarmiento, J. L., and Levin, S. A. (2013). Marine taxa track local climate velocities. Science 341, 1239–1242. doi: 10.1126/science.1239352
R Core Team (2020). R: A Language and Environment for Statistical Computing. Vienna: R Foundation for Statistical Computing.
Rogers, J. B., and Pikitch, E. K. (1992). Numerical definition of groundfish assemblages caught off the coasts of Oregon and Washington using commercial fishing strategies. Can. J. Fish. Aquat. Sci. 49, 2648–2656. doi: 10.1139/f92-293
Rooper, C. N. (2008). An ecological analysis of rockfish (Sebastes spp.) assemblages in the North Pacific Ocean along broad-scale environmental gradients. Fish. Bull. U.S. 106, 1–11.
Rooper, C. N., and Martin, M. H. (2012). Comparison of habitat-based indices of abundance with fishery-independent biomass estimates from bottom trawl surveys. Fish. Bull. U.S. 110, 21–35.
Rousseeuw, P. J. (1987). Silhouettes: a graphical aid to the interpretation and validation of cluster analysis. J. Comput. Appl. Math. 20, 53–65. doi: 10.1016/0377-0427(87)90125-7
Shertzer, K. W., Williams, E. H., and Taylor, J. C. (2009). Spatial structure and temporal patterns in a large marine ecosystem: exploited reef fishes of the southeast United States. Fish. Res. 100, 126–133. doi: 10.1016/j.fishres.2009.06.017
Shertzer, K. W., and Williams, E. W. (2008). Fish assemblages and indicator species: reef fishes off the southeastern United States. Fish. Bull., U.S. 106, 257–269.
Shirkhorshidi, A. S., Aghabozorgi, S., and Wah, T. Y. (2015). A comparison study on similarity and dissimilarity measures in clustering continuous data. PLoS One 10:e0144059. doi: 10.1371/journal.pone.0144059
Silva, J. F., Ellis, J. R., and Catchpole, T. L. (2012). Species composition of skates (Rajidae) in commercial fisheries around the British Isles and their discarding patterns. J. Fish Biol. 80, 1678–1703. doi: 10.1111/j.1095-8649.2012.03247.x
Simberloff, D. (1998). Flagships, umbrellas, and keystones: is single-species management passé in the landscape era? Biol. Conserv. 83, 247–257. doi: 10.1016/s0006-3207(97)00081-5
Stanley, R. D., and Kronlund, A. R. (2005). Life history characteristics for silvergray rockfish (Sebastes brevispinis) in British Columbia waters and the implications for stock assessment and management. Fish. Bull. U.S. 103, 670- -684.
Stevens, M. M., Andrews, A. H., Cailliet, G. M., Coale, K. H., and Lundstrom, C. C. (2004). Radiometric validation of age, growth, and longevity for the blackgill rockfish (Sebastes melanostomus). Fish. Bull., U.S. 102, 711–722.
Tagart, J., Wallace, F., and Ianelli, J. N. (2000). Status of the Yellowtail Rockfish Resource in 2000. Portland, OR: Pacific Fishery Management Council.
Thorson, J. T., Munch, S. B., Cope, J. M., and Gao, J. (2017). Predicting life history parameters for all fishes worldwide. Ecol. Appl. 27, 2262–2276. doi: 10.1002/eap.1606
Tolimieri, N., and Levin, P. S. (2006). Assemblage structure of eastern Pacific groundfishes on the US continental slope in relation to physical and environmental variables. Trans. Am. Fish. Soc. 135, 317–332. doi: 10.1577/t05-092.1
Tribuzio, C. A., and Echave, K. B. (2019). Assessment of the Other Rockfish Stock Complex in the Gulf of Alaska. In…. Stock Assessment and Fishery Evaluation Report for the Groundfish Resources of the Gulf of Alaska, North Pacific Fishery Management Council, 605 W 4th Ave, Suite 306. Anchorage, AK 99501. Anchorage, AK: North Pacific Fishery Management Council, 49.
Tuda, P. M., Wolff, M., and Breckwoldt, A. (2016). Size structure and gear selectivity of target species in the multispecies multigear fishery of the Kenyan South Coast. Ocean Coast. Manage. 130, 95–106. doi: 10.1016/j.ocecoaman.2016.06.001
USOFR (U.S. Office of the Federal Register) (2009). Magnuson–Stevens Act provisions; Annual Catch Limits; National Standard Guidelines. Code of Federal Regulations, Title 50, Part 600. U.S. Washington, D.C: Government Printing Office.
Vinther, M., Reeves, S. A., and Patterson, K. R. (2004). From single-species advice to mixed species management: taking the next step. ICES J. Mar. Sci. 61, 1398–1409. doi: 10.1016/j.icesjms.2004.08.018
von Szalay, P. G., and Raring, N. W. (2018). Data Report: 2017 Gulf of Alaska Bottom Trawl Survey. U.S. Dep. Commer., NOAA Tech. Memo. NMFS-AFSC-374. Washington, D.C: NOAA.
Ward, J. H. Jr. (1963). Hierarchical grouping to optimize an objective function. J. Am. Stat. Assoc. 58, 236–244. doi: 10.1080/01621459.1963.10500845
Westrheim, S. J. (1975). Reproduction, maturation, and identification of larvae of some Sebastes (Scorpaenidae) species in the northwest Pacific Ocean. J. Fish. Res. Bd Can. 32, 2399–2411. doi: 10.1139/f75-277
Westrheim, S. J., and Harling, W. R. (1975). Age-Length Relationships for 26 Scorpaenids in the Northeast Pacific Ocean. Fisheries and Marine Service Research and Development Technical Report 565. Nanaimo BC: Department of Fisheries and Oceans Resource Services.
Wilkins, M. E. (1986). Development and evaluation of methodologies for assessing and monitoring the abundance of widow rockfish, Sebastes entomelas. Fish. Bull. 84, 287–310.
Williams, E. H., and Ralston, S. (2002). Distribution and co-occurrence of rockfishes (family: Sebastidae) over trawlable shelf and slope habitats of California and southern Oregon. Fish. Bull., U.S. 100, 836–855.
Wilson, C. D., and Boehlert, G. W. (1990). The effects of different otolith ageing techniques on estimates of growth and mortality for the splitnose rockfish, Sebastes diploproa, and canary rockfish, S. pinniger. Cal. Fish Game 76, 146- -160.
Zacharias, M. A., and Roff, J. C. (2001). Use of focal species in marine conservation and management: a review and critique. Aquat. Cons. Mar. Freshwater Ecosyst. 11, 59–76. doi: 10.1002/aqc.429
Zhou, S., Hobday, A. J., Dichmont, C. M., and Smith, A. D. M. (2016). Ecological risk assessment for the effects of fishing: a comparison and validation of PSA and SAFE. Fish. Res. 183, 518–529. doi: 10.1016/j.fishres.2016.07.015
Appendix
Life History Parameter Value Sources
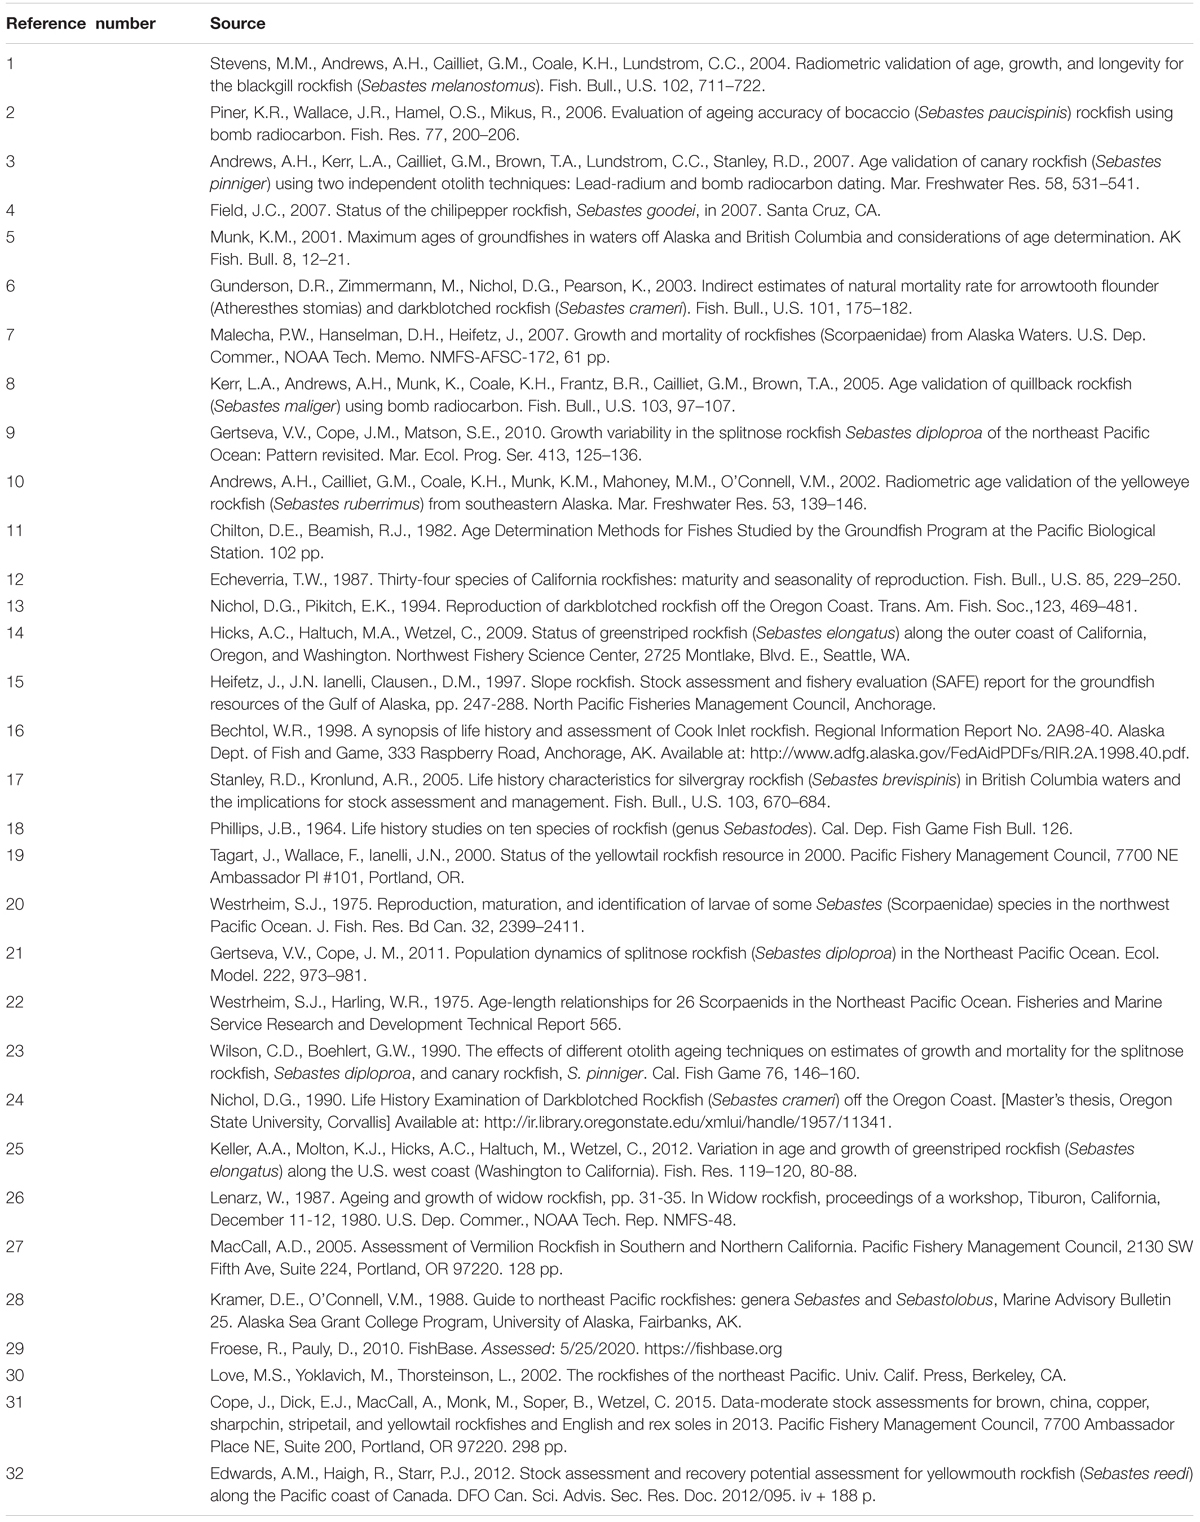
TABLE A1. Reference number with associated source from the life history parameters of rockfish from Table 1.
Keywords: stock complex, species assemblage, cluster analysis, ordination analysis, data-limited fisheries
Citation: Omori KL, Tribuzio CA, Babcock EA and Hoenig JM (2021) Methods for Identifying Species Complexes Using a Novel Suite of Multivariate Approaches and Multiple Data Sources: A Case Study With Gulf of Alaska Rockfish. Front. Mar. Sci. 8:663375. doi: 10.3389/fmars.2021.663375
Received: 02 February 2021; Accepted: 16 July 2021;
Published: 11 August 2021.
Edited by:
Natalie Anne Dowling, Oceans and Atmosphere (CSIRO), AustraliaReviewed by:
José Lino Vieira De Oliveira Costa, University of Lisbon, PortugalLyall Bellquist, The Nature Conservancy, United States
Copyright © 2021 Omori, Tribuzio, Babcock and Hoenig. This is an open-access article distributed under the terms of the Creative Commons Attribution License (CC BY). The use, distribution or reproduction in other forums is permitted, provided the original author(s) and the copyright owner(s) are credited and that the original publication in this journal is cited, in accordance with accepted academic practice. No use, distribution or reproduction is permitted which does not comply with these terms.
*Correspondence: Kristen L. Omori, a29tb3JpQHZpbXMuZWR1