Abstract
Oysters are an important aquaculture species distributed worldwide, including in Zhejiang Province, located on the east coast of China. Because of the high diversity and complicated introduction history of oysters and their seedlings, there has been much disagreement regarding the origin of each species, and the dominant and indigenous species remain unclear. We sampled 16 batches of oysters from seven sites in three aquaculture bays and found two main oyster species, Crassostrea sikamea and Crassostrea angulata. The former occupied the higher intertidal zone and comprised more than 70% of the cultured oysters. Based on the cytochrome oxidase C subunit I (COI) and mitochondrial noncoding region (MNR), C. sikamea showed higher genetic diversity than C. angulata. The analysis of molecular variance among COI sequences of these species from the Xiangshan Bay populations were comparable to those of other populations and showed that most of the molecular variance was within groups, which was consistent with the low pairwise fixation index FST values. The neutrality test revealed that C. sikamea experienced population expansion events, whereas for C. angulata, the significant Fu’s Fs and non-significant Tajima’s D test results may indicate a possible population expansion event, implying that C. sikamea is likely an indigenous species. The method established based on internal transcribed spacer 1 digestion by the HindIII restriction enzyme is useful for identifying C. sikamea and C. angulata in the local region. The specific primers on the MNR sequence show potential for distinguishing C. sikamea from four other important Crassostrea oysters. These results highlight the abundance of C. sikamea on the Zhejiang coast and lay the foundation for protecting and utilizing the local oyster germplasm resources and for the sustainable development of the oyster industry.
Introduction
Oysters are important marine aquaculture shellfish that are distributed globally, with an annual production of more than 6 million tons (Botta et al., 2020). There are abundant oyster resources in China, and the dominant species in the northern Liaoning and Shandong Provinces is the Pacific oyster Crassostrea gigas (Wang et al., 2008); in Fujian Province, the Portuguese oyster (C. angulata) (Wang et al., 2010); and in Guangdong and Guangxi Provinces, the Hong Kong oyster (C. hongkongensis) (Lam and Morton, 2003) and Suminoe oyster (C. ariakensis) (Wang et al., 2004). Zhejiang Province is located on the east coast of China, south of the Yangtze River estuary. According to a newly unearthed shell mound, oysters have been utilized for at least 8000 years in the local area (Kaihao, 2020). Important aquaculture bays include Xiangshan Bay, Sanmen Bay, and Yueqing Bay along the coast. The local aquaculture history of the oyster is approximately 800 years old, dating back to the Song dynasty (A.D. 1225). Furthermore, the “Xidian oyster,” cultured in the Xidian region, was listed as a tribute to the royal family of the Qing Dynasty and enjoyed a high reputation. As a highly important farmed shellfish in Zhejiang Province, oyster production reached 223,000 tons in 2019 (Bureau of Fisheries, 2020).
Traditionally, Zhejiang’s local oysters are obviously different from the above-mentioned dominant species in terms of shell shape, low growth rate, and small body size, and they have been called monk-hat oysters. Previous research found that the most common small oyster in Zhejiang is C. angulata (Wang et al., 2010) which is thought to be the main oyster cultured in Zhejiang and Fujian Provinces (Li et al., 2015). Kumamoto oysters (Wang et al., 2013) and Suminoe oysters (Wang et al., 2004) are also distributed in this area, although species abundance has not been reported. In addition, the Pacific oyster C. gigas was introduced approximately 20 years ago, in the 1980s, from southern Japan and the spats were thought to have settled, whereas this oyster was gradually abandoned for various reasons (Jin, 2000). Some studies have reported that hybridization occurs naturally between C. gigas and C. angulata (Huvet et al., 2004). Moreover, for approximately 30 years, local oyster farmers generally purchased seedlings from different locations in Fujian Province, of which the majority are C. angulata, and the introduced spat could obviously improve oyster industry yields. These conditions have increased the complexity of oyster species along the coast of Zhejiang. The exchange of seedlings may impact the genetic structure of indigenous populations and reduce genetic diversity (Guo, 2009).
Mitochondrial DNA sequences, such as cytochrome oxidase C subunit I (COI), are preferred genetic markers because they are highly conserved protein-coding genes in the mitochondrial genome of animals (Folmer et al., 1994); thus, they have been widely used for species identification and genetic diversity assessment of mollusks (Hsiao et al., 2016; Sekino et al., 2016; In et al., 2017; Nowland et al., 2019; Özcan Gökçek et al., 2020; Tan et al., 2020; Melo et al., 2021) and other invertebrates (Yue et al., 2020). Moreover, a mitochondrial noncoding region (MNR) lying between the Gly and Val tRNA synthetase regions has the potential to distinguish different oyster populations (Aranishi and Okimoto, 2005) and has recently been used to analyze the population genetics of C. gigas and C. angulata in Europe and Asia (Moehler et al., 2011; Grade et al., 2016).
Owing to high similarities in the appearance and sympatric distribution of up to four oyster species in many regions (Huvet et al., 2004; Wang and Guo, 2008a; Camara et al., 2009; Xia et al., 2009), distinguishing oyster species based on shell morphology is unreliable and misleading. Several methods have been established for oyster species determination (Wang and Guo, 2008a; Cordes and Reece, 2009; Xia et al., 2009; Wang et al., 2014); however, simpler methods with improved targeting for identifying specific oyster species in the local region need to be established.
In view of the high diversity and complicated introduction history of oysters in Zhejiang Province, efforts are needed to maintain the characteristics and diversity of local oysters. In this study, we aimed to clarify the dominant oyster species on the Zhejiang coast, determine the genetic diversity of different oyster populations based on molecular markers, confirm the indigenous species, and establish specific methods for identifying local oyster species. These results may lay the foundation for the subsequent protection and utilization of local oyster germplasm resources and the sustainable development of the oyster industry.
Materials and Methods
Sample Collection
To identify the main oyster species and their distributions, samples from seven sites (Table 1 and Figure 1) were collected from July 2019 to August 2020 in the three major aquaculture bays on the Zhejiang coast. Samples from the upper region of the intertidal zone (muddy intertidal) and longline-cultured samples from intertidal wild spats were collected from all the sampling sites. For one site in Xiangshan Bay (Chunhu), samples from the subtidal region were collected from fish culture cages and longline-cultured samples (spat from Fujian Province) were also collected (Figure 2). Thirty oysters of different oyster types were randomly sampled from each location for species identification. To measure growth-related traits, one cultured oyster population from each bay was sampled in August 2020. Shell height, length, and width were measured using vernier calipers (0.01 mm) and total weight was measured using an electronic balance (0.01 g). After dissection, the mantle edge pigmentation was recorded as yellow or black. The adductor muscle was collected and quickly frozen in liquid nitrogen for subsequent DNA extraction and species identification.
TABLE 1
| Location | Abbreviation | Latitude | Longitude | References |
| Xidian (Xiangshan bay) | XSB | 29.474 | 121.422 | This study |
| Chunhu (Xiangshan bay) | 29.492 | 121.603 | ||
| Xianxiang (Xiangshan bay) | 29.687 | 121.776 | ||
|
|
||||
| Sanmen (Sanmen bay) | SMB | 29.042 | 121.558 | |
| Yishi (Sanmen bay) | 29.206 | 121.486 | ||
|
|
||||
| Wenling (Yueqing bay) | 28.307 | 121.244 | ||
| Yueqing (Yueqing bay) | YQB | 28.281 | 121.129 | |
| Zhangzhou | ZZ | 23.99 | 117.76 | |
|
|
||||
| Langqi dao | LQD | 26.08 | 119.59 | Li et al., 2015 |
| Fuqing | FQ | 25.67 | 119.47 | |
| Putian | PT | 25.42 | 119.11 | |
|
|
||||
| Shantou | ST | 23.25 | 117.04 | Grade et al., 2016 |
| Keelung | KL | 22.84 | 120.04 | |
|
|
||||
| Nantong | NT | 32.11 | 121.54 | Sekino et al., 2012 |
| Ariake sea, Japan | JP | 32.88 | 130.41 | |
Oysters sampling sites for species identification.
FIGURE 1
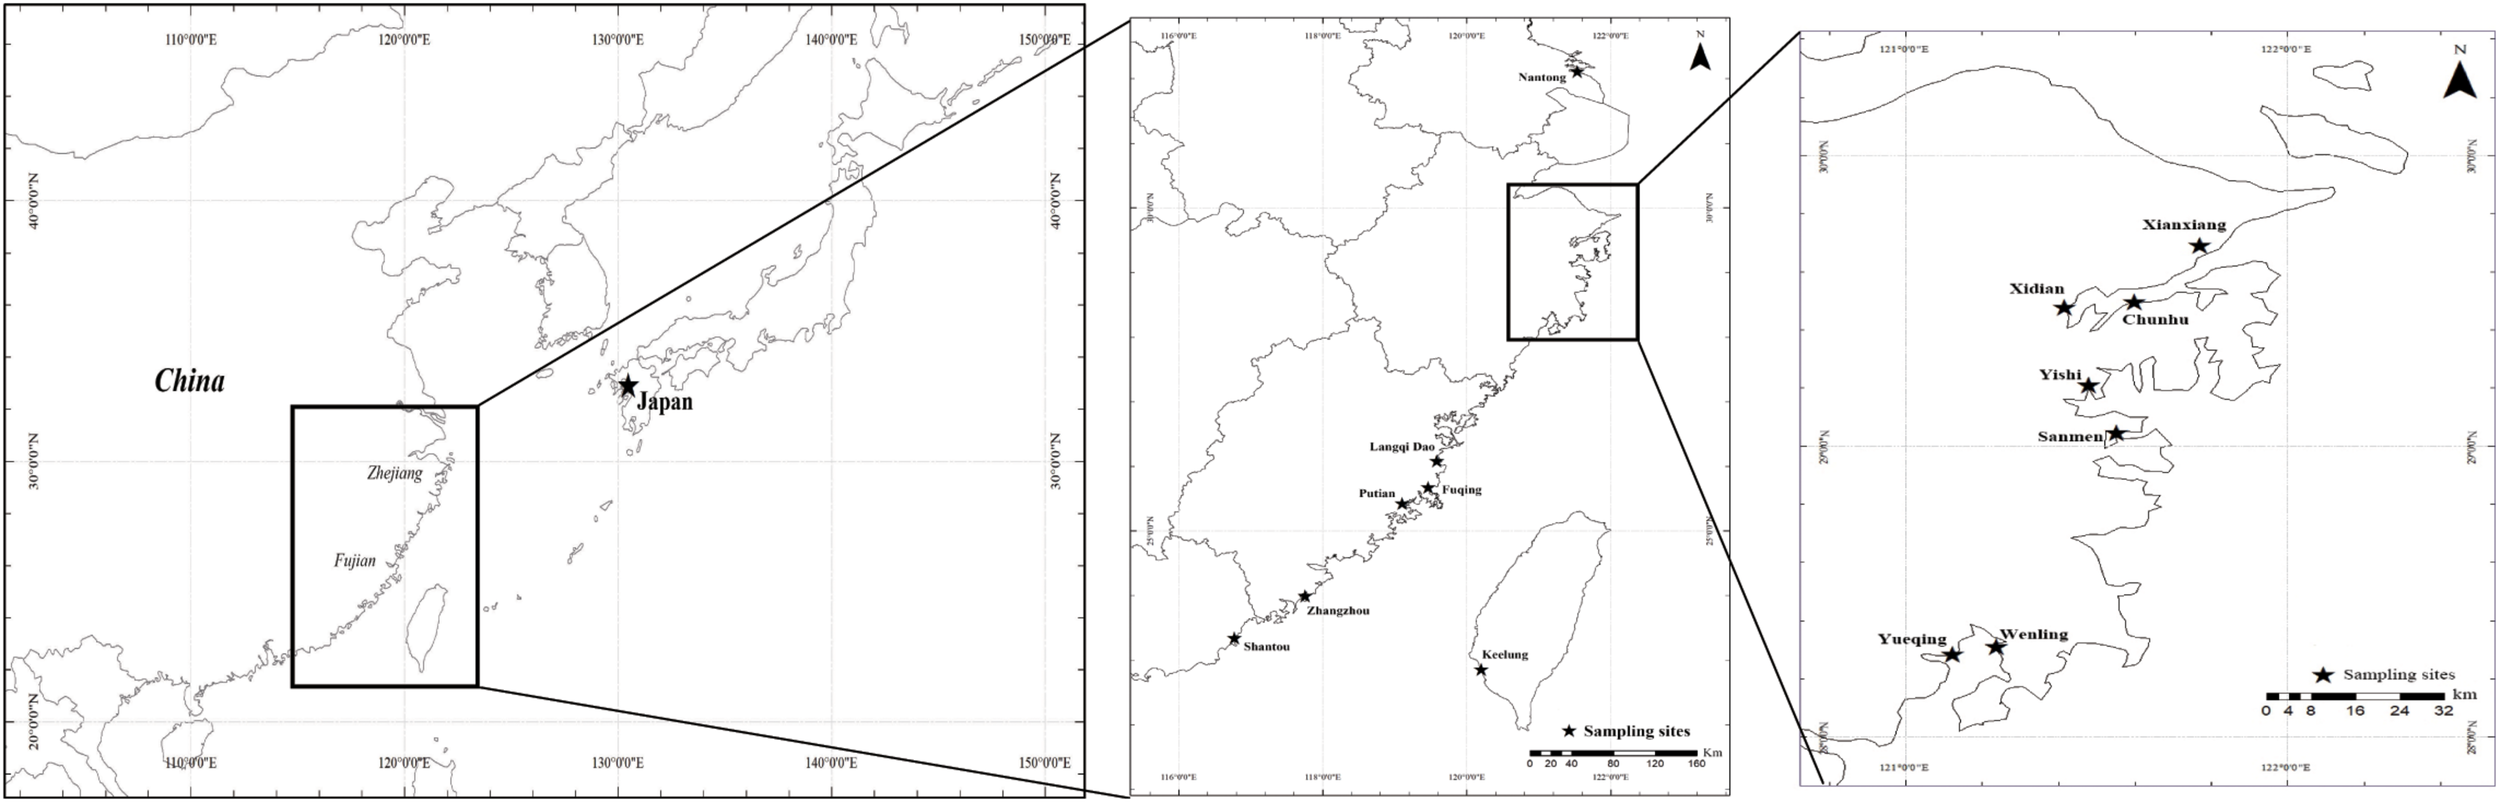
Geographic location in this study, the main aquaculture bay—Xiangshan bay, Sanmen bay and Yueqing bay in the coast of Zhejiang Province as well as other related location including samples in Fujian province and Nantong.
FIGURE 2
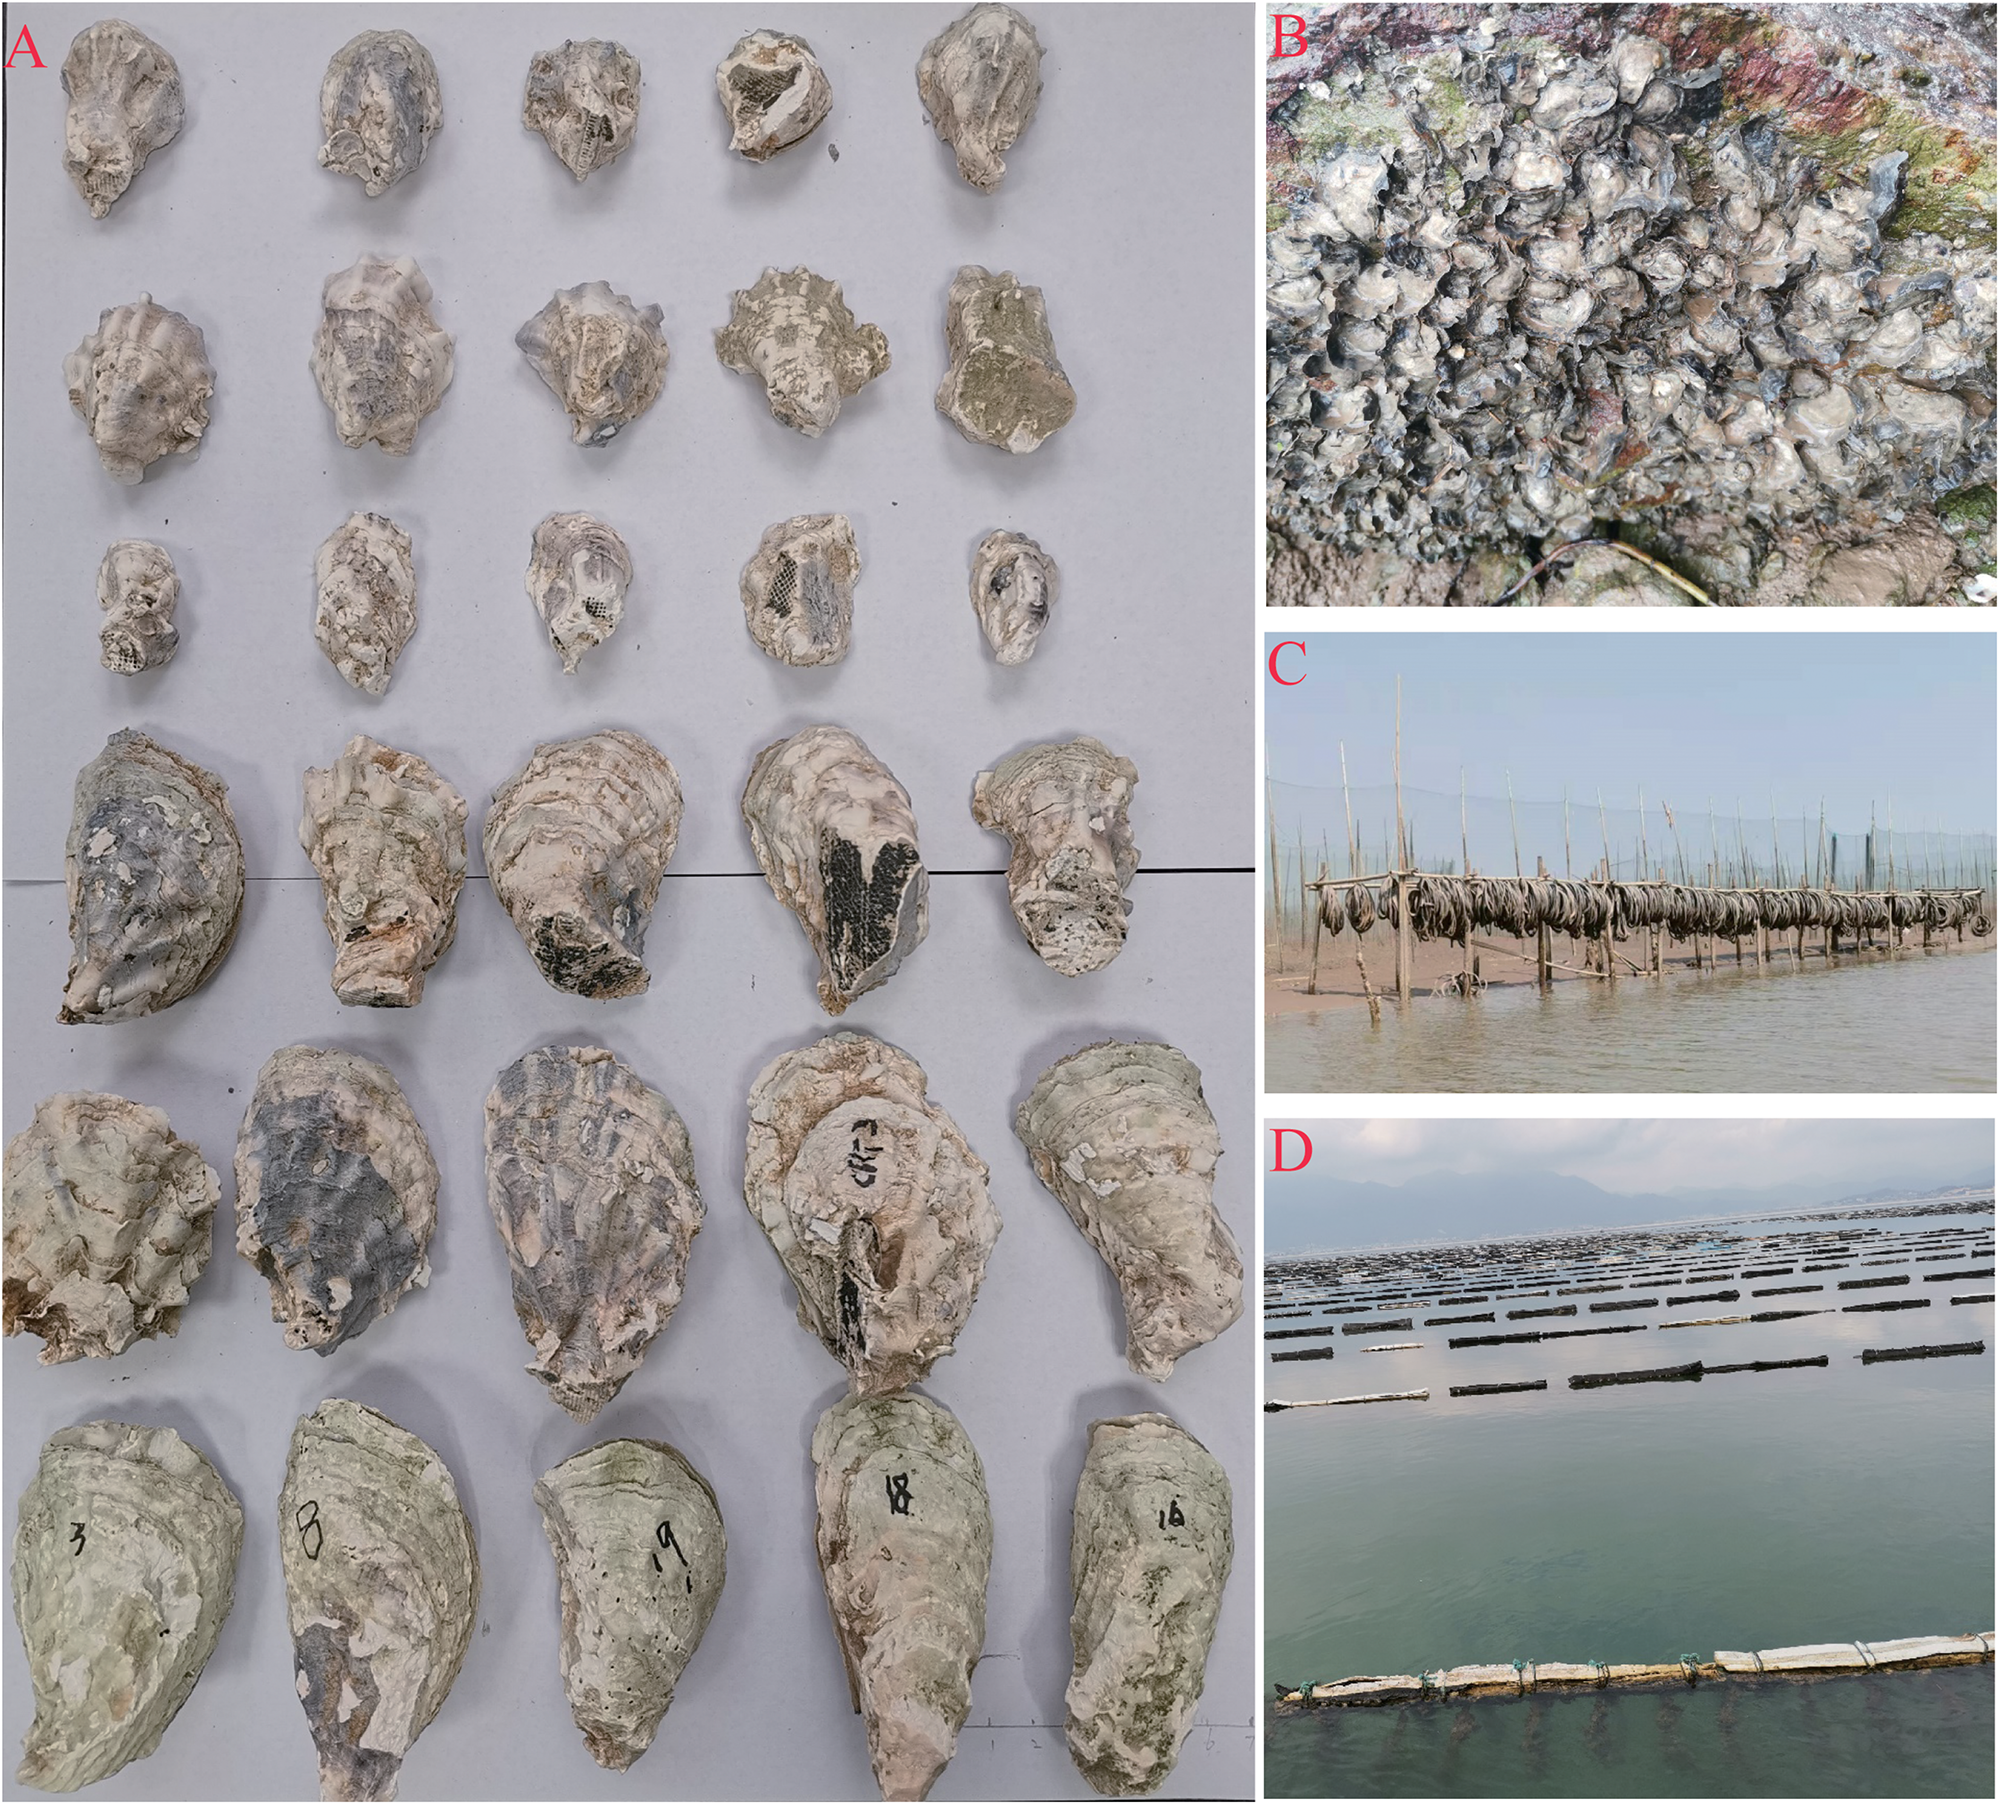
Oyster samples and their habitat. (A) Line 1–3 are cultured Kumamoto oyster sampled in Sanmen bay, Xiangshan bay and Yueqing bay, respectively, line 4 are Portuguese oyster sampled in the Xiangshan bay, line 5 are cultured Portuguese oysters originate of artificial breeding spat from Fujian province and line 6 are adult Portuguese oysters from Fujian province. (B) Oysters grown in the muddy intertidal zone. (C) Oyster seedling collection facilities using the abandoned bicycle tires as attachment in the intertidal zone. (D) The longline cultured oyster facilities in the local area hanging the abandoned bicycle tires directly.
For genetic diversity analysis of C. angulata, 88 sequences from Xiangshan Bay (abbreviated as XSB hereafter; n = 37) and Zhangzhou (abbreviated as ZZ hereafter; n = 51), and some COI haplotypes of Langqi dao (LQD, n = 39), Fuqing (FQ, n = 29), and Putian (PT, n = 32) from the Fujian coast were obtained from the NCBI nucleotide database (KP216768–KP216806), and the abundances of each haplotype in the populations were extracted from a previous study (Li et al., 2015). For MNR, 61 sequences from XSB (n = 31) and ZZ (n = 30), as well as some sequences (KY217737–KY217796) obtained from Shantou (ST, n = 27) and Keelung (KL, n = 28) of Guangdong and Taiwan Provinces were used. Haplotype distributions in different populations were included (Grade et al., 2016). For C. sikamea, COI sequences from XSB (n = 63), Sanmen Bay (SMB, n = 46), Yueqing Bay (YQB, n = 50), and ZZ (n = 27), and data from Nantong, China (CHH in the original paper, AB736731–AB736845), and Ariake Sea, Japan (ARK in the original paper, AB736621–AB736685) (Sekino et al., 2012) were selected for comparison. For MNR, only 147 sequences from XSB (n = 42), SMB (n = 46), YQB (n = 34), and ZZ (n = 25) were included; the geographic information of other samples is listed in Table 1 and Figure 1.
Individual C. gigas oysters sampled from oyster farms in Qingdao, C. ariakensis and C. hongkongensis collected in Yangjiang, Guangdong Province, C. sikamea and C. angulata from XSB, SMB, YQB, and ZZ were selected to verify the method used to distinguish C. sikamea from other species.
DNA Extraction and Species Identification
Genomic DNA was isolated from the adductor muscle using a DNA kit (Tiangen, Beijing, China) according to the manufacturer’s instructions. The integrity and concentration of DNA were determined using 1.2% agarose gel electrophoresis and spectrophotometry (Allsheng, Hangzhou, China). Oyster species were identified based on the sequences of nuclear internal transcribed spacer 1 (ITS1) and COI markers. The ITS1 fragment was amplified using ITS1-F (5′-GTTTCCGTAGGTGAACCTGC-3′) and ITS1-R (5′-ACACGAGCCGAGTGATCCAC-3′) (Wang and Guo, 2008b). The cycling conditions were as follows: initial denaturation at 94°C for 5 min, followed by 35 cycles of 94°C for 30 s, 50°C for 30 s, and 72°C for 40 s, with a final extension at 72°C for 10 min. Some COI fragments were amplified with universal primer pairs: LCO 1490 (5′-GGTCAACAAATCATAAAGATATTGG-3′) and HCO 2198 (5′-TAAACTTCAGGGTGACCAAAAAATCA-3′) (Folmer et al., 1994). Polymerase chain reactions (PCR) were performed in a final volume of 20 μL containing 7 μL of distilled water and 10 μL of Taq polymerase premix (TaKaRa, Dalian, China). The cycling conditions included initial denaturation at 94°C for 5 min, followed by 35 cycles of 94°C for 30 s, 50°C for 30 s, and 72°C for 50 s, followed by a final extension at 72°C for 10 min. The PCR products were sequenced by Hangzhou Tsingke Company (Hangzhou, China). The sequence was analyzed using BLAST in the NCBI server1, and oyster species were identified according to the BLAST results of individual COI sequences. Considering that hybrid individuals have difficulty appearing in nature, two individuals were selected for each species and bay to construct a phylogenetic tree using MEGA (Version 6.0) based on the COI and ITS1 sequences of the same individual to eliminate the possible occurrence of hybrid oysters.
Genetic Diversity Analysis of Main Oyster Species
To analyze genetic diversity, COI and MNR were used as the target regions, and the COI sequences were amplified as described in section “DNA Extraction and Species Identification.” Primers for MNR-F (5′-TCACAAGTACATTTGTCTTCCA-3′) and MNR-R (5′-AACGTTGTAAGCGTCATGTAAT-3′) were used according to (Aranishi and Okimoto, 2005; Grade et al., 2016). The PCR reaction volume and cycling conditions were the same as those described above.
To analyze the genetic diversity parameters, we calculated the number of polymorphic sites, number of haplotypes, haplotype diversity, average number of nucleotide differences, and nucleotide diversity for COI and MNR using DnaSP software (version 5) (Librado and Rozas, 2009).
Population differentiation was evaluated by computing the global fixation index FST using the Arlequin software (version 3.5) (Excoffier and Heidi, 2010). To explore the proportion of genetic variation among the populations, we conducted an analysis of molecular variance (AMOVA) in Arlequin. The significance of both the FST and AMOVA tests was assessed using 1000 permutations. A median joining (MJ) network of haplotypes was constructed using PopART (version 1.72).
To analyze the demographic history of C. angulata and C. sikamea, Tajima’s D (Tajima, 1989) and Fu’s F (Fu, 1997) were calculated, and a mismatch distribution using DnaSP was assessed to test whether they experienced population expansion.
Methods for Identifying C. sikamea
ITS1 sequences from NCBI were analyzed (KX345544–KX345547 and KF370432–KF370439 for C. sikamea and KU726931–KU726939 and AB735529–AB735533 for C. angulata). The HindIII digestion site AGGCCT appeared in the sequence of C. angulata, but not in that of C. sikamea (Supplementary Figure 2). The ITS1 sequence was amplified as described in section “DNA Extraction and Species Identification.” The enzyme digestion reaction system contained 3 μL of the PCR product, 1 μL of HindIII (NEB, Ipswich, United Kingdom), 5 μL of the enzyme buffer, and 11 μL of distilled water at a final volume of 20 μL. The reaction was performed in a water bath at 37°C for 60 min.
To design the MNR-specific primers, the complete mitochondrial genome sequences of C. gigas, C. angulata, C. sikamea, C. ariakensis, C. hongkongensis, C. iredalei, and C. nippona were downloaded and aligned (Supplementary Figure 2). Specific primers were designed for identifying C. sikamea based on the mitochondrial non-coding region (MNR-F :5′-TCACAAGTACATTTGTCTTCCA-3′, MNR-S-R: 5′-AGGCTTTCACTCCACTTACT-3′, MNR-R :5′-AACGTTGTAAGCGTCATGTAAT-3′). The PCR reaction volume and cycling conditions were the same as those used for MNR amplification, except that adding three kind of primers instead of two. The product was tested using 1.2% agarose gel electrophoresis for both enzyme digestion and the specific PCR.
Results
Oyster Species Identification in Three Local Bays
Species Distribution and Proportion
There were mainly two oyster species by molecule method in the sampled region: C. sikamea and C. angulata (Table 2). At all seven sites, all oysters sampled in the muddy intertidal area were C. sikamea. For longline-cultured oysters from the intertidal wild spat of XSB, 67–70% of the oysters were C. sikamea, and the remaining were C. angulata. The longline-cultured oysters originating from spats bought from Fujian Province by local farmers were all C. angulata. Among the subtidal samples collected from fish culture cages, the Portuguese and Kumamoto oysters comprised 67% and 33% of the samples, respectively. In SMB, for longline-cultured oysters from intertidal wild spat, 87%–97% of the oysters were C. sikamea, whereas the rest were C. angulata. In YQB, all longline-cultured oysters from intertidal wild spats were C. sikamea. ITS1 sequencing and the phylogenetic tree eliminated the possibility of hybrid individuals in the three bays (Figure 3).
TABLE 2
| Bays | Sites | Habitat | C. sikamea (%) | C. angulata (%) |
| Xiangshan Bay | Xidian | Muddy intertidal | 100% | 0 |
| Longline cultured (intertidal wild spat) | 70% | 30% | ||
| Chunhu | Muddy intertidal | 100% | 0 | |
| Longline cultured (intertidal wild spat) | 70% | 30% | ||
| Longline cultured (spat from Fujian province) | 0 | 100% | ||
| Fish culture cage (subtidal) | 33% | 67% | ||
| Xianxiang | Muddy intertidal | 100% | 0 | |
| Longline cultured (intertidal wild spat) | 67% | 33% | ||
| Sanmen Bay | Sanmen | Muddy intertidal | 100% | 0 |
| Longline cultured (intertidal wild spat) | 97% | 3% | ||
| Yishi | Muddy intertidal | 100% | 0 | |
| Longline cultured (intertidal wild spat) | 87% | 13% | ||
| Yueqing Bay | Wenling | Muddy intertidal | 100% | 0 |
| Longline cultured (intertidal wild spat) | 100% | 0 | ||
| Yueqing | Muddy intertidal | 100% | 0 | |
| Longline cultured (intertidal wild spat) | 100% | 0 |
Oyster species distribution and proportion of different sampling sites.
FIGURE 3
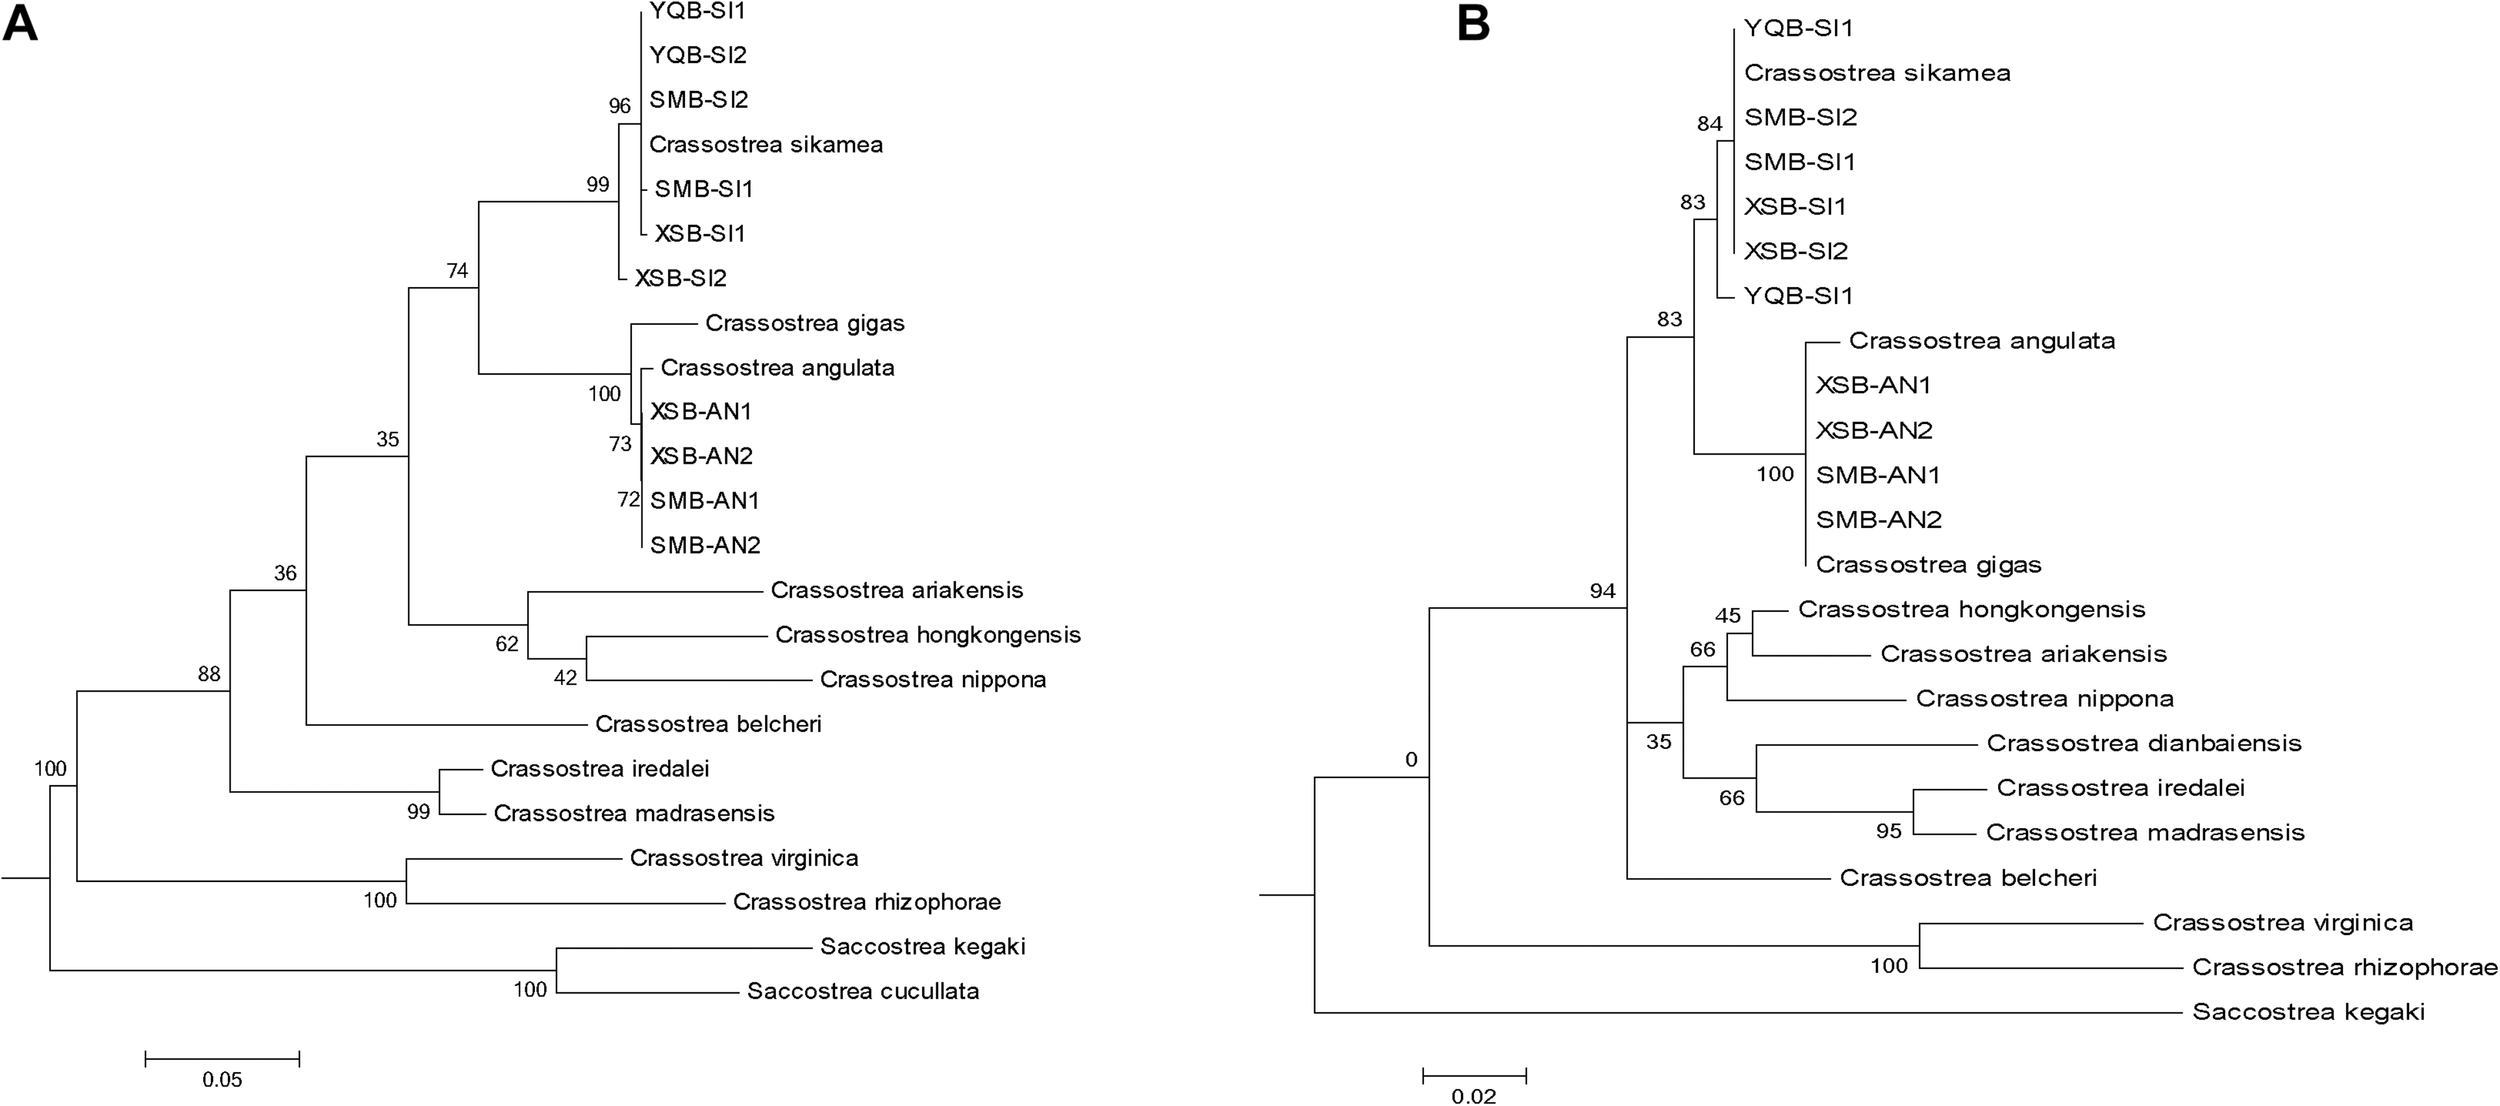
The ITS1 and COI sequences of two identified individuals in each bay are randomly selected and the phylogenetic tree construction of representative oyster species in the database. Accession number of the reference sequences downloaded from NCBI database for (A) COI: Crassostrea_sikamea, EU007477; Crassostrea_angulata,LC383463; Crassostrea_gigas, MN862563; Crassostrea_hongkongensis,KP734091; Crassostrea_ariakensis, KF272859; Crassostrea_nippona, FJ743531; Crassostrea_belcheri, JF915511; Crassostrea_iredalei, JF915503; Crassostrea_madrasensis, JF915507; Crassostrea_virginica, KU905908; Crassostrea_rhizophorae, HM003498; Saccostrea_kegaki, LC110472. (B) ITS1: Crassostrea sikamea, FJ222345; Crassostrea hongkongensis, FJ222331;Crassostrea gigas, KM460835; Crassostrea ariakensis, EU252081;Crassostrea angulata, KU726937;Crassostrea nippona, FJ356679; Crassostrea belcheri, EU073256; Crassostrea iredalei, FJ222362;Crassostrea madrasensis, EU073237; Crassostrea dianbaiensis, AB972050; Crassostrea virginica, EU073344; Crassostrea rhizophorae, KF370460; Saccostrea kegaki, LC111294.
Production Performance of the Two Oyster Species
The production performance of 1-year-old oysters is presented in Table 3. The shell height, length, and width and total weight of Kumamoto oysters in the three bays ranged from 32.1 ± 4.9 to 35.2 ± 3.3 mm, 22.3 ± 3.3 to 25.8 ± 3.1 mm, 15.1 ± 2.0 to 17.5 ± 1.9 mm, and 6.4 ± 2.2 to 7.5 ± 2.5 g, respectively. Moreover, the corresponding data for Portuguese oysters in XSB were 44.2 ± 4.3 mm, 30.9 ± 2.5 mm, 18.8 ± 1.9 mm, and 14.2 ± 3.3 g, respectively. The growth-related characteristics of Portuguese oysters in XSB were significantly larger than those of the Kumamoto oysters in the three bays. The shell height:length ratio ranged from 1.33 ± 0.19 to 1.46 ± 0.28, which was not significant between the Kumamoto and Portuguese oysters, whereas the shell height:width ratio was much lower for the Kumamoto oyster than for the Portuguese oyster in XSB, although this result was not significance (p = 0.06).
TABLE 3
| Shell height (mm) | Shell length | Shell width | Total weight (g) | SH:SL | SH: SW | Margin-yellow | Margin-black | |
| Cs-XSB | 35.2 ± 3.3b | 25.1 ± 1.7b | 17.5 ± 1.9b | 7.3 ± 3.2ab | 1.41 ± 0.16a | 2.06 ± 0.46a | 77% | 23% |
| Cs-SMB | 34.2 ± 4.1ab | 25.8 ± 3.1b | 15.8 ± 4.0ab | 7.5 ± 2.5b | 1.33 ± 0.19a | 2.28 ± 0.58a | 87% | 13% |
| Cs-YQB | 32.1 ± 4.9a | 22.3 ± 3.3a | 15.1 ± 2.0a | 6.4 ± 2.2a | 1.46 ± 0.28a | 2.16 ± 0.39a | 83% | 17% |
| Ca-XSB | 44.2 ± 4.3c | 30.9 ± 2.5c | 18.8 ± 1.9b | 14.2 ± 3.3c | 1.43 ± 0.21a | 2.44 ± 0.60a | 10% | 90% |
Production performance and mantle edge pigmentation distribution of one-year-old oysters of Kumamoto oyster and Portuguese oyster.
Cs-XSB, Crassostrea sikamea sampled in Xiangshan bay; Cs-SMB, Crassostrea sikamea sampled in Sanmen bay; Cs-YQB, Crassostrea sikamea sampled in Yueqing bay; Ca-XSB, Crassostrea angulata sampled in Xiangshan bay.
Different letters mean that production performances of populations of Kumamoto oyster and Portuguese oyster are significantly different.
Mantle Edge Pigmentation
There were some differences in the mantle edge pigmentation of the Kumamoto and Portuguese oysters. Kumamoto oysters were 77–87% yellow and 13–23% black. In contrast, for Portuguese oysters, the mantle edges were 90% black and 10% yellow (Table 3).
Genetic Diversity of the Two Species Based on COI/MNR Sequences
Two mitochondrial sequences (COI and MNR) were amplified for genetic diversity analysis, and a COI fragment of 603 bp was obtained from 188 specimens of the Portuguese oyster. In total, 49 segregating sites and 44 haplotypes were identified. Haplotype diversity and nucleotide diversity were 0.836 ± 0.046 and 0.353 ± 0.039% for XSB and 0.869 ± 0.031 and 0.428 ± 0.036% for ZZ populations, respectively. For Kumamoto oysters, 543 bp sequences from 366 individuals were analyzed, and 105 segregating sites and 145 haplotypes were defined. Haplotype diversity ranged from 0.929 ± 0.027 to 0.983 ± 0.017 for XSB, SMB, YQB, and ZZ populations, and the nucleotide diversity ranged from 0.586 ± 0.053% to 0.727 ± 0.063% (Table 4).
TABLE 4
| Species | Pop. | N | S | H | k | Hd | Pi(%) | Tajima’s D | Fu’Fs |
| C. angulata | XSB | 37 | 14 | 13 | 2.13 | 0.836 ± 0.046 | 0.353 ± 0.039 | –1.17 | −5.47* |
| ZZ | 51 | 17 | 16 | 2.59 | 0.869 ± 0.031 | 0.428 ± 0.036 | –0.99 | −6.15* | |
| LQD | 39 | 21 | 17 | 2.35 | 0.866 ± 0.040 | 0.390 ± 0.048 | −1.75* | −9.94* | |
| FQ | 29 | 19 | 13 | 2.56 | 0.845 ± 0.059 | 0.425 ± 0.058 | −1.64* | −5.38* | |
| PT | 32 | 15 | 14 | 2.64 | 0.901 ± 0.032 | 0.439 ± 0.043 | –0.96 | −5.91* | |
| Total | 188 | 49 | 44 | Mean | 0.861 ± 0.035 | 0.409 ± 0.042 | –1.30 | –6.57 | |
| C. sikamea | XSB | 63 | 43 | 41 | 3.71 | 0.957 ± 0.017 | 0.684 ± 0.047 | −1.97* | −26.04* |
| SMB | 46 | 31 | 26 | 3.18 | 0.929 ± 0.027 | 0.586 ± 0.053 | −1.86* | −20.40* | |
| YQB | 50 | 36 | 33 | 3.73 | 0.962 ± 0.018 | 0.687 ± 0.039 | −1.81* | −25.99* | |
| ZZ | 27 | 24 | 23 | 3.95 | 0.983 ± 0.017 | 0.727 ± 0.063 | –1.32 | −21.16* | |
| JP | 65 | 17 | 15 | 1.31 | 0.695 ± 0.049 | 0.242 ± 0.039 | −1.91* | −9.72* | |
| NT | 115 | 61 | 61 | 3.53 | 0.953 ± 0.012 | 0.650 ± 0.037 | −2.20* | −26.10* | |
| Total | 366 | 105 | 145 | Mean | 0.959 ± 0.035 | 0.645 ± 0.039 | −1.84* | −21.57* |
Genetic diversity parameters of Crassostrea angulata and Crassostrea sikamea based on COI sequence.
S, Number of segregating sites; h, Number of haplotypes; Hd, Haplotype diversity; K, Average number of nucleotide differences; Pi (π), Nucleotide diversity. Asterisk means that Tajima’s D or Fu’Fs test is different from zero (p < 0.05) and corresponding population may experience expansion.
For MNR, a 620-bp fragment was obtained from 116 specimens for subsequent analysis of Portuguese oysters, and 25–35 segregating sites and 11–24 haplotypes were found in the four populations, with 81 segregating sites and 67 haplotypes identified in total. The haplotype diversity ranged from 0.832 ± 0.052 (ST) to 0.977 ± 0.020 (ZZ) and nucleotide diversity from 0.59 ± 0.09% (KL) to 0.78 ± 0.07% (XSB). For the Kumamoto oysters, 172 segregating sites and 119 haplotypes were found in 151 individuals. The haplotype diversity and nucleotide diversity were 0.969 ± 0.021 to 1.0 ± 0.011 and 1.02 ± 0.10% to 1.44 ± 0.12%, respectively (Table 5). Haplotypes were less common in this sequence, and the haplotype distributions are shown in Supplementary Table 1.
TABLE 5
| Species | Pop. | N | S | h | K | Hd | Pi(%) | Tajima’s D | Fu’Fs |
| C. angulata | XSB | 31 | 35 | 22 | 4.76 | 0.970 ± 0.017 | 0.78 ± 0.07 | −1.66* | −13.21* |
| ZZ | 30 | 35 | 24 | 4.58 | 0.977 ± 0.020 | 0.75 ± 0.07 | −1.81* | −18.82* | |
| ST | 27 | 25 | 11 | 3.68 | 0.832 ± 0.052 | 0.60 ± 0.09 | –1.57 | –1.61 | |
| KE | 28 | 33 | 21 | 3.61 | 0.942 ± 0.037 | 0.59 ± 0.09 | −2.11* | −16.45* | |
| Total | 116 | 81 | 67 | Mean | 0.962 ± 0.010 | 0.73 ± 0.04 | −1.77* | −12.56* | |
| C. sikamea | XSB | 42 | 80 | 40 | 7.41 | 0.998 ± 0.006 | 1.28 ± 0.14 | −2.29* | −41.54* |
| SMB | 46 | 95 | 41 | 7.48 | 0.994 ± 0.006 | 1.31 ± 0.13 | −2.39* | −38.09* | |
| YQB | 38 | 62 | 27 | 5.99 | 0.969 ± 0.021 | 1.02 ± 0.10 | −2.27* | −18.37* | |
| ZZ | 25 | 59 | 25 | 8.26 | 1.0 ± 0.011 | 1.44 ± 0.12 | −1.96* | −19.81* | |
| Total | 151 | 172 | 119 | Mean | 0.993 ± 0.003 | 1.18 ± 0.06 | −2.16* | −22.95* |
Genetic diversity parameters of Crassostrea angulata and Crassostrea sikamea based on MNR sequence.
S, Number of segregating sites; h, Number of haplotypes; Hd, Haplotype diversity; K, Average number of nucleotide differences; Pi (π), Nucleotide diversity. Asterisk means that Tajima’s D or Fu’Fs test is different from zero (p < 0.05) and corresponding population may experience expansion.
Genetic Differentiation and Population Expansion
To conduct the AMOVA among C. angulata mitochondrial COI sequences, two groups were defined, one included the XSB population and the other group included LQD, FQ, PT, and ZZ populations. The results showed that the majority of the molecular variance was within groups (99.74%), with −0.62% variance among groups and 0.89% among populations within groups. The variance components of the three origin types were not statistically significant (p > 0.05) in the AMOVA analysis. Similar results were obtained for Kumamoto oysters when defining the two groups as XSB with the combination of SMB, YQB, NT, and ZZ, as shown in Table 6.
TABLE 6
| Groups | Source of variation | df | Sum of squares | Percentage of variation | P-value |
| Among groups | 1 | 0.261 | –0.62 | 1.0 | |
| C. angulata of XSB with LQD, FQ, PT, and ZZ | Among populations within groups | 3 | 1.202 | 0.89 | 0.158 |
| Within populations | 183 | 79.037 | 99.74 | 0.190 | |
| Among groups | 1 | 1.63 | –0.37 | 0.795 | |
| C. sikamea of XSB with SMB, YQB, NT, and ZZ | Among populations within groups | 3 | 6.59 | 0.42 | 0.182 |
| Within populations | 296 | 530.496 | 99.95 | 0.255 |
AMOVA of C. angulata and C. sikamea based on the COI sequence of XSB with other populations.
Ten haplotypes were shared among the five C. angulata populations based on the COI sequence, and five of the most shared haplotypes (Hap1–2 and 4–6) were found in 71% (134/188) of all individuals. Several major haplotypes located in the center, with a few singletons or low-frequency haplotypes linked by short branches. The MJ haplotype network illustrates evident differences in the population structure between the two species. Furthermore, two haplotypes were shared among all C. sikamea populations, and 25 haplotypes were shared among at least two populations and were present in 6.3% and 53% of all individuals (Supplementary Table 1). The MJ network showed numerous minor haplotypes with no high proportions, and fewer haplotypes were shared (Figure 4).
FIGURE 4
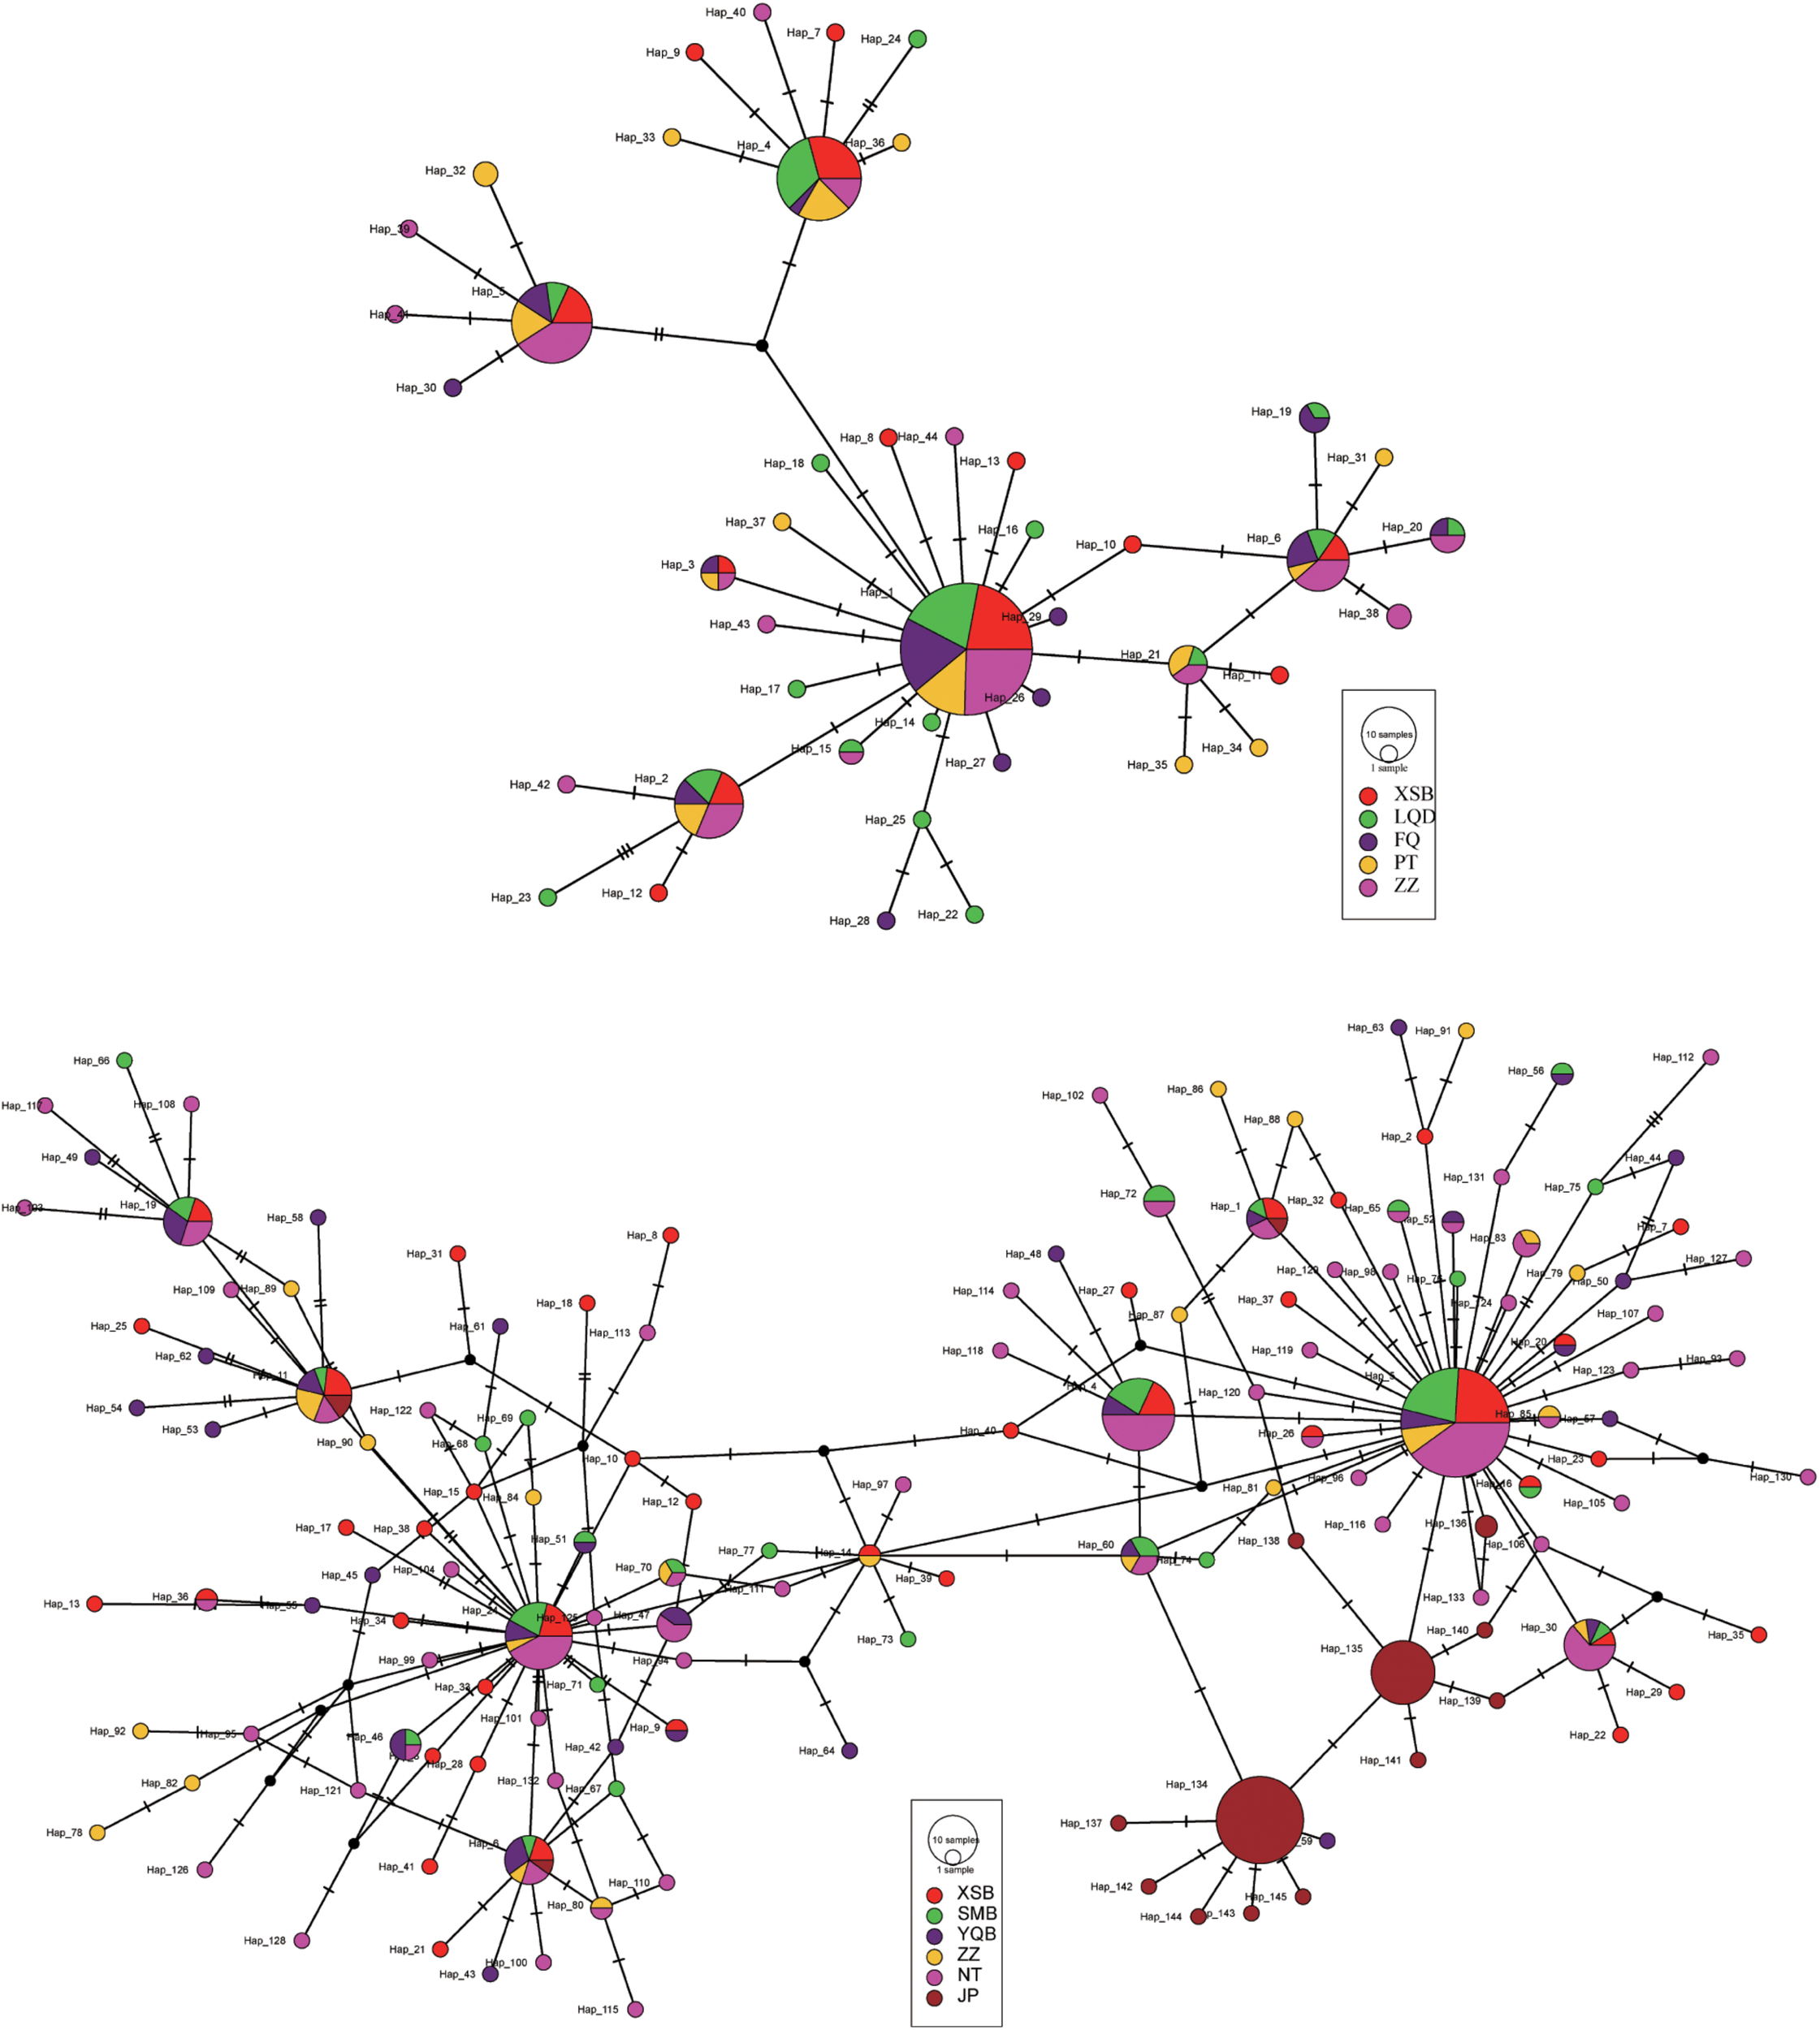
Median joining network for Crassostrea angulata (upper) and C. sikamea (lower) COI haplotypes. The circles represent haplotypes, geographical population samples are marked by distinctive colors, and size of circles are in proportion to the haplotype frequencies. The number of perpendicular bars on branches represents the number of mutations between haplotypes.
Population pairwise FST values were generally low and not significant among the five tested Portuguese oyster populations based on the COI sequence (Supplementary Table 2). No significant FST was observed except for samples from Japan with the other five populations for the Kumamoto oyster (0.283–0.353, Supplementary Table 2). A non-significant value was found for both species based on the MNR fragment, except for two significant genetic differentiation populations with low FST values (Supplementary Table 2).
The neutrality test showed that Fu’s F was significantly different from zero (p < 0.05) and Tajima’s D was not significant (p > 0.05) for the Portuguese oyster based on the COI sequences; both parameters were observed to be significantly negative for the MNR fragment. For the four populations of Kumamoto oysters, both Tajima’s D and Fu’s Fs tests showed significant results for the two sequences (Tables 4, 5). The mismatch distribution was unimodal for C. angulata in XSB and ZZ and for C. sikamea populations in the six locations (Supplementary Figure 1).
Establishment of Species Identification Method
Considering that there are mainly two oyster species on the Zhejiang coast, the ITS1-RFLP method was established. The ITS1 product was digested with the HindIII restriction enzyme to obtain 200 and 310 bp fragments from C. angulata, and the product could not be confused for C. sikamea, leaving a 530 bp fragment, as shown in Figure 5.
FIGURE 5
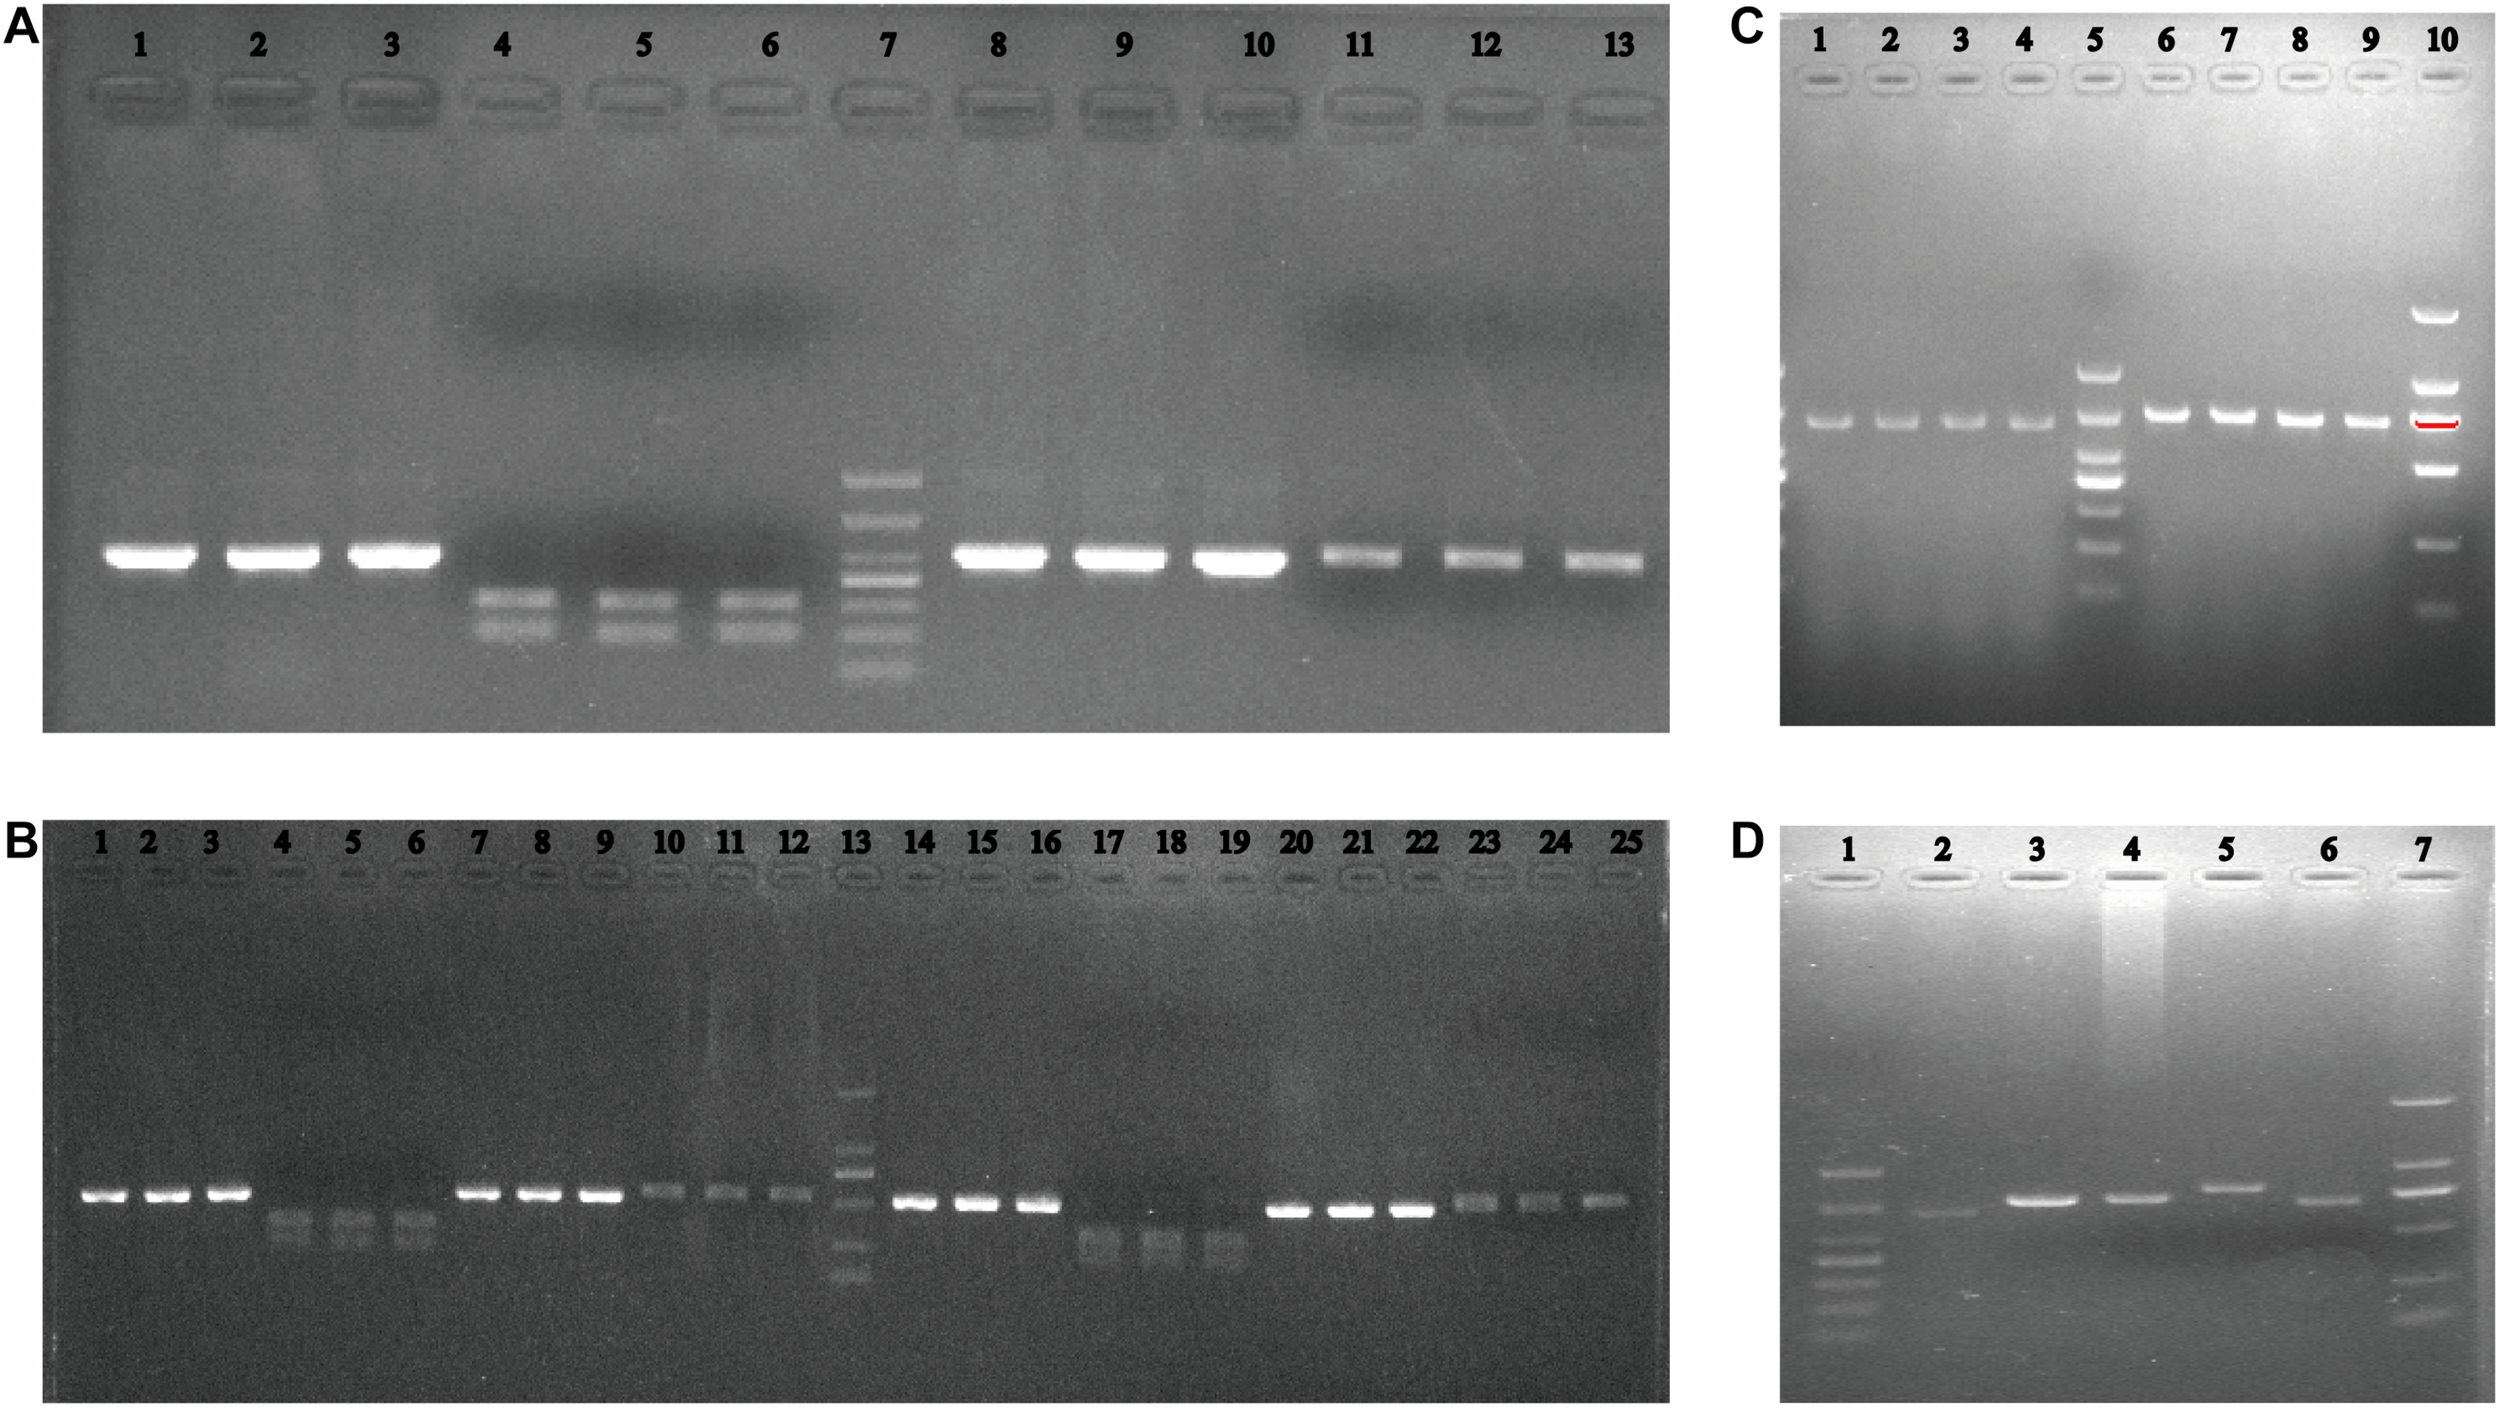
Agarose electrophoresis of PCR-RFLP for ITS1 for oysters. (A) Lane 1–3 are PCR product of ITS1 of three individuals and lane 4–6 are corresponding digested product by Hind III restricted enzyme of Crassostrea angulata from ZZ and lane 8–13 are PCR product and corresponding digested product for Crassostrea sikamea from YQB and lane 7: DL1000 DNA marker. (B) Lane 1–6, 7–12: PCR product and corresponding digested product of three Crassostrea angulata and three Crassostrea sikamea individuals in XSB and lane 14–25 for SMB, lane 13:DL2000 DNA marker. Verification of MNR specific identification primer, agarose electrophoresis of (C) oysters samples from different geographic locations, lane 1–4: SMB, YQB, and ZZ, 6–9: C.angulata in XSB, SMB, YQB and ZZ; 5&10: DL1000 and DL2000 DNA marker; (D) five Crassostrea oysters, lane 2: Crassostrea sikamea, 3: C.angulata, 4: C.gigas,5 C.ariakensis,6: C.hongkongensis and lane 1&7: DL1000 and DL2000 DNA marker.
To distinguish C. sikamea from additional oyster species, specific primers were designed based on the highly variable MNR. A 660 bp fragment was successfully amplified for C. sikamea, with a larger unspecific bands for C. angulata, C. gigas, C. ariakensis, or C. hongkongensis on the agarose gel (Figure 5D). For samples from XSB, SMB, YQB, and ZZ, a specific band was observed for C. sikamea, while a larger band was observed for C. angulata (Figure 5C).
Discussion
Dominant Species and Its Distribution
In this study, oyster species were identified using molecular diagnosis based on the BLAST result of the COI sequence of individuals, and we found that C. sikamea was widely distributed and cultivated in large numbers on the Zhejiang coast. C. sikamea comprised more than 70% of the oyster samples in 14 batches collected from the three bays in this area. Zhejiang Province has an annual oyster production of approximately 223,000 metric tons (Bureau of Fisheries, 2020); thus, we speculate that at least 50,000 metric tons of this yield is C. sikamea. Previous studies have mentioned its occurrence in this area, but its abundance has not been reported (Wang et al., 2013). It is the dominant species on the Zhejiang coast, whereas in the Ariake Sea, where it was first found, and in the South Korean peninsula, it coexists with the Pacific oyster and was once thought to be endangered at these locations (Hedgecock et al., 1999). The natural distribution of this species has been reported to include South Korea and southern Japan (Ariake Sea and Seto Inland Sea) (Banks et al., 1994; Hamaguchi et al., 2013), southern China (Wang et al., 2013), and Vietnam (In et al., 2017). The Kumamoto oysters were distributed especially in the warmer estuary and intertidal zones. For instance, in Yueqing, samples were collected in the estuary of the Qingjiang River, and all oysters were C. sikamea. This species shows a habitat preference for estuaries with mesohaline environments (Camara et al., 2009). In addition, its more frequent occurrence in the middle and high regions of the intertidal zone in the estuaries of the Ariake Sea has been reported (Camara et al., 2009). Furthermore, the Kumamoto oyster occupies the intertidal zone, and the Suminoe oyster occupies the subtidal zone (Xu et al., 2009). These reports are consistent with our result that oysters collected in the upper region of the intertidal zone were all C. sikamea, and of those collected in the subtidal zone, 67% were C. angulata.
Studies have found that the most common small-cupped oyster from Zhejiang to Hainan in southern China is C. angulata, which is also thought to be the main oyster cultured in Zhejiang and Fujian Provinces (Wang et al., 2010; Li et al., 2015). We found that the Portuguese oysters indeed exist in a narrow region and comprise 30% of the wild spat in XSB, which is a long and narrow bay with an inland distance of 60 km, and the salinity is higher (average salinity around 25) than that of SNB and YQB (You and Jiao, 2011). Portuguese oysters have been reported to be distributed as far as the Okinawa (Ryukyu Archipelago) and Shikoku Islands in southern Japan, although the authors were unsure whether the oysters were indigenous (Sekino and Yamashita, 2012; Sekino et al., 2016). The latitude of Zhejiang Province is similar to that of the above locations, and Portuguese oysters prefer high salinity and high-temperature environments (Shi et al., 2019); therefore, we cannot exclude the natural distribution of Portuguese oysters here.
The Kumamoto oyster is very small compared to the Portuguese oyster, with the former weighing half as much as the latter in this study, and this is the primary reason why local farmers transport oysters from Fujian Province. Kumamoto oysters tend to be deeper cupped than other species (Hedgecock et al., 1999; Camara et al., 2009). Our results seem to support the opinion that the shell height:width ratio for C. sikamea is smaller than that of C. angulata sampled in XSB. The shell shape seems to be heritable, although some studies have found that it has low heritability (Sang et al., 2019) or is affected mainly by the type of sediment (Mizuta and Wikfors, 2018).
For approximately 30 years, local oyster farmers in XSB have continually transported oyster seeds from Fujian Province, which is the core distribution area of the Portuguese oyster (Wang et al., 2010). As identified by us, artificial spawning seeds purchased from Fujian Province were all C. angulata, and they were usually transported in September and successfully spawned in the next summer in the local bay; thus, the origin of the Portuguese oyster is not clear. Moreover, we found that the mantle edge color was light for C. sikamea and dark for C. angulata. Mantle edge pigmentation has moderate heritability (0.215 ± 0.092) among Pacific oysters (Xing et al., 2017) and successive selective breeding for the golden-shell strains of this species has yielded lighter-margined oysters (Han and Li, 2019). Local farmers usually distinguish oysters by mantle color, as they believe that local oysters have yellow mantle edges, whereas imported ones have black mantle color. Therefore, it is necessary to perform genetic evaluations to analyze the indigenous oysters of the two species.
Genetic Diversity of the Two Species and Identification of Indigenous Species
For Portuguese oysters, the nucleotide and haplotype diversity based on the COI sequence of oysters collected in XSB was lower than that of the sampled populations from ZZ as well as four sites on the Chinese coast (Hsiao et al., 2016), and four populations on the Fujian coast (Li et al., 2015). The significant results of Fu’s Fs test and non-significant Tajima’s D test showed that the Portuguese oysters in XSB may have experienced a population expansion event, and the unimodal distribution of nucleotide mismatch analysis also supported this conclusion. It seems that Portuguese oysters on the coast of southern China form a large group, and gene flow exists (Hsiao et al., 2016).
Taking into account that farmers in XSB have introduced large amounts of artificially spawned Portuguese oyster spats from many geographic locations ranging from the south to the north of Fujian Province for many years, the introduced or invasive species tend to show low genetic diversity. Oysters have great fecundity and high polymorphism in DNA sequences (Li et al., 2018); thus, even if the Portuguese oysters spat that were sampled in this study are not indigenous (the offspring of the introduced individuals), the genetic diversity should not be very low. Therefore, it is difficult to determine whether the oysters were the original or offspring of the introduced populations (Grade et al., 2016; Hsiao et al., 2016). Oyster larvae have a long swimming period of up to 3 or 4 weeks, and there are many islands along the coast of Zhejiang; therefore, it is possible that ocean currents drive larvae to settle (Sekino and Yamashita, 2012; Sekino et al., 2016). Molecular markers at the genome-wide level may be needed to further determine their exact source, such as with Pacific oysters in the Northern Hemisphere, where a clear lineage of different populations has been provided (Sutherland et al., 2020) and oysters in Europe (Vendrami et al., 2018).
For Kumamoto oysters, the nucleotide and haplotype diversity was much higher in our samples than in the Japanese and Korean populations, as well as in the Portuguese oysters based on the COI sequence (Sekino et al., 2012). High diversity was found in three Kumamoto oyster populations in Zhejiang Province when analyzing the population history of this species along the coastal regions of the Northwest Pacific (Hu et al., 2018). Significant Fu’s Fs and Tajima’s D test results showed that Kumamoto oysters on the Zhejiang coast experienced a population expansion event. There was no significant genetic differentiation among the XSB population and the other four populations along the coast of China (NT, SMB, YQB, and ZZ). However, populations sampled along the Zhejiang coast were quite distinct from the Japanese populations, and the MJ haplotype network indicated that fewer haplotypes were shared among all populations and that private haplotypes accounted for a larger proportion (Sekino et al., 2012). Kumamoto oyster populations on the Zhejiang coast show high genetic diversity comparable to that of other populations along the coast of China, and large-scale artificial spawning and breeding programs have not been conducted as has been done with the Pacific and Portuguese oysters.
Portuguese oysters are thought to be distributed south of the Yangtze River (Wang et al., 2010) and have not been found to the north (Wang et al., 2008), although sporadic reports exist (Lapègue et al., 2004). The diluted water of Changjiang may be a barrier for marine animal distribution to the north (Ni et al., 2017), whereas the distribution of Kumamoto oysters seems to cross this barrier, as indicated by the non-significant FST, implying its tolerance to low salinity (Camara et al., 2009). Our results indicate that the Kumamoto oysters have high genetic diversity and are likely an indigenous species along the coast of Zhejiang. Portuguese oysters have relatively low genetic diversity, but their sources require further exploration.
Distinguishing Kumamoto Oysters for Better Utilization of Resources
Conducting species identification to eliminate other oyster species before artificial breeding and exploring simple methods of species discrimination are highly important for protecting and utilizing Kumamoto oyster germplasm resources. Although the shell shape of Kumamoto oysters is somewhat different from that of other species, it remains difficult to classify oyster taxonomy according to morphology (Wang et al., 2004). Our results revealed a sympatric distribution between the Kumamoto and Portuguese oysters and between the Hong Kong and Suminoe oysters on the southern coast of China (Wang and Guo, 2008a; Xia et al., 2009).
The results of ITS1-RFLP showed that after digesting the PCR product of the ITS1 sequence with HindIII, the Kumamoto and Portuguese oysters could be clearly distinguished. The sequence alignment results also supported this finding (Supplementary Figure 2), as being an effective method for distinguishing between the Kumamoto and Pacific oysters and their artificial hybrids (Xu et al., 2019). This may reflect the subspecies relationship and sequence similarity of the Pacific and Portuguese oysters. The use of PCR-RFLP analysis of several gene fragments for distinguishing seven Crassostrea oysters from the South China Sea showed wider applicability, whereas it was somewhat difficult to utilize two or more restriction enzymes with one to five fragments after digestion (Xia et al., 2009).
The MNR sequence could be used to distinguish the Kumamoto oysters from the five main species of Crassostrea oysters, and the results of four populations (XSB, SMB, YQB, and ZZ) also demonstrated the versatility of this method. Previous results based on the MNR sequence have shown its potential in discriminating different populations of the Pacific and Portuguese oysters (Aranishi and Okimoto, 2005; Grade et al., 2016). It is not surprising that there are great differences between species because of the high polymorphism of the sequences. A multiplex PCR method based on COI was powerful and widely used for differentiating five Crassostrea species (Wang and Guo, 2008a) and we applied this method at the beginning of the species identification process; however, when distinguishing between Kumamoto and Portuguese oysters in XSB, sometimes the latter species exhibited two specific bands, which muddled the determination. Kumamoto oysters were mistaken as Pacific oysters from the Ariake Sea in Japan and introduced to the United States in the 1940s (Hedgecock et al., 1999). At that time, molecular identification methods were not established; therefore, the American population of Kumamoto oysters has been contaminated by Pacific oysters because of purposeful or unintentional hybridization (Hedgecock et al., 1999; Camara et al., 2009). These newly established species identification methods are more practical locally and it has a certain value for the identification of Kumamoto oysters in other regions.
In this study, we found abundant C. sikamea resources distributed along the Zhejiang coast, and these oysters preferred intertidal and estuarial habitats. It is possible that at least 50,000 tons of the annual oyster production is C. sikamea, making this region the world’s largest Kumamoto oyster farming area. Our results indicate that Kumamoto oysters have high genetic diversity and should be an indigenous species along the coast of Zhejiang. Portuguese oysters have relatively lower genetic diversity than Kumamoto oysters, but their sources require further exploration. Established species identification methods are of practical significance and are useful for broodstock discrimination. These results have enriched our understanding of the distribution and biological characteristics of Kumamoto oysters, and the genetic diversity assessment is beneficial for better protection and utilization of local oyster germplasm resources and for the development of the oyster industry.
Statements
Data availability statement
The datasets presented in this study can be found in online repositories. The names of the repository/repositories and accession number(s) can be found below: https://www.ncbi.nlm.nih.gov/, MW675439-MW675650 for MNR, MW663490-MW663763 for cytochrome c oxidase subunit I (COX1) gene and MW481329-MW481338 for ITS1.
Author contributions
QX and ZL conceived and designed the study. SL and HX collected and sampled the oysters. SL performed the statistical analyses. SL and QX wrote and polished the manuscript. All authors read and approved the final manuscript.
Funding
This work was financially supported by the Project “Studies on Technologies for Disease Mitigation in Marine Mollusk Aquaculture” of “3315” Innovative Team of Ningbo City, the fundamental research foundation for Provincial University supported by Zhejiang Wanli University, Earmarked Fund for China Agriculture Research System (CARS-49), and the Science and Technology Planning Project of Ningbo City (2019C10046).
Acknowledgments
We would like to sincerely thank Dr. Lin He for the designing and contacting the sampling site, Yuanyuan Zheng for map preparation, staffs of Fisheries Technical Extension Station of Fenghua, Ninghai, Sanmen, and Yueqing county for their kind support and information for oyster aquaculture, Frederico Batista in Cefas (United Kingdom) for providing the haplotype frequencies of the MNR sequence of Portuguese oysters we used in the manuscript, Jing Ye, Shoushuo Jian, and Loutao Xu for their help of sampling and Mr. Mingkun Liu for data analysis and using the software and Youli Liu for constructive discussion. We would like to thank Editage (www.editage.cn) for English language editing.
Conflict of interest
The authors declare that the research was conducted in the absence of any commercial or financial relationships that could be construed as a potential conflict of interest.
Supplementary material
The Supplementary Material for this article can be found online at: https://www.frontiersin.org/articles/10.3389/fmars.2021.662515/full#supplementary-material
Supplementary Figure 1Nucleotide mismatch distribution analysis of Crassostrea angulata from XSB (A) and ZZ (B) as well as Crassostrea sikamea from XSB (C), SMB (D), YQB (E), ZZ (F), NT (G), and JP (H), the ordinate represents frequency of differences in the corresponding populations.
Supplementary Figure 2(A) The sequence alignment of the ITS1 of Crassostrea sikamea and Crassostrea angulata, of which the serial number and accession number in the NCBI database were included, Hind III restriction sites were highlighted. (B) The forward primer (MNR-F) and (C) reverse primer (MNR-S-R) alignment of the specific MNR of Crassostrea sikamea and other six Crassostrea oysters, of which the serial number and accession number in the NCBI database were included, primers sequences were highlighted.
References
1
Aranishi F. Okimoto T. (2005). Sequence polymorphism in a novel noncoding region of Pacific oyster mitochondria DNA.J. Appl. Genet.46201–206.
2
Banks M. McGoldrick D. Borgeson W. Hedgecock D. (1994). Gametic incompatibility and genetic divergence of Pacific and Kumamoto oysters, Crassostrea gigas and C. sikamea.Mar. Biol.121127–135. 10.1007/bf00349481
3
Botta R. Asche F. Borsum J. Camp E. (2020). A review of global oyster aquaculture production and consumption.Mar. Policy117:103952. 10.1016/j.marpol.2020.103952
4
Bureau of Fisheries (2020). China Fisheries Statistic Yearbook 2019.Beijing: China Agriculture Press.
5
Camara M. Davis J. Sekino M. Hedgecock D. Li G. Langdon C. et al (2009). The kumamoto oyster Crassostrea sikamea is neither rare nor threatened by hybridization in the Northern Ariake Sea. Japan.J. Shellfish Res.27313–322. 10.2983/0730-8000(2008)27[313:tkocsi]2.0.co;2
6
Cordes J. Reece K. (2009). Discrimination of nine Crassostrea oyster species based upon restriction fragment-length polymorphism analysis of nuclear and mitochondrial DNA markers.J. Shellfish Res.271155–1161. 10.2983/0730-8000-27.5.1155
7
Excoffier L. Heidi L. (2010). Arlequin (version 3.5.1.2): an integrated software package for population genetics data analysis.Evol. Bioinform. Online147–50.
8
Folmer O. Black M. Wr H. Lutz R. Vrijenhoek R. (1994). DNA primers for amplification of mitochondrial Cytochrome C oxidase subunit I from diverse metazoan invertebrates.Mol. Mar. Biol. Biotechnol.3294–299.
9
Fu Y. X. (1997). Statistical tests of neutrality of mutations against population growth, hitchhiking and background selection.Genetics147915–925. 10.1093/genetics/147.2.915
10
Grade A. Chairi H. Lallias D. Power D. Ruano F. Leitão A. et al (2016). New insights about the introduction of the Portuguese oyster, Crassostrea angulata, into the North East Atlantic from Asia based on a highly polymorphic mitochondrial region.Aquatic. Living Resour.29:404. 10.1051/alr/2016035
11
Guo X. (2009). Use and exchange of genetic resources in molluscan aquaculture.Rev. Aquacul.1251–259. 10.1111/j.1753-5131.2009.01014.x
12
Hamaguchi M. Shimabukuro H. Kawane M. Hamaguchi T. (2013). “A new record of the kumamoto oyster Crassostrea sikamea in the Seto Inland Sea, Japan,” in Marine Biodiversity Records, ed.AnnL. (Cambridge: Cambridge University Press).
13
Han Z. Li Q. (2019). Mendelian inheritance of orange shell color in the Pacific oyster Crassostrea gigas.Aquaculture516:734616. 10.1016/j.aquaculture.2019.734616
14
Hedgecock D. Li G. Banks M. Kain Z. (1999). Occurrence of the kumamoto oyster Crassostrea sikamea in the Ariake Sea, Japan.Mar. Biol.13365–68. 10.1007/s002270050443
15
Hsiao S.-T. Chuang S.-C. Chen K.-S. Ho P.-H. Wu C.-L. Chen C. (2016). DNA barcoding reveals that the common cupped oyster in Taiwan is the Portuguese oyster Crassostrea angulata (Ostreoida; Ostreidae), not C. gigas.Sci. Rep.6:34057.
16
Hu L. Zhang Z. Wang H. Zhang T. (2018). Molecular phylogeography and population history of Crassostrea sikamea (Amemiya, 1928) based on mitochondrial DNA.J. Exp. Mar. Biol. Ecol.50323–30. 10.1016/j.jembe.2017.11.004
17
Huvet A. Fabioux C. McCombie H. Lapègue S. Boudry P. (2004). Natural hybridization between genetically differentiated populations of Crassostrea gigas and C. angulata highlighted by sequence variation in flanking regions of a microsatellite locus.Mar. Ecol. Prog. Series272141–152. 10.3354/meps272141
18
In V. O’Connor W. Sang V. Van P. Knibb W. (2017). Resolution of the controversial relationship between Pacific and Portuguese oysters internationally and in Vietnam.Aquaculture473389–399. 10.1016/j.aquaculture.2017.03.004
19
Jin B. (2000). A study on the status and perspective for oyster aquaculture inZhejiang province.Mod. Fish. Inf.156–10.
20
Kaihao W. (2020). A Shell of a Discovery, China Daily. Available online at: https://www.chinadailyhk.com/article/132991(accessed June 06, 2020).
21
Lam K. Morton B. (2003). Mitochondrial DNA and morphological identification of a new species of Crassostrea (Bivalvia: Ostreidae) cultured for centuries in the Pearl River Delta, Hong Kong, China.Aquaculture2281–13. 10.1016/s0044-8486(03)00215-1
22
Lapègue S. Batista F. Heurtebise S. Yu Z. Boudry P. (2004). Evidence for the presence of the Portuguese oyster, Crassostrea angulata, in northern China.J. Shellfish Res.23759–763.
23
Li L. Li A. Song K. Meng J. Guo X. M. Li S. M. et al (2018). Divergence and plasticity shape adaptive potential of the Pacific oyster.Nat. Ecol. Evol.21751–1760. 10.1038/s41559-018-0668-2
24
Li S. Li Q. Yu H. Kong L. (2015). Genetic structure and population history of Crassostrea angulata from the coast of Zhejiang and Fujian Provinces.J. Fish. China221260–1269.
25
Librado P. J. R. Rozas J. (2009). DnaSP v5: a software for comprehensive analysis of DNA polymorphism data.Bioinformatics (Oxf. Engl.)251451–1452. 10.1093/bioinformatics/btp187
26
Melo C. Divilov K. Durland E. Schoolfield B. Davis J. Carnegie R. et al (2021). Introduction and evaluation on the US West Coast of a new strain (Midori) of Pacific oyster (Crassostrea gigas) collected from the Ariake Sea, southern Japan.Aquaculture531:735970. 10.1016/j.aquaculture.2020.735970
27
Mizuta D. Wikfors G. H. (2018). Seeking the perfect oyster shell: a brief review of the current knowledge.Rev. Aquacul.11586–602. 10.1111/raq.12247
28
Moehler J. Wegner M. Reise K. Jacobsen S. (2011). Invasion genetics of Pacific oyster Crassostrea gigas shaped by aquaculture stocking practices.J. Sea Res.66256–262. 10.1016/j.seares.2011.08.004
29
Ni G. Hassell E. Dong Y. Park J.-K. (2017). More than meets the eye: the barrier effect of the Yangtze River outflow.Mol. Ecol.264591–4602. 10.1111/mec.14235
30
Nowland S. Silva C. Southgate P. Strugnell J. M. (2019). Mitochondrial and nuclear genetic analyses of the tropical black-lip rock oyster (Saccostrea echinata) reveals population subdivision and informs sustainable aquaculture development.BMC Genomics20:711. 10.1186/s12864-019-6052-z
31
Özcan Gökçek E. Acarli S. Karahan B. Vural P. Koban E. (2020). First molecular record of the alien species Pacific oyster (Crassostrea gigas, Thunberg 1793) in the Marmara Sea.Mar. Sci. Technol. Bull.923–31. 10.33714/masteb.668529
32
Sang V. Knibb W. Ngoc N. In V. O’Connor W. Dove M. et al (2019). First breeding program of the Portuguese oyster Crassostrea angulata demonstrated significant selection response in traits of economic importance.Aquaculture518:734664. 10.1016/j.aquaculture.2019.734664
33
Sekino M. Ishikawa H. Fujiwara A. Yamashita H. (2016). Occurrence of the Portuguese oyster Crassostrea angulata (Lamarck, 1819) along the coast of Shikoku Island, Japan.Plankton Benthos Res.1171–74. 10.3800/pbr.11.71
34
Sekino M. Sato S. i Hong J.-S. Li Q. (2012). Contrasting pattern of mitochondrial population diversity between an estuarine bivalve, the Kumamoto oyster Crassostrea sikamea, and the closely related Pacific oyster C. gigas.Mar. Biol.1592757–2776. 10.1007/s00227-012-2037-z
35
Sekino M. Yamashita H. (2012). Mitochondrial DNA barcoding for Okinawan oysters: a cryptic population of the Portuguese oyster Crassostrea angulata in Japanese waters.Fish. Sci.7961–76. 10.1007/s12562-012-0577-2
36
Shi B. Wu Y. Zhou L. You W. Ke C.-H. (2019). Influence of gonadal development on metal accumulation in the Portuguese oyster, Crassostrea angulata, in subtropical areas.Aquacul. Res.501142–1152.
37
Sutherland B. J. G. Rycroft C. Ferchaud A. L. Saunders R. Li L. Liu S. et al (2020). Relative genomic impacts of translocation history, hatchery practices, and farm selection in Pacific oyster Crassostrea gigas throughout the Northern Hemisphere.Evol. Appl.131380–1399. 10.1111/eva.12965
38
Tajima F. V. (1989). Statistical method for testing the neutral mutation hypothesis by DNA Polymorphism.Genetics123585–595. 10.1093/genetics/123.3.585
39
Tan Y. Fang L. Qiu M. Huo Z. Yan X. (2020). Population genetics of the Manila clam (Ruditapes philippinarum) in East Asia.Sci. Rep.10:21890.
40
Vendrami D. Houston R. Gharbi K. Telesca L. Gutierrez A. P. Gurney-Smith H. et al (2018). Detailed insights into pan-European population structure and inbreeding in wild and hatchery Pacific oyster (Crassostrea gigas) populations revealed by genome-wide SNP data.Evol. Appl.12519–534. 10.1111/eva.12736
41
Wang H. Guo X. (2008a). Identification of Crassostrea ariakensis and related oysters by multiplex species-specific PCR.J. Shellfish Res.27481–487. 10.2983/0730-8000(2008)27[481:iocaar]2.0.co;2
42
Wang H. Guo X. Zhang G. Zhang F. (2004). Classification of Jinjiang oysters Crassostrea rivularis (Gould, 1861) from China, based on morphology and phylogenetic analysis.Aquaculture242137–155. 10.1016/j.aquaculture.2004.09.014
43
Wang H. Qian L. Liu X. Zhang G. Guo X. (2010). Classification of a common cupped oyster from Southern China.J. Shellfish Res.29857–866. 10.2983/035.029.0420
44
Wang H. Qian L. Wang A. Guo X. (2013). Occurrence and distribution of Crassostrea sikamea (Amemiya 1928) in China.J. Shellfish Res.32439–446. 10.2983/035.032.0224
45
Wang H. Zhang G. Liu X. Guo X. (2008). Classification of common oysters from North China.J. Shellfish Res.27495–503. 10.2983/0730-8000(2008)27[495:cocofn]2.0.co;2
46
Wang J. Xu F. Li L. Zhang G. (2014). A new identification method for five species of oysters in genus Crassostrea from China based on high-resolution melting analysis.Chin. J. Oceanol. Limnol.32419–425. 10.1007/s00343-014-3124-4
47
Wang Y. Guo X. (2008b). ITS length polymorphism in oysters and its potential use in species identification.J. Shellfish Res.27489–493. 10.2983/0730-8000(2008)27[489:ilpioa]2.0.co;2
48
Xia J. Yu Z. Kong X. (2009). Identification of seven Crassostrea oysters from the South China Sea using PCR-RFLP analysis.J. Molluscan Stud.75139–146. 10.1093/mollus/eyp001
49
Xing D. Li Q. Kong L. Yu H. (2017). Heritability estimate for mantle edge pigmentation and correlation with shell pigmentation in the white-shell strain of Pacific oyster. Crassostrea gigas.Aquaculture48273–77. 10.1016/j.aquaculture.2017.09.026
50
Xu F. Zhang G. Liu X. Zhang S. Shi B. Guo X. (2009). Laboratory Hybridization between Crassostrea ariakensis and C. Sikamea.J. Shellfish Res.28453–458.
51
Xu H. Kong L. Yu H. Liu S. (2019). Fertilization, survival and growth of hybrids between Crassostrea gigas and Crassostrea sikamea.Fish. Sci.85821–828.
52
You Z. Jiao H. (2011). Research on Ecological Environment Protection and Restoration Technology of Xiangshan Bay.Beijing: China Ocean Press.
53
Yue G. H. Xia J. Cao S. Wang C. (2020). Inferring the invasion mechanisms of the red swamp crayfish in China using mitochondrial DNA sequences.Aquacul. Fish.635–41.
Summary
Keywords
oyster distribution, Zhejiang coast, genetic diversity, dominant species, indigenous species, Kumamoto oyster
Citation
Liu S, Xue Q, Xu H and Lin Z (2021) Identification of Main Oyster Species and Comparison of Their Genetic Diversity in Zhejiang Coast, South of Yangtze River Estuary. Front. Mar. Sci. 8:662515. doi: 10.3389/fmars.2021.662515
Received
01 February 2021
Accepted
15 March 2021
Published
06 April 2021
Volume
8 - 2021
Edited by
Marcos Rubal, University of Porto, Portugal
Reviewed by
Sylvie Lapegue, Institut Français de Recherche pour l’Exploitation de la Mer (IFREMER), France; Zhang Yuehuan, South China Sea Institute of Oceanology (CAS), China
Updates
Copyright
© 2021 Liu, Xue, Xu and Lin.
This is an open-access article distributed under the terms of the Creative Commons Attribution License (CC BY). The use, distribution or reproduction in other forums is permitted, provided the original author(s) and the copyright owner(s) are credited and that the original publication in this journal is cited, in accordance with accepted academic practice. No use, distribution or reproduction is permitted which does not comply with these terms.
*Correspondence: Qinggang Xue, qxue@zwu.edu.cnZhihua Lin, zhihua9988@126.com
This article was submitted to Marine Evolutionary Biology, Biogeography and Species Diversity, a section of the journal Frontiers in Marine Science
Disclaimer
All claims expressed in this article are solely those of the authors and do not necessarily represent those of their affiliated organizations, or those of the publisher, the editors and the reviewers. Any product that may be evaluated in this article or claim that may be made by its manufacturer is not guaranteed or endorsed by the publisher.