 Ronnie Concepcion II1,2*
 Elmer Dadios2,3,4
 Argel Bandala1,2,4
 Isabel Caçador5,6
 Vanessa F. Fonseca5,7
 Bernardo Duarte5,6
- 1Electronics and Communications Engineering Department, De La Salle University, Manila, Philippines
- 2Intelligent Systems Laboratory, John Gokongwei Jr. College of Engineering, De La Salle University, Manila, Philippines
- 3Manufacturing Engineering and Management Department, De La Salle University, Manila, Philippines
- 4Center for Engineering and Sustainable Development Research, De La Salle University, Manila, Philippines
- 5Marine and Environmental Sciences Centre (MARE), Faculdade de Ciências, Universidade de Lisboa, Lisbon, Portugal
- 6Departamento de Biologia Vegetal, Faculdade de Ciências, Universidade de Lisboa, Lisbon, Portugal
- 7Departamento de Biologia Animal, Faculdade de Ciências, Universidade de Lisboa, Lisbon, Portugal
On a global scale, marine transitional waters have been severely impacted by anthropogenic activities. Historically, developing human civilizations have often settled in coastal areas with about 2/3 of the human population inhabiting areas within 20-km range from coastal areas. Environmental management worldwide strives for sustainable development while minimizing impacts to ecosystem integrity and has resulted in several framework directives, management programs, and legislation compelling governments to monitor their coastal systems and improve environmental quality. Among the most significant anthropogenic impacts to these ecosystems are land reclamation, dredging, pollution (sediment discharges, hazardous substances, litter, oil spills, and eutrophication), unsustainable exploitation of marine resources (sand extraction, oil and gas exploitation, and fishing), unmanaged tourism activities, the introduction of non-indigenous species, and climate change. The multitude of stressors is not independent, and as such, the chemical status of marine systems has serious implications on its ecological status and needs to be addressed efficiently. Public monitoring databases provide a large amount of physico-chemical (nutrient, dissolved oxygen, and chlorophyll a concentration) and contaminant (trace metals and polycyclic aromatic hydrocarbons) data for all Portuguese transitional systems (estuaries and coastal lagoons). These data are used to classify the chemical status (eutrophication and contamination level) of these ecosystems considering pre-defined classification thresholds, which facilitates communication to government authorities and management entities. Artificial intelligence and machine learning techniques provide an automated and efficient opportunity to improve simulation accuracy and further advance our understanding of environmental problems in estuarine and coastal waters when dealing with large environmental datasets. In the present work, we applied machine learning models, namely, linear discriminant analysis, classification tree, naive Bayesian, and support vector machine, to nutrient, dissolved oxygen, chlorophyll a, trace metals, and polycyclic aromatic hydrocarbon concentrations to produce a chemical status classification of the Portuguese marine transition systems. This approach allowed us to efficiently classify in an automated way the transitional water’s chemical status within the pre-defined classification thresholds, producing numerical index values that can easily be communicated to the general public and managers alike.
Introduction
Coastal and transitional marine systems sustain some of the most important ecosystems on the planet (estuaries and coastal lagoons). These ecosystems are extremely rich in biodiversity, providing habitat, shelter, feeding, and reproductive grounds for several animals (fishes, birds, and invertebrates) while also harboring a high floristic diversity in terms of angiosperms (seagrasses and salt marshes). The latter provide additional ecosystem services to these transitional systems, such as shoreline protection against storm surge and erosion, carbon sequestration due to its high primary productivity, eutrophication reduction, and bioremediation of contaminants, while also acting as key biological elements as important habitats (Duarte et al., 2017). These characteristics (among others) have historically attracted developing human civilizations to coastal areas, in addition to facilitated access to water-promoted trade, commerce, and disposal of wastes (Borja and Dauer, 2008). Thus, on a global scale, coastal and transitional waters (TW) have been severely altered by anthropogenic activities. Globally, environmental management strives for sustainable development while minimizing impacts to ecosystem integrity (Müller, 2005). Among the most significant anthropogenic impacts to these ecosystems are land reclamation, dredging, pollution (sediment discharges, hazardous substances, litter, oil spills, and eutrophication), unsustainable exploitation of marine resources (sand extraction, oil and gas exploitation, and fishing), unmanaged tourism, the introduction of alien species, and climate change (Borja et al., 2008). But, nowadays, international laws have moved to prioritize the cooperative environmental improvement, compelling stakeholders and ecologists to establish a connection between the generated anthropogenic activities and its consequent ecological impacts.
The Water Framework Directive (WFD; European Commission EC, 2000) establishes a framework for the protection of all waters (including inland surface waters, TW, coastal waters, and groundwaters) and is aimed at achieving a good-quality status in all European waters by 2015. The concept of ecological status of the various waters is defined by the WFD in terms of the quality of the biological community present, as well as the quality of its hydromorphological and physico-chemical characteristics. Its application requires methods that can distinguish different levels of ecological quality to classify surface waters. With the implementation of the WFD, the European Union member states are compelled to monitor the ecological quality of all their water bodies and elaborate an efficient management plan to solve potential quality problems of their TW. In order to implement a transnational monitoring scheme, five biological quality elements (BQE) were defined for the ecological quality assessments: phytoplankton, macroalgae, marine angiosperms, benthic invertebrate fauna, and fish fauna. The evaluation of these biological elements is supported by the characterization of hydromorphological and physico-chemical elements of water bodies. The abiotic elements include general variables (such as dissolved oxygen and nutrients, etc.) and priority substances (The European Parliament and the Council of the European Union, 2008a, b), i.e., trace metals and organic compounds. This defines specific environmental quality standards (EQS) based on priority substances for the dissolved water fraction of the systems. However, several works point out that “the monitoring network shall be designed so as to provide a coherent and comprehensive overview of ecological and chemical status,” and thus, it is reasonable that at least water and sediment should be simultaneously included in the evaluation system for all coastal water bodies (Crane, 2003; Borja et al., 2004a). Two levels of evaluation of the chemical status are currently used within the WFD: physico-chemical conditions influencing the biological quality, which are mostly related with eutrophic processes (nutrients, oxygen, and turbidity, etc.) (Painting et al., 2007), and the classification of the chemical status, based on the evaluation of the concentration of priority substances only (Coquery et al., 2005). Within the WFD spirit, these two approaches are strictly related as it has been described in previous studies, thus supporting the need to address both chemical traits concomitantly (Borja et al., 2004a, 2008; Tueros et al., 2008). Regarding the first and since marine coastal eutrophication has become more frequent over recent years, the need to classify these systems according to their nutrient burden has arisen, alongside their phytoplankton concentration and oxygen conditions and in sum the probability of the system to enter a eutrophic condition (Vollenweider et al., 1998). Changes in the trophic state of the systems toward an eutrophic condition can be as harmful to the system biota as a contamination event and thus need to be faced within mandatory monitoring features (Vollenweider et al., 1998; Salas et al., 2008). As for the second, chemical contamination from anthropogenic origin focusing on metal, polycyclic aromatic hydrocarbon (PAH), and polychlorinated biphenyl (PCB) contamination does not require any introduction, due to its renowned negative effects in all biotic compartments, due to biochemical stress disorders, cell oxidative stress, and inevitable impacts at the organism and population level. Although for a trophic classification a set of conditions need to be approached to trigger the transition to an undesired trophic status, for contaminants, although they often have similar origins and occur simultaneously with similar patterns of distribution, the presence of any contaminant should be faced individually and produces negative biology effects in isolation as well as in mixture.
These chemical traits are composed of a vast array of physico-chemical variables along with a wide list of priority substances and concentrations in waters and sediments, making the evaluation of this set of chemical traits complex. At this level, as well as in several other areas related to management and decision-making, machine learning (ML) approaches can be of added value for interpreting and providing the necessary support tools for an effective decision-making process (Tulabandhula and Rudin, 2014). To overcome these difficulties, we propose the use of supervised ML, where the predictive models are based on the knowledge extracted from a training data set, which typically consists of a set of features and associated labels (classification) or continuous values (regression), aiming to fit the training data to a function that can be used to predict a label or a continuous value in a new input data (e.g., new samples) (Cordier et al., 2017). If one could argue that chemical surveillance and monitoring through water analysis is still needed, ML can improve the automatic classification process and detect early signs of water chemical quality degradation, if coupled for example to automatic samplers and autonomous analyzers. Using ML processes, this autonomously collected water quality data by, e.g., deployed sensors, can be integrated and the chemical water status predicted and classified, allowing decision makers and stakeholders to act in conformity and prevent, e.g., higher water quality degradation levels or take action against the causes of this decrease in almost real time (Castrillo and García, 2020; Lu and Ma, 2020). Moreover, classifications are water chemical status based in several parameters and not a single one, and thus, a ML-assisted decision process would improve the decision on the correct classification extracted from a set of mandatory parameter measurements that not always show concordance.
In this study, we investigated the possibility of using supervised ML and tested different algorithms to build predictive models for the inference of two chemical status classification systems, based on trophic and contaminant characteristics commonly used within the WFD for the quality status assessment of transitional coastal systems, using publicly available data and the Portuguese estuaries and coastal lagoons as a case study.
Materials and Methods
Specific water chemical monitoring parameters were manually selected and clustered based on their significance to trophic state and contamination level. Marine system chemical parameters were set as input to a manual pre-classifying stage of trophic state and water contamination level hinged on OECD standard (Figure 1). Feature selection and feature-based ML modeling were processed separately for the two chemical state classifications. The outputs of this study are classified trophic state and water contamination levels based on water limnological parameters.
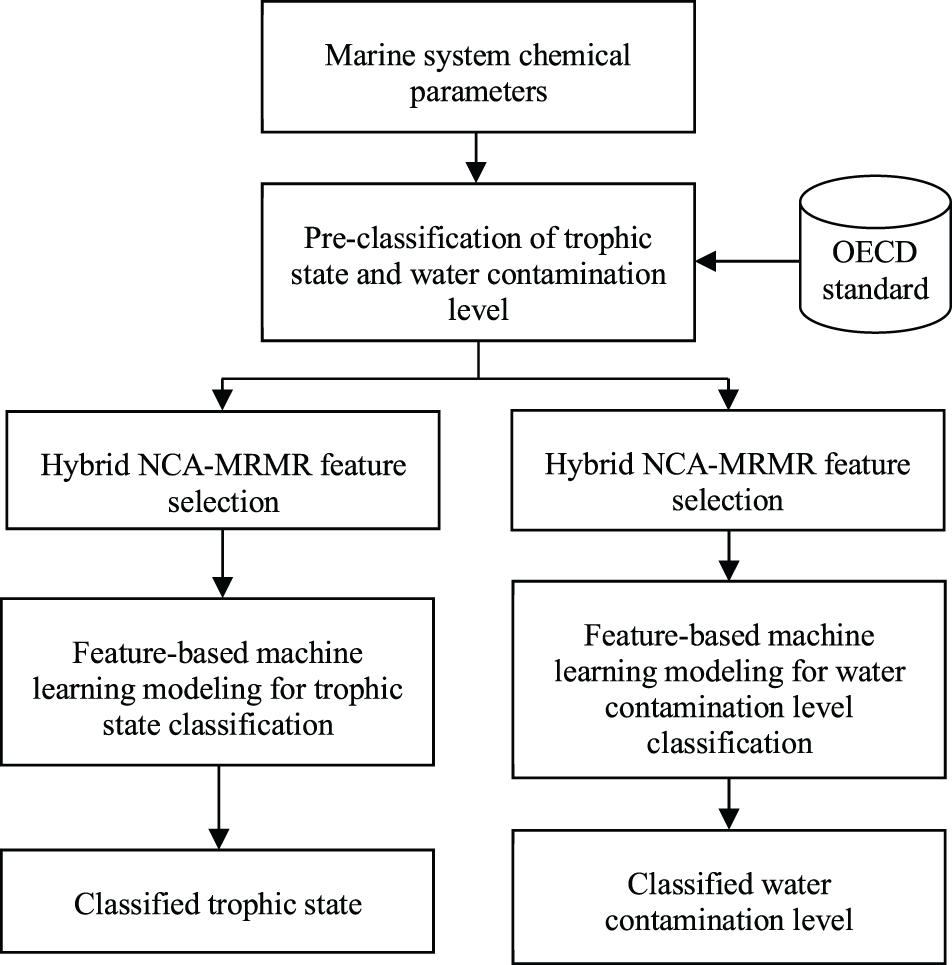
Figure 1. General architecture of feature-based machine learning model development in classifying chemical state of marine transitional systems, which are trophic state and contamination level.
Environmental Data
Physico-chemical (Table 1) and contaminant data (Table 2) data (collections from March 2009 to April 2010) were attained from the Portuguese National Water Institute (Instituto Nacional da Água, INAG), specifically from the National Information System on Hydric Resources (Sistema Nacional de Informação de Recurso Hídricos, SNIRH1) database. There were 145 combinations of data extracted and used as input to the computational intelligence model. These data refer to water and sediment sampling collections and analysis within the WFD implementation program in Portugal in all Portuguese transitional water systems (estuaries and coastal lagoons) (Figure 2). Surface water samples (for trophic state evaluation) were collected along with bottom sediments (for contamination state assessment). All analytical procedures were done according to the WFD-recommended procedures according to the Environmental Quality Standards Directive 2008/105/EC (as amended by The European Parliament and the Council of the European Union, 2013). Values below the detection limit were substituted by the detection limit value for statistical and ML processing purposes. Trophic state threshold standards (Table 3) were defined according to Salas et al. (2008) adapted by Primpas and Karydis (2011). Water contamination level threshold standards (Table 4) were defined according to Annicchiarico et al. (2011).
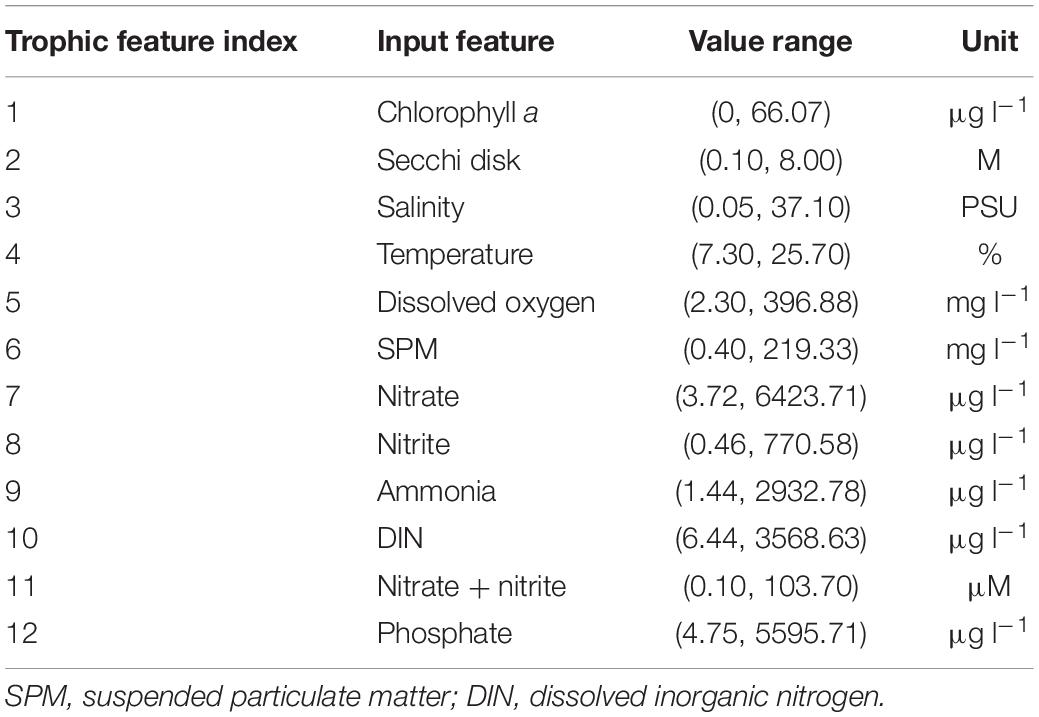
Table 1. Complete input features for trophic state classification, including value range and units.
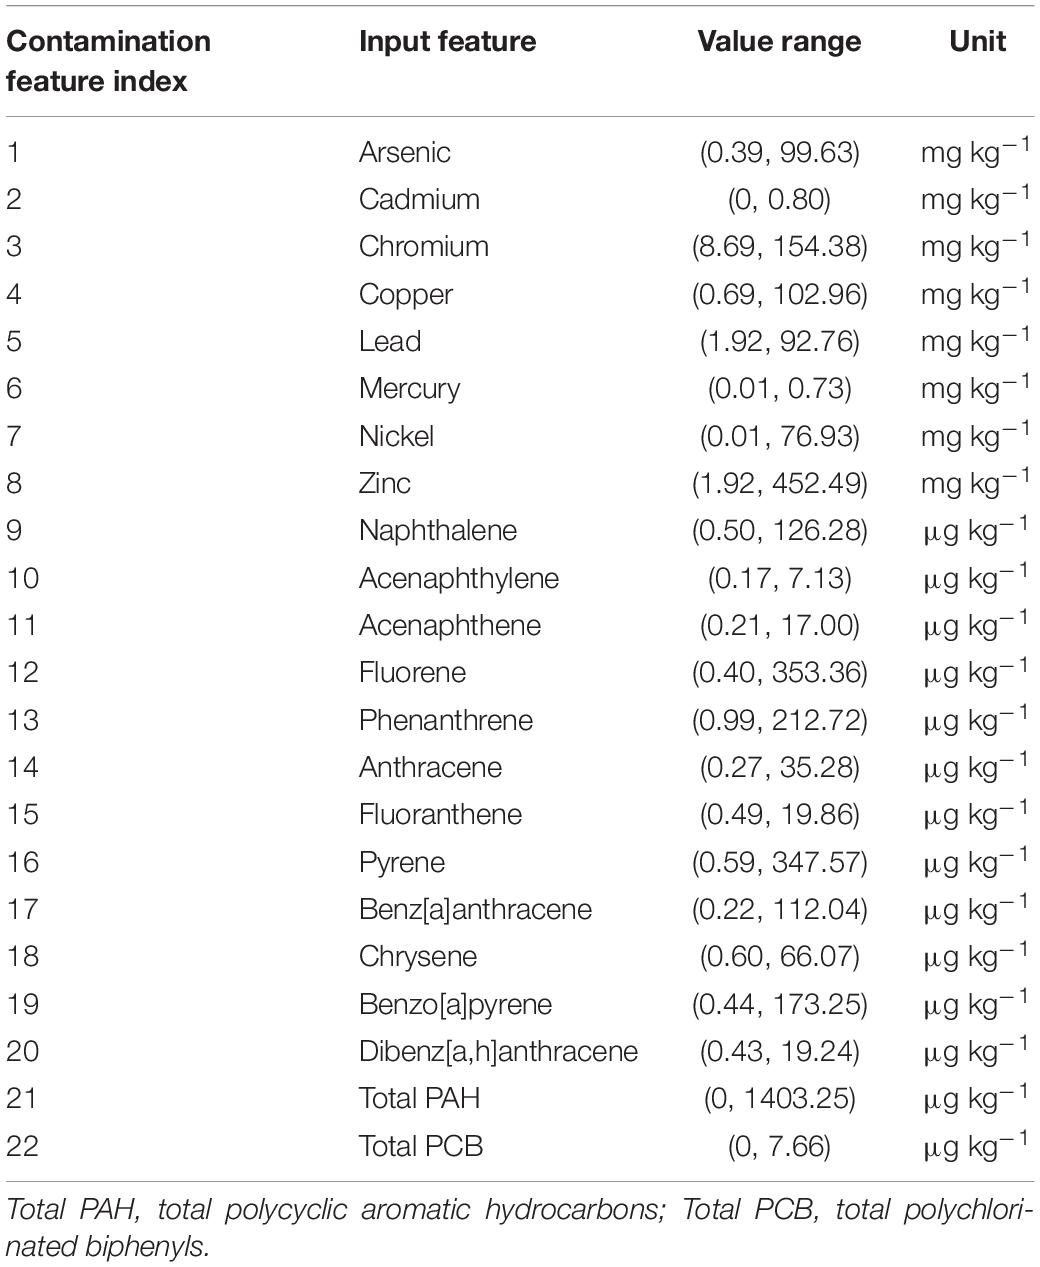
Table 2. Complete input features for water contamination level classification, including value range and units.
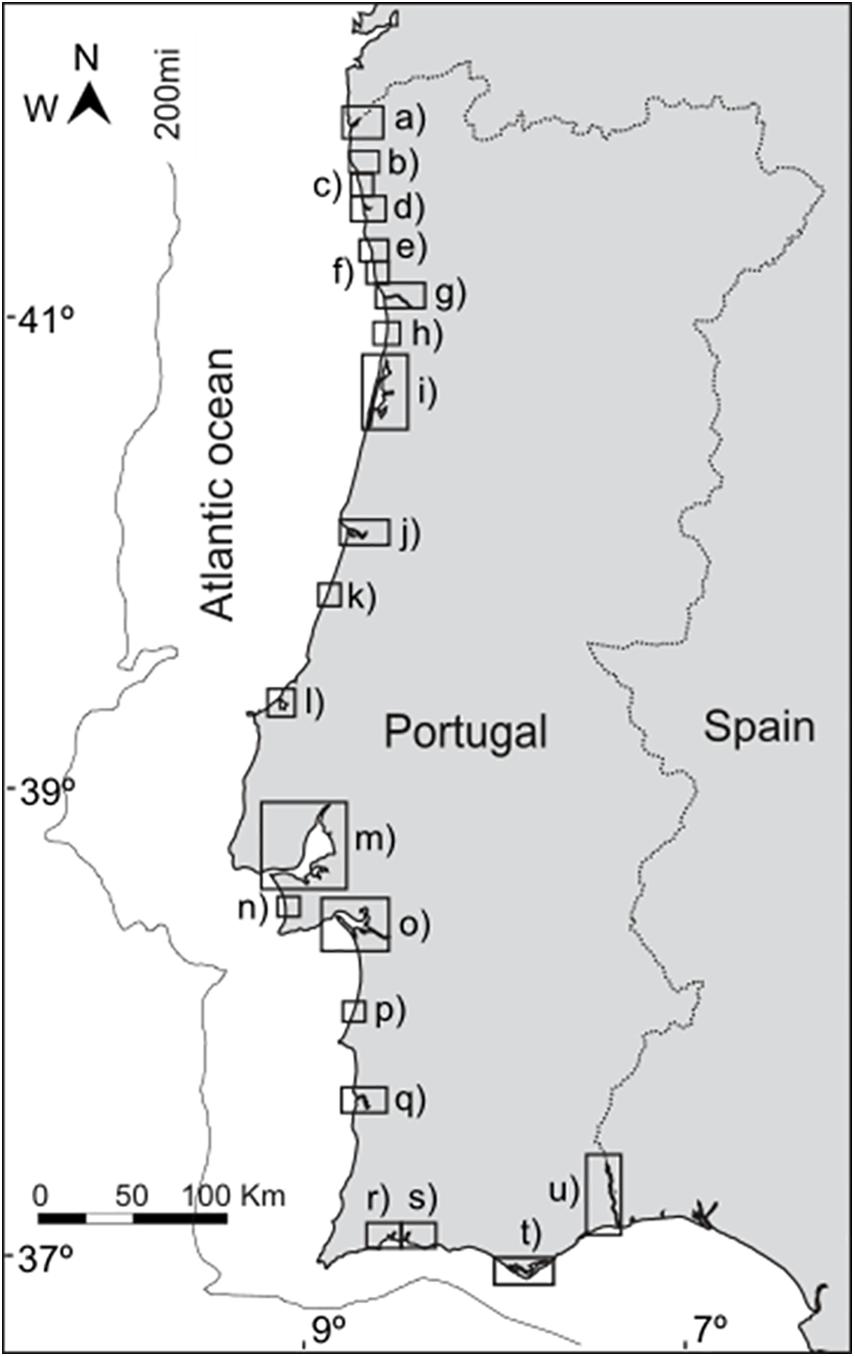
Figure 2. Coastal transitional systems considered in this study: (a) Minho estuary; (b) Lima estuary; (c) Neiva estuary; (d) Cávado estuary; (e) Ave estuary; (f) Leça estuary; (g) Douro estuary; (h) Esmoriz; (i) Aveiro coastal lagoon; (j) Mondego estuary; (k) Liz estuary; (l) Óbidos coastal lagoon; (m) Tagus estuary; (n) Albufeira coastal lagoon; (o) Sado estuary; (p) Santo André coastal lagoon; (q) Mira estuary; (r) Alvor estuary; (s) Aráde estuary; (t) Ria Formosa coastal lagoon, and (u) Guadiana estuary.
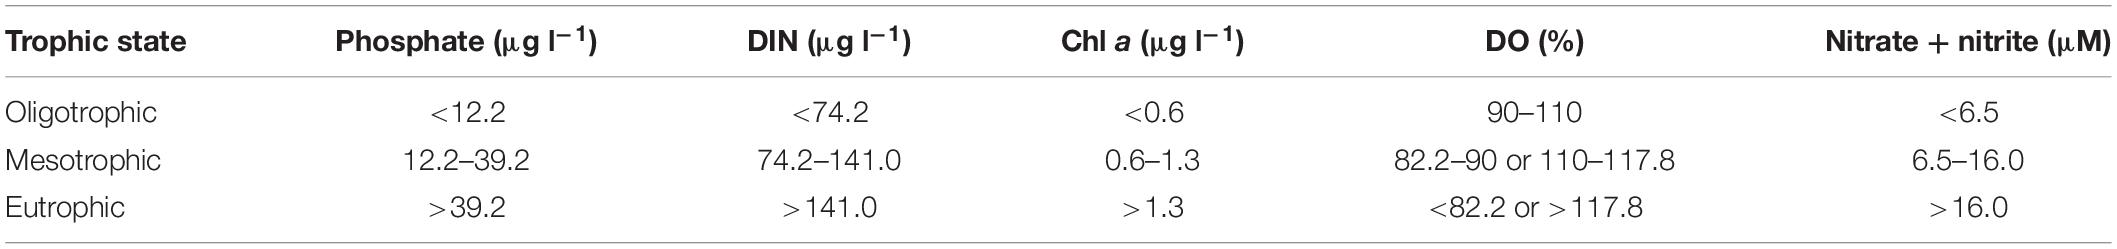
Table 3. Trophic state threshold standard for phosphate, dissolved inorganic nitrogen (DIN), chlorophyll a (Chl a), dissolved oxygen (DO), and nitrate and nitrite concentration, following Salas et al. (2008) and Primpas and Karydis (2011).
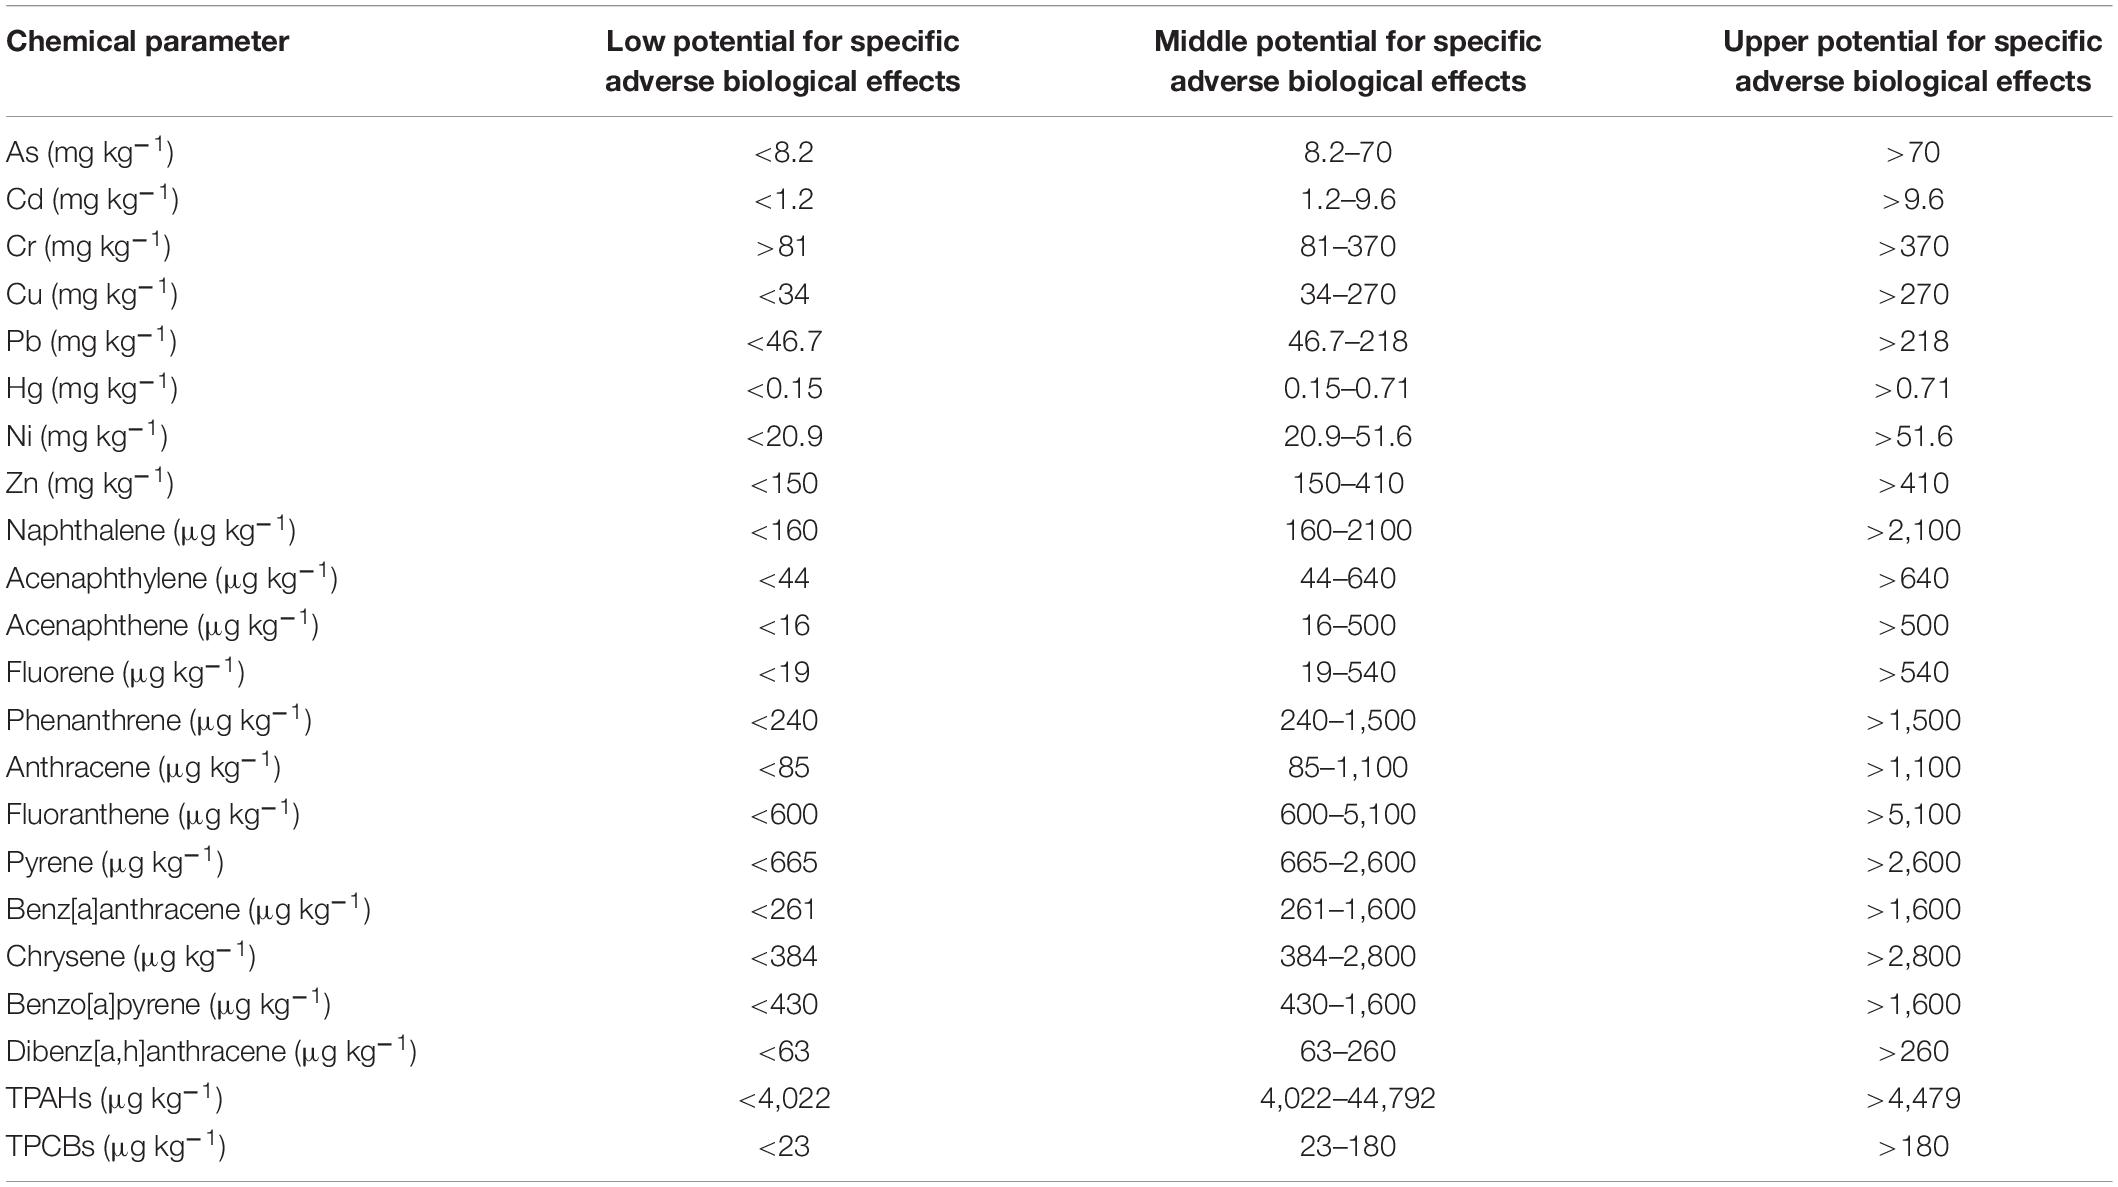
Table 4. Sediment contamination level threshold standards for trace elements and organic contaminants, following Annicchiarico et al. (2011).
Manual classification of the samples was done based on Tables 3, 4 thresholds using two approaches: averaging and worst-case scenarios. Each variable was classified from 1 to 3 according to its value and the correspondent threshold range. For the trophic classification state, only five of the 12 features available have their threshold predefined according to Salas et al. (2008). Nevertheless, the remaining values are typically measured and framed within the same analysis, as the variables used for trophic classification heavily depend on the remaining variables. In short, these supplementary variables are not used in the classification system, but they are key to understand the cause of the observed changes. Variables were classified according to their trophic classification with 1 (if the variable has values within the oligotrophic ranges), 2 (if the variable has values within the mesotrophic ranges), or 3 (if the variable has values within the eutrophic ranges). For contamination classification, a similar approach was taken, but integrating all the available independent and measured features: variables were classified with 1 (if the variable has values within the low potential for specific adverse biological effects ranges), 2 (if the variable has values within the middle potential for specific adverse biological effects ranges), or 3 (if the variable has values within the upper potential for specific adverse biological effects ranges). For overall sample classification using the averaging approach, variable classification was averaged and rounded to the unit. For applying the worst-case approach, samples were classified according to the variable with worst classification, based on the “one out, all out” principle of the WFD (European Commission EC, 2000).
Feature Selection
Feature selection is an essential stage in ML as it computationally determines the relevance of an array of features by automatically selecting a subset of features that can increase the accuracy of the model to be constructed (Concepcion II et al., 2020). In this study, hybrid neighborhood component analysis (NCA) and minimum redundancy minimum relevance (MRMR) algorithm were developed to reduce the original 12 features for trophic state classification (Table 1) and 22 features for water contamination level classification (Table 2) using MATLAB 2020a platform. This multidimensional reduction technique is expected to make the ML model to have reduced overfitting, faster training time, and simple model input structure. NCA model was configured with stochastic gradient descent (SGD) as solver, a minimum batch size of 10, and a pass limit of 5. It was tuned using a subset size of 100 and iterations of 20. MRMR used the “fscmrmr” function in MATLAB that ranks the inputted features and ranks them based on the generated mutually and maximally differentiated variances. The resulting feature weights generated by hybrid NCA–MRMR is averaged and ranked with the highest average weight as the most important feature. The number of features to be selected is based on the recommendation of principal component analysis (PCA) that was configured using listwise for missing value treatment and eigenvalue threshold of 1.0. Factorability tests of Kaiser–Meyer–Olkin (KMO) measure of sampling adequacy and Bartlett’s test of sphericity were also considered in pulling the count of final features to be accepted as input to the ML model. To discriminate the suitability of ML models in this application, the impacts of complete and reduced feature sets are separately inputted with stratified data sampling of 56%–24%–20% (81–34–30 data) for training, validation, and testing, respectively.
Development of Trophic State Classification Model
Four feature-based ML models, namely, linear discriminant analysis (LDA), decision tree for classification (CTree), naïve Bayesian (NB), and support vector machine (SVM), were configured and optimized in classifying trophic state based on limnological stressors. LDA was optimized with delta of 39.725 and gamma of 0.85031 (Figure 3A). CTree was optimized with a minimum leaf size of 1, a minimum parent size of 10, activated leaf merging and pruning, and Gini’s diversity as split criterion (Figure 3B). NB was optimized with normal distribution and width of 4.7842 × 10⁻¹¹ (Figure 3C). SVM was optimized using “onevsall” coding, box constraint of 942.21, kernel scale of 106.7, bias of -2.4124, and sequential minimal optimization as the solver (Figure 3D). Trophic state features (Table 1) were inputted to these models.

Figure 3. Optimization of (A) linear discriminant analysis, (B) classification tree, (C) naïve Bayes, and (D) support vector machine models for trophic state classification and optimization of (E) linear discriminant analysis, (F) classification tree, (G) naïve Bayes, and (H) support vector machine models for sediment contamination level classification.
Development of Sediment Contamination Level Classification Model
Four feature-based ML models, namely, LDA, CTree, NB, and SVM, were configured and optimized in classifying water contamination level based on limnological stressors (Table 2). LDA was optimized with delta of 3.7953 × 10⁻⁶ and gamma of 0.92488 (Figure 3E). CTree was optimized with a minimum leaf size of 1, a minimum parent size of 10, activated leaf merging and pruning, and Gini’s diversity as split criterion (Figure 3F). NB was optimized with kernel-based distribution and width of 2.3529 (Figure 3G). SVM was optimized using “onevsall” coding, box constraint of 0.38012, kernel scale of 0.99577, bias of -8.8426, and sequential minimal optimization as the solver (Figure 3H). Trophic state features (Table 2) were inputted to these models.
Model Evaluation Metrics
The developed feature-based ML models for both chemical state classifications were evaluated based on classification accuracy, fall-out, precision, specificity, recall, F1-score, and inference time. Accuracy defines the ratio of correct predictions and total predictions done by the system. Fall-out is the false positive rate, which defines the ratio of false positive classifications and the actual negative. Precision defines the ratio of true positive predictions and the true and false positive predictions. Specificity defines the ratio of true negative prediction and the combined true negative and false positive predictions. Recall or sensitivity defines the ratio of true positive predictions and the combined true positive and false negative predictions. F1-score is a measure of model’s accuracy based on precision and recall parameters. Inference time defines how long a prediction is inferred by the developed ML model. These are standard determinants for assessing the reliability of the developed ML models.
Results and Discussion
Surface Water Trophic Characterization and Sediment Contamination Profiles
Evaluating the chemical data from the water (Supplementary Table 1) and sediment (Supplementary Tables 2, 3) samples from all the coastal transitional systems surveyed, high variability was observed. In terms of phosphate concentration in the water column, the Alvor coastal lagoon was the systems with the highest value, while the Lima estuary presented the lowest concentration of this phosphorous form. Regarding dissolved inorganic nitrogen (DIN) concentrations, these were found to be higher in the water samples collected at the Leça estuary, while the lowest values were found in the surface water samples from the Albufeira coastal lagoon. The Guadiana estuary showed the highest water Chl a concentration, in opposition to the Tagus estuary, where the lowest value for this parameter was measured. For dissolved oxygen, the maximum and minimum concentrations where both detected in the Albufeira coastal lagoon.
In terms of bottom sediment trace element concentrations (Supplementary Table 2), this was also variable according to the element analyzed. Zinc was the most abundant element detected, followed by Cr and Pb, with Hg and Cd the least abundant. Arsenic highest concentrations were detected in the Guadiana estuary, while the lower ones were observed in the Lis estuary. Cd concentrations were highest in the Leça estuary bottom sediments and lower in the sediment samples collected in the Ria Formosa coastal lagoon. Sado estuary bottom sediments presented the highest Cr concentrations. In opposition, the Guadiana estuary sediments showed the lowest concentrations of this element. The Leça estuary presented the highest concentrations of Cu and Pb, while the lower concentrations of these elements were measured in the Ria Formosa and Óbidos coastal lagoons, respectively. Mercury concentrations were highest in the Aveiro coastal lagoon, while in several transitional systems, this element was not detected. Regarding Ni, this was found to be more abundant in the Sado estuary sediments, while the Santo André coastal lagoon showed the lowest concentrations. Finally, Zn had its maximum concentrations in the samples collected at the Leça estuary, being the lowest concentrations observed in the Óbidos coastal lagoon sediments.
Regarding sediment organic contamination (Supplementary Table 3), the Albufeira coastal lagoon bottom sediments proved to have the highest concentrations of anthracene, benz[α]anthracene, chrysene, and benzo[α]pyrene, while the highest concentrations of acenaphthene and fluoranthene were present in the sediments sampled at the Douro estuary. Fluorene, phenanthrene, and pyrene concentrations were found to be maximum in the Esmoriz transitional system. The Guadiana estuary sediments showed the highest and lowest concentrations of acenaphthylene. On the other hand, naphthalene and dibenz[α,h]anthracene showed their maximum sediment concentration values at the Leça estuary. Overall, the Albufeira coastal lagoon showed the highest concentrations of total PAHs, while the highest concentrations of PCBs were observed in the sediment samples collected at the Mira estuary.
NCA–MRMR-Selected Trophic State and Water Chemical Predictors
For the feature selection intended for trophic state classification, NCA ranked dissolved oxygen, nitrate, and phosphate as the most impactful features (Figure 4A). On the other hand, MRMR resolved on using Secchi disk, suspended particulate matter (SPM), and chlorophyll a (Figure 4A). The generated feature weight spectrum resembles erratic prediction of weights, thus combining it mathematically reduced the issue on rankings. Hence, the PCA-generated eigenvalue delineation graph considered only four tropic feature indices with an eigenvalue at least 1 (Figure 4C). The factorability test of KMO measure of sampling adequacy resulted in 0.531382, indicating that variance in classification is caused by certain underlying factors, and factor analysis is recommended. The Bartlett’s test of sphericity agrees with the recommended of KMO with chi-square of 18559.3. Thus, NCA–MRMR selected dissolved oxygen, SPM, nitrate, and DIN (four-feature array) as the most relevant features in classifying trophic state. These four extracted features account for 68.6853% of the variability of the original data (12-feature array).
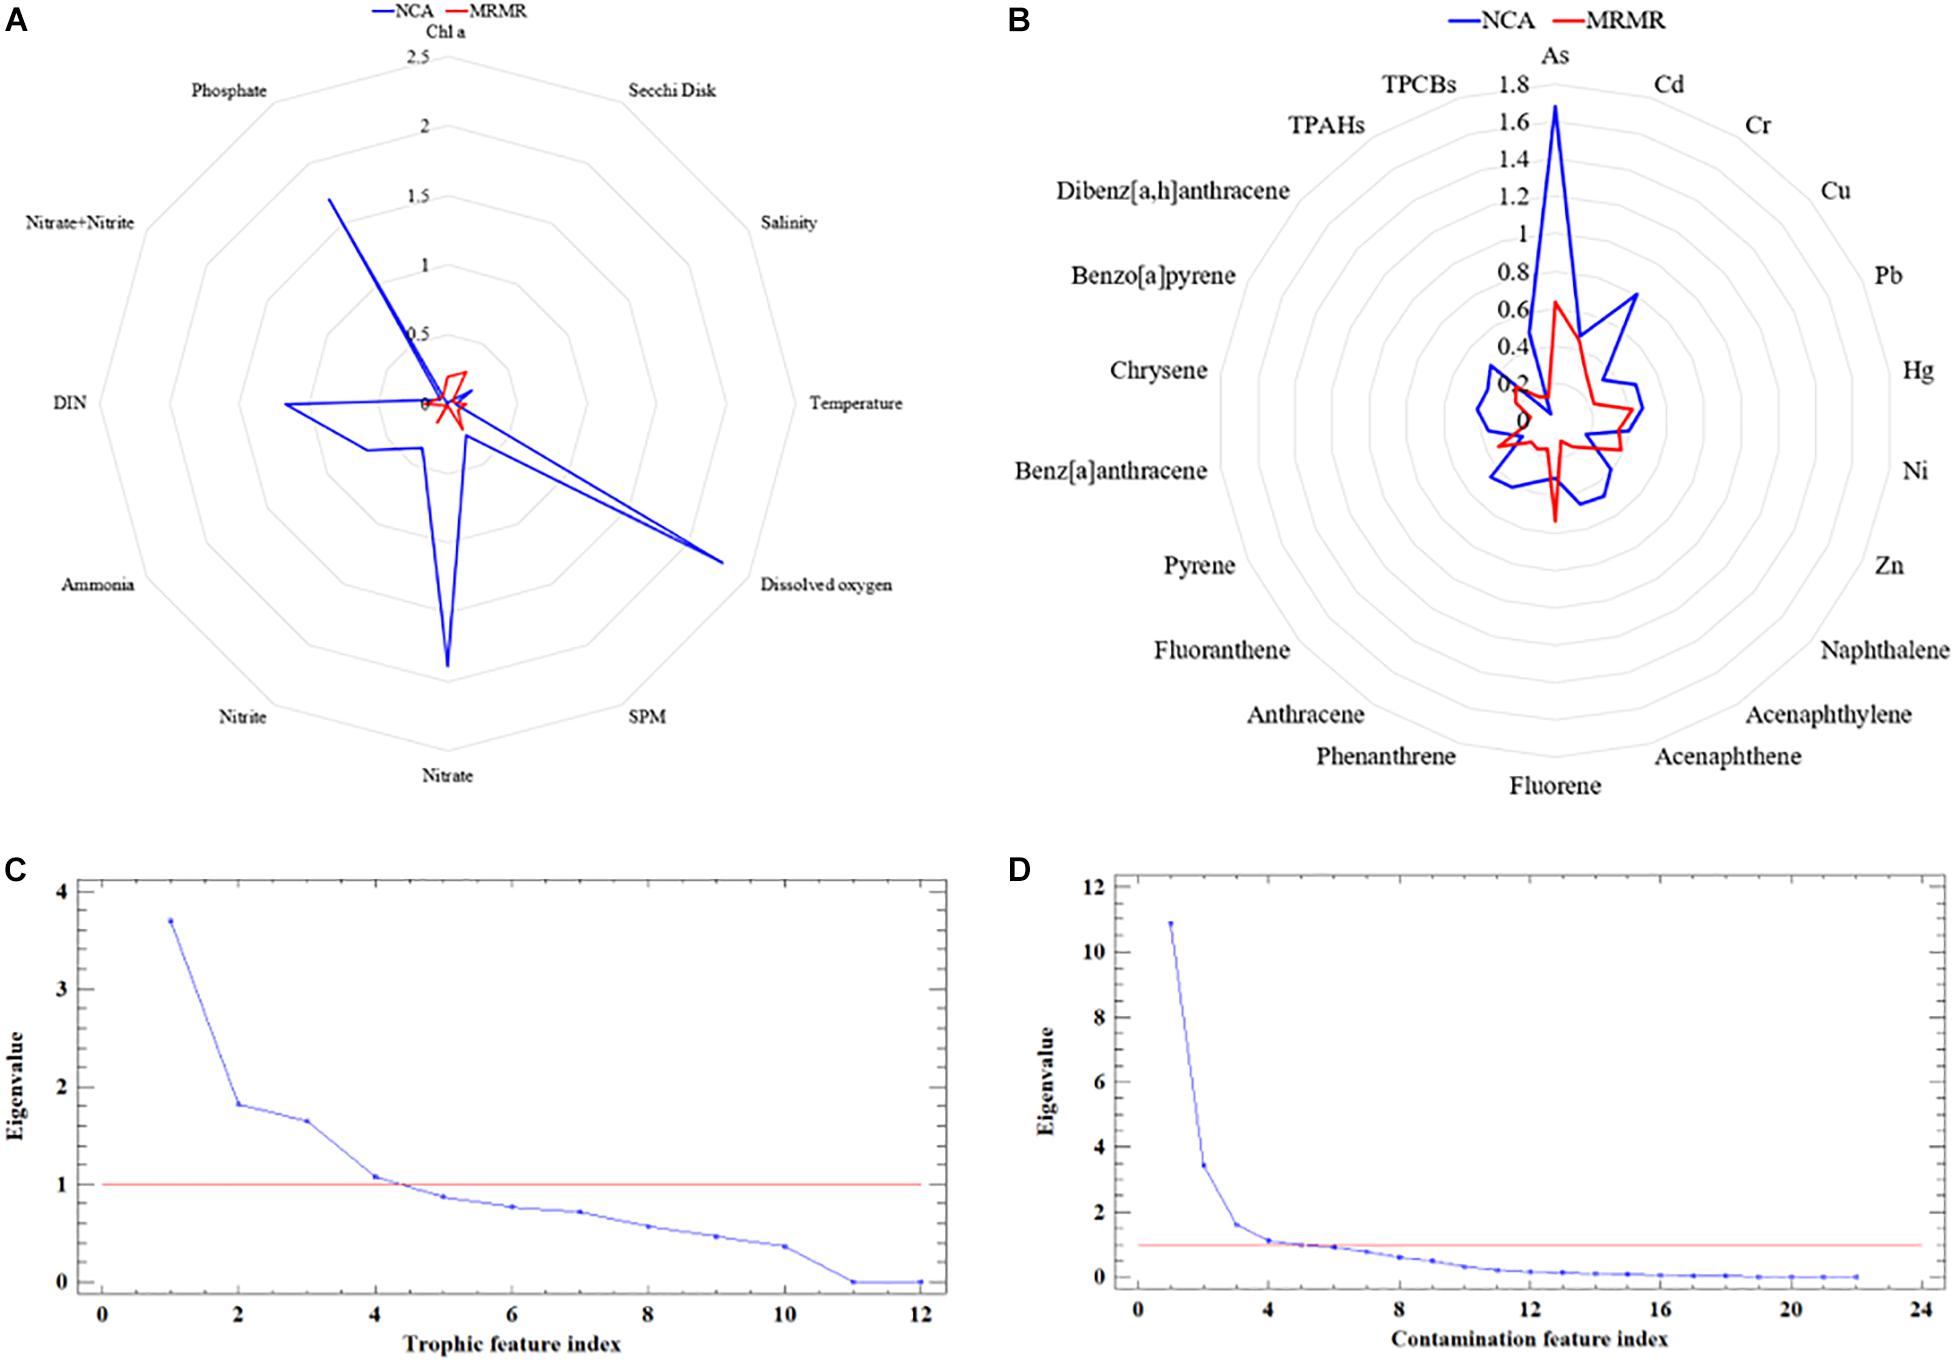
Figure 4. Feature weight spectrum generated by neighborhood component analysis and minimum redundancy maximum relevance algorithms for (A) trophic state and (B) sediment contamination level classifications. Eigenvalue delineation diagram indicating the (C) trophic and (D) contamination feature indices in determining the number of features to be selected.
In the case of the feature selection for water contamination level classification, NCA ranked arsenic and chromium as the most impactful features, and MRMR weighted best arsenic, fluorene, and cadmium (Figure 4B). The generated feature weight spectrum has a profound inclination to arsenic and mercury, but not all selections provided by NCA and MRMR agree with each other; thus, combining it rationally resolved the issue on feature rankings. The PCA-generated eigenvalue delineation graph considered four features to be extracted from hybrid NCA–MRMR (Figure 4D). The factorability test of KMO measure of sampling adequacy resulting in 0.794467 concurs with Bartlett’s test of sphericity with chi-square of 5534.09 that there are underlying factors that significantly affect the shared variance of the total system. Thus, NCA–MRMR selected arsenic, cadmium, chromium, and mercury (four-feature array) as the most relevant features in classifying water contamination level. These four extracted features account for 77.4473% of the variability of the original data (22-feature array).
Feature-Based Machine Learning Trophic State Classification
After several explorations and convergences of the optimized feature-based ML models (Figure 3), the optimal accuracy and sensitivity in classifying trophic state-based limnological parameters was achieved. In the following discussions, classification models are subscripted with the number of features to differentiate the context of employed number of limnological features as predictors using the same set of ML models. LDA12 and SVM4 have classified eutrophic data condition with 35.714% accuracy while SVM12 has classified it 64.286% correctly. LDA4 missed all eutrophic classifications (Figure 5A). CTree12 and CTree4 have classified all eutrophic data perfectly (Figure 5B). In mesotrophic classification, LDA4 exhibited the best performance of 100% classification followed by CTree4 with 96.552% accuracy. NB4 misclassified 18.966% of mesotrophic as eutrophic and 5.172% of mesotrophic as oligotrophic (Figure 5C). In oligotrophic classification, LDA4 incorrectly predicted all samples while CTree12, CTree4, NB12, NB4, and SVM12 have classified it flawlessly. It was observed that the mesotrophic condition is the easiest to classify with a cumulative average accuracy of all optimized models equal to 92.026% followed by oligotrophic with 81.25%. Eutrophic state is the hardest to classify with an overall average accuracy of 64.286%. Overall, CTree4 bested out other ML models in classifying trophic state with an accuracy of 99.61% in the training and validation stages and 99.43% in the testing stage (Table 5). CTree12 has fall-out rate of 50.834% better than CTree4, but the latter has 100% recall rate and 22.9884% inference time than the prior one. This makes the developed NCA–MRMR–CTree model very suitable for fast prediction having low computational cost in the system.
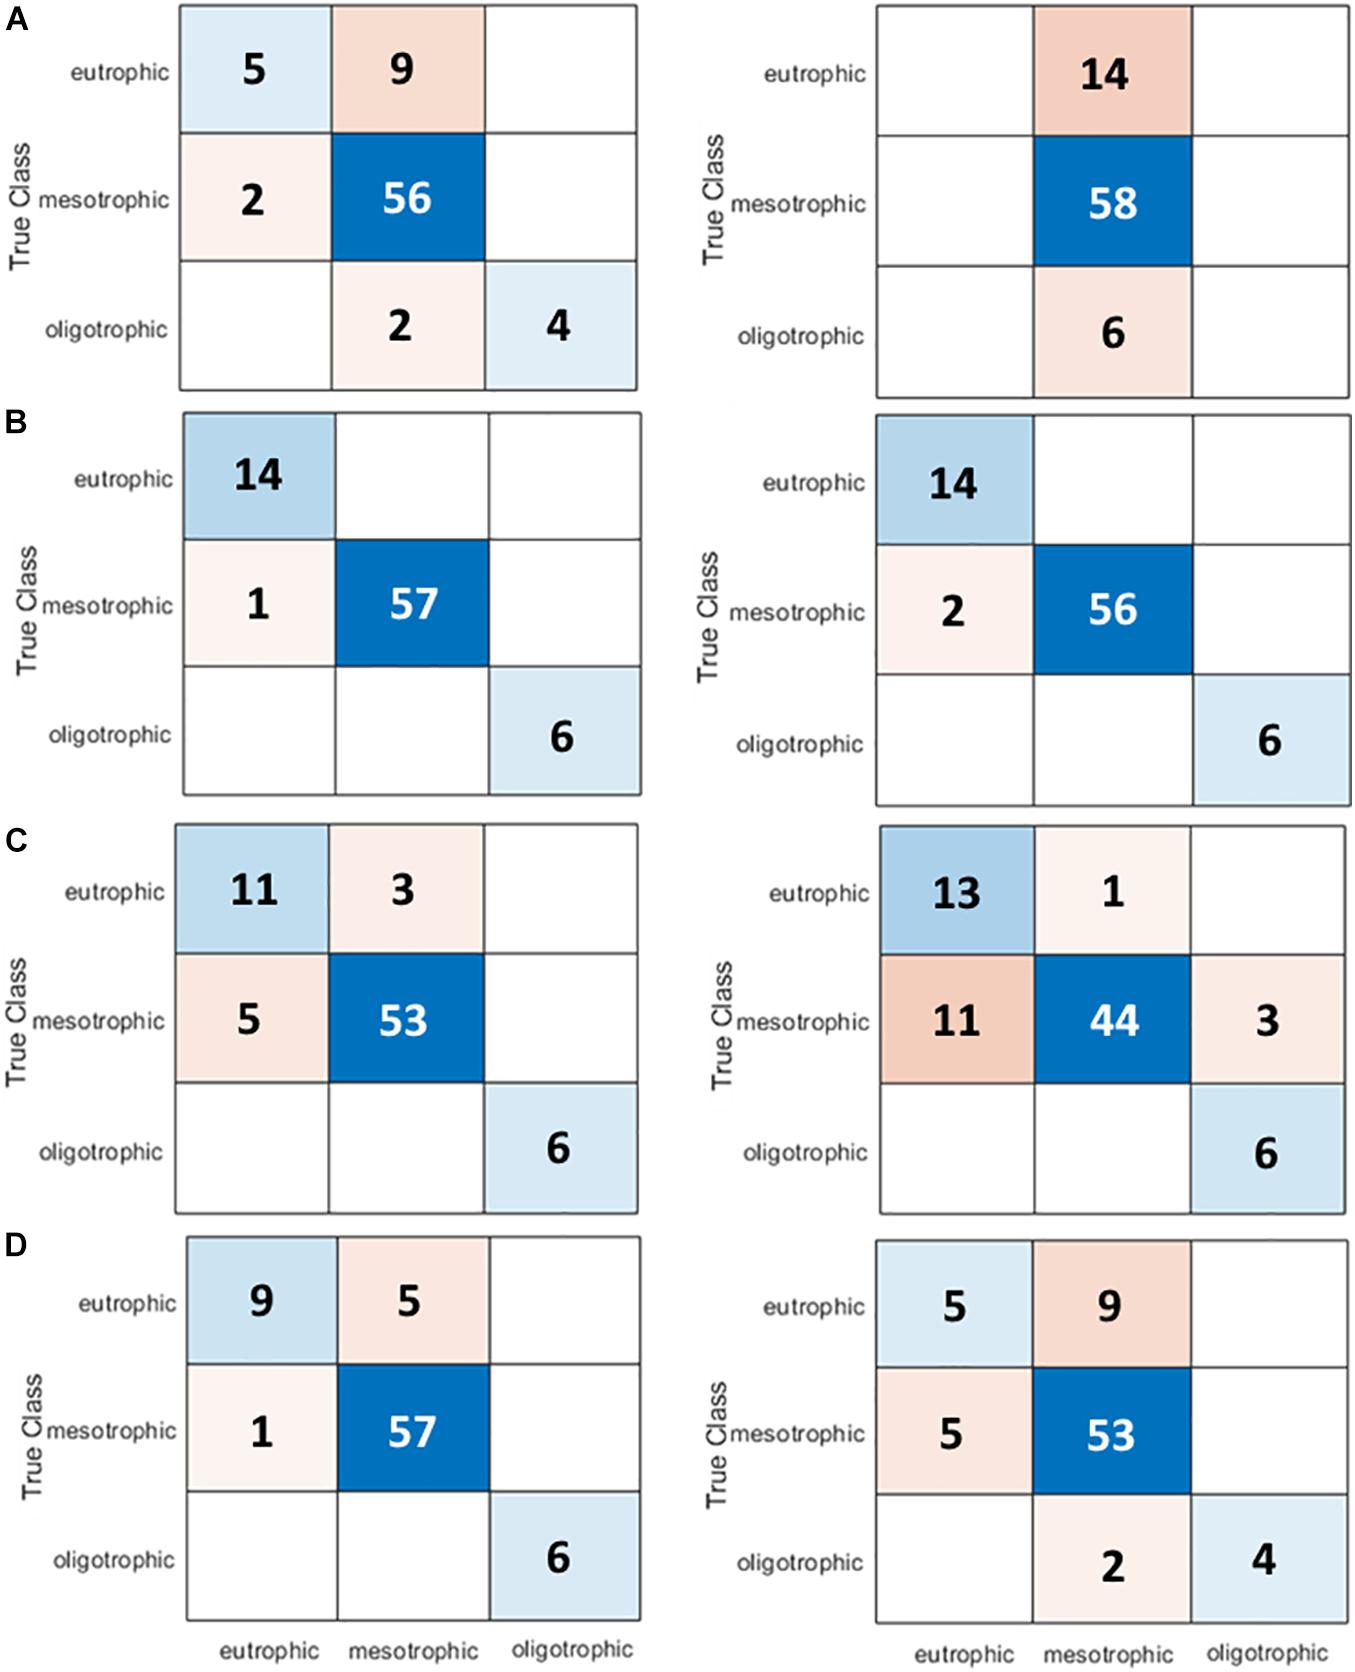
Figure 5. Confusion matrices of (A) LDA, (B) CTree, (C) NB, and (D) support vector machine (SVM) model for trophic state classification using 12 features (without feature selection, Table 1) and four features [NCA–MRMR selected dissolved oxygen, suspended particulate matter (SPM), nitrate, and dissolved inorganic nitrogen (DIN)].
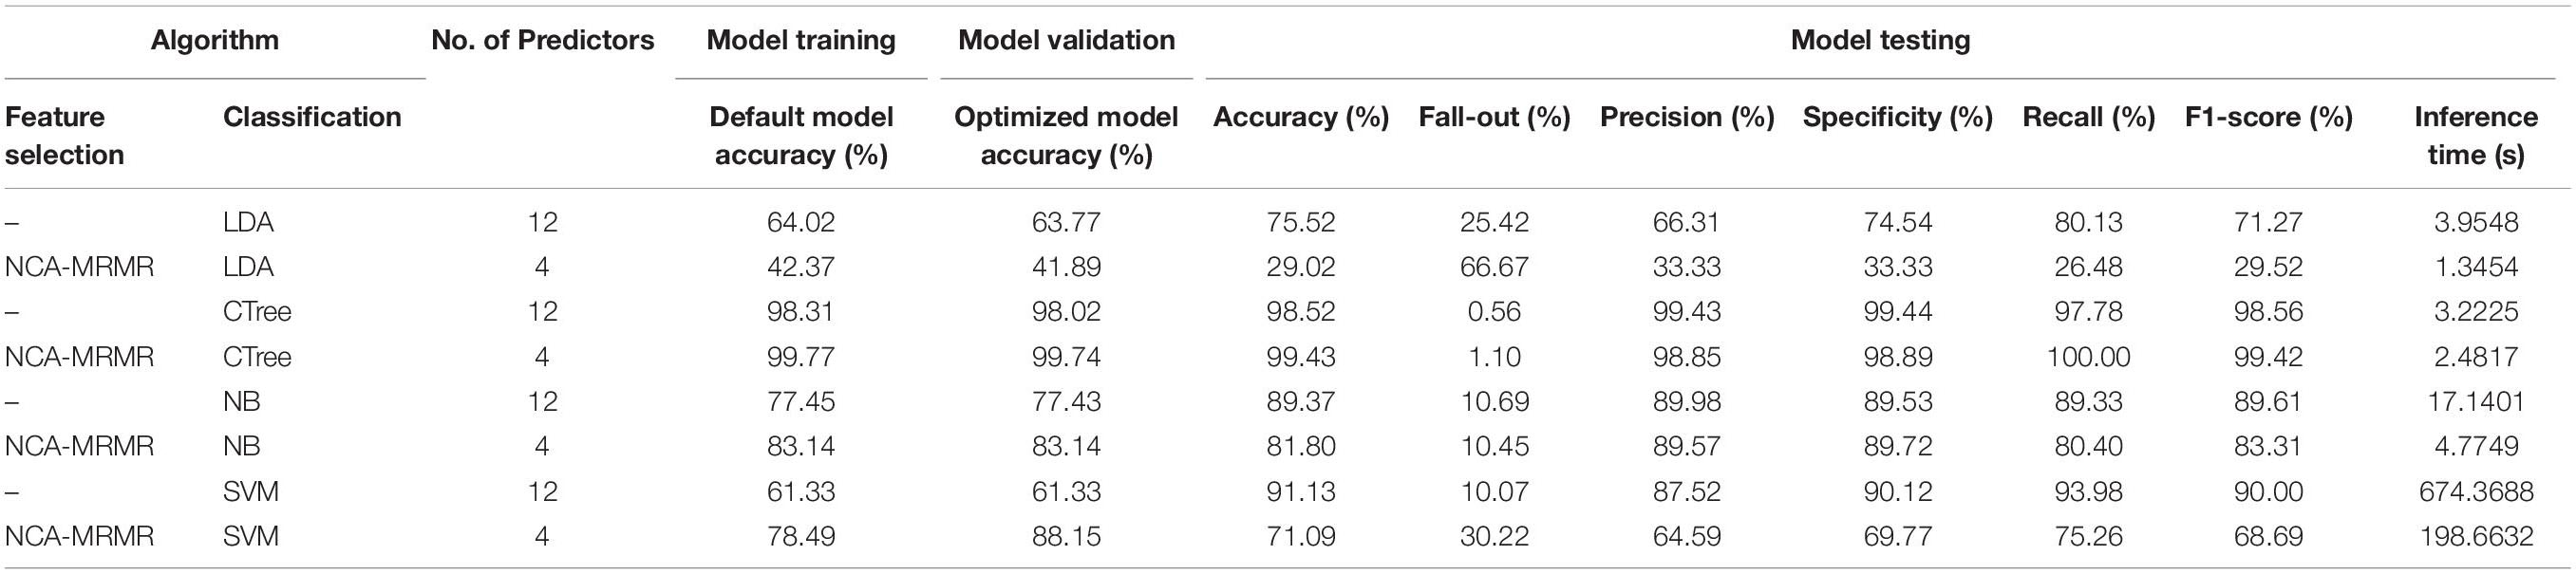
Table 5. Model performance evaluation for trophic state classification.
The NCA–MRMR–CTree architecture simplified the complex classifiers down to dissolved oxygen and SPM concentration only as its core baseline in the decision. If SPM is below 12.8211 mg l–1, it automatically classifies the marine system as oligotrophic (Figure 6A). Going further down the architecture, mesotrophic state is classified when SPM concentration is below 43.6868 mg l–1 or if dissolved oxygen is below 90 mg l–1 or if dissolved oxygen is greater than or equal to 100 mg l–1 and SPM is above or equal to 163.826 mg l–1 (Figure 5A). An NCA–MRMR–CTree trophic state classification is shown in Figure 6B using dissolved oxygen and DIN concentrations (another most significant limnological feature). CTree model structured out the differences of each trophic state, but most of the data samples are congested on the intersecting points of dissolved oxygen of 100 mg l–1 and DIN of 750 mg l–1. This means that variability caused by SPM has a higher impact when compared to DIN concentration to cause delineation among trophic states. Nonetheless, the developed NCA–MRMR–CTree is an effective and sensitive model to classify trophic state by just using minimal limnological parameters as its input predictors. Economic, power, and processing time factors will be gained.
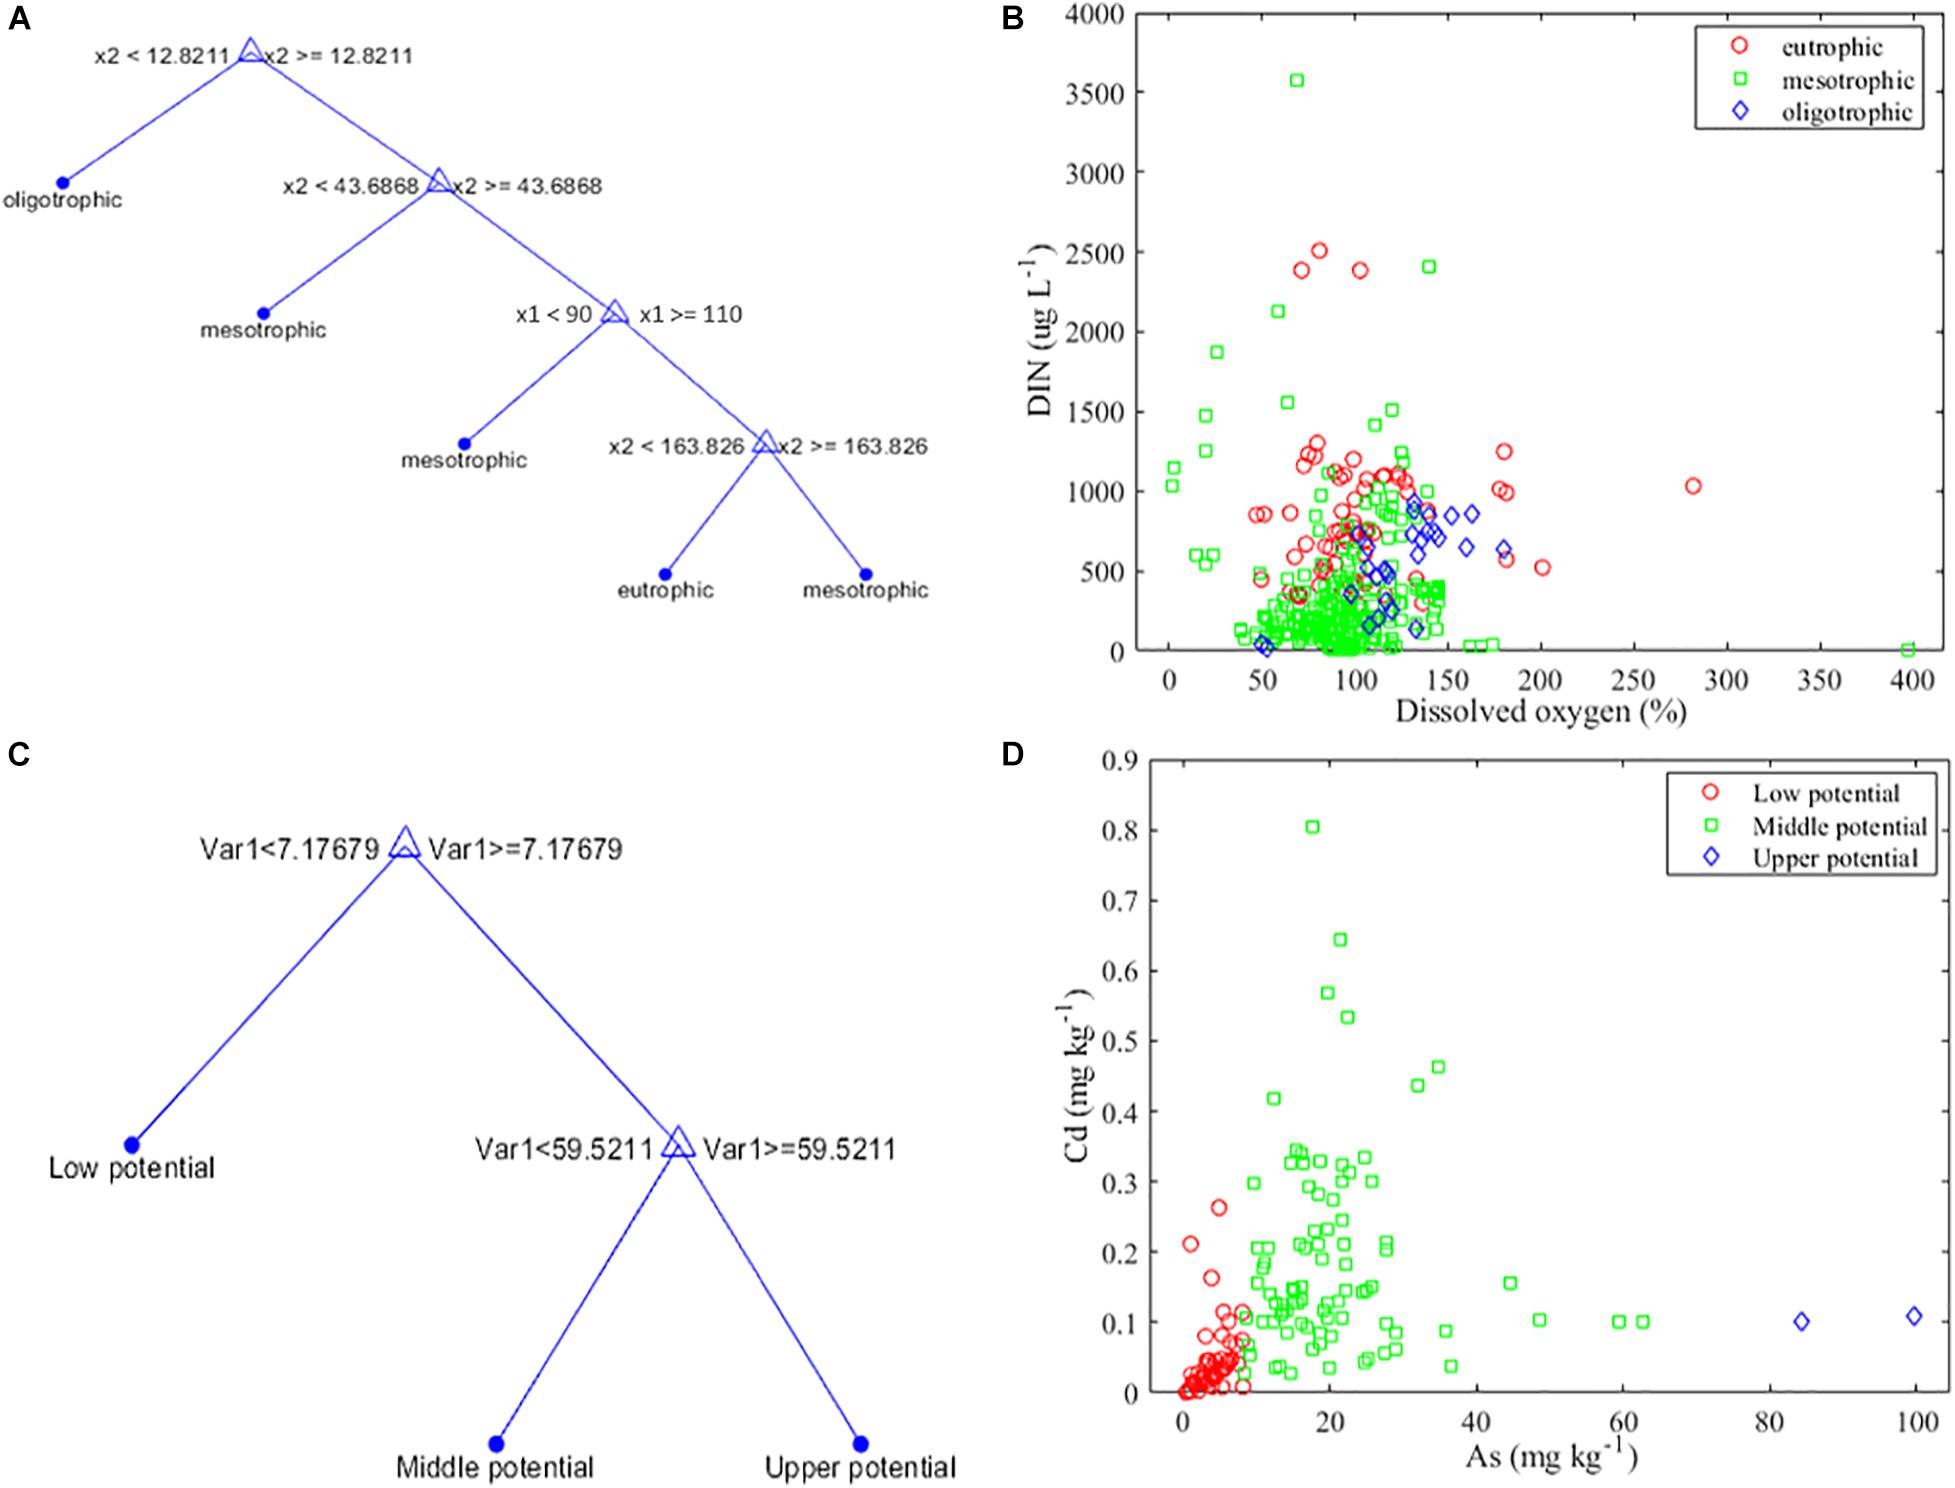
Figure 6. (A) Hybrid NCA–MRMR–CTree network with dissolved oxygen (x1) and SPM (x2) ruling out the trophic state. (B) Trophic state classification in terms of dissolved oxygen and DIN concentrations. (C) Hybrid NCA–MRMR–CTree network with arsenic (Var1) ruling out the water contamination level. (D) Water contamination level classification in terms of cadmium and arsenic concentrations.
Feature-Based Machine Learning Water Contamination Level Classification
Optimization of feature-based ML models for water contamination level classification was achieved by undergoing several epochs in the training, validation, and testing stages (Figure 3). In classifying low potential for specific adverse biological effects from sampled limnological data arrays (Table 6), LDA22, LDA4, CTree22, CTree4, and SVM4 models exhibited 100% accuracy and sensitivity. NB22 model performed the worst classification with 30% error (Figure 7). In classifying middle potential for specific adverse biological effects, CTree22, CTree4, NB22, NB4, and SVM4 have 100% correct predictions, while LDA22 performed the worst with 11.765% incorrect expectations (Figure 7). In classifying high potential for specific adverse biological effects, all models have 100% misclassification except CTree22 and CTree4 (Figure 7). It was observed that among the contamination levels, low potential is the easiest to be classified with an average cumulative accuracy of 94.38% and followed by middle potential with 92.65%. The hardest to be classified is the upper potential with 25% accuracy only. Moreover, by using the hybrid NCA–MRMR-selected four-feature array dataset, the low and middle potentials were correctly classified with accuracies of 97.5 and 94.118%, respectively. By using the original 22-feature array dataset (Table 6), the low and middle potentials were correctly classified with accuracies of 91.25 and 91.177%, respectively, which is comparably lower than the prior one. It justifies that the employed feature selection is highly significant and contributed to increasing the sensitivity of the system. Overall, CTree4 bested out other ML models in classifying water contamination level with an accuracy of 100% in the training stage, 60.02% in the validation stage, and 100% in the testing stage (Table 6). CTree22 has internal overfitting that resulted in perfect classification all through the stages. Hence, CTree4 has comparably 61.091% faster inference time than CTree22. This makes the developed NCA–MRMR–CTree model very suitable for fast prediction of water contamination level having limited limnological predictor data and low computational cost in the system.
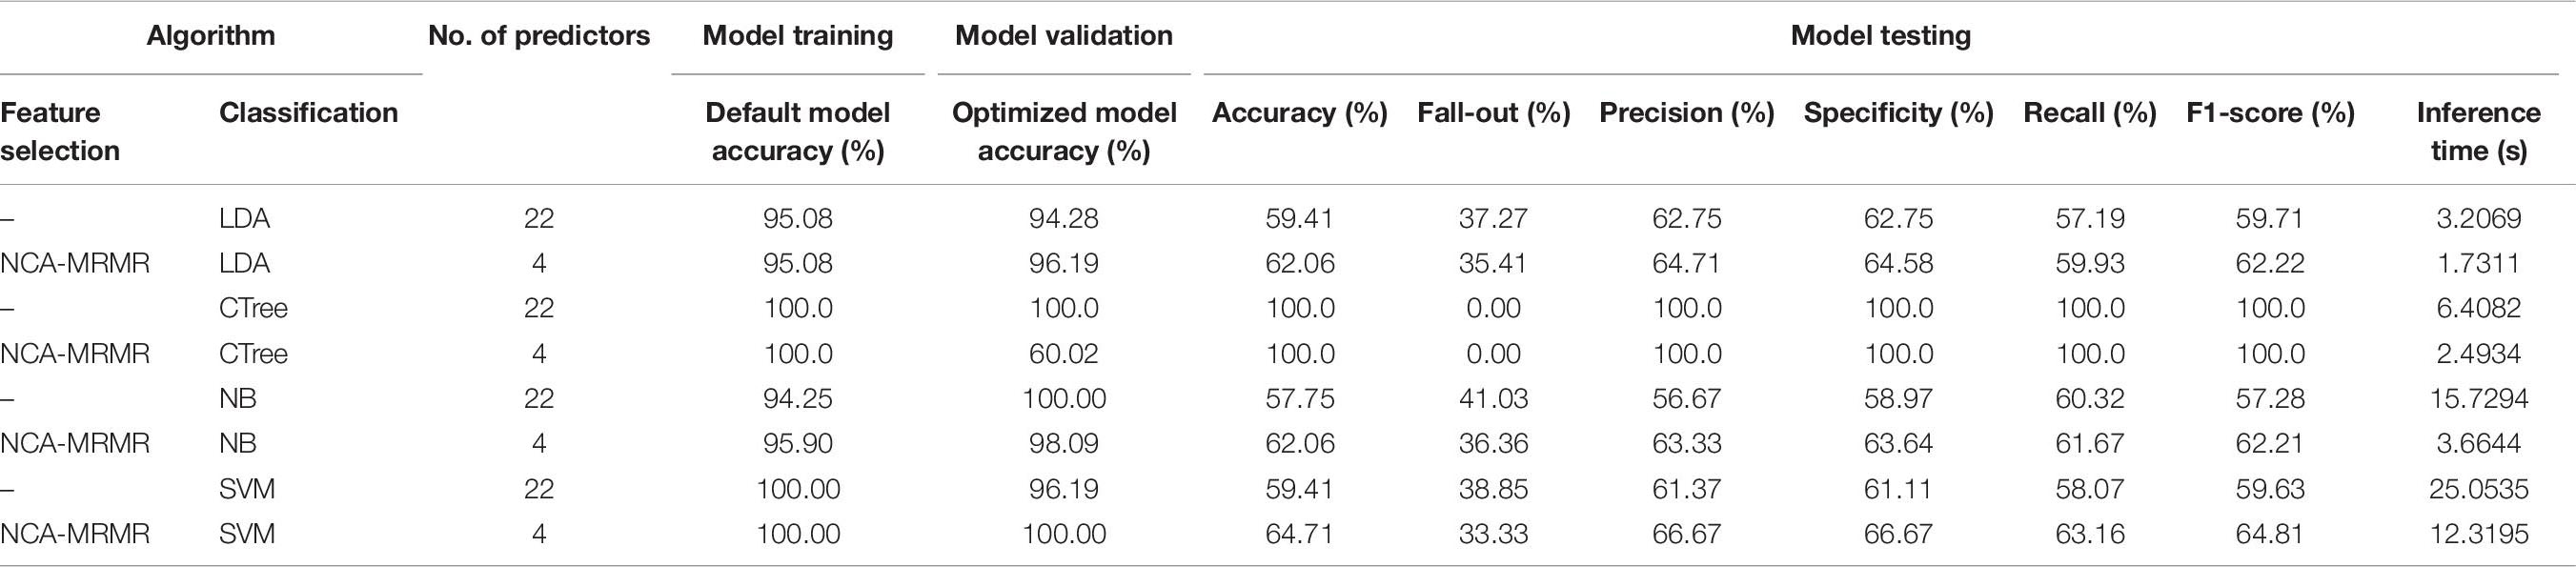
Table 6. Model performance evaluation for water chemical level classification.
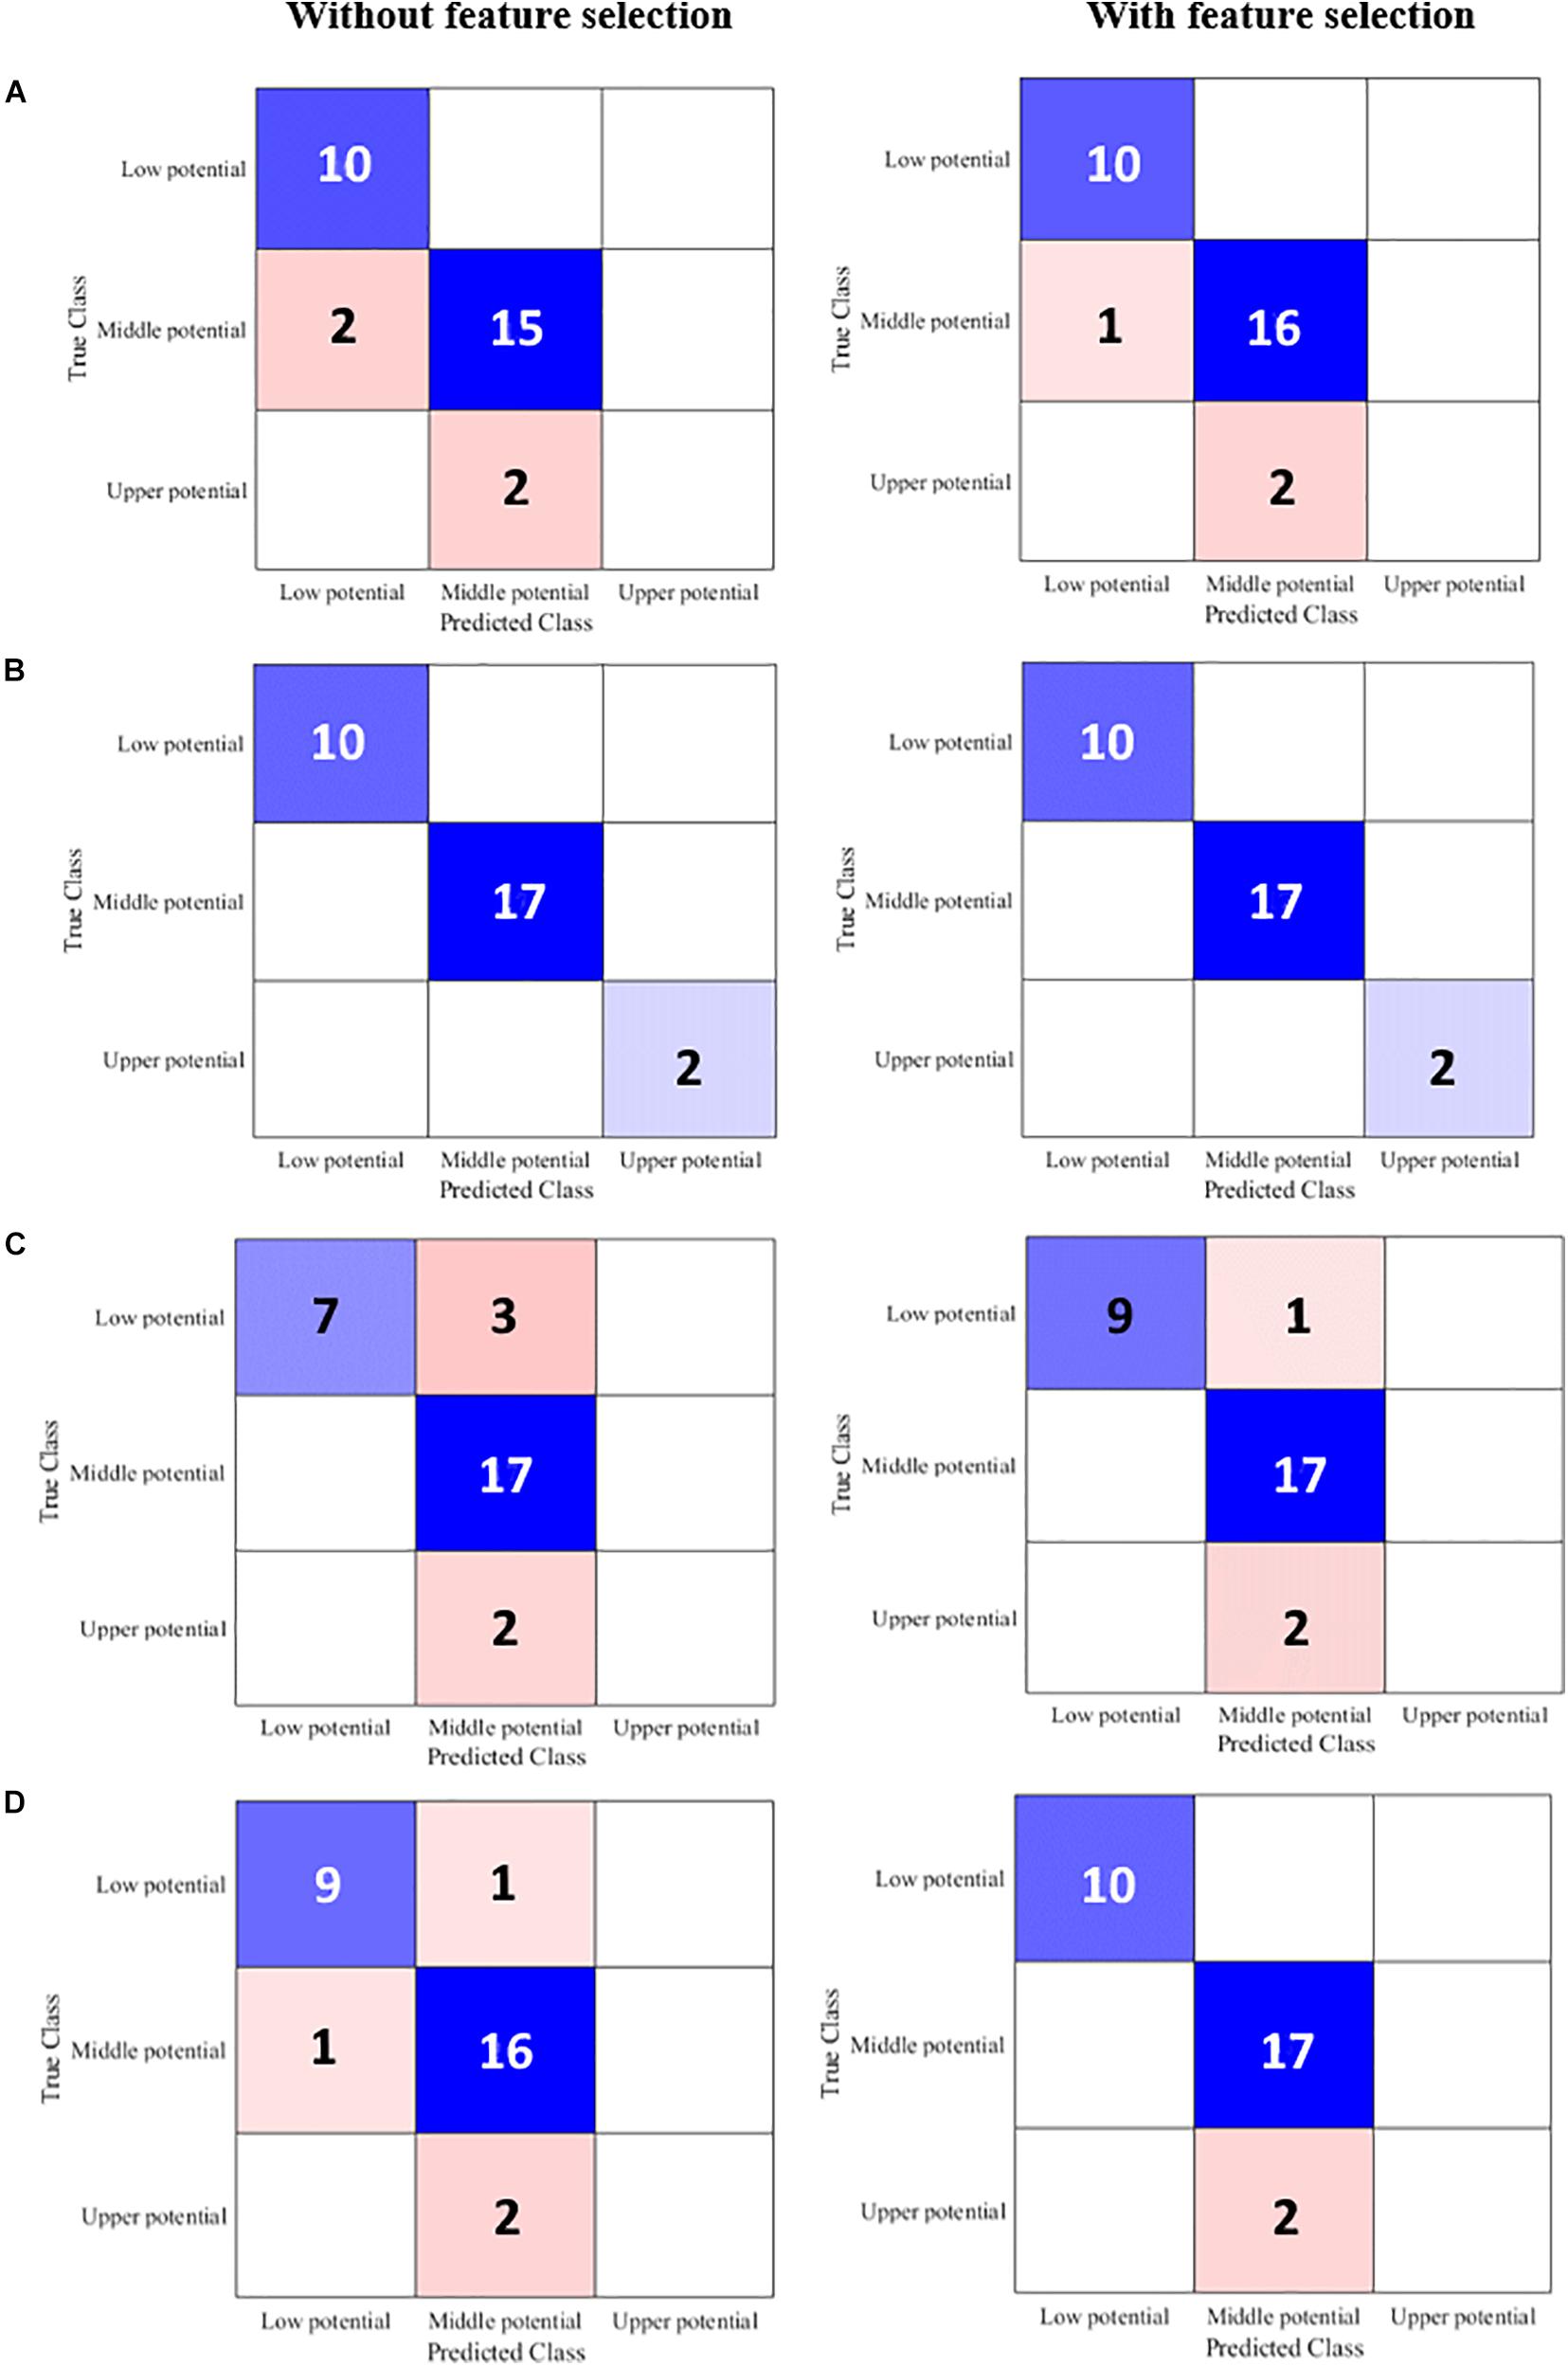
Figure 7. Confusion matrices of (A) LDA, (B) CTree, (C) NB, and (D) SVM model for water chemical level classification using 22 features (without feature selection, Table 2) and four features (NCA–MRMR selected arsenic, cadmium, chromium, and mercury).
The NCA–MRMR–CTree architecture simplified the complex classifiers down to arsenic concentration only as its core baseline in the decision. If arsenic is below 7.17679 mg kg–1, it automatically classifies the marine system as low potential (Figure 6C). Going further down the architecture, middle potential state is classified when arsenic concentration is above or equal 7.17679 mg kg–1 but below 59.5211 mg kg–1 (Figure 6C). Upper potential marine system is classified when arsenic concentration is above 59.5211 mg kg–1. An NCA–MRMR–CTree water contamination level classification is shown in Figure 7B using arsenic and cadmium concentrations (another most significant limnological feature). CTree model structured out the differences of each water contamination level, and it clearly separates the three states though there are only few data samples that are closely linked to low and middle potentials in the intersection of arsenic (5–9 mg kg–1) and cadmium (0.01–0.11 mg kg–1). This proves the essentiality of chromium and mercury will suffice the absolute classification in this system. Thus, the developed NCA–MRMR–CTree is an effective and sensitive model to classify water contamination level as it significantly reduced the number of predictors to be used and the inference time to be rendered.
Feature-Based Manual Versus Machine Learning Water Chemical Status Classification
Manual classification of the water samples’ chemical status, in terms of trophic and contamination level, was produced using both abovementioned approaches. Using the worst-case classification, 98% of the analyzed samples fall within the eutrophic classification, based on simultaneously high values of DO and chlorophyll a and low values of DIN. This might be due to the fact that several datapoints extracted from the public database present low salinities concomitant with sampling during low tide and thus with higher riverine influence (Supplementary Table 1). Nevertheless, and comparing the manual classification with that obtained from the NCA–MRMR–CTree, it is possible to observe that the model has high efficiency in automatic classification of the water body chemical status (Figure 8). Regarding the trophic status of the water bodies, the NCA–MRMR–CTree model presented a 76 and 98% classification efficiency when compared to the ones provided by both averaging and worst-case scenario manual approaches, respectively. Using the same comparison for the contamination data, the best fit model presented a 26–90% classification efficiency when compared to the averaging and worst-case scenario manual approaches, respectively. This indicates that ML models can reproduce similar classifications to manual procedures, based on the same assumptions and leveraging on available public data. These facts reinforced the applicability of these ML models for chemical status water classification with a high degree of accuracy and efficiency.
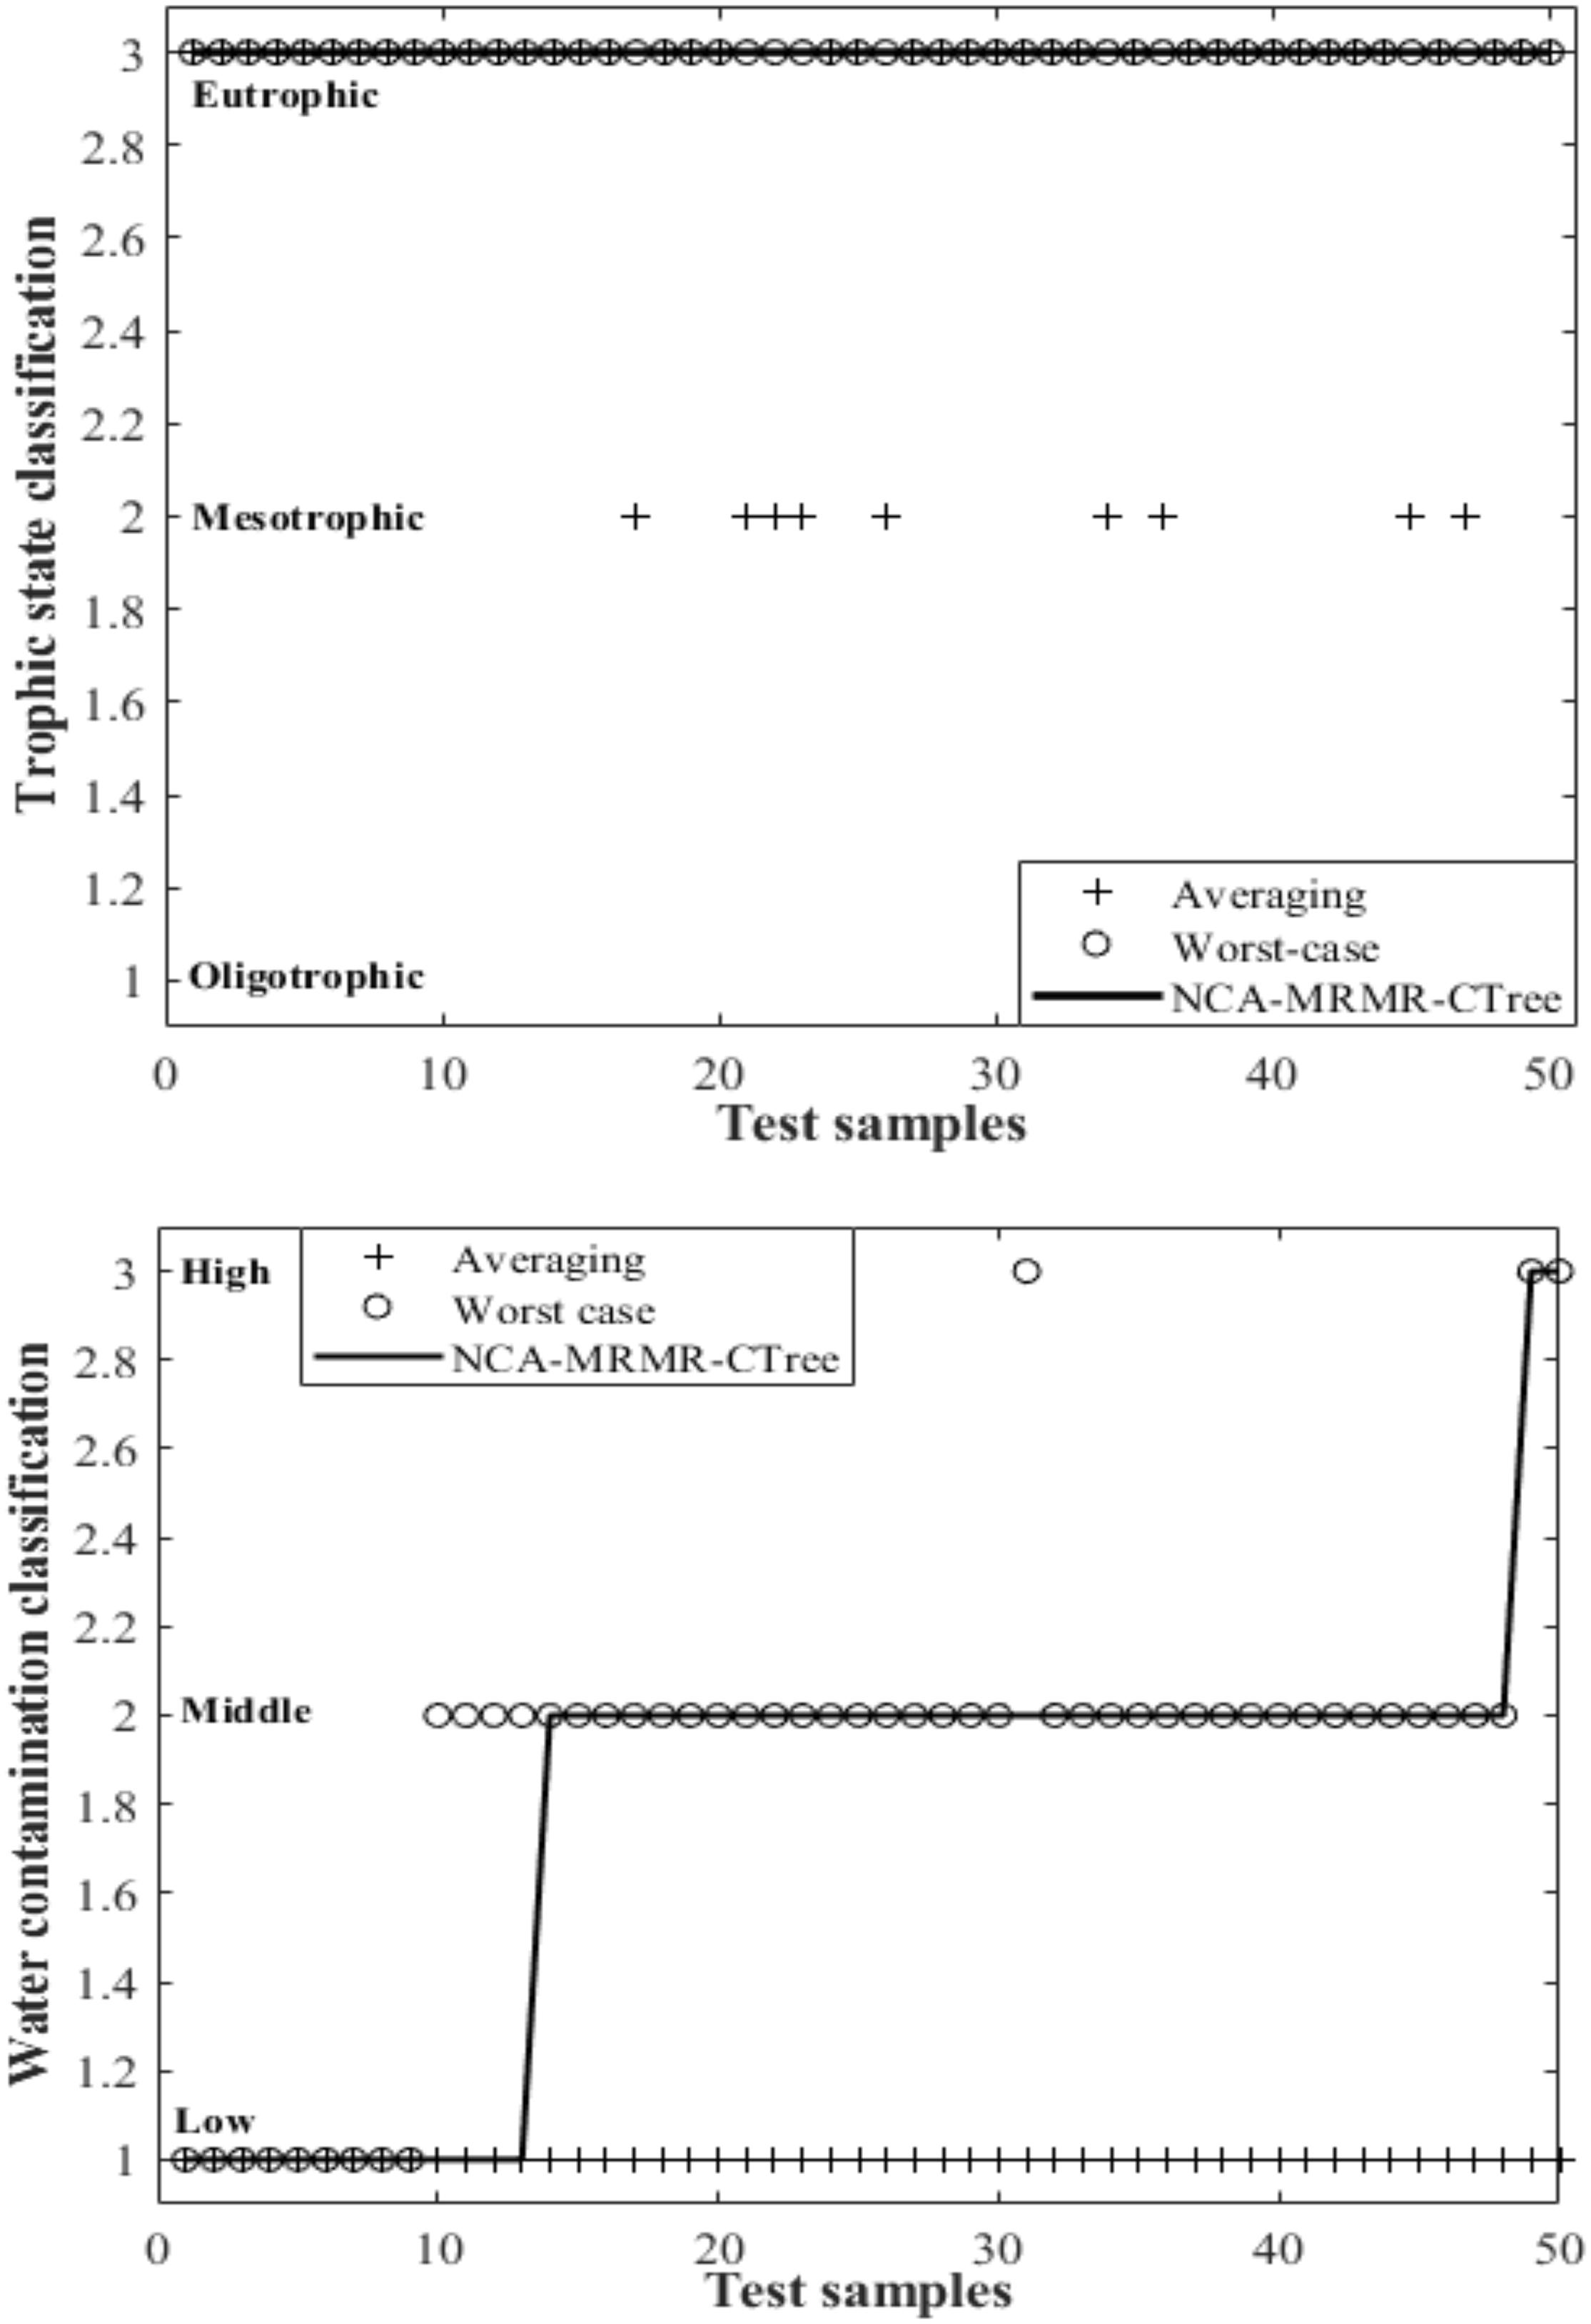
Figure 8. Water body chemical status obtained from the automatic classification and by both manual classification approaches in 50 randomly selected samples.
After several explorations in using feature-based ML in assessing water body chemical status, this study successfully developed a hybrid NCA–MRMR–CTree that can classify trophic state and water contamination level with an accuracy of 99.43 and 100%, respectively. There are previously published studies (Table 7) employing various ML models such as artificial neural network (ANN), hybrid classification tree and ANN, ANN and random forest (RF), particle swarm optimization (PSO), adaptive neuro-fuzzy inference system (ANFIS), hybrid radial basis function neural network (RBF-NN), and hybrid wavelet analysis and ANFIS. The trend of ML application in the field of marine transitional systems seems to integrate two or more models. In the study of Concepcion II et al. (2020), CTree was used to multidimensionally reduce the wide array of limnological features to lower the inference time, and ANN was configured for the actual inferencing. However, in the present study, the cascaded NCA–MRMR model was constructed to reduce the number of predictors and CTree is for the classification. Hence, the use of the ML models can be reconfigurable and be employed for the said purposes. This low accuracy using the PSO is due to its convergence directivity that loses global optimum as a solution to the problem (Chen et al., 2015). Overall, the developed NCA–MRMR–CTree in this study bested out other mentioned models for both trophic state and water contamination level models. By employing ML to automate the classification of transitional water trophic state and chemical contamination level, the efficiency was improved especially since the developed model has feature selection that reduced the number of sensors to be used as inputs for the inference and still yielding accuracy approaching 100%. The developed seamless NCA–MRMR–CTree model can be deployed in a real-time manner in coastal areas by embedding it on a microcomputer such as a Raspberry Pi module that is connected to the Internet for virtual monitoring. Corresponding sensors must be connected to the Raspberry Pi model to acquire the environmental data and wirelessly transmit it to a server that is private to the organization. Likewise, by using the NCA–MRMR–CTree model, it requires only four water parameters as input to deduce the correct classification instead of manually basing on 22 features. This may provide a faster assessment of water quality at a lower cost. In that way, intelligent and efficient assessment of the real-time condition of marine transitional systems can be inherited. Because the system is deployed on the actual site, the need to extract water samples and bringing them to a laboratory is not necessary. The actual classification and inference are automatically done by the system on time and online. This is essential especially when the environment is drastically changing. However, this model is limited by the data used to train, validate, and test it. In training computational intelligence models, the combination of parameters greatly affects its inference characteristic. The larger the training dataset, the more universal model can be developed. To further improve this model and generalize for other countries, it would be better to retrain this model using other datasets. But, the developed NCA–MRMR–CTree model is very applicable to coastal systems that closely resemble the environment of Portugal. It can complement the regular field works of scientist and government agencies for monitoring the changes in water quality. Overall, the monitoring efforts of marine transitional systems can be sustainably improved through ML.
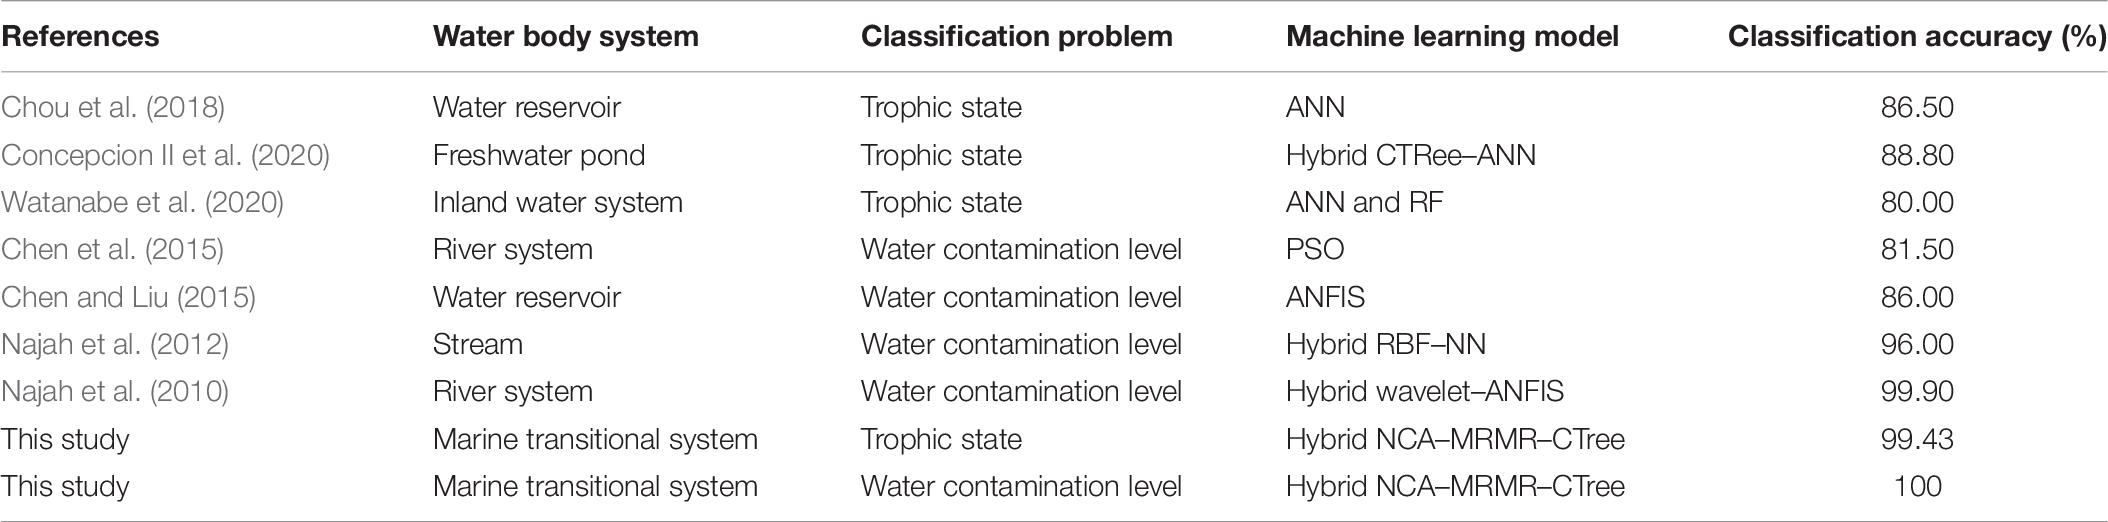
Table 7. Comparison of classification accuracy of the developed feature-based machine learning models.
Conclusion
Coastal transitional system chemical status is of utmost importance for the implementation and evaluation of the system ecological status, being this dependent on the trophic and contamination level of the system. These trophic and contamination traits rely on several physico-chemical variables that need to be addressed as a whole and that are neither always affected simultaneously nor show concordancy. At this level, automatic decision-support systems, fed by automatic samplers and analyzers, can be of great value for extracting an appropriate chemical status classification of the system. Applying ML techniques, namely, neighborhood correlation analysis-based classification tree algorithms running on an optimized mode, resulted in an efficient classification of the transitional systems with 100% accuracy. The results here presented point out that the models here developed can be of added value for the implementation of environmental directives, providing an efficient method for real-time chemical status classification of the evaluated transitional systems, supporting stakeholders and policy-makers on the ecological status evaluation of the European water bodies, provided substantiated classification information, early warning alerts, and allowing decision-makers to take action at early stages of water chemical status degradation.
Data Availability Statement
Publicly available datasets were analyzed in this study. This data can be found here: https://snirh.apambiente.pt.
Author Contributions
RC and BD conceived this study, analyzed the data results, and wrote the manuscript. BD, IC, and VF performed the data extraction and sampling. RC, ED, and AB performed the modeling. All authors contributed to the article and approved the submitted version.
Funding
This publication was financed by Portuguese national funds through FCT–Fundação IP under project reference UIDB/04292/2020 and by the European Union’s Horizon 2020 Research and Innovation Program under grant agreement N810139: Project Portugal Twinning for Innovation and Excellence in Marine Science and Earth Observation–PORTWIMS. BD and VF were supported by researcher contracts (CEECIND/00511/2017 and DL57/2016/CP1479/CT0024, respectively).
Conflict of Interest
The authors declare that the research was conducted in the absence of any commercial or financial relationships that could be construed as a potential conflict of interest.
Supplementary Material
The Supplementary Material for this article can be found online at: https://www.frontiersin.org/articles/10.3389/fmars.2021.658434/full#supplementary-material
Footnotes
References
Annicchiarico, C., Buonocore, M., Cardellicchio, N., Di Leo, A., Giandomenico, S., and Spada, L. (2011). PCBs, PAHs and metal contamination and quality index in marine sediments of the Taranto Gulf. Chem. Ecol. 27, 21–32. doi: 10.1080/02757540.2010.536156
Borja, A., and Dauer, D. M. (2008). Assessing the environmental quality status in estuarine and coastal systems: comparing methodologies and indices. Ecol. Indic. 8, 331–337. doi: 10.1016/j.ecolind.2007.05.004
Borja, A., Bricker, S. B., Dauer, D. M., Demetriades, N. T., Ferreira, J. G., Forbes, A. T., et al. (2008). Overview of integrative tools and methods in assessing ecological integrity in estuarine and coastal systems worldwide. Mar. Pollut. Bull. 56, 1519–1537. doi: 10.1016/j.marpolbul.2008.07.005
Borja, A., Franco, J., Valencia, V., Bald, J., Muxika, I., Belzunce, M. J., et al. (2004a). Implementation of the European water framework directive from the Basque country (Northern Spain): a methodological approach. Mar. Pollut. Bull. 48, 209–218. doi: 10.1016/j.marpolbul.2003.12.001
Castrillo, M., and García, A. L. (2020). Estimation of high frequency nutrient concentrations from water quality surrogates using machine learning methods. Water Res. 172:115490. doi: 10.1016/j.watres.2020.115490
Chen, W.-B., and Liu, W.-C. (2015). Water quality modeling in reservoirs using multivariate linear regression and two neural network models. Adv. Artif. Neural Syst. 2015:6. doi: 10.1155/2015/521721
Chen, X. Y., Chau, K. W., and Busari, A. O. (2015). A comparative study of population-based optimization algorithms for downstream river flow forecasting by a hybrid neural network model. Eng. Appl. Artif. Intell. 46, 258–268. doi: 10.1016/j.engappai.2015.09.010
Chou, J.-S., Ho, C.-C., and Hoang, H.-S. (2018). Determining quality of water in reservoir using machine learning. Ecol. Inform. 44, 57–75. doi: 10.1016/j.ecoinf.2018.01.005
Concepcion II, R., Loresco, P., Bedruz, R., Dadios, E., Lauguico, S., and Sybingco, E. (2020). Trophic state assessment using hybrid classification tree-artificial neural network. Int. J. Adv. Intell. Inform. 6, 46–59. doi: 10.26555/ijain.v6i1.408
Coquery, M., Morin, A., Bécue, A., and Lepot, B. (2005). Priority substances of the European water framework directive: analytical challenges in monitoring water quality. Trends Anal. Chem. 24, 117–127. doi: 10.1016/j.trac.2004.11.004
Cordier, T., Esling, P., Lejzerowicz, F., Visco, J., Ouadahi, A., Martins, C., et al. (2017). Predicting the ecological quality status of marine environments from eDNA metabarcoding data using supervised machine learning. Environ. Sci. Technol. 51, 9118–9126. doi: 10.1021/acs.est.7b01518
Crane, M. (2003). Proposed development of sediment quality guidelines under the European water framework directive: a critique. Toxicol. Lett. 142, 195–206. doi: 10.1016/s0378-4274(03)00069-9
Duarte, B., Neto, J. M., Marques, J. C., Adams, J. B., and Caçador, I. (2017). Marine angiosperm indices used to assess ecological status within the water framework directive and South African national water act: learning from differences and common issues. Ecol. Indic. 83, 192–200. doi: 10.1016/j.ecolind.2017.07.032
European Commission EC (2000). Water Framework Directive 2000/60/EC, Official Journal of the European Communities, 2000 L327/1eL327/72, 22 December 2000. Brussels: European Commission (EC).
Lu, H., and Ma, X. (2020). Hybrid decision tree-based machine learning models for short-term water quality prediction. Chemosphere 249:126169. doi: 10.1016/j.chemosphere.2020.126169
Müller, F. (2005). Indicating ecosystem and landscape organisation. Ecol. Indic. 5, 280–294. doi: 10.1016/j.ecolind.2005.03.017
Najah, A. A., El-Shafie, A., Karim, O. A., and Jaafar, O. (2010). Water quality prediction model utilizing integrated wavelet-ANFIS model with cross-validation. Neural Comput. Appl. 21, 833–841. doi: 10.1007/s00521-010-0486-1
Najah, A., El-Shafie, A., Karim, O. A., and El-Shafie, A. H. (2012). Application of artificial neural networks for water quality prediction. Neural Comput. Appl. 22, 187–201. doi: 10.1007/s00521-012-0940-3
Painting, S. J., Devlin, M. J., Malcolm, S. J., Parker, E. R., Mills, D. K., Mills, C., et al. (2007). Assessing the impact of nutrient enrichment in estuaries: susceptibility to eutrophication. Mar. Pollut. Bull. 55, 74–90. doi: 10.1016/j.marpolbul.2006.08.020
Primpas, I., and Karydis, M. (2011). Scaling the trophic index (TRIX) in oligotrophic marine environments. Environ. Monit. Assess. 178, 257–269. doi: 10.1007/s10661-010-1687-x
Salas, F., Teixeira, H., Marcos, C., Marques, J. C., and Pérez-Ruzafa, A. (2008). Applicability of the trophic index TRIX in two transitional ecosystems: the Mar Menor lagoon (Spain) and the Mondego estuary (Portugal). ICES J. Mar. Sci. 65, 1442–1448. doi: 10.1093/icesjms/fsn123
The European Parliament and the Council of the European Union (2008a). Directive, 2008/105/EC of the European Parliament and the Council of 16 December 2008 on Environmental Quality Standards in the Field of Water Policy, Amending and Subsequently Repealing Directives 82ç7172/EEC, 83/513/EEC, 84/156/EEC, 84/491/EEC and 86/280/EEC and Amending Directive 2000/60/EC. Brussels: European Commission.
The European Parliament and the Council of the European Union (2008b). Directive 2008/105/EC of the European Parliament and of the Council of 16 December 2008 on Environmental Quality Standards in the Field of Water Policy, Amending and Subsequently Repealing Council Directives 82/176/EEC, 83/513/EEC, 84/156/EEC, 84/491/EEC, 86/280/EEC and Amending Directive 2000/60/EC of the European Parliament and of the Council. Brussels: The European Parliament and the Council of the European Union.
The European Parliament and the Council of the European Union (2013). Directive 2013/39/EU of the European Parliament and of the Council of 12 August 2013 amending Directives 2000/60/EC and 2008/105/EC as Regards Priority Substances in the Field of Water Policy Text with EEA Relevance. Brussels: The European Parliament and the Council of the European Union.
Tueros, I., Rodriguez, J. G., Borja, A., Solaun, O., Valencia, V., and Millán, E. (2008). Dissolved metal background levels in marine waters, for the assessment of the physico-chemical status, within the European water framework directive. Sci. Total Environ. 407, 40–52. doi: 10.1016/j.scitotenv.2008.08.026
Tulabandhula, T., and Rudin, C. (2014). On combining machine learning with decision making. Mach. Learn. 97, 33–64. doi: 10.1007/s10994-014-5459-7
Vollenweider, R. A., Giovanardi, F., Montanari, G., and Rinaldi, A. (1998). Characterization of the trophic conditions of marine coastal waters with special reference to the NW Adriatic Sea: proposal for a trophic scale, turbidity and generalized water quality index. Environmetrics 9, 329–357. doi: 10.1002/(sici)1099-095x(199805/06)9:3<329::aid-env308>3.0.co;2-9
Keywords: computational intelligence, classification, estuarine systems, eutrophication, machine learning, water contamination
Citation: Concepcion R II, Dadios E, Bandala A, Caçador I, Fonseca VF and Duarte B (2021) Applying Limnological Feature-Based Machine Learning Techniques to Chemical State Classification in Marine Transitional Systems. Front. Mar. Sci. 8:658434. doi: 10.3389/fmars.2021.658434
Received: 25 January 2021; Accepted: 25 May 2021;
Published: 09 July 2021.
Edited by:
Heliana Teixeira, University of Aveiro, PortugalReviewed by:
Michelle Jillian Devlin, Centre for Environment, Fisheries and Aquaculture Science, United KingdomTaylor Royalty, The University of Tennessee, Knoxville, United States
Copyright © 2021 Concepcion, Dadios, Bandala, Caçador, Fonseca and Duarte. This is an open-access article distributed under the terms of the Creative Commons Attribution License (CC BY). The use, distribution or reproduction in other forums is permitted, provided the original author(s) and the copyright owner(s) are credited and that the original publication in this journal is cited, in accordance with accepted academic practice. No use, distribution or reproduction is permitted which does not comply with these terms.
*Correspondence: Ronnie Concepcion II, cm9ubmllX2NvbmNlcGNpb25paUBkbHN1LmVkdS5waA==