 Vilnis Frishfelds
 Juris Sennikovs1
 Uldis Bethers
 Jens Murawski
- 1Department of Research and Development, Institute of Numerical Modelling, University of Latvia, Riga, Latvia
- 2Danish Meteorological Institute, Copenhagen, Denmark
This study investigates a water transport features by extending Copernicus Marine Environment Service (CMEMS) to the Liepaja coast-port-channel-lake system with a two-way nested model. The Liepaja lake and Liepaja port are connected by Trade channel. The Liepaja port has three gates—the openings in wave breakers connecting the port aquatory with the Baltic sea. Each of gates has a corresponding dredged channel for securing the navigation. A hydrodynamic model is set up to study the flow and water level in this system. The area of the port gates, port and Trade channel are resolved by 33 m grid. The model results are verified against currents and sea level observations inside/outside port, Trade channel and Liepaja lake. Results and observations show that strong currents occur in the Trade channel in case of rapid sea level change in Baltic sea despite the Trade channel is rather shallow at the connection with Liepaja lake. The northern part of the Liepaja lake gets filled with brackish water during storm surge events. The channel has notable alternating current also during a relatively calm weather due to the port seiches. Long and narrow shape of the channel implies the Helmholtz type oscillations between the lake and the port with a period in approximately semidiurnal range. Hydrodynamic simulations describe well these oscillations but the phase of hourly scale oscillations in the port may differ in case of weak external forcing. Water exchange is significantly increased by the transit (gate to gate) sea currents. This transit flow usually occurs between South or Central gate and the North gate carrying sea water into the port. Northward flow of the surface layer is more characteristic in the port aquatory due the prevailing south-western winds. There are intense morphological processes at the coastline and underwater slope near the Liepaja port due to a sandy western coastline of Latvia, long fetch of the waves and strong currents at the port gates. Liepaja port is one of the Latvian ports in HywasPort operational service of hydrodynamics, waves and siltation.
1. Introduction
Coastal studies nowadays become increasingly attractive as the sea interaction with the coast is the most important aspect of the marine studies with respect to a socially economic needs (Benveniste et al., 2019). Model data accompanied with observations is the primary way to understand processes at the river estuaries and ports (Mey-Frémaux et al., 2019; Sotillo et al., 2020). However, the existing operational oceanographic models usually are not designed for the coastal scales, such as ports and related inland waters. They still provide accurate values of the water level if it varies slightly within the coastal system.
Standalone single domain simulations of the port hydrodynamics can work well if the port has single and narrow opening to the sea. However, even in such configuration, setting the outer boundary conditions for water level, temperature, and salinity from the oceanographic model may be insufficient; one requires the boundary currents or inflow. This aspect limits possible standalone single domain setups of the port hydrodynamic models as the currents in the large scale oceanographic setups can be incorrect at the scales where boundary conditions at the port gates are essential. Even more limitations in a modeling of the hydrodynamics of ports in standalone coastal setups occur if there are river deltas or the port has wide or multiple sea gates. Liepaja port has three navigation gates connecting the inner port with the Baltic proper: South gate, Central gate, and North gate. This may result in slight difference in the water level at different port gates and evolving of the transit currents entering through a one gate and leaving through the other. These transit currents may be a part of a large scale circulation in the sea.
Therefore, a proper hydrodynamic model of the Liepaja port has to include the currents from the large scale oceanographic model of the Baltic sea. Liepaja port is connected to a Liepaja lake by the Trade channel, where rather intense currents may occur. As a result, a hydrodynamic model of Liepaja port has to include at least these parts: the Baltic proper, the inner Liepaja port, the Trade channel, and the Liepaja lake.
One of options is to use nesting of the hydrodynamic model in different scales. HIROMB-BOOS (HBM) hydrodynamic model has long history of operational forecasts and reanalysis including CMEMS by several state meteorological institutes around Baltic sea. HBM has two-way nesting feature that allows merging different scales of the Baltic sea, Liepaja port, and Liepaja lake, i.e., HBM is designed both for basin scale to estuary scale (She and Murawski, 2018). Two-way nesting of different domains in HBM is provided for every time step which is an effective way of combining various scales seamlessly in the model (Höffken et al., 2020). This feature allowed to build operational hydrodynamic setups on basis of HBM at several coastal locations around Baltic sea and North sea: Liepaja, Ventspils, Riga, Jurmala ports, Limfjord (Murawski et al., in review), Roskilde fjord, Isefjord, Wadden sea, Elbe river mouth, and others.
There are also other three-dimensional ocean circulation models with regular grid successfully applied for coastal areas, such as GETM (see Hofmeister et al., 2009) which handles the narrow channels of the area relatively well. Effectiveness of nested setups is demonstrated also by Sotillo et al. (2020) where nesting feature is applied by ROMS ocean circulation model. Boundary conditions there are derived from either Atlantic or Mediterranean ocean model data depending on the location of the port.
Another option is using unstructured grid as in Lane et al. (2009). However, unstructured grids have certain difficulties: more cumbersome parallelization, less accuracy for the same mesh resolution, harder coding algorithm. Unstructured grid has been successfully applied using, e.g., by a state-of-the-art unstructured hydrodynamic model (SCHISM) (Zhang et al., 2016), with offshore 3D boundary conditions at Tasman and Golden bay in New Zealand (MetOceanView, 2018).
The nested HBM model of Liepaja port is used as a decision support tool by Liepaja port authority and Harbor Master Service via its integration in the free public operational port service HywasPort (Sennikovs et al., 2020b). HywasPort service largely resembles more extensive SAMOA operational service (Sotillo et al., 2020) for ports of Spanish coast where principal role is also played by providing operational services to authorities of the ports. SAMOA operational service demonstrates that model development goes hand in hand with building of monitoring platforms and doing data analysis. Both HywasPort and SAMOA services include local wave field models but they are not coupled with hydrodynamic models yet. SAMOA model uses slightly lower factor of grid ratio which leads to less artifacts at the interface of both grids. Unfortunately, there are no radar products available yet along the Latvian coast to test currents at proximity of port gates. As strong difference from SAMOA coastal system, Baltic proper has weak tidal oscillations. The amplitude of diurnal and semidiurnal oscillations is below 1 cm due to relatively isolated nature of the Baltic sea. HywasPort service deals also with morphological processes due to its importance in Liepaja and Venstpils ports that are surrounded by sandy beaches and subjected to waves generated in Baltic proper. Despite the waves are the primary driver of sediment transport in and around the port, also the hydrodynamics has a distinct role for transporting the sediments. As example, Liepaja port authorities reported a notable change in bathymetry at South gate when it experienced strong gradients of current in the operational model. For this reason, regular surveys of port bathymetry will be correlated with wave and hydrodynamic models of the port in next phase of HywasPort service.
During initial studies of Liepaja port-Liepaja lake system from 2016, one-way nested operational setups were used where port and lake are influenced by the sea but not the other way. In this manner, however, the currents at ports gates are governed by sea level at the boundary resulting to lower inflows and outflows through the port gates compared to two-way nesting with the Baltic sea. Moreover, it results also to insufficient inflows of saline water through the Trade channel into Liepaja lake.
2. Setup of Operational Model
Three-dimensional hydrodynamic model of Liepaja port is constructed basing on HBM model of ocean circulation. Initially, a single domain operational setup was used to derive currents inside the port and lake (Sennikovs et al., 2018a). This setup was later (in 2018) replaced by two-way nested setup that includes Baltic sea in 2018 after model verifications (Sennikovs et al., 2018b) showed essential improvement of currents at port gates [see also (Murawski et al., in review)]. The nested HBM hydrodynamic model is constructed for the system “Barta river—Liepaja lake—Trade channel—Inner harbor—Sea gates—Baltic Sea” (Figures 1, 2). HBM is three-dimensional, free-surface, baroclinic ocean circulation model solving the Navier-Stokes equations for the horizontal momentum and mass, and the balance equations for salinity and heat on a spherical grid taking into account the Earth's rotation. The model code is efficient and highly parallelized both with OpenMP and MPI interfaces (Berg and Poulsen, 2012). HBM uses k − ω turbulence closure scheme, which has been extended for the buoyancy-affected geophysical flows in the vertical direction. The free surface implementation in HBM allows for varying sea level and the flooding and drying of grid cells which have large role in low lying areas of coastal systems. Numerical stability of HBM model is ensured by realizability criteria in turbulence closure scheme. Vertical mixing scheme in HBM including stability functions for the vertical eddy diffusivities of salinity, temperature, and momentum follows (Canuto et al., 2010). The HBM model allows for full two-way nesting of grids with different vertical and horizontal, as well as time resolution. The nested domains in current setup are:
• The Baltic proper—coarse resolution with 1 nm (nautical mile), 18 vertical layers,
• The inner Liepaja port, including the navigation gates and the connection with the Liepaja lake (Trade channel)—fine resolution with 33 m, six vertical layers,
• The Liepaja lake—medium resolution with 66 m, two vertical layers.
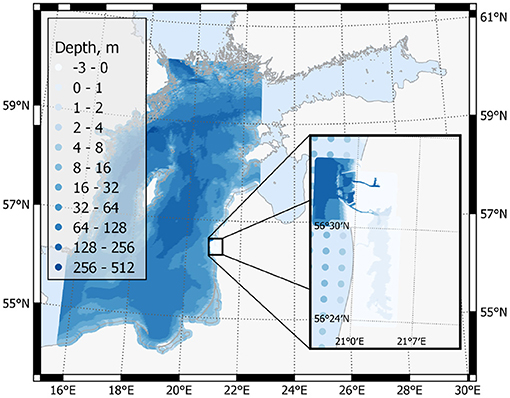
Figure 1. Nested domains of Baltic sea—Liepaja port—Liepaja lake setup.
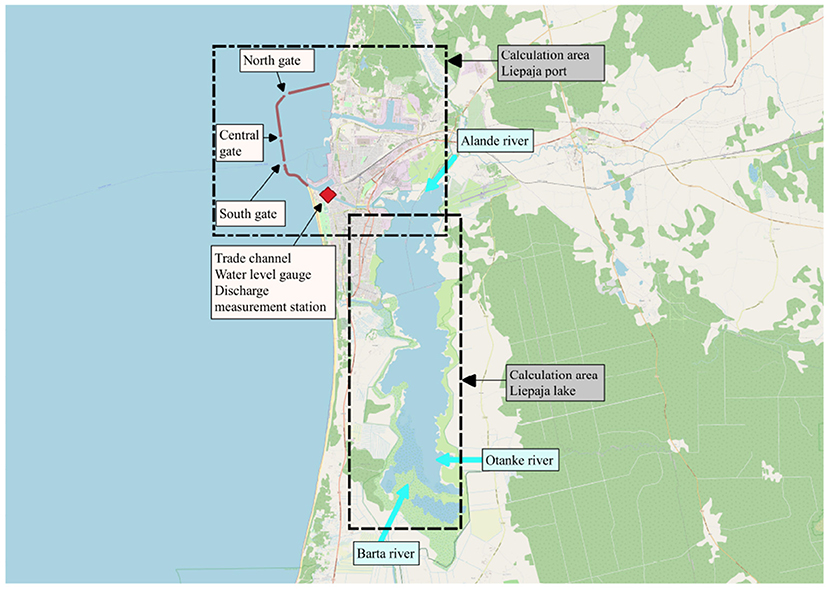
Figure 2. Scheme of Liepaja setup.
HBM uses Arakawa staggered grid horizontally and z-coordinates vertically. Top layer accounts for varying sea level and handles wetting and drying areas. The bottom layer has special treatment in order to enhance bottom flows over sharply inclined beds. Flow at bottom layer is one of major challenges in ocean circulation models to keep the right salinity balance. Most important tidal constituents are accounted in boundary conditions of CMEMS operational model. Tidal potential calculated from ephemerides of the Sun and the Moon is added in the model but it has low contribution 1 cm within Baltic proper.
The bathymetry of the Baltic sea is derived from the EMODnet database of 2018. The Latvian territorial waters are resolved well in this database as it includes updated data from Maritime Administration of Latvia. The bathymetry of the Liepaja port including dredged areas and shipping routes is obtained from the latest depth survey (April 2020) performed by the Liepaja port authority. Frequent depth surveys in the Liepaja port are performed because the navigation channels of the Liepaja port are exposed to considerable (up to 500,000 cubic meters per year) siltation due the longshore sand transport. South and Central gates have depth exceeding 12 m sufficient for navigation of larger vessels. North gate is more shallow with depth of about 9 m. The Liepaja lake is a shallow lagoon type lake with a relatively wide water area and the average depth below 2 m. The area of the lake expands significantly in storm surge events due to low lying areas surrounding the lake. Current setup of the model does not include expansion of lake area at high water level because it compromises the stability of the code and time step would have to be reduced. Eventual flooding could be essential in case of high river run-off and high sea level as it was in autumn of 2017 (see Sennikovs et al., 2018b). Barta river in the Southern part of the Liepaja lake is the main freshwater source in the system.
Six vertical layers are used for the fine resolution part of the model setup of the Liepaja port with depth slices 0–2, 2–4, 4–6, 6–10, 10–14, and 14–22 m. The Baltic sea domain of current setup has additional layers with vertical spacing of 8 m for the top 100 m part of the Baltic sea that are necessary to resolve the halocline. 32–64 m layers are used for even deeper layers. Vertical resolution of Baltic proper is low compared to existing operational setups of the Baltic sea but Baltic proper in current setup is used just as buffer zone for coastal setup and is not used in any other way. Operational model for Ventspils port is attached to the same domain of Baltic proper. Only 2 vertical layers 0–2, 2–4 m are present for the Liepaja lake part of the nested setup, where the maximum depth is just above 3 m. The choice of the vertical depth slices resulted from experience with operational modeling of 12 Latvian lakes and Latvian territorial waters of the Baltic sea with the same HBM ocean circulation model. One meter vertical resolution in top layers did not brought any notable benefit in lakes, because vertical stratification occurs only for short periods there in warmer season and typically at larger depth. The bathymetries of Liepaja lake and Liepaja port with sandy bed are rather smooth which do not necessary require additional vertical layers for better representation of flow at the bottom layer. Additional vertical layers would increase the computational time considerably.
Outer wet boundaries are placed at borders of the Baltic proper: at the Bornholm basin and the entrances to the Gulf of Riga, the Gulf of Finland and the Bothnian bay. The boundary conditions are following: hourly values of sea level, salinity and temperature. They are obtained from the operational Baltic sea model of the Copernicus Marine environmental monitoring system (CMEMS). There are 2 CMEMS products that are used for boundary conditions. One CMEMS product “BALTICSEA REANALYSIS PHY 003 011” covers the time up to middle of 2019. It has a horizontal resolution of 4 * 4 km. From the middle of 2018, a CMEMS product “BALTICSEA ANALYSIS FORECAST PHY 003 006” is available with higher horizontal resolution of 2 * 2 km. The later product with higher resolution is used from July 2018 for time range presented in this paper but low resolution product was used for previous standalone and nested setups before that date. There are no major differences between the CMEMS products as they are based on the same model by the same institution. Both CMEMS Baltic sea forecast and reanalysis products are switched to Nemo-Nordic model from HBM model in December 15, 2020. The operational setup runs on 12 CPU cores of PC which is enough to maintain a 54 h forecast period updated every day.
Modified Beer's law is used as short wave radiation option in HBM for shallow domains of Liepaja lake and Liepaja port:
where δ(z) is Dirack's delta function, Qi is incoming solar irradiation dependent on solar zenith angle, cloudiness, humidity and atmospheric pressure according to Zillman formula (Maykut, 1985), z is vertical coordinate downwards from the surface. The last term in equation 1 with β = 0.43 accounts the infrared part of solar radiation that attenuates quickly within top 2 m layer of water column. The first term in right hand side of (1) accounts for visible spectrum which has bimodal exponential character with parametrization according to Morel and Antoine (1994). Additional assumption is chlorophyll-a content of 2 mg/m3 that is characteristic yearly average value for the shallow Liepaja lake with prominent vegetation. The modified Beer's law is justified through numerous measurements in lakes, while Meier's formulation (Meier, 2001) is justified in the Baltic Sea. Hydrodynamic resistance of Trade channel is adjusted by changing bottom friction factor of it. A value of 0.0028 is selected as it yields best fit of water level difference between Trade channel and Liepaja lake.
Regional scale DMI Harmonie atmosphere model is used as meteorological forcing. It has a high horizontal resolution of 2.5 km which is very important for the coastal systems with strong cross-shore gradients. The atmospheric parameters comprise of hourly instantaneous values of the mean sea level pressure, the wind speed at 10 m height, the temperature and relative moisture at 2 m height, the cloudiness and hourly accumulated value of precipitation. Wind forcing is applied by Charnock wind stress formulation (Charnock, 1955) at the water surface
where W is wind speed at 10 m height, u is surface current, ρair is air density and Cd is coefficient dependent on wind speed and temperature difference between air and water according to Kara et al. (2000). Forecast time slice of the Harmonie model is 54 h, the model runs are performed four times per day. Therefore, the forecast length of Liepaja setup is adjusted accordingly. Operational setup is organized by adding 6 h blocks continuously to the forecast length until a new meteorological forcing arrives and forecast is restarted from the start hour of the new meteorological forecast. New boundary conditions and updated river data are used as they arrive for the new 6 h forecast blocks. CMEMS Baltic sea forecast product is currently updated twice daily, but new observations of hourly river data arrives once per day.
2.1. Freshwater Inflow
Freshwater inflow is an important aspect when studying salinity dynamics in the port and lake. Total catchment area of the Liepaja lake is 2,537 km2. Largest inflow contribution comes from the river Barta at the southern part of Liepaja lake with catchment area of 2,016 km2. Thus, the river Barta delivers nearly 80% of all fresh water inflows. The rest of inflow comes through smaller creeks Otanke and Alande. The discharge measurements of river Barta at the hydraulic monitoring station Dukupji are performed on monthly basis, while hourly measurements of water level are available by Latvian Environment, geology and meteorology centre (LEGMC). Therefore, a rating curve is used to derive a run-off from the hourly water level observations in Barta river. Run-off data at Dukupji station are occasional with an observation per 1–2 months. The run-off [m3/s] is estimated by a parabolic approximation basing on historical data up to 2018:
here hB [m] is a water level at the station Dukupji. The station is located 18.6 km upstream the mouth of the river Barta in Liepaja lake. The catchment area covered by station Dukupji is 1,713 km2. The fresh water input by the precipitation is also accounted for, as the precipitation/evaporation is included in the HBM code. The precipitation has rather low influence because the surface area of the lake is just 1.5% of its catchment area. Nevertheless, precipitation and evaporation has strong impact on salinity of coastal system. A downside of using a formulation (3) is that it does not account retardation of flow signal from Dukupji station up to inflow point of Barta river in Liepaja lake. Actual or latest temperature observation at Dukupji station is used as river inflow temperature. It is assumed that salinity of river inflows is zero.
3. Dynamics of Water Level, Thermodynamics and Salinity in Liepaja Port and Liepaja Lake
The operational version of the hydrodynamic model of the coastal system involving Liepaja port is running since 2018. The results are continuously compared with observation data. The Liepaja port and Liepaja lake has several observations stations. The most important station is placed in the channel connecting Liepaja port and Liepaja lake. It collects hourly observations of water level, bottom temperature and flow rate. The other station operated by LEGMC is located at western bank of the Liepaja lake where hourly data of the water level and the temperature are available. In year 2020, a smart buoy was installed just outside the port in the sea between southern and middle gates. Wave parameters, currents, salinity and water temperature are measured by the buoy's sensors.
Salinity in the inner Liepaja port usually is rather similar to the salinity in Baltic sea because of several factors: (1) relatively low freshwater input from the lake through the Trade channel which is shallow at the eastern end, (2) port gates with dredged navigation channels enable the thermohaline circulation and occasionally also the transit currents through the gates (see Figure 3 left). Freshwater can dominate in the port only after a period of strong precipitation and strong river run-off as it was at autumn of year 2017. After period of low river run-off and precipitation sea water can fill even half of the Liepaja lake (see Figure 3 right). Unfortunately, there are no monitoring stations of salinity in inner waters of Liepaja port and Liepaja lake. It is interesting to check the temperature in the channel connecting Liepaja port and Liepaja lake as the temperature of the port and Baltic sea could be by even 10 degree different from temperature of the shallow Liepaja lake. Thus, the temperature in the channel is largely dependent on the flow direction in channel and temperatures in Liepaja port and Liepaja lake (see Figure 4). As can be seen the temperature in the channel is between the temperature of Liepaja port and Liepaja lake. Temperature and salinity in Liepaja port nearly coincides with temperature and salinity in the Baltic sea just outside of port because of relatively intense ventilation through the port gates. Two-way nesting significantly improves heat and salinity transport in Trade channel as comparison to standalone single domain setup: bias and centered Root Mean Square Deviation (cRMSD) of bottom temperature are −0.3 and 0.68°C, respectively, in two-way nested setup and −1.70 and 1.27°C in standalone single domain setup in period 2018.08.01–2019.11.03. The later experiences weaker currents in Trade channel. Result for the nested setup can be considered as rather good for this challenging position. One reason of slightly negative bias is because of water transport from very shallow Liepaja lake which has slightly insufficient estimation of shortwave radiation. Total accumulated shortwave radiation (1) does not depend on vertical resolution, but due to shallow depth of Liepaja lake one fraction of radiation is reflected back and other fraction of radiation heats the soil. Despite the HBM model includes three additional soil layers in thermodynamics, direct heating of soil is disregarded in current formulation. During winter months ice formation is possible in the lake and navigable part of Trade channel. It partially blocks water transport through Trade channel. HBM model accounts both free drift ice and fast ice. Free drift ice can move freely by winds and currents. Ice that is pressed to the coast or have restricted mobility due to the coastline is considered as fast ice. Unfortunately, the years 2018–2020 had relatively mild winters with little ice in Liepaja lake. Nevertheless, cold January and February of 2021 resulted in fast ice for more than a month in Liepaja lake.
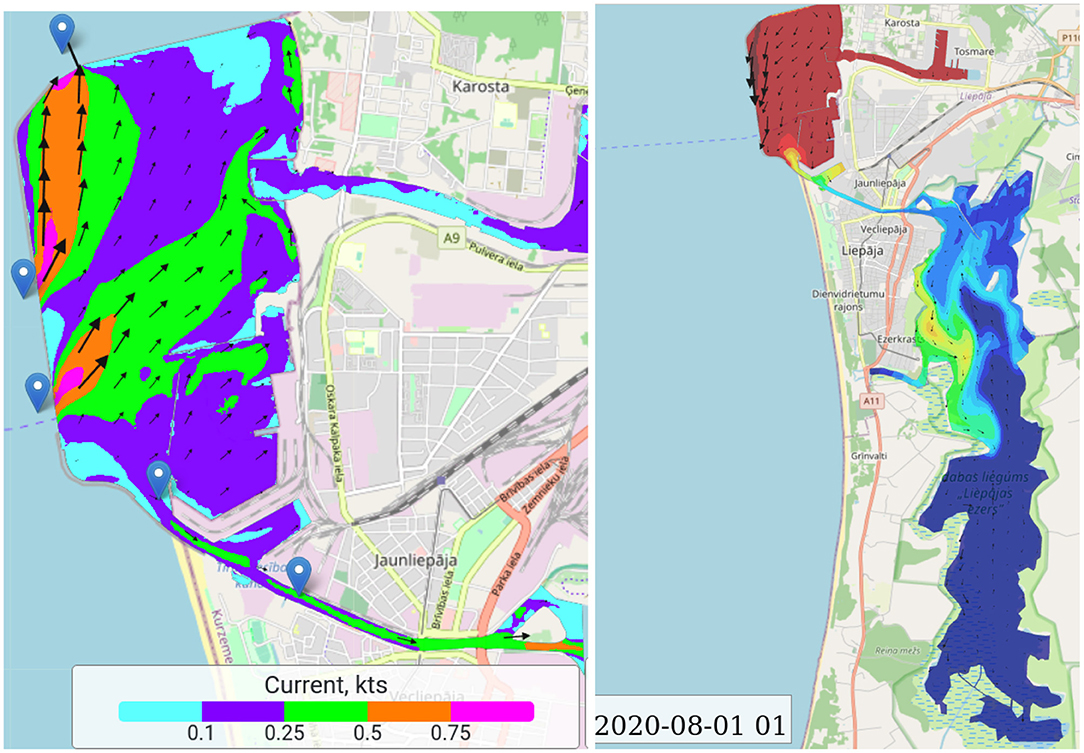
Figure 3. (Left) Surface flow rate at 2020.12.30 00:00 showing transit flow through the Central and North gates. (Right) Salinity distribution after the period of low river run-off and precipitation at 2020.08.01.
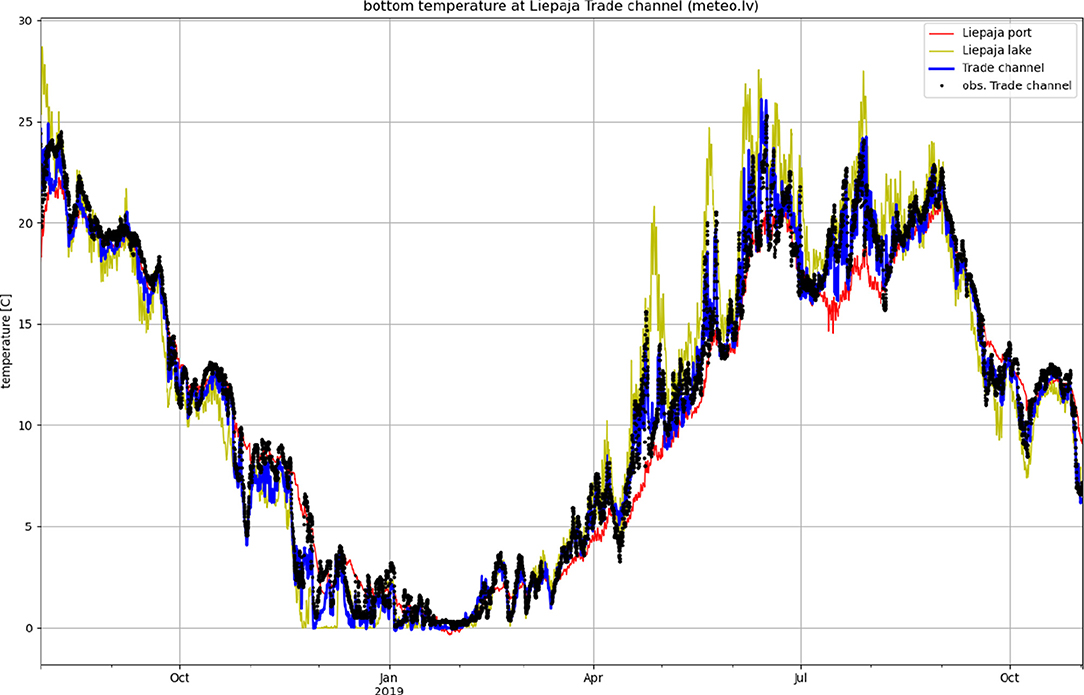
Figure 4. Simulated and observed temperature at the bottom of Trade channel. Simulated temperatures at observation station of western coast of Liepaja lake (Ezerkrasts) and temperature at Ferry terminal of Liepaja port are added as reference.
Water level simulations in Liepaja port and Liepaja lake coincide well with observations, see Figure 6 with average cRMSD of about 3 cm for every 5 day interval within years 2018–2020. The reason to use average cRMSD for 5 day intervals is that HywasPort operational service automatically adjusts the reference height of displayed water level in 5 day interval to fit with latest values in observations. The relatively good agreement of water level is more attributed to the model performance in the Baltic proper with CMEMS boundary conditions, because the average difference of water level in Liepaja port—Liepaja lake system is typically below 5 cm. The correlation between simulated and observed water level agree well except one storm surge case in spring of 2020 when port bathymetry in operational setup get updated with data from recent depth survey (see Figure 5). Slight shift of average water level in calculations is caused by difference in height reference level between observations which uses LAS-2000, five height reference system and CMEMS boundary conditions where model system specific reference level is used.
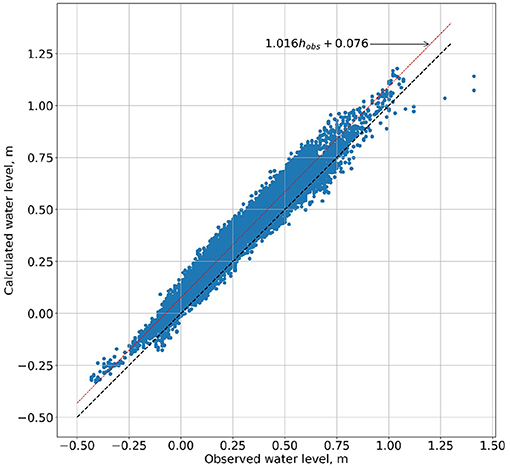
Figure 5. Calculated vs. observed water level in the gauging station “Liepaja” located in the trade channel.
It has to be tested whether there is any improvement of water level as compared to the CMEMS Baltic sea product “BALTICSEA ANALYSIS FORECAST PHY 003 006.” Mooring station of Trade channel is placed at southern corner of Winter port just 2 km away from South gate with rather good navigability between. Therefore, calculated water level by the coastal model does not differ much from Baltic sea model at this location. Considering the time period 2018.07.17–2019.11.02, cRMSD is 4.0 cm is both in coastal setup and Baltic sea model. It is fairly good result, as the coastal model has an additional difficulty of disturbed currents at the outer interface of the Baltic sea domain. Much different situation occurs at mooring station of Liepaja lake located at Ezerkrasts. Nearest location of CMEMS Baltic sea model yields cRMSD of 5.5 cm there in period 2018.07.17–2019.11.02, but coastal model yields cRMSD of 3.6 cm. Average cRMSD of 5 day intervals in the same period is 4.9 cm in CMEMS Baltic sea model and 2.4 cm in the coastal model.
4. Currents
4.1. Currents Through Port Gates
Safe shipping and planning of dredging works are largely dependent on currents and waves near the port gates. Moreover, currents trough the gates determine exchange of inner water with sea water. Therefore, it is important to examine characteristics of flow speed and direction through them. The overall statistics of discharge through port gates and Trade channel on monthly basis are shown in Figure 6 for a 2 years period. Despite the North gate is more shallow by 3 m as South gate and Central gate, the North gate usually experiences more intense outflows that is attributed to dominant south-westerly winds and currents, and also inflow from the Trade channel. Outflows there can be specially strong during winter with stronger even more dominant south-westerly winds. Despite rather large ratio between mesh sizes in Baltic proper and Liepaja port, the flow rates through the gates are reasonable. In order to study currents and plan the necessary dredging works, smart buoy is installed behind South and Central gates, in 2020. Operational data of current modulus at the buoy which is operated still in testing phase coincide fairly well with observations (see Sennikovs et al., 2020c). Flow stratification is common in port gates during the warmest months of the year. Coastal dynamics leads to thermohaline circulation enhancing exchange of seawater with water in the port.
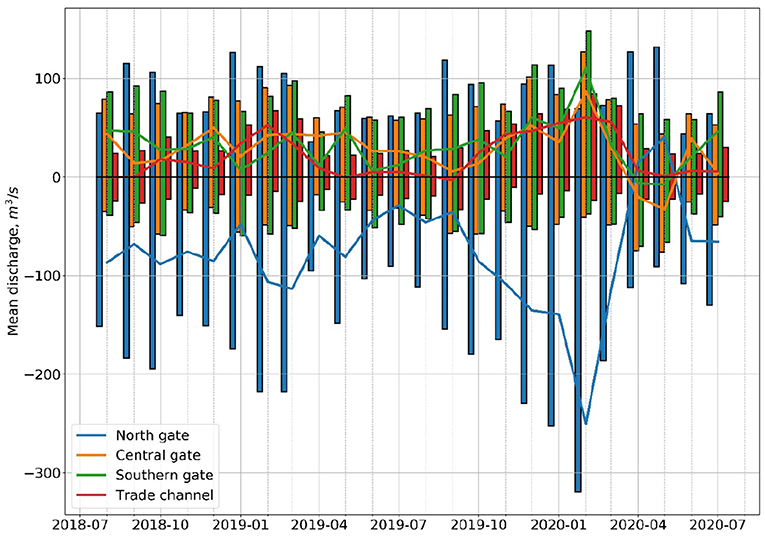
Figure 6. Calculated monthly mean discharge through cross-sections on the boundaries of inner Liepaja port area. Positive discharge is into the inner port area, negative discharge is out of it. Mean positive, mean negative (bars), and mean total (lines) discharge for each of the cross-sections are shown.
4.2. Currents in Trade Channel and Its Oscillations
Flow in Trade channel is critical for water exchange between the port and relatively wide inland water body—Liepaja lake. Trade channel is much more shallow than port gates, especially the eastern part of it. Therefore, flow rates through the narrow channel are lower. Inflows and outflows from the lake are well-balanced in monthly time scale (see Figure 7). Some differences occur due to precipitation/evaporation added to the lake. Higher exchange through Trade channel occurs in winter period and period with high precipitation and river run-off. Observations show higher run-off values in Trade channel than in simulations (see Figure 8). There are several potential reasons for that: the sub-basin of 18.6 km long Barta river section from Dukupji station to inflow in Liepaja lake is unaccounted that including smaller tributaries (Tosele, Jecupe) in that segment; the estimation in (3) is too low as it is based on few occasional flow observations in Dukupji station; the distance to Dukupji station creates also retardation of flow signal that is unaccounted; other tributaries to Liepaja lake are underestimated; the flow observations in stations Dukupji and Liepaja Trade channel may be inaccurate. In order to address the river inflow issues, it would be beneficial to include high resolution pan-European water model (E-hype) data for the improved coastal setup. As can be seen, currents in the Trade channel can go both ways in hourly time scale both in observations and simulations (see Sennikovs et al., 2020a,c). Flow in Trade channel has an oscillating character of the water exchange between the port and the lake (see Figure 9). The cyclic frequency of the oscillations can be approximated by Otsmann et al. (1999):
here ATrade and LTrade are the area of a cross-section and the length of the Trade channel, respectively, ALake is the area of the Liepaja lake and g is gravitational acceleration. The port is well-connected with the Baltic sea, therefore, the water level oscillations of the lake dominate in Equation (5). Formulae gives the oscillation period of about 10 h when damping of the oscillations is neglected. The oscillations explain the frequent change of flow direction in Trade channel in observations that could not be described just by river inflow and storm surge. The mechanism behind these oscillations presumably originates from inertia of the flow in Trade channel like it is in a Helmholtz resonator. The flow directed to the lake cannot stop suddenly creating an excess water level in Liepaja lake during forward phase. Slightly increased water level eventually forces a return phase of the water mass and slightly lowered water level in Liepaja lake.
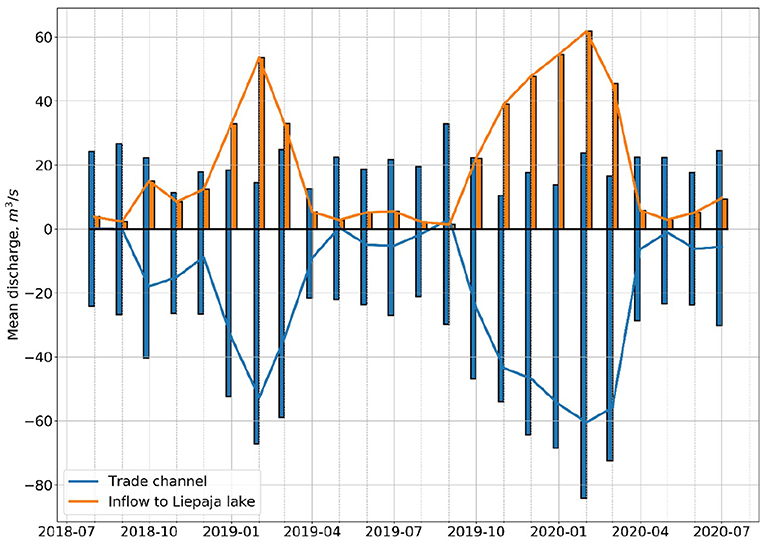
Figure 7. Calculated monthly mean discharge through cross-sections on the boundaries of Liepaja lake area. Positive discharge is into the lake, negative discharge is out of it. Mean positive, mean negative (bars), and mean total (lines) discharge for each of the cross-sections is shown.

Figure 8. Calculated vs. observed discharge in the Trade channel.
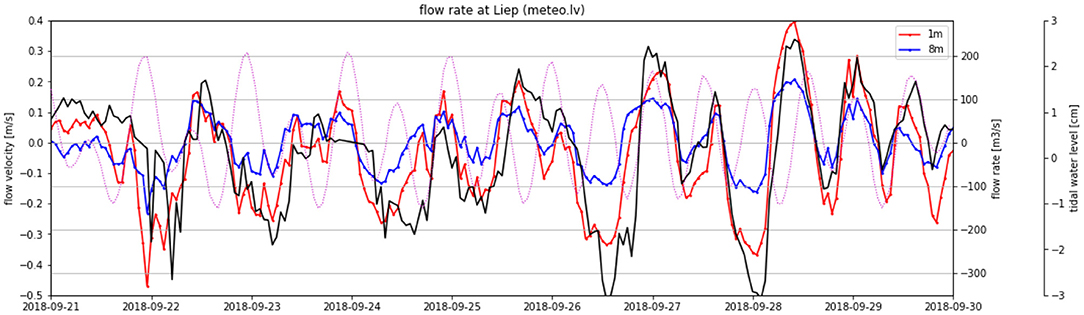
Figure 9. Flow velocity (toward sea) during September, 2018 in Trade channel: (1) red—upper layer, (2) blue—bottom layer, (3) black—observations of discharge, (4) dotted line—tidal constituent of water level.
These oscillations are unrelated with tidal forcing as Baltic proper has weak both semi-diurnal and diurnal tides (Keruss and Sennikovs, 1999; Rabinovich and Medvedev, 2015). Dotted line in Figure 9 illustrates the phase of water level change at Liepaja if there is only tidal forcing applied in Baltic sea model, water has constant density of 1,007 kg/m3, and water level is zero at boundary of Danish straits. Tidal signal here is estimated by a 2 nm HBM model of the Baltic sea, where tidal potential is derived from ephemerides of the Sun and the Moon. Moreover, Fourier spectrum of observed water level 1961–2019 does not show a notable M2 = 12.42 h tidal component with amplitude of 0.2 cm in Trade channel as compared to Venstpils station with amplitude 0.6 cm. There are no new resonance frequencies in water level spectrum due to irregular nature of these flow oscillations.
HBM model predicts character of oscillations in Trade channel fairly well (see Figure 9). However, there could be phase difference in case of weak forcing. Therefore, calculated vs. observed discharge in Trade channel have large deviation from strait line (see Figure 8). It results in relatively weak correlation between the calculated and observed discharge through the Trade channel (see Figure 10). Two layer flows are common in port gates, but less common in the Trade channel which has depth of only 2–3 m at the entrance to Liepaja lake.
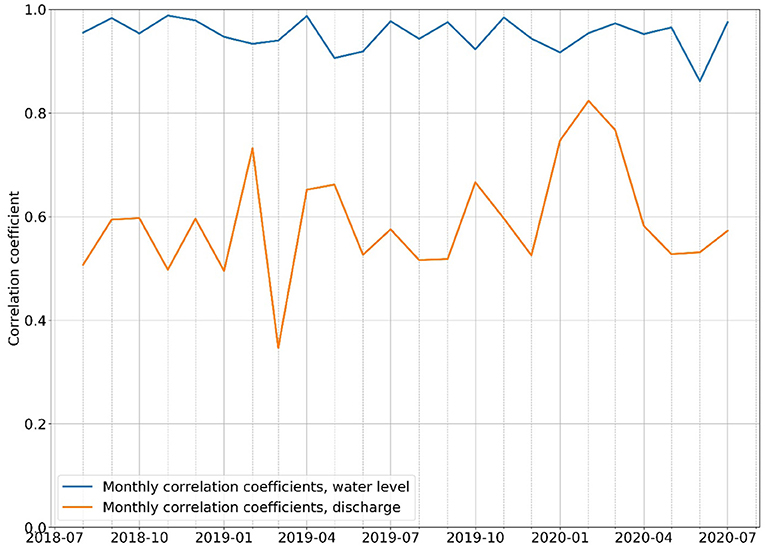
Figure 10. Monthly correlation coefficients between calculated and measured water level and discharge in the Trade channel.
5. Discussion
Time range of operational analysis does not include major storm events of the decade or century. One of most important storms was February 11, 2020. Usually, storm surge with water level exceeding 1 m lasts only few hours Liepaja port as in most of the stations in Baltic proper. Much longer storm surge events occur in Gulf of Riga, Gulf of Finland and Bothnian bay. Relatively short length of the Trade channel still enables inflow of sea water in Liepaja lake were salinity higher than 1 PSU can stay for more than 2 days in northern part of Liepaja lake. Longer lasting salinity in Liepaja lake occurs in dry periods with low river run-off and precipitation. Such a situation was in summer-autumn 2018 when salinity of about 1 PSU stayed for almost 2 months in northern part of Liepaja lake. Therefore, Liepaja lake is well-suited for such type of fish as northern pike that can thrive in this changing environment. Currently, the wave and hydrodynamics of the port are left uncoupled. But it events of strong south-western storms there are strong longshore currents that are left unaccounted. Newer version of HBM model enables to account radiation stress and there are plans to apply this feature in later improvements of operational service.
Winter of year 2020 was exceptionally mild with almost no ice at all through all of the winter. That correlates with extraordinary atmospheric surface pressure positive anomaly at the Continental Europe in January-February, 2020. Mild winters in eastern Europe occurs in case of continued Atlantic influence. That results in dominance of south-westerly winds that generally increases sea level in Baltic sea (see Figure 11). South-westerly winds increases also transit flows from South and Central gate to North gate (see Figure 6).
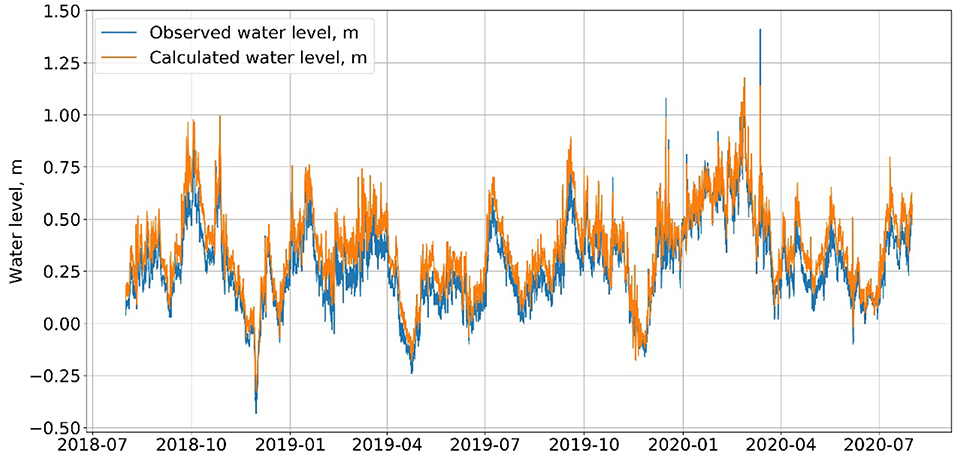
Figure 11. Time-series of observed and calculated water level in the gauging station “Liepaja” located in the Trade channel.
In case of strong easterly winds, eastern part of Baltic sea is subjected to low water level situation. One such case was at the end of November, 2018 with water level of almost down to −50 cm (see Figure 11). Another feature of easterly winds is rather low water exchange between port and the Baltic sea (see Figure 6).
Exchange of water between port and sea can be effectively characterized by water age as in Liu et al. (2008), Chen et al. (2015). However, it requires to add additional tracer in the model. Nevertheless, characteristic exchange time can be estimated from currents at port gates in Figure 6. The volume of the Liepaja port is ~0.12 km3. Average outflow rate through all gates is ~200 m3/s (see Figure 6). Thus, the exchange time for the port with Baltic sea is around 1 week. The average inflow rate of nearly freshwater from Trade channel is 30 m3/s (see Figure 7). Hence, the average salinity in Liepaja port is by about 1 PSU lower in Liepaja port than in Baltic proper. Similar estimate we can do about Liepaja lake which has a volume of 0.075 km3. Exchange time with Liepaja port is around 1 month. On the other hand, freshwater inflow from rivers and precipitation would require 2 months to fill the Liepaja lake. Salinity is not well-mixed in shallow Liepaja lake which does not enable a similar estimate as in Liepaja port.
Flow in Trade channel that connects Liepaja port with Liepaja lake experiences semi-diurnal oscillations that are related to slow oscillation of water level in the lake (see Figure 9). In case of weak external forcing, simulations cannot always solve the phase of these oscillations correctly, therefore correlation between calculated and observed flow in Trade channel is between 0.6 and 0.7 in average (see Figure 10). Another factor leading to relatively low correlation coefficient for the run-off in Trade channel is that estimation of freshwater inflow by the approximate rating curve (3) is too low in current setup. Yet another factor is that the Dukupji station is placed 18.6 km upstream the river Barta and retardation is unaccounted.
6. Conclusions
Efficiency of HBM nesting feature with high grid size ratio was studied on coastal system of Liepaja port that involves transit currents through the port gates. Two-way nested setup enables not only to consider water exchange between sea and port but also enhances model performance inside port and lake system as compared to standalone single domain setup of Liepaja port. The currents at port gates are reasonable and consistent with recent observations at smart buoy. Two-way nested HBM setup correctly mimics inflows of saline water in Liepaja port and Liepaja lake. Governing south-westerly winds leads to more intense port outflows through the North gate despite it is only 9 m deep. Especially strong outflow through the North gate is during winter with even stronger south-westerly winds. Trade channel experiences semi-diurnal oscillations of currents that are related to slow oscillation of water level in the lake by seiches. Thermodynamics in the coastal system are well-resolved by using radiation scheme of modified Beer's law in HBM. Bottom temperature bias and cRMSD are under 1 K in Trade channel which is rather good result for this challenging position. Water temperature there is between the water temperatures in the Liepaja port and Liepaja lake as it is subjected to inflows from both sides. Liepaja lake and Trade channel are rarely stratified, but Liepaja port has stratification in warmer season. As a result, baroclinic flows are likely between Baltic sea and Liepaja port. Nested HBM setup provides excellent agreement of water level in Trade channel and Liepaja lake with observations with cRMSD of just few centimeters. Good water level performance is contributed by applied CMEMS boundary conditions of Baltic proper. Coastal setup provides essential improvement of water level estimation in Liepaja lake as compared to CMEMS Baltic sea model itself.
Data Availability Statement
The raw data supporting the conclusions of this article will be made available by the authors, without undue reservation.
Author Contributions
HBM operational setup for Baltic sea—Liepaja port—Liepaja lake system was constructed and maintained predominantly by VF. JS and AT contributed with post-processing of data and setting up un interactive web page for visualization of operational forecasts. AT processed the bathymetry data for Liepaja port. UB designed the data flows in the system and analyzed the model results vs. hydrological and meteorological events. JM contributed with essential improvements in HBM software. All authors contributed to the article and approved the submitted version.
Funding
The authors were grateful to support by Latvian Fundamental and Applied Research Project lzp-2018/1-0162.
Conflict of Interest
The authors declare that the research was conducted in the absence of any commercial or financial relationships that could be construed as a potential conflict of interest.
References
Benveniste, J., Cazenave, A., Vignudelli, S., Fenoglio-Marc, L., Shah, R., Almar, R., et al. (2019). Requirements for a coastal hazards observing system. Front. Mar. Sci. 6:348. doi: 10.3389/fmars.2019.00348
Berg, P., and Poulsen, J. W. (2012). Technical Report. 12/16, More Details on HBM: General Modelling Theory and Survey of Recent Studies. Available online at: http://beta.dmi.dk/fileadmin/Rapporter/TR/tr12-16.pdf (accessed December 31, 2020).
Canuto, V., Howard, A., Cheng, Y., Muller, C., Leboissetier, A., and Jayne, S. (2010). Ocean turbulence, III: new giss vertical mixing scheme. Ocean Modell. 34, 70–91. doi: 10.1016/j.ocemod.2010.04.006
Charnock, H. (1955). Wind stress on a water surface. Q. J. R. Meteorol. Soc. 81, 639–640. doi: 10.1002/qj.49708135027
Chen, W. B., Liu, W. C., and Hsu, M. H. (2015). Modeling assessment of a saltwater intrusion and a transport time scale response to sea-level rise in a tidal estuary. Environ. Fluid Mech. 15, 491–514. doi: 10.1007/s10652-014-9367-y
Höffken, J., Vafeidis, A. T., MacPherson, L. R., and Dangendorf, S. (2020). Effects of the temporal variability of storm surges on coastal flooding. Front. Mar. Sci. 7:98. doi: 10.3389/fmars.2020.00098
Hofmeister, R., Burchard, H., and Bolding, K. (2009). A three-dimensional model study on processes of stratification and de-stratification in the limfjord. Contin. Shelf Res. 29, 1515–1524. doi: 10.1016/j.csr.2009.04.004
Kara, A. B., Rochford, P. A., and Hurlburt, H. E. (2000). Efficient and accurate bulk parameterizations of air–sea fluxes for use in general circulation models. J. Atmos. Ocean. Technol. 17, 1421–1438. doi: 10.1175/1520-0426(2000)017<1421:EAABPO>2.0.CO;2
Keruss, M., and Sennikovs, J. (1999). “Determination of tides in Gulf of Riga and Baltic sea,” in Proceedings of International Scientific Colloqium ‘Modelling of Material Processing’, Riga.
Lane, E. M., Gillibrand, R. A. W. P. A., and Uddstrom, M. (2009). Operational forecasting of sea level height using an unstructured grid ocean model. Ocean Modell. 28, 88–96. doi: 10.1016/j.ocemod.2008.11.004
Liu, W. C., Chen, W. B., Kuo, J. T., and Wu, C. (2008). Numerical determination of residence time and age in a partially mixed estuary using three-dimensional model. Contin. Shelf Res. 28, 1068–1088. doi: 10.1016/j.csr.2008.02.006
Maykut, G. A. (1985). An Introduction to Ice in Polar Oceans. Avaialble online at: https://apps.dtic.mil/dtic/tr/fulltext/u2/a166140.pdf (accessed March 20, 2021).
Meier, H. E. M. (2001). On the parameterization of mixing in three-dimensional Baltic sea models. J. Geophys. Res. 106, 30997–31016. doi: 10.1029/2000JC000631
MetOceanView (2018). An Operational Hydrodynamic Forecast Model for Tasman and Golden Bay. Available online at: https://www.metocean.co.nz/news/2018/10/1/an-operational-hydrodynamic-forecast-model-for-tasman-and-golden-bay (accessed January 20, 2021).
Mey-Frémaux, P. D., Ayoub, N., Barth, A., Brewin, R., Charria, G., Campuzano, F., et al. (2019). Model-observations synergy in the coastal ocean. Front. Mar. Sci. 6:436. doi: 10.3389/fmars.2019.00436
Morel, A., and Antoine, D. (1994). Heating rate within the upper ocean in relation to its bio-optical state. J. Phys. Oceanogr. 24, 1652–1665. doi: 10.1175/1520-0485(1994)024<1652:HRWTUO>2.0.CO;2
Otsmann, M., Suursaar, U., and Kulla, T. (1999). Modelling currents along the western coast of Estonia as superposition of Helmholtz oscillators. Trans. Built Environ. 40:10.
Rabinovich, A., and Medvedev, I. (2015). Tides at the southeastern coast of the Baltic sea. Oceanology 55, 319–326. doi: 10.1134/S0001437015030133
Sennikovs, J., Frishfelds, V., and Bethers, U. (2018a). Overview Pictures of Standalone Single Domain (2018.01.11–2018.03.24) and Nested (2018.07.04–2020.03.20) Model Results of Operational Results of Liepaja Port–Liepaja Lake System for the Period 2018–2020. Available online at: http://www.modlab.lv/meteo/Straumes/browse.php?db=lakes¶m=liepcurrent (accessed December 31, 2020).
Sennikovs, J., Frishfelds, V., and Bethers, U. (2018b). Reanalysis of Baltic Sea–Liepaja Port–Liepaja Lake System for Autumn 2017 With High River Run-Off. Available online at: http://www.modlab.lv/meteo/FimarWeb/LiepajaStraumes/Aprekins_2017/aprekins_2017_07_09.html (accessed December 31, 2020).
Sennikovs, J., Timuhins, A., Frishfelds, V., and Bethers, U. (2020a). Historical Model Results of Operational Results of Baltic Sea–Liepaja Port–Liepaja Lake System for the Period 2018–2020. Available online at: http://www.modlab.lv/meteo/FimarWeb/LiepajaStraumes/Aprekins_2020/index.html (accessed December 31, 2020).
Sennikovs, J., Timuhins, A., Frishfelds, V., and Bethers, U. (2020b). Hydrodynamic, Wave and Siltation Modelling for Ports. Available online at: http://www.water.lv/HywasPort (accessed December 31, 2020).
Sennikovs, J., Timuhins, A., Frishfelds, V., and Bethers, U. (2020c). Hydrodynamic, Wave and Siltation Modelling for Ports: Liepaja Port. Available online at: http://www.water.lv/HywasPort/LiepajasOsta (accessed December 31, 2020).
She, J., and Murawski, J. (2018). “Towards seamless modelling for the Baltic sea in operational oceanography serving sustainable marine development,” in Proceedings of the Eight EuroGOOS International Conference, eds E. Buch, V. Fernández, D. Eparkhina, P. Gorringe, and G. Nolan, (Bergen). 233–241.
Sotillo, M., Cerralbo, P., Lorente, P., Grifoll, M., Espino, M., Sanchez-Arcilla, A., et al. (2020). Coastal ocean forecasting in Spanish ports: the Samoa operational service. J. Oper. Oceanogr. 13, 37–54. doi: 10.1080/1755876X.2019.1606765
Keywords: coastal modeling, two-way nesting, transit currents in ports, port seiches, port hydrodynamics
Citation: Frishfelds V, Sennikovs J, Bethers U, Murawski J and Timuhins A (2021) Modeling Transit Flow Through Port Gates and Connecting Channel in Baltic Sea—Liepaja Port—Liepaja Lake System. Front. Mar. Sci. 8:657721. doi: 10.3389/fmars.2021.657721
Received: 23 January 2021; Accepted: 24 March 2021;
Published: 22 April 2021.
Edited by:
Manuel Espino Infantes, Polytechnic University of Catalonia, SpainReviewed by:
Manuel Garcia-Leon, Universitat Politecnica de Catalunya, SpainChen Wei-Bo, National Science and Technology Center for Disaster Reduction (NCDR), Taiwan
Copyright © 2021 Frishfelds, Sennikovs, Bethers, Murawski and Timuhins. This is an open-access article distributed under the terms of the Creative Commons Attribution License (CC BY). The use, distribution or reproduction in other forums is permitted, provided the original author(s) and the copyright owner(s) are credited and that the original publication in this journal is cited, in accordance with accepted academic practice. No use, distribution or reproduction is permitted which does not comply with these terms.
*Correspondence: Vilnis Frishfelds, ZnJpc2hmZWxkc0BsYXRuZXQubHY=