 Wyatt C. Million
 Sibelle O’Donnell1
 Erich Bartels
- 1Department of Biological Sciences, University of Southern California, Los Angeles, Los Angeles, CA, United States
- 2Elizabeth Moore International Center for Coral Reef Research & Restoration, Mote Marine Laboratory, Summerland Key, FL, United States
The ability to quantify changes in the structural complexity of reefs and individual coral colonies that build them is vital to understanding, managing, and restoring the function of these ecosystems. However, traditional methods for quantifying coral growth in situ fail to accurately quantify the diversity of morphologies observed both among and within species that contribute to topographical complexity. Three-dimensional (3D) photogrammetry has emerged as a powerful tool for the quantification of reefscape complexity but has yet to be broadly adopted for quantifying the growth and morphology of individual coral colonies. Here we debut a high-throughput method for colony-level 3D photogrammetry and apply this technique to explore the relationship between linear extension and other growth metrics in Acropora cervicornis. We fate-tracked 156 individual coral transplants to test whether initial growth can be used to predict subsequent patterns of growth. We generated photographic series of fragments in a restoration nursery immediately before transplanting to natural reef sites and re-photographed coral at 6 months and 1 year post-transplantation. Photosets were used to build 3D models with Agisoft Metashape, which was automated to run on a high-performance computing system using a custom script to serially process models without the need for additional user input. Coral models were phenotyped in MeshLab to obtain measures of total linear extension (TLE), surface area, volume, and volume of interstitial space (i.e., the space between branches). 3D-model based measures of TLE were highly similar to by-hand measurements made in the field (r = 0.98), demonstrating that this method is compatible with established techniques without additional in water effort. However, we identified an allometric relationship between the change in TLE and the volume of interstitial space, indicating that growth in higher order traits is not necessarily a linear function of growth in branch length. Additionally, relationships among growth measures weakened when comparisons were made across time points, implying that the use of early growth to predict future performance is limited. Taken together, results show that 3D photogrammetry is an information rich method for quantifying colony-level growth and its application can help address contemporary questions in coral biology.
Introduction
The three-dimensional structural complexity of coral is central to the ecological function of reefs (Alvarez-Filip et al., 2009; Zawada et al., 2010). Structurally intricate reefs sustain high biological diversity (Risk, 1972; Graham and Nash, 2013), increase productivity (Szmant, 1997), and reduce hydrodynamic energy (Lugo-Fernández et al., 1998; Monismith, 2007). Colony morphology also influences small scale water flow that controls the size of the diffusion boundary layer, influencing heat and mass transfer (Stocking et al., 2018) and pH of the tissue surface (Chan et al., 2016). These physicochemical processes support key aspects of a coral’s biology, including nutrient uptake, and mitigation of acidification and thermal stress (Dennison and Barnes, 1988; Lesser et al., 1994; Jimenez et al., 2011). Consequently, the ability to quantify changes in the structural complexity of reefs and the individual coral colonies that build them is vital to understanding, managing, and restoring the function of these ecosystems.
Traditional methods for measuring coral growth have provided foundational knowledge of extremely fast growth rates in Acropora cervicornis compared to other species (Lirman et al., 2014), trade-offs between growth and thermal susceptibility (Jones and Berkelmans, 2010; Cunning et al., 2015) and the capacity for morphological plasticity (Bruno and Edmunds, 1997; Todd, 2008; Drury et al., 2017). However, the type and quality of information that can be obtained from each individual metric is limited. Moreover, many require handling, or even destructive sampling, hindering the potential to investigate temporal changes in growth using repeated measures. Non-invasive methods for measuring growth in situ include total linear extension (TLE, Johnson et al., 2011) and estimated ellipsoidal volumes (Kiel et al., 2012). TLE relies on linear measures of branch lengths, typically taken by hand with calipers or a ruler, to quantify skeletal size (Johnson et al., 2011). However, this measure is only applicable to branching species, and can be arduous to complete in situ as colonies increase in size (Lirman et al., 2014). Alternatively, colony size can be calculated from the volume of an ellipsoid with the same length, width, and height as a coral colony (Kiel et al., 2012). However, this method is likely unable to resolve changes in the pattern of growth that do not increase the maximum dimensions of a colony. Invasive techniques to measure coral growth include direct measures of surface area (SA) via wax dipping (Stimson and Kinzie, 1991; Veal et al., 2010), volume (V) via water displacement (Jokiel et al., 1978; Herler and Dirnwöber, 2011), and mass via buoyant weighing (Davies, 1989). However, each of these methods requires handling and, for wax dipping, sacrificing the coral completely. Measuring growth in one dimension also ignores structural differences. For example, two colonies may have the same linear extension or ellipsoidal volume but encompass vastly different morphological forms (Pratchett et al., 2015). Therefore, multiple independent methods would be required to gain a comprehensive understanding of colony growth and morphology.
Three-dimensional (3D) photogrammetry, i.e., obtaining measurements from digital, scaled 3D representations of objects, has become a powerful tool for quantifying structural components of coral reefs (Burns et al., 2015; D’Urban Jackson et al., 2020; Hernández-Landa et al., 2020). There has been growing application of this technology to quantify reefscape complexity (McKinnon et al., 2011; Burns et al., 2015; Leon et al., 2015), but 3D photogrammetry has yet to be broadly adopted for quantifying growth and morphology of individual coral colonies, despite several studies validating its application (Figueira et al., 2015; Lavy et al., 2015; Agudo-Adriani et al., 2016; Ferrari et al., 2017; House et al., 2018; Doszpot et al., 2019; Lange and Perry, 2020). One reason for this may be that although model building algorithms and the user-friendliness of applications continue to improve, methodological nuances can result in differences in the required processing time, quality of models produced, and traits measured (Lange and Perry, 2020 compared to Lavy et al., 2015). Similar to open source software that allows for community contribution that drives innovation (Hippel and Krogh, 2003), increasing accessibility and reproducibility of 3D photogrammetry methods can help facilitate broader adoption and advancement of this technique. The information richness of a single 3D model is a major methodological advantage, expanding the range of biological questions that can be investigated. For example, in addition to quantifying coral growth via TLE, SA, or V, quantifying the volume of interstitial space (Vinter) can give insights into the ecological function of coral growth by providing an estimate of the amount of resulting habitat space that is created (Coker et al., 2014; Agudo-Adriani et al., 2016). 3D models can also provide digital structures to enable more accurate mapping of the hydrodynamics of flow around colonies (Stocking et al., 2018). Finally, the permanent record of 3D models allows for researchers to revisit historical datasets to verify previous measures or test new hypotheses. This unprecedented access to multiple traits once hard to measure comes without the need to touch or manipulate the coral itself, making it especially useful for conducting repeated measures over time.
The ability to non-invasively quantify changes in key performance traits also has important practical applications, particularly in the context of reef restoration. The structural complexity of Caribbean coral reefs has been altered by dramatic losses of branching acroporids (Miller et al., 2002; Alvarez-Filip et al., 2009). As a result, A. cervicornis and A. palmata have been the focus of broad-scale restoration efforts in Florida and the broader Caribbean. Significant effort has been invested in the development of in-water and ex situ nurseries in order to generate biological material to outplant to degraded reef sites (Rinkevich, 1995; Young et al., 2012; Lohr et al., 2015). However, the ultimate success of these efforts has been hampered by the inability to predict the performance of coral outplants, given that both genetic and environmental variables can influence survival and growth (Drury et al., 2017; O’Donnell et al., 2017). The ability to use early, non-invasive indicators to quantify outplant success would be beneficial in restoration settings that aim to optimize efforts to repopulate Caribbean reefs (Edmunds and Putnam, 2020; Parkinson et al., 2020).
Reliable predictors of coral performance that can be evaluated before or soon after outplanting can guide restoration programs to strategically enhance efforts. However, prior work suggests that the predictive power of traditional growth metrics may be limited. Early growth rate in TLE for Acropora cervicornis was found to be a poor predictor of future growth rate for nursery-grown (O’Donnell et al., 2018) and wild corals (Edmunds, 2017). Similarly, early growth rates for two massive coral species as measured in nurseries explained only a portion of future performance, and the predictive power of these metrics varied over sampling points and traits (Edmunds and Putnam, 2020). The utility of higher order traits, such as SA, V, and Vinter, for predicting subsequent growth remains unknown because handling or destructive sampling of outplants is not possible in a restoration context.
Here we apply high-throughput colony-level 3D photogrammetry to fill this knowledge gap. First, we develop an open-access protocol for conducting colony-level 3D photogrammetry that provides guidance for in situ image collection, makes high-throughput model building more readily accessible, and creates a repeatable, standardized method for coral phenotyping from 3D models. We then employ this method to address questions regarding the predictive power of higher order morphological traits in A. cervicornis by quantifying the growth of outplants at different intervals throughout 1 year. We test to what degree total linear extension (TLE), a commonly used non-invasive metric of growth in A. cervicornis (Johnson et al., 2011), can be used to estimate growth in higher order traits, such as surface area (SA), volume (V), and the volume of the interstitial space (Vinter), in addition to testing for predictive correlations among these traits.
Materials and Methods
Study Design
In April 2018, three ramets of each of ten genotypes of A. cervicornis from Mote Marine Laboratory’s in situ nursery were transplanted in triplicate to nine offshore reef sites throughout the Lower Florida Keys under FKNMS permits 2015-163-A1 and 2018-035 (n = 27 initial ramets/genotype). Triplicate ramets were attached to the reef substrate, with one ramet per genotype assigned to each of 3 randomized arrays within each site. Coral morphology was quantified with 3D photogrammetry at 3 time points: in the in situ nursery prior to transplantation (April 2018), and 6 months (October 2018) and 12 months (April 2019) post-transplantation. Of the 270 outplanted coral fragments, 72 died or were lost from the transplant after 12 months. An additional 43 coral fragments, including 40 nursery fragments, 2 fragments at 6 months, and 1 fragment at 12 months were removed from the dataset due to insufficient photographic coverage causing incomplete models, resulting in a final dataset of 156 fragments measured for all traits at all-time points. Additionally in April 2018 and October 2018, TLE was measured by-hand with a flexible ruler following the protocol of Lirman et al. (2014) and these measurements were used to compare with TLE obtained through 3D photogrammetry in order to assess the potential for backward compatibility.
Image Capture
Photographs of outplanted corals were taken by SCUBA divers following the protocol available at dx.doi.org/10.17504/protocols.io.bgdcjs2w. Briefly, photographs were taken from multiple angles using the Olympus Tough TG-4/TG-5 (Olympus America Inc.), maintaining roughly 80% overlap until the entire coral colony was captured with 2D images. The Olympus Tough TG-4/TG-5 was chosen for its low price point, its built-in underwater capabilities which avoids the need for auxiliary underwater housings, and its small size which allowed divers to operate the camera with one hand in high wave-action environments. Cameras were set to “underwater” or “auto” mode with flash turned off, and photos were taken by either manually pressing the shutter or set to capture images automatically at 1 s intervals, depending on photographer preference. In April 2018, coral ramets were photographed in the nursery prior to transplantation in groups of 10 (Supplementary Figure 1) requiring 120–383 photos per group. Post-transplantation, in October 2018 and April 2019, a custom-built scaling object incorporating Agisoft Metashape markers was included around each coral to provide a fixed reference for model generation. The number of photos taken for each colony ranged from 7 to 293, with the number of photographs depending on size of the colony and water quality conditions at a given location.
Image Pre-processing and Model Building
Photos were downloaded and sorted into separate photo sets for each group of 10 nursery corals (April 2018) or individual outplanted colony (October 2018, April 2019). Photographs where the coral was out of focus or out of frame were manually removed. Photographs shot in “auto” mode were color corrected in Lightroom (Adobe® Lightroom® software) to remove green tint and enhance contrast of the coral when needed, for example, when model building was hindered by bright white branch tips.
Three-dimensional models were generated from photo sets using Agisoft Metashape (Agisoft LLC, St. Petersburg, Russia). Metashape is processing intensive so in order to rapidly build 3D models with limited user input, we completed all model building on a Dell PowerEdge R910 with an Intel® Xeon® Processor E7-4850 with Metashape manually limited to 20–40 CPUs and 250 GB of RAM. Due to limited licensing capabilities of Metashape, a custom Python script was used to serially process models and Metashape settings were adjusted when needed for individual models. Models were exported as Wavefront (.OBJ) files which are capable of maintaining color pulled from 2D photos. Models with portions of colonies missing were rebuilt with a modified script that expands the size of the bounding box during the “Align Photos” step to include all calculated tie points. All bioinformatic scripts used to run Metashape on the command line can be found at https://github.com/wyattmillion/Coral3DPhotogram. We assessed the performance of 200 automated Agisoft Metashape runs through the number of tie points found from each photoset (overlapping points found in two or more photos) and the number of faces making up each mesh.
3D Phenotyping
Models generated in Metashape were imported into the free 3D model editing software, Meshlab v2016.12 (Cignoni et al., 2008) to obtain measurements of TLE, SA, V, and Vinter following protocols outlined at dx.doi.org/10.17504/protocols.io.bgbpjsmn. Briefly, models were scaled using Agisoft Metashape markers and scaling accuracy was verified by remeasuring markers. Models were manually trimmed using the Select vertices and Remove current set of selected vertices tools leaving only living coral in the models. Small holes in the areas of coral tissue were filled prior to phenotyping models using the Close Holes filter. To calculate TLE, the lengths of all branches were manually measured and summed using the Measuring Tool. Surface area was automatically quantified using MeshLab’s Compute Geometric Measure filter. The bottom of coral models were then closed using the Close Holes filter in order to make the mesh “watertight” for the Compute Geometric Measure filter to measure the volume of the coral. The volume of a colony was subtracted from the volume of a convex hull, i.e., a mesh overlaid over the most extreme branch tips (Supplementary Figure 2), in order to quantify Vinter. Traits such as “proportion occupied” (Doszpot et al., 2019) and “convexity” (Zawada et al., 2019) utilize a convex hull but instead derive morphometric features standardized to coral volume or surface area. Here we used Vinter to measure the absolute volume of empty space between coral branches.
Five colonies suffered severe breakage and only a small portion of living tissue remained after 12 months (Supplementary Figure 3). 3D models were not built for these colonies and instead, SA was measured in ImageJ (Rasband, 1997–2014) following (Kenkel et al., 2015) and V and Vinter were recorded as 0 because the colony tissue represented a 2D area with no living 3D structure beyond the height of a single polyp (Supplementary Figure 3). TLE was recorded as 1 mm as this was the average height of the coral polyps on the colonies at the 6-month time point.
Statistical Analysis
All statistical analysis was completed in R 3.6.3 (R Core Team, 2020). One coral was randomly chosen to assess precision of the 3D photogrammetry method. To do this, we determined the coefficient of variation (CV) for each focal trait measure (TLE, SA, V, and Vinter) across 6 replicate models built from a reduced photoset where a random 10% of the photographs were removed, similar to Ferrari et al. (2017) and Lange and Perry (2020). The corals used in this study are part of restoration efforts and as such could not be removed from the substrate to measure volume or surface through traditional methods. Instead, TLE measured by-hand in situ was used to ground-truth measurements of TLE obtained from 3D models.
Pearson correlations were used to assess the relationship between by-hand and 3D model based measurements of TLE collected at two time points (initial, and 6 months, n = 311) and to assess whether the difference in methods is a function of coral size. To assess the strength of predictive relationships among trait measurements within and across time-points, Kendall’s tau correlations were used to relate the change in trait values between 0–6 months and 6–12 months (n = 156). Kendall’s tau was used for its ability to handle non-normally distributed data and heteroscedastic residuals, as well as outliers, which here represent true biological variation, and non-linearity (Newson, 2002). Additive polynomial regressions were used to maximize the fit of non-linear relationships observed for TLE and Vinter, while adding the fewest polynomial terms.
A. cervicornis naturally reproduces through fragmentation (Tunnicliffe, 1981; Drury et al., 2019). To assess whether natural fragmentation events influenced the predictive relationship among traits, we recorded the number of breakage events experienced by each coral by comparing photographic records across time points. Breakage was coded as a binary with coral experiencing one or more breakage events considered “Broken” and corals experiencing no breakage considered “Unbroken.”
Results
Modeling Performance and Precision
3D models of individual colonies (6- and 12-month time points) were built from an average of 91 photos, while as few as 7 photos (for the smallest colonies) and as many as 293 photos (for the largest colonies) were used in successful runs. The number of photos used as input into the model building step was loosely related to the size of the colony following a linear pattern (Supplementary Figure 4). We used a subset of 200 models to evaluate our model building pipeline which took about 1.5 h on average to build models of colonies ranging from 0.1 to 74 cm TLE and with 1 to 21 branches. The number of tie points for the 200 model runs ranged from 920 to 151,132, and the number of faces ranged from 137,873 to 5,337,592.
Replicate models of a single coral colony at the 12-month time point were measured to assess the precision of model building and phenotyping steps. This coral represented a relatively large and complex colony, with 21 branches total (TLE = 74 cm, SA = 261 cm2, V = 85 cm3, Vinter = 434 cm3). Replicate 3D models had similar resolution with an average of 2,125,932 faces per model (CV = 1.5%). The replicate models produced very similar trait measurements, once individually scaled, with a CV of 1.3% for TLE, 3.7% for SA, 5.7% for V, and 4.9% for Vinter.
Photogrammetry vs. Traditional Methods
A strong correlation was observed between TLE measures made by-hand in situ and those obtained from the 3D models (r = 0.98, n = 311, Figure 1A). The average absolute difference between the two methods for a single colony was 12.8 mm (Figure 1A). Additionally, there was a significant but weak positive correlation between the absolute size of a focal colony and accuracy, as quantified by the difference in the value of TLE, based on how the measurement was made (r = 0.29, p < 0.001, Figure 1B). A greater agreement between by-hand and 3D model based measurements (i.e., a lower difference value) indicates higher accuracy, suggesting that discrepancies between the two methods increase as colonies increase in size.
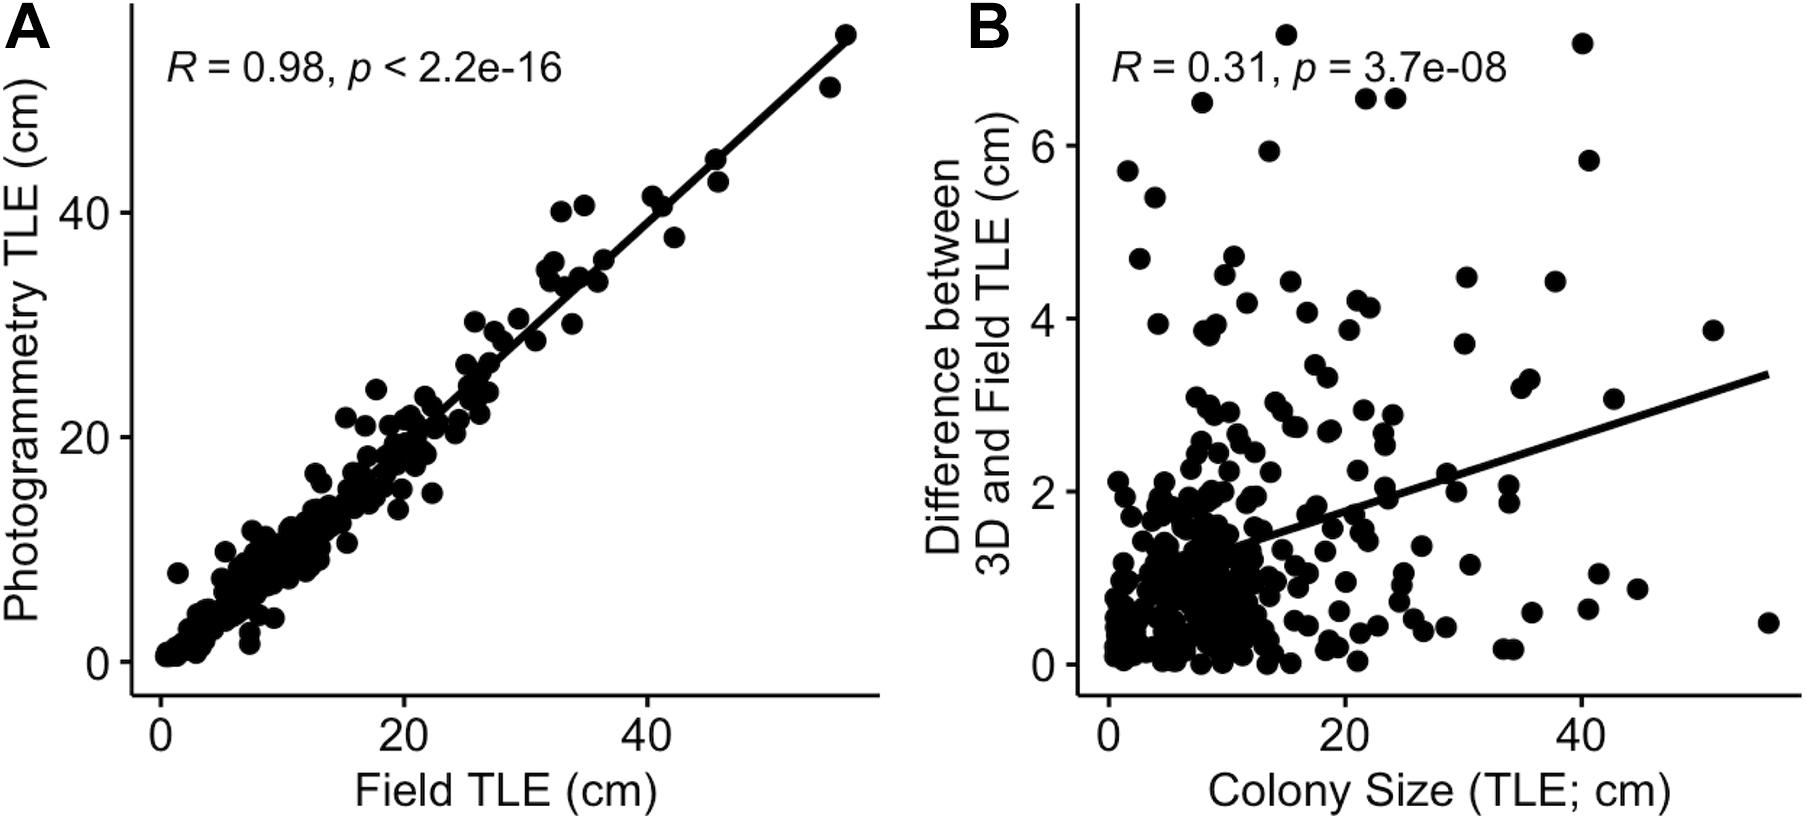
Figure 1. The relationship between (A) TLE measured by-hand in the field and from 3D models and (B) the absolute difference between by-hand and 3D based measures and the size of the focal coral colony (n = 311).
TLE as a Proxy for Higher Order Traits
TLE was highly correlated with growth in higher order traits when compared within the same time point (Figure 2 and Supplementary Figure 5). The change in TLE over the first 6 months of outplanting was very strongly correlated with growth of SA, V, and Vinter over the same time window (τ = 0.76–0.85). The strength of correlations was slightly reduced in the second 6-month window, but TLE was still strongly correlated with other three-dimensional traits (τ = 0.64–0.8).
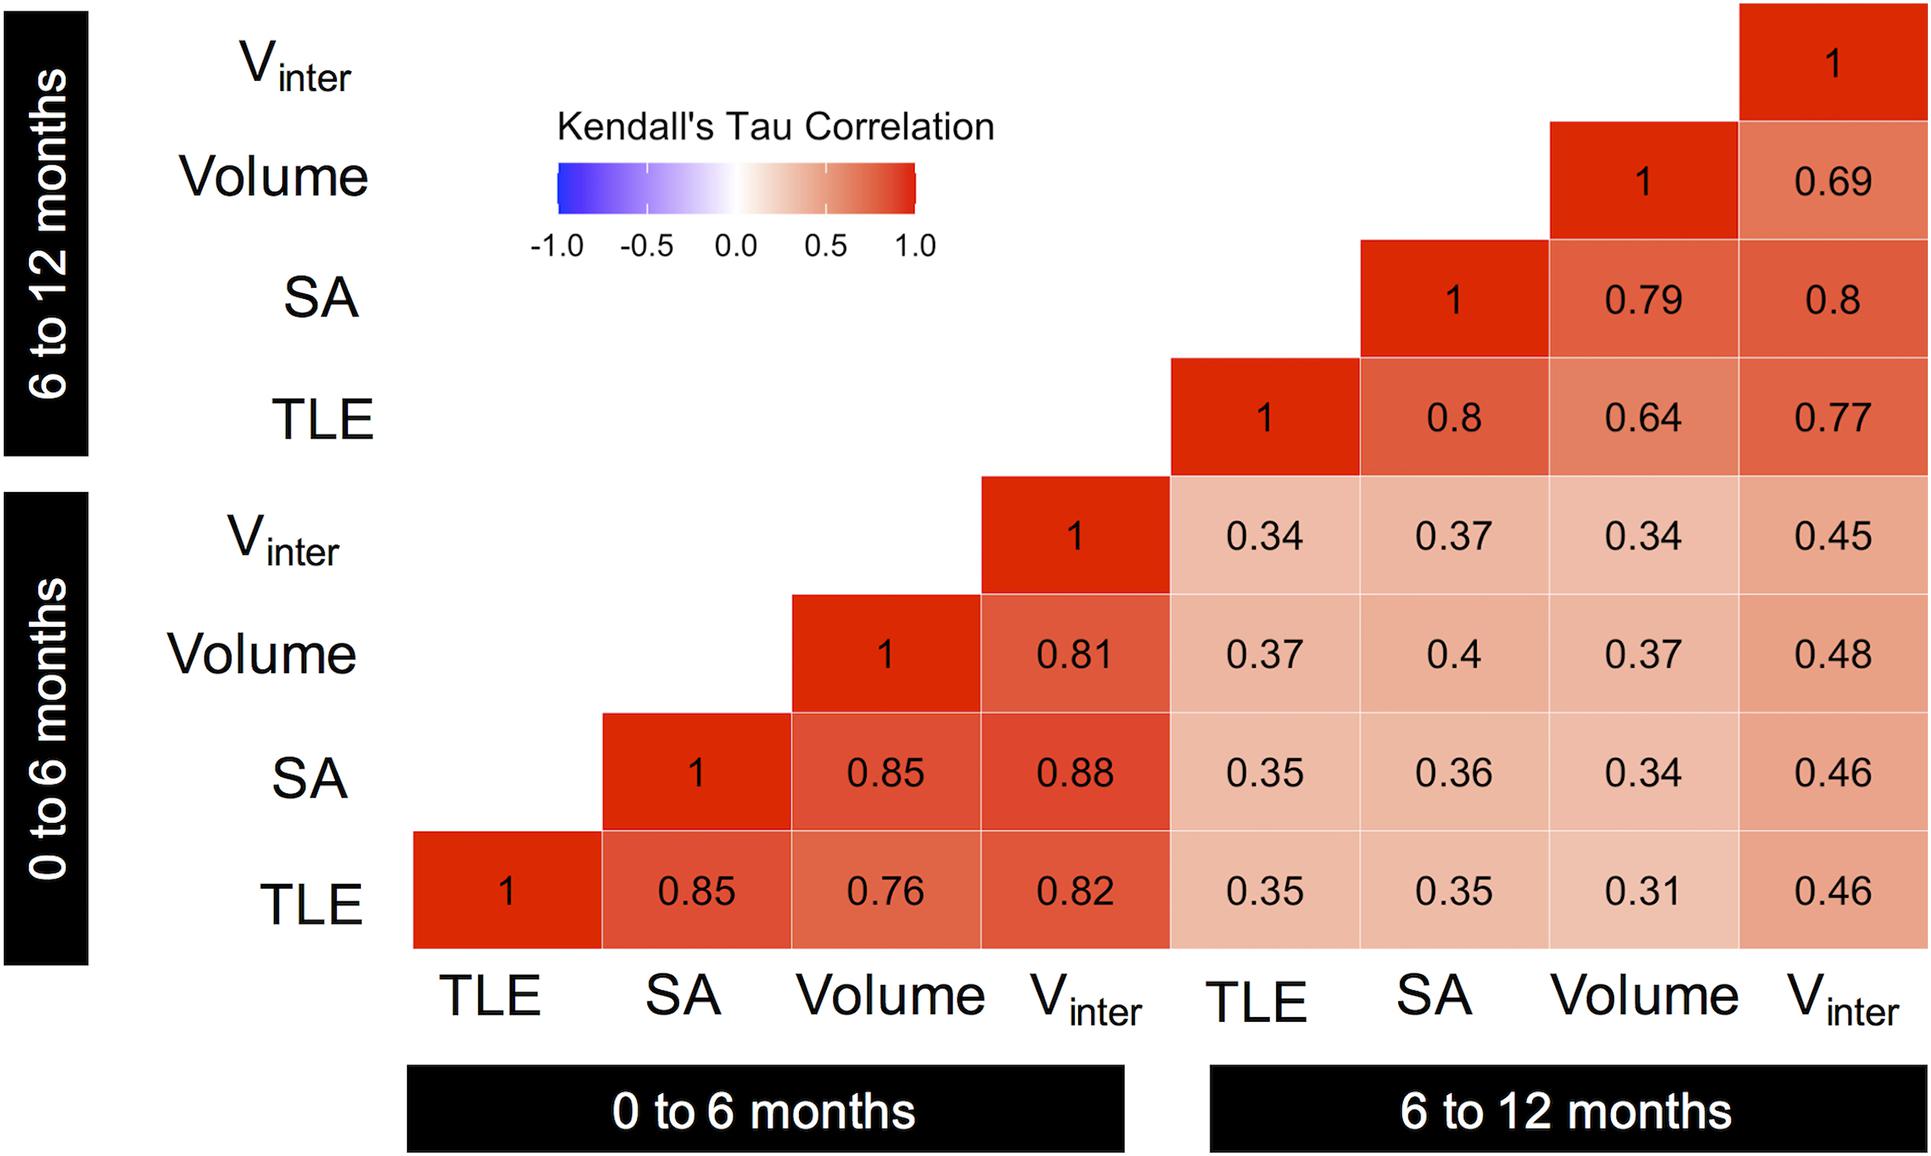
Figure 2. Correlation matrix showing the relationships among growth in traits over time. Values indicate Kendall’s tau correlation coefficient. All relationships were significant (p < 0.05). Color indicates the magnitude and direction of the correlation.
Regression plots of individual trait correlations suggest that non-linear dynamics likely influenced trait relationships (Supplementary Figure 5). For example, a second order polynomial better explained the relationship between growth in TLE and growth in Vinter during the first 6 months (r = 0.922, p = 2.2e-16) and during the second 6 months (r = 0.864, p = 2.2e-16; Figure 3), with Vinter increasing at a faster rate than TLE.
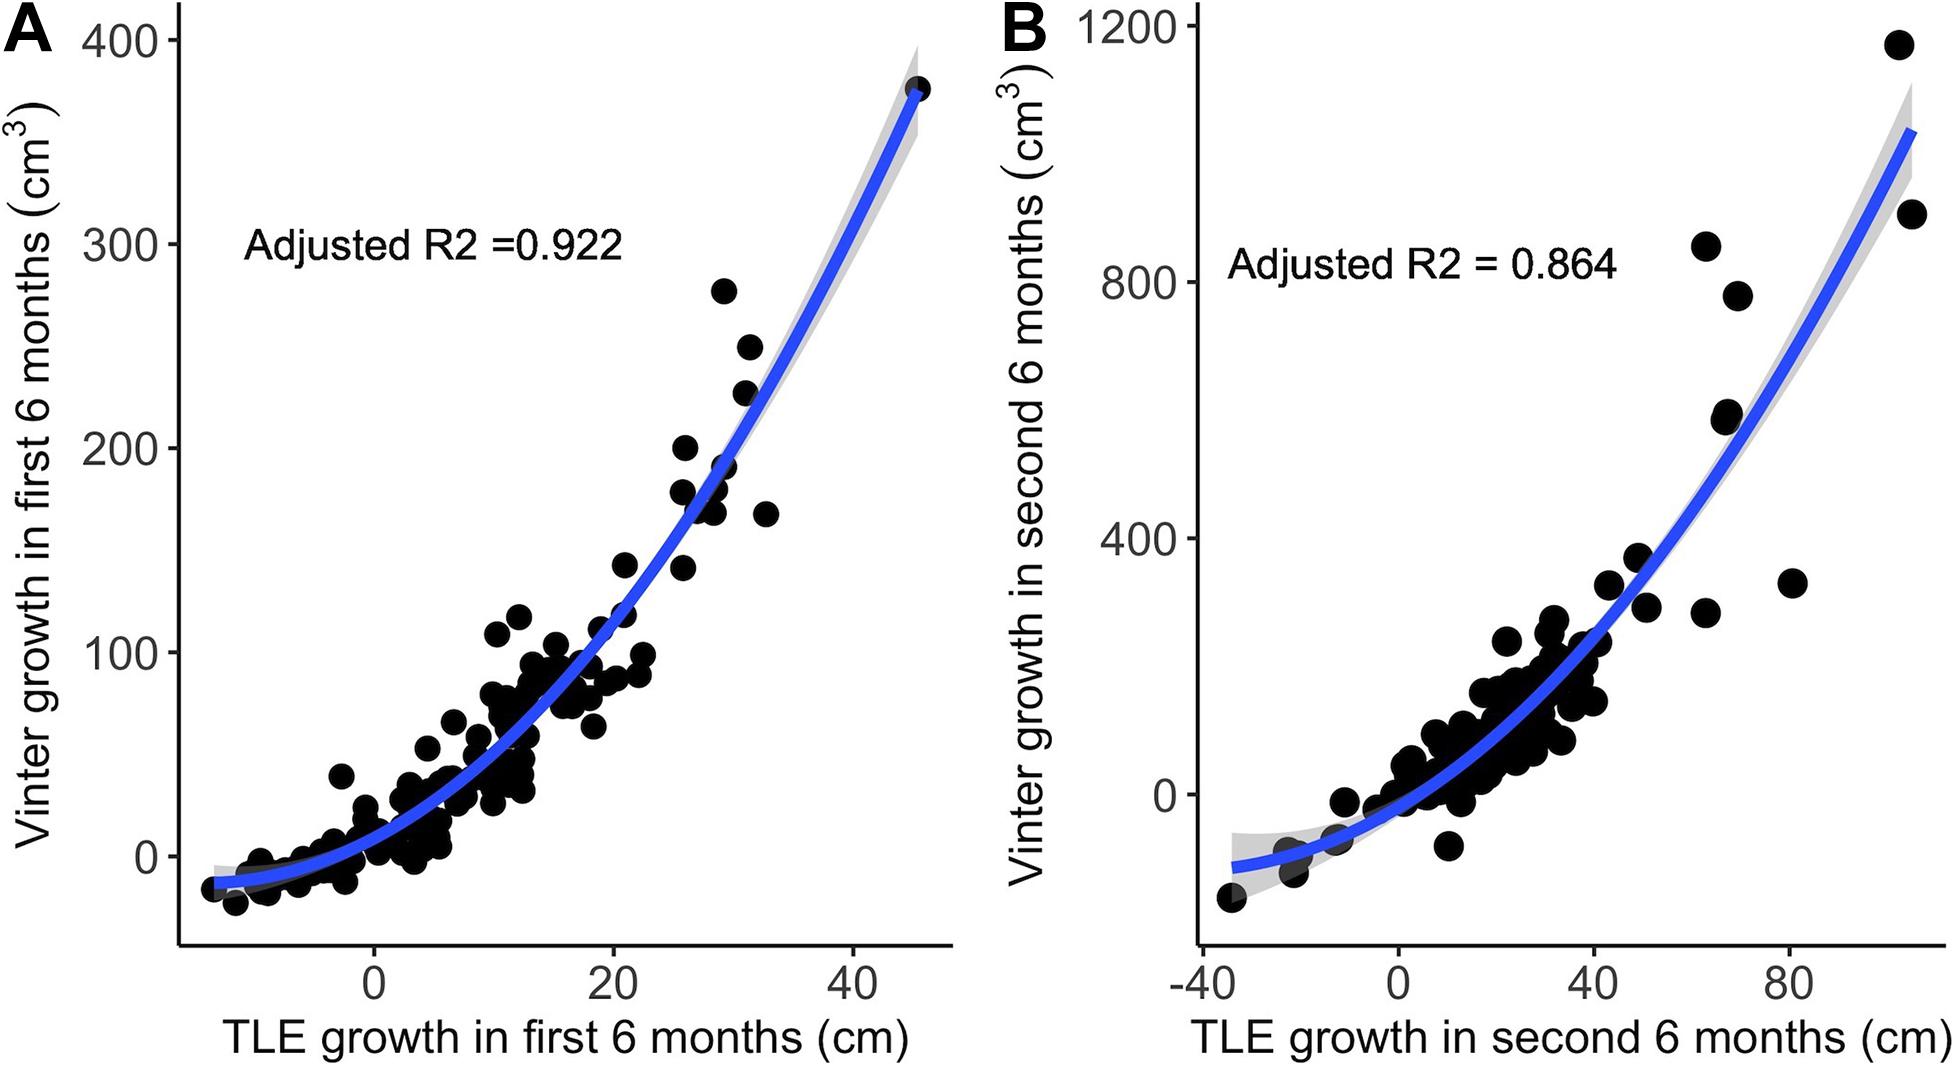
Figure 3. Growth in TLE compared to growth in Vinter over the first 6 months (A) and over the second 6 months (B). The solid blue line shows the second order polynomial fit to each relationship. Shaded areas around each line represent the 95% confidence intervals (n = 156).
Relationships Among Growth Traits Over Time
Relationships among growth measurements weakened markedly when comparisons were made across time points (Figure 2). Trait growth in the first 6 months post-outplant was weakly correlated with growth of the focal trait over the second 6 months (τ = 0.35–0.45, Figure 2). The use of non-linear regressions explained an additional 2.5% of the variation in subsequent TLE growth and an additional 1.7% of the variation in subsequent Vinter growth. The relationships between future and subsequent growth in SA and V were not significantly improved by non-linear models (Supplementary Figure 6).
Random coral breakage influences the predictive power of initial growth measurements, but relationships remain weaker than for the within time-point correlations even when broken corals are excluded from models (Figure 4). For example, the correlation between initial and subsequent Vinter growth improved when broken coral were excluded (Broken included: τ = 0.45, p = 5.05e-17; Figure 2; Broken excluded: τ = 0.63, p = 3e-9, Figure 4D). Similar effects of breakage diminish the power of initial growth to predict future growth in other traits as Kendall’s tau coefficients also increased for correlations between initial and subsequent growth in TLE and SA (τ = 0.57 and τ = 0.49, respectively) when broken corals were excluded (Figures 4A,B). No significant relationships between initial and subsequent growth were observed for corals that experienced breakage (Figure 4).
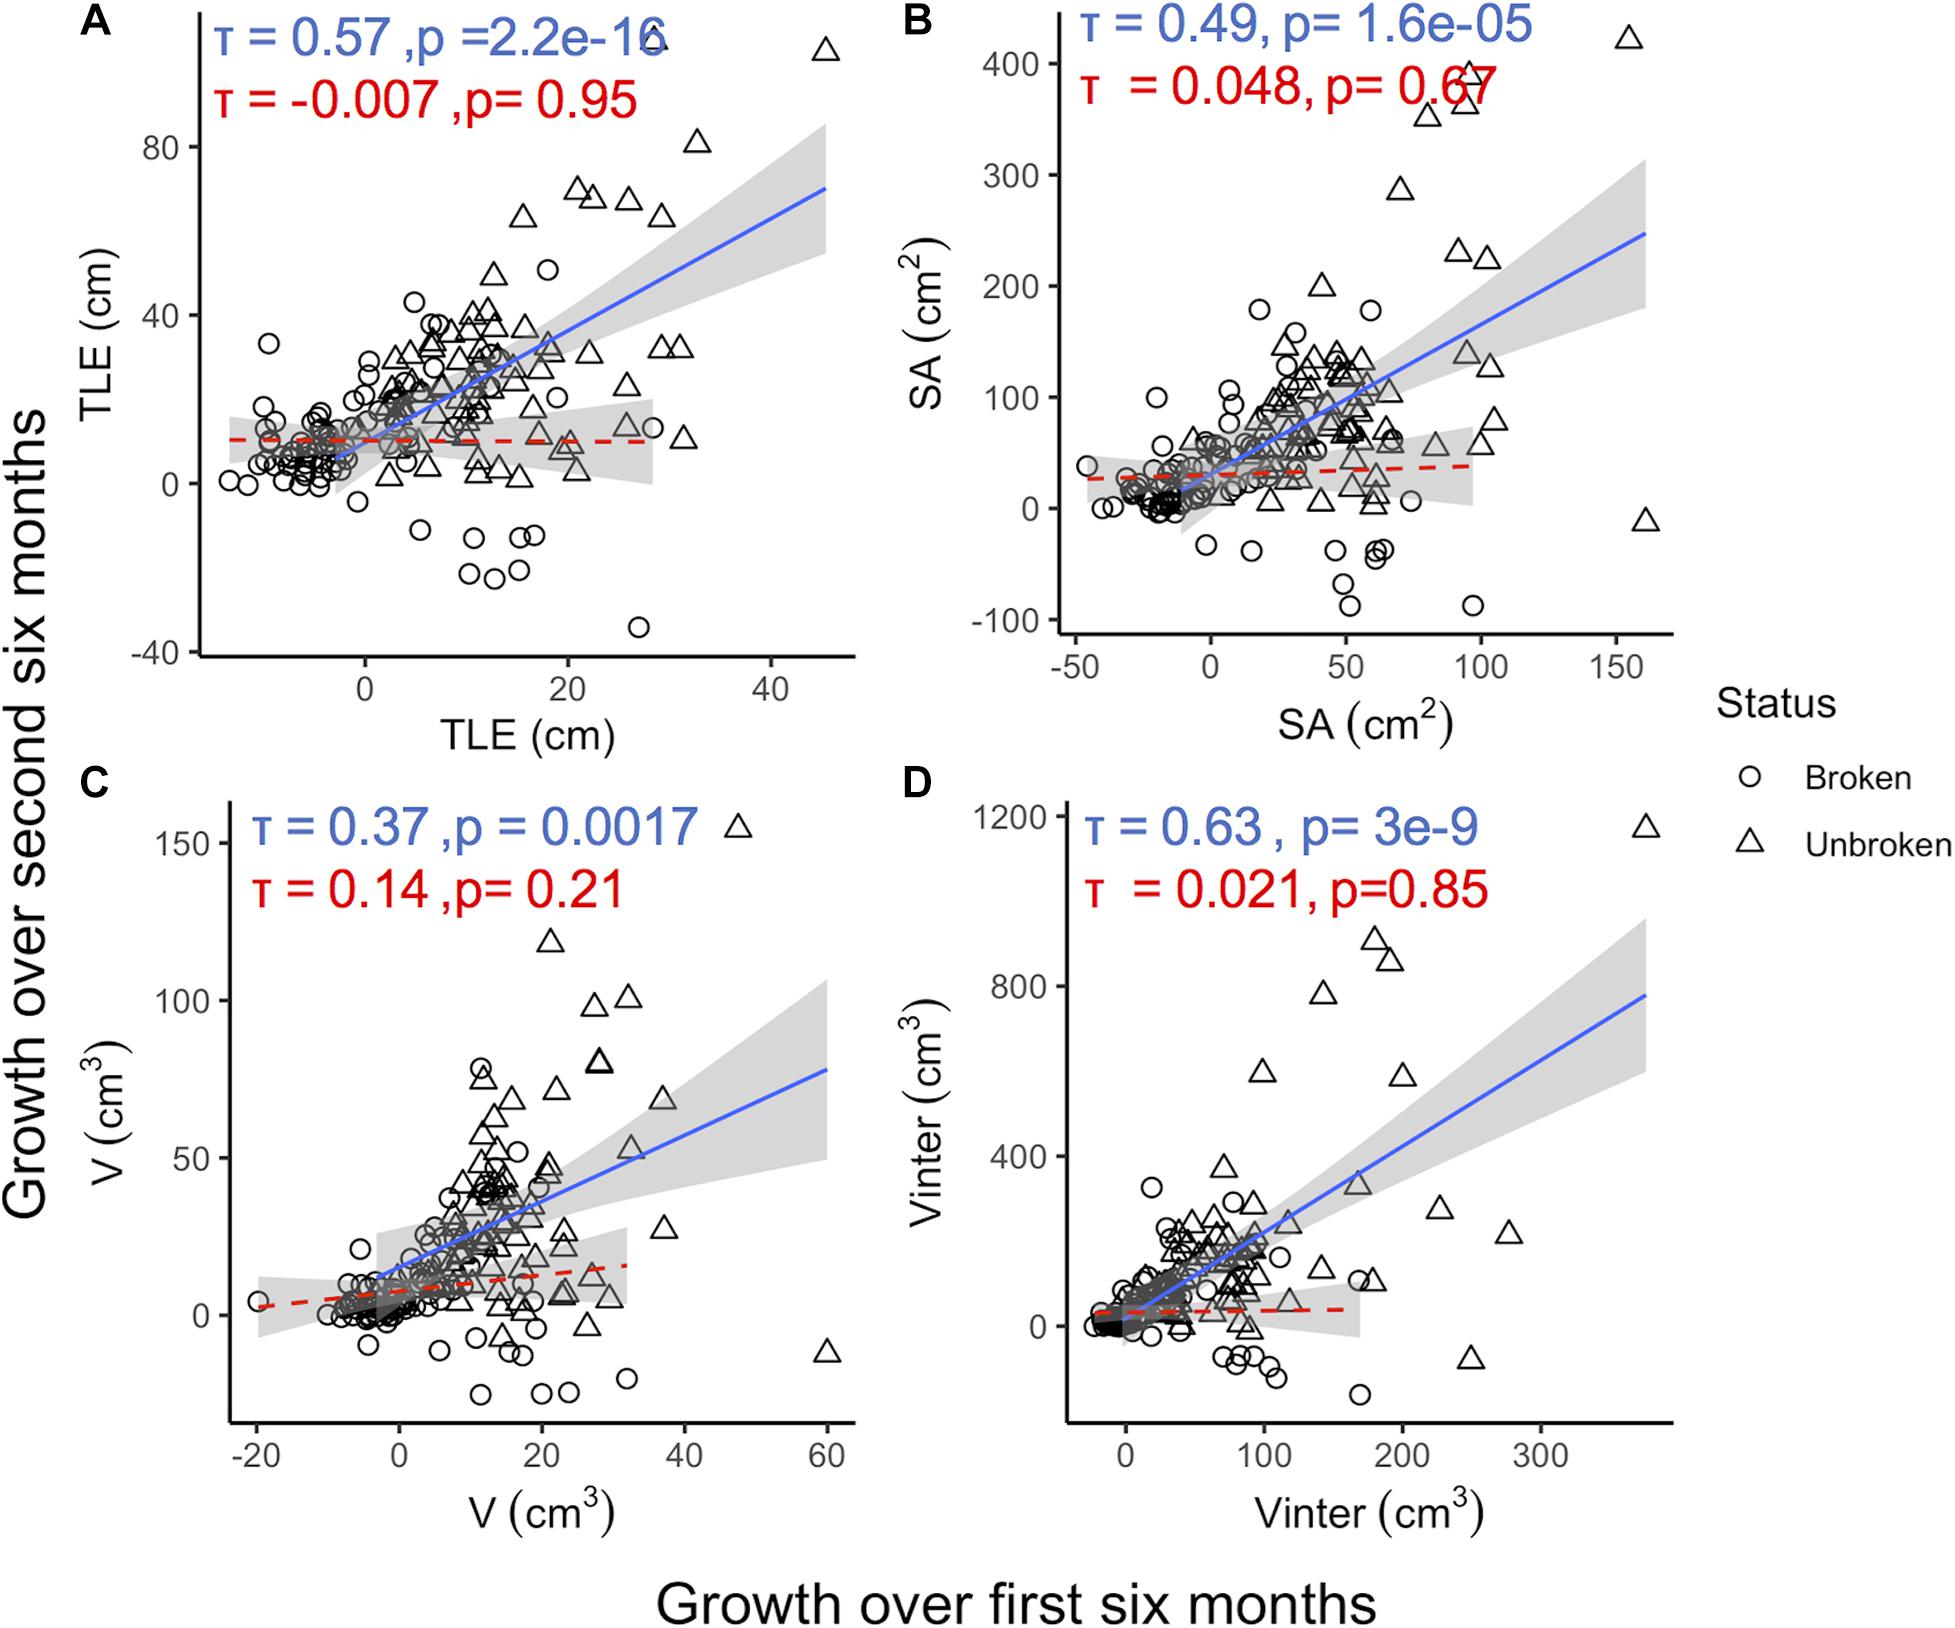
Figure 4. Growth over the first 6 months compared to growth over the second 6 months for TLE (A), SA (B), V (C), and Vinter (D) colored by whether coral experienced breakage (open circles, dashed red line) or not (open triangles, solid blue line). Kendall’s tau coefficients and p-values are included for correlations. Shaded areas around each line represent the 95% confidence intervals (n = 156).
The change in TLE over the first 6 months of outplanting was generally a poor predictor of future growth. The strongest predictive relationships for an initial measure of growth were observed for V, which had the strongest correlations with subsequent growth in all traits regardless of breakage events (τ = 0.37–0.48, Figure 2), and when broken corals were excluded (τ = 0.37–0.49, Supplementary Figure 7). Interestingly, initial growth in all traits displayed stronger relationships with subsequent growth in Vinter, as evidenced by stronger correlation coefficients in the 6–12 month Vinter column, than for other initial to subsequent growth comparisons (TLE, SA, V, Figure 2).
Discussion
The complex structure of a coral reef is vital to its function (Alvarez-Filip et al., 2009; Zawada et al., 2010). Consequently, declines in populations of reef building corals dramatically change the topography of these biologically diverse ecosystems (Denis et al., 2017). Acropora cervicornis was once a prolific reef builder in the Caribbean and its decline has sparked massive restoration efforts in areas like the Florida Keys (Young et al., 2012). To quantify restoration outcomes, practitioners often desire to track colony growth as a performance metric (Young et al., 2012; Ware et al., 2020) because coral size correlates with fitness-related traits like survival and fecundity (Babcock, 1991; Hughes et al., 1992; Álvarez-Noriega et al., 2016). However, given the scale of outplanting efforts, invasive methods to track coral growth are inefficient and counter to the goals of restoration when destructive sampling is necessary (Johnson et al., 2011). Similarly, while non-invasive measurements, such as TLE, are informative (Johnson et al., 2011), they can be painstaking and slow if done by-hand (Lirman et al., 2014). Here we show that 3D photogrammetry can generate accurate measurements of linear growth while simultaneously providing information on higher order traits reflective of an individual coral’s condition, like surface area, and volume, as well as its function, such as the volume of interstitial space produced by its branching morphology. We find that linear extension is a strong correlate of growth in higher order traits within a monitoring period. However, predictive relationships across time-points are poor. Moreover, breakage and non-linear relationships among traits present obstacles to predicting future growth in coral colonies. Variation in morphological growth brought on by environmental variation may further complicate projections made from initial growth rates.
Relationships Between TLE and Higher Order Traits
Growth in TLE was a reliable estimator for growth in SA, V, and Vinter within a particular monitoring window. Relationships were the strongest within the first 6 months post-outplant suggesting that TLE could be used to approximate higher order traits in smaller, less complex colonies. However, this relationship weakened on average during the second 6-month monitoring window. This decrease in the strength of relationships among traits over time could be due to allometric variation in the growth rates of traits relative to overall colony size.
Allometry broadly describes the scaling of two biological traits (West et al., 1997) but often implies differences in growth rate between these traits. For example, horn length in male rhinoceros beetles showed a positive allometric relationship to prothorax size, meaning that increases in body size resulted in disproportionately large increases in horn size (McCullough et al., 2015). Allometric scaling has also been used to describe size-dependent growth rates in plants that show negative allometry—growth rate decreases as overall biomass increases (Wesselingh et al., 1997; Félix-Burruel et al., 2019). Additionally, allometric relationships can change due to environmental effects, resulting in inconsistent scaling between traits within a species. This phenomenon has been reported in height-stem diameter relationships across environmental gradients for some tree species (Lines et al., 2012). Finally, intraspecific variation in allometric scaling between traits can result in further phenotypic variation, for example, scaling between horn and body size can vary among competing males of a single rhinoceros species (McCullough et al., 2015).
We uncover an exponential relationship between TLE and Vinter where marginal increases in TLE result in larger increases in Vinter as corals grow, indicating positive allometry. Similar positive allometry was observed in multiple coral morphotypes for shelter volume-colony diameter and planar area relationships (Urbina-Barreto et al., 2020), and between colony surface complexity and colony volume (Zawada et al., 2019). The allometric relationship observed here between TLE and Vinter means that small colonies create interstitial space at a slower rate than larger colonies. This may slow restoration of the ecological function of A. cervicornis reefs if colonies are not able to reach large sizes due to natural breakage (Tunnicliffe, 1981; Madin et al., 2014) in addition to intrinsic negative scaling that can limit the overall size of an otherwise healthy coral (Dornelas et al., 2017). Negative allometric relationships can also impact morphological growth. Allometry in colony geometry and volume (Zawada et al., 2019) indicate that growth in higher order traits has the potential to plateau or regress as coral size increases. Changes in colony shape and geometry would result in shifts of ecological functionality over colony size ranges. The complex growth dynamics influenced by positive and negative allometry underscore the need to track various forms of morphological growth to understand the ecological consequences (Lesser et al., 1994; Agudo-Adriani et al., 2016; Chan et al., 2016), a need which can be met by 3D photogrammetry.
The remaining correlations between TLE and SA or V in A. cervicornis were explained by linear functions; however, the strength of these relationships decreased over the second 6 months. Explanations for this pattern likely include both environmental or genetic variation in allometric relationships. For example, location-specific variation in the relationship between ellipsoid volume and TLE has been reported in A. cervicornis (Huntington and Miller, 2014). Moreover, while intraspecific allometric variation was not found for negative size-dependent growth (Dornelas et al., 2017), an extensive body of work has identified genotypic variation in A. cervicornis morphology (Bowden-Kerby, 2008; Kuffner et al., 2017; Lohr and Patterson, 2017; Drury et al., 2019) supporting the potential for intraspecific variation in allometric scaling relationships among traits. Here, colonies representing multiple genotypes were outplanted to multiple reef sites likely to vary in environmental conditions; however, our current dataset lacks the temporal resolution with which to identify patterns of site-specific and intraspecific variation in allometry between TLE and higher order traits. Tracking individuals with high temporal resolution would help capture site-specific and genotypic growth curves spanning multiple size classes. Allometric variation among colonies can also result in varying trait growth relationships within or between reef sites, which could play a role in the weakened among-trait correlations seen in this study. Ultimately, quantifying the potential for allometric variation among individuals is important for understanding the ecology and evolution of populations and species, especially when that variation arises in fitness-related traits, such as growth in coral (Babcock, 1991; Hughes et al., 1992; Álvarez-Noriega et al., 2016).
Predictive Power of Initial Growth
Coral restoration can benefit from reliable predictors of key performance traits that can be used to guide propagation and outplanting of corals with desired traits (van Oppen et al., 2015). We tested the predictive power of initial growth by relating it to growth in subsequent time intervals. Initial growth was weakly correlated with subsequent growth in each morphological trait (τ = 0.35–0.45). This is significantly higher than the predictive power of growth rates measured in an in situ field nursery for growth post-outplant in A. cervicornis (O’Donnell et al., 2018). This suggests that post-outplant growth, rather than nursery growth, can more reliably project the performance of A. cervicornis transplants. However, the moderate correlations seen here, which are similar to the correlations between initial and subsequent growth previously reported for massive species (Edmunds and Putnam, 2020), imply that colony growth is determined by more than just intrinsic growth rate.
One random factor exerting a negative effect on growth in A. cervicornis is fragmentation, or breakage. Breakage is a natural ecological process that can lead to asexual propagation (Tunnicliffe, 1981; Drury et al., 2019), partial mortality, or death (Madin et al., 2014). Breakage was frequent in this study, with 54% of colonies experiencing at least one breakage event over the 1 year monitoring window. The effects of breakage on the predictive power of initial growth in TLE, SA, and Vinter were evident as correlations with subsequent growth improved once broken colonies were removed from models. Interestingly, the exclusion of broken coral resulted in no increase in the predictive power of initial growth in V, suggesting that measures of growth in V may be robust to breakage. Initial growth in V was also the best predictor of subsequent growth in TLE, SA, and Vinter when broken corals were included which may indicate a consistent relationship between the growth in V and growth in other traits. This is similar to the findings of Zawada et al. (2019) who showed that for a variety of coral morphotypes including branching species, colony volume scaled consistently with many higher order traits as colony size increased (i.e., limited allometric scaling).
Seasonality may also play a role in modulating growth rates over time as unexplained variation in subsequent trait growth remained even after accounting for breakage. Morphological traits that respond to environmental changes can result in differences in growth patterns over time that further reduce the predictive power of initial growth. Our study spanned four seasons in the Florida Keys with the first 6 months occurring during roughly Summer and Fall while the second 6 months occurred during Winter and Spring. Seasonal variation in environmental conditions like wave energy, which is dictated by wind speed in the Florida Keys (Ahn et al., 2020), can result in fluctuating selection on different aspects of colony growth. For example, high wave energy increased the number of smaller branches produced in A. cervicornis colonies (Bottjer, 1980), hypothetically increasing TLE, SA, and V but decreasing Vinter if new branches did not extend beyond the initial branch length. Similarly, trade-offs between linear growth and skeletal density were evident in A. cervicornis grown using two grow-out methods (blocks vs. suspended trees) thought to modulate the amount of force exerted on colonies by water movement (Kuffner et al., 2017). Environmental conditions can therefore cause differences in how colonies grow and if environmental conditions are not constant over time, growth in one time period will not be indicative of growth in another. Moreover, Edmunds and Putnam (2020) also noted that the predictive power of initial growth varied by season, further confirming that projections of future growth are complicated by temporal changes in environmental conditions.
Advantages of 3D Photogrammetry
It has been nearly 20 years since 3D models built from photographs were first used in the study of coral (Bythell et al., 2001) and in that time, technological improvements have made 3D photogrammetry a reliable method for exploring complex features of coral and coral reefs. We show that small-scale colony-level 3D photogrammetry yields measures of TLE that have a near-perfect correlation with measures of TLE made by-hand and this backward compatibility allows for seamless transitions between methods. 3D photogrammetry could be adopted at any time during the course of a study without the need to apply a correction factor. Alternatively, high correlations between by-hand and 3D measures ensure that those unable to adopt 3D techniques, such as small non-profit organizations, can continue to use traditional methods while still being able to compare results with novel techniques. Measures of SA and V from 3D models could not be directly compared to traditional measures due to the nature of this experiment; however, previous efforts have confirmed the accuracy of 3D photogrammetry (Figueira et al., 2015; House et al., 2018). In addition to facilitating meta-analysis through backward compatibility, 3D photogrammetry also offers several advantages over traditional measurements in terms of its accuracy and information rich digital record, and the ability to obtain multiple trait measurements using a single method.
While the difference between 3D photogrammetry and traditional methods does increase as the coral increases in size, this is likely due to error in by-hand measurements rather than error in the models. Repeated, independent measurements of 3D models showed high precision, even for the larger, more complex colonies. Moreover, we were able to identify errors that would have otherwise gone undetected in the by-hand dataset through re-reviewing the extensive photographic record. For example, two nearby colonies were wrongly identified due to missing identification tags, but we were able to correctly re-identify these individuals using photographs from previous time points. Additionally, although one colony was identified as an outlier for growth in Vinter over the second 6 months, the photographic record allowed us to verify that this was the result of true biological variation rather than sampling error (Supplementary Figure 8). 3D photogrammetry also allowed us to measure individual colonies even after a dislodged colony became intertwined with the focal colony (Supplementary Figure 9), which would have been impossible to accurately measure by-hand. Despite the advantages of 3D photogrammetry, its application in large scale projects remains hampered by hurdles in downstream image and model processing procedures.
Beyond in situ image acquisition, 3D photogrammetry requires additional computational effort which can limit the overall adoption of this technology. Model building software, such as Agisoft Metashape, require large amounts of processing power and time. While the graphical user interface of these programs can be straightforward, in the absence of a dedicated computer 3D model building can be difficult to upscale. Agisoft Metashape also has a command line-based interface that can be run remotely on high-power computing (HPC) systems making model building high-throughput for those with coding knowledge and access to such machines. We sought to lower the accessibility barrier to high-throughput 3D photogrammetry by providing directions and scripts for using Agisoft Metashape on remote HPC systems. This experiment relied on a personally managed remote system but increasing availability of pay-as-you-go cloud computing services are viable alternatives for researchers wanting to increase processing power for 3D model building without the need to purchase and maintain a dedicated computing system.
Broader Applications
The advent of 3D photogrammetry has facilitated investigation of new traits without the need for additional effort in the field or destructive sampling. Traits such as “compactness,” “top-heaviness” (Zawada et al., 2019), and “proportion occupied” (Doszpot et al., 2019) quantify complex, ecologically relevant aspects of colony morphology that can easily be accessed using digital 3D models. For example, Vinter quantifies the absolute amount of space created between the branches of a coral, similar to shelter volume (Urbina-Barreto et al., 2020). Interstitial space provides important habitat for reef fishes (Wilson et al., 2008; Noonan et al., 2012; Urbina-Barreto et al., 2020) helping to maintain populations (Wilson et al., 2008; Graham, 2014). The volume of interstitial space also influences the physical environment of a colony, as it can result in pockets of reduced flow (Reidenbach et al., 2006). This affects tissue boundary-layer conditions for heat transfer and pH buffering, which influence bleaching and calcification rate (Chan et al., 2016; Stocking et al., 2018). Because Vinter exponentially increases with TLE, the ecological functions associated with Vinter are also amplified by marginal increases in linear extension. Additionally, large scale experiments addressing local adaption, phenotypic plasticity, and trade-offs in these newly accessible traits are now feasible with high-throughput 3D photogrammetry. Studies requiring large sample sizes, such as those exploring genotype and environment relationships in A. cervicornis and A. palmata, could be implemented immediately and would produce valuable information for restoration programs.
Here, we show that 3D photogrammetry can be applied efficiently to large sample sizes, but we acknowledge that the colonies used in this study were small relative to the maximum size A. cervicornis colonies can reach. However, the success in modeling complex structures like those seen in Supplementary Figure 9 highlight the potential of 3D photogrammetry to capture increasingly complex morphologies by simply taking more photographs in situ (Supplementary Figure 4). Furthermore, the use of 3D photogrammetry in studies of densely branched species (Doszpot et al., 2019) provide further confidence this technology can maintain accuracy while improving trait accessibility for research and restoration.
Colony-level 3D photogrammetry could also serve restoration practitioners who seek more detailed information on outplant performance. For example, the tracking of individuals can identify reef sites or genotypes that cultivate large interstitial space crucial for fish habitat (Wilson et al., 2008; Noonan et al., 2012; Urbina-Barreto et al., 2020) ultimately helping to strategize restoration efforts. While reef-scape 3D photogrammetry (McKinnon et al., 2011; Burns et al., 2015; Leon et al., 2015) may prove more effective for tracking restoration outcomes in terms of percent cover and ecosystem complexity, colony-level methods could be used to ground-truth the lower resolution photogrammetry that practitioners employ over hundreds of square meters to determine if accurate measures of colony-level phenotype can be obtained from this coarser method. While 3D photogrammetry (at both large and fine-scales) has yet to become a common tool in restoration, its potential for data collection, its methodological simplicity in the field, and recently improved accessibility of post-processing methods have set the stage for its utility. Taken together, colony-level 3D photogrammetry is a powerful tool for investigating organismal processes such as phenotypic plasticity and ecosystem-level patterns that could prove vital for restoration efforts.
Data Availability Statement
The datasets presented in this study can be found in online repositories. The names of the repository/repositories and accession number(s) can be found below: https://github.com/wyattmillion/Frontiers3Dmorphology.
Author Contributions
WM and CK conceived, designed the study, and coded the pipeline and built 3D models. WM was responsible for in situ coral photography, conducted analysis, and drafted the initial manuscript. EB completed by-hand TLE measurement of coral and coordinated all diving operations. WM and SO’D prepared images for 3D construction and analyzed 3D models for precision metrics and coral traits. All authors contributed to discussions, interpretations, and writing. All authors read and approved the submitted version.
Funding
Funding for this study was provided by the NOAA Coral Reef Conservation Program grant NA17NOS4820084.
Conflict of Interest
The authors declare that the research was conducted in the absence of any commercial or financial relationships that could be construed as a potential conflict of interest.
Acknowledgments
We are grateful to Maria Ruggeri, Yingqi Zhang, Hunter Ramo, Cory Walter, Joseph Kuehl, and Cory Krediet for their help photographing coral in situ. Phoebe Chang contributed to image preprocessing and Alexandra Stella and Aryana Volk helped with model validation. Elaina Graham generously facilitated access to the Heidelberg Lab high performance computer. All fieldwork was conducted under permits FKNMS-2015-163-A1 and FKNMS-2018-035.
Supplementary Material
The Supplementary Material for this article can be found online at: https://www.frontiersin.org/articles/10.3389/fmars.2021.646475/full#supplementary-material
References
Agudo-Adriani, E. A., Cappelletto, J., Cavada-Blanco, F., and Croquer, A. (2016). Colony geometry and structural complexity of the endangered species acropora cervicornis partly explains the structure of their associated fish assemblage. PeerJ 4:e1861. doi: 10.7717/peerj.1861
Ahn, S., Haas, K. A., and Neary, V. S. (2020). Dominant wave energy systems and conditional wave resource characterization for coastal waters of the united states. Energies 13:3041. doi: 10.3390/en13123041
Alvarez-Filip, Y., Dulvy, N. K., Gill, J. A., Côté, I. M., and Watkinson, A. R. (2009). Flattening of caribbean coral reefs: region-wide declines in architectural complexity. Proc. Biol. Sci. 276, 3019–3025. doi: 10.1098/rspb.2009.0339
Álvarez-Noriega, M., Baird, A. H., Dornelas, M., Madin, J. S., Cumbo, V. R., and Connolly, S. R. (2016). Fecundity and the demographic strategies of coral morphologies. Ecology 97, 3485–3493. doi: 10.1002/ecy.1588
Babcock, R. C. (1991). Comparative demography of three species of scleractinian corals using age- and size-dependent classifications. Ecol. Monogr. 61, 225–255. doi: 10.2307/2937107
Bottjer, D. J. (1980). Branching morphology of the reef coral acropora cervicornis in different hydraulic regimes. J. Paleontol. 54, 1102–1107.
Bowden-Kerby, A. (2008). “Restoration of threatened acropora cervicornis corals: intraspecific variation as a factor in mortality, growth, and self-attachment,” in Proceedings of the 11th International Coral Reef Symposium, 2:1200–1204 (Norfolk, VA: NSU).
Bruno, J. F., and Edmunds, P. J. (1997). Clonal variation for phenotypic plasticity in the coral madracis mirabilis. Ecology 78, 2177–2190. doi: 10.2307/2265954
Burns, J., Delparte, D., Gates, R. D., and Takabayashi, M. (2015). Integrating structure-from-motion photogrammetry with geospatial software as a novel technique for quantifying 3D ecological characteristics of coral reefs. PeerJ 3:e1077. doi: 10.7717/peerj.1077
Bythell, J., Pan, P., and Lee, J. (2001). Three-dimensional morphometric measurements of reef corals using underwater photogrammetry techniques. Coral Reefs 20, 193–199. doi: 10.1007/s003380100157
Chan, N. C., Wangpraseurt, D., Kühl, M., and Connolly, S. R. (2016). Flow and coral morphology control coral surface pH: implications for the effects of ocean acidification. Front. Mar. Sci. 16:10.
Cignoni, P., Callieri, M., Corsini, M., Dellepiane, M., Ganovelli, F., and Ranzuglia, G. (2008). “MeshLab: an open-source mesh processing tool,” in Proceedings of the Sixth Eurographics Italian Chapter Conference (Sweden: Eurographics Association).
Coker, D. J., Wilson, S. K., and Pratchett, M. S. (2014). Importance of live coral habitat for reef fishes. Rev. Fish Biol. Fish. 24, 89–126. doi: 10.1007/s11160-013-9319-5
Cunning, R., Gillette, P., Capo, T., Galvez, K., and Baker, A. C. (2015). Growth tradeoffs associated with thermotolerant symbionts in the coral pocillopora damicornis are lost in warmer oceans. Coral Reefs 34, 155–160. doi: 10.1007/s00338-014-1216-4
D’Urban Jackson, T., Williams, G. J., Walker-Springett, G., and Davies, A. J. (2020). Three-dimensional digital mapping of ecosystems: a new era in spatial ecology. Proc. Biol. Sci. 287:20192383. doi: 10.1098/rspb.2019.2383
Davies, P. S. (1989). Short-term growth measurements of corals using an accurate buoyant weighing technique. Mar. Biol. 101, 389–395. doi: 10.1007/bf00428135
Denis, V., Ribas-Deulofeu, L., Sturaro, N., Kuo, C. Y., and Chen, C. A. (2017). A Functional approach to the structural complexity of coral assemblages based on colony morphological features. Sci. Rep. 7:9849.
Dennison, W. C., and Barnes, D. J. (1988). Effect of water motion on coral photosynthesis and calcification. J. Exp. Mar. Biol. Ecol. 115, 67–77. doi: 10.1016/0022-0981(88)90190-6
Dornelas, M., Madin, J. S., Baird, A. H., and Connolly, S. R. (2017). “Allometric growth in reef-building corals,” in Proceedings of the Royal Society B: Biological Sciences, 284. doi: 10.1098/rspb.2017.0053
Doszpot, N., McWilliam, M., Pratchett, M., Hoey, A., and Figueira, W. (2019). Plasticity in three-dimensional geometry of branching corals along a cross-shelf gradient. Diversity 11:44. doi: 10.3390/d11030044
Drury, C., Greer, J. B., Baums, I., Gintert, B., and Lirman, D. (2019). Clonal diversity impacts coral cover in acropora cervicornis thickets: potential relationships between density, growth, and polymorphisms. Ecol. Evol. 9, 4518–4531. doi: 10.1002/ece3.5035
Drury, C., Manzello, D., and Lirman, D. (2017). Genotype and local environment dynamically influence growth, disturbance response and survivorship in the threatened coral, acropora cervicornis. PLoS One 12:e0174000. doi: 10.1371/journal.pone.0174000
Edmunds, P. J. (2017). Intraspecific variation in growth rate is a poor predictor of fitness for reef corals. Ecology 98, 2191–2200. doi: 10.1002/ecy.1912
Edmunds, P. J., and Putnam, H. M. (2020). Science-based approach to using growth rate to assess coral performance and restoration outcomes. Biol. Lett. 16:20200227. doi: 10.1098/rsbl.2020.0227
Félix-Burruel, R. E., Larios, E., Bustamante, E., and Búrquez, A. (2019). Nonlinear modeling of saguaro growth rates reveals the importance of temperature for size-dependent growth. Am. J. Bot. 106, 1300–1307. doi: 10.1002/ajb2.1358
Ferrari, R., Figueira, W. F., Pratchett, M. S., Boube, T., Adam, A., Kobelkowsky-Vidrio, T., et al. (2017). 3D photogrammetry quantifies growth and external erosion of individual coral colonies and skeletons. Sci. Rep. 7:16737.
Figueira, W. F., Ferrari, R., Weatherby, E., Porter, A., Hawes, S., and Byrne, M. (2015). Accuracy and precision of habitat structural complexity metrics derived from underwater photogrammetry. Remote Sens. 7, 16883–16900. doi: 10.3390/rs71215859
Graham, N. A. J. (2014). Habitat complexity: coral structural loss leads to fisheries declines. Curr. Biol. 24, R359–R361.
Graham, N. A. J., and Nash, K. L. (2013). The importance of structural complexity in coral reef ecosystems. Coral Reefs 32, 315–326. doi: 10.1007/s00338-012-0984-y
Herler, J., and Dirnwöber, M. (2011). A simple technique for measuring buoyant weight increment of entire, transplanted coral colonies in the field. J. Exp. Mar. Biol. Ecol. 407, 250–255. doi: 10.1016/j.jembe.2011.06.022
Hernández-Landa, R. C., Barrera-Falcon, E., and Rioja-Nieto, R. (2020). Size-frequency distribution of coral assemblages in insular shallow reefs of the mexican caribbean using underwater photogrammetry. PeerJ 8:e8957. doi: 10.7717/peerj.8957
Hippel, E. V., and Krogh, G. V. (2003). Open source software and the ‘private-collective’ innovation model: issues for organization science. Organ. Sci. 14, 209–223. doi: 10.1287/orsc.14.2.209.14992
House, J. E., Brambilla, V., Bidaut, L. M., Christie, A. P., Pizarro, O., Madin, J. S., et al. (2018). Moving to 3D: relationships between coral planar area, surface area and volume. PeerJ 6:e4280. doi: 10.7717/peerj.4280
Hughes, T. P., Ayre, D., and Connell, J. H. (1992). The evolutionary ecology of corals. Trends Ecol. Evol. 7, 292–295. doi: 10.1016/0169-5347(92)90225-z
Huntington, B. E., and Miller, M. W. (2014). Location-specific metrics for rapidly estimating the abundance and condition of the threatened coral acropora cervicornis. Restor. Ecol. 22, 299–303. doi: 10.1111/rec.12057
Jimenez, I. M., Kühl, M., Larkum, A. W. D., and Ralph, P. J. (2011). Effects of flow and colony morphology on the thermal boundary layer of corals. J. R. Soc. Interface 8, 1785–1795. doi: 10.1098/rsif.2011.0144
Johnson, M. E., Lustic, C., Bartels, E., Baums, I. B., Gilliam, D. S., Larson, E. A., et al. (2011). Caribbean Acropora Restoration Guide: Best Practices for Propagation and Population Enhancement. Arlington, VA: The Nature conservancy.
Jokiel, P. L., Maragos, J. E., and Franzisket, L. (1978). “Coral growth: buoyant weight technique,” in Monographs on Oceanographic Methodology, UNESCO.Coral Reefs: Research Methods, eds D. R. Stoddart and R. E. Johannes (Paris: UNESCO).
Jones, A., and Berkelmans, R. (2010). Potential costs of acclimatization to a warmer climate: growth of a reef coral with heat tolerant vs. sensitive symbiont types. PloS One 5:e10437. doi: 10.1371/journal.pone.0010437
Kenkel, C. D., Setta, S. P., and Matz, M. V. (2015). Heritable differences in fitness-related traits among populations of the mustard hill coral, porites astreoides. Heredity 115, 509–516.
Kiel, C., Huntington, B. E., and Miller, M. W. (2012). Tractable field metrics for restoration and recovery monitoring of staghorn coral acropora cervicornis. Endanger. Species Res. 19, 171–176. doi: 10.3354/esr00474
Kuffner, I. B., Bartels, E., Stathakopoulos, A., Enochs, I. C., Kolodziej, G., Toth, L. T., et al. (2017). Plasticity in skeletal characteristics of nursery-raised staghorn coral, acropora cervicornis. Coral Reefs 36, 679–684. doi: 10.1007/s00338-017-1560-2
Lange, I. D., and Perry, C. T. (2020). A quick, easy and non-invasive method to quantify coral growth rates using photogrammetry and 3D model comparisons. Methods Ecol. Evol. 11, 714–726. doi: 10.1111/2041-210x.13388
Lavy, A., Eyal, G., Neal, B., Keren, R., Loya, Y., and Ilan, M. (2015). A quick, easy and non-intrusive method for underwater volume and surface area evaluation of benthic organisms by 3d computer modelling. Methods Ecol. Evol. 6, 521–531. doi: 10.1111/2041-210x.12331
Leon, J. X., Roelfsema, C. M., Saunders, M. I., and Phinn, S. R. (2015). Measuring coral reef terrain roughness using ‘structure-from-motion’ close-range photogrammetry. Geomorphology 242, 21–28. doi: 10.1016/j.geomorph.2015.01.030
Lesser, M. P., Weis, V. M., Patterson, M. R., and Jokiel, P. L. (1994). Effects of morphology and water motion on carbon delivery and productivity in the reef coral, pocillopora damicornis (linnaeus): diffusion barriers, inorganic carbon limitation, and biochemical plasticity. J. Exp. Mar. Biol. Ecol. 178, 153–179. doi: 10.1016/0022-0981(94)90034-5
Lines, E. R., Zavala, M. A., Purves, D. W., and Coomes, D. A. (2012). Predictable changes in aboveground allometry of trees along gradients of temperature, aridity and competition. Global Ecol. Biogeogr. J. Macroecol. 21, 1017–1028. doi: 10.1111/j.1466-8238.2011.00746.x
Lirman, D., Schopmeyer, S., Galvan, V., Drury, C., Baker, A. C., and Baums, I. B. (2014). Growth dynamics of the threatened caribbean staghorn coral acropora cervicornis: influence of host genotype, symbiont identity, colony size, and environmental setting. PLoS One 9:e107253. doi: 10.1371/journal.pone.0107253
Lohr, K. E., and Patterson, J. T. (2017). Intraspecific variation in phenotype among nursery-reared staghorn coral acropora cervicornis (Lamarck, 1816). J. Exp. Mar. Biol. Ecol. 486, 87–92. doi: 10.1016/j.jembe.2016.10.005
Lohr, K. E., Bejarano, S., Lirman, D., Schopmeyer, S., and Manfrino, C. (2015). Optimizing the productivity of a coral nursery focused on staghorn coral acropora cervicornis. Endanger. Species Res. 27, 243–250. doi: 10.3354/esr00667
Lugo-Fernández, A., Roberts, H. H., Wiseman Jr., and Wj. (1998). Tide effects on wave attenuation and wave set-up on a caribbean coral reef. Estuar. Coast. Shelf Sci. 47, 385–393. doi: 10.1006/ecss.1998.0365
Madin, J. S., Baird, A. H., Dornelas, M., and Connolly, S. R. (2014). Mechanical vulnerability explains size-dependent mortality of reef corals. edited by howard cornell. Ecol. Lett. 17, 1008–1015. doi: 10.1111/ele.12306
McCullough, E. L., Ledger, K. J., O’Brien, D. M., and Emlen, D. J. (2015). Variation in the allometry of exaggerated rhinoceros beetle horns. Anim. Behav. 109, 133–140. doi: 10.1016/j.anbehav.2015.08.013
McKinnon, D., He, H., Upcroft, B., and Smith, R. N. (2011). Towards Automated and in-Situ, Near-Real Time 3-D Reconstruction of Coral Reef Environments. Piscataway, NJ: IEEE.
Miller, M., Bourque, A., and Bohnsack, J. (2002). An analysis of the loss of acroporid corals at looe key, Florida, USA: 1983–2000. Coral Reefs 21, 179–182.
Newson, R. (2002). Parameters behind ‘nonparametric’ statistics: kendall’s tau, somers’ d and median differences. Stata J. Promot. Commun. Stat. Stata 2, 45–64.
Noonan, S. H. C., Jones, G. P., and Pratchett, M. S. (2012). Coral size, health and structural complexity: effects on the ecology of a coral reef damselfish. Mar. Ecol. Prog. Ser. 456, 127–137.
O’Donnell, K. E., Lohr, K. E., Bartels, E., and Patterson, J. T. (2017). Evaluation of staghorn coral (Acropora cervicornis, Lamarck 1816) production techniques in an ocean-based nursery with consideration of coral genotype. J. Exp. Mar. Biol. Ecol. 487, 53–58. doi: 10.1016/j.jembe.2016.11.013
O’Donnell, K. E., Lohr, K. E., Bartels, E., Baums, I. B., and Patterson, J. T. (2018). Acropora cervicornis genet performance and symbiont identity throughout the restoration process. Coral Reefs 37, 1109–1118.
Parkinson, J. E., Baker, A. C., Baums, I. B., Davies, S. W., Grottoli, A. G., Kitchen, S. A., et al. (2020). Molecular tools for coral reef restoration: beyond biomarker discovery. Conserv. Lett. 13:e12687. doi: 10.1111/conl.12687
Pratchett, M. S., Anderson, K. D., Hoogenboom, M. O., Widman, E., Baird, A. H., Pandolfi, J. M., et al. (2015). Spatial, temporal and taxonomic variation in coral growth—implications for the structure and function of coral reef ecosystems. Oceanogr. Mar. Biol. 53, 215–295.
R Core Team (2020). R: A Language and Environment for Statistical Computing. Vienna: R Foundation for Statistical Computing. Available online at: https://www.R-project.org/.
Reidenbach, M. A., Koseff, J. R., Monismith, S. G., Steinbuckc, J. V., and Genin, A. (2006). The effects of waves and morphology on mass transfer within branched reef corals. Limnol. Oceanogr. 51, 1134–1141.
Rinkevich, B. (1995). Restoration strategies for coral reefs damaged by recreational activities: the use of sexual and asexual recruits. Restor. Ecol. 3, 241–251.
Risk, M. J. (1972). Fish diversity on a coral reef in the Virgin Islands. Atoll Res. Bull. 153, 1–4.
Stimson, J., and Kinzie, R. (1991). The temporal pattern and rate of release of zooxanthellae from the reef coral pocillopora damicornis (Linnaeus) under nitrogen-enrichment and control conditions. J. Exp. Mar. Biol. Ecol. 153, 63–74.
Stocking, J. B., Laforsch, C., Sigl, R., and Reidenbach, M. A. (2018). The role of turbulent hydrodynamics and surface morphology on heat and mass transfer in corals. J. R. Soc. Interface 15:20180448.
Szmant, A. M. (1997). Nutrient effects on coral reefs: a hypothesis on the importance of topographic and trophic complexity to reef nutrient dynamics. in Proceedings of the 8th International Coral Reef Symposium. Panama: Tropical Research Institute
Todd, P. A. (2008). Morphological plasticity in scleractinian corals. Biol. Rev. Camb. Philos. Soc. 83, 315–337.
Tunnicliffe, V. (1981). Breakage and propagation of the stony coral acropora cervicornis. Proc. Natl. Acad. Sci. USA 78, 2427–2431.
Urbina-Barreto, I., Chiroleu, F., Pinel, R., Fréchon, L., Mahamadaly, V., Elise, S., et al. (2020). Quantifying the shelter capacity of coral reefs using photogrammetric 3D modeling: from colonies to reefscapes. Ecol. Indic. 121:107151.
van Oppen, M. J. H., Oliver, J. K., Putnam, H. M., and Gates, R. D. (2015). Building coral reef resilience through assisted evolution. Proc. Natl. Acad. Sci. USA 112, 2307–2313.
Veal, C. J., Carmi, M., Fine, M., and Hoegh-Guldberg, O. (2010). Increasing the accuracy of surface area estimation using single wax dipping of coral fragments. Coral Reefs 29, 893–897.
Ware, M., Garfield, E. N., Nedimyer, K., Levy, J., Kaufman, L., Precht, W., et al. (2020). Survivorship and growth in staghorn coral (Acropora Cervicornis) outplanting projects in the florida keys national marine sanctuary. PLoS One 15:e0231817.
Wesselingh, R. A., Klinkhamer, P. G. L., De Jong, T. J., and Boorman, L. A. (1997). Threshold size for flowering in different habitats: effects of size-dependent growth and survival. Ecology 78, 2118– 2132.
West, G. B., Brown, J. H., and Enquist, B. J. (1997). A general model for the origin of allometric scaling laws in biology. Science 276, 122–126. doi: 10.1126/science.276.5309.122
Wilson, S. K., Burgess, S. C., Cheal, A. J., Emslie, M., Fisher, R., Miller, I., et al. (2008). Habitat utilization by coral reef fish: implications for specialists vs. generalists in a changing environment. J. Anim. Ecol. 77, 220–228.
Young, C. N., Schopmeyer, S. A., and Lirman, D. (2012). A review of reef restoration and coral propagation using the threatened genus acropora in the caribbean and Western Atlantic. Bull. Mar. Sci. 88, 1075–1098.
Zawada, D. G., Piniak, G. A., and Hearn, C. J. (2010). Topographic complexity and roughness of a tropical benthic seascape. Geophys. Res. Lett. 37:L14604.
Keywords: coral, morphology, 3D photogrammetry, Acropora cervicornis, TLE, volume, surface area, allometry
Citation: Million WC, O’Donnell S, Bartels E and Kenkel CD (2021) Colony-Level 3D Photogrammetry Reveals That Total Linear Extension and Initial Growth Do Not Scale With Complex Morphological Growth in the Branching Coral, Acropora cervicornis. Front. Mar. Sci. 8:646475. doi: 10.3389/fmars.2021.646475
Received: 27 December 2020; Accepted: 23 March 2021;
Published: 16 April 2021.
Edited by:
Manuel Gonzalez-Rivero, Australian Institute of Marine Science (AIMS), AustraliaReviewed by:
Aldo Cróquer, The Nature Conservancy, Dominican RepublicZac H. Forsman, University of Hawaii at Manoa, United States
Copyright © 2021 Million, O’Donnell, Bartels and Kenkel. This is an open-access article distributed under the terms of the Creative Commons Attribution License (CC BY). The use, distribution or reproduction in other forums is permitted, provided the original author(s) and the copyright owner(s) are credited and that the original publication in this journal is cited, in accordance with accepted academic practice. No use, distribution or reproduction is permitted which does not comply with these terms.
*Correspondence: Wyatt C. Million, d21pbGxpb25AdXNjLmVkdQ==