
94% of researchers rate our articles as excellent or good
Learn more about the work of our research integrity team to safeguard the quality of each article we publish.
Find out more
ORIGINAL RESEARCH article
Front. Mar. Sci., 12 March 2021
Sec. Physical Oceanography
Volume 8 - 2021 | https://doi.org/10.3389/fmars.2021.640535
This article is part of the Research TopicImpact of Deep Oceanic Processes on Circulation and Climate Variability: Examples from the Mediterranean Sea and the Global OceanView all 17 articles
 Manuel Vargas-Yáñez1*
 Mélanie Juza2
 M. Carmen García-Martínez1
 Francina Moya1
 Rosa Balbín3
 Enrique Ballesteros1María Muñoz1Elena Tel4Josep Pascual5
 Pedro Vélez-Belchí6Jordi Salat5
The analysis of a 24-year time series of Conductivity-Temperature-Depth (CTD) casts collected in the Balearic Channels (1996–2019) has allowed detecting and quantifying long-term changes in water mass properties in the Western Mediterranean. For the complete period, the intermediate waters have experienced warming and salting at rates of 1.4°C/100yr and 0.3–0.6/100yr for the Western Intermediate Water, and 1°C/100yr and 0.3–0.4/100yr for the Levantine Intermediate Water. The density of these two water masses has not changed. The deep waters, defined as those denser than 29.1 kg/m3, showed positive trends in temperature, salinity, and density (0.8°C/100yr, 0.2/100yr, and 0.02 kg.m–3/100yr, respectively). The high temporal variability of the upper layer makes the detection of long-term changes more difficult. Nevertheless, combining CTD data with temperature data from the oceanographic station at L’Estartit and simulated data from the NCEP/NCAR reanalysis, it can be established that the Atlantic Water increased its temperature at a rate of 2.1–2.8°C/100yr and likely its salinity at a rate of 0.6/100yr. The water column absorbed heat at a rate equivalent to 1–1.2 W/m2. All these trends are much higher than those reported in previous works (more than double in some cases). The warming of the water column produced an increase in the thermosteric component of sea level. However, this increase was compensated by the decrease in the halosteric component. Besides these changes, other alterations related to the Western Mediterranean Transition have been observed over shorter periods. The temperature and salinity of the intermediate waters increased before the winter of 2004/2005 and then the temperature and salinity of the deep waters increased dramatically in 2005. The density of the deep water reached values unprecedented before 2005. Deep and intermediate waters were uplifted by the presence of such dense deep waters. The arrival of warmer and saltier intermediate waters from the Eastern Mediterranean is also observed, mainly after 2010.
From the beginnings of modern oceanography in the Mediterranean Sea (Nielsen, 1912) and during most of the twentieth century, it was accepted the existence of an equilibrium between the heat and freshwater fluxes through the sea surface and the heat and water transports at the Strait of Gibraltar. At the same time, it was considered that the total salt content of the Mediterranean Sea was constant as a result of a zero net salt flux at the Gibraltar Strait (Bethoux, 1979). However, this picture has changed since, at least, the beginning of the 1990s decade, when the comparison of temperature and salinity data collected during the twentieth century showed warming and salting of the intermediate and deep waters (Bethoux et al., 1990; Rohling and Bryden, 1992; Vargas-Yáñez et al., 2010, 2017). According to these works, this process was accelerated during the second part of the twentieth century. Atlantic waters flowing at the upper layer of the Mediterranean Sea also experienced an intense warming since the beginning of the 1970s (Nykjaer, 2009; Skliris et al., 2012; Salat et al., 2019). The warming of the Mediterranean Sea simply reflects the behavior of the global ocean which has absorbed more than 90% of the heat gained by the Earth as a consequence of global warming (Rhein et al., 2013). The salting of the Mediterranean Sea is associated with the increase of the net evaporation (evaporation minus precipitation and river run-off) during the twentieth century and the beginning of the twenty-first. Therefore, it cannot be considered that the water volume and the salt content of the Mediterranean Sea are in an equilibrium state expressed by the Knudsen equations (Borghini et al., 2014). Neither it can be considered that the net heat loss through the sea surface balances the transport of heat through the Strait of Gibraltar (Jordà et al., 2017). There are some uncertainties concerning the future evolution of the salinity of those waters formed within the Mediterranean Sea (hereafter Mediterranean Waters, MWs), because of the possible influence of Arctic ice melting (Jordà et al., 2017). Nevertheless, most of the ocean climate projections show an intense increase in the salinity and temperature of the Mediterranean during the twenty-first century (Somot et al., 2006; Adloff et al., 2015) as a result of a higher net evaporation rate (Sanchez-Gomez et al., 2009; Mariotti et al., 2015), and a reduction of the net heat loss to the atmosphere (Somot et al., 2008; Dubois et al., 2012; Jordà et al., 2017).
Besides these long-term changes linked to global climate change, both the Western and Eastern Mediterranean (WMED and EMED, respectively) have experienced abrupt changes during the end of the twentieth century and the beginning of the twenty-first. Such alterations were caused by shifts in the areas of deep water formation, the main circulation pathways of water masses, or changes in the properties and production rates of intermediate and deep waters. These sharp changes are known as the Eastern Mediterranean Transient (EMT, Roether et al., 1996; Lascaratos et al., 1999; Theocharis et al., 1999), affecting the EMED, and the Western Mediterranean Transition (WMT, López-Jurado et al., 2005; Font et al., 2007; Smith et al., 2008; Schroeder et al., 2010, 2017, 2019), affecting the WMED. It is not clear yet whether these changes will be recurrent in the future and will contribute to shaping the circulation and water mass properties of the Mediterranean Sea permanently. Neither it is clear whether the EMT and WMT are related to the long-term climate change experienced by the Mediterranean region or if they are caused by exceptional episodes of extreme ocean-atmosphere fluxes.
The understanding of these changes requires the analysis of long time series of temperature and salinity. Recent monitoring programs such as Hydrochanges (Schroeder et al., 2013) or MedARGO (Poulain et al., 2007) have considerably contributed to provide the data required for climatic studies in the Mediterranean Sea. However, the data scarcity, mainly before 2010, makes the estimation of long-term changes very sensitive to the data processing methods and increases considerably the uncertainty associated with the estimation of linear trends (Vargas-Yáñez et al., 2010, 2012; Jordá and Gomis, 2013; Llasses et al., 2015). In this context, permanent in situ oceanographic stations are of primary importance, but such stations are very scarce in the Mediterranean Sea. Some of these stations in the WMED are those corresponding to the RADMED monitoring program (see Figure 1) supported by the Instituto Español de Oceanografía (IEO; López-Jurado et al., 2015). This program was initiated in 2007 but includes the oceanographic stations monitored by IEO in the frame of previous projects since 1996 in the Balearic Channels. The availability of long time series of CTD casts at fixed positions over 1996–2019, with a seasonal periodicity, provides the opportunity of detecting and analyzing the changes experienced by the Atlantic and Mediterranean waters in the WMED. The Balearic Channels have been described as a choke point for the exchange of water mass, heat, and salt in the WMED (Heslop et al., 2012; Barceló-Llull et al., 2019; Vargas-Yáñez et al., 2020, this volume). Fresh Atlantic Water (AW) from the Algerian Current can flow northwards through the Mallorca Channel (between Ibiza and Mallorca Islands), whereas severely modified AW flows southwards along the Ibiza Channel (between Ibiza Island and the mainland). The Western Intermediate Water (WIW) can be formed in the Catalan shelf, the Gulf of Lions, the Ligurian Sea, and even around the Balearic Islands during severe winters. This water mass is frequently detected in the Balearic channels. The Levantine Intermediate Water (LIW) flows preferentially through the Ibiza Channel and in some cases, the Western Mediterranean Deep Water (WMDW), formed in the nearby Gulf of Lions, can be found at the bottom layers of this region (Vargas-Yáñez et al., 2020). These features of the circulation and the water masses present in the Balearic Channels, and the long time series of CTD profiles obtained with a constant methodology, make this region an ideal spot for the detection and analysis of water mass changes. This is the objective of the present work: detecting and quantifying changes in the water masses of the WMED, discussing such changes in the present context of climate change and in light of the recent dynamics of the WMT. The impact of the temperature and salinity variations on the sea level of this region will also be addressed.
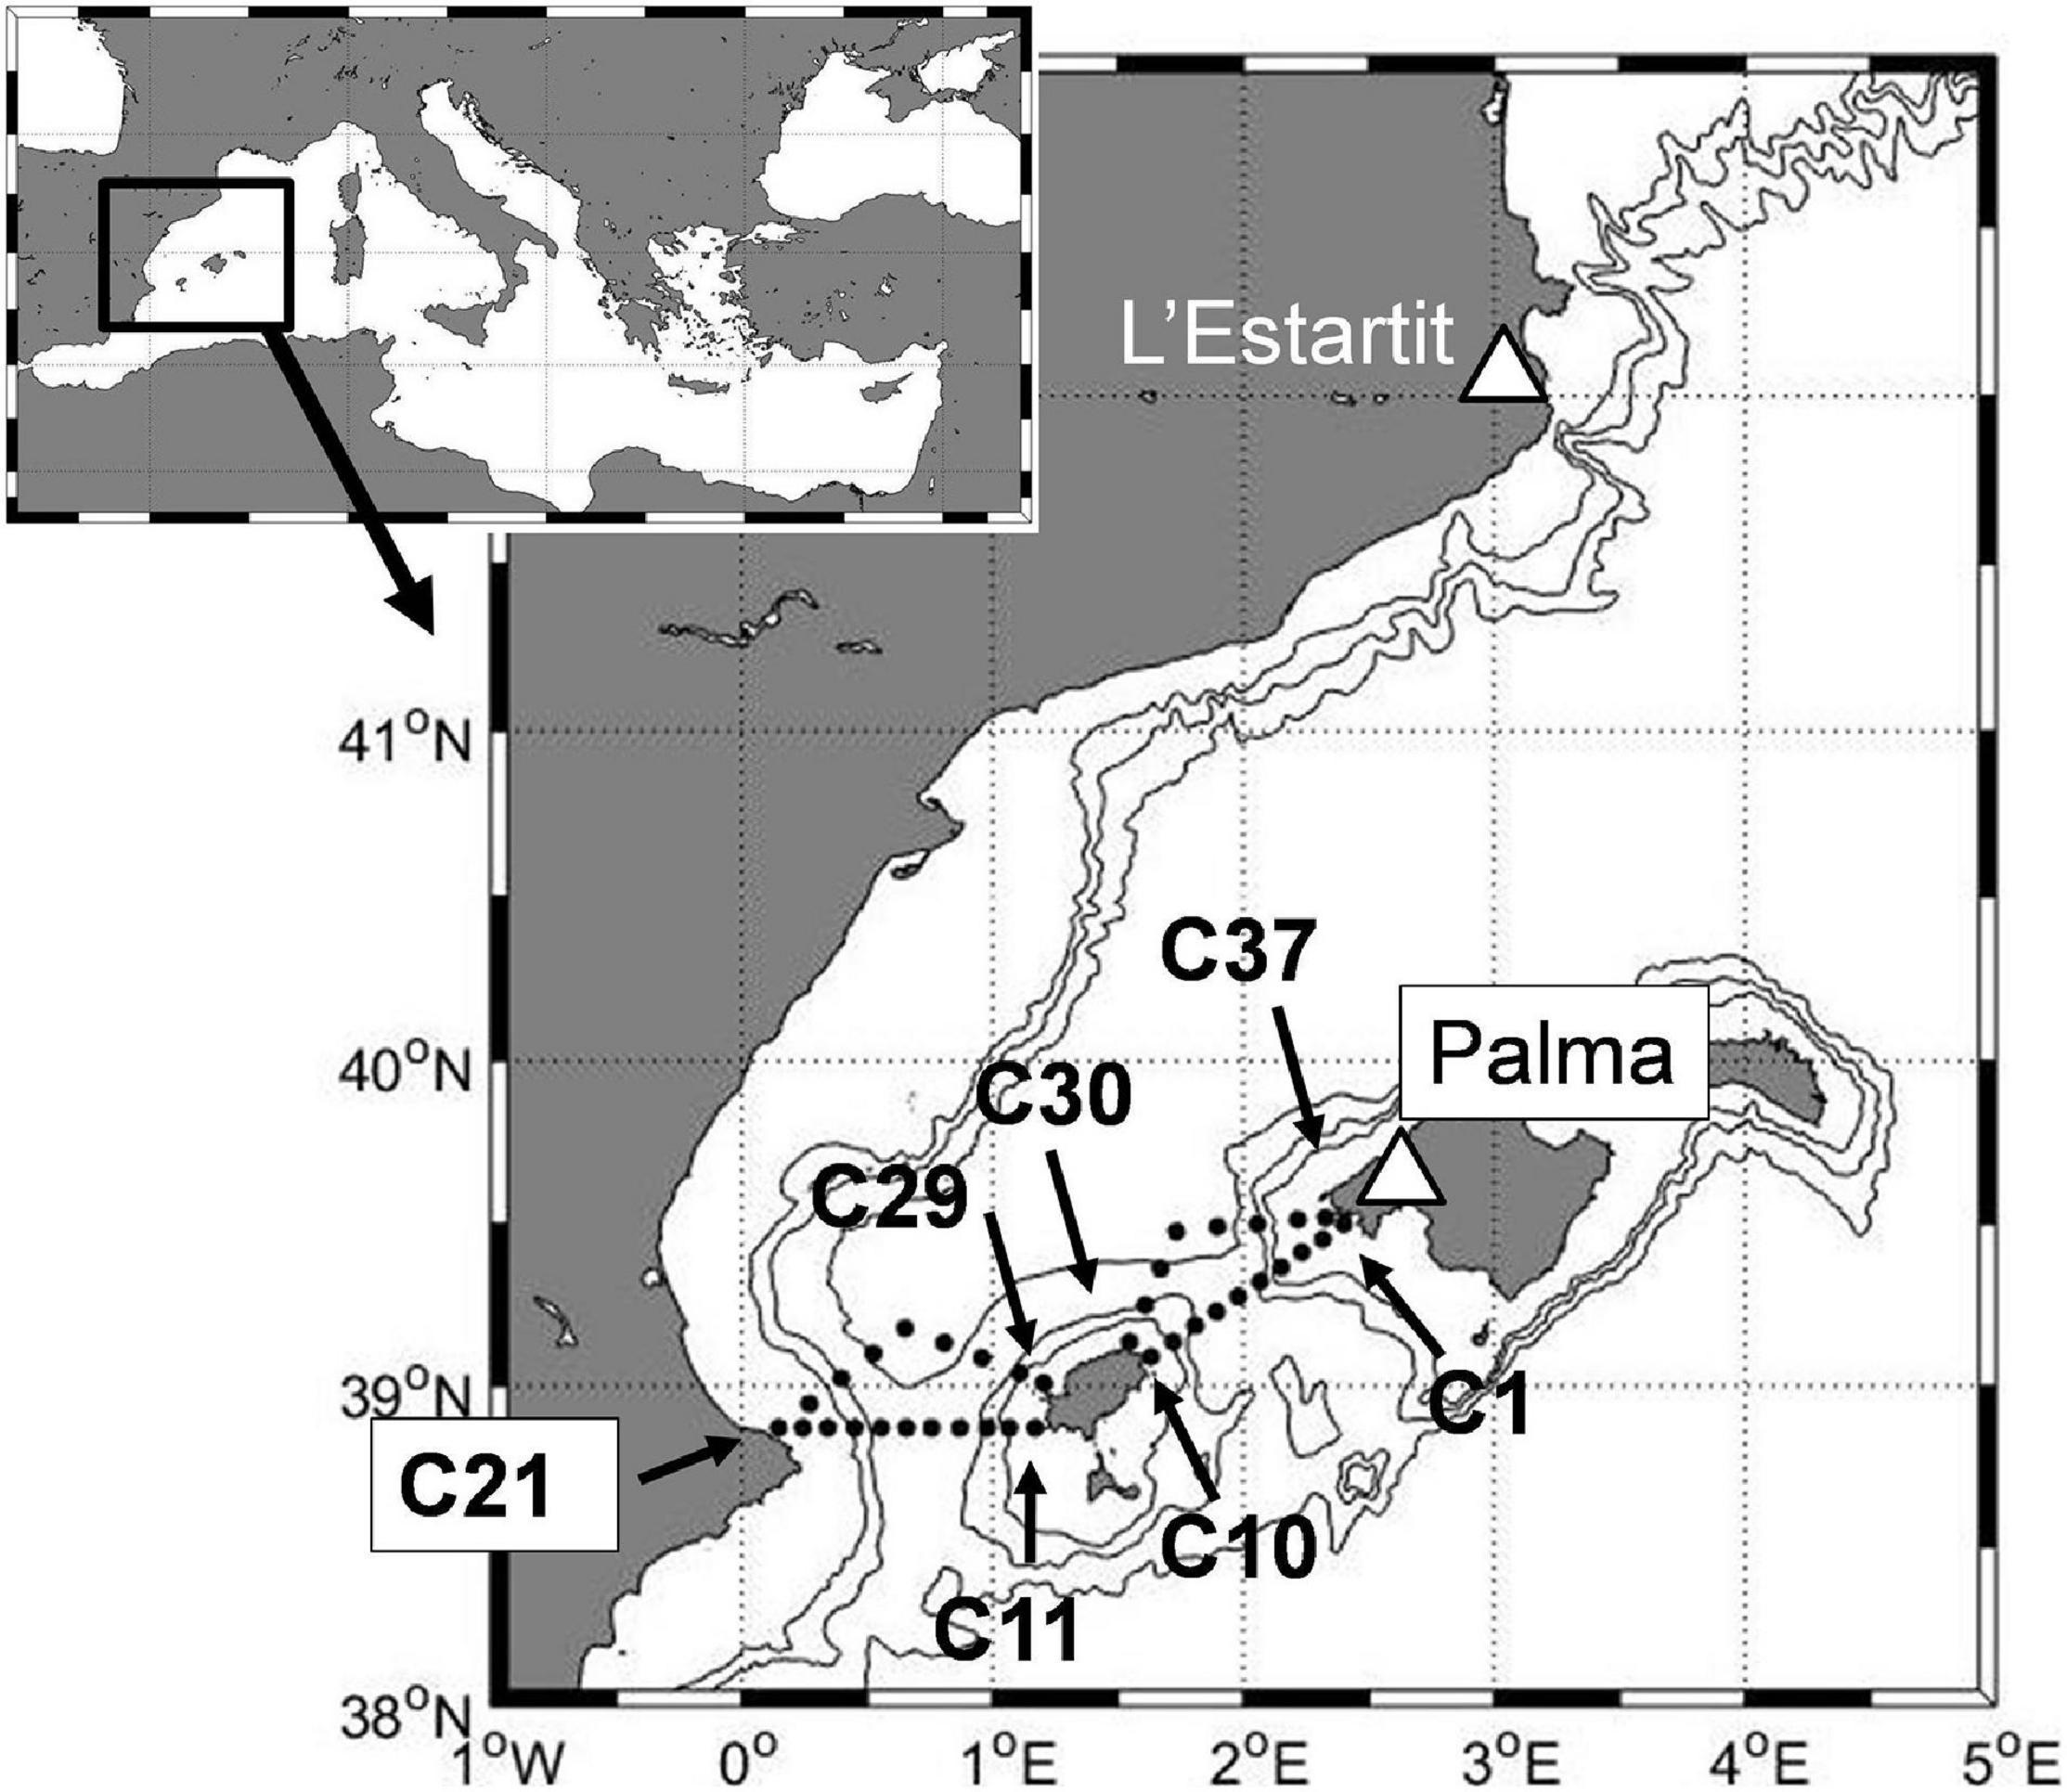
Figure 1. Position of the stations monitored from 1996 to 2019 in the frame of the CANALES, CIRBAL, and RADMED projects. These stations are distributed along four sections: Mallorca South (stations C1–C10), Ibiza South (C11–C21), Ibiza North (C21–C29), and Mallorca North (C30–C37). The Mallorca South and North sections form the Mallorca Channel triangle and the Ibiza South and North form the Ibiza Channel triangle. White triangles show the position of the Palma de Mallorca tide gauge and the position of the L’Estartit coastal station.
Time series of CTD casts were obtained at 37 oceanographic stations regularly distributed in the Mallorca and Ibiza Channels during 71 campaigns from 1996 to 2019 (Figure 1). These campaigns were carried out under the umbrella of three different projects: CANALES (1996–1998), CIRBAL (1999–2006), and RADMED (2007-present). These stations were sampled on a seasonal basis, although numerous gaps are present in the final time series because of the weather conditions or the lack of vessel availability. The dates for each of the 71 campaigns and the project under which each survey was carried out is presented in Vargas-Yáñez et al. (2020). Here, we include this information in Supplementary Table 1 for the completeness of the work. At each station, temperature and salinity profiles were obtained using a CTD, mainly of the model SBE911 and as spare instruments, the models SBE 25 or SBE 19+, installed in a carousel water sampler. The instruments were periodically calibrated by the manufacturer (at least once every 2 years). Besides this, the conductivity sensor was calibrated using the carousel water samples. Calibrations were performed for selected depths of the water column at the beginning and at the end of the campaigns. The spare CTD was cross calibrated with the SBE911 using the carousel at least once every campaign (for more details see López-Jurado et al., 2015).
The oceanographic stations are located in the Balearic Channels, a choke point of the WMED where water mass exchanges occur (Heslop et al., 2012; Juza et al., 2019). The channels can intercept both fresh AW recently advected into the Mediterranean Sea through the Strait of Gibraltar and AW with a higher degree of modification after completing a cyclonic circuit within the WMED. In this region of the WMED, the strongest influence of this water mass is observed at the sea surface and then decreases with depth (The average temperature, salinity and density of the AW at the sea surface in the Balearic Channels are presented in Supplementary Table 2). The 37.5 isohaline is usually considered as the surface of separation between the AW and the MWs in the nearby Alboran Sea. This criterion could also be used for the identification of the AW transported northwards from the Algerian Current, but would not be appropriate for the severely modified AW flowing southwards within the Northern Current. The AW flows at the upper layer above the Western Intermediate Water (WIW) which is found below 100 m (Vargas-Yáñez et al., 2020). Therefore, a possibility is to consider the average properties of the upper 100 m of the water column as representative of the AW. This criterion is somehow subjective and other depth ranges could be chosen. To check if the definition of the upper layer has any influence on the obtained results, four different time series were constructed for each variable (potential temperature, salinity and potential density). These time series consisted on the average values at fixed depth ranges (0–25, 0–50, 0–75, and 0–100 m), for the 37 stations and for each of the 71 available campaigns.
The AW temperature, salinity and density have clear seasonal cycles (Vargas-Yáñez et al., 2017, 2019). The variance associated with such cycles should be removed prior to the analysis of long-term trends. Therefore, the seasonal climatological temperature, salinity and density cycles were estimated for each depth level. These cycles were estimated as the mean values for all the data corresponding to winter (January to March), spring (April to June), summer (July to September) and autumn (October to December). Then, the seasonal climatological cycles, estimated for each depth level, were subtracted from the original time series. The final ones were made of residuals or deviations with respect to the climatological seasonal cycles. Supplementary Table 2 shows the values corresponding to the seasonal cycles of salinity, potential temperature and density for the surface layer. This procedure was not needed for the MWs for which the seasonal cycle was absent or very weak, not affecting the trend estimation. However, the seasonal cycles for the salinity, potential temperature, density and pressure for the WIW, LIW, and WMDW are also presented in Supplementary Table 2 for the completeness of the work.
The WIW flows below the AW at a depth ranging from 100 to 300 m (see Supplementary Table 2 for a description of the average properties of this water mass; Salat and Font, 1987; López-Jurado et al., 1995; Juza et al., 2013, 2019; Vargas-Yáñez et al., 2020). The density range for this water mass is 28.8–29.05 (Pinot et al., 2002). A first criterion used to define the properties of this water mass during each campaign was to select all the θS values within the selected density range for each oceanographic station. The minimum θ value within this range was considered as the core of the WIW at that particular station. The salinity, potential density and depth corresponding to this minimum were considered as the WIW properties for that particular oceanographic station. In order to obtain one single value for each campaign, two different criteria were used. In the first case, the mean value of the 37 stations was considered and the standard deviation was also estimated. These values would reflect the average properties of the WIW in the Balearic Channels during that survey (method 1 hereafter). A second criterion was to select the minimum of the 37 values. This value would be indicative of the properties of those waters with the highest influence or contribution of WIW during that survey (method 2). Juza et al. (2019) have evidenced that using pre-defined density, temperature or salinity ranges could fail to detect WIW in some cases. Instead of these traditional methods, Juza et al. (2019) proposed the use of a geometry-based detection approach. For each campaign and for the 37 stations this method provides a range of θS values that could be considered as corresponding to the presence of the WIW. The 50th percentile was used to construct the time series of WIW properties in the Balearic Channels (potential temperature, salinity, potential density and depth), and the 17th and 83rd percentiles were used to define the dispersion for each survey (method 3).
The core of the LIW was identified as the absolute salinity maximum within each salinity profile (see Supplementary Table 2). Potential temperature, salinity, potential density and depth for this LIW core were determined for each station corresponding to each campaign. The mean value and the standard deviation from the 37 stations were calculated for each campaign (method 1). As in the case of the WIW, this first method makes an estimation of the average properties of LIW during each survey. A second method consisted of selecting the maximum salinity of the 37 stations. This would represent the properties of the LIW for those waters with a maximum influence of this water mass (method 2).
The WMDW was considered by Pinot and Ganachaud (1999) and Pinot et al. (2002) as the waters with potential density higher than 29.1 kg/m3. Nevertheless, the θS diagram for the whole data set (Figure 2) showed that the 29.1 kg/m3 potential density corresponded to the mixing line between the LIW salinity maximum and the deepest waters, and in some cases it was closer to the LIW extreme of the mixing line. Hence, the first criterion used to construct time series for the deep water properties was to calculate the potential temperature, salinity, potential density and depth of those waters exceeding the value 29.11 kg/m3, averaged for the 37 stations and for each campaign (method 1). However, the 29.11 kg/m3 density was not reached during most of the initial campaigns, reducing considerably the final length of the time series. For this reason, the time series of deep water properties were also estimated using the threshold of 29.1 kg/m3 (method 2).
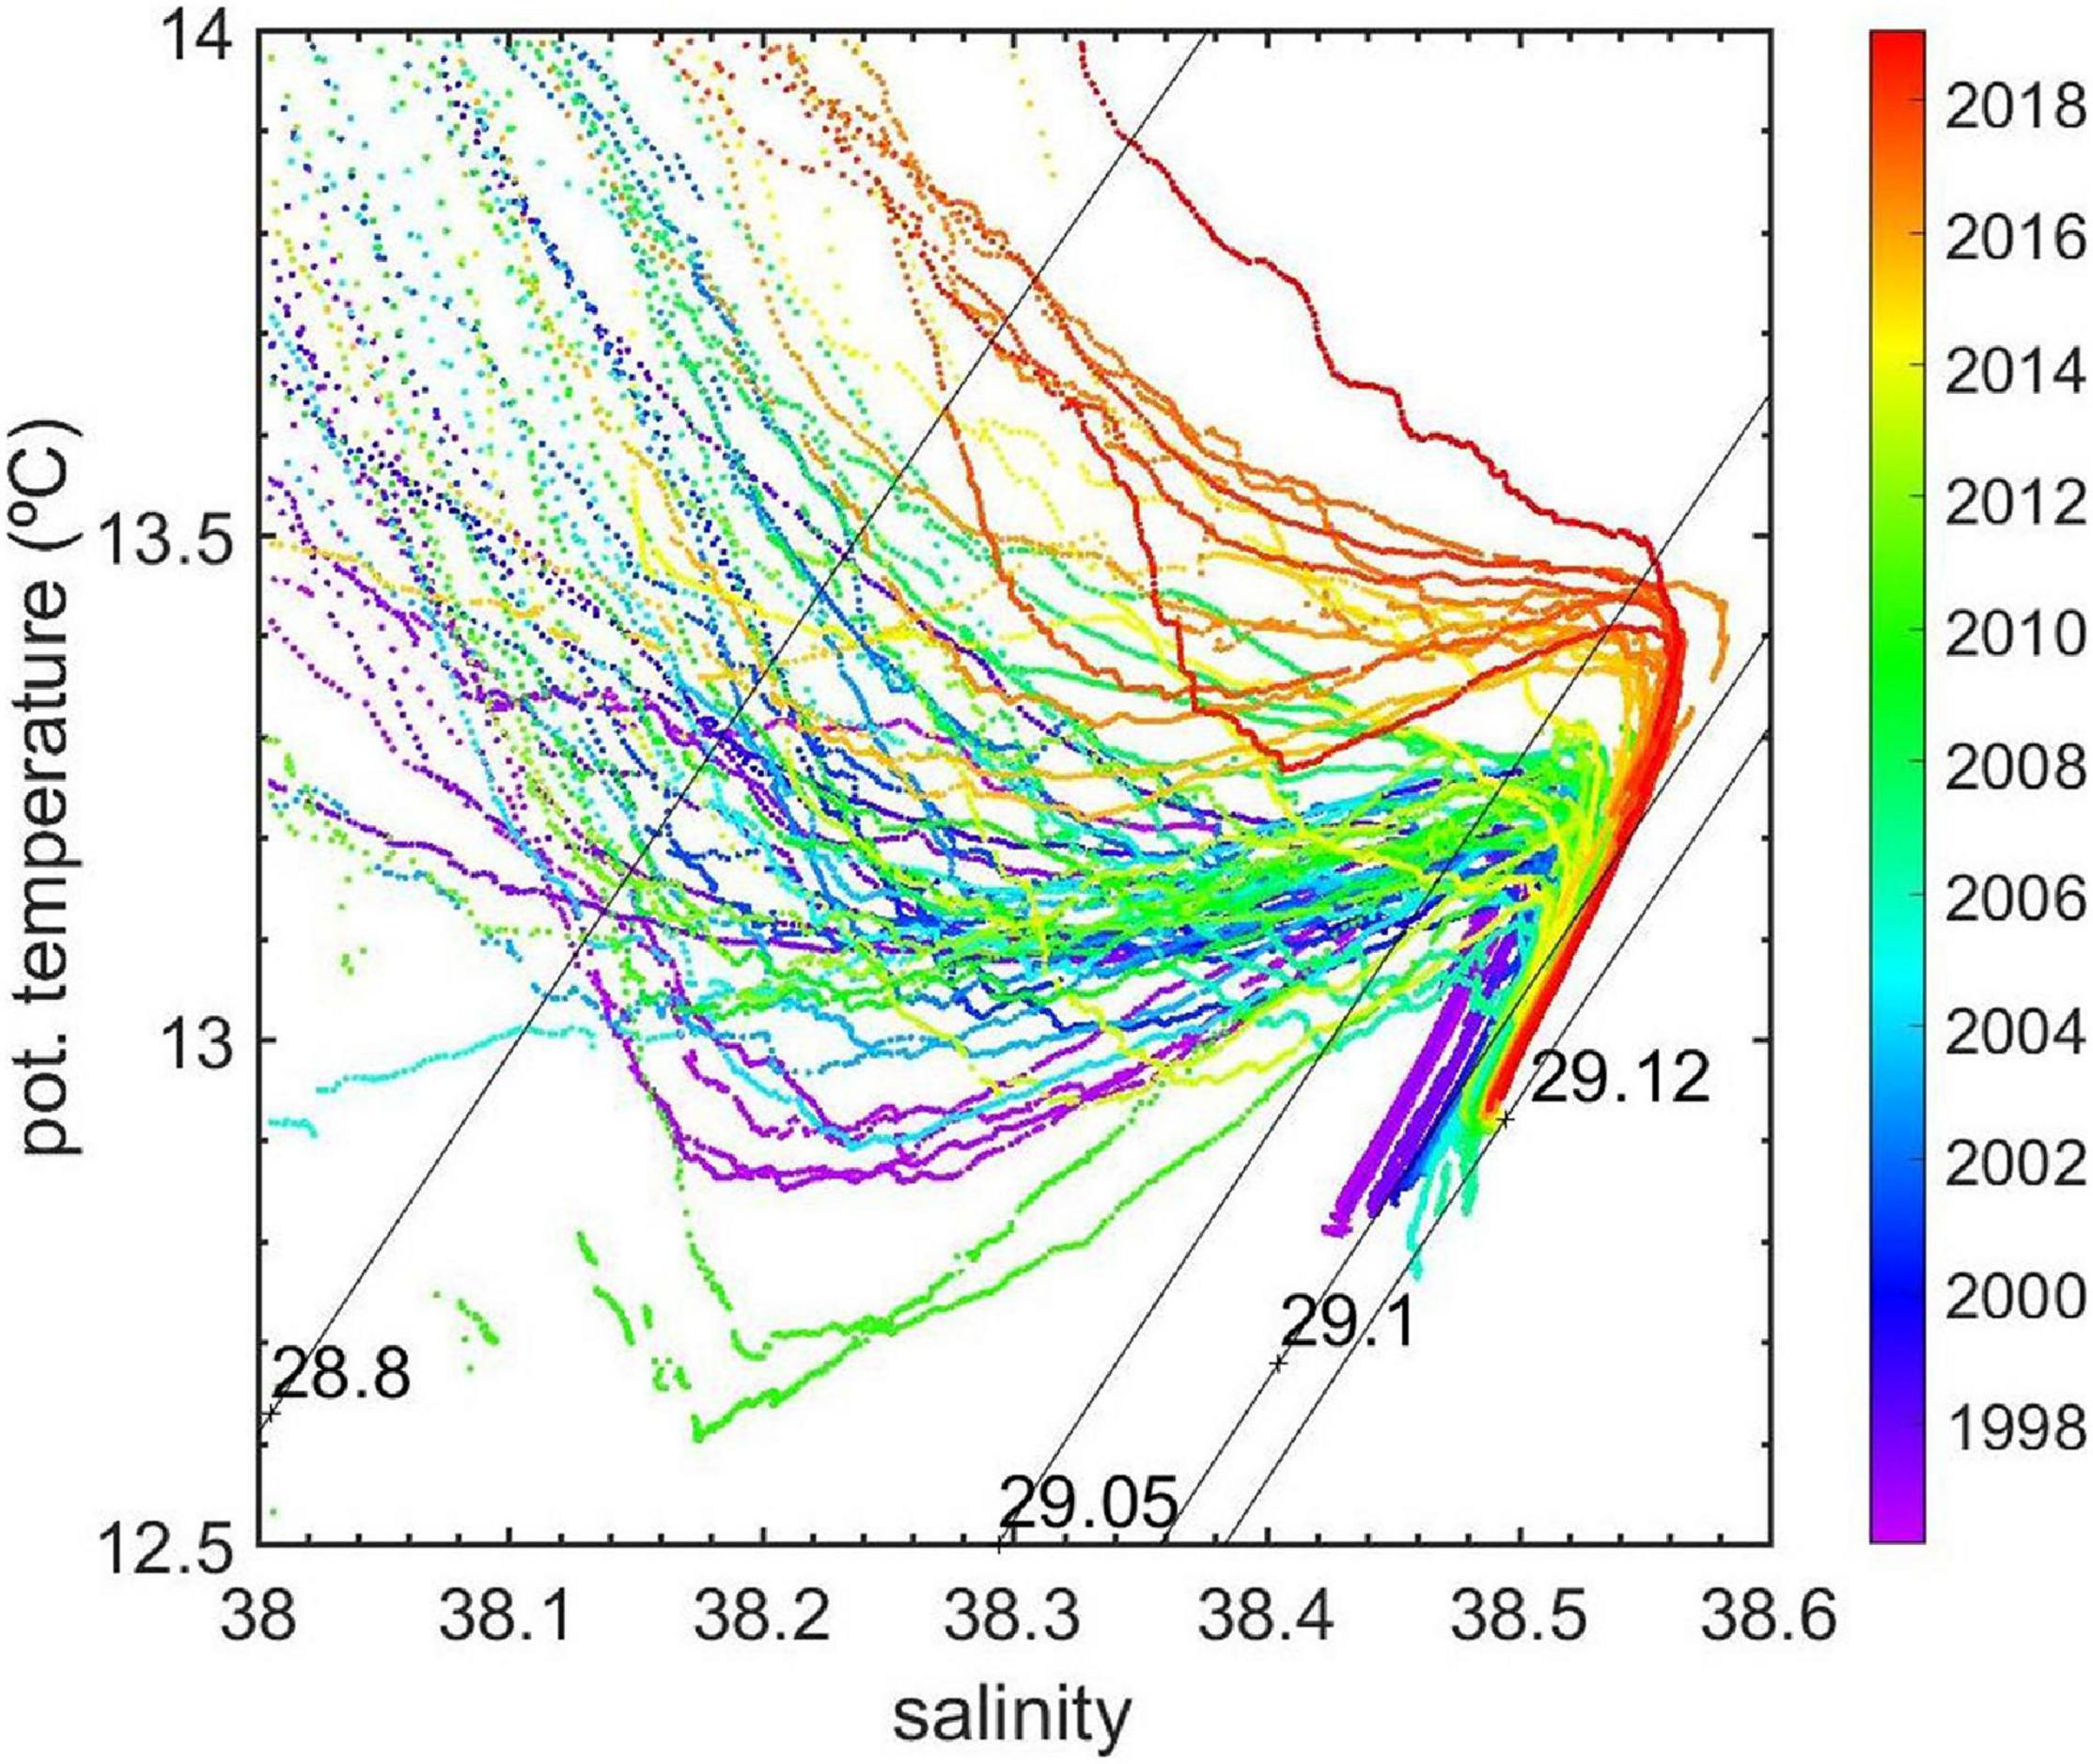
Figure 2. Potential temperature-salinity (θS) diagrams for the complete time series from 1996 to 2019. For each of the 71 oceanographic campaigns, one single θ-S diagram is presented, averaging the data from all the oceanographic stations forming the four sections that cover the Balearic Channels. The color scale shows the time corresponding to each survey. Some specific isopycnals have been included. WIW would have a potential density higher than 28.8 and lower than 29.05. The 29.05 isopycnal could be associated to the LIW core, and the 29.1 would be representative of the WMDW previously to the WMT. The 29.12 is also included as this density value is observed after the WMT.
Monthly time series of temperature at 0, 20, 50, and 80 m depth were constructed from weekly time series at L’Estartit oceanographic station (operated by ICM/CSIC, Figure 1, Salat et al., 2019). Monthly time series of sea level were also constructed from hourly data at the same location. A climatological seasonal cycle was obtained for each time series averaging all the data corresponding to the same month of the year over the available period. Time series of anomalies or residuals were obtained subtracting the seasonal cycle to the original time series. Temperature time series at 0, 20, 50, and 80 m extend from 1970 to 2019, whereas sea level time series extends from 1990 to 2019 (Salat et al., 2019).
Monthly sea level data were obtained from hourly data at the tide gauge located at Palma de Mallorca and operated by IEO (Figure 1). As in the case of L’Estartit, a climatological seasonal cycle was obtained averaging all the data corresponding to the same month of the year over the available period. A time series of anomalies was obtained subtracting the seasonal cycle from the Palma sea level time series.
The temperature of the upper 100 m of the sea has a very strong variability because of the ocean-atmosphere interaction. The seasonal variability can be removed, as previously explained, but the resulting time series of residuals has a large variance associated with monthly and inter-annual time scales. Hence, trends and long-term changes are very difficult to detect. This variability can partially be filtered out when the time series has a high temporal resolution, as for the sea level and sea temperature time series at L’Estartit. On the contrary, short temporal scales artificially appear as part of longer time scales (aliasing) when the sampling is 3-monthly, as in the case of CTD time series. For this reason and to check the robustness of the results dealing with the properties of the upper layer, time series of monthly sea surface temperature (SST) were obtained from the reanalysis of the NCEP/NCAR (Kalnay et al., 1996). SST data were averaged for the area delimited from 41° N to 42.9° N and from 1.9° E to 3.8° E. The resulting time series was considered for comparison with L’Estartit time series and will be referred to as the Northern Sector SST. SST data were also averaged for the area from 39° N to 41° N and from 1.9° E to 3.8°E. This time series was considered for comparison with results from the Balearic Channels and will be referred to as the Balearic Channels SST.
The sea level is affected by atmospheric pressure, among many other factors. In an ideal situation, a pressure increase of 1 mbar produces a sea level decrease of 1 cm. This is known as the inverse barometer effect. Therefore, persistent changes or trends in atmospheric pressure could induce trends in the sea level, as was the case from 1960 to mid-1990s in the WMED (Tsimplis and Baker, 2000; Tsimplis and Josey, 2001). For this reason, time series of monthly atmospheric pressure were also obtained from the reanalysis of NCEP/NCAR. As for the SST, two different time series were extracted. The first one, for comparison with the Palma tide gauge, corresponded to the same area used for the construction of the Balearic Channels SST (39° N-41° N, 1.9° E-3.8° E). The second one, for comparison with the L’Estartit sea level time series, corresponded to the same area used for constructing the Northern Sector SST time series (41° N-42.9° N, 1.9° E-3.8° E).
The changes in the water column height between two pressure levels with respect to a reference climatological density profile (ρ0) were estimated using the hydrostatic equation:
If p1 is taken as zero (sea surface) and p2 is the maximum pressure reached for a certain station, then this expression is an estimation of the steric sea level. Time series of steric sea level anomalies were obtained for each campaign. The reference profile corresponded to the mean temperature and salinity profiles averaged for the 37 stations covering the Balearic Channels and for the complete period (1996–2019).
The temperature (thermosteric) contribution to the steric sea level anomaly was estimated as:
Where Δθ is the deviation with respect to the climatological temperature profile. Similarly, the salinity (halosteric) component of the steric anomaly was estimated as:
Where α and β are the thermal expansion and the haline contraction coefficients respectively.
The anomaly of heat absorbed by a water column of one square meter between the pressure levels p1 and p2 was estimated as:
Once again if p1 is set equal to zero and p2 is the maximum pressure reached, then the equation above represents the heat absorbed by the whole water column.
The maximum pressure level reached in the analyzed oceanographic stations was 1385 dbar. Since the CTD casts did not always reach the same depth, the reference level considered for the calculation of the steric sea level and absorbed heat was fixed at 1200 dbar. The steric, thermosteric and halosteric sea level anomalies, as well as the heat absorbed, were calculated within two vertical layers: from the sea surface to 1200 dbar and from 100 to 1200 dbar. This second pressure range was used to study the influence of variations experienced by the MWs on the sea level and absorbed heat. Furthermore, excluding the upper 100 dbar of the water column allowed eliminating the seasonal variability in these time series.
The potential temperature and salinity changes at fixed pressure levels can be decomposed in two contributions. The first one is caused by the variations of temperature and salinity experienced by the isopycnals occupying such pressure levels, and the second contribution is associated with the vertical displacement of the isopycnals (Bindoff and McDougall, 1994; Zunino et al., 2012). This decomposition can be written as:
The climatological profiles of potential temperature, salinity and potential density were estimated as functions of pressure, averaging all the profiles from the 71 campaigns, and were considered as the references. The temperature, salinity, and density profiles from each campaign were then compared with the references and the changes were decomposed according to the equations above.
Figure 3 shows the time series of residuals for potential temperature, salinity and potential density for the AW in the Balearic Channels from 1996 to 2019. For each variable, four different time series are displayed, corresponding to the average value in the upper 25, 50, 75 m, and for the upper 100 m. Both potential temperature and salinity of the AW showed positive trends for the four time series over the analyzed period. Nevertheless, temperature trends were not statistically significant. The salinity trends were statistically significant at the 90% confidence level (Table 1). The potential density trends were negative for the 0–25 m layer and positive in the other three layers, but these trends were not significant in any of the four depth ranges. Table 1 shows that the (not significant) temperature trends varied between 0.9 and 1.8°C/100yr, depending on the depth range considered, whereas the salinity trends were approximately 0.6/100yr in all the cases.
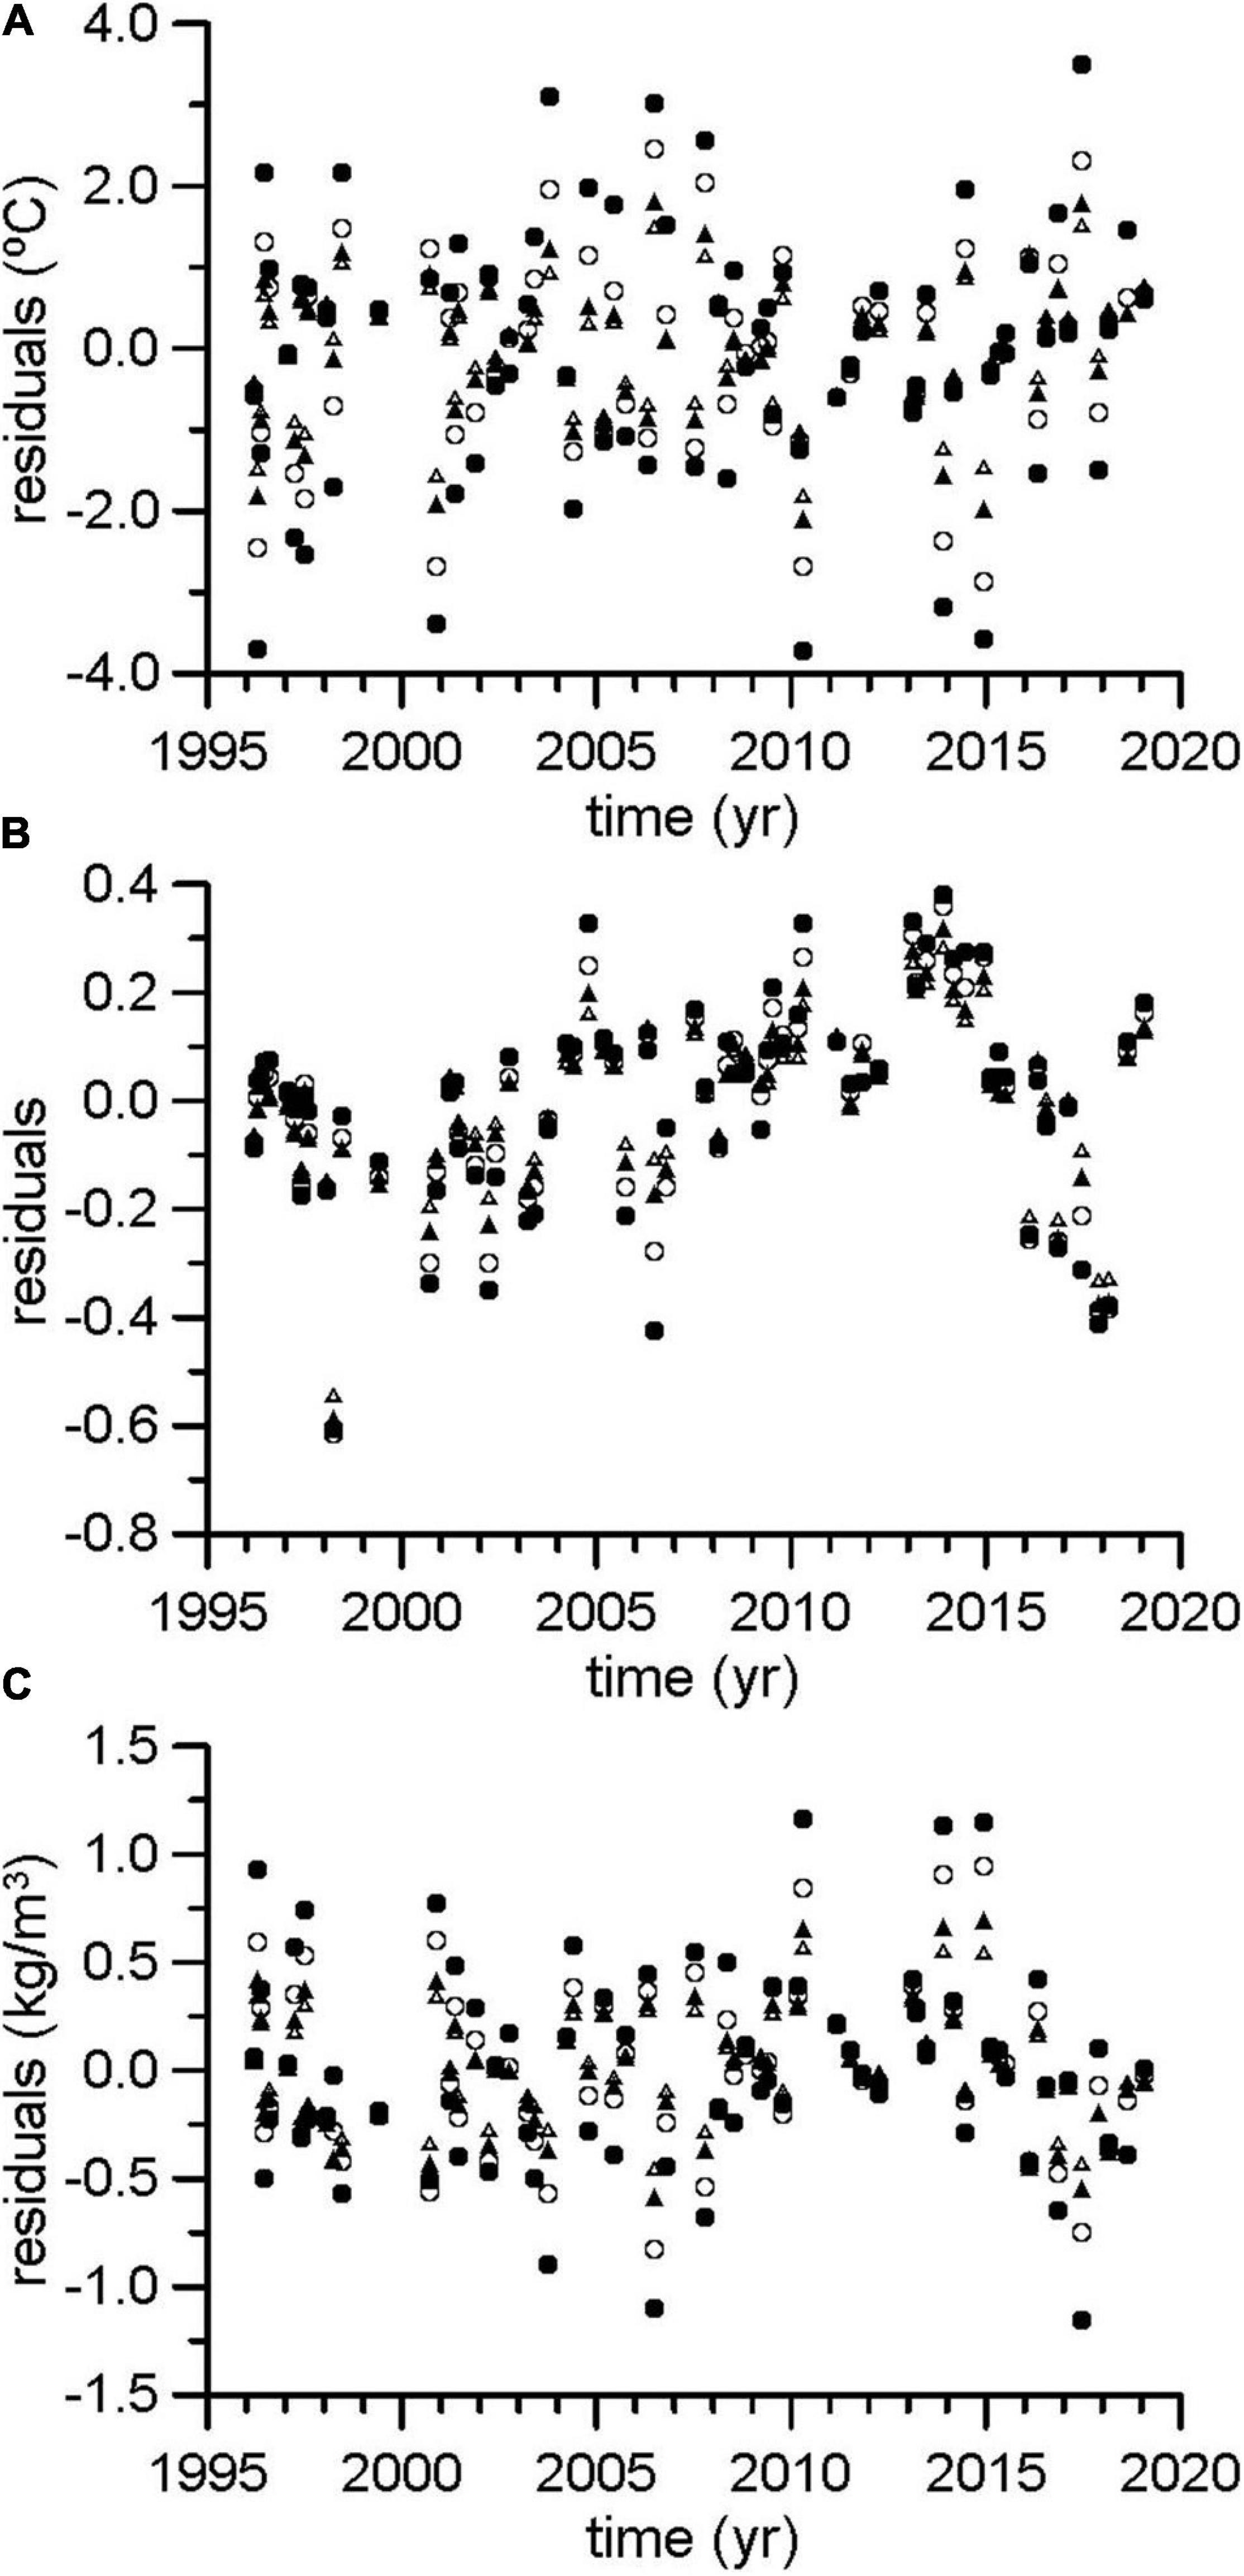
Figure 3. Residuals or anomalies of potential temperature (A), salinity (B), and potential density (C) for the AW layer. Residuals are obtained subtracting a seasonal cycle to the original time series. For each variable, four different time series are presented. The first one is made of the mean value of the upper 25 dbar (black filled circles), 50 dbar (open circles), 75 dbar (black filled triangles), and 100 dbar (open triangles).
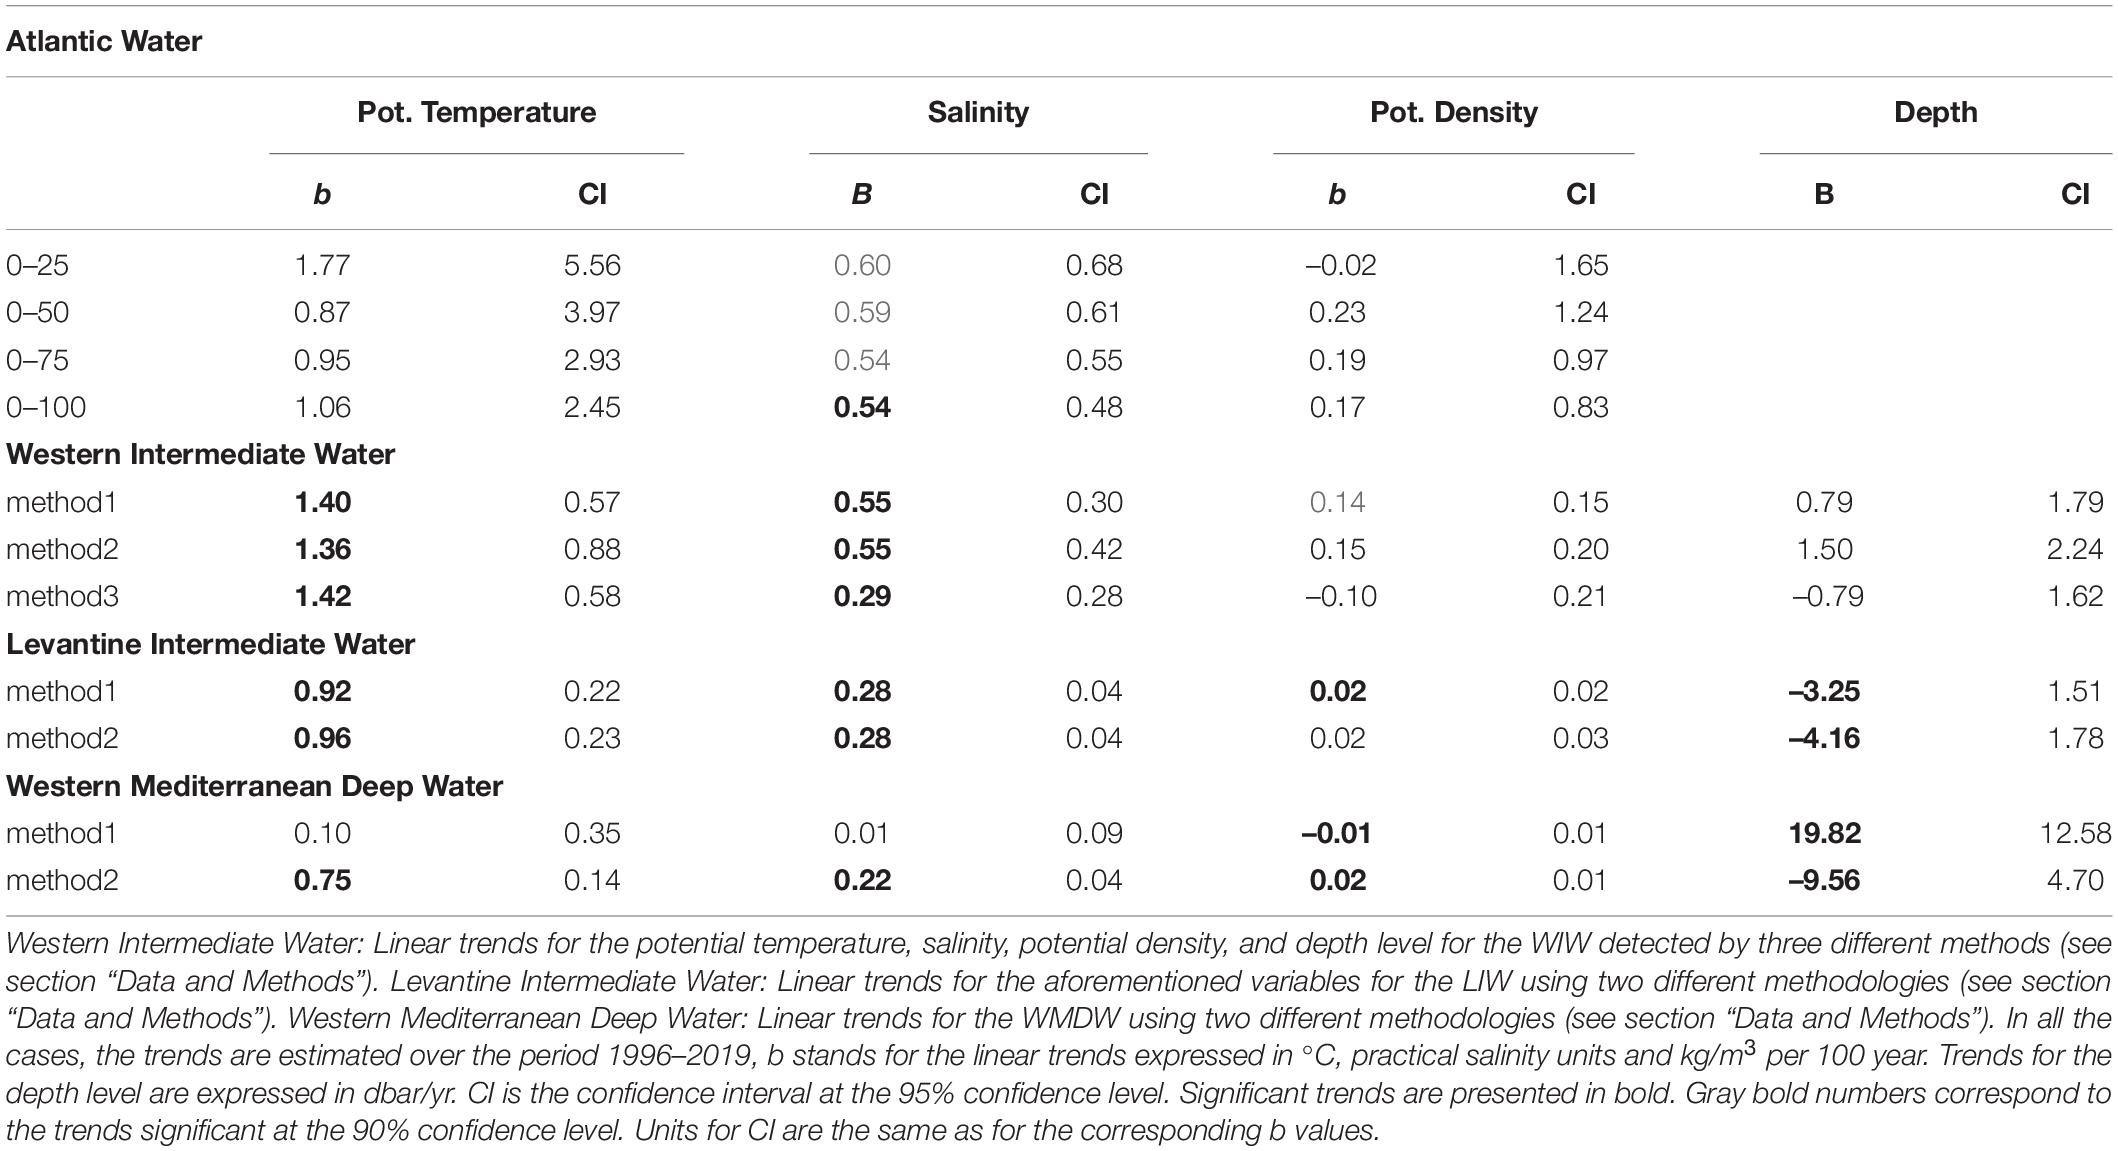
Table 1. Atlantic Water: Linear trends for the AW potential temperature, salinity, and potential density averaged for the upper 25, 50, 75, and 100 m layers.
The lack of significance in the trends estimated for the AW temperature could be due to the substantial intra and inter-annual variability exhibited by these time series, the large sampling interval (3 months) and the existence of gaps within the time series (see section “Discussion”). It is interesting to note that the temperature and salinity anomalies were negatively and significantly correlated, with positive temperature anomalies corresponding to negative salinity anomalies and vice-versa.
Figures 4A,C shows the potential temperature and salinity time series for WIW using the methods 1 and 2 (as described in section “Data and Methods”). For method 1, the standard deviation corresponding to the 37 oceanographic stations is included as error bars. Figures 4B,D shows the 17th, 50th and 83rd percentiles for the potential temperature and salinity values obtained by the geometry-based method. The three methodologies led to the same results: the WIW potential temperature and salinity increased over the period 1996–2019. The potential temperature trends were around 1.4°C/100yr for the three methods used and were statistically significant at the 95% confidence level (Table 1). The WIW salinity trends were around 0.55/100yr using methods 1 and 2 and lower with the geometry-based method with a value of 0.29/100yr. While the potential density trend estimated from method 1 was positive and statistically significant at the 90% confidence level, the trend was negative but not statistically significant using method 2 and the geometry-based method (method 3). No significant trend was observed for the depth level occupied by the WIW for any of the methodologies used (Table 1). The WIW depth remained stable between 100 and 300 m over the analyzed period with a strong inter-annual variability (not shown).
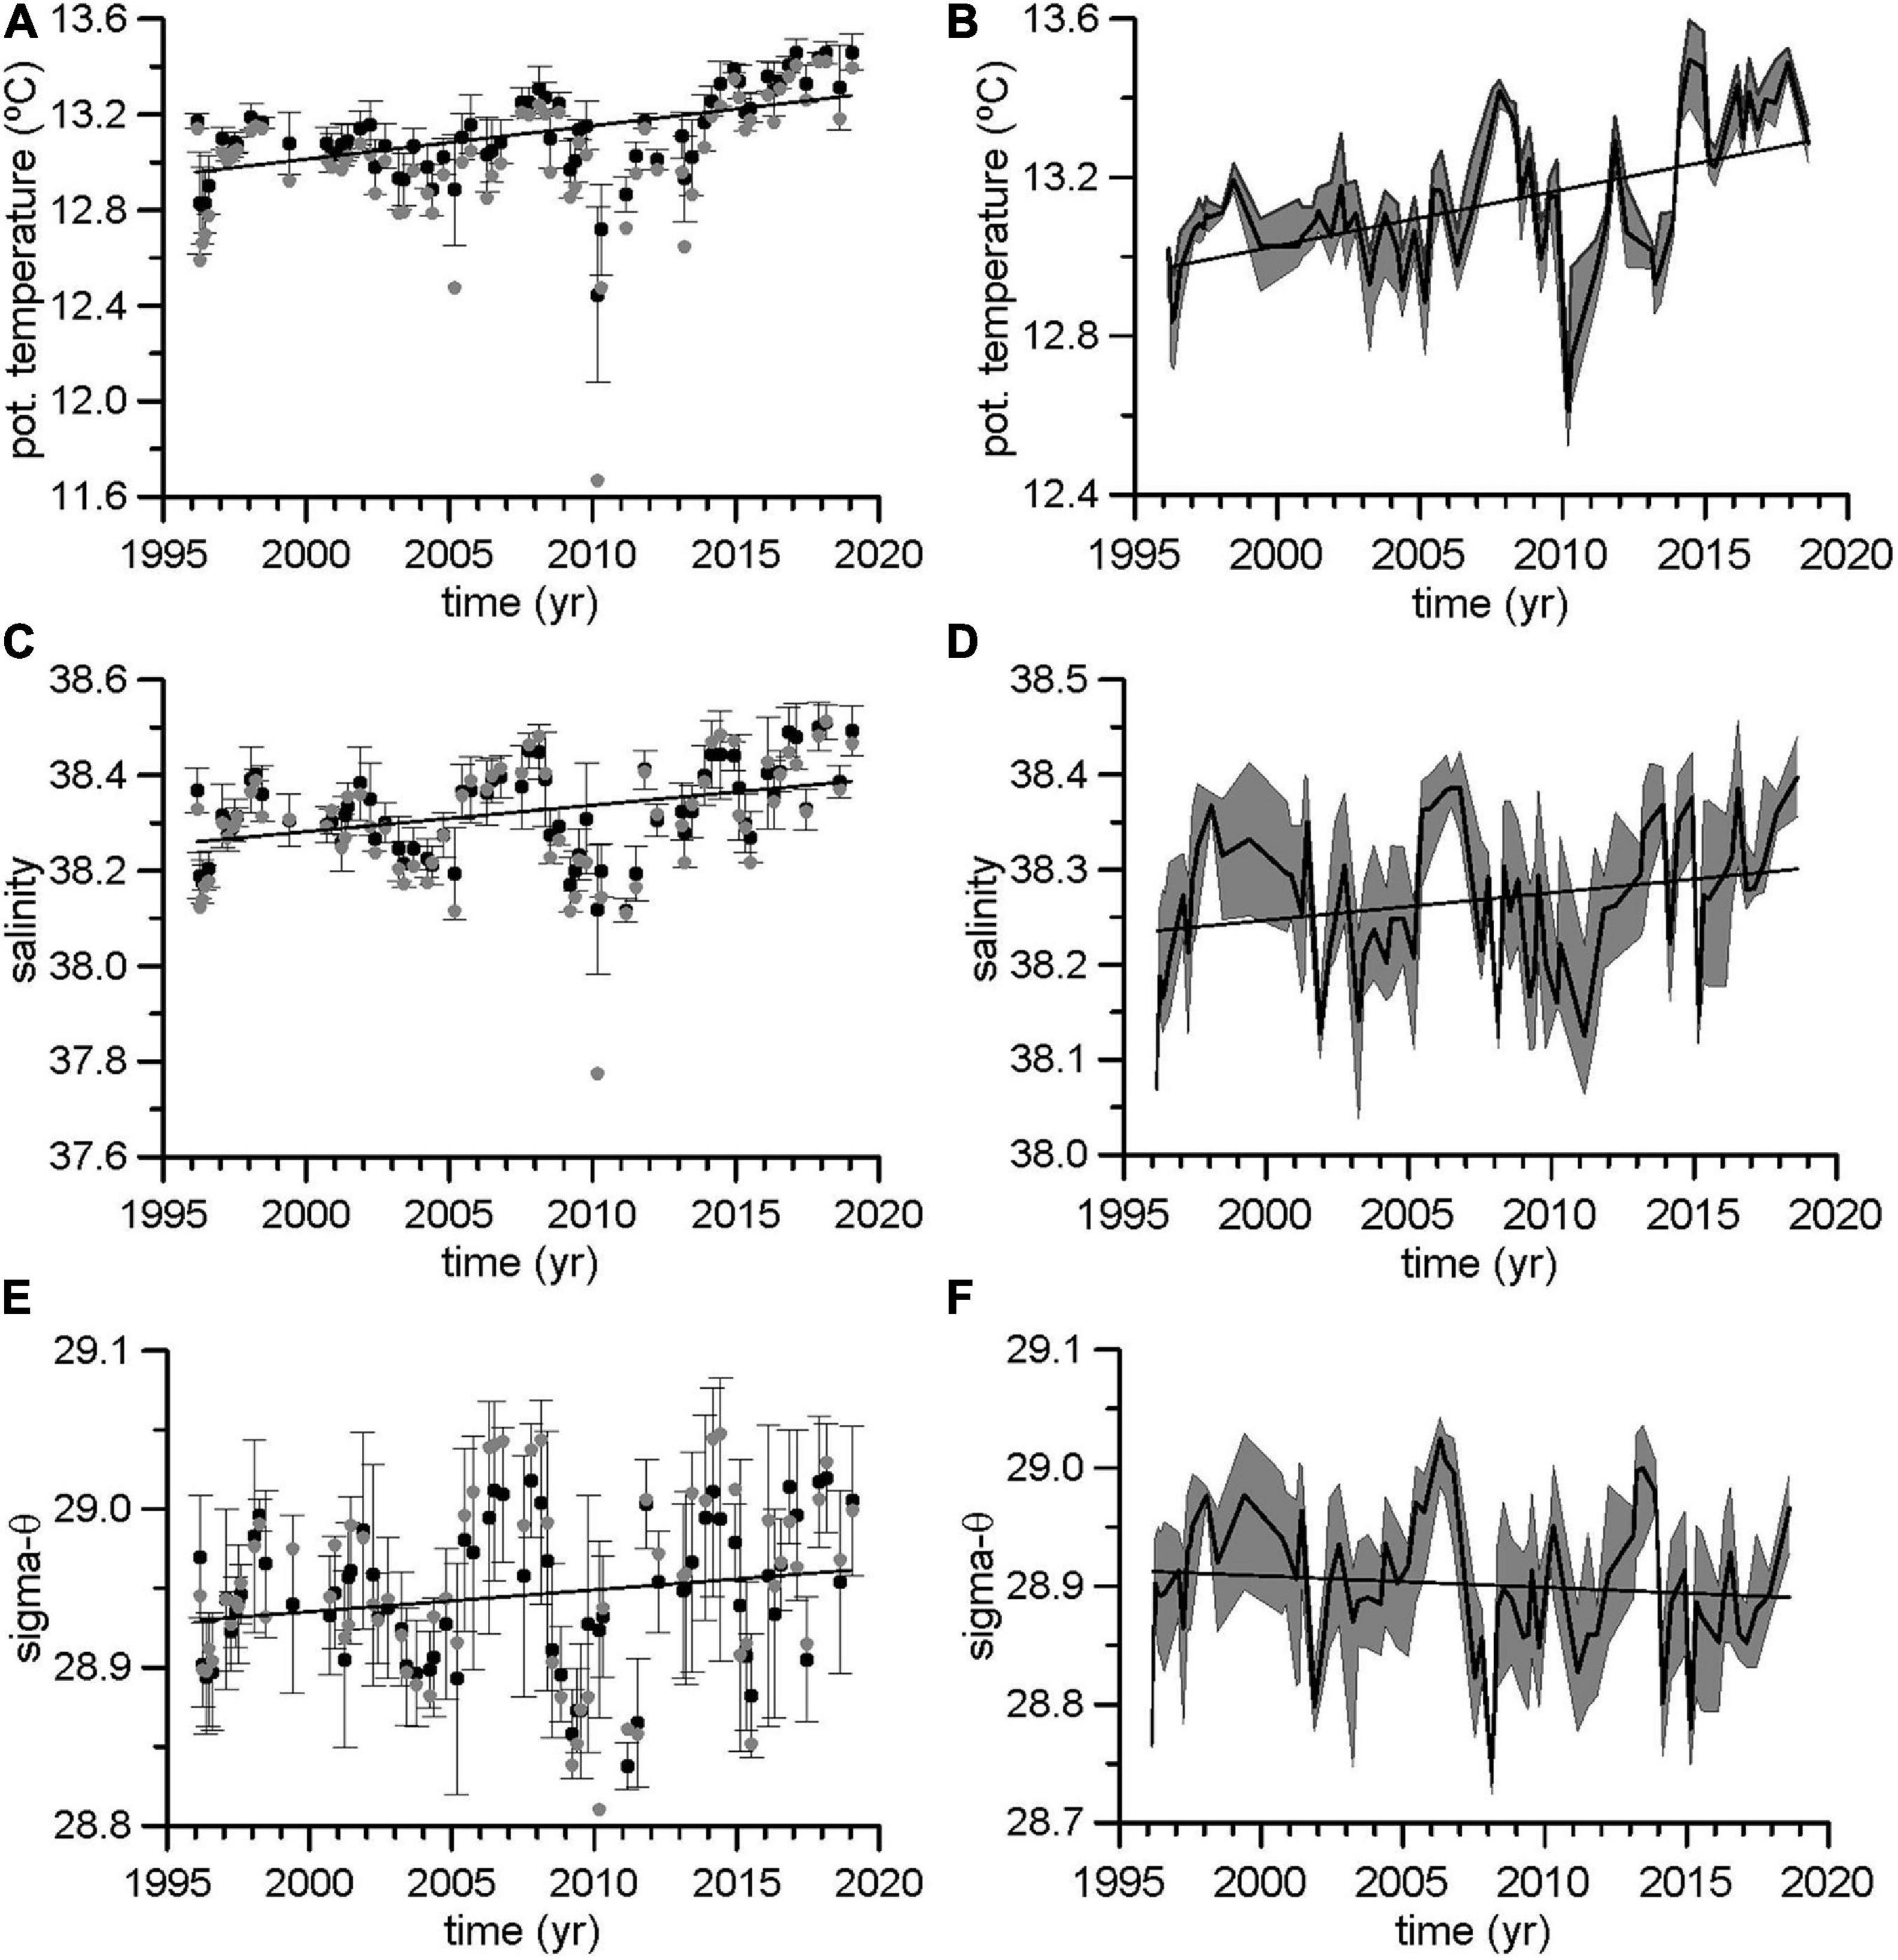
Figure 4. Time series for the potential temperature (A,B), salinity (C,D), and potential density (E,F) for the WIW. Black dots in (A,C,E) correspond to the WIW properties obtained using method 1. Error bars for this method represent one standard deviation. Gray dots correspond to method 2. (B,D,F) Show the WIW properties obtained using the geometric method in Juza et al. (2019). Black lines represent the 50th percentile and the shaded areas correspond to the 17th and 83rd percentiles.
Figure 5 shows the evolution of the potential temperature, salinity and potential density of the LIW, as obtained using the method 1 (LIW core properties averaged for the 37 stations for each survey) and the method 2 (maximum values of the LIW core properties for each survey). The LIW potential temperature and salinity experienced positive trends of 0.92–0.96°C/100yr and 0.28/100yr, respectively (Table 1). These trends were statistically significant at the 95% confidence level with the same order of magnitude as those estimated for the WIW. On the contrary, the LIW potential density trends were significant only at the 90% level for the method 1 and not significant for the method 2, and showed weak values for both methods (Table 1). The depth level occupied by this water mass was displaced upwards during the analyzed period with a negative trend between –3 and –4 dbar/yr (Table 1).
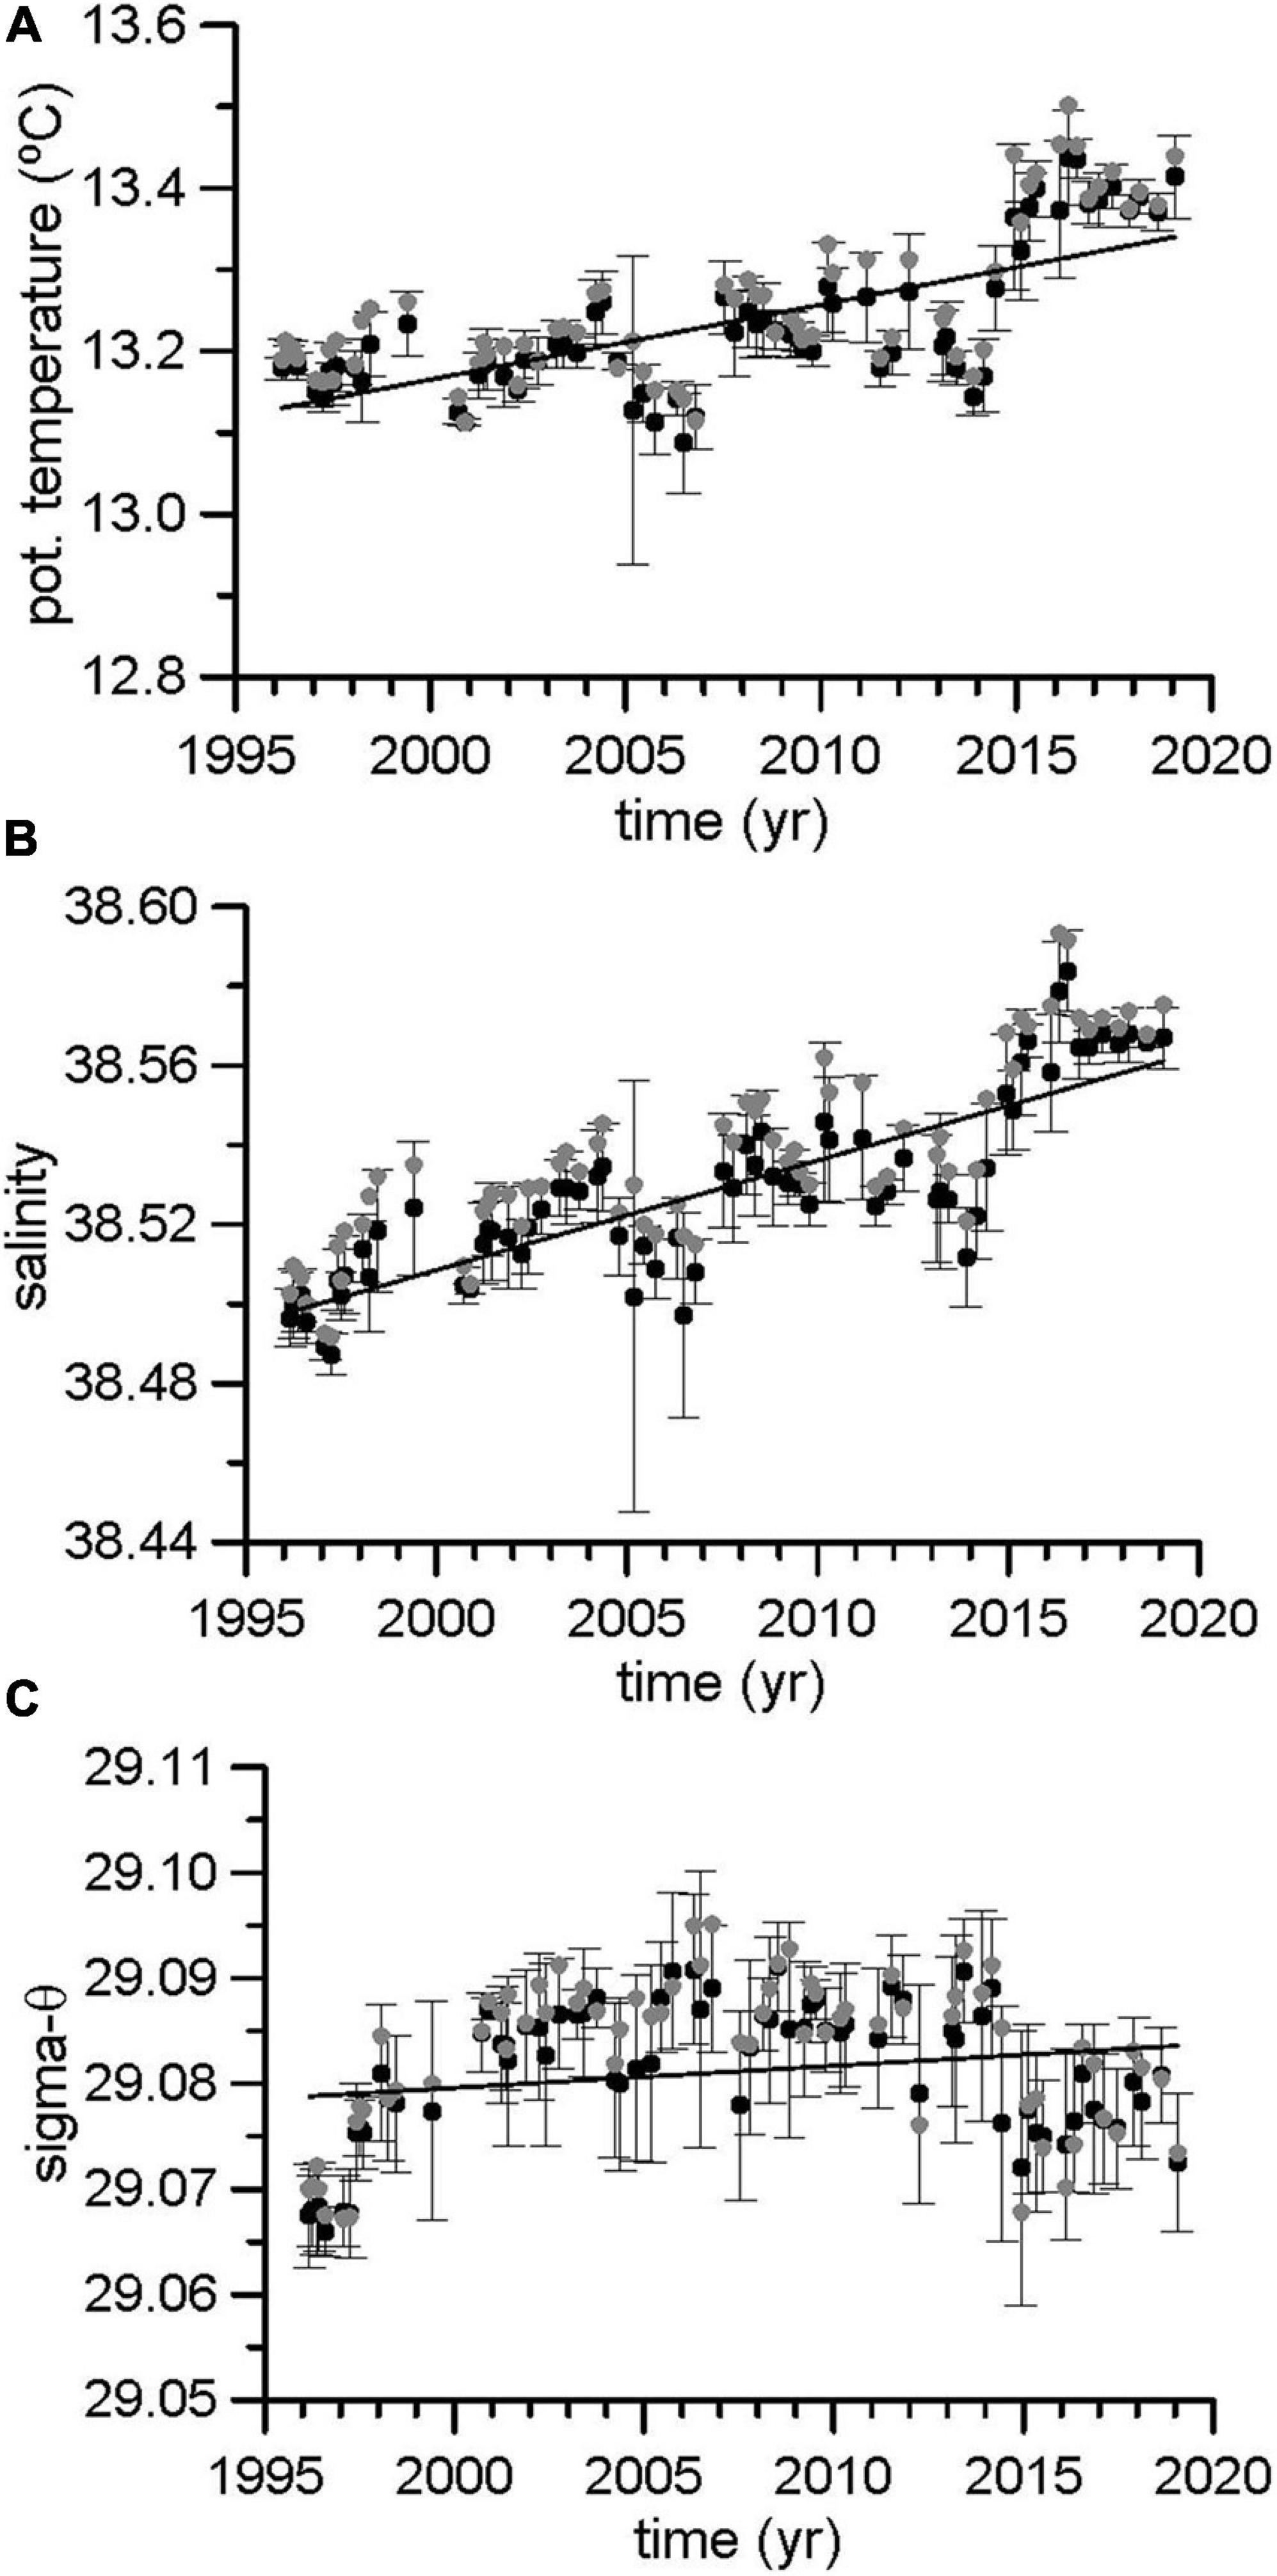
Figure 5. Time series of potential temperature (A), salinity (B), and potential density (C) for the LIW. Black dots and error bars (one standard deviation) correspond to the LIW properties obtained using method 1, and gray dots correspond to the properties obtained using method 2.
Using the threshold of 29.11 to define the properties of WMDW (method 1), the length of time series is considerably reduced as this density value was reached only once before 2005. The associated potential temperature and salinity trends were not statistically significant whereas the potential density became progressively lower and the depth range increased, both in a statistically significant way (Table 1 and Figure 6). The time series obtained using the threshold of 29.1 (method 2) were longer and showed statistically significant trends for the potential temperature (0.75°C/100yr), salinity (0.22/100yr), potential density (0.02 kg.m–3/100yr) and depth (–9.6 dbar/yr). Except for 2001, 2005 is the first year when potential density values higher than 29.11 were found. This value corresponded to exceptionally cold and fresh waters (Figures 6A,B) that progressively became warmer and saltier until 2019, but keeping density values higher than those recorded before 2005.
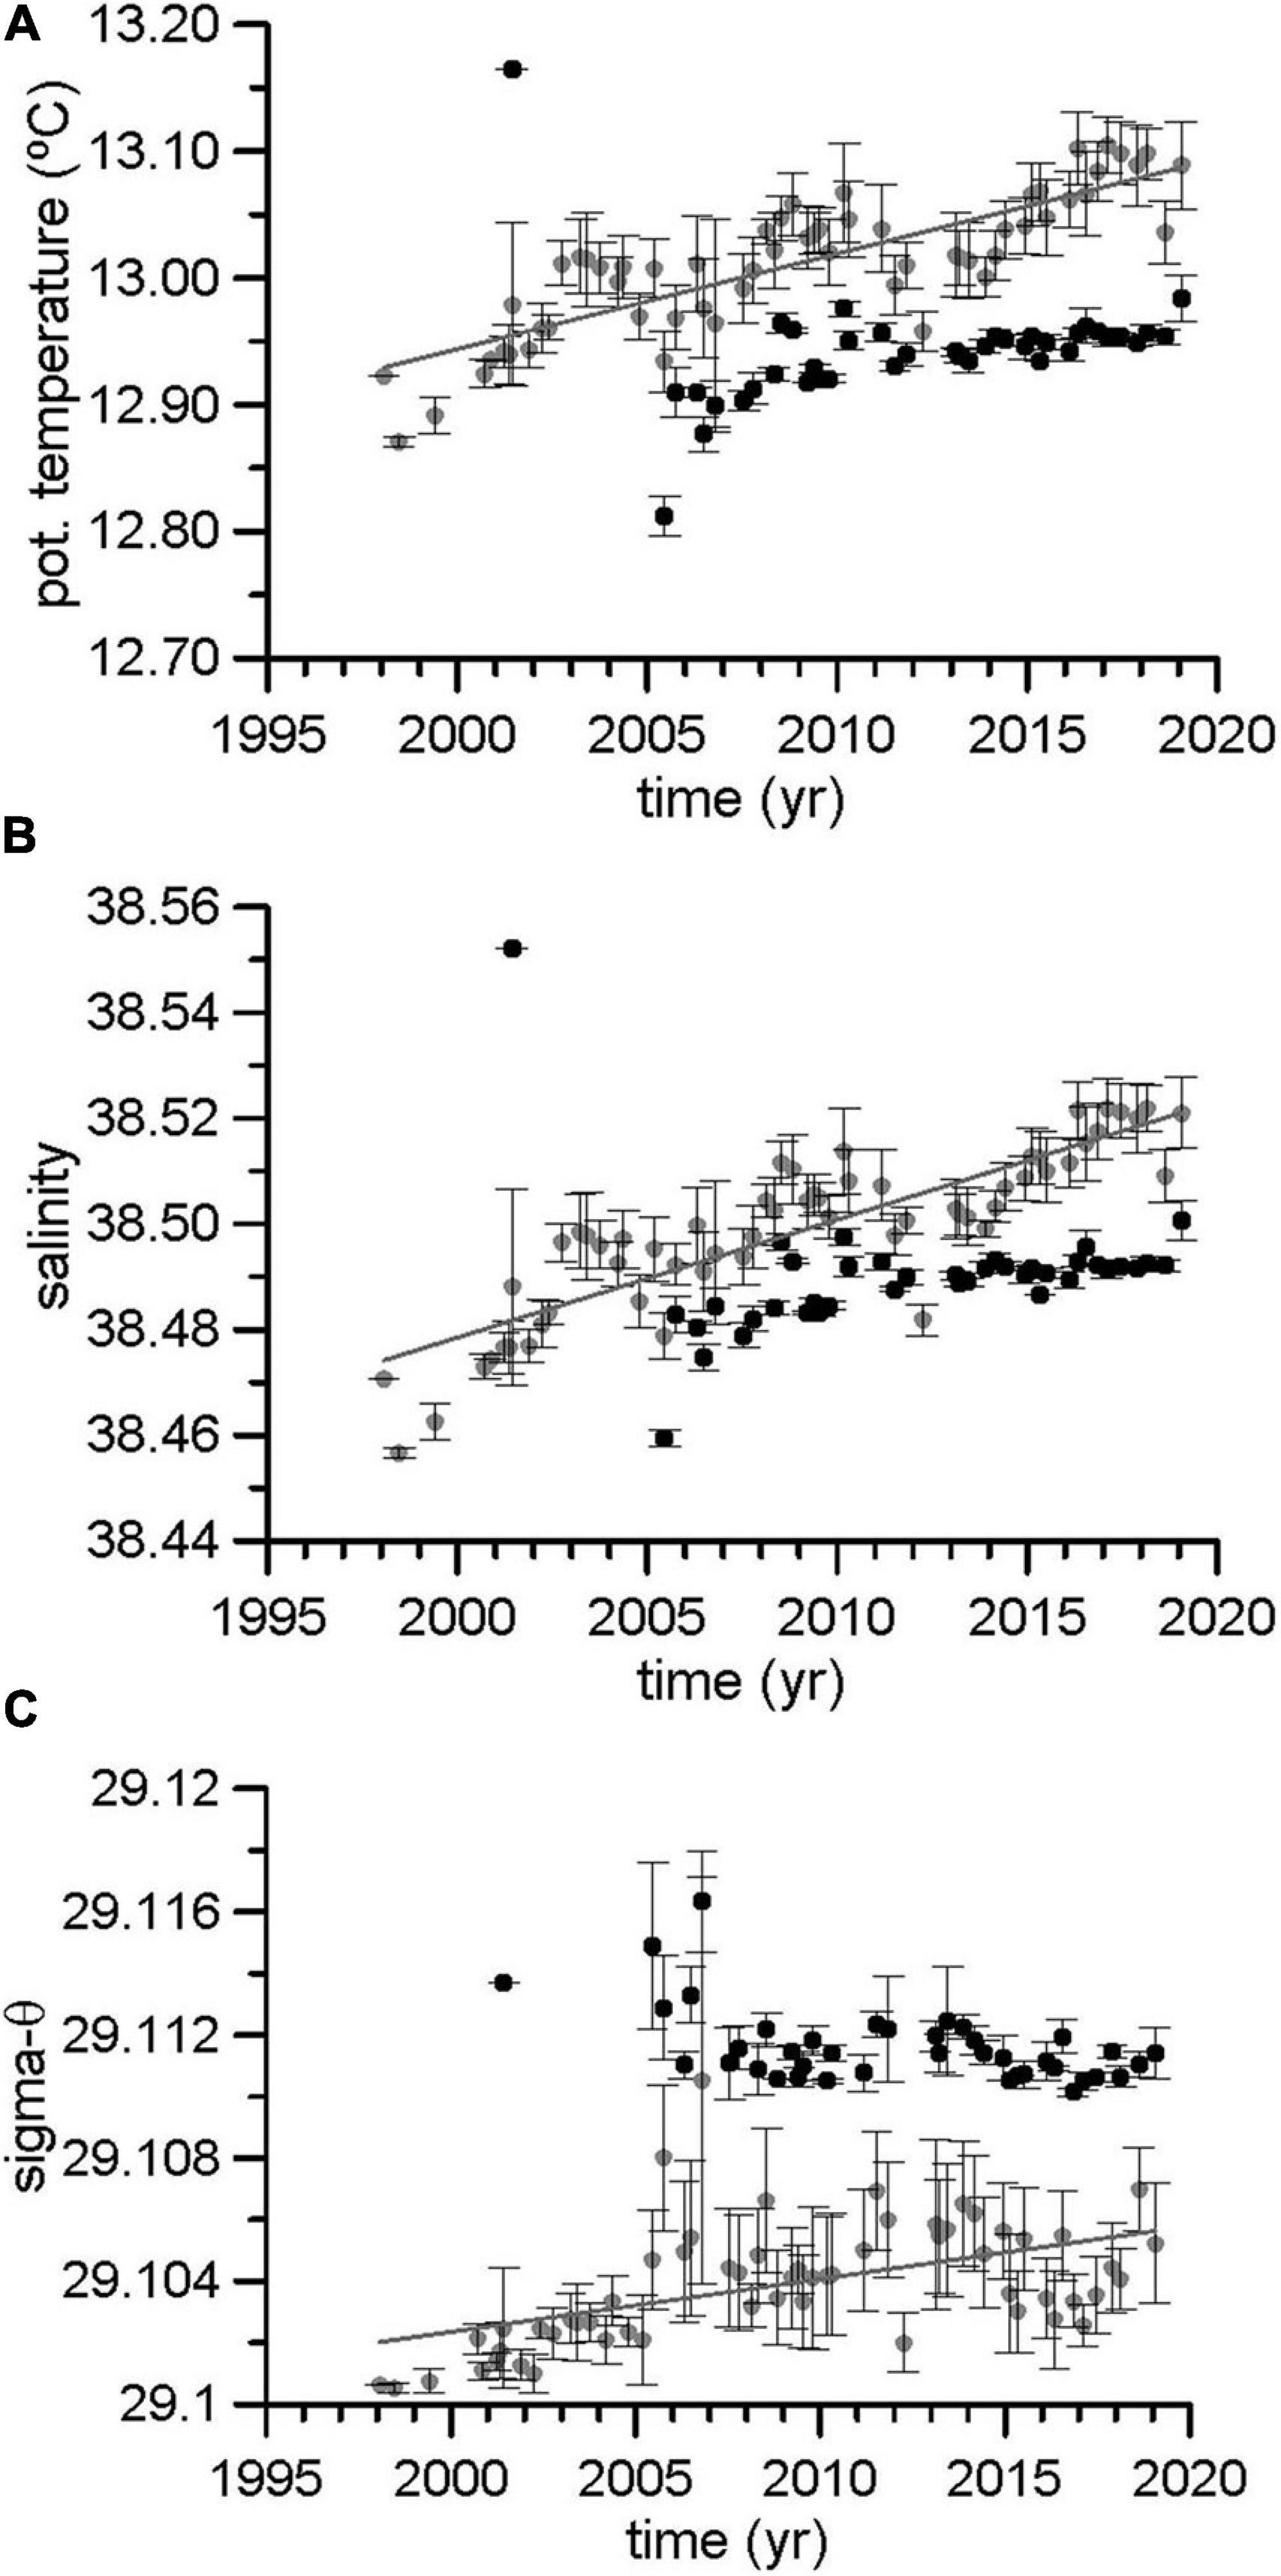
Figure 6. Time series of potential temperature (A), salinity (B), and potential density (C) of the deep waters. Black dots and error bars (one standard deviation) correspond to properties obtained using method 1 (waters with a potential density higher than 29.11 kg/m3) whereas gray dots and error bars correspond to properties obtained using method 2 (waters with potential temperature higher than 29.1 kg/m3).
Figure 7A shows the SST in the Northern Sector and the Balearic Channels area. The former time series starts in 1970, for comparison with the L’Estartit time series, whereas the latter one starts in1996 for comparison with the CTD time series. The SST increased with strong positive linear trends of 2.2 and 2.7°C/100yr in the Northern Sector and the Balearic Channels region, respectively (Figure 7A and Table 2). These results were very similar to those obtained from the analysis of the temperature at 0, 20, 50, and 80 m depth at the L’Estartit station. Figure 7B shows the time series at these four depths. The linear trends ranged between 2.1°C/100yr for the deepest time series and 2.8°C/100yr for the surface one (Table 2).
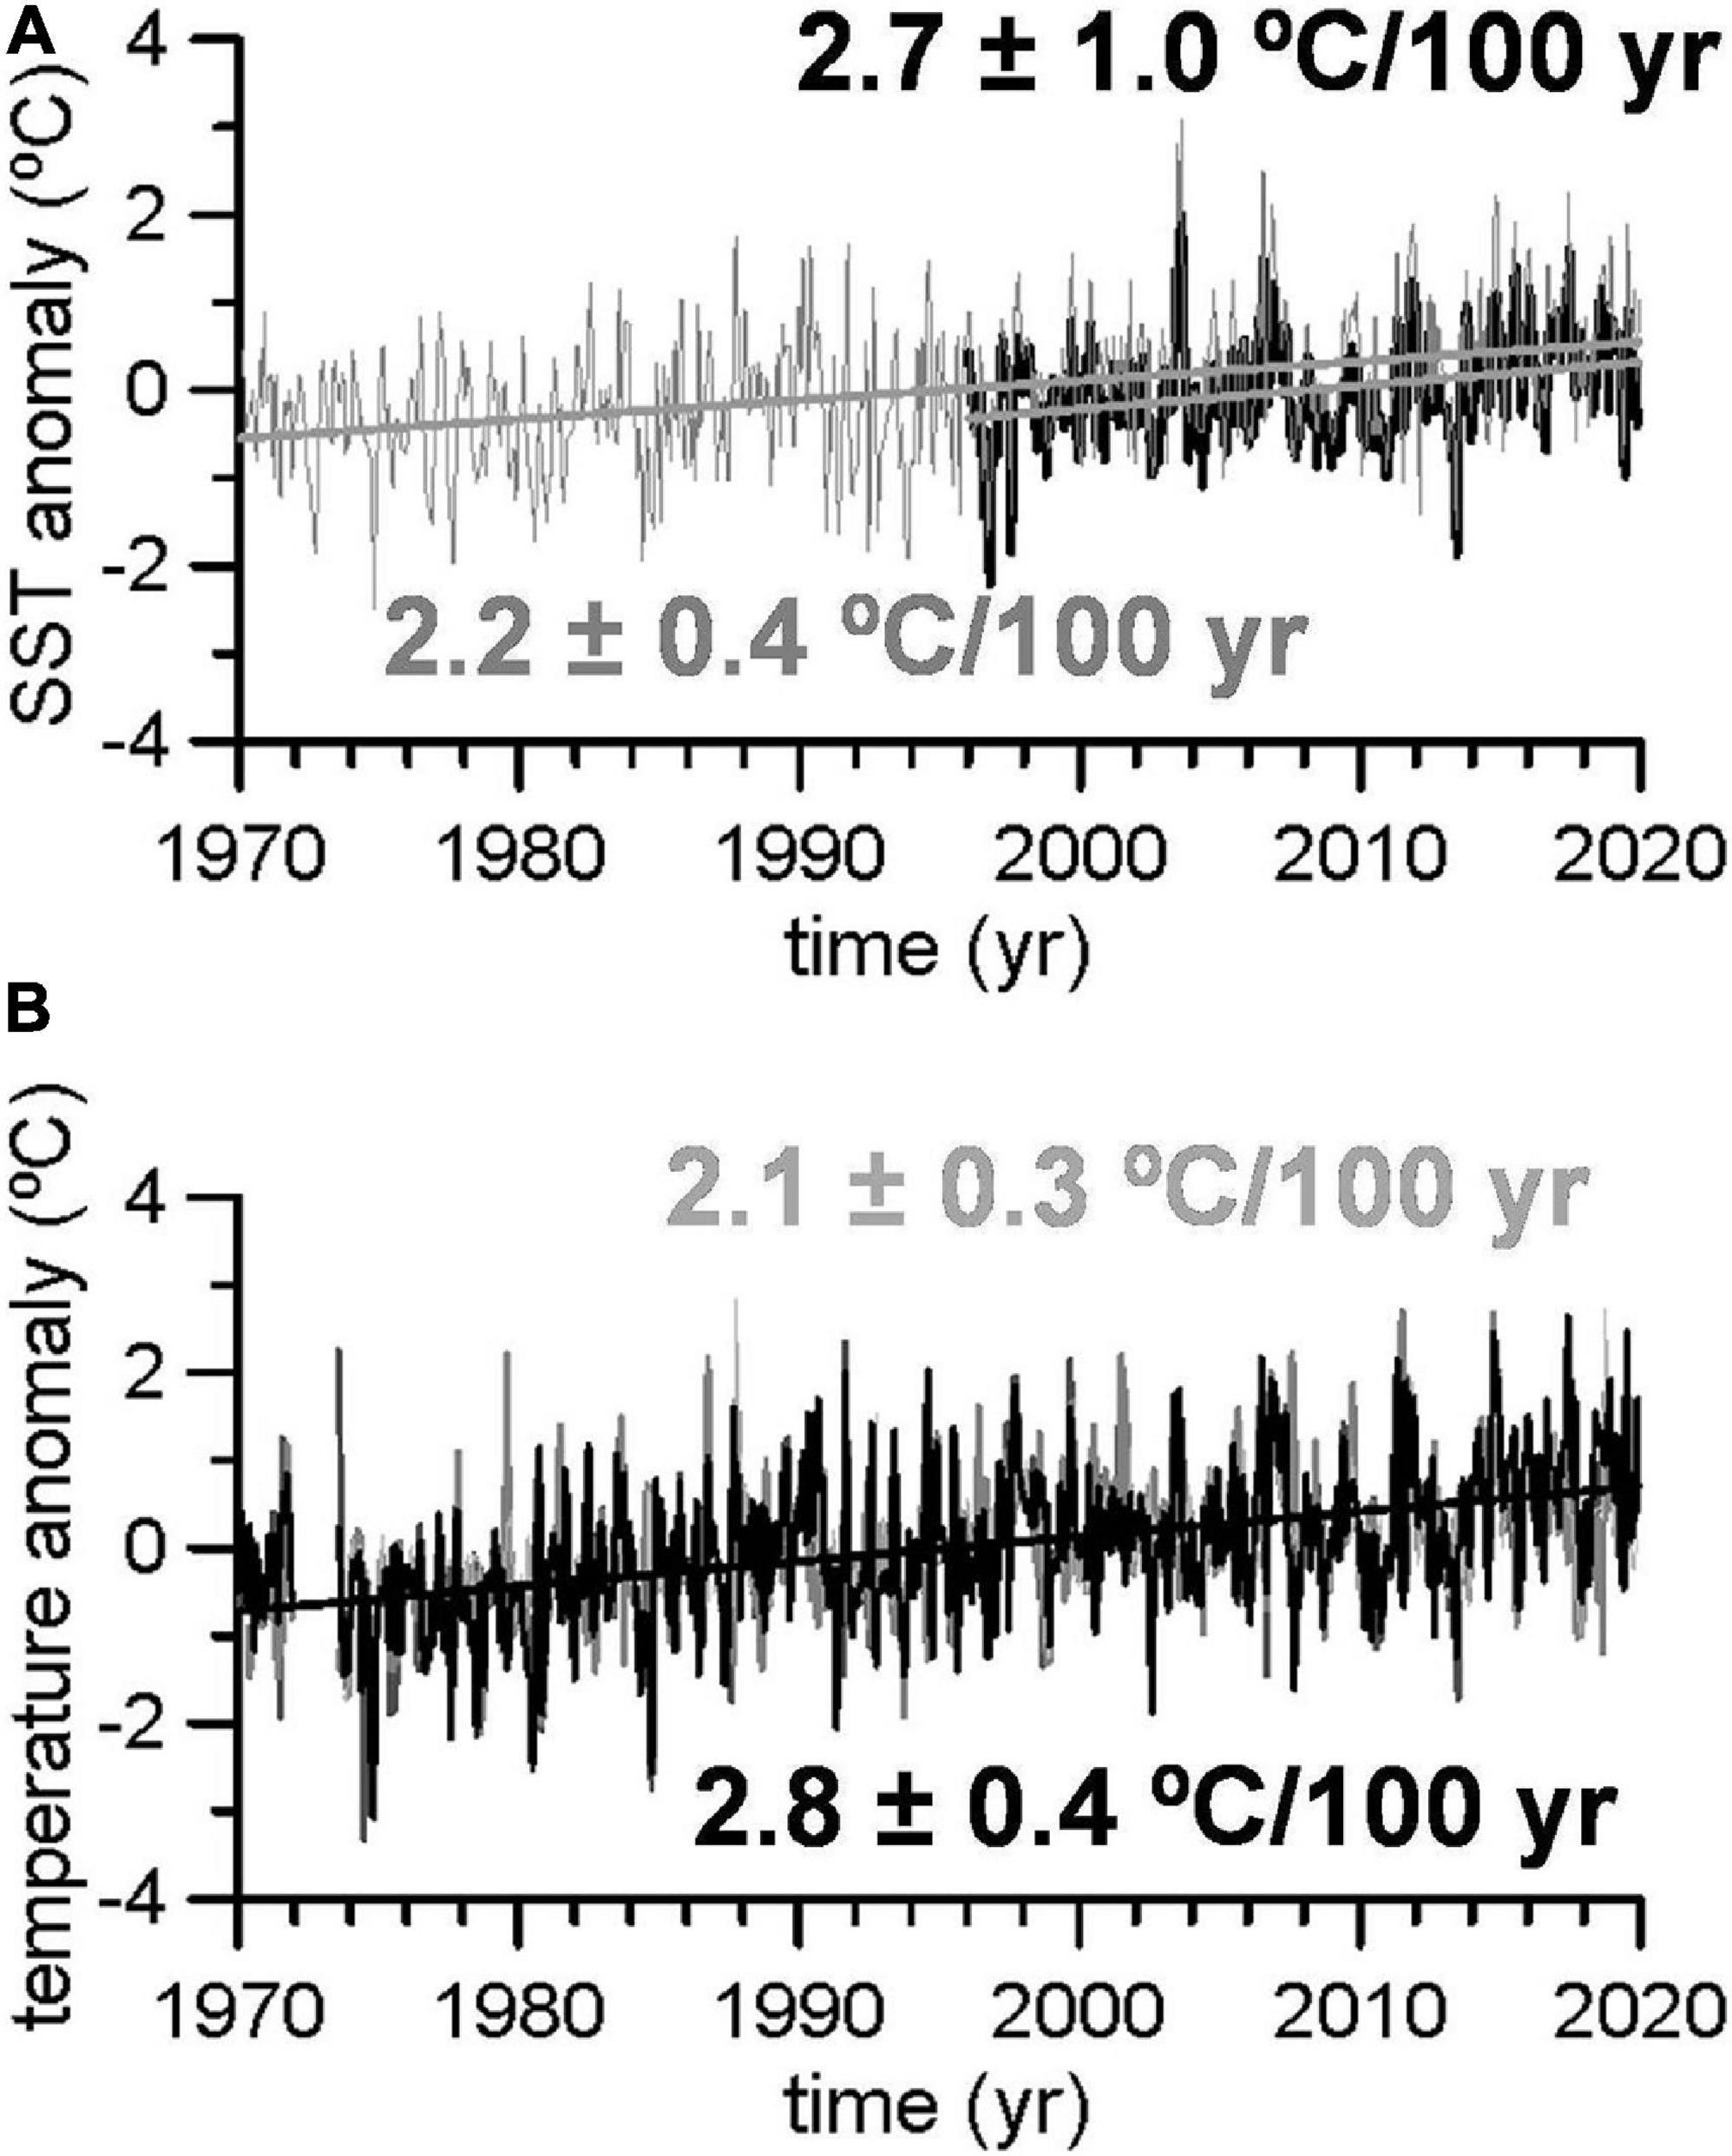
Figure 7. (A) Temperature residuals or anomalies obtained from NCEP SST data at the Balearic Channels (black line, 39°–41° N, 1.9°–3.8° E) and at the Northern Sector (gray line, 41°–42.9° N, 1.9°–3.8° E). The Balearic Channels SST extends from 1996 to 2019, for comparison with the CTD time series. The Northern Sector time series extends from 1970 to 2019 for comparison with l’Estartit temperature time series. (B) Temperature residuals or anomalies at 0, 20, 50, and 80 m depth at the L’Estartit coastal station. The four time series are presented with different colors from black (0 m) to light gray (80 m), although they are not distinguished in this plot because they have very similar behavior.
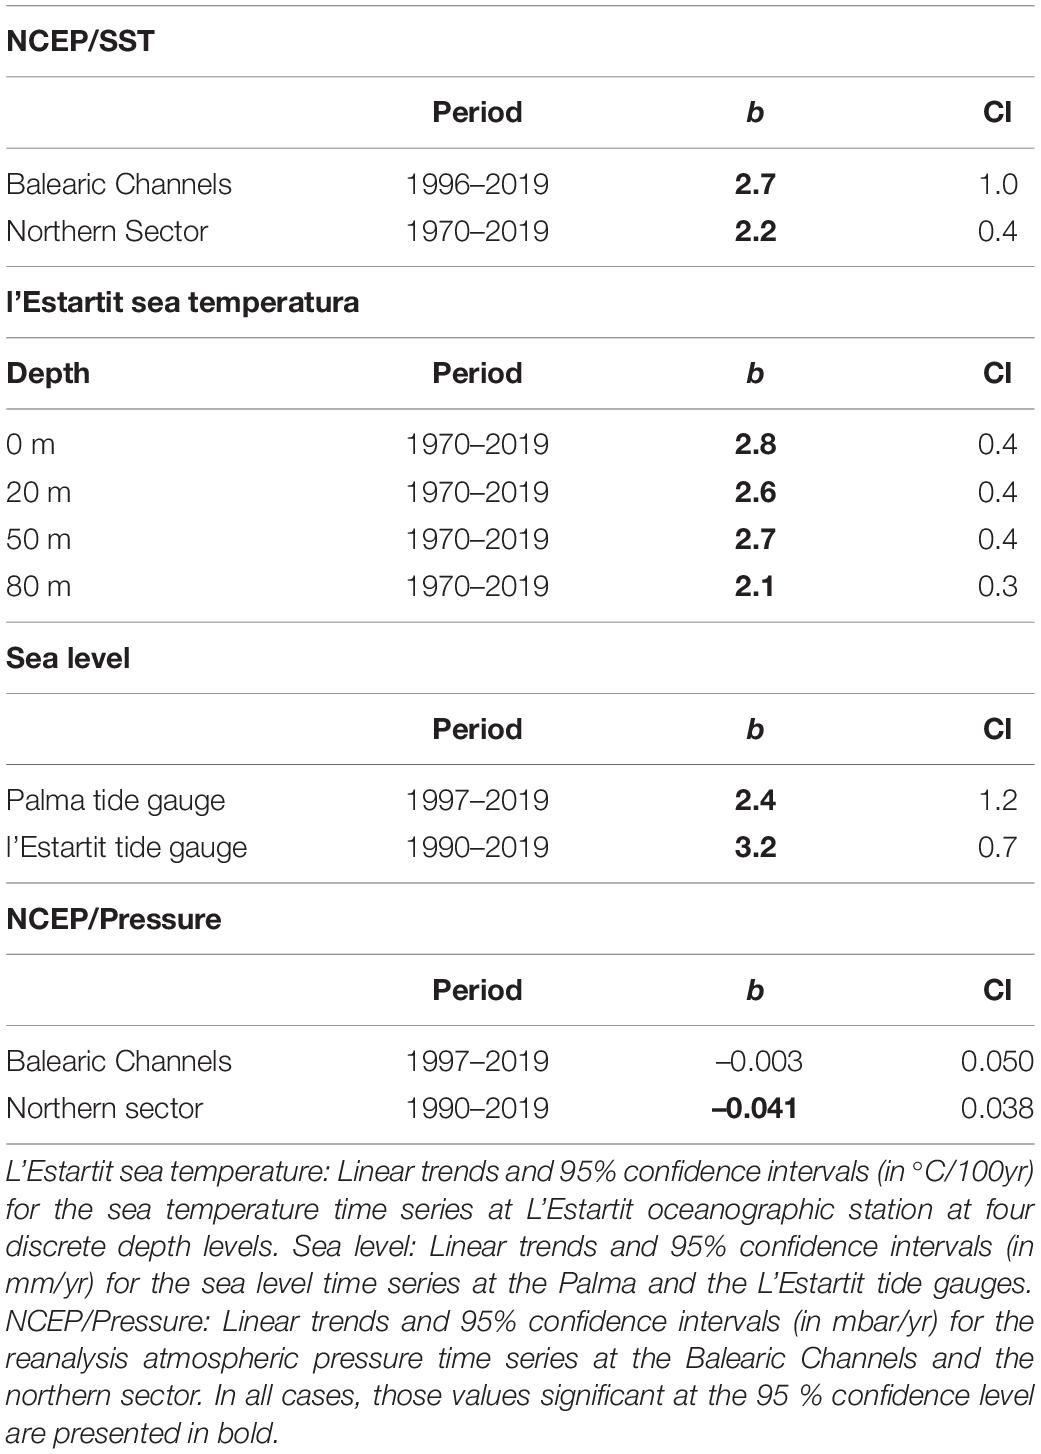
Table 2. NCEP/SST: Linear trends (b) and 95% confidence intervals (CI in °C/100yr) for the reanalysis SST obtained from NCEP.
Figure 8A shows the sea level time series at Palma de Mallorca from 1997 to 2019, and Figure 8B shows the regression of monthly residuals of sea level on atmospheric pressure in the Balearic Channels sector. The sea level and atmospheric pressure anomalies were significantly correlated. The slope of the linear regression indicated that an increase of 1 mbar in atmospheric pressure corresponded to a decrease in sea level of 1.1 cm (see insert in Figure 8B). A similar correlation was found between the sea level at L’Estartit and the atmospheric pressure at the Northern Sector, where a pressure increase of 1 mbar corresponded to a decrease of 1.4 cm in sea level (see insert in Figure 8D). Besides the inverse linear relationship between the sea level and atmospheric pressure at both locations (inverse barometer effect), the sea level increased with linear trends of 2.4 ± 1.2 mm/yr and 3.2 ± 0.7 mm/yr at Palma and L’Estartit, respectively (see Table 2 and inserts in Figures 8A,C). It should be noted that the period covered by both time series is not exactly the same. If the linear trend at L’Estartit is estimated for the same period of time covered by the Palma sea level time series (1997–2019), then the trend estimation is 2.8 ± 1.0 mm/yr (see insert in Figure 8C).
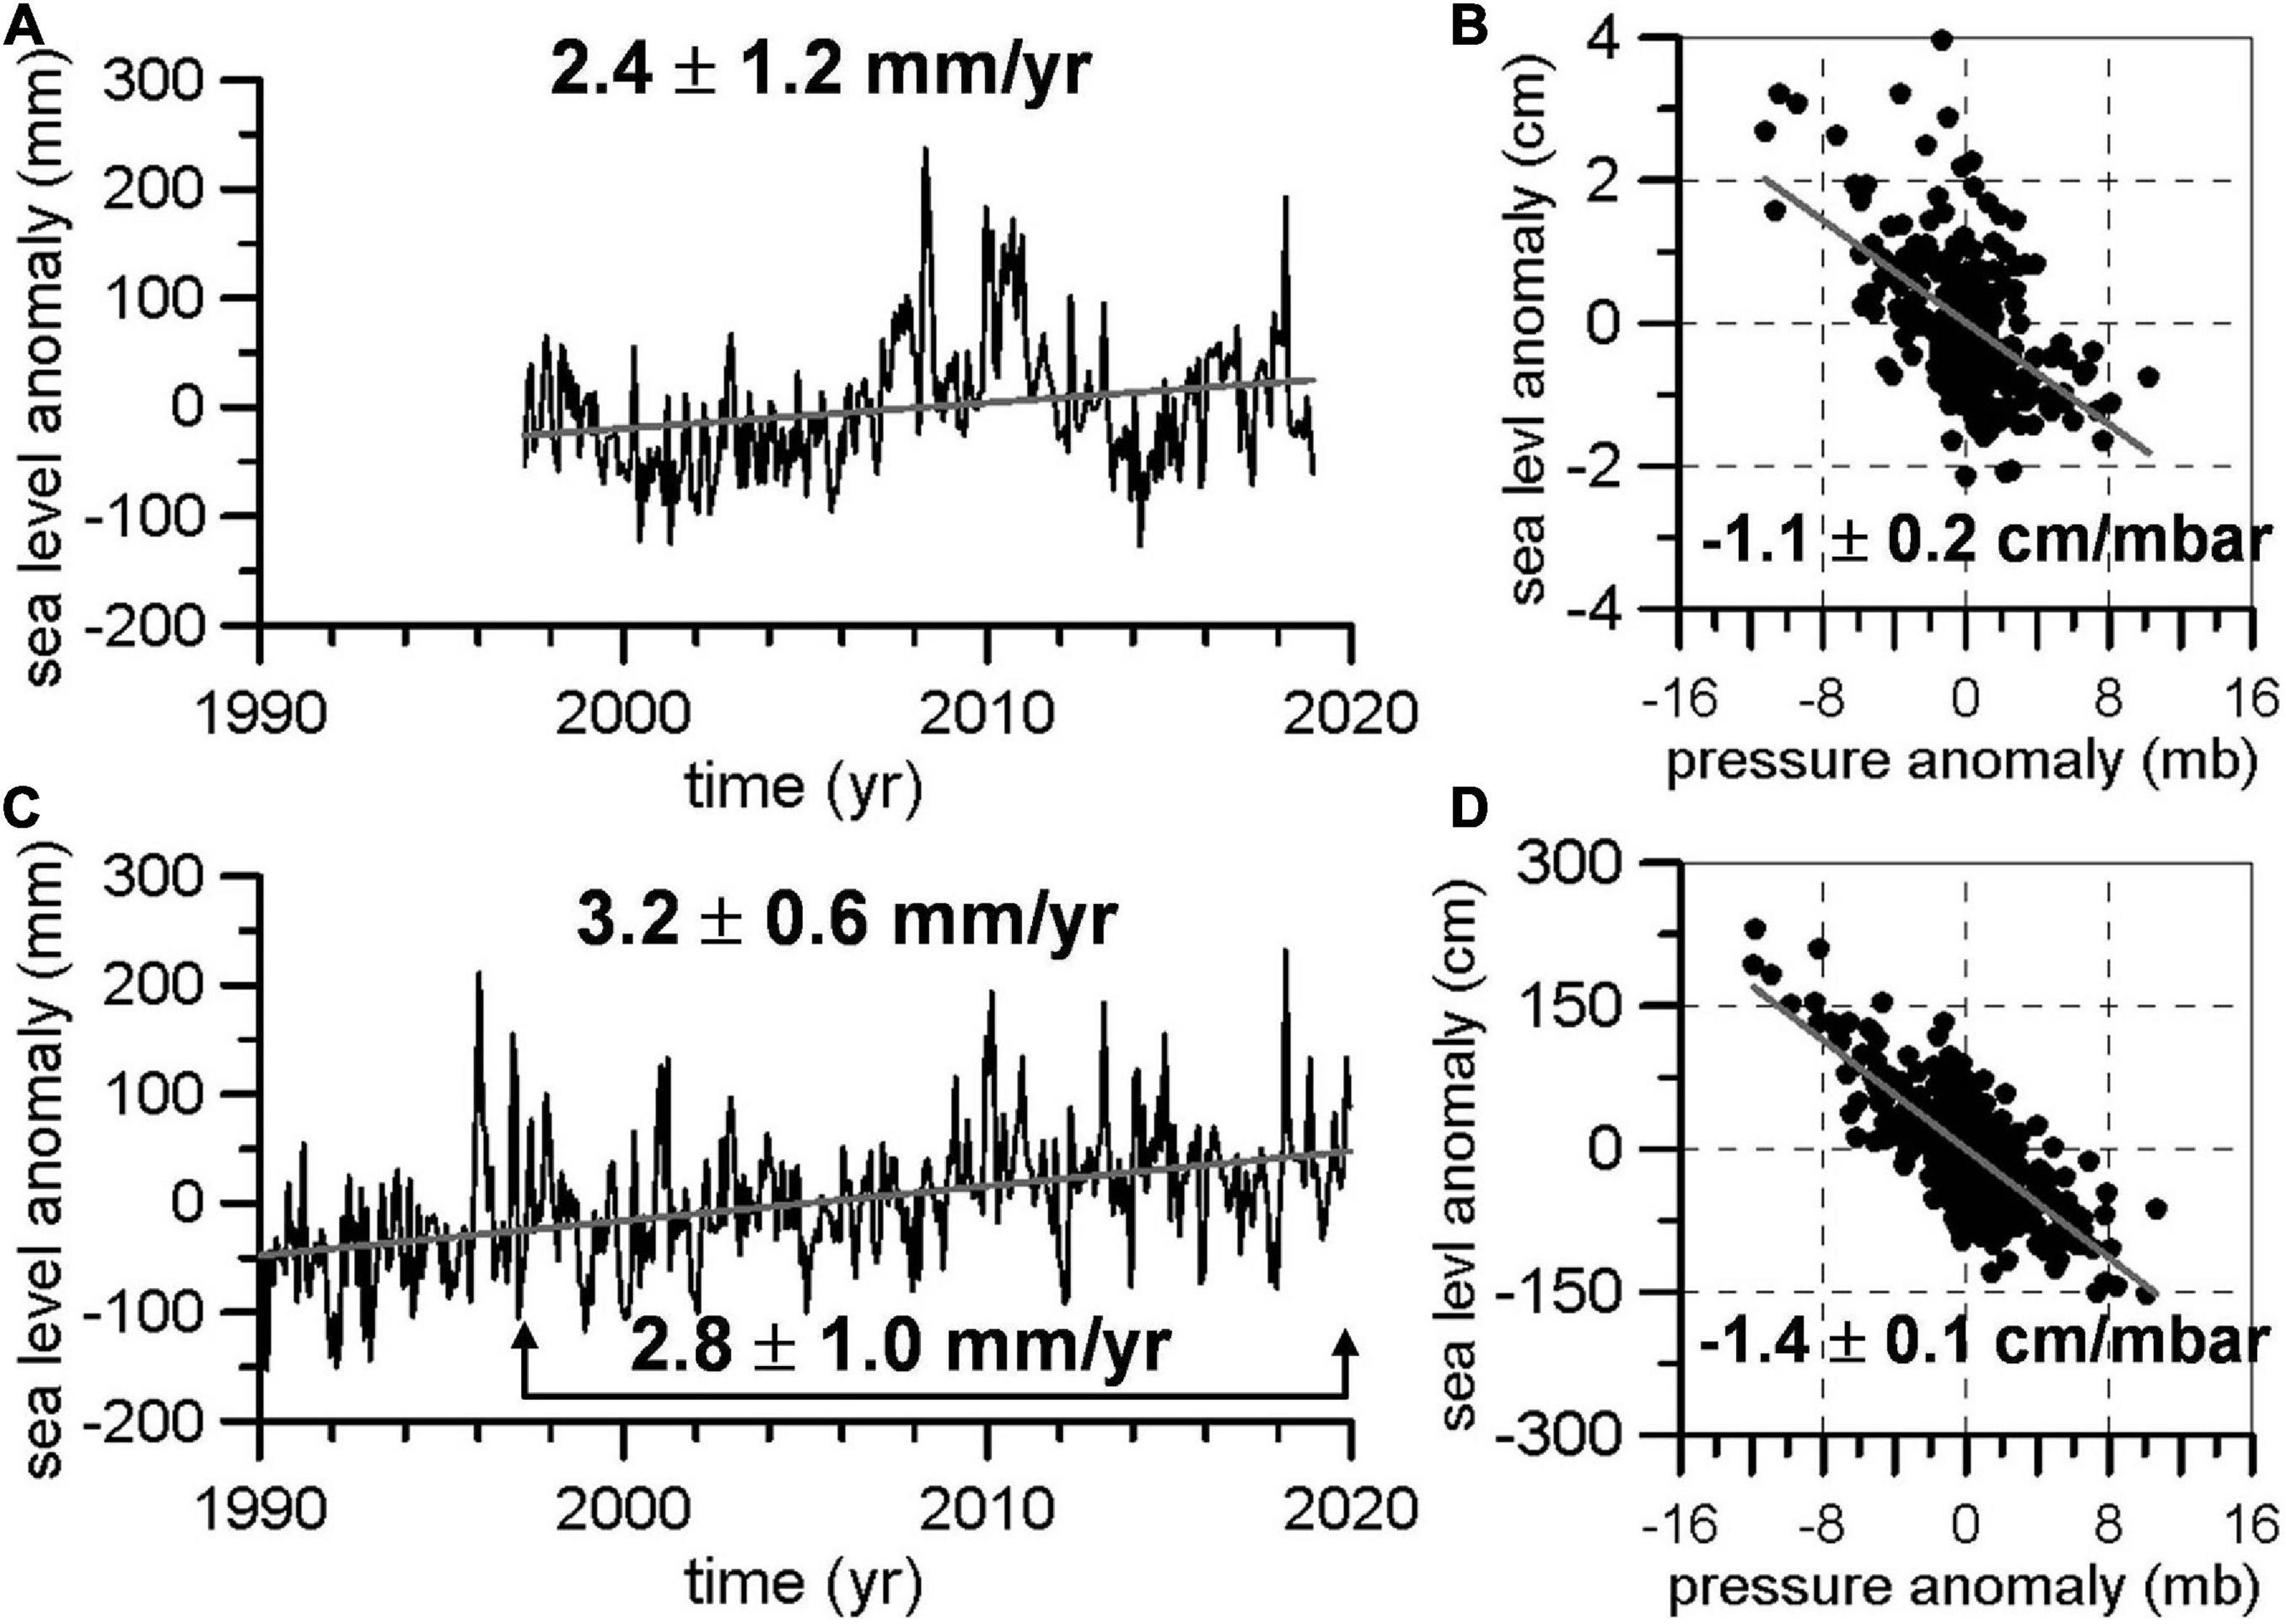
Figure 8. (A) Time series of residuals or anomalies of sea level at the Palma de Mallorca tide gauge. (B) Linear regression of sea level residuals on atmospheric pressure at the Balearic Channels. The linear trend for the sea level time series and the slope for the regression are included. (C) Time series of sea level residuals at the L’Estartit tide gauge. Linear trends for the complete period, and the 1996–2019 period, are included. (D) Linear regression of sea level on atmospheric pressure at the Northern Sector.
The atmospheric pressure decreased along the periods of time corresponding to the sea level time series. The negative trend in the Balearic Channels was –0.003 mbar/yr. According to the inverse barometer effect for this location, this would induce a positive trend of 0.033 mm/yr in the Palma sea level. However, this atmospheric pressure trend was very weak and not statistically significant. The atmospheric pressure decreased at a rate of –0.041 mbar/yr in the Northern Sector (significant, Table 2). This negative trend would induce a positive sea level increase of 0.6 mm/yr.
Figure 9A shows the heat absorbed from the sea surface to 1200 dbar and the heat absorbed from 100 to 1200 dbar. In both cases, the heat absorbed showed similar behavior with strong positive trends of 1.12 and 1.0 W/m2 over 1996–2019, respectively (Table 3). The variance of the absorbed heat time series was higher when the upper 100 dbar were included, which resulted in larger confidence intervals (Table 3). Larger values of the absorbed heat were also obtained when the whole water column was considered. The contribution of the absorbed heat to the sea level increase is reflected in the thermosteric sea level which showed positive and significant linear trends of 1.86 and 1.63 mm/yr in the 0–1200 and 100–1200 dbar layers, respectively (Table 3 and Figure 9B). On the contrary, the halosteric component had an opposite effect on sea level (Figure 9C). The effect of salinity on density dominated over the temperature one and the steric sea level showed a decreasing linear trend (Figure 9D). However, this trend was not statistically significant for the 0–1200 dbar case, very likely because of the large variance of the upper layer. The steric level decreased in a significant way for the 100–1200 dbar layer, with a trend of –0.65 mm/yr over 1996–2019 (Table 3).
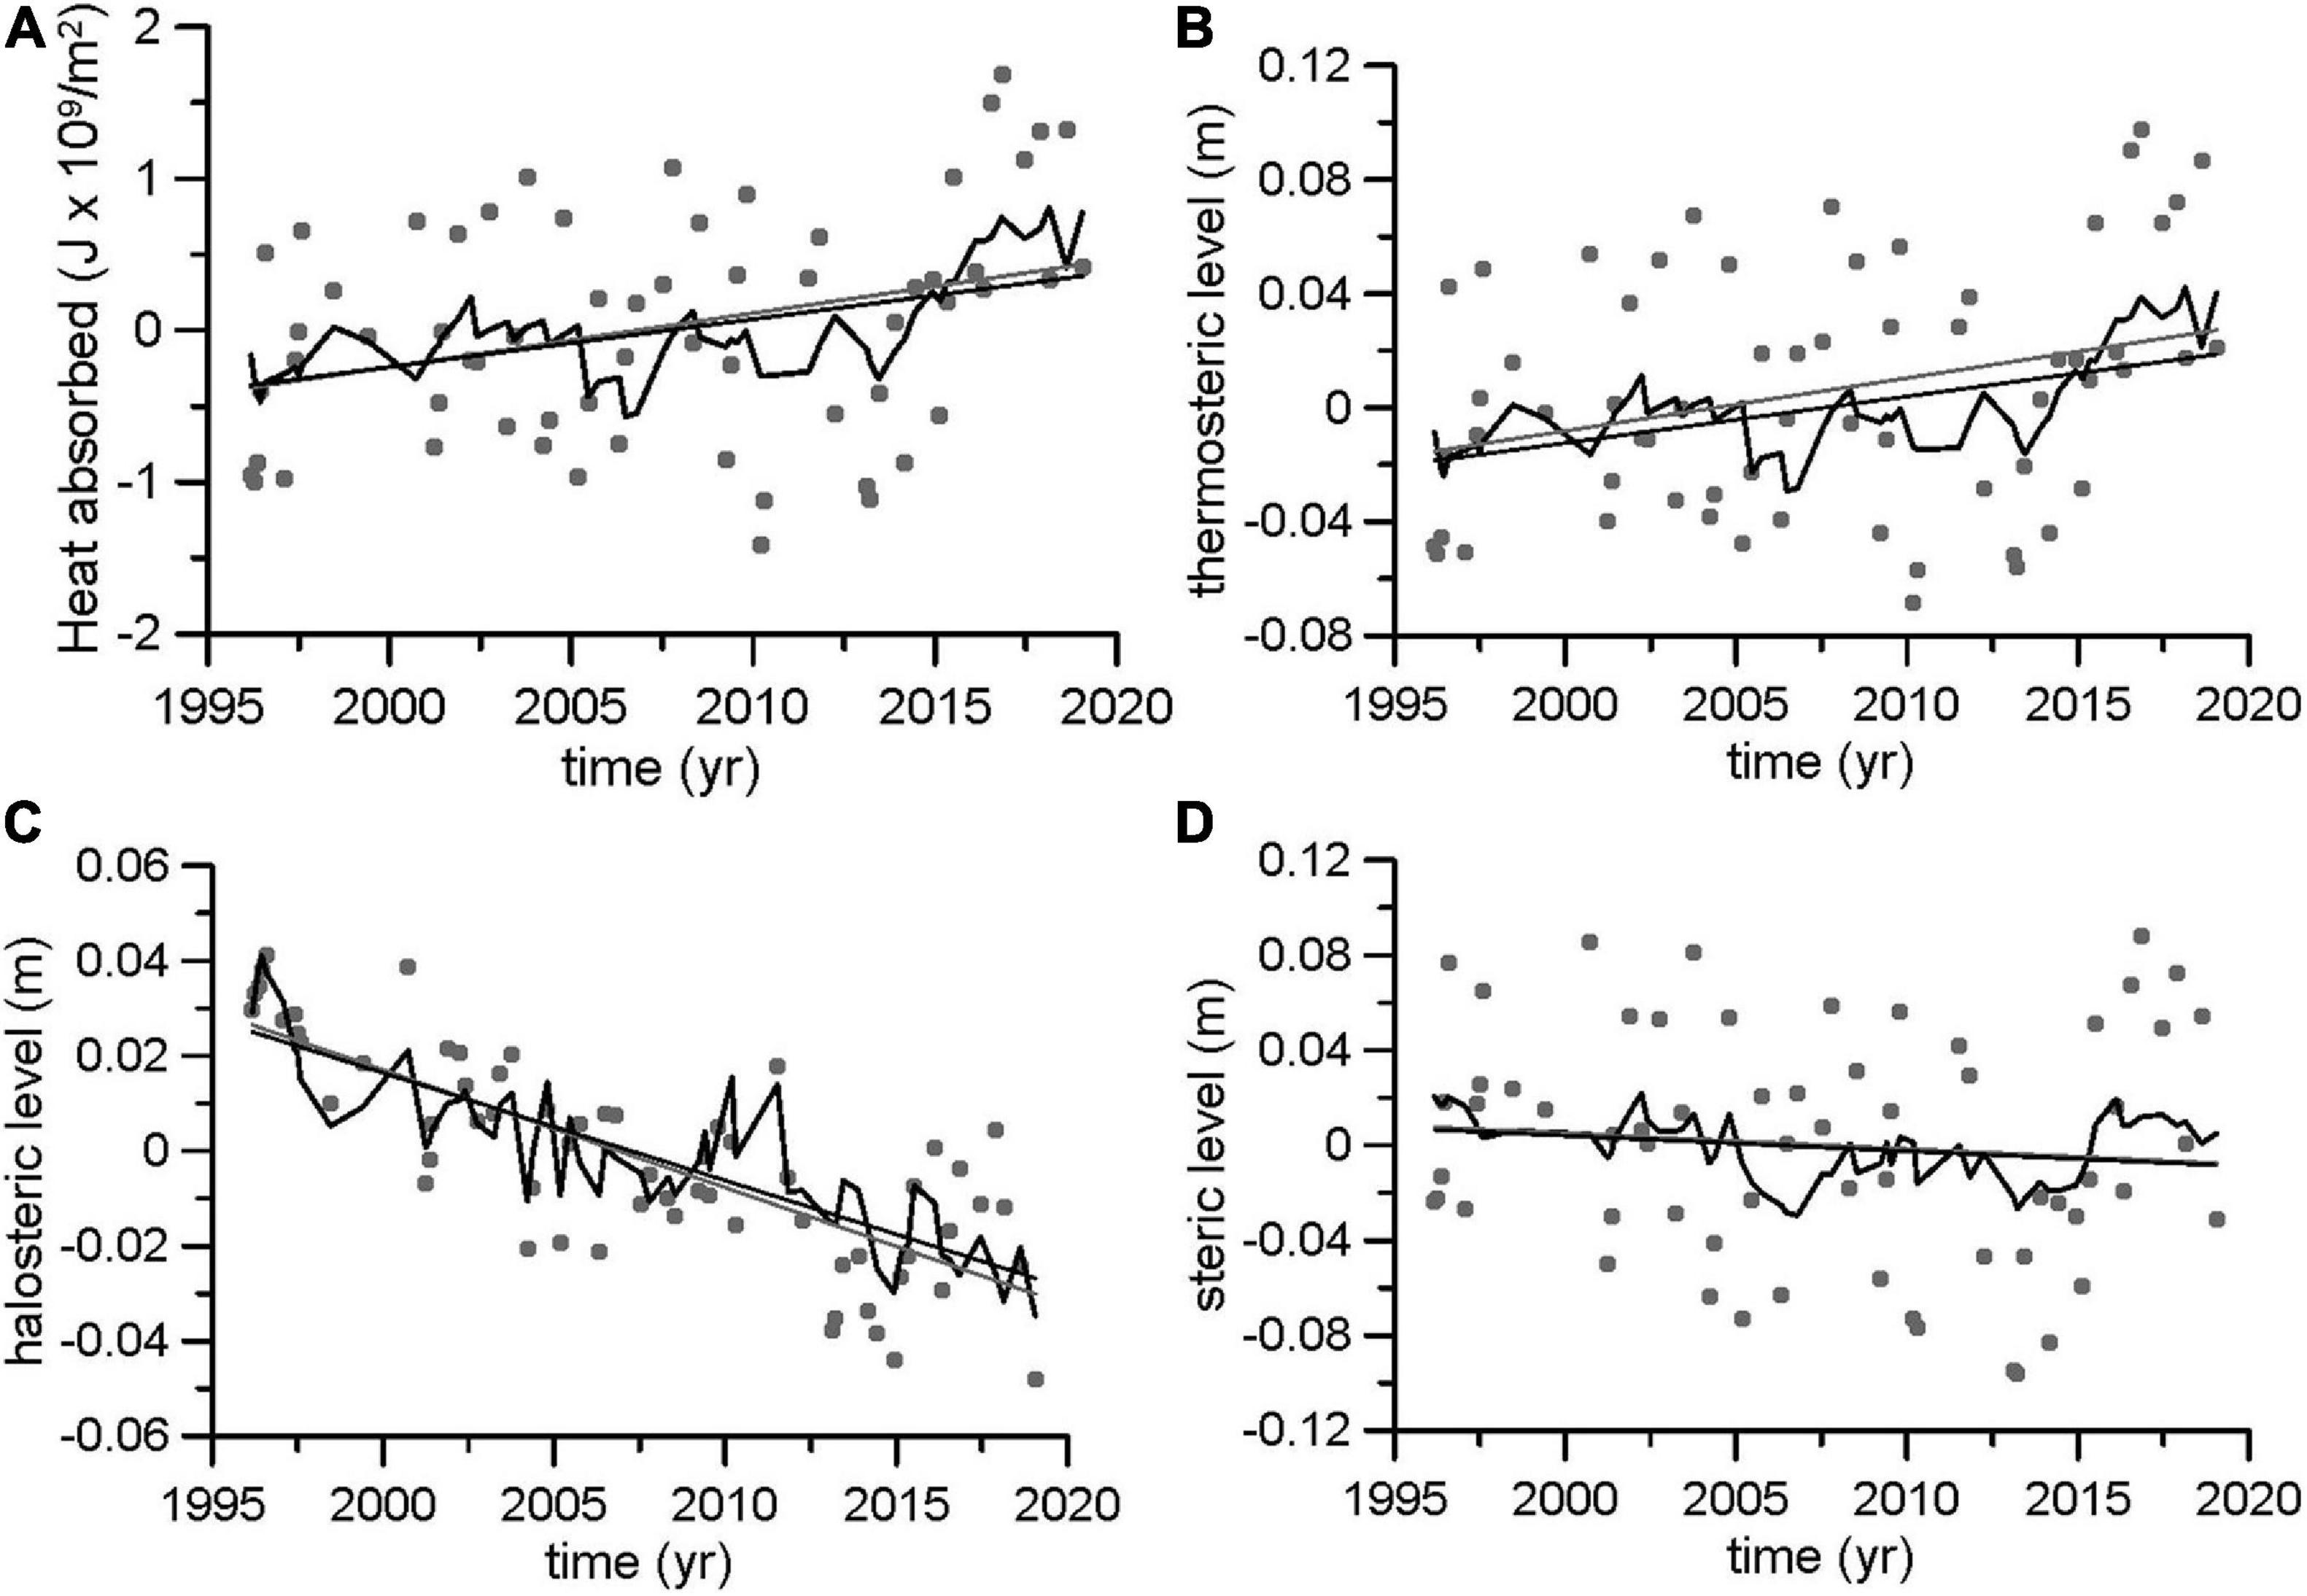
Figure 9. Heat absorbed (in Joules × 109/m2, A), thermosteric (B), halosteric (C), and steric (D) sea level (in m) in the Balearic Channels. For each campaign, the heat absorbed and the steric, thermosteric, and halosteric sea level are estimated as variations from the mean temperature and salinity profile averaged for the complete period. Gray dots correspond to the calculations from the sea surface to 1200 dbar, whereas the black lines correspond to the calculations excluding the upper 100 dbar.
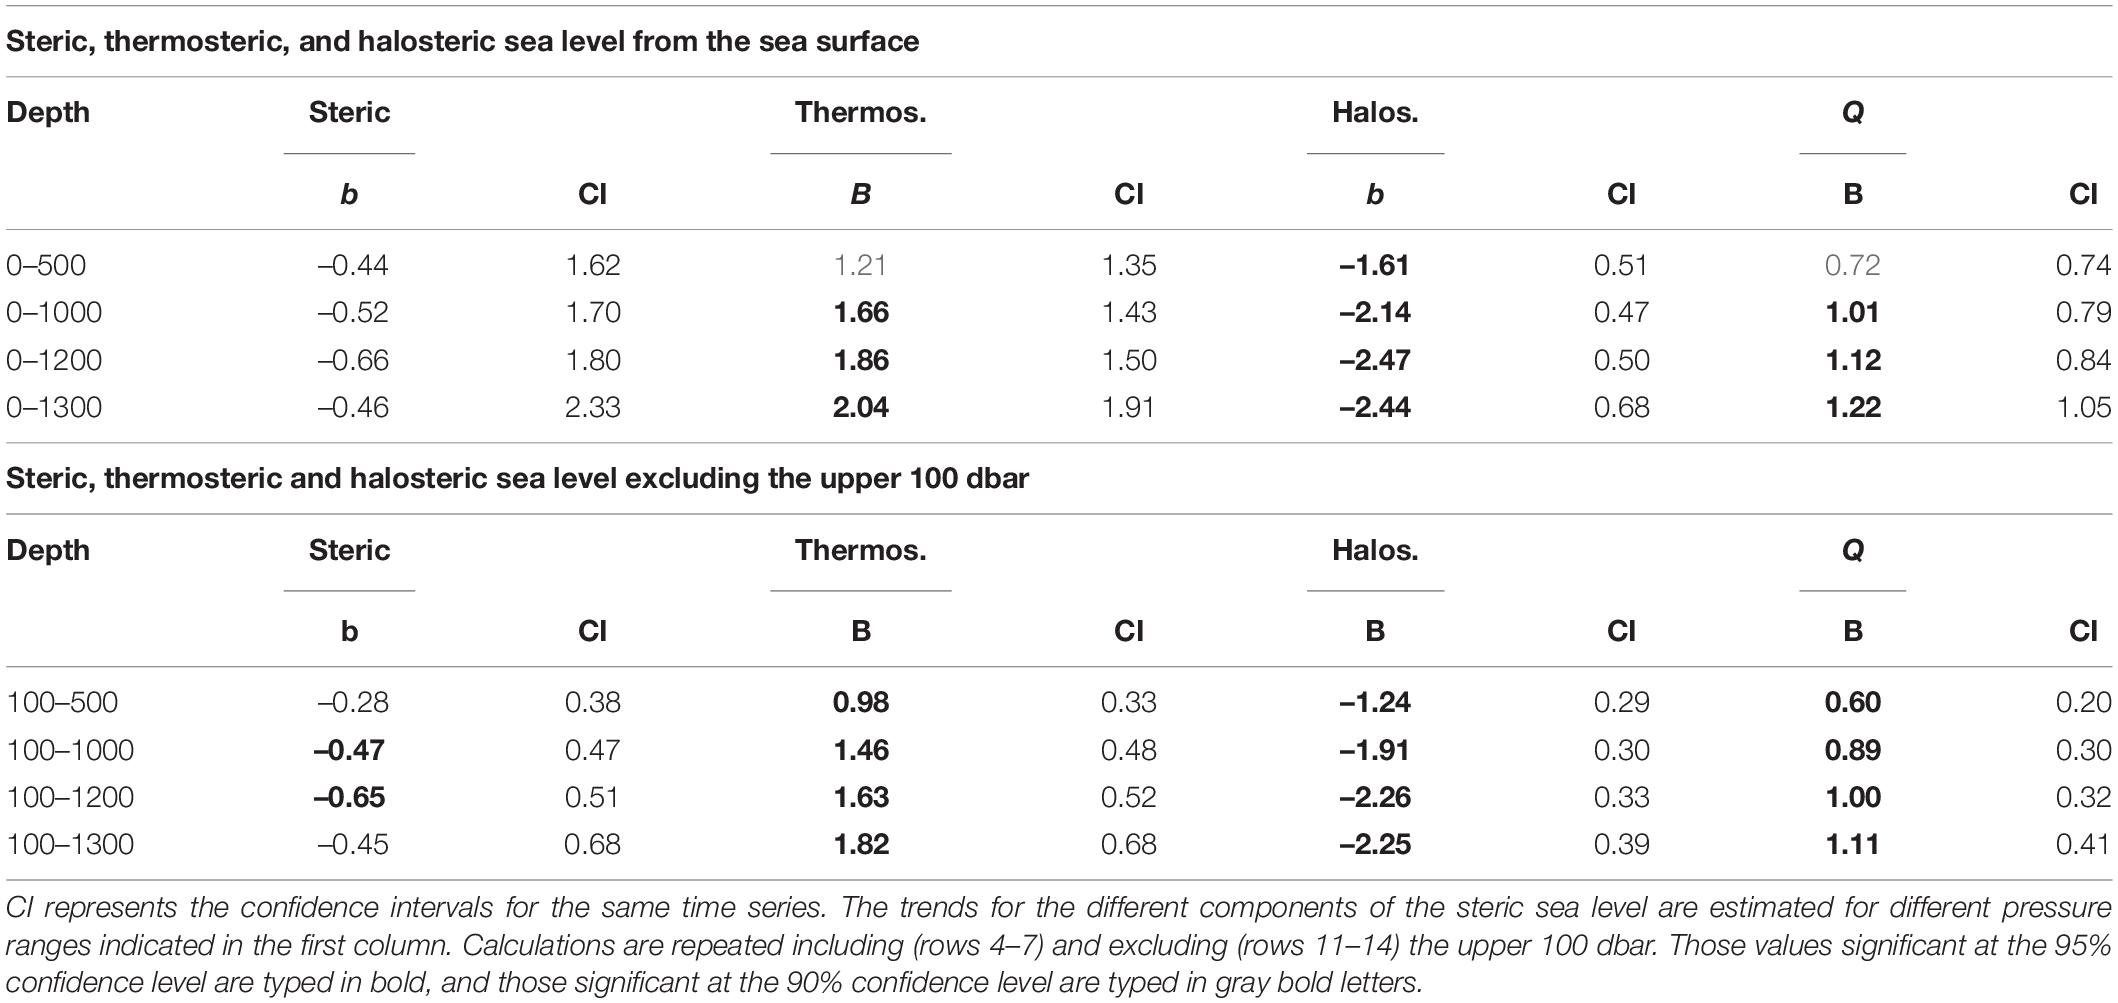
Table 3. Linear trends for the steric sea level, thermosteric sea level, halosteric sea level (b, mm/yr), and heat absorbed by a water column of one square meter (W/m2).
The analysis of a data set, obtained with the same methodology at the same oceanographic stations for a period of 24 years (1996–2019) has shown the temperature and salinity increase of the waters in the Balearic Channels. In this discussion, a distinction is made between the changes operating over long time scales (at least of the order of the length of the complete time series) and those with time scales of a few years or even one decade.
First, we focus on the rate of change in properties for the complete period analyzed 1996–2019. The WIW temperature and salinity have increased. Both changes have compensated each other and no variations in the density and depth level of this water mass have been observed (Table 1 and Figure 4). This result is not dependent on the different methods used to define this water mass and to calculate its hydrographic properties. The temperature trends are around 1.4°C/100yr and the salinity trends range between 0.3 and 0.6/100yr. These significant changes are greater than those reported in previous works (refer to the summary table of results from different works in Garcia Martinez et al., 2018). Our results concerning the LIW properties are also robust and it can be stated that the temperature and salinity of this water mass have increased with rates greater than those observed during the last century with values of∼1°C/100yr and 0.3–0.4/100yr, respectively (Table 1 and Figure 5). Once again, no significant change was observed for the potential density. The depth range occupied by the LIW became shallower at rates ranging between –3 and –4 dbar/yr. In the case that the LIW density had changed, its equilibrium depth would also change and this could explain the upward displacement of this water mass. On the contrary, the constancy of the LIW density suggests that its upward displacement could be linked to changes in the formation rate of deep waters.
Concerning the deep waters, different results were obtained when considering the water masses with σθ > 29.11 kg/m3 (method 1) or those with σθ > 29.1 kg/m3 (method 2). In the first case, the changes in potential temperature and salinity were not statistically significant, whereas the potential density decreased and the depth level occupied by these water masses became deeper with a linear trend of 20 dbar/yr (positive trends indicate higher pressure and therefore deeper levels, see Table 1). In the second case (see Table 1 and Figure 6), this water mass became warmer, saltier, denser, and progressively occupied a shallower depth range. These, apparently contradictory results, simply reflect the impact of inter-annual and decadal variability on the estimation of long-term changes. Except for spring 2001, density values higher than 29.11 kg/m3 started to be observed after winter 2004/2005. Inspecting carefully Figure 6C (see black dots corresponding to method 1), it becomes clear that the changes observed cannot be considered as progressive ones that could be represented by means of a linear trend. There is a sharp density increase during 2005 and 2006 clearly linked to the WMT (López-Jurado et al., 2005; Font et al., 2007; Smith et al., 2008; Schroeder et al., 2010), and then the density of these deep waters decreased and kept constant with values between 29.111 and 29.113 kg/m3, being these values higher than those found in the deep waters of the Balearic Channels prior to 2005. These results simply evidence that changes estimated over short periods of time have to be considered very carefully and not considered as representative of the rate of change for long periods. Figures 6A,B shows that both, potential temperature and salinity, estimated by means of the method 2, experienced warming periods from the beginning of the series to 2003, from 2005 to 2010 and from 2012 to the end of the series, with cooling periods between them. Consequently, both time series exhibit three relative maxima. Very similar oscillations can be observed for the potential temperature and salinity of the WIW and LIW (Figures 4, 5), although the maximum and minimum values would not correspond to exactly the same years. This oscillatory behavior is very likely the response of water masses to the internal variability of the ocean-atmosphere system, and it implies that selecting shorter periods of time would yield negative trends in some cases and much higher positive trends in others. A similar result was evidenced by Schroeder et al. (2019) when analyzing the waters flowing into the WMED through the Sicily Channel at 400 m depth. The period analyzed, 1993–2018, was comparable to the one used at the present work and these authors found that the waters flowing from the EMED had increased their temperature and salinity at rates of 0.028°C/yr (2.8°C/100yr) and 0.008 yr–1 (0.8/100yr) which are even larger than the rates presented for intermediate and deep waters in the Balearic Sea in the present work. However, these authors also found sub-periods with different behavior, with negative trends from 2004 to 2010 and positive and intense trends from 2010 to 2018. In summary, intense changes observed over periods of 5 or even 10 years do not seem to reflect long-term changes in the heat and salt balance of the WMED, associated with long-term changes in the heat and fresh water fluxes with the atmosphere. Changes over short periods of time may simply be the consequence of heat and salt redistributions within the basin caused by changes in the circulation of water masses or alterations in the formation rates or sites of such water masses. On the contrary, the three consecutive temperature and salinity maxima observed in the WIW, LIW and WMDW time series (Figures 4–6) show increasing values that account for the linear trends reported for the complete period. Nevertheless, we have to admit that 24 years could also be considered as a short period of time for establishing the long-term behavior of water masses.
The lack of significance for the temperature trends of the AW and the lower degree of confidence for the salinity trends (90%, Table 1) could cast some doubts about the changes of the Mediterranean upper layer. WIW is formed by the winter cooling of AW in the continental shelf of the Gulf of Lions, the Ligurian Sea and the Catalan shelf (López-Jurado et al., 1995; Juza et al., 2013, 2019), without the influence of LIW. Therefore, the observed warming of this water mass should be associated with the warming or lower cooling of the AW. Concerning the deep waters in the WMED, previous works had suggested that their warming and salting was caused by the salinity increase of the water masses contributing to the formation of WMDW as saltier waters would reach the deep water density at a higher temperature. On the contrary, it could be argued that saltier waters, if affected by the same heat fluxes at the sea surface, would produce deep waters saltier but with the same temperature as in previous decades. A similar argument was proposed by Schroeder et al. (2010) to explain that the warming and salting of the new WMDW formed after winter 2004/2005 could not be only the result of extreme weather conditions during winter. The results already presented in this work show that the LIW, contributing to the WMDW formation, warmed during the period 1996–2019. Analyzing the L’Estartit temperature time series allowed establishing that the AW also experienced intense warming. Therefore, the warming of the WMDW is probably caused by the contribution of warmer AW and LIW, which in turn, should be linked to changes in the sea-atmosphere heat fluxes. Furthermore, the L’Estartit time series extend from 1970 to 2019. These 50-year time series make us conclude that the warming of the AW in the WMED is not the result of decadal variability, as the trends at L’Estartit can be representative of long-term changes. These results are confirmed by the analysis of the reanalysis SST time series in the Northern Sector and the Balearic Channels (Table 2). A similar argument could be used for the long-term salinity increase of deep waters. The salinity of the AW and LIW has increased from 1996 to 2019 (Table 1 and Figures 3, 5) and these positive trends have been transmitted to the deep waters by means of their contribution to the deep water formation.
According to the results dealing with changes affecting to the complete period of time (1996–2019), it can be concluded that the whole water column has warmed and increased its salinity in the Balearic Channels. These changes have affected all the water masses present at different depth ranges. As a consequence, the heat content of the water column (0–1200 dbar) has increased at a rate equivalent to a continuous heat uptake of 1.12 W/m2. This rate is reduced to 1 W/m2 when the upper 100 dbar are excluded (Table 3 and Figure 9A). It should be noted that the global ocean energy gain was equivalent to 0.55 W/m2 for the period 1971–2010. This value increased to 0.71 W/m2 for the period 1993–2010 (Stocker et al., 2013). The trends shown in the present work are higher than those reported for the global ocean. This could indicate higher sensitivity of the Mediterranean Sea to the radiative imbalance of the Earth Climate System, maybe because of its reduced dimensions and semi-enclosed characteristics. However, the values reported for the global ocean relay within the uncertainty range estimated for the Mediterranean trends (see confidence intervals in Table 3). Another important result is the acceleration of the heat gain of both the global ocean (Stocker et al., 2013) and the WMED. The values estimated in the Balearic Channels from 1996 to 2019 range between 1 and 1.12 W/m2 whereas those estimated by Vargas-Yáñez et al. (2017) for the period 1943–2015 in the WMED were between 0.2 and 0.6 W/m2.
The heat absorbed by the water column has contributed to the sea level increase through the thermal expansion. The salinity increase seems to have had a larger influence since the steric sea level shows a decreasing trend around –0.6 mm/yr (Table 3 and Figure 9). Jordá and Gomis (2013) showed that the steric component of sea level had decreased from 1960 to 2000 with a trend ranging between –0.3 and –0.9 mm/yr, depending on the hydrographic database used. This negative trend was due to an important contribution of the halosteric component, but also of the thermosteric one. Although the negative contribution of the halosteric component is in agreement with our results, the thermosteric negative contribution would not be supported by the present ones. The contribution of the halosteric component to the change of sea level along the 21st century is an open and interesting question as projections based on different emission scenarios differ in the salinity behavior of the Mediterranean Sea (Jordà et al., 2017). These discrepancies arise from the uncertainty in the salinity changes of the AW flowing into the Mediterranean Sea. According to some numerical simulations, the melting of polar ice would reduce the salinity of the AW flowing into the Mediterranean Sea and consequently of the MWs. On the contrary, other models show an increase of the MWs salinity as it would be dominated by the increase of evaporation and the decrease of precipitation projected for the 21st century in the Mediterranean region (Somot et al., 2006; Jordà et al., 2017). The time series analyzed in the present work show that, at least since the end of the 20th century and for the beginning of the 21st, the salinity of the different MWs is increasing and the rate of change is accelerating. An additional factor affecting the variations of sea level is the atmospheric pressure. Considering a negative trend of –0.003 mbar/yr and an inverse barometer effect of –1.1 cm/mbar in the Balearic Channels and at the Palma tide gauge, it can be estimated that the atmospheric pressure induced a positive trend of 0.033 mm/yr in sea level (the atmospheric pressure trend was very weak and not significant). The sea level trend at the Palma tide gauge was 2.4 mm/yr. Removing the steric component and the atmospheric pressure components, the linear trend for sea level caused by changes in the mass component is 3 mm/yr. The sea level at L’Estartit tide gauge has a linear trend of 3.2 mm/yr over 1970–2019. Considering the period 1997–2019 for comparison with the Palma tide gauge time series, the linear trend in sea level decreases to 2.8 mm/yr. Considering the negative trend of atmospheric pressure for the Northern Sector (–0.041 mbar/yr), and the inverse barometer effect for this region (–1.4 cm/mbar), it can be estimated an increase of 0.6 mm/yr in sea level associated with this effect. Taking into account the steric sea level estimated from the CTD time series in the Balearic Channels, the mass component of sea level at L’Estartit from 1997 to 2019 would be 2.9 mm/yr. Hence, when the atmospheric pressure and the steric component are considered, both the L’Estartit and Palma sea level time series show the same positive trends.
Besides these processes acting over long-term periods, or at least during the complete duration of the time series, there are abrupt changes that can produce alterations of the water mass properties on time scales of very few years. The WMT is probably the most marked event of such sudden and sharp changes in the WMED. Figure 5A shows that the potential temperature of LIW increased in a continuous way from 2000 to 2004 whereas the salinity of this water mass increased from 1996 to 2004. Both time series have a relative maximum during early 2004, before the onset of the WMT. The effect of salinity on density prevailed over that of temperature and the potential density increased from ∼29.065 kg/m3 to ∼29.095 kg/m3, which approximately correspond to the lower and upper limits of this water mass (Figure 2). To better interpret these results, the temperature and salinity profiles for each campaign were compared with the reference profiles obtained for the complete time series and the observed changes were decomposed into changes on isobaric levels, changes on isopycnal surfaces and changes caused by heaving, that is, vertical displacements of the isopycnals (Figure 10; Bindoff and McDougall, 1994; Zunino et al., 2012). Figures 10C,D shows changes in isobaric levels and shows that the temperature and the salinity at 600 dbar were lower than the reference values during the initial part of the time series (negative values), and continuously increased reaching a relative maximum in 2004. This result is the same already outlined in Figure 5. The isopycnal surfaces that occupied the 600 dbar level during this initial period corresponded to waters fresher and cooler than those corresponding to the reference profiles and these isopycnal surfaces progressively increased its temperature and salinity. The heaving contribution was positive, which means that this isobaric level was also occupied by lighter isopycnals, that is, isopycnal surfaces that occupied shallower levels in the reference profiles. This contribution slightly decreased from 1996 to 2004, indicating that the 600 dbar level was replaced by less shallow isopycnals. This would be the effect of an upward displacement of the isopycnals which is better observed in the reduction of the pressure levels of the isopycnals between 28.944 kg/m3 and 29.091 kg/m3 (Figure 11), which correspond to the density range of LIW (Figure 2). In spring 2004–2005, the potential temperature and salinity of the LIW core (Figures 5A,B) suffered a very abrupt decrease which was also observed in the temperature and salinity changes on isobaric surfaces in Figures 10C,D. This change was initially caused by a strong upward displacement of isopycnals and by the freshening and cooling of the isopycnals occupying this isobaric level. The effect of the vertical displacement was intensified during autumn 2005 and accounted for the cooling and freshening at the 600 dbar level. On the contrary, the contribution of the changes on isopycnals during autumn 2005 was positive, as they became warmer and saltier. These vertical movements can also be seen in Figure 11 where the above-mentioned isopycnals were displaced to lower pressure values. The upward displacement of isopycnals was accentuated during 2006 and caused a further decrease of the temperature and salinity at 600 dbar, although it was observed warming and salting on isopycnal surfaces. This process could also be observed at deeper levels. The 1000 dbar isobaric level is located in the mixing line between LIW and WMDW. This level experienced a temperature and salinity decrease caused by the upward displacement of isopycnals from 2004 to 2005. Such isopycnals also became fresher and cooler during 2004 and then warmer and saltier during 2006. The isopycnals in the range 29.103–29.108 kg/m3 experienced a very large upward displacement that in some cases was from 1158 to 640 dbar (Figure 11). In addition, new density values appeared at the bottom layers of the Balearic Channels (e.g., the 29.111 kg/m3 value in Figure 11).
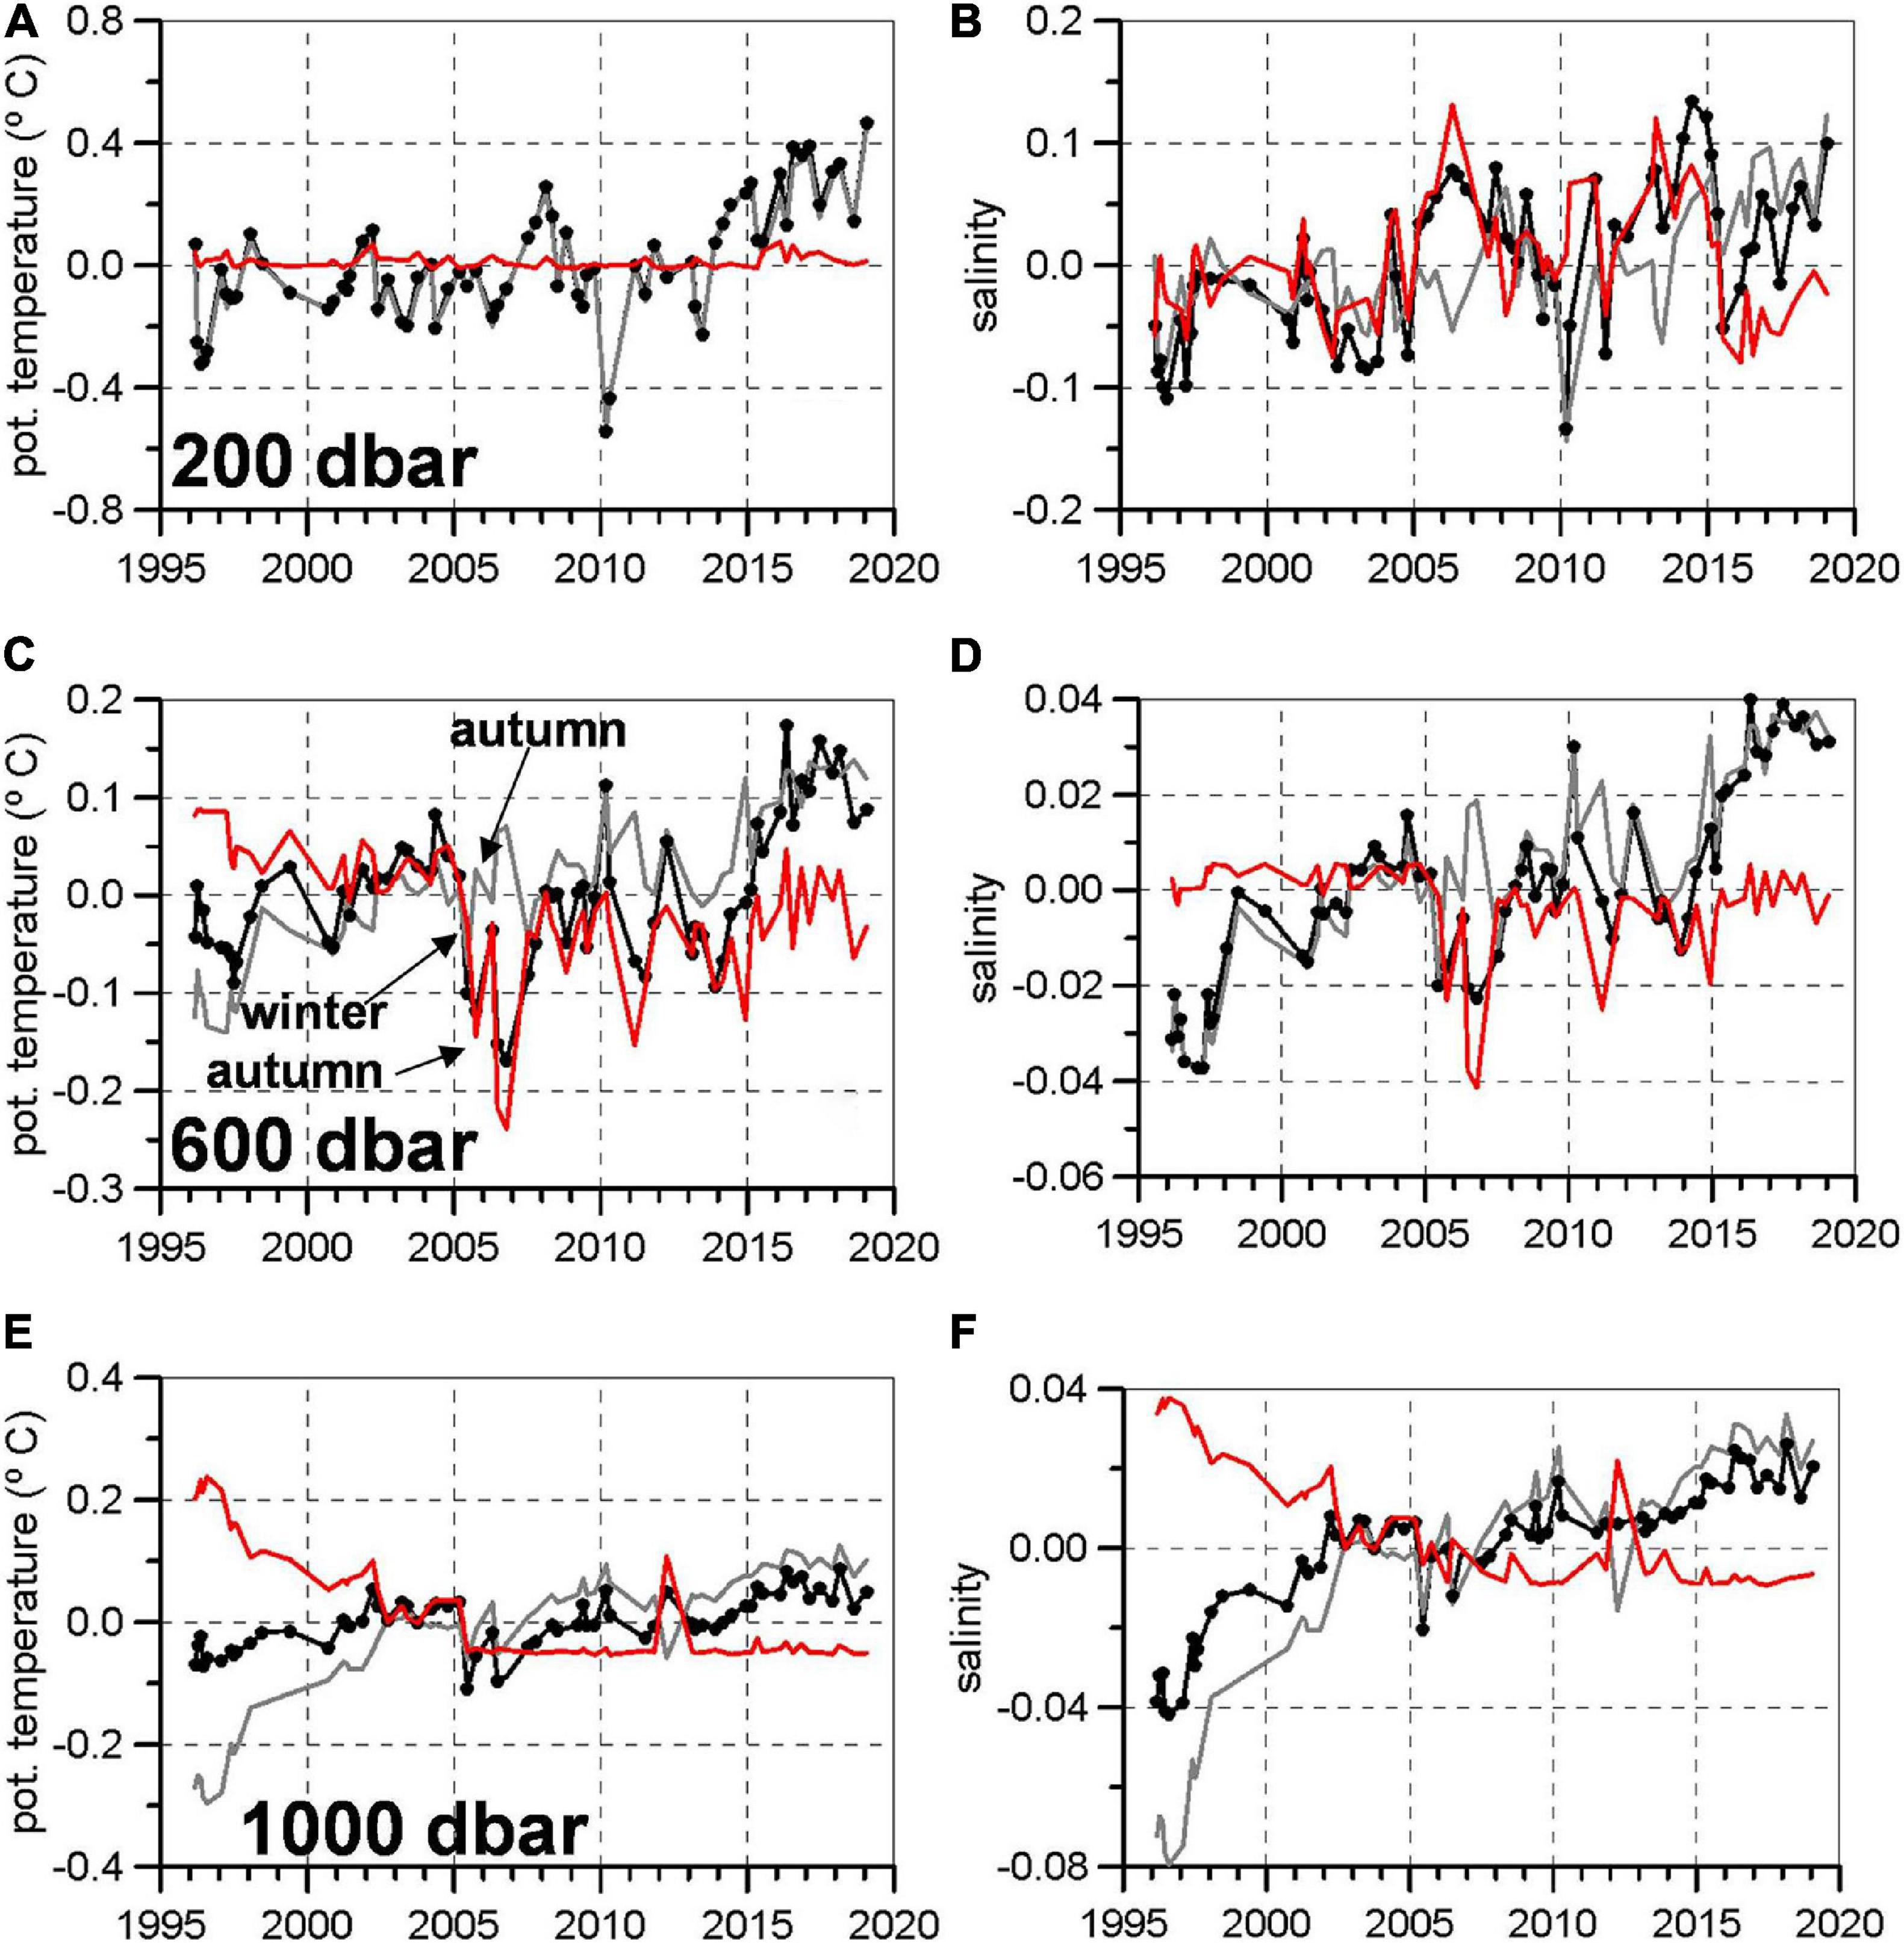
Figure 10. Potential temperature (A,C,E) and salinity (B,D,F) variations from reference profiles (averaged for the complete time series) at three selected isobaric levels representative of different water masses: 200 dbar (WIW), 400 dbar (LIW), and 1000 dbar (DW). For each variable and isobaric level, the black line represents changes on isobaric levels, the gray line represents changes on isopycnals, the red line represents changes caused by isopycnal heaving, and black dots are the sum of isopycnal and heaving changes.
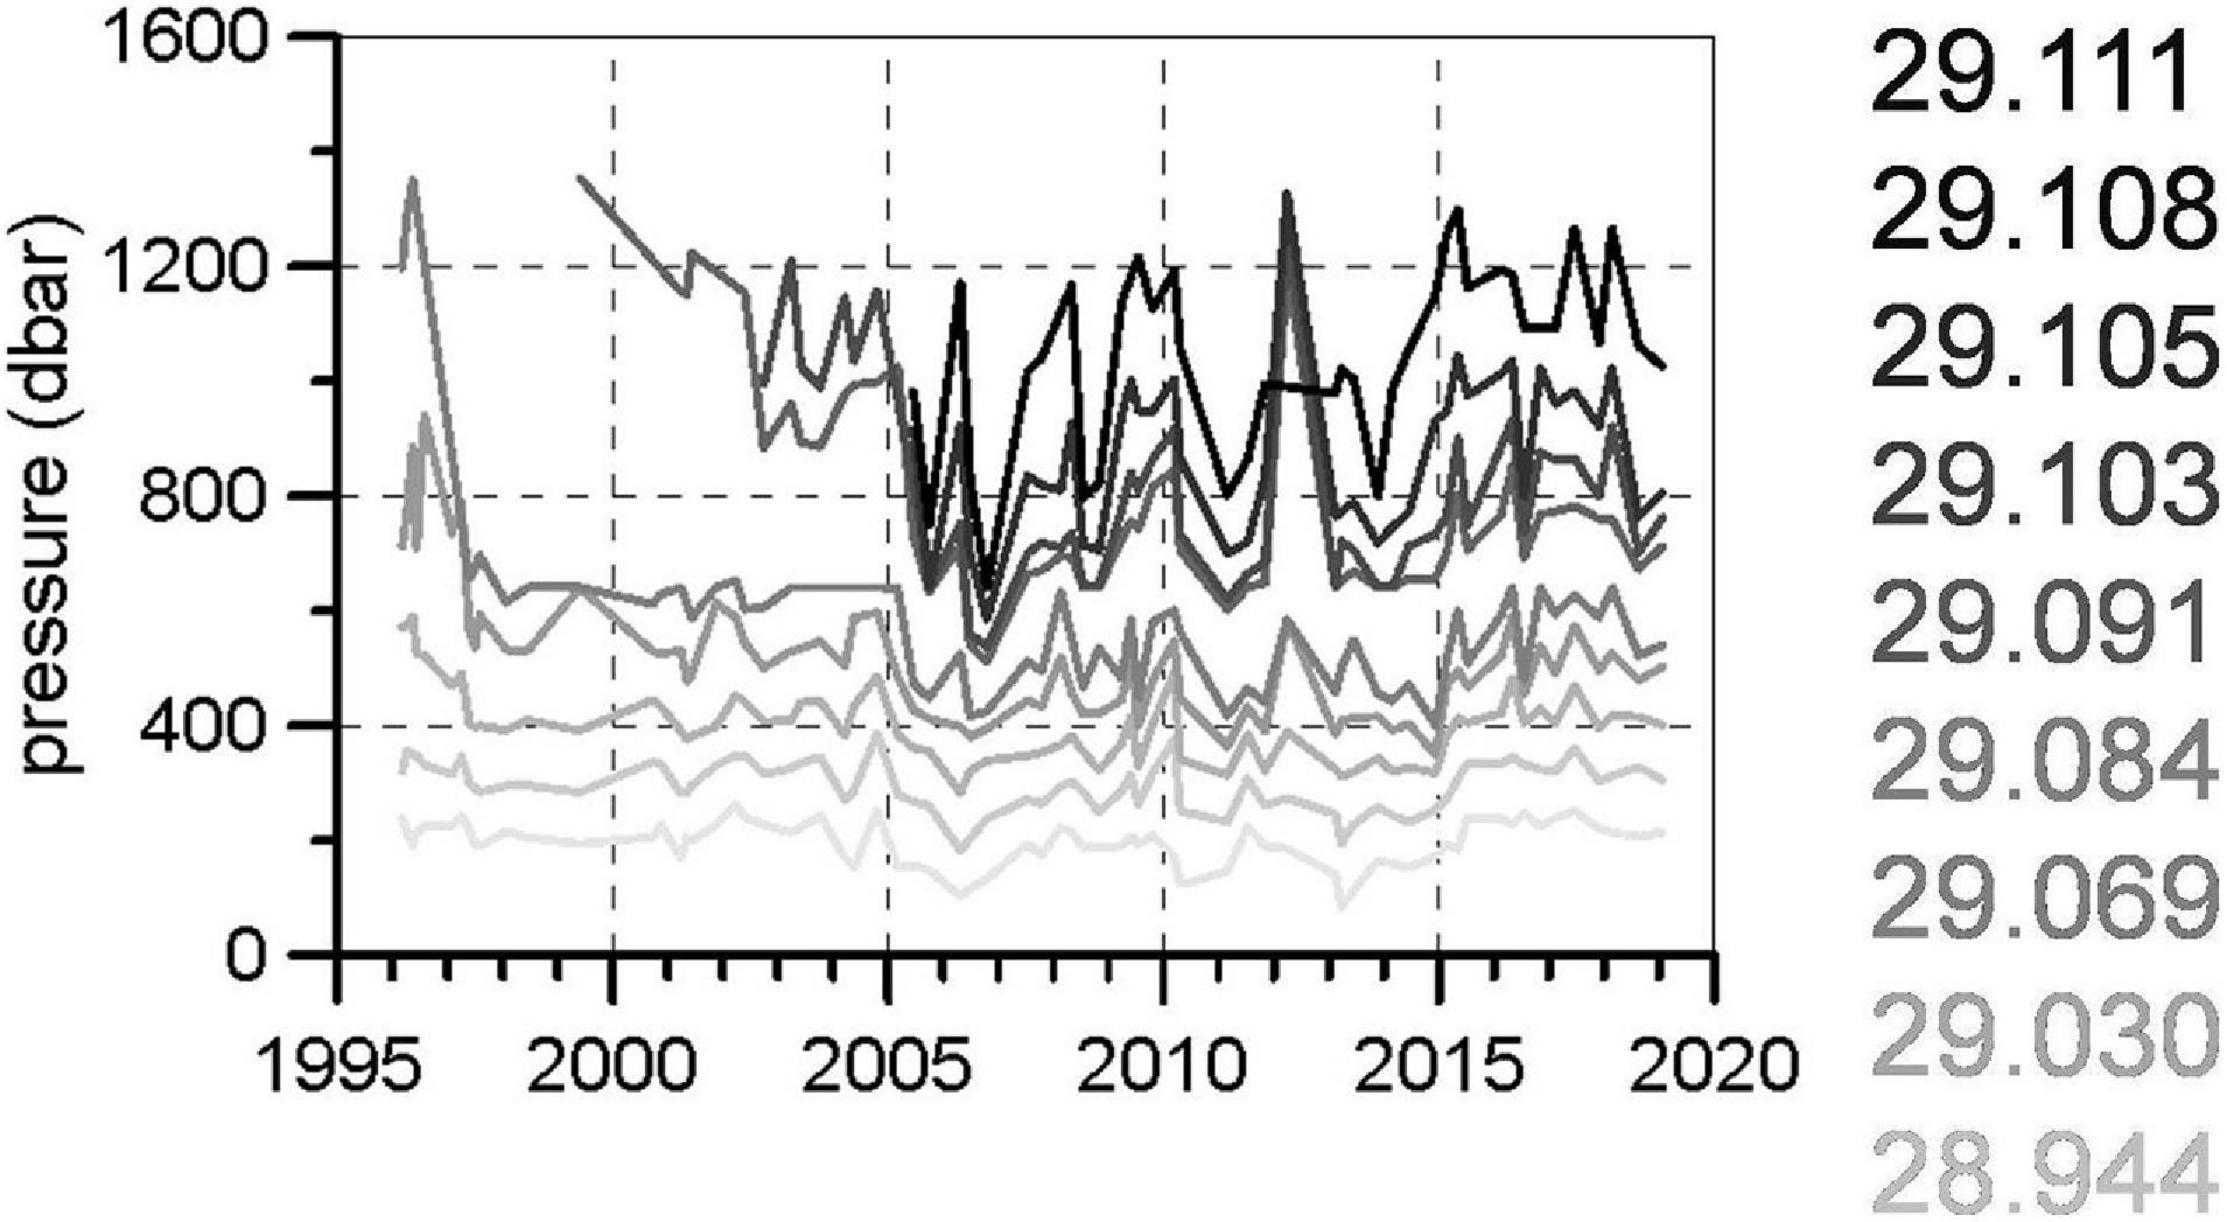
Figure 11. Evolution of the depth (pressure level) of certain selected isopycnals representing different water masses from WIW to deep waters.
The evolution of water mass properties described above is a clear effect of the WMT on the Balearic Channels. Previous works have hypothesized that the WMT was triggered by an accumulation of heat and salt in the intermediate layers of the WMED because of the arrival of warmer and saltier LIW/CIW (Cretan Intermediate Water) from the EMED after the Eastern Mediterranean Transient (Astraldi et al., 2002; Gasparini et al., 2005; Schroeder et al., 2017). Other works consider that such accumulation was caused by the absence of deep water formation during the 1990s decade (Herrmann et al., 2010). The present dataset does not allow establishing which of these two hypotheses is right and we speculate that probably the WMT is the result of a combination of processes. The CTD time series collected at the Balearic Channels support this accumulation since 2000 in the case of heat, and since 1996 for salt (Figures 5A,B). The production of large volumes of very dense new WMDW (nWMDW) during the winters 2004/2005 and 2005/2006 displaced upwards the LIW and the deeper waters being the result of mixing between LIW and old WMDW. After this episode, the deep waters of the Balearic Channels were occupied by new waters with density values higher than those found before the WMT. The new value was around 29.112 kg/m3 and kept constant until the end of the series (Figure 6C). However, both the densest waters (σθ > 29.11 kg/m3) and the lighter deep waters considered in the present work (σθ > 29.1 kg/m3) continued warming and salting until 2019 (Figures 6A,B). In this case, these changes were not caused by vertical displacements of water masses, but by changes over isopycnal surfaces (Figures 10E,F). A similar situation is found in the intermediate layer. The temperature and salinity at 600 dbar decreased abruptly in spring 2005. The first cause was the upward displacement of isopycnals (vertical contribution in Figures 10C,D) and a freshening and cooling of isopycnals (Figures 10C,D). This latter contribution could be linked to the transference of heat and salt from LIW to the nWMDW formed during that winter. After this episode, the temperature and salinity of LIW continued increasing, as was the case for the deep layers (Figures 5, 10C,D) and as in that case, the contribution of vertical displacements was weak and remained constant along the time. These warming and salting processes were caused by changes in the water masses on isopycnals. The temperature and salinity trends were stronger after 2013 until the end of the series. Schroeder et al. (2019) reported an abrupt increase of the potential temperature and salinity of waters flowing into the WMED through the Sicily Channel. It is very likely that the acceleration of these trends in the Balearic Channels for the final part of the time series is the result of this heat and salt advection from the EMED.
In summary, the upper, intermediate, and deep layers of the Balearic Channels have become warmer and saltier from 1996 to 2019. The temperature and salinity variations have compensated each other and no long-term changes have been observed in the density of the AW, WIW, and LIW. The deep waters have also increased their density and the deepest layers of the channels are now occupied by waters denser than those found in this region prior to 2004/2005. The shift in the properties of the deep layers is caused by the WMT. The intermediate layer of the WMED is occupied by water masses formed in the EMED and therefore, the changes detected are imported from that basin. The temperature and salinity at intermediate layers increased during the years before the onset of the WMT, very likely because of the inflow of warmer and saltier waters through the Sicily Channel. An abrupt increase of temperature and salinity in the channel after 2010 is also observed with 2–3 years delay in the Balearic Channels. Consequently, the formation of saltier and warmer deep waters is highly influenced by the heat and salt advection from the EMED. Nevertheless, a local contribution from the WMED cannot be ignored as the AW in the Balearic Channels and at L’Estartit oceanographic station have become warmer and saltier during the analyzed period. The deep water formation processes or their absence produce the transfer of heat and salt from the upper and intermediate layers to the deep ocean. These processes and others that cannot be resolved with the present dataset impose a strong inter-annual and decadal variability in time series. Besides this variability, the long-term behavior of temperature and salinity along the whole water column seems to be progressive warming and salting, very likely as the result of a heat and salt imbalance in the Mediterranean Sea, associated with climate change. The heat gain estimated in other works for the global ocean is within the uncertainty ranges calculated from the CTD time series in the Balearic Sea. This warming would cause the rise of sea level, but its influence on the steric component of sea level is compensated by the salinity increase. However, when the sea level time series are corrected for the steric and atmospheric pressure effects, they show an increasing trend of 2.9–3 mm/yr, associated with changes in the mass component. Results from the tide gauges at L’Estartit and Palma de Mallorca are consistent.
The datasets presented in this study can be found in online repositories. The names of the repository/repositories and accession number(s) can be found below: http://www.ba.ieo.es/es/ibamar.
MJ developed and applied the geometry-based method for WIW detection and contributed to the manuscript redaction. MG-M and RB were responsible of the management of the project and experimental design. FM, MM, and EB were responsible of the CTD data processing. ET was responsible of the sea level and NCEP data processing and acquisition. JP and JS were responsible for the data acquisition and processing of the L’Esatrtit data. MV-Y and PV-B were responsible of the statistical analysis and manuscript redaction. All the authors contributed to the review of the manuscript and its final redaction.
This study has been supported by the research program RADMED (“Series Temporales de Datos Oceanográficos del Mediterráneo”) funded by Instituto Español de Oceanografía (IEO). Partial support has been also received from the Spanish “Programa Estatal De I+D+I Orientada a Los Retos De La Sociedad (RTI2018-100844-B-C32)” through project SAGA: Flujos zonales en el Océano Atlántico sur interior.
The authors declare that the research was conducted in the absence of any commercial or financial relationships that could be construed as a potential conflict of interest.
The Supplementary Material for this article can be found online at: https://www.frontiersin.org/articles/10.3389/fmars.2021.640535/full#supplementary-material
Adloff, F., Somot, S., Sevault, F., Jordà, G., Aznar, R., Déqué, M., et al. (2015). Mediterranean Sea response to climate change in an ensemble of twenty first century scenarios. Clim. Dyn. 45, 2775–2802. doi: 10.1007/s00382-015-2507-3
Astraldi, M., Gasparini, G. P., Vetrano, A., and Vignudelli, S. (2002). Hydrographiccharacteristics and interannualvariability of water masses in the central Mediterranean: a sensitivity test for long-term changes in the Mediterranean Sea. Deep Sea Res. I 49, 661–680. doi: 10.1016/S0967-0637(01)00059-0
Barceló-Llull, B., Pascual, A., Ruiz, S., Escudier, R., Torner, M., and Tintoré, J. (2019). Temporal and spatial hydrodynamic variability in the Mallorca Channel (Western Mediterranean Sea) from eight years of underwater glider data. J. Geophys. Res. Oceans 124, 2769–2786. doi: 10.1029/2018JC014636
Bethoux, J. P. (1979). Budgets of the Mediterranean Sea. Their dependence on the local climate and on the characteristics of the Atlantic Waters. Oceanol. Acta 2, 157–163.
Bethoux, J. P., Gentili, B., Raunet, J., and Taillez, D. (1990). Warming trend in the Wetern Mediterranean deep water. Nature 347, 660–662. doi: 10.1038/347660a0
Bindoff, N. L., and McDougall, T. J. (1994). Diagnosing climate change and ocean ventilation using hydrographic data. J. Phys. Oceanogr. 24, 1137–1152. doi: 10.1175/1520-04851994024<1137:DCCAOV>2.0.CO;2
Borghini, M., Bryden, H., Schroeder, K., Sparnocchia, S., and Vetrano, A. (2014). TheMediterraneanisbecomingsaltier. Ocean Sci. 10, 693–700. doi: 10.5194/os-10-693-2014
Dubois, C., Somot, S., Calmanti, S., Carillo, A., Déqué, M., Dell’Aquilla, A., et al. (2012). Future projections of the surface heat and water budgets of the Mediterranean Sea in an ensemble of coupled atmosphere–ocean regional climate models. Clim. Dyn. 39, 1859–1884. doi: 10.1007/s00382-011-1261-4
Font, J., Puig, P., Salat, J., Palanques, A., and Emelianov, M. (2007). Sequence of hydrographic changes in NW Mediterranean deep water due to exceptional winter of 2005. Sci. Mar. 71, 339–346. doi: 10.3989/scimar.2007.71n2339
Garcia Martinez, M. C., Vargas Yanez, M., Moya, F., Zunino, P., and Bautista, B. (2018). The effects of climate change and rivers damming in the Mediterranean Sea during the Twentieth Century. Int. J. Nat. Sci. Environ. Resour. 8, 1–22. doi: 10.19080/IJESNR.2018.08.555741
Gasparini, G. P., Ortona, A., Budillon, G., Astraldi, M., and Sansone, E. (2005). The effect of the Eastern Mediterranean Transient on the hydrographic characteristics in the Strait of Sicily and in the Tyrrhenian. Deep See Res. I 52, 915–935. doi: 10.1016/j.dsr.2005.01.001
Herrmann, M., Sevault, F., Beuvier, J., and Somot, S. (2010). What induced the exceptional 2005 convection event in the northwestern Mediterranean basin? Answers from a modeling study. J. Geophys. Res. 115:C12051. doi: 10.1029/2010JC006162
Heslop, E. E., Ruiz, S., Allen, J., Lopez-Jurado, J. L., Renault, L., and Tintoré, J. (2012). Autonomous underwater gliders monitoring variability at “choke points” in our ocean system: a case study in the Western Mediterranean Sea. Geophys. Res. Lett. 39:L20604. doi: 10.1029/2012GL053717
Jordá, G., and Gomis, D. (2013). Reliability of the steric and mass components of the Mediterranean Sea level es estimated from hydrographic gridded products. Geophys. Res. Lett. 40, 3655–3660. doi: 10.1002/grl.50718
Jordà, G., Von Schuckmann, K., Josey, S. A., Caniaux, G., García-Lafuente, J., Sammartino, S., et al. (2017). The Mediterranean sea heat and mass budgets : estimates, uncertainties and perspectives. Prog. Oceanogr. 156, 174–208. doi: 10.1016/j.pocean.2017.07.001
Juza, M., Escudier, R., Vargas-Yáñez, M., Mourre, B., Heslop, E., Allen, J., et al. (2019). Characterization of changes in Western Intermediate Water properties enabled by an innovative geometry-based detection approach. J. Mar. Syst. 191, 1–12. doi: 10.1016/j.jmarsys.2018.11.003
Juza, M., Renault, L., Ruiz, S., and Tintoré, J. (2013). Origin and pathways of intermediate water in the Northewestern Mediterranean Sea using observations and numerical modelling. J. Geophys. Res. Oceans 118, 6621–6633. doi: 10.1002/2013JC009231
Kalnay, E., Kanamitsu, M., Kistler, R., Collins, W., Deaven, D., Gandin, L., et al. (1996). The NCEP/NCAR 40-Year reanalysis project. Bull. Am. Meteorol. Soc. 77, 437–471. doi: 10.1175/1520-04771996077<0437:TNYRP<2.0.CO;2
Lascaratos, A., Roether, W., Nittis, K., and Klein, B. (1999). Recent changes in deep water formation and spreading in the Eastern Mediterranean Sea: a review. Prog. Oceanogr. 44, 5–36. doi: 10.1016/S0079-6611(99)00019-1
Llasses, J., Jordà, G., and Gomis, D. (2015). Skills of differenthydrographic networks in capturing changes in the Mediterranean Sea at climatescales. Clim. Res. 63, 1–18. doi: 10.3354/cr01270
López-Jurado, J. L., Balbín, R., Amengual, B., Aparicio-González, A., Fernández de Puelles, M. L., García-Martínez, M. C., et al. (2015). The RADMED monitoring program: towards an ecosystem approach. Ocean. Sci. 11, 645–671. doi: 10.5194/osd-12-645-2015
López-Jurado, J. L., García-Lafuente, J., and Lacaya, N. (1995). Hydrographic conditions of the Ibiza channel during November 1990, March 1991 and July 1992. Oceanol. Acta 18, 235–243.
López-Jurado, J. L., González-Pola, C., and Vélez-Belchí, P. (2005). Observation of an abrupt disruption of the long-term warming trend at the Balearic Sea, Western Mediterranean, in summer 2005. Geophys. Res. Lett. 32:L24606. doi: 10.1029/2005GL024430
Mariotti, A., Pan, Y., Zeng, N., and Alessandri, A. (2015). Long-term climate change in the Mediterranean region in the midst of decadal variability. Clim. Dyn. 44, 1437–1456. doi: 10.1007/s00382-015-2487-3
Nielsen, J. N. (1912). “Hydrography od the Mediterranean and adjacent waters,” in Report on the Danish Oceanographical Expeditions 1908-1910 to the Mediterranean and Adjacent Seas, Vol. I, Copenhagen, 72–191.
Nykjaer, L. (2009). Mediterranean Sea surface warming 1985-2006. Clim. Res. 39, 11–17. doi: 10.3354/cr00794
Pinot, J. M., and Ganachaud, A. (1999). The role of winter intermediate waters in spring-summer circulation of the Balearic Sea: 1. Hydrography and inverse modeling. J. Geophys. Res. 104, 29843–29864. doi: 10.1029/1999JC900071
Pinot, J.-M., López-Jurado, J. L., and Riera, M. (2002). The CANALES experiment (1996-1998). Interannual, seasonal, and mesoscale variability of the circulation in the Balearic Channels. Prog. Oceanogr. 55, 335–370. doi: 10.1016/S0079-6611(02)00139-8
Poulain, P.-M., Barbanti, R., Font, J., Cruzado, A., Millot, C., Gertman, I., et al. (2007). MedArgo: a drifting profiler program in the Mediterranean Sea. Ocean Sci. 3, 379–395. doi: 10.5194/osd-3-1901-2006
Rhein, M., Rintoul, S. R., Aoki, S., Campos, E., Chambers, D., Feely, R. A., et al. (2013). “Observations: ocean,” in Climate Change 2013: The Physical Science Basis. Contribution of Working Group I to the Fifth Assessment Report of the Intergovernmental Panel on Climate Change, eds T. F. Stocker, D. Qin, G.-K. Plattner, M. Tignor, S. K. Allen, and J. Boschung (Cambridge: Cambridge University Press).
Roether, W., Manca, B. B., Klein, B., Bregant, D., Georgopoulos, D., Beitzel, V., et al. (1996). Recent changes in the Eastern Mediterranean deep waters. Science 271, 333–335. doi: 10.1126/science.271.5247.333
Rohling, E. J., and Bryden, H. L. (1992). Man-induced salinity and temperature increase in Western Mediterranean deep water. J. Geophys. Res. 97, 11191–11198. doi: 10.1029/92JC00767
Salat, J., and Font, J. (1987). Water mass structure near and offshore the Catalan coast during the winters of 1982 and 1983. Ann. Geophys. 5B, 49–54.
Salat, J., Pascual, J., Flexas, M., Chin, T. M., and Vazquez-Cuervo, J. (2019). Forty-five years of oceanographic and meteorological observations at a coastal station in the NW Mediterranean: a ground truth for satellite observations. Ocean Dyn. 69, 1067–1084. doi: 10.1007/s10236-019-01285-z
Sanchez-Gomez, E., Somot, S., and Mariotti, A. (2009). Future changes in the Mediterranean water budget projected by an ensemble of regional climate models. Geophys. Res. Lett. 36:L21401. doi: 10.1029/2009GL040120
Schroeder, K., Chiggiato, J., Ben Ismail, S., Borghini, M., Patti, B., and Sparnocchia, S. (2019). Mediterranean deep and intermediate water mass properties. In: copernicus marine service report, Issue 3. J. Operational Oceanogr. 12, s26–s30. doi: 10.1080/1755876X.2019.1633075
Schroeder, K., Chiggiato, J., Josey, S. A., Borghini, M., Aracri, S., and Sparnocchia, S. (2017). Rapid response to climate change in a marginal sea. Sci. Rep. 7:4065. doi: 10.1038/s41598-017-04455-5
Schroeder, K., Josey, S. A., Hermann, M., Grignon, L., Gasparini, G. P., and Bryden, H. L. (2010). Abrupt warming and salting of the Western Mediterranean Deep Water after 2005: atmiospheric forcing and lateral advection. J. Geophys. Res. 115:C08029. doi: 10.1029/2009JC005749
Schroeder, K., Millot, C., Bengara, L., Ben Ismail, S., Bensi, M., Borghini, M., et al. (2013). Long-term monitoring programme of the hydrological variability in the Mediterranean Sea: a first overview of the HYDROCHANGES network. Ocean Sci. 9, 301–324. doi: 10.5194/os-9-301-2013
Skliris, N., Sofianos, S. S., Gkanasos, A., Mantziafou, A., Versatis, V., Axaopoulos, P., et al. (2012). Decadal scale variability of sea surface temperatura in the Mediterranean Sea in relation to atmospheric variability. Ocean Dyn. 62, 13–30. doi: 10.1007/s10236-011-0493-5
Smith, R. O., Bryden, H. L., and Stansfield, K. (2008). Observations of new western mediterranean deep water formation using Argo floats 2004-2006. Ocean Sci. 4, 133–149. doi: 10.5194/os-4-133-2008
Somot, S., Sevault, F., and Déqué, M. (2006). Transient climate change scenario simulation of the Mediterranean Sea for the twenty-first century using a high-resolution ocean circulation model. Clim. Dyn. 27, 851–879. doi: 10.1007/s00382-006-0167-z
Somot, S., Sevault, F., Déqué, M., and Crépon, M. (2008). 21st century climate change scenario for the Mediterranean using a coupled Atmosphere-Ocean Regional ClimateModel. Glob. Planet. Change 63, 112–126. doi: 10.1016/j.gloplacha.2007.10.003
Stocker, T. F., Qin, D., Plattner, G.-K., Alexander, L. V., Allen, S. K., Bindoff, N. L., et al. (2013). “Technical Sum-mary,” in Climate Change 2013: The Physical Science Basis. Contribution of Working Group I to the Fifth Assess-ment Report of the Intergovernmental Panel on Climate Change, eds T. F. Stocker, D. Qin, G.-K. Plattner, M. Tignor, S. K. Allen, J. Boschung, et al. (Cambridge: Cambridge University Press).
Theocharis, A., Nittis, K., Kontoyiannis, H., Papageorgiou, E., and Balopoulos, E. (1999). Climatic changes in the Aegean Sea influence theEastern Mediterranean thermohaline circulation(1986-1997). Geophys. Res. Lett. 26, 1617–1620. doi: 10.1029/1999GL900320
Tsimplis, M. N., and Baker, T. F. (2000). Sea level drop in the Mediterranean Sea: an indicator of deep wáter salinity and temperatura changes? Geophys. Res. Lett. 27, 1731–1734. doi: 10.1029/1999gl007004
Tsimplis, M. N., and Josey, S. A. (2001). . Forcing of the Mediterranean Sea by atmospheric oscillations over the North Atlantic. Geophys. Res. Lett. 28, 803–806. doi: 10.1029/2000GL012098
Vargas-Yáñez, M., García-Martinez, M. C., Moya, F., ópez-Jurado, J. L. L., Serra, M., Santiago-Domenech, R., et al. (2019). in The Present state of Marine Ecosystems in the Spanish Mediterranean in a Climate Change Context, ed. Grupo Mediterráneo de Cambio Climático (Málaga: Tuimagina editorial). ISBN: 978-84-09-13597-4. doi: 10.1029/2000gl012098
Vargas-Yáñez, M., García-Martíneza, M. C., Moya, F., Balbín, R., ópez-Jurado, J. L. L., Serra, M., et al. (2017). Updating temperature and salinity mean values and trends in the Western Mediterranean: the RADMED project. Progr. Oceanogr. 157, 27–46. doi: 10.1016/j.pocean.2017.09.004
Vargas-Yáñez, M., Mallard, E., Rixen, M., Zunino, P., García-Martínez, M. C., and Moya, F. (2012). The effect of interpolation methods in temperatura and salinity trends in the Western Mediterranean. Medit. Mar. Sci. 13/1, 118–125. doi: 10.12681/mms.28
Vargas-Yáñez, M., Zunino, P., Benali, A., Delpy, M., Pastre, F., Moya, F., et al. (2010). How much is the Western Mediterranean really warming and salting? J. Geophys. Res. 115:C04001. doi: 10.1029/2009JC005816
Vargas-Yáñez, M. M., Juza, R., Balbin, P., Velez-Belchí, M. C., García-Martínez, F., and Moya, A. (2020). Climatological temperature and salinity properties and associated water mass transports in the Balearic Channels using repeated observations from 1996 to 2019. Front. Mar. Sci. 7:568602. doi: 10.3389/fmars.2020.568602
Zunino, P., Schroeder, K., Vargas-Yáñez, M., Gasparini, G. P., Coppola, L., García-Martínez, M. C., et al. (2012). Effects of the Western Mediterranean Transition on the resident water masses: pure warming, pure freshening and pure heaving. J. Mar. Syst. 96-97, 15–23. doi: 10.1016/j.jmarsys.2012.01.011
Keywords: water mass properties, linear trends, climate change, Balearic Channels, Western Mediterranean Transition
Citation: Vargas-Yáñez M, Juza M, García-Martínez MC, Moya F, Balbín R, Ballesteros E, Muñoz M, Tel E, Pascual J, Vélez-Belchí P and Salat J (2021) Long-Term Changes in the Water Mass Properties in the Balearic Channels Over the Period 1996–2019. Front. Mar. Sci. 8:640535. doi: 10.3389/fmars.2021.640535
Received: 11 December 2020; Accepted: 22 February 2021;
Published: 12 March 2021.
Edited by:
Katrin Schroeder, Institute of Marine Science (CNR), ItalyReviewed by:
Barak Herut, Israel Oceanographic & Limnological Research, IsraelCopyright © 2021 Vargas-Yáñez, Juza, García-Martínez, Moya, Balbín, Ballesteros, Muñoz, Tel, Pascual, Vélez-Belchí and Salat. This is an open-access article distributed under the terms of the Creative Commons Attribution License (CC BY). The use, distribution or reproduction in other forums is permitted, provided the original author(s) and the copyright owner(s) are credited and that the original publication in this journal is cited, in accordance with accepted academic practice. No use, distribution or reproduction is permitted which does not comply with these terms.
*Correspondence: Manuel Vargas-Yáñez, bWFub2xvLnZhcmdhc0BpZW8uZXM=
Disclaimer: All claims expressed in this article are solely those of the authors and do not necessarily represent those of their affiliated organizations, or those of the publisher, the editors and the reviewers. Any product that may be evaluated in this article or claim that may be made by its manufacturer is not guaranteed or endorsed by the publisher.
Research integrity at Frontiers
Learn more about the work of our research integrity team to safeguard the quality of each article we publish.