 Jessica N. Perelman
 Eric Firing
 Jesse M. A. van der Grient
 Benjamin A. Jones
 Jeffrey C. Drazen
94% of researchers rate our articles as excellent or good
Learn more about the work of our research integrity team to safeguard the quality of each article we publish.
Find out more
ORIGINAL RESEARCH article
Front. Mar. Sci., 10 May 2021
Sec. Deep-Sea Environments and Ecology
Volume 8 - 2021 | https://doi.org/10.3389/fmars.2021.632764
This article is part of the Research TopicBiodiversity, Connectivity and Ecosystem Function Across the Clarion-Clipperton Zone: A Regional Synthesis for an Area Targeted for Nodule MiningView all 16 articles
The Clarion-Clipperton Zone (CCZ) is a 4 million km2 area in the eastern Central Pacific Ocean exhibiting large variability in environmental parameters, particularly oxygen and primary production, that is being targeted for deep-sea polymetallic nodule mining. This remote region’s pelagic biology is very poorly sampled, including for micronekton and zooplankton that provide essential ecosystem services such as carbon flux and support for commercial fisheries. We built a baseline of deep scattering layer (DSL) depths and vertical migration behaviors, proxies for mesopelagic micronekton and zooplankton communities, using shipboard acoustic Doppler current profiler datasets. Acoustic data (38 kHz, 75 kHz) were compiled from research cruises passing near or through the CCZ (2004–2019), and environmental data (mean midwater oxygen partial pressure, surface chlorophyll-a, and sea surface height anomaly) were assembled from the World Ocean Atlas and satellite oceanographic datasets. Our results suggest that midwater oxygen, associated with the Eastern Tropical Pacific Oxygen Minimum Zone (OMZ), is the strongest predictor of daytime DSL depths and the proportions of midwater populations that undergo vertical migration in this region. We used these relationships to predict micronekton and zooplankton behaviors across the CCZ, including licensed mining exploration areas and no-mining reserves. While the OMZ encompasses most licensed exploration areas, the current network of reserves lies outside of the core OMZ and ultimately may not represent or protect the pelagic OMZ fauna at highest risk from mining impacts. This research will further assist in developing resource exploitation regulations by the International Seabed Authority, and will provide mesopelagic baseline information for monitoring changes that may occur in the CCZ once industrial-scale mining begins.
The deep pelagic ocean likely contains a greater abundance and higher biomass of organisms than any other major ecosystem. Yet, this ecosystem is largely under-represented in global databases of marine biological records, and deep pelagic communities remain the least-known faunal group on Earth (Webb et al., 2010). Mesopelagic micronekton, small fishes and invertebrates (∼2–20 cm in size) that primarily inhabit depths between 200 and 1,000 m, form an essential trophic link between zooplankton and top predators such as tuna and billfishes (Choy et al., 2013; Young et al., 2015; Drazen and Sutton, 2017) and thus support pelagic fisheries. Diel vertical migration (DVM) by micronekton and zooplankton is the largest migration on Earth, and this contributes significantly to carbon and nutrient cycling in the ocean as organisms feed near the surface and respire at depth. Accordingly, the role of these communities in upper ocean carbon and nitrogen transport is substantial (Longhurst et al., 1990; Davison et al., 2013; Ariza et al., 2015).
When dense aggregations of micronekton and zooplankton form at midwater depths, these are frequently detected by shipboard sonars as acoustic backscatter and are thus termed “deep scattering layers” (DSLs). While swimbladdered fishes and gas-bearing siphonophores can dominate these acoustic signals, DSLs vary globally across pelagic ecosystems in their faunal composition, as well as daytime depths and vertical movements (Klevjer et al., 2016; Sutton et al., 2017). The fish families Myctophidae and Gonostomatidae (particularly Cyclothone spp.) are typically the dominant marine vertebrates caught in midwater trawls around the globe (e.g., Sutton et al., 2010) and likely comprise a large portion of mesopelagic scattering layers. Vertical migrations of DSLs are readily observable in echograms and this enables a visualization of largescale vertical community dynamics in the pelagic ocean (Dietz, 1948; Proud et al., 2018). The number of DSLs and their acoustic backscattering strength (a proxy for animal density) can vary widely at local and global scales (Urmy et al., 2012; Proud et al., 2017). Not all mesopelagic fauna migrate, which results in behavioral variation across the globe. Strong regional differences have been observed acoustically in the proportion of DSLs migrating out of the mesopelagic at night, from 20% migrating in the Indian Ocean and up to 90% migrating in the Eastern Pacific Ocean (Klevjer et al., 2016). However, information about the proportions of mesopelagic fauna actually carrying out DVM on local and regional scales is minimal, and this is a key attribute affecting active carbon flux and the coupling strength between the epi- and mesopelagic.
The ultimate driver of DVM by mid-trophic organisms is visual predator avoidance (Lampert, 1989, 1993). The behavior is thus thought to be driven primarily by downwelling light intensity in the water column where visual predation is common, as changes in the light environment at sunset and sunrise trigger these largescale animal migrations to and from the surface (Dickson, 1972; Kampa, 1975). The depth of daytime DSLs varies regionally (Bogorov, 1946; Dietz, 1948; Isaacs et al., 1974), and gradients in environmental conditions such as oxygen, chlorophyll, sea surface height, and water-column temperature have more recently been observed to drive largescale variability in scattering layer dynamics at regional and global scales (e.g., Bianchi et al., 2013; Netburn and Koslow, 2015; Urmy and Horne, 2016; Proud et al., 2017; Escobar-Flores et al., 2018). Oxygen-depleted zones act as strong bounding conditions for scattering layer depths globally, as hypoxia limits the depths to which animals can migrate and the duration they can spend at those depths. Phytoplankton chlorophyll affects light penetration in the ocean as light is scattered and absorbed by enhanced particle concentrations in surface waters (Yentsch and Phinney, 1989), and it can also be an indicator of surface food availability (Legendre and Michaud, 1999). Sea surface height anomalies can indicate the presence of oceanographic features (e.g., eddies) that may influence micronekton distribution via upwelling or downwelling (e.g., Drazen et al., 2011; Béhagle et al., 2016). Disturbances that alter these environmental drivers, such as climate change and human activities in the ocean, may stress midwater communities and alter their migration behavior. Knowledge of natural ecosystem dynamics and community sensitivities to environmental cues will thus enhance our ability to predict how the deep pelagic will respond to these stressors.
Growing interest in deep-sea polymetallic nodule mining may present a new human-induced stressor for midwater communities. This emerging industry could begin operations in the next several years in the Clarion-Clipperton Zone (CCZ)—a 4 million-km2 area in the eastern Central Pacific Ocean (Wedding et al., 2015). This expansive region currently has mining exploration licenses by 15 countries regulated by the International Seabed Authority (ISA). Around the licensed exploration areas, a network of nine Areas of Particular Environmental Interest (APEIs) have been set up as no-mining zones by the ISA. They were developed on the basis of biophysical gradients, biologically unique seamounts, and socioeconomic impacts (Wedding et al., 2013). While nodule mining is expected to have major consequences for abyssal seafloor fauna (Amon et al., 2016; Jones et al., 2017), the industrial-scale operations are likewise expected to impact midwater ecosystems (Drazen et al., 2020). Namely, noise will be produced from vibrations in riser systems used to pump nodules to the surface, and heavy metal-laden sediment plumes generated from surface dewatering of the collected minerals will be released back into the water column. The resulting environmental influences could potentially hinder feeding, reproduction, DVM, and growth among organisms which may ultimately reduce pelagic biomass and diversity or alter their distributions (Christiansen et al., 2019; Drazen et al., 2020).
Only a handful of trawl and acoustic studies have documented midwater communities in the CCZ (e.g., Loeb and Nichols, 1984; Wishner et al., 2018), and this substantial knowledge gap hinders our ability to predict the influences of mining activities on the mesopelagic ecosystem. A recent global biogeographic classification suggests that the CCZ includes two mesopelagic “ecoregions” defined by geographically distinct faunal assemblages (Sutton et al., 2017): the Northern Central Pacific and Eastern Tropical Pacific ecoregions. In this framework, the Northern Central Pacific ecoregion is characterized as an oligotrophic gyre system with a fauna distinct from the central Equatorial Pacific, and the Eastern Tropical Pacific ecoregion is characterized as eutrophic with endemic taxa adapted to low oxygen. While this classification is broad, it is based on existing knowledge of faunal distributions and oceanographic patterns, and it may provide a good foundation from which to build hypotheses about mesopelagic ecosystems across the remote CCZ.
Light intensity and dissolved oxygen levels are known to be strong drivers of DVM and depth structure in deep scattering layers (Netburn and Koslow, 2015; Aksnes et al., 2017) and these parameters vary strongly within the CCZ mining region. Across the eastern Central Pacific Ocean, midwater oxygen partial pressures vary greatly with very low oxygen (∼0.5–2 kPa) extending from east to west and higher oxygen (∼4–7 kPa) in the north and south (Figure 1A). Further, surface chlorophyll and thus light penetration varies north to south and east to west with higher chlorophyll occurring to the east and to the south near equatorial upwelling (Figure 1B). Sea surface height anomalies, which may also influence DVM communities, are highly dynamic across the region due to the transient nature of the mesoscale features they indicate. Mesoscale eddies, for instance, may have a radius up to 100 km, a lifespan of several months, and typically propagate westward across the Pacific Ocean (Cheng et al., 2014; Aleynik et al., 2017). Such oceanographic gradients likely drive variability in the depths and behaviors of deep scattering layers across the CCZ.
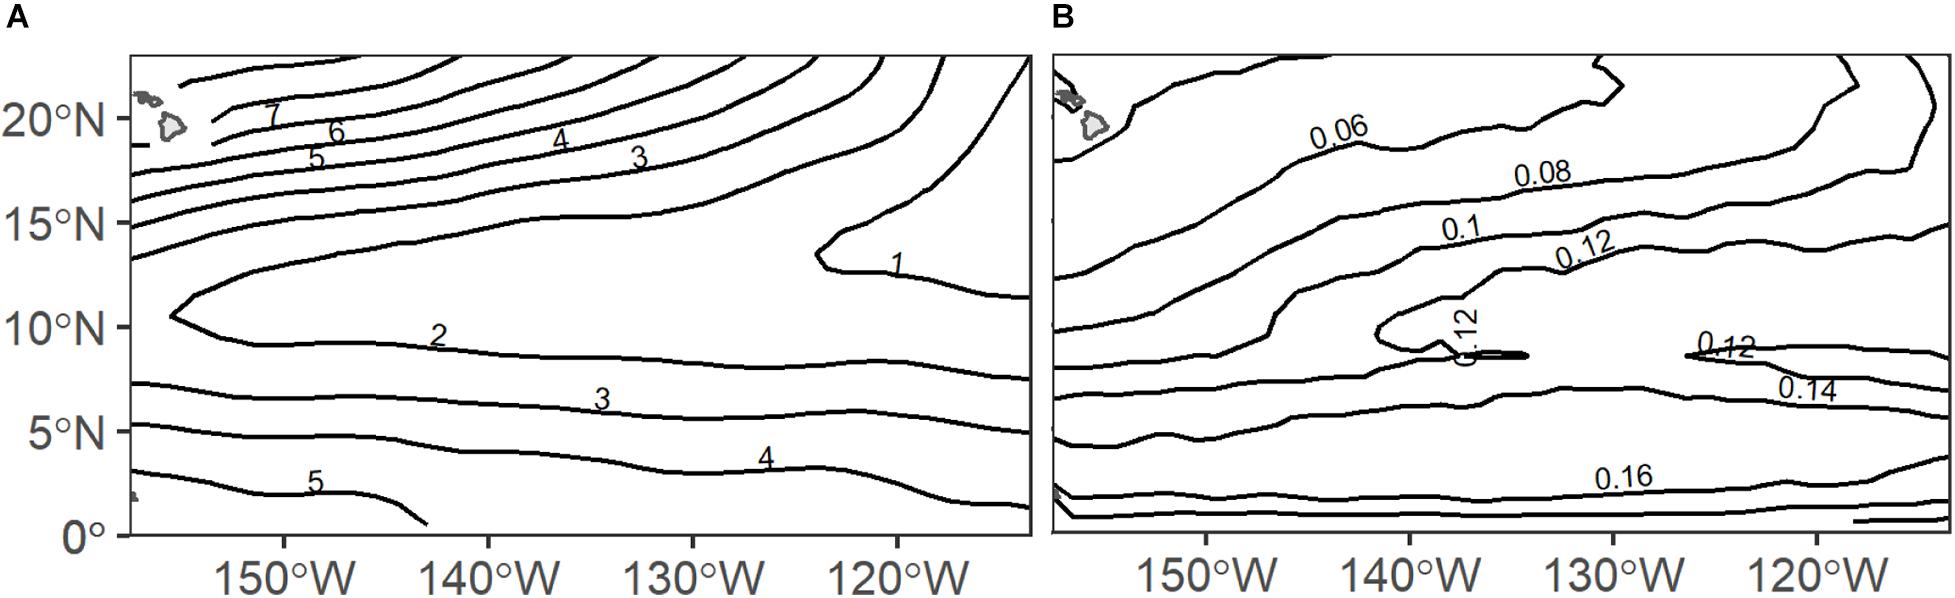
Figure 1. Annual climatologies of (A) midwater oxygen partial pressure (pO2; kPa) and (B) surface chlorophyll (chl-a; mg m–3) across the eastern Central Pacific Ocean (source details in Table 1).
The goal of this research is to build a baseline of deep scattering layer depths and DVM behaviors within and around the CCZ using opportunistic active acoustic data, and to reveal the dominant oceanographic factors driving variability in these dynamics. With the Eastern Tropical Pacific oxygen minimum zone (OMZ) extending throughout most of the region, we hypothesize that oxygen will play the largest role in structuring these communities by shallowing daytime DSL depths and increasing the proportions of migrating fauna in more hypoxic waters. The applied goal of this work is to inform developing resource exploitation regulations, which the ISA proposes to have in place by 2021, and to provide some mesopelagic baseline information for subsequently monitoring changes that may occur once largescale mining operations begin.
Our analyses of scattering layers across the CCZ use publicly available shipboard acoustic Doppler current profiler (ADCP) measurements. At low frequencies (75 and 38 kHz), acoustic backscatter in pelagic ecosystems typically indicates the presence of large zooplankton and micronekton, and especially small mesopelagic fishes and siphonophores with gas-filled organs (Simmonds and MacLennan, 2008; Proud et al., 2019). Each frequency highlights the community of organisms whose size and morphology cause them to resonate most strongly at that frequency (Davison et al., 2015). We selected these two frequencies because the acoustic signals extend deep enough (roughly 650 m for 75 kHz and 1,000 m for 38 kHz) to encompass the daytime depths of dominant mesopelagic scattering layers, especially in the eastern Central Pacific where hypoxia limits migration depths (Bianchi et al., 2013; Klevjer et al., 2016; Aksnes et al., 2017; Proud et al., 2018). However, the shallowest measurements from ADCP systems are determined by the combination of transducer depth, blanking distance, and vertical resolution (cell size) which is a function of pulse length. Thus, the narrowband 75 kHz ADCPs in our dataset (with a cell size of 16 m, default blanking distance of 8 m, and transducer depth around 4 m) have the shallowest measurements at about 28 m, and the narrowband 38 kHz instruments (with a cell size of 24 m, default blanking distance of 16 m, and transducer depth around 7 m) have the shallowest measurements at about 47 m. Since these ADCP datasets include many instruments, all with uncalibrated backscatter, we analyzed relative structure within each dataset by evaluating the behaviors of dominant scattering layers, rather than assessing backscatter distributions as proxies for biomass (which is often done with calibrated echo sounder data).
Shipboard ADCP datasets were compiled from the Joint Archive for Shipboard Acoustic Doppler Current Profilers (JASADCP)1 and the NCEI Global Oceans Currents Database2. We analyzed a total of 44 cruise datasets from research vessels equipped with 75 and 38 kHz narrowband ADCPs (36 and 8 cruises, respectively) passing near or through the CCZ between 2004 and 2019 that showed at least one DVM event in the acoustic backscatter (Supplementary Table 1). ADCP backscatter was converted from counts to decibel units using the common scaling factor (kc) of 0.45 (Deines, 1999). We estimated the noise as the mean signal return from the bottom 6 depth cells, on the assumption that the signal-to-noise ratio (SNR) is small at those depths. After subtracting this estimated noise level from the received signal, we set a minimum SNR threshold of 3 dB. Acoustic intensity was thus calculated following the method of Gostiaux and Van Haren (2010):
where E is the received signal strength indicator (RSSI; a logarithmic measure of acoustic intensity), Enoise is the noise level (counts), and IdB is the acoustic intensity in decibels. Corrections were made for transmission loss due to spherical spreading and sound absorption. The attenuation coefficient was calculated as a function of depth using the formula of Ainslie and McColm (1998), with climatological temperature profiles from World Ocean Atlas. Due to highly variable noise and bubbles, particularly in the 75 kHz dataset, we flagged and removed cruise days with <10 intervals (5 min averaged profiles) that contained detectable backscatter during the daytime or nighttime timeframes of interest. Thus, while our original 75 kHz dataset included 50 cruises in the CCZ region, only 44 were included in these analyses. All acoustic data analyses were conducted in Python (version 3.7; Python Core Team, 2020).
Our examination of dominant scattering layers includes determination of dominant daytime DSL depths and DVM proportions (DVMP). Daytime DSL depth was defined as the median depth of peak acoustic intensity from vertical backscatter profiles within 3 h around local solar noon. DVMP, which was defined as the apparent proportion of midwater communities undergoing diel vertical migration, or vertical migration strength, was calculated as a ratio of integrated mesopelagic nighttime and daytime acoustic intensities similarly to Klevjer et al. (2016):
IdB was calculated by integrating the acoustic intensity of each vertical profile (below 200 m) within 3 h around local solar midnight or noon. Then, we selected the median integrated value to represent IdB. We did not correct for total water column changes between day and night acoustic intensities in our calculations of DVMp due to lack of measurements in the shallowest 30–50 m as described previously. We further removed days or nights with > 5 noisy intervals within the noon or midnight time periods.
Due to the lack of high-resolution in situ oceanographic data to pair with opportunistic ADCP measurements for statistical models, environmental variables were extracted from global satellite and climatological datasets (Table 1). We explored the influences of oxygen, surface chlorophyll-a, sea surface height anomaly, sea surface temperature, and thermocline depth on DSL depth and DVMp and ultimately focused on three of these variables: midwater oxygen partial pressure (pO2), surface chlorophyll-a (chl-a), and sea surface height anomaly (SSHA). While we do expect temperature to affect swimming behaviors and habitat preferences, sea surface temperature is unlikely to influence migration deeper in the water column and it was excluded from these analyses. Thermocline depth was collinear with midwater oxygen (see collinearity method below), and because oxygen was ultimately a stronger predictor of DSL depth and DVMp, we excluded thermocline depth from the models. After exploring several different monthly climatological oxygen metrics, including the depth of various oxygen isopleths and vertical oxygen averages over different depth ranges, mean pO2 between 200 and 1,000 m (midwater pO2) was selected as the best oxygen predictor of DSL behaviors, roughly encompassing the mesopelagic depth range. We further compared the pO2 values at daytime DSL depths between the two frequency-defined communities. While pO2 values were not concurrent in time with acoustic observations, the chl-a and SSHA values used for statistical models were extracted from satellite datasets and were thus matched as closely as possible to the empirical data (Table 1).
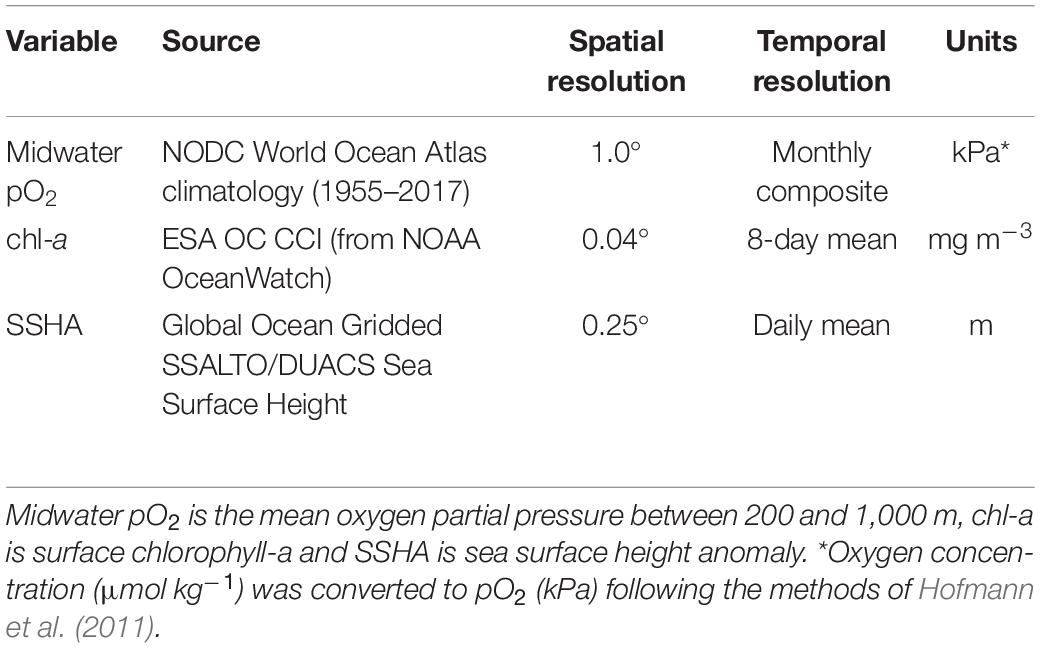
Table 1. Environmental variables used to build statistical models for deep scattering layer (DSL) depth and vertical migration proportion (DVMp).
We evaluated the variance inflation factors (VIF) of each environmental variable in regression models to assess collinearity between predictors, with a cutoff of 2.5. After investigating for spatial and temporal autocorrelation in model residuals, the relationships between acoustic metrics (DSL depths and DVMp) and environmental variables were evaluated using multiple linear regression (Eq. 3) and multiple beta regression (betareg R package; Cribari-Neto and Zeileis, 2009; Eq. 4), respectively.
Since our ultimate goal was to best predict these acoustic metrics across the CCZ, models were averaged using a multi-model inference approach (Harrison et al., 2018) and parameter estimates were weighted based on Akaike information criteria (AICc; MuMIn package; Barton, 2018). Only models with ΔAICc < 4 (from the top ranked model) were included in these averages. AICc has become a favored approach for model selection over p-values when using multiple parameters to predict an outcome (Halsey, 2019). Full average models were used as opposed to conditional averages, as the full model mitigates biasing environmental parameters with weaker relationships. Explicitly, if a parameter is absent in a component model, its coefficient is set to zero and thus the full model average assumes a smaller response from that variable (Lukacs et al., 2010). To quantify the relative importance of environmental parameters in these model averages, we compared the sum of Akaike weights, or sum of model probabilities, for each parameter following the methods of Giam and Olden (2016). All statistical analyses were performed in R programming language (version 4.0.0; R Core Team, 2020).
To better understand the depths and migratory patterns of DSLs across the CCZ, we generated 1 × 1° interpolated maps of DSL depths and DVMp for each of the two frequencies (75 and 38 kHz). For these, we used predictions made with the empirical models described above in conjunction with annual 1 × 1° climatological data for pO2 and chl-a generated from the sources described in Table 1. Because SSHA is an anomaly and indicates dynamic and ephemeral mesoscale features, this parameter was set to zero for the climatological predictions. Using CCZ shapefiles provided by the ISA, we calculated the mean DSL depth and DVMp in each licensed exploration area and APEI and averaged predictions across all mining exploration and no-mining zones. These were compared statistically using Wilcoxon rank sum tests. We further developed seasonal prediction maps for each acoustic frequency (Supplementary Figures 4,5) to explore the temporal changes in DSLs between winter (Oct–Mar) and summer (Apr–Sep). All figures were produced in R or Python.
Generally, ADCP backscatter indicated clear differences in scattering layer depth and migration patterns across the CCZ for both datasets. Observations from the northwest end of the region (e.g., 16.31°N, 146.45°W; Figure 2A) revealed relatively deep migratory scattering layers as well as strong non-migratory layers between ∼400 and 900 m. Observations from the eastern end of the region (e.g., 11.89°N, 116.61°W; Figure 2B) revealed shallower migrating layers in which most of the mesopelagic community appears to migrate, with several weak non-migratory layers residing in the deep mesopelagic below ∼650 m. These locations represent the upper and lower extremes of midwater oxygen levels in the CCZ (Figure 1A). While we mainly focused on strong mesopelagic DSLs, it is worth noting that weaker migratory and non-migratory DSLs extended below 1,000 m in our 38 kHz datasets (Supplementary Figure 1).
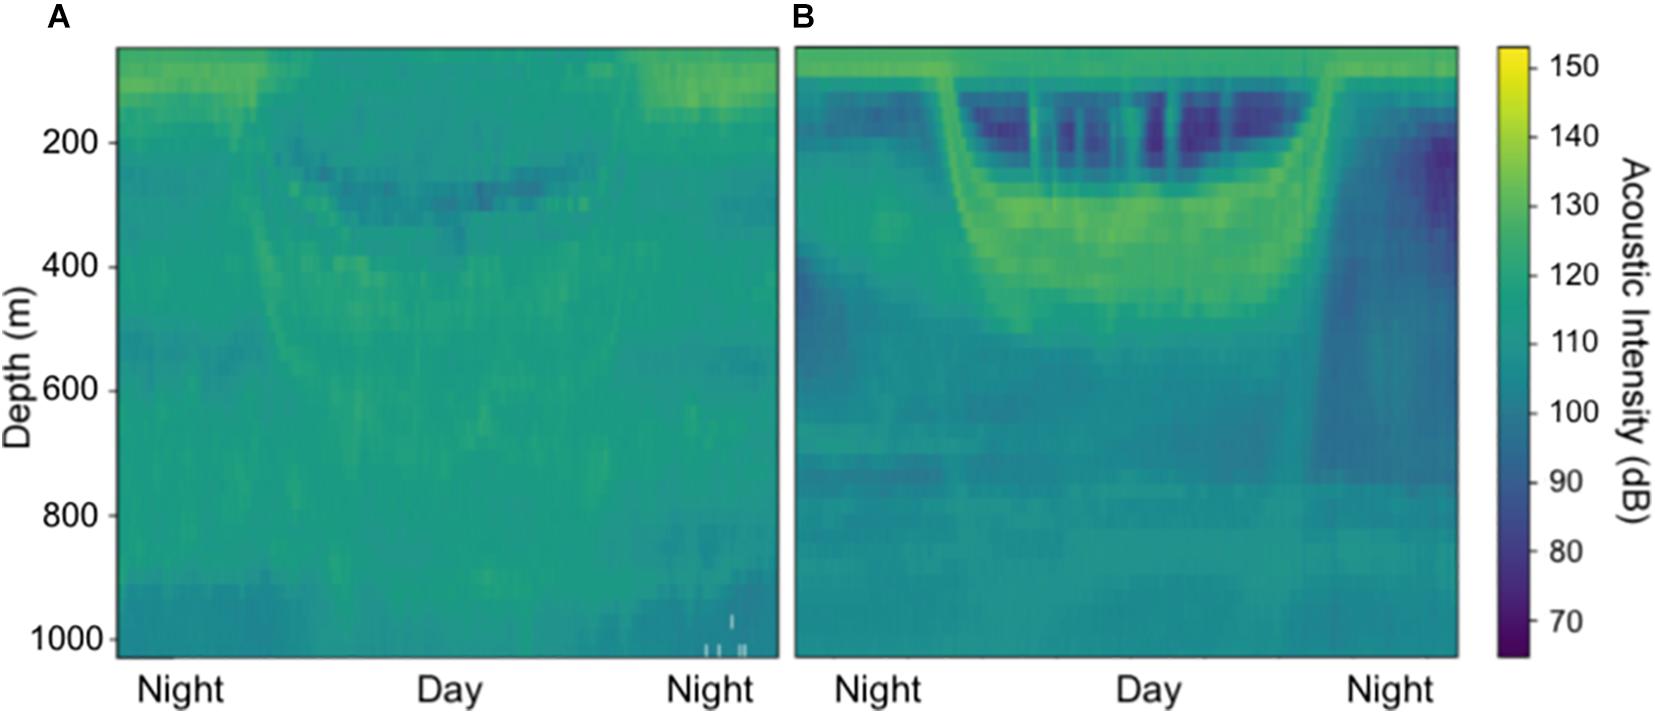
Figure 2. Shipboard ADCP acoustic intensities at 38 kHz in (A) the northwest CCZ (16.31°N, 146.45°W) and (B) the eastern CCZ (11.89°N, 116.61°W) from November 2009. Acoustic intensity units are in decibels (RSSI counts*0.45).
The daytime DSL depth ranged from 270 to 510 m at 75 kHz and 290 to 890 m at 38 kHz, with median depths of 373 and 431 m, respectively. Observed daytime DSL depths at 75 kHz were shallowest in the eastern and central CCZ (Figure 3A), largely following the low-oxygen tongue extending out from the eastern tropical Pacific (Figure 1A). At 38 kHz, DSL depths were shallowest in the eastern and central CCZ as well as in the southwest (Figure 3B), generally following the low-oxygen and increased chl-a tongues extending out from the eastern tropical Pacific, and increased chl-a in the southern CCZ (Figure 1B). Since we lack 38 kHz data from the southcentral and southeastern CCZ, it is unclear whether the pattern of shallower DSL depths continues across the southern CCZ following enhanced chl-a.
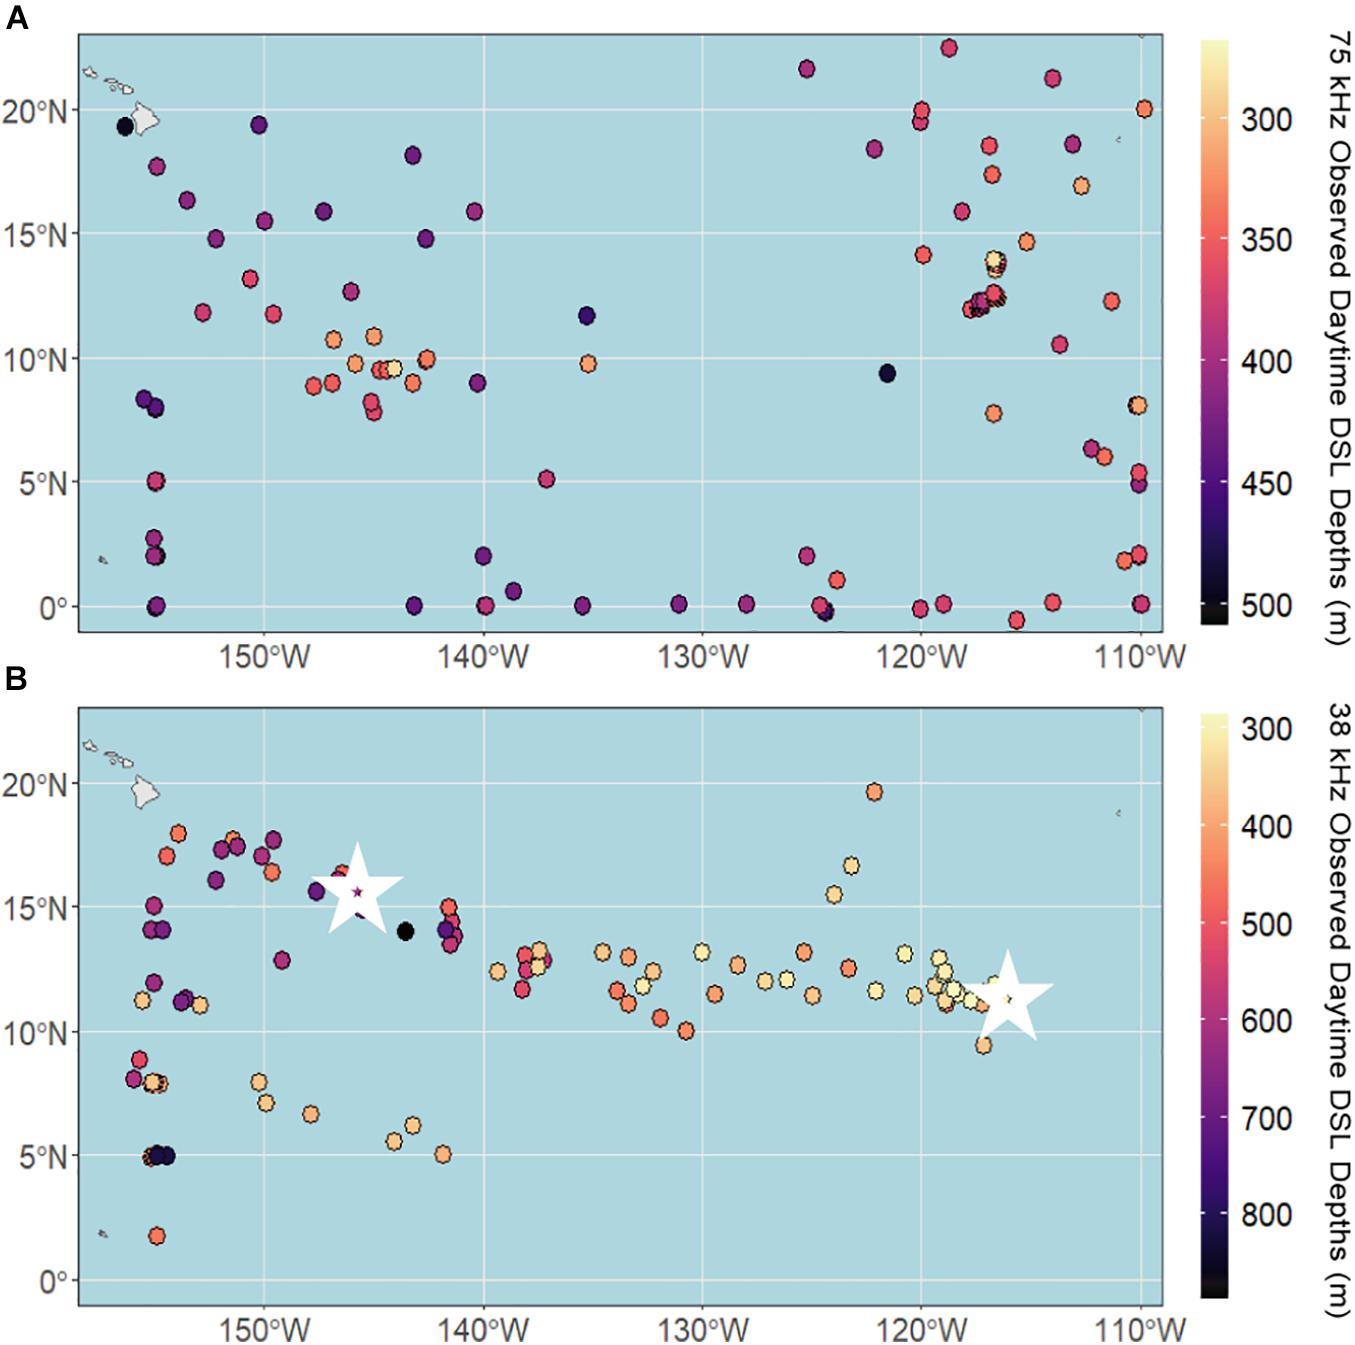
Figure 3. Observed daytime deep scattering layer (DSL) depths across the CCZ region calculated from shipboard ADCP data between 2004 and 2019 at (A) 75 kHz and (B) 38 kHz. White stars indicate the locations of echogram examples (Figure 2).
DVMp ranged from 0.03 to 0.99 at 75 kHz and 0.11 to 0.99 at 38 kHz, with median proportions of 0.86 and 0.63, respectively. DVMp was highest in the eastern and central CCZ for both datasets (Figure 4), largely overlying the most hypoxic waters of the eastern tropical Pacific.
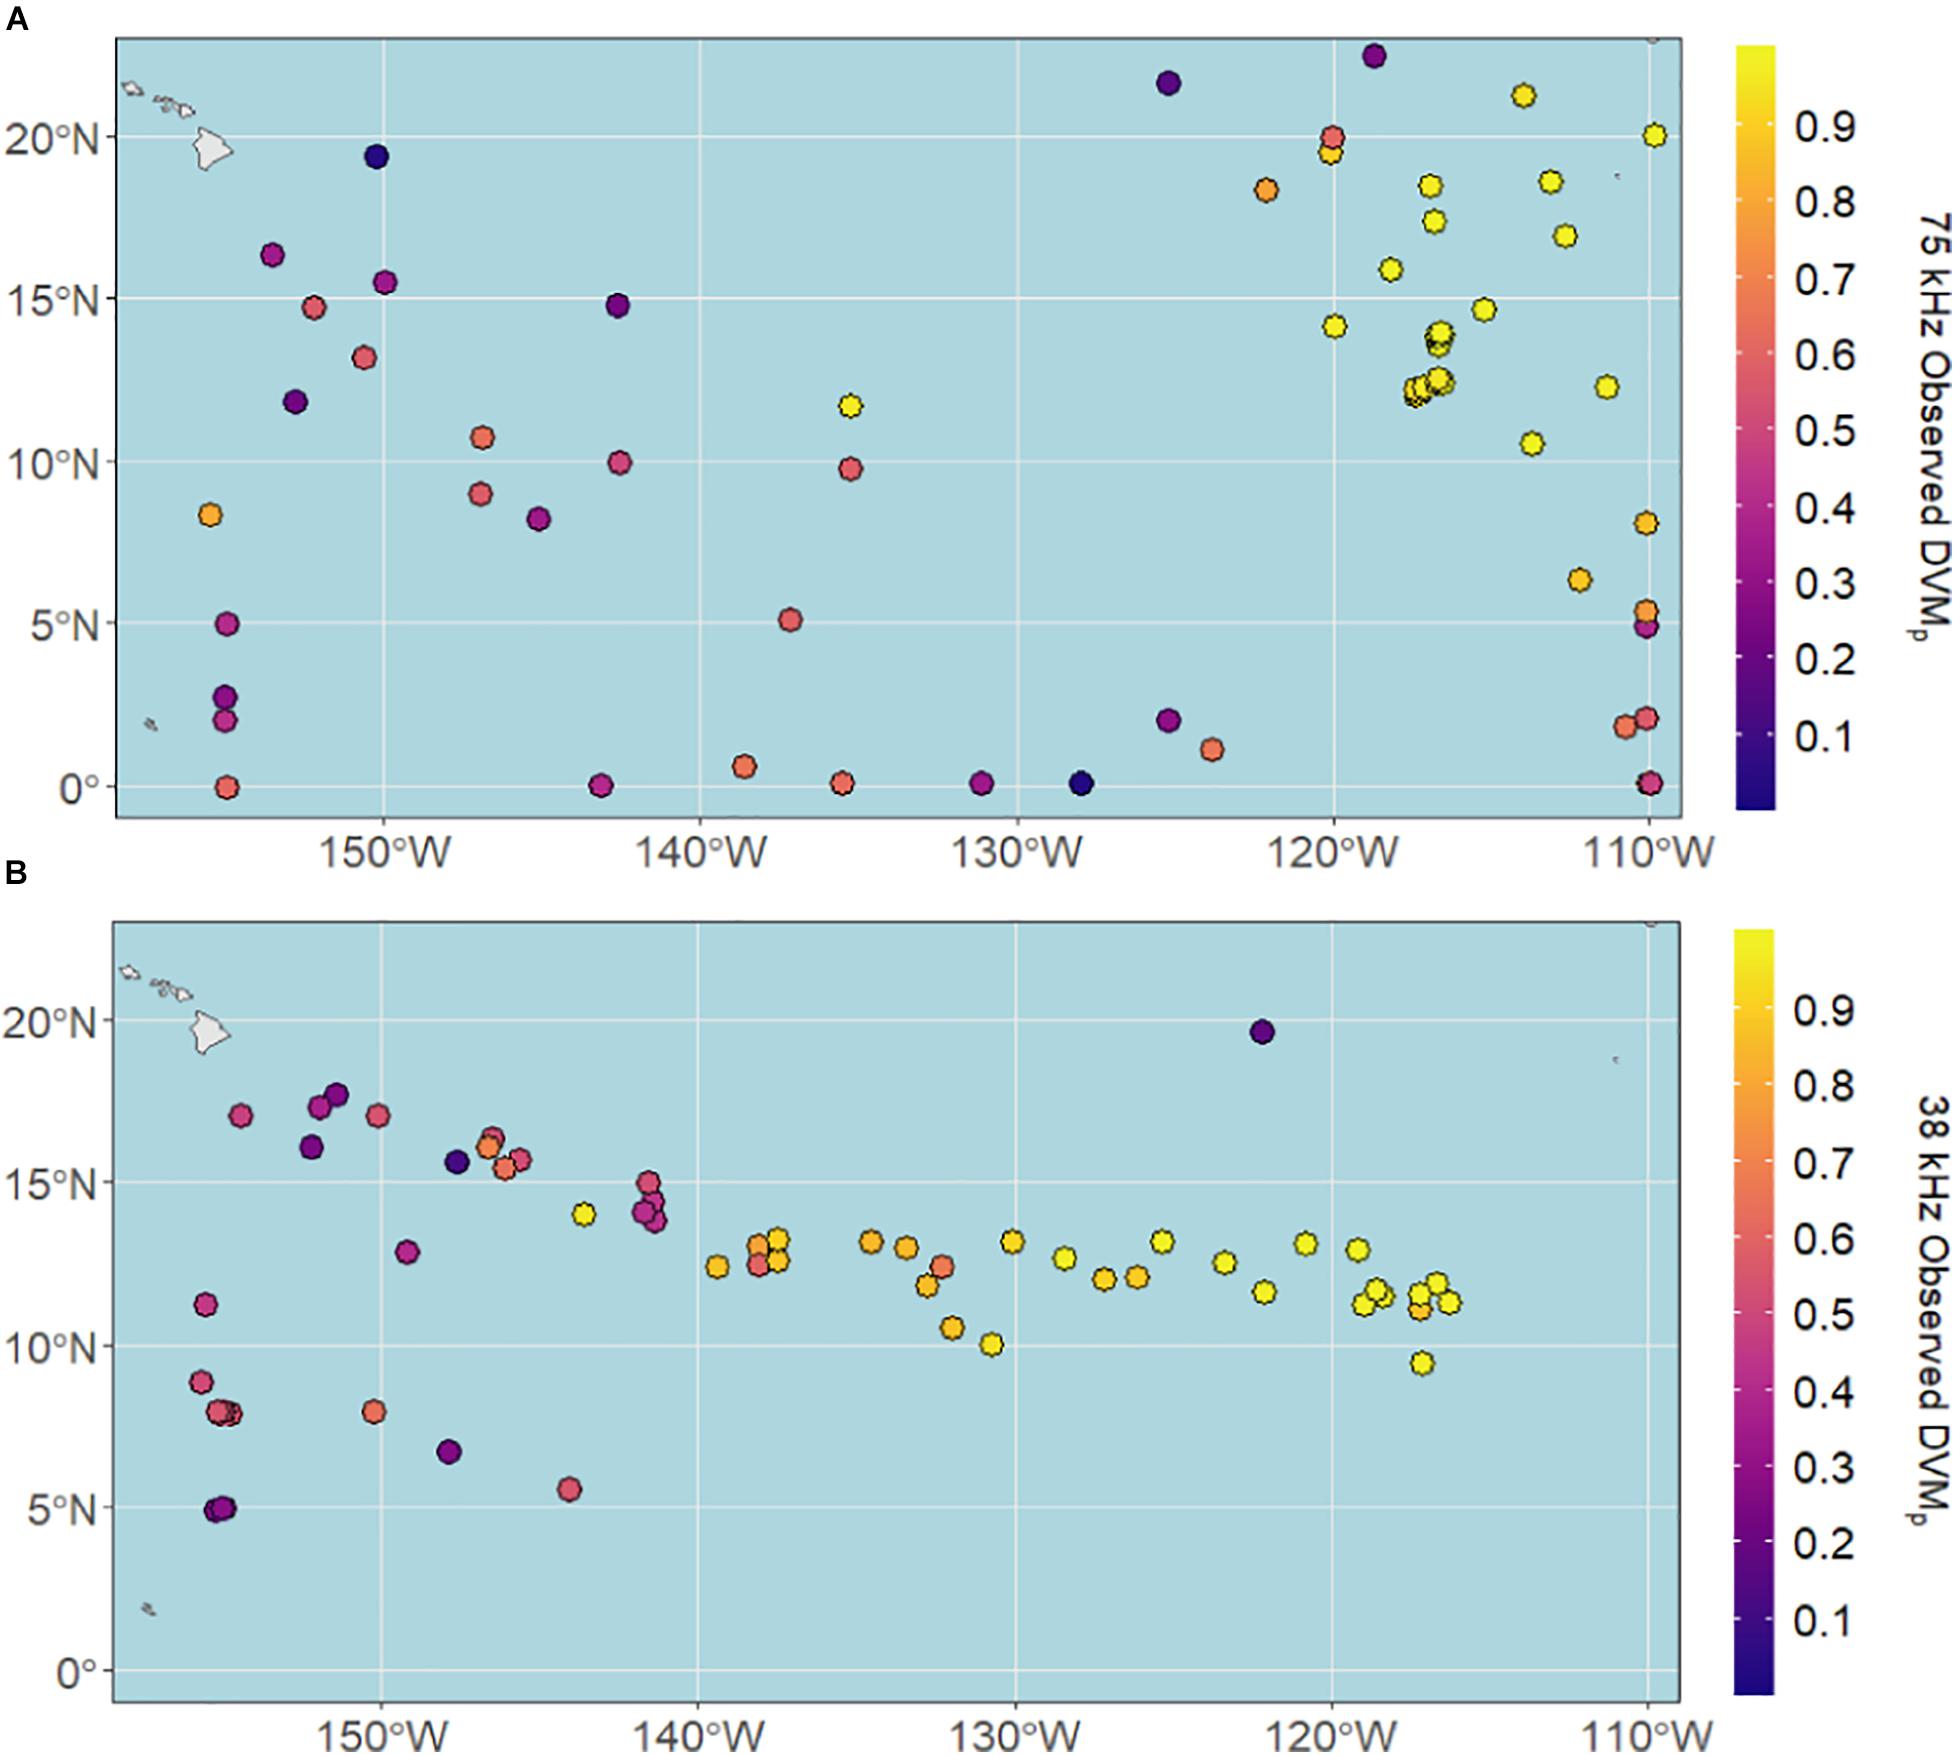
Figure 4. Observed vertical migration proportions (DVMp) across the CCZ region calculated from shipboard ADCP data between 2004 and 2019 at (A) 75 kHz and (B) 38 kHz.
At 75 kHz, daytime DSL depth was best described by a single model including pO2, chl-a, and SSHA (n = 77, adjusted R2 = 0.56; Table 2). DSL depth increased with increasing pO2 and SSHA and decreased with increasing chl-a (Supplementary Figure 2). DSL depth at 38 kHz was more difficult to ascribe to the environmental predictors. Since DSL depths in this dataset were right-skewed (Shapiro-Wilk normality test; p < 0.001), we used a loglinear multiple regression model average that similarly included pO2, chl-a, and SSHA as important predictors (n = 76, adjusted R2 = 0.31; Table 2). Three component models comprised this model average: all included pO2, two included chl-a, and one included SSHA. As in the 75 kHz model, DSL depth increased with increasing pO2 and increasing SSHA and decreased with increasing chl-a in the 38 kHz model average (Supplementary Figure 2). For both frequency datasets, the order of relative variable importance based on sum of Akaike weight values was (1) pO2, (2) chl-a, and (3) SSHA. Oxygen partial pressure at the depth of daytime DSLs ranged from 0.14 to 6.65 kPa at 75 kHz (median = 1.55 kPa, mode = 0.77 kPa) and from 0.12 to 4.80 kPa at 38 kHz (median = 1.65 kPa, mode = 0.73 kPa).
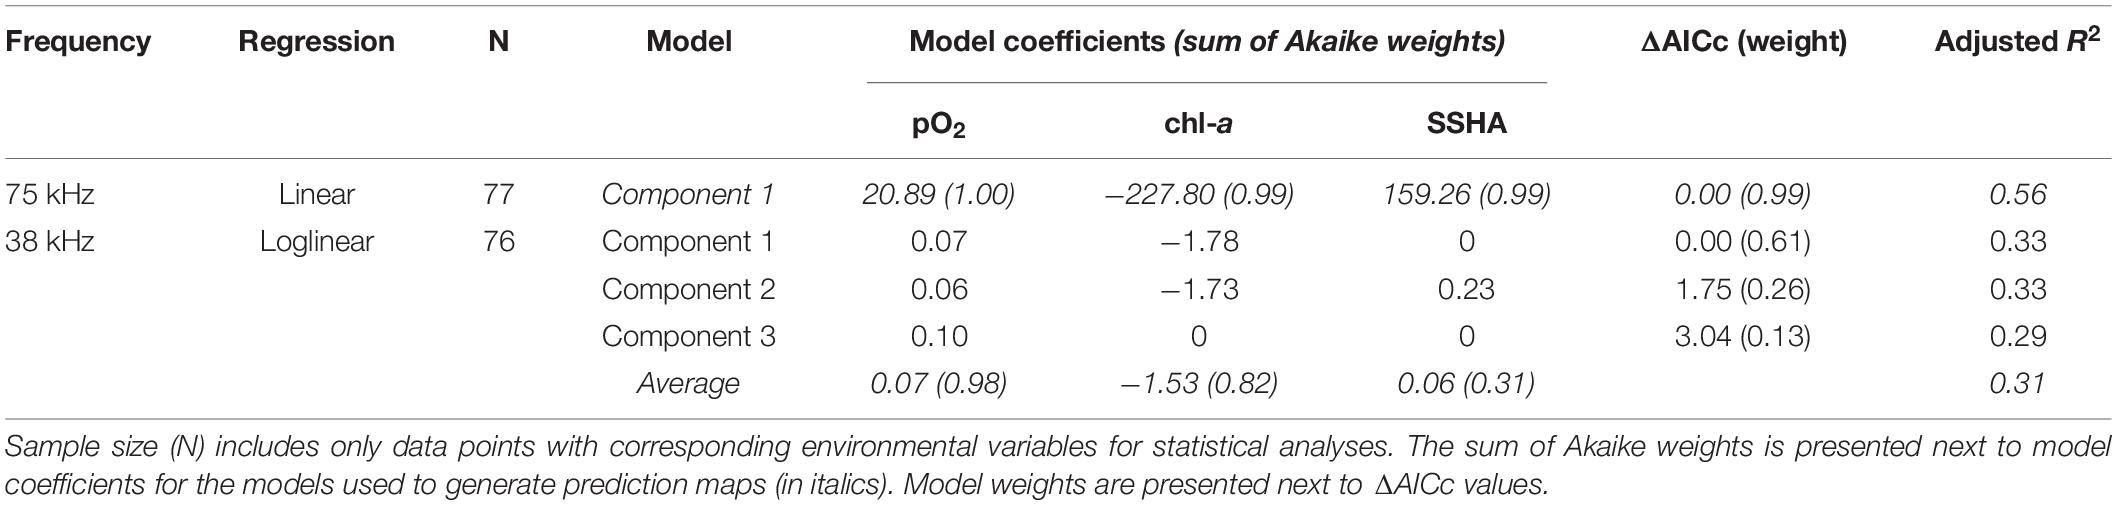
Table 2. Model parameters (component models and averages) from fitted regressions of observed deep scattering layer (DSL) depths for the two ADCP frequencies.
DVMp was influenced by pO2, chl-a, and SSHA at both 75 kHz (n = 46, adjusted pseudo-R2 = 0.60; Table 3) and 38 kHz (n = 56, adjusted pseudo-R2 = 0.56; Table 3). The model averages were comprised of two component models for both frequencies, one without and one with SSHA. According to these multiple beta regressions, DVMp increased with decreasing pO2 and with increasing chl-a and SSHA (Supplementary Figure 3) at both frequencies. Similar to DSL depth, the order of relative variable importance for DVMp in both datasets was (1) pO2 (2) chl-a, and (3) SSHA. DVMp always exceeded 0.9 when midwater oxygen partial pressure fell below 1.0 kPa (75 kHz) and 1.1 kPa (38 kHz).
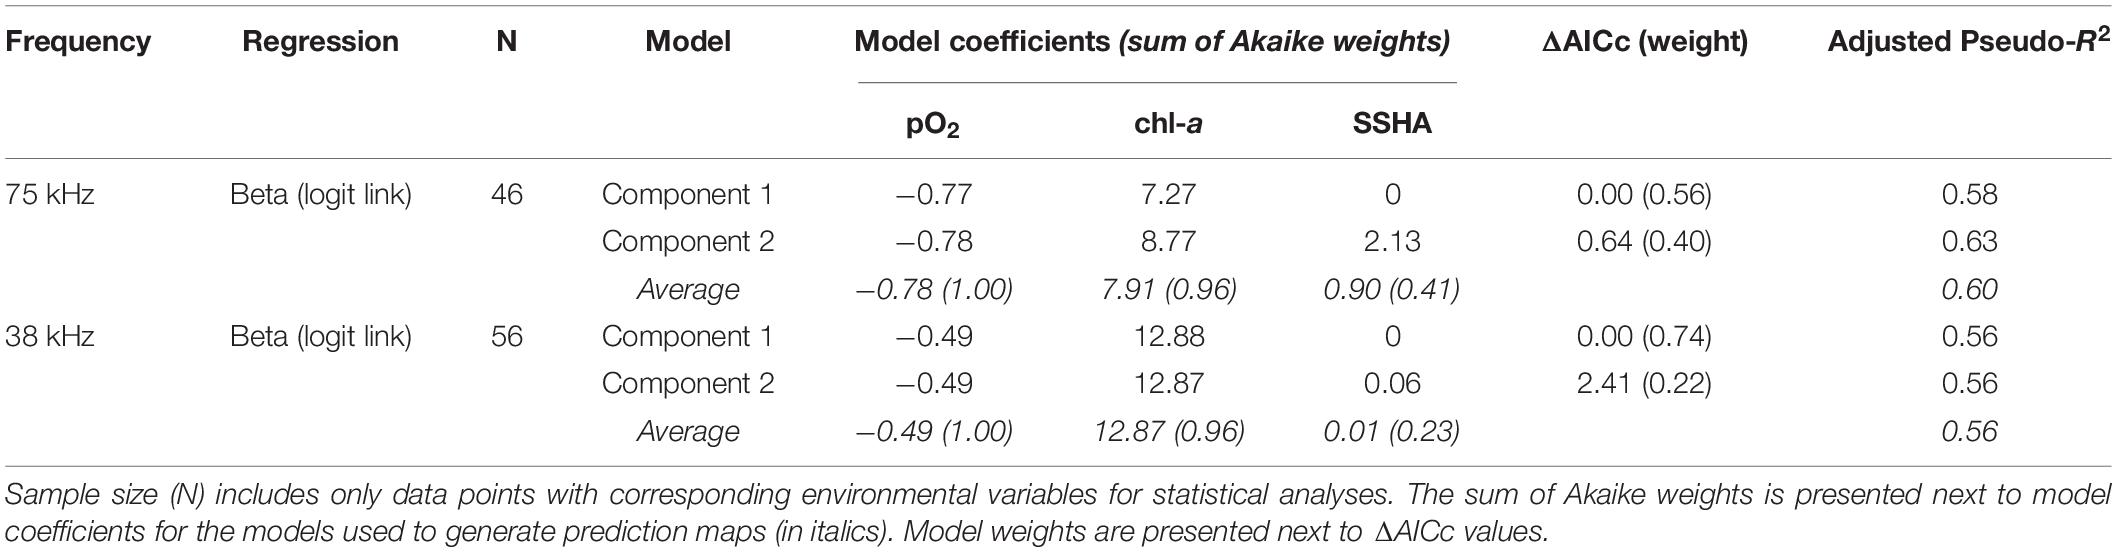
Table 3. Model parameters (component models and averages) from fitted regressions of observed vertical migration proportion (DVMp) for the two ADCP frequencies.
Model predictions for both frequencies extended our observations of shallow DSL depths in the eastern and central CCZ, largely overlapping the most hypoxic waters of the OMZ (Figures 5A,B). However, due to the low explanatory power of the 38 kHz model, the predictions for this frequency were less reliable. The predicted DSL depth ranges for 75 kHz (345–553 m) were shallower than those for 38 kHz (358–753 m), but similar DSL depths were predicted in the most hypoxic waters of the eastern CCZ for both datasets (∼355–370 m). Most licensed exploration areas had relatively shallow DSL depths, while most APEIs occurred where DSL depths changed most rapidly. The mean (±1 SD) predicted daytime DSL depths across current licensed exploration areas and APEIs were 365 ± 12 and 389 ± 14 m at 75 kHz (p < 0.001) and 388 ± 19 and 424 ± 24 m at 38 kHz (p < 0.001), respectively, with the eastern-most license areas having the shallowest DSLs. APEI-9 had the shallowest predicted DSL depths of the APEIs (370 and 393 m for 75 and 38 kHz, respectively), and APEI-3 had the deepest (410 and 468 m for 75 and 38 kHz, respectively). Our predictions showed minor seasonal trends in DSL depths for both frequencies (Supplementary Figure 4), with patterns suggesting a slight summertime deepening of DSL depths.
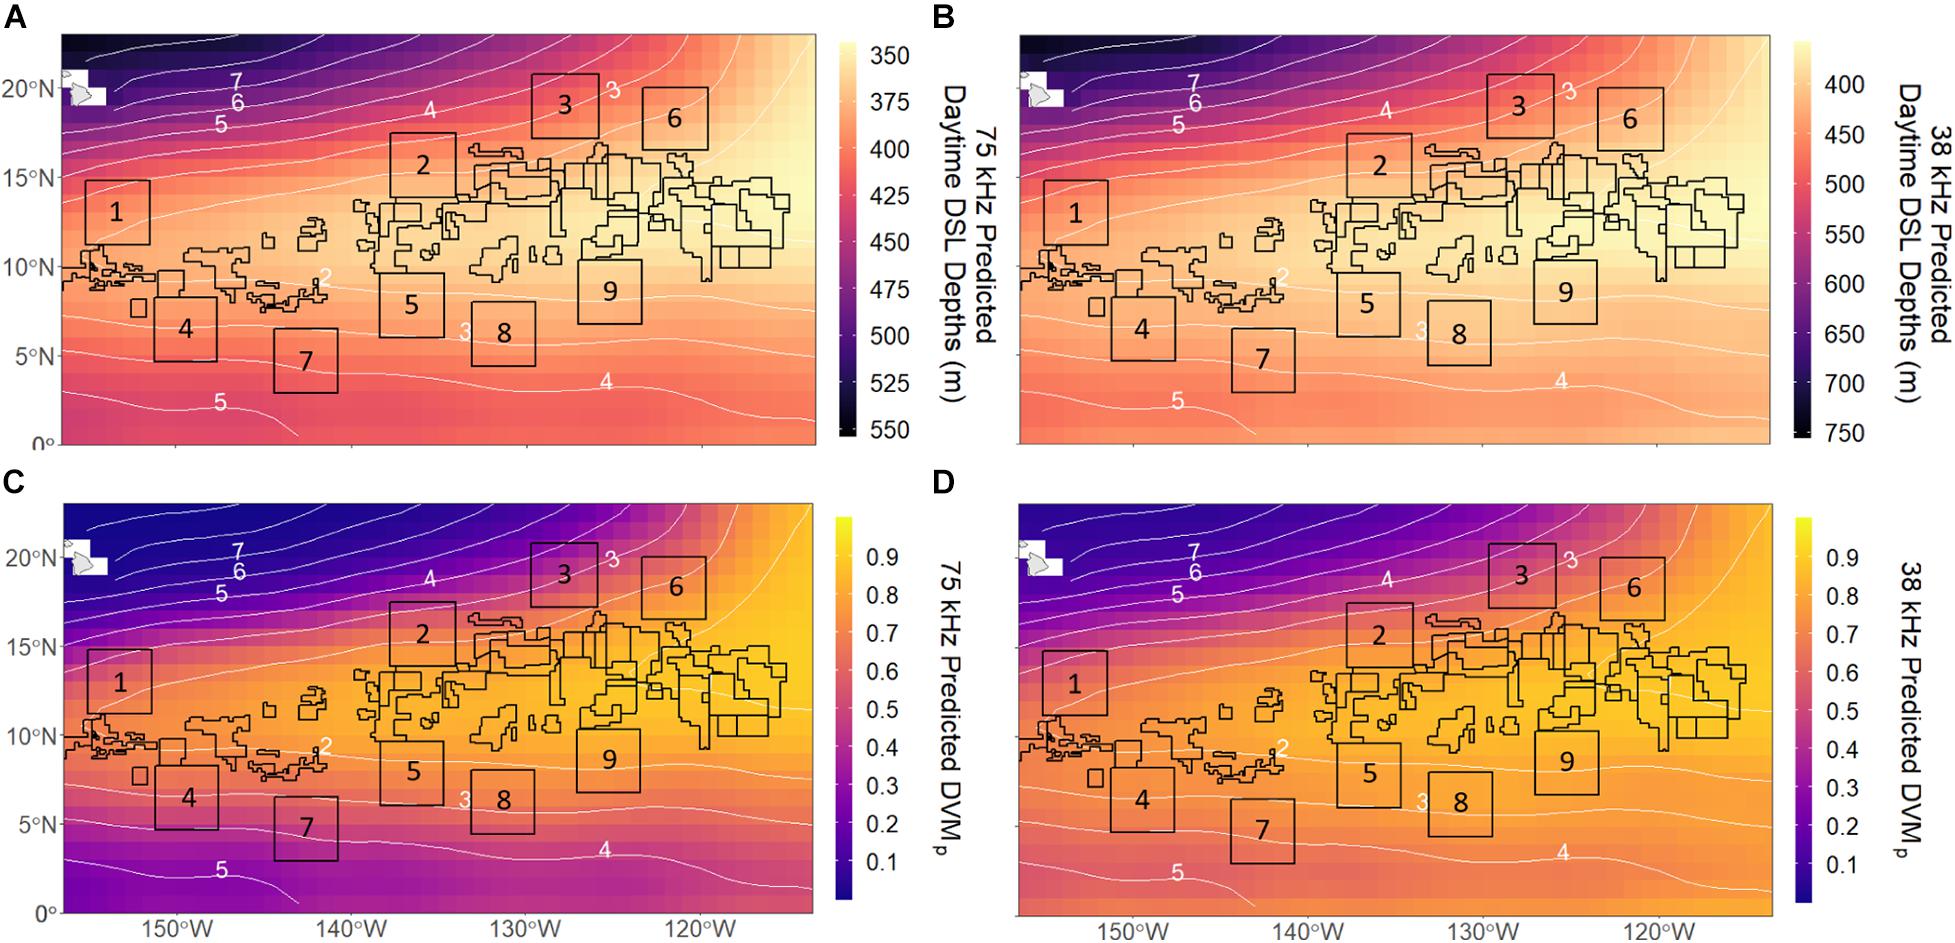
Figure 5. Annual mean 1 × 1° predictions for daytime deep scattering layer (DSL) depths at (A) 75 kHz and (B) 38 kHz and vertical migration proportions (DVMp) at (C) 75 kHz and (D) 38 kHz across the CCZ. Numbered boxes indicate Areas of Particular Environmental Interest (APEIs) and all other polygons represent mining exploration claim areas designated by the International Seabed Authority (ISA). White numbered contours represent mean midwater oxygen partial pressure (pO2; kPa).
DVMp predictions for the CCZ were similar in pattern to those for DSL depths. DVMp was highest in the eastern and central CCZ for both frequencies (Figures 5C,D), overlapping with the OMZ and most licensed exploration areas (particularly the eastern-most license areas). DVMp predictions ranged from 0.004 to 0.90 at 75 kHz and from 0.04 to 0.90 at 38 kHz, with values exceeding 0.85 in the most hypoxic waters for both frequencies. Overall, DVMp was higher in the southern CCZ (∼0–5°N) at 38 kHz than at 75 kHz. Most APEIs had weaker migrations than license areas as they lie near the OMZ boundaries. The mean (±1 SD) predicted DVMp among all license areas and APEIs were 0.80 ± 0.07 and 0.62 ± 0.11 at 75 kHz (p < 0.001) and 0.82 ± 0.06 and 0.71 ± 0.09 at 38 kHz (p < 0.001). APEI-9 was predicted to have the highest DVMp (0.76 and 0.81 for 75 and 38 kHz, respectively) and APEI-3 was predicted to have the lowest (0.44 and 0.53 at 75 and 38 kHz, respectively). Similar to DSL depths, there were minor seasonal patterns in the predictions of DVMp (slight summertime weakening of migration) for the CCZ region (Supplementary Figure 5).
Our analyses of acoustically measured micronekton and large zooplankton migratory behaviors highlight the significance of the Eastern Tropical Pacific OMZ in structuring mesopelagic communities across the CCZ. Amongst the environmental variables explored, midwater oxygen appears to be the strongest driver of daytime habitat depth and vertical migration strength in the CCZ. Midwater oxygen was present in all component models with the highest relative importance (sum of Akaike weights; Tables 2, 3), and it largely structured the predicted behavioral patterns of these communities. As expected, DSL depths shoal and vertical migration strength increases along decreasing midwater oxygen gradients, leading to patterns in these behaviors that primarily follow the “tongue” shape of the OMZ (Figures 1A, 5). Under low oxygen conditions, Klevjer et al. (2016) similarly observed midwater oxygen as a primary driver of global daytime scattering layer depths and migrating proportions. At more regional scales, other studies have also observed scattering layer organisms to closely follow oxyclines (Netburn and Koslow, 2015; Wishner et al., 2018). Although our 38 kHz dataset does not cover the southern and northern CCZ, we suspect that DVMp in this community is lower across the southern and northwestern CCZ where oxygen is higher, and DVMp is higher to the northeast following the trend with low oxygen.
By putting a physiological constraint on organisms, oxygen can impact the vertical distribution and duration spent at depth when oxygen levels are low. Above an OMZ, many organisms may only inhabit waters as deep as their hypoxia tolerance allows, and greater proportions of the mesopelagic community vertically migrate to higher oxygen surface waters at night in areas where midwaters are most hypoxic to offset oxygen limitation (Seibel, 2011; Klevjer et al., 2016). Metabolic suppression at depth in OMZs is a common strategy for vertical migrators (Seibel, 2011). Many mesozooplankton and micronekton can only adjust their capacity to acquire oxygen down to a critical oxygen partial pressure threshold of ∼0.8–1.0 kPa (though this varies regionally and between taxa), but some can migrate well into hypoxic waters of OMZs using a variety of adaptations to cope with low oxygen (Sameoto, 1986; Childress and Seibel, 1998; Hofmann et al., 2011; Seibel, 2011; Wishner et al., 2013; Seibel et al., 2016). Climatological oxygen partial pressures at DSL depths in this study had median values of 1.55 and 1.65 kPa for the 75 and 38 kHz communities, respectively, and were similar to critical oxygen thresholds reported for mesozooplankton and micronekton in OMZ regions (Seibel, 2011; Cade and Benoit-Bird, 2015; Seibel et al., 2016).
We identified mean oxygen partial pressure between 200 and 1,000 m as the most parsimonious oxygen metric to include in our models. This range likely encompasses the species-specific depths at which hypoxia tolerance thresholds are encountered, which follows the notion that there is no common oxygen preference across the global ocean (Aksnes et al., 2017). It is important to emphasize that the scattering layer is not singular; rather, multiple layers migrate at variable times and to different depths. Since responses to hypoxia are species-specific, community-wide metrics like single frequency acoustic backscatter might miss variability that is significant to food web dynamics and ecosystem services such as carbon cycling. Future work should thus employ additional techniques like broadband surveys and trawl sampling to assess the taxon-specific details underlying the community patterns we observed in this study.
DSL depths and migration strength were also influenced by other environmental factors according to our models. DSL depths shoaled and migration strength increased with increasing surface chlorophyll for both frequency-defined communities. Enhanced chlorophyll concentration in surface waters can absorb and scatter downwelling light (Yentsch and Phinney, 1989), leading to lower visual predation pressure that could allow zooplankton and micronekton to reside at shallower depths. Chlorophyll-a may also fuel enhanced secondary production that can be channeled up to higher trophic level organisms (Legendre and Michaud, 1999; Hirst and Bunker, 2003), and this food availability in surface waters could lead to enhanced migration strength. While our results evaluate DVM behaviors, recent work using global satellite-based light-detection-and-ranging (lidar) data calculated total DVM biomass (not DVM strength) to be higher in more productive regions with higher food availability, including the tropical Pacific (Behrenfeld et al., 2019).
Our models further suggest that DSL depths deepen and migration strength increases with increasing SSHA. SSHA can act as a surface proxy for meso- and macroscale oceanographic features such as eddies and fronts, both of which have been observed to influence micronekton vertical structure and aggregation in the pelagic ocean (e.g., Drazen et al., 2011; Béhagle et al., 2016). In the northern hemisphere, downwelling (+ SSHA) by anticyclonic eddies can bring micronekton and zooplankton to deeper waters, while upwelling (− SSHA) from cyclonic eddies may do the opposite by shoaling the thermocline and enhancing secondary production (food availability) in shallower waters (Bakun, 2007; Drazen et al., 2011; Béhagle et al., 2014). Enhanced surface chlorophyll associated with both cyclonic eddy interiors and anticyclonic eddy peripheries (e.g., Mizobata et al., 2002) could also decrease light penetration and further influence the shoaling of scattering layers. It is worth noting that SSHA was not important in every component model (Tables 2, 3), and it is likely a weaker indicator of scattering layer dynamics across the CCZ than pO2 and chl-a. SSHA indirectly influences the region-wide predictions of DSL depths and DVMp because its inclusion in the empirical models changes the parameter estimates for chl-a and pO2 during model fitting. However, the direct effect of SSHA is excluded from the region-wide predictions as mesoscale eddies and fronts only have short-term influences on scattering layer behaviors (i.e., weeks to months) in a fixed area (D’Ovidio et al., 2013). Although we lack a complete mechanistic understanding of how each environmental factor influences DVM behavior in micronekton and zooplankton, such satellite-based and climatological variables provide useful proxies that account for a portion of the variability in DSL behaviors in remote regions like the CCZ.
While we observed similar behaviors in relation to environmental factors in both frequency-defined communities, there were significant disparities between DSL depths and migration strengths worth noting. The ranges of observed daytime DSL depths were deeper for the 38 kHz community (290–890 m) than for the 75 kHz community (270–510 m). While there are variable hypoxia thresholds among marine fauna (Hofmann et al., 2011), oxygen partial pressure at daytime DSL depths was similar for 75 kHz (median 1.55 kPa, mode = 0.77 kPa) and 38 kHz (median = 1.65 kPa; mode = 0.73 kPa) communities in our observations. Thus, it is unlikely that differences in oxygen tolerance are driving the disparities in daytime depths between these communities. Clearly, the increased depths observed by the 38 kHz frequency itself may skew DSL locations toward greater possible depths. However, there was no evidence of strong DSLs approaching the maximum depth range in our 75 kHz dataset (i.e., the peak acoustic intensity was well above 650 m). Additionally, there may be biological explanations for these differences. For instance, it is likely that larger organisms dominate lower frequency (longer wavelength) signals where near-resonance effects would amplify scattering by larger organisms with gaseous inclusions. It is possible that these organisms, such as swim-bladdered myctophids, are simply more mobile and thus can reach greater daytime depths. Following size-dependent predator-avoidance hypotheses (Lampert, 1993; De Robertis, 2002), larger micronekton are also more conspicuous to visual predators, and thus may need to reside at deeper daytime depths than smaller organisms to stay hidden, as has been observed with zooplankton (Bollens et al., 2010). Our observations of DVMp likewise differed by frequency, with a higher median proportion for 75 kHz (0.86) than for 38 kHz (0.63), though total ranges were similar. One possible explanation for this difference is that non- or weakly migratory, lower mesopelagic and bathypelagic fishes (e.g., stomiids) contribute to 38 kHz nighttime backscatter at depths below 650 m (Andersen et al., 1992; Kenaley, 2008; Sutton et al., 2010), which is the limit of our 75 kHz observations. This would lower the day-to-night backscatter ratios and thus lead to lower values of DVMp.
Although oxygen was an important factor controlling daytime DSL depths for both communities, it was not as influential for the 38 kHz community, and we were ultimately unable to account for as much variability in this group with the environmental variables in this study (R2 = 0.31; Table 2). Although DSL depth predictions for this community still largely follow the shape of the Eastern Tropical Pacific OMZ similarly to the 75 kHz community, they deviate slightly from this pattern and appear to reflect a stronger influence of surface chlorophyll, with shallower DSL depths appearing across the southern CCZ (Figure 5B). DVMp predictions for the 38 kHz community similarly reflect a stronger influence of chl-a, with higher migrating proportions extending south of the OMZ (Figure 5D). This model had higher explanatory power (R2 = 0.56; Table 3) than that for DSL depth, but it underestimated DVMp east of ∼130°W, highlighting the variance unaccounted for by this model (Supplementary Figure 7D). More 38 kHz observations across the southern and northern CCZ (Figures 3B, 4B) are required to fully evaluate predictions there. The relative influences of environmental factors on micronekton and zooplankton behavior may be different between these two mesopelagic communities in the CCZ, and it is possible that there are additional factors affecting the 38 kHz community that are not accounted for in this study.
The acoustic properties of organisms themselves can be a source of variability affecting the signals obtained. Evidence from recent depth-stratified broadband acoustic surveys in the Atlantic Ocean (Bassett et al., 2020) suggests that ship-based echo sounders at frequencies near 38 kHz under sample scattering layers at deeper depths. This is because the contribution to backscatter from marine organisms can be strongly frequency and depth dependent. For example, gaseous swimbladder-bearing fish that resonate near 38 kHz in the upper water column have a higher resonance frequency at greater depths. The combination of this shift in the resonance frequency of those fish, and increased attenuation of higher frequency signals (e.g., 75 kHz), may mean that neither the 38 kHz nor 75 kHz frequency is detecting many organisms in the lower mesopelagic that resonate near 38 kHz in shallower waters. Thus, the ship-based systems we employ here likely have a “blind-spot” at greater depths. In this regard, our observations of DSL depths across the CCZ assume that peak acoustic intensity represents the strongest or densest biomass layers, but we recognize that this may not necessarily be the case. Depths of peak acoustic intensity may also represent the depths of specific communities of organisms that happen to resonate most strongly at that particular frequency and depth (Davison et al., 2015). It is important to consider such complexities in acoustic data for addressing vertical community structure in the pelagic ocean when concurrent trawl or specimen data is lacking.
The community compositions of DSLs we observed from ADCP backscatter in the CCZ are unknown. However, the aforementioned mesopelagic biogeographical ecoregions defined for the CCZ (Sutton et al., 2017) are consistent with our observations of disparate scattering layer behaviors; shallower daytime DSLs and stronger vertical migration in the eastern and central CCZ (Eastern Tropical Pacific ecoregion), and deeper daytime DSLs and weaker vertical migration in the northwestern CCZ (the Northern Central Pacific ecoregion). Thus, it is possible that differences in scattering layer behaviors across the region are indicative of changes in mesopelagic faunal composition. The Northern Central Pacific ecoregion appears to hold high mesopelagic fish diversity and a dominant abundance of fish in the genus Cyclothone (Clarke, 1973, 1974, 1976; Maynard et al., 1975; Barnett, 1983). Despite high abundances of Cyclothone collected in trawls, several species within this genus have regressed or fat-invested swim bladders (Phleger, 1998; Davison, 2011; Dornan et al., 2019), rendering them weak acoustic scatterers. Thus, Cyclothone may not contribute significantly to the acoustic backscatter we observed and could be considered “acoustically cryptic” (Dornan et al., 2019). However, those species containing a gas-filled swim bladder (e.g., C. pseudopallida) are likely non-migrators (Davison, 2011) and may contribute to observed non-migratory scattering layers. Similarly to our observed DSL depths and DVMP in the NW corner of the CCZ (Figures 3, 4), nearly half of daytime micronekton biomass below 400 m has been found to migrate into the upper 400 m at night around Hawai’i (Maynard et al., 1975). Also consistent with our acoustic observations, micronekton and macrozooplankton vertical distributions in parts of the Eastern Tropical Pacific Ecoregion suggest that the upper water column down to 550 m is strongly influenced by DVM in and out of the upper oxycline and OMZ core (Maas et al., 2014). Fishes and crustaceans (particularly euphausiids) appear to dominate this community. Secondary biomass peaks in zooplankton and micronekton have also been observed at OMZ lower oxycline depths from trawls and acoustics (Supplementary Figure 6; Bianchi et al., 2013; Wishner et al., 2013; Maas et al., 2014; Klevjer et al., 2016). This is consistent with our observations of additional, weaker scattering layers extending well below ∼500 m in the OMZ (Figure 2 and Supplementary Figure 1), following the hypothesis that these low-oxygen waters provide some organisms with a refuge from large visual predators with greater oxygen demands (Seibel, 2011).
Despite our minimal understanding of mesopelagic community composition across the CCZ, these results provide basic information about deep pelagic communities that is relevant and significant to deep-sea mining in the region. After nodules are pumped from the abyssal seafloor to the surface, sediment plumes will be released into the water column after dewatering of polymetallic ore. As these sediment plumes will likely impact midwater communities, Drazen et al. (2020) recently recommended that they be discharged below depths of 1,500–2,000 m (i.e., well below the lower bounds of the mesopelagic), or be released all the way back to the abyssal seafloor. However, the ISA has yet to set that discharge depth, and if released too shallow (i.e., into the mesopelagic), these plumes could interact with and influence DVM behaviors and their associated ecosystem functions. An understanding of how DVM behaviors vary among licensed exploration areas and APEIs is crucial. For example, our overall findings suggest that dominant daytime DSLs are shallowest and vertical migration strength is highest in the eastern-most license areas (Figure 5). Mesopelagic mining impacts in this region could therefore have a greater influence on vertical coupling and DVM-mediated carbon transport (Longhurst et al., 1990; Ducklow et al., 2001) depending on the depth zones affected by mining.
Importantly, the majority of licensed mining exploration areas in the CCZ lie within the OMZ, and consequently these areas contain the shallowest scattering layer depths and strongest vertical migrations. However, the system of APEIs surrounding these mining zones lie on the boundaries or just outside of the OMZ, exhibiting relatively deeper scattering layers and weaker migrations. Many pelagic OMZ fauna are highly adapted (behaviorally and biologically) or endemic to low-oxygen habitats (Antezana, 2009; Seibel et al., 2016; Sutton et al., 2017). Our observations of disparate behavioral dynamics, combined with this knowledge of OMZ-specialist fauna, indicates that these protected, no-mining reserves likely do not adequately represent or protect the OMZ organisms in oceanic midwaters that could be impacted by deep-sea mining (Drazen et al., 2020). The APEI network of nine 400-km2 reserve areas was spatially designed to protect the diversity of benthic habitats and fauna within the CCZ mining region (Wedding et al., 2013), so it is not surprising that these areas may not protect midwater habitats as they are currently placed. However, in order to prevent excessive harm to midwater ecosystems, whose services are closely linked to humans, the deep pelagic must be included in precautionary management plans and future environmental research in the CCZ (Christiansen et al., 2019; Drazen et al., 2020). Future work combining broadband acoustics and depth-stratified trawl sampling would provide a more thorough understanding of the organisms comprising DSLs in the CCZ (Kloser et al., 2002; Escobar-Flores et al., 2019), and to what extent different taxa contribute to the patterns of habitat depth and vertical migration that we observed here in opportunistic shipboard ADCP data. Nonetheless, this study provides the first major examination of midwater community dynamics across the remote CCZ, highlights the complexities of mesopelagic micronekton and zooplankton behavior in the open ocean, and raises concerns about the effectiveness of current no-mining areas for pelagic habitats.
The original contributions presented in the study are included in the article/Supplementary Material, further inquiries can be directed to the corresponding author/s.
JP and JD were responsible for the project design and funding was secured by JD. JP led ADCP and statistical analyses as well as manuscript writing. EF led the development of ACDP backscatter processing tools and interpretation. JD and EF aided in the refinement and selection of environmental variables. JG contributed to statistical analyses and statistical model development. BJ contributed to interpretation of the acoustic results. All authors contributed to manuscript writing and have approved the submitted document.
Funding support for this project came from the Benioff Ocean Initiative.
The authors declare that the research was conducted in the absence of any commercial or financial relationships that could be construed as a potential conflict of interest.
We would like to thank Julia Hummon for formatting and providing access to shipboard ADCP data files, Phoebe Woodworth-Jefcoats for her assistance with environmental data extraction and climatology configuration, and Seth Bushinsky for his input on oxygen conversions. We also thank Justin Suca for his contributions to data interpretation, statistical modeling input, and R support. ADCP data was provided by JASADCP and KIOST. Finally, we would like to acknowledge our funding support for this project, the Benioff Ocean Initiative.
The Supplementary Material for this article can be found online at: https://www.frontiersin.org/articles/10.3389/fmars.2021.632764/full#supplementary-material
Ainslie, M. A., and McColm, J. G. (1998). A simplified formula for viscous and chemical absorption in sea water. J. Acoust. Soc. Am. 103, 1671–1672. doi: 10.1121/1.421258
Aksnes, D. L., Røstad, A., Kaartvedt, S., Martinez, U., Duarte, C. M., and Irigoien, X. (2017). Light penetration structures the deep acoustic scattering layers in the global ocean. Sci. Adv. 3:e1602468. doi: 10.1126/sciadv.1602468
Aleynik, D., Inall, M. E., Dale, A., and Vink, A. (2017). Impact of remotely generated eddies on plume dispersion at abyssal mining sites in the Pacific. Sci. Rep. 7:16959.
Amon, D. J., Ziegler, A. F., Dahlgren, T. G., Glover, A. G., Goineau, A., Gooday, A. J., et al. (2016). Insights into the abundance and diversity of abyssal megafauna in a polymetallic-nodule region in the eastern Clarion-Clipperton Zone. Sci. Rep. 6:30492.
Andersen, V., Sardou, J., and Nival, P. (1992). The diel migrations and vertical distributions of zooplankton and micronekton in the Northwestern Mediterranean Sea. 2. Siphonophores, hydromedusae and pyrosomids. J. Plankton Res. 14, 1155–1169. doi: 10.1093/plankt/14.8.1155
Antezana, T. (2009). Species-specific patterns of diel migration into the Oxygen Minimum Zone by euphausiids in the Humboldt Current Ecosystem. Prog. Oceanogr. 83, 228–236. doi: 10.1016/j.pocean.2009.07.039
Ariza, A., Garijo, J. C., Landeira, J. M., Bordes, F., and Hernández-León, S. (2015). Migrant biomass and respiratory carbon flux by zooplankton and micronekton in the subtropical northeast Atlantic Ocean (Canary Islands). Prog. Oceanogr. 134, 330–342. doi: 10.1016/j.pocean.2015.03.003
Bakun, A. (2007). Fronts and eddies as key structures in the habitat of marine fish larvae: opportunity, adaptive response and competitive advantage. Sci. Mar. 70, 105–122. doi: 10.3989/scimar.2006.70s2105
Barnett, M. A. (1983). Species structure and temporal stability of mesopelagic fish assemblages in the Central Gyres of the North and South Pacific Ocean. Mar. Biol. 74, 245–256. doi: 10.1007/BF00403448
Bassett, C., Lavery, A. C., Stanton, T. K., and Cotter, E. D. (2020). Frequency- and depth-dependent target strength measurements of individual mesopelagic scatterers. J. Acoust. Soc. Am. 148:EL153. doi: 10.1121/10.0001745
Béhagle, N., Cotté, C., Ryan, T. E., Gauthier, O., Roudaut, G., Brehmer, P., et al. (2016). Acoustic micronektonic distribution is structured by macroscale oceanographic processes across 20-50°S latitudes in the South-Western Indian Ocean. Deep. Res. Part I Oceanogr. Res. Pap. 110, 20–32. doi: 10.1016/j.dsr.2015.12.007
Béhagle, N., Du Buisson, L., Josse, E., Lebourges-Dhaussy, A., Roudaut, G., and Ménard, F. (2014). Mesoscale features and micronekton in the Mozambique Channel: an acoustic approach. Deep. Res. Part II Top. Stud. Oceanogr. 100, 164–173. doi: 10.1016/j.dsr2.2013.10.024
Behrenfeld, M. J., Gaube, P., Della Penna, A., O’Malley, R. T., Burt, W. J., Hu, Y., et al. (2019). Global satellite-observed daily vertical migrations of ocean animals. Nature 576, 1–5.
Bianchi, D., Galbraith, E. D., Carozza, D. A., Mislan, K. A. S., and Stock, C. A. (2013). Intensification of open-ocean oxygen depletion by vertically migrating animals. Nat. Geosci. 6:545. doi: 10.1038/ngeo1837
Bogorov, B. G. (1946). Peculiarities of diurnal vertical migrations of zooplankton in polar seas. J. Mar. Res 6, 25–32.
Bollens, S. M., Rollwagen-Bollens, G., Quenette, J. A., and Bochdansky, A. B. (2010). Cascading migrations and implications for vertical fluxes in pelagic ecosystems. J. Plankton Res. 33, 349–355. doi: 10.1093/plankt/fbq152
Cade, D. E., and Benoit-Bird, K. J. (2015). Depths, migration rates and environmental associations of acoustic scattering layers in the Gulf of California. Deep. Res. Part I Oceanogr. Res. Pap. 102, 78–89. doi: 10.1016/j.dsr.2015.05.001
Cheng, Y.-H., Ho, C.-R., Zheng, Q., and Kuo, N.-J. (2014). Statistical characteristics of mesoscale eddies in the North Pacific derived from satellite altimetry. Remote Sens. 6, 5164–5183. doi: 10.3390/rs6065164
Childress, J. J., and Seibel, B. A. (1998). Life at stable low oxygen levels: adaptations of animals to oceanic oxygen minimum layers. J. Exp. Biol. 201, 1223–1232.
Choy, C. A., Portner, E., Iwane, M., and Drazen, J. C. (2013). Diets of five important predatory mesopelagic fishes of the central North Pacific. Mar. Ecol. Prog. Ser. 492, 169–184. doi: 10.3354/meps10518
Christiansen, B., Denda, A., and Christiansen, S. (2019). Potential effects of deep seabed mining on pelagic and benthopelagic biota. Mar. Policy. 114:103442. doi: 10.1016/j.marpol.2019.02.014
Clarke, T. A. (1973). Some aspects of the ecology of lanternfishes (myctophidae) in the Pacific Ocean near Hawaii. Fish. Bull. 71, 401–434.
Clarke, T. A. (1974). Some aspects of the ecology of stomiatoid fishes in the Pacific Ocean near Hawaii. Fish. Bull. 72, 337–351.
Clarke, T. A. (1976). Vertical distribution and other aspects of the ecology of certain mesopelagic fishes taken near Hawaii. Fish. Bull. 74, 635–645.
Davison, P. (2011). The specific gravity of mesopelagic fish from the northeastern Pacific Ocean and its implications for acoustic backscatter. ICES J. Mar. Sci. 68, 2064–2074. doi: 10.1093/icesjms/fsr140
Davison, P. C., Checkley, D. M., Koslow, J. A., and Barlow, J. (2013). Carbon export mediated by mesopelagic fishes in the northeast Pacific Ocean. Prog. Oceanogr. 116, 14–30. doi: 10.1016/j.pocean.2013.05.013
Davison, P. C., Koslow, J. A., and Kloser, R. J. (2015). Acoustic biomass estimation of mesopelagic fish: backscattering from individuals, populations, and communities. ICES J. Mar. Sci. 72, 1413–1424. doi: 10.1093/icesjms/fsv023
De Robertis, A. (2002). Size-dependent visual predation risk and the timing of vertical migration: an optimization model. Limnol. Oceanogr. 47, 925–933. doi: 10.4319/lo.2002.47.4.0925
Deines, K. L. (1999). “Backscatter estimation using broadband acoustic Doppler current profilers,” in Proceedings of the IEEE Sixth Working Conference on Current Measurement (Cat. No. 99CH36331), (Piscataway,NJ: IEEE), 249–253.
Dickson, R. R. (1972). On the relationship between ocean transparency and the depth of sonic scattering layers in the North Atlantic. ICES J. Mar. Sci. 34, 416–422. doi: 10.1093/icesjms/34.3.416
Dietz, R. S. (1948). Deep scattering layer in the Pacific and Antarctic Oceans. J. Mar. Res. 7, 430–442.
Dornan, T., Fielding, S., Saunders, R. A., and Genner, M. J. (2019). Swimbladder morphology masks Southern Ocean mesopelagic fish biomass. Proc. R. Soc. B 286:20190353. doi: 10.1098/rspb.2019.0353
D’Ovidio, F., De Monte, S., Penna, A. D., Cotté, C., and Guinet, C. (2013). Ecological implications of eddy retention in the open ocean: a Lagrangian approach. J. Phys. A Math. Theor. 46, 1–22. doi: 10.1088/1751-8113/46/25/254023
Drazen, J. C., De Forest, L. G., and Domokos, R. (2011). Micronekton abundance and biomass in Hawaiian waters as influenced by seamounts, eddies, and the moon. Deep Sea Res. Part I Oceanogr. Res. Pap. 58, 557–566. doi: 10.1016/j.dsr.2011.03.002
Drazen, J. C., Smith, C. R., Gjerde, K. M., Haddock, S. H. D., Carter, G. S., Choy, C. A., et al. (2020). Midwater ecosystems must be considered when evaluating environmental risks of deep-sea mining. Proc. Natl. Acad. Sci. U.S.A. 117, 17455–17460. doi: 10.1073/pnas.2011914117
Drazen, J. C., and Sutton, T. T. (2017). Dining in the deep: the feeding ecology of deep-sea fishes. Ann. Rev. Mar. Sci. 9, 337–366. doi: 10.1146/annurev-marine-010816-060543
Ducklow, H. W., Steinberg, D. K., and Buesseler, K. O. (2001). Upper ocean carbon export and the biological pump. Oceanogr. DC-Oceanogr. Soc. 14, 50–58. doi: 10.5670/oceanog.2001.06
Escobar-Flores, P. C., Ladroit, Y., and O’Driscoll, R. L. (2019). Acoustic assessment of the micronekton community on the Chatham Rise, New Zealand, using a semi-automated approach. Front. Mar. Sci. 6:507. doi: 10.3389/fmars.2019.00507
Escobar-Flores, P. C., O’Driscoll, R. L., and Montgomery, J. C. (2018). Predicting distribution and relative abundance of mid-trophic level organisms using oceanographic parameters and acoustic backscatter. Mar. Ecol. Prog. Ser. 592, 37–56. doi: 10.3354/meps12519
Giam, X., and Olden, J. D. (2016). Quantifying variable importance in a multimodel inference framework. Methods Ecol. Evol. 7, 388–397. doi: 10.1111/2041-210X.12492
Gostiaux, L., and Van Haren, H. (2010). Extracting meaningful information from uncalibrated backscattered echo intensity data. J. Atmos. Ocean. Technol. 27, 943–949. doi: 10.1175/2009jtecho704.1
Halsey, L. G. (2019). The reign of the p-value is over: what alternative analyses could we employ to fill the power vacuum? Biol. Lett. 15:20190174. doi: 10.1098/rsbl.2019.0174
Harrison, X. A., Donaldson, L., Correa-Cano, M. E., Evans, J., Fisher, D. N., Goodwin, C. E. D., et al. (2018). A brief introduction to mixed effects modelling and multi-model inference in ecology. PeerJ 6:e4794.
Hirst, A. G., and Bunker, A. J. (2003). Growth of marine planktonic copepods: global rates and patterns in relation to chlorophyll a, temperature, and body weight. Limnol. Oceanogr. 48, 1988–2010. doi: 10.4319/lo.2003.48.5.1988
Hofmann, A. F., Peltzer, E. T., Walz, P. M., and Brewer, P. G. (2011). Hypoxia by degrees: establishing definitions for a changing ocean. Deep. Res. Part I Oceanogr. Res. Pap. 58, 1212–1226. doi: 10.1016/j.dsr.2011.09.004
Isaacs, J. D., Tont, S. A., and Wick, G. L. (1974). Deep scattering layers: vertical migration as a tactic for finding food. Deep Sea Res. Oceanogr. Abstracts 21, 651–656. doi: 10.1016/0011-7471(74)90049-7
Jones, D. O. B., Kaiser, S., Sweetman, A. K., Smith, C. R., Menot, L., Vink, A., et al. (2017). Biological responses to disturbance from simulated deep-sea polymetallic nodule mining. PLoS One 12:e0171750. doi: 10.1371/journal.pone.0171750
Kampa, E. M. (1975). Observations of a sonic-scattering layer during the total solar eclipse 30 June, 1973. Deep Sea Res. Oceanogr. Abstracts 22, 417–423. doi: 10.1016/0011-7471(75)90063-7
Kenaley, C. P. (2008). Diel vertical migration of the loosejaw dragonfishes (Stomiiformes: stomiidae: malacosteinae): a new analysis for rare pelagic taxa. J. Fish Biol. 73, 888–901. doi: 10.1111/j.1095-8649.2008.01983.x
Klevjer, T. A., Irigoien, X., Røstad, A., Fraile-Nuez, E., Benítez-Barrios, V. M., and Kaartvedt, S. (2016). Large scale patterns in vertical distribution and behaviour of mesopelagic scattering layers. Sci. Rep. 6:19873.
Kloser, R. J., Ryan, T., Sakov, P., Williams, A., and Koslow, J. A. (2002). Species identification in deep water using multiple acoustic frequencies. Can. J. Fish. Aquat. Sci. 59, 1065–1077. doi: 10.1139/f02-076
Lampert, W. (1989). The adaptive significance of diel vertical migration of zooplankton. Funct. Ecol. 3, 21–27. doi: 10.2307/2389671
Lampert, W. (1993). Ultimate causes of diel vertical migration of zooplankton: new evidence for the predator-avoidance hypothesis. Diel Vertical Migration of Zooplankton 79–88.
Legendre, L., and Michaud, J. (1999). Chlorophyll a to estimate the particulate organic carbon available as food to large zooplankton in the euphotic zone of oceans. J. Plankton Res. 21, 2067–2083. doi: 10.1093/plankt/21.11.2067
Loeb, V. J., and Nichols, J. A. (1984). Vertical distribution and composition of ichthyoplankton and invertebrate zooplankton assemblages in the eastern tropical Pacific. Biol. Pesq. 13, 39–66.
Longhurst, A. R., Bedo, A. W., Harrison, W. G., Head, E. J. H., and Sameoto, D. D. (1990). Vertical flux of respiratory carbon by oceanic diel migrant biota. Deep Sea Res. Part A. Oceanogr. Res. Pap. 37, 685–694. doi: 10.1016/0198-0149(90)90098-g
Lukacs, P. M., Burnham, K. P., and Anderson, D. R. (2010). Model selection bias and Freedman’s paradox. Ann. Inst. Stat. Math. 62:117. doi: 10.1007/s10463-009-0234-4
Maas, A. E., Frazar, S. L., Outram, D. M., Seibel, B. A., and Wishner, K. F. (2014). Fine-scale vertical distribution of macroplankton and micronekton in the Eastern Tropical North Pacific in association with an oxygen minimum zone. J. Plankton Res. 36, 1557–1575. doi: 10.1093/plankt/fbu077
Maynard, S. D., Riggs, F. V., and Walters, J. F. (1975). Mesopelagic micronekton in Hawaiian waters: faunal composition, standing stock, and diel vertical migration. Fish. Bull. 73, 726–736.
Mizobata, K., Saitoh, S. I., Shiomoto, A., Miyamura, T., Shiga, N., Imai, K., et al. (2002). Bering Sea cyclonic and anticyclonic eddies observed during summer 2000 and 2001. Prog. Oceanogr. 55, 65–75. doi: 10.1016/s0079-6611(02)00070-8
Netburn, A. N., and Koslow, J. A. (2015). Dissolved oxygen as a constraint on daytime deep scattering layer depth in the southern California current ecosystem. Deep Sea Res. Part I Oceanogr. Res. Pap. 104, 149–158. doi: 10.1016/j.dsr.2015.06.006
Phleger, C. F. (1998). Buoyancy in marine fishes: direct and indirect role of lipids. Am. Zool. 38, 321–330. doi: 10.1093/icb/38.2.321
Proud, R., Cox, M. J., and Brierley, A. S. (2017). Biogeography of the global ocean’s mesopelagic zone. Curr. Biol. 27, 113–119. doi: 10.1016/j.cub.2016.11.003
Proud, R., Cox, M. J., Le Guen, C., and Brierley, A. S. (2018). Fine-scale depth structure of pelagic communities throughout the global ocean based on acoustic sound scattering layers. Mar. Ecol. Prog. Ser. 598, 35–48. doi: 10.3354/meps12612
Proud, R., Handegard, N. O., Kloser, R. J., Cox, M. J., Brierley, A. S., and Demer, D. (2019). From siphonophores to deep scattering layers: uncertainty ranges for the estimation of global mesopelagic fish biomass. ICES J. Mar. Sci. 76, 718–733.
Python Core Team (2020). Python: A dynamic, Open Source Programming Language. Available online at∗: https://www.python.org/
R Core Team. (2020). R: A Language and Environment for Statistical Computing. Available online at∗: https://www.r-project.org/
Sameoto, D. D. (1986). Influence of the biological and physical environment on the vertical distribution of mesozooplankton and micronekton in the eastern tropical Pacific. Mar. Biol. 93, 263–279. doi: 10.1007/bf00508264
Seibel, B. A. (2011). Critical oxygen levels and metabolic suppression in oceanic oxygen minimum zones. J. Exp. Biol. 214, 326–336. doi: 10.1242/jeb.049171
Seibel, B. A., Schneider, J. L., Kaartvedt, S., Wishner, K. F., and Daly, K. L. (2016). Hypoxia tolerance and metabolic suppression in oxygen minimum zone euphausiids: implications for ocean deoxygenation and biogeochemical cycles. Integr. Comp. Biol. 56, 510–523. doi: 10.1093/icb/icw091
Simmonds, J., and MacLennan, D. N. (2008). Fisheries Acoustics: Theory and Practice. Hoboken, NJ: John Wiley & Sons.
Sutton, T. T., Clark, M. R., Dunn, D. C., Halpin, P. N., Rogers, A. D., Guinotte, J., et al. (2017). A global biogeographic classification of the mesopelagic zone. Deep. Res. Part I Oceanogr. Res. Pap. 126, 85–102. doi: 10.1016/j.dsr.2017.05.006
Sutton, T. T., Wiebe, P. H., Madin, L., and Bucklin, A. (2010). Diversity and community structure of pelagic fishes to 5000 m depth in the Sargasso Sea. Deep Sea Res. Part II Top. Stud. Oceanogr. 57, 2220–2233. doi: 10.1016/j.dsr2.2010.09.024
Urmy, S. S., and Horne, J. K. (2016). Multi-scale responses of scattering layers to environmental variability in Monterey Bay, California. Deep Sea Res. Part I Oceanogr. Res. Pap. 113, 22–32. doi: 10.1016/j.dsr.2016.04.004
Urmy, S. S., Horne, J. K., and Barbee, D. H. (2012). Measuring the vertical distributional variability of pelagic fauna in Monterey Bay. ICES J. Mar. Sci. 69, 184–196. doi: 10.1093/icesjms/fsr205
Webb, T. J., Berghe, E. V., and O’Dor, R. (2010). Biodiversity’s big wet secret: the global distribution of marine biological records reveals chronic under-exploration of the deep pelagic ocean. PLoS One 5:e10223. doi: 10.1371/journal.pone.0010223
Wedding, L. M., Friedlander, A. M., Kittinger, J. N., Watling, L., Gaines, S. D., Bennett, M., et al. (2013). From principles to practice: a spatial approach to systematic conservation planning in the deep sea. Proc. R. Soc. London B Biol. Sci. 280:20131684. doi: 10.1098/rspb.2013.1684
Wedding, L. M., Reiter, S. M., Smith, C. R., Gjerde, K. M., Kittinger, J. N., Friedlander, A. M., et al. (2015). Managing mining of the deep seabed. Science (80-.). 349, 144–145.
Wishner, K. F., Outram, D. M., Seibel, B. A., Daly, K. L., and Williams, R. L. (2013). Zooplankton in the eastern tropical north Pacific: boundary effects of oxygen minimum zone expansion. Deep Sea Res. Part I Oceanogr. Res. Pap. 79, 122–140. doi: 10.1016/j.dsr.2013.05.012
Wishner, K. F., Seibel, B. A., Roman, C., Deutsch, C., Outram, D., Shaw, C. T., et al. (2018). Ocean deoxygenation and zooplankton: very small oxygen differences matter. Sci. Adv. 4:eaau5180. doi: 10.1126/sciadv.aau5180
Yentsch, C. S., and Phinney, D. A. (1989). A bridge between ocean optics and microbial ecology. Limnol. Oceanogr. 34, 1694–1705. doi: 10.4319/lo.1989.34.8.1694
Keywords: Clarion-Clipperton Zone, deep-sea mining, mesopelagic, scattering layers, micronekton, oxygen minimum zone
Citation: Perelman JN, Firing E, van der Grient JMA, Jones BA and Drazen JC (2021) Mesopelagic Scattering Layer Behaviors Across the Clarion-Clipperton Zone: Implications for Deep-Sea Mining. Front. Mar. Sci. 8:632764. doi: 10.3389/fmars.2021.632764
Received: 24 November 2020; Accepted: 12 April 2021;
Published: 10 May 2021.
Edited by:
Kerry Howell, University of Plymouth, United KingdomReviewed by:
Michael Vecchione, National Oceanic and Atmospheric Administration (NOAA), United StatesCopyright © 2021 Perelman, Firing, van der Grient, Jones and Drazen. This is an open-access article distributed under the terms of the Creative Commons Attribution License (CC BY). The use, distribution or reproduction in other forums is permitted, provided the original author(s) and the copyright owner(s) are credited and that the original publication in this journal is cited, in accordance with accepted academic practice. No use, distribution or reproduction is permitted which does not comply with these terms.
*Correspondence: Jessica N. Perelman, am5wZXJlbG1AaGF3YWlpLmVkdQ==
Disclaimer: All claims expressed in this article are solely those of the authors and do not necessarily represent those of their affiliated organizations, or those of the publisher, the editors and the reviewers. Any product that may be evaluated in this article or claim that may be made by its manufacturer is not guaranteed or endorsed by the publisher.
Research integrity at Frontiers
Learn more about the work of our research integrity team to safeguard the quality of each article we publish.