 Jian Su
 Elin Andrée
 Jacob W. Nielsen
 Steffen M. Olsen
 Kristine S. Madsen
94% of researchers rate our articles as excellent or good
Learn more about the work of our research integrity team to safeguard the quality of each article we publish.
Find out more
ORIGINAL RESEARCH article
Front. Mar. Sci. , 12 May 2021
Sec. Coastal Ocean Processes
Volume 8 - 2021 | https://doi.org/10.3389/fmars.2021.629470
This article is part of the Research Topic Climate Services for Adaptation to Sea-Level Rise View all 17 articles
Denmark has a long, complex coastline, connecting the North Sea in the west to the semi-enclosed Baltic Sea in the east, via the Skagerrak-Kattegat Seas. Historical sea level records indicate that relative sea level (RSL) has been increasing along the Danish North Sea coast, south of Skagerrak, following the global mean sea level (GMSL) rise. In the central Skagerrak-Kattegat Seas, RSL rise has been practically absent, due to the GMSL rise being off-set by the Fennoscandian post-glacial land-uplift. The new IPCC Special Report on the Ocean and Cryosphere in a Changing Climate (SROCC) reported that under RCP8.5 GMSL will increase more than the previous estimates in the IPCC Fifth Assessment Report (AR5) at the end of twenty-first century due to Antarctic ice sheet dynamics. We performed a regionalization of the SROCC sea level projections for the “Danish Climate Atlas” dataset, a nation-wide climate adaptation dataset based on IPCC and various national and international databases. In these complementary datasets, important local data have been considered, which have not been included in the IPCC SROCC GMSL rise estimates, i.e., more precise national-wide land-rise prediction and sets of sea level fingerprints. Our results indicate that sea level projections under RCP8.5 results in a > 40 cm RSL rise at the end of the twenty-first century in the Skagerrak-Kattegat Seas, which might call for a new adaptation strategy in this region. The rate of mean sea level rise will exceed the rate of the land-rise earlier than the previous estimates by AR5 under the RCP8.5 scenario. In particular, we stress how these new estimates will affect future extreme sea levels in this region. Based on our results, we suggest this more recent GMSL projection needs to be considered in coastal risk assessments in the Skagerrak-Kattegat Seas also in this century.
Adapting to climate change, especially to sea level rise (SLR), in the coastal region is an ongoing challenge for policy-makers now and into the future (Moser and Ekstrom, 2010). Policy-makers are struggling to keep on-top of fast growing, up-to-date scientific data, such as global mean sea level (GMSL) projections from global climate models (Slangen et al., 2017), new land topography and elevation data (key to translate SLR into potential exposure of population, Kulp and Strauss, 2019; Ludwigsen et al., 2020), new economic assessments of coastal flooding damage (Jevrejeva et al., 2018; Prahl et al., 2018; Vousdoukas et al., 2018a), and information on extreme sea level (Woodworth et al., 2016). The concept of “climate service”, aiming to provide science-based information and advice for local adaptation decisions, was established to facilitate decision-making on climate mitigation and adaptation strategies (Hewitt et al., 2012; Swart et al., 2017; Hinkel et al., 2019). A variety of organizations currently develop and deliver climate services, including private consultancies, non-governmental organizations, universities, and government agencies (Gregory et al., 2019). On a national level, the Danish Climate Atlas project was designed to provide climate service by establishing a go-to platform for climate information, based on the production of a consistent, nation-wide and easily accessible data set, which is maintained and regularly updated.
Denmark is a low-lying country with a coastline totalling more than 7,000 km. The coastline extends from the North Sea to the Baltic Sea, where the islands constituting the Danish Straits forms part of the reason for the restricted oceanic influence on the Baltic Sea (Figure 1). Denmark has implemented national level requirements for municipalities to develop climate adaptation plans (Sørensen et al., 2016), while such efforts remain voluntary for many other EU countries (Keskitalo et al., 2016). Pioneering projects assessing the users' needs for sea level rise information within the Copernicus Climate Change Service framework, further accentuates that it is of vital importance for coastal planning and adaptation purposes that reliable and robust, up-to-date information on SLR, and the impacts of extreme sea level events, are updated regularly (1–5 years, Madsen et al., 2019b; Muis et al., 2020).
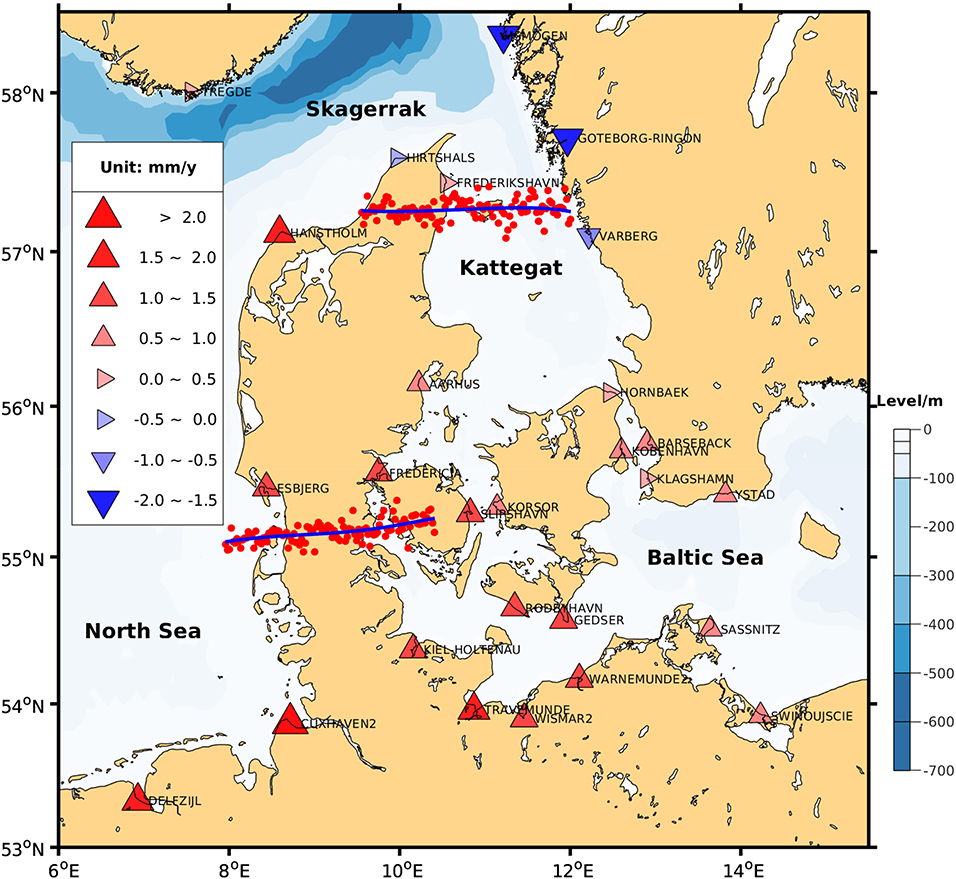
Figure 1. Background shaded color: bathymetry (m) of the study area, the North Sea–Baltic Sea transition zone. Top symbols: relative sea level rise trends—the change rate (mm y−1) of the long-term sea level (> 60 years) derived from monthly mean values of sea level records at tidal gauge stations in the PSMSL data set (Permanent Service for Mean Sea Level, 2020). The blue downwards and red upwards triangles indicate a decrease or increase of sea level, respectively. The rightwards arrow refers to small change rates of the sea level. For the methods to calculate the relative sea level rise trends, please refer to https://www.psmsl.org/products/trends/methods.php. Two sea level time series at Esbjerg and Frederikshavn stations are illustrated, original yearly data in red dots and blue lines are trends with polynomial fit to the original data.
The Danish North Sea coasts are highly exposed to the large sea level variability of the North Sea, and therefore has a long coastal protection history, e.g., the Danish Wadden Sea Dikes (Sørensen, 2016). In this region, the observed relative sea level (RSL) rise has followed the GMSL rise (upwards triangles at the western coast of Denmark in Figure 1 with an example of sea level time series in Esbjerg, Holgate et al., 2013; Wahl et al., 2013). On the east coast of the Jutland Peninsula (Skagerrak-Kattegat Seas in Figure 1), GMSL rise has had less of an impact on the RSL (Figure 1 rightwards arrows with an example of sea level time series in Frederikshavn). Usually, RSL rise rate between −0.5 and 0.5 mm y−1 is considered as an area absent of SLR, i.e., a neutral SLR zone (the rightwards arrows in Figure 1). For example, the Danish capital Copenhagen, located in the inner Danish waters (even south of this neutral SLR zone) is generally considered not highly vulnerable to SLR (Hallegatte et al., 2011).
The major cause of the absence of RSL rise in the Skagerrak-Kattegat Seas is the cancelation between the GMSL rise and glacial isostatic adjustment (GIA, Hieronymus and Kalén, 2020). The whole northern tip of the Jutland Peninsula is a post-glacial, rising sea floor (Møller, 1997). Since GIA dominates the RSL change in the past century, detailed spatial GIA information is crucial for accurate, future estimates of RSL around Denmark (Madsen et al., 2019a). However, the GIA information used in the IPCC reports often has a coarse resolution or is not fully resolved in the global SLR estimates for our study area (Kopp et al., 2014; Jevrejeva et al., 2018). Recent developments in the land uplift modeling provided a detailed map for the study area (Spada, 2017; Vestøl et al., 2019). In addition, all the references mentioned above regarding the inner Danish waters, acknowledged that the local climate adaptation strategy might change as the extreme sea level (ESL) rise caused by GMSL rise may cause more economic loss in the region due to the absence of climate protection plans. Thus, detailed information on future climate change for climate adaptation strategy is highly desired.
Information on climate change is assessed by the Intergovernmental Panel on Climate Change (IPCC). In 2013, IPCC released their 5th assessment report (AR5), giving best estimates and likely ranges of sea level change on global and regional scales (Church J. et al., 2013). Based on this data, mean SLR has been estimated for Denmark as a whole (Olesen et al., 2014), however that report did not address the spatial inhomogeneities for individual municipalities, which means that a systematic understanding of SLR on regional to local scales for Danish coastlines is still lacking. In 2019, IPCC released a Special Report on the Ocean and Cryosphere in a Changing Climate (SROCC) (Oppenheimer et al., 2019). The new SROCC report updated two important aspects of sea level: climate change induced GMSL rise and ESL rise.
There are clear links between rising temperature and GMSL rise. Globally, SLR over the last centuries is well documented, including acceleration after the nineteenth century (Church J. A. et al., 2013; Bamber et al., 2018). Over the last two centuries, estimated SLR mostly relies on coastal tide-gauge measurements. The average estimate is 1.4 mm yr−1 for the period 1901–1990 based on two recent reconstructions by Hay et al. (2015) and Dangendorf et al. (2017). High precision satellite altimetry started in October 1992, providing altimetry-based ocean wide estimates of SLR. Average global SLR increased to 3.2 mm yr−1 over the period 1993–2015 (Watson et al., 2015; Nerem et al., 2018), reflecting an acceleration in recent decades. Observed and projected SLR has two major components, thermal expansion (increase in the volume of ocean water caused by additional heat uptake) and melt water input to the ocean from retreating land-ice (glaciers and ice-sheets). Other contributions include for example changes in land water storage. The thermal expansion effect is included in AR5 CMIP (Coupled Model Intercomparison Project) models. The melt water input from ice sheet is presently not included in the global climate models assessed in SROCC and AR5, but is added to the GMSL signal afterwards (Slangen et al., 2017). In the SROCC report, it is clear that Antarctica is a major joker in the estimation of future SLR, which has a positive net contribution on GMSL rise (Yu et al., 2018; Golledge et al., 2019). Therefore, a reliable sea level fingerprint of Antarctic ice-sheet collapse is essential to local estimation of SLR (Mitrovica et al., 2009; Kopp et al., 2014).
One of the main consequences of GMSL rise is an increase in the intensity and frequency of coastal ESL (Wahl et al., 2017). Many studies conclude that trends in future changes in storminess have large uncertainties which challenge the assessments of ESL (Marcos et al., 2015; Muis et al., 2016; Vousdoukas et al., 2018b; Kirezci et al., 2020). For the Danish coasts, even the ESL reanalysis based on observations has a very large uncertainty, attributed to the complexity of the coastlines (Calafat and Marcos, 2020). On top, RSL rise adds another dimension of uncertainty, leading to the estimates of recurrence high water level being non-stationary (Masina and Lamberti, 2013; Ghanbari et al., 2019). Despite the uncertainties, estimates of recurrence periods for extreme high waters is of critical interest to risk managers (Woodworth, 2006; Hinkel et al., 2014; Sørensen et al., 2016; Woodworth et al., 2016; Wahl et al., 2017). In this paper we quantify the impact of SLR projections under different scenarios in SROCC on the frequency of extreme high water levels. In particular, we discuss the possible future research advances that could affect the current state-of-the-art estimates of both future mean and extreme sea levels.
The IPCC SROCC used the same quantification of the contributors to SLR as in the predecessor IPCC AR5, except for the Antarctic ice-sheet dynamics. IPCC AR5 only estimated the Antarctic ice sheet dynamics' contribution as a linear extrapolation of the observed ice discharge (Little et al., 2013), while IPCC SROCC projected the SLR projections based on some process-based numerical ice sheet models (detailed discussion see section 4, Shepherd et al., 2018). Therefore, SROCC results are very similar to the AR5 in 2100 except for the high emission scenario (RCP8.5), for which the contribution of Antarctica is tripled from a median of 4–12 cm. Finally, the SROCC estimate of GMSL rise is around 10 cm higher, with a median of 84 cm and a likely range (17–83rd percentile) of 61–110 cm (Figure 2C).
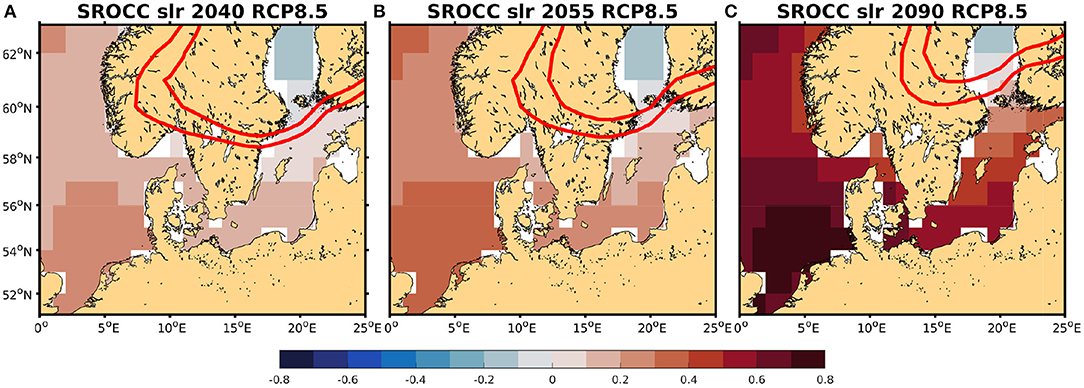
Figure 2. Regional sea level rise (m, median value) in 2040 (A), 2055 (B), and 2090 (C) in IPCC SROCC for IPCC RCP 8.5 scenario. The position of near-neutral sea level rise zone are indicated by −0.5 mm y−1 (north red line) and 0.5 mm y−1 (south red line) lines. Data are from Oppenheimer et al. (2019).
The contribution of GIA to the RSL can be of the same magnitude as climate change induced GMSL in regions like Scandinavia (Kierulf et al., 2014) or North America (Sella et al., 2007). It is the primary source of spatial inhomogeneities in SLR for Denmark (Madsen et al., 2019a). To obtain a spatial map of the land uplift, a land uplift model is an obvious solution. The dataset in this study is assessed by DTU Space (National Space Institute, Technical University of Denmark) to provide the regional/local land rise in Denmark (Personal communication, Per Knudsen, DTU Space, 2016). This dataset is based on classic geodetic data for a 100 years period (1900–2000) combined with Global Navigation Satellite System (GNSS) data from varying time periods. As a final step, the spatial land-uplift data was interpolated to the stations representing each of the coastal stretches (Figure 3, red squares).
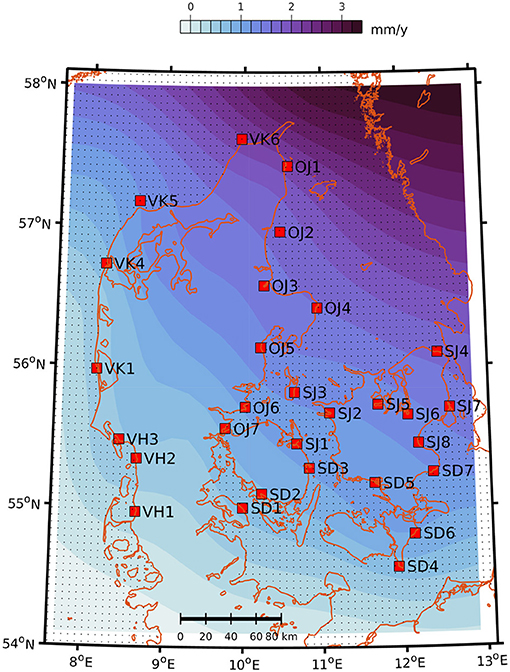
Figure 3. Regional/local land rise (mm y−1) in Denmark (Personal communication, Per Knudsen, DTU Space, 2016). The data is calculated based on land observations, and the ocean data is extrapolated (shaded with dots). Overall, all of Denmark is rising due to glacial isostatic land rise in Scandinavia after the last ice age. The land rise of northern Denmark is about 2 mm per year, decreasing toward south and west, to zero just south of the Danish-German border. We extracted the data at the stations (red squares) to represent the coastal stretches. The name lists of the stations and coastal stretches are in Table 1.
Sea level change is not evenly distributed around the globe. Changes in the Earth's gravity field and elastic deformation of the solid Earth give rise to spatial differences in the sea level rise pattern (Mitrovica and Milne, 2003). For example, near the Antarctic ice-sheet, reduced gravitational attraction from ice-sheet mass loss between the ice and the nearby ocean causes sea level to fall, despite a contribution to global sea level rise (Mitrovica et al., 2011). In the Climate Atlas project, we adopted the factor of 1.1 for the sea level signal from the Antarctic ice sheet for the whole Denmark, following the sea level fingerprint from Mitrovica et al. (2009) and the new work from Mitrovica et al. (2018).
In this section, we summarize the steps carried out to obtain the local sea level rise values. The localizing methodology follows the previous work in Olesen et al. (2014) after IPCC AR5, which has been widely used in the local municipalities for coastal protection planning. The main procedures are as listed below.
(1) Obtain the data for the regions around Denmark, i.e., North and Baltic Seas, from supplement materials in Church J. et al. (2013) and the new input of global SLR from Oppenheimer et al. (2019) (Figure 2). The data from IPCC include the median value (50%) and the likely range (upper 83% and lower 17%).
(2) It is evident that sea level change varies from the Danish North Sea coast to the Danish Baltic coast (Figure 1), and high resolution data are needed to resolve the Inner Danish Straits. After comparing the GIA data in SROCC (map in Figure 2) and better resolution GIA data (Figure 3), we found that the resolution of SROCC data is still not high enough for municipalities to use directly. Therefore, GIA should be deducted from the SROCC data, and we used a simple averaging method to obtain a SLR value for the entire Danish coastline (see next procedure). This way the spatial GIA information is filtered out.
(3) To obtain the sea level change for the entire Danish coastline without spurious effects of averaging, we averaged the values from two points; one point in the southern North Sea (54.5 °N, 4.5 °E) and one point in the southern Baltic Sea (56.6 °N, 18.5 °E). The high resolution GIA data (see section 2.2) is added to this value to obtain the local SLR values. Note that this method may be adjusted in the later release of Climate Atlas project, when the resolution of IPCC regional SLR data is at a satisfactory level for local usage.
(4) Scale to the Climate Atlas reference period. Often the reference periods and future time slices required in the local climate adaptation strategy are different for different purposes. IPCC SLR projections in AR5 and SROCC used the reference period 1986–2005 and 20 year time slices. Today, however, it is not suitable for the municipalities for near-term and long-term future climate adaptation planning anymore, since 20 years is too short for extreme sea level analysis. In the Climate Atlas project, we choose the reference period as 1981–2010 and 30 year time slices, in line with previous studies like Meier et al. (2004). Therefore, projected SLR is scaled to the Climate Atlas reference period according to a quadratic formula. Since the national Danish height system DVR90 is designed to give almost-zero mean sea level in year 1990, just a few years before the center of our reference period, and the measured sea level may have a bias toward high sea level, we used 0 cm, relative to DVR90, as mean sea level for the reference period.
(5) Regional effects. The importance of mean sea level change caused by local ocean dynamics and steric effects has been evaluated by averaging 30 years of sea level data from the operational storm surge model at the Danish Meteorological Institute (DMI)—HBM (Hiromb-Boos Model, Berg and Poulsen, 2012) model simulations for each 30 year period. We found that this contribution at the end of the century (by subtracting the mean sea level values of the reference period from the future periods) varies between −1.5 and −0.4 cm. We therefore considered this change to be well within the uncertainty range, and thus too small to be significant. It has been left out of the further calculations.
(6) The likely range of the IPCC provides lower and upper limits (17 and 83%). Ten and 90 percentiles are calculated from the likely range of IPCC, based on a symmetric normal distribution. For the 10-percentile, this is considered a good approximation. For the 90 percentile, the method should give a lower limit estimation of the true uncertainty because of asymmetric distribution (Grinsted et al., 2015), especially for the RCP8.5 scenario, but the method is chosen because it is robust and well-described.
(7) All values were corrected for regional land rise, to provide the relative sea level signal for different coastal stretches (Table 1). Each coastal stretch is represented by one station, chosen to have the most reliable present day high water statistics for that coastal stretch (Table 1). The definition of coastal stretches is according to the extensive coastal risk management experience from the Danish Coastal Authority (KDI) and their climate adaptation plans (Auken, 2013).
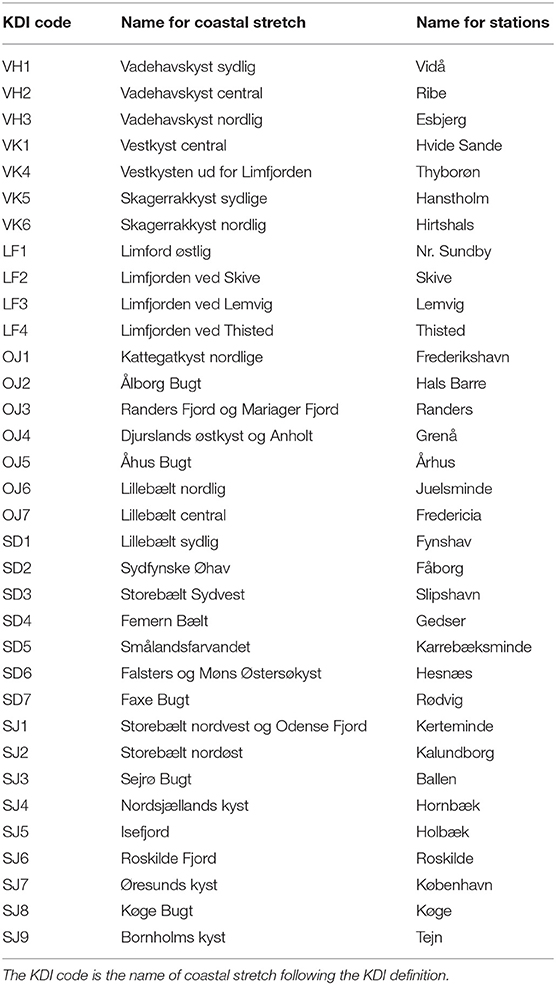
Table 1. The names of the 34 coastal stretches and the observing stations that represent the coastal stretches.
The resolution of SROCC GMSL information is too low to provide reliable information for local communities, e.g. in the Skagerrak-Kattegat Seas and even for the Baltic Sea, as shown in Figure 2. Nevertheless, SROCC estimates still provide the grounds for the quantification of local RSL.
One of the essential questions for SLR in the Skagerrak-Kattegat Seas is whether the location of the neutral SLR zone (defined as RSL rise rate between −0.5 and 0.5 mm y−1) will remain, or else how it will shift in the future. One advantage of exploring the global SROCC SLR dataset is that the position of the neutral SLR zone can be easily depicted. Figure 2 shows a general northwards movement of the neutral SLR zone under RCP8.5 scenario. In the middle of the twenty-first century, the median value of the rate of RSL rise already shows that the Skagerrak-Kattegat Seas are within the positive SLR zone, and it will accelerate in the next half of the twenty-first century.
The land rise of northern Denmark is about 2 mm per year, decreasing toward south and west, to zero just south of the Danish-German border (Figure 3). In the central Skagerrak-Kattegat Seas, the land rise (or sea-bed rise) is more than 2 mm per year. Overall, all of Denmark is rising after the last ice age, which has compensated for global SLR, giving an average RSL decrease in the northern-most part of the country in the twentieth century (Hansen, 2018). However, the rate of GMSL rise will in the coming decades outpace by a factor of two the rate of land rise (Figure 4, bars); under RCP8.5 the GMSL rise in the 2020's will reach 5 mm y−1, and close to 10 mm y−1 around 2060. Figure 4 shows time series for the different locations along the Danish coasts under RCP8.5 based on the IPCC SROCC dataset. The colors indicate location, and changes from dark red for the North Sea coast to dark blue for the Baltic coasts. It is apparent that locations with light colors, in the Skagerrak-Kattegat Seas (see named two stations in Figure 4), show slower SLR, especially in the first half of this century. In the next half of the twenty-first century, on the other hand, SLR will accelerate. By the end of the century, the sea level in the Skagerrak-Kattegat Seas already reaches 60–70 cm higher than the reference period.
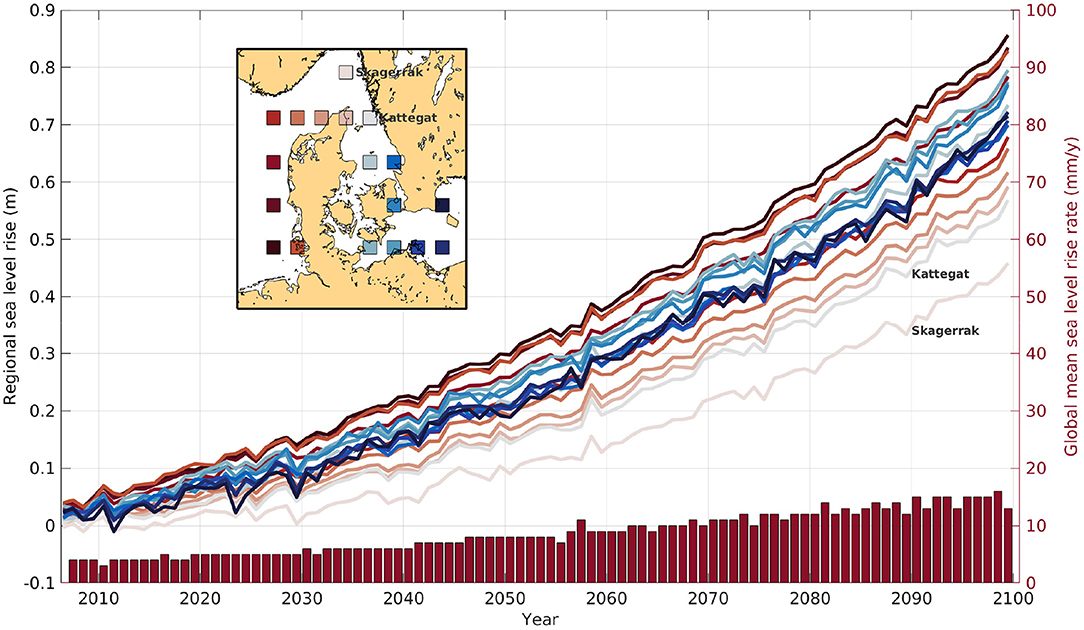
Figure 4. Lines: time series of regional sea level rise projection (m, median value, 2006–2100) for RCP8.5 scenario at different areas around Denmark according to IPCC SROCC on the left y-axis. The locations corresponding to each of the time series are indicated by different colors in the map. The locations in Skagerrak and Kattegat with the slowest increasing trends are denoted Skagerrak and Kattegat, respectively, both in the map and time series lines. Bars: the global mean sea level rise rate (mm y−1) on the right y axis. Data are from SROCC-Ch4ArticleSM.
The coastal climate adaptation plan in Denmark is the responsibility of each municipality. Individual municipalities assess the flood risk in the future according to the vulnerability, RSL and ESL rise along their coastal stretches (Sørensen et al., 2016). RSL rise varies from one coastal stretch to the next, but the variability within one coastal stretch is rather small. Overall, the RSL changes are positive in all regions (Figure 5), with higher values toward south and west, where the compensation from land rise is smaller. Except for this, the major challenge for municipalities is which scenario to consider in the future. For example, the median value for mean SLR in the end of this century is much higher under the RCP8.5 scenario (~ 44 cm) than the RCP4.5 scenario (~ 23 cm) along the Skagerrak-Kattegat coasts. This implies that the choice of scenarios play a major part in what adaptation strategies might be deemed appropriate—possibly with very different climate adaptations plans as outcome.
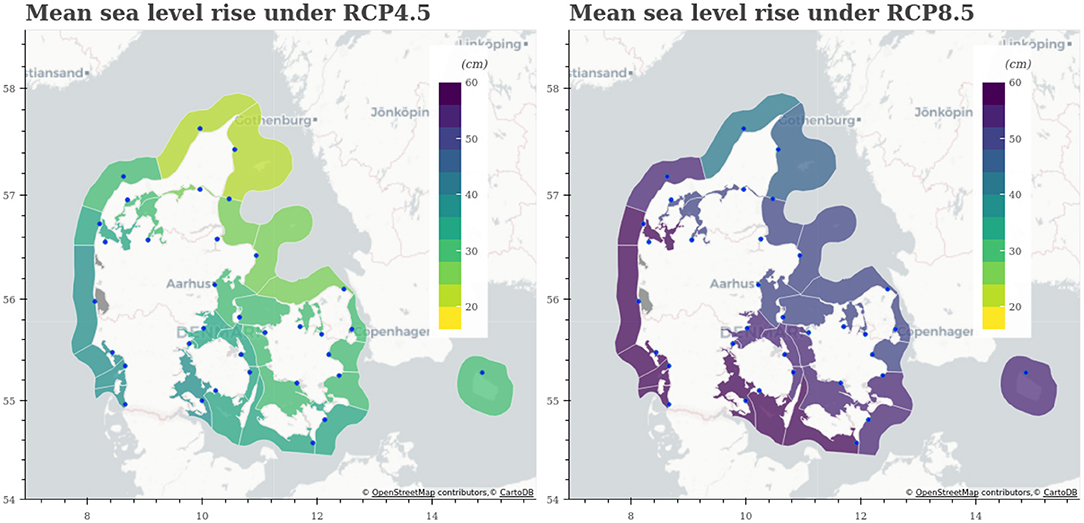
Figure 5. Regional sea level rise (cm) in different coastal stretches for RCP4.5 (left) and RCP8.5 (right) scenarios in 2070–2100, relative to 1980–2010. The value at each stretch is calculated based on a representative tidal gauge station (blue dots). The name lists of the stations and coastal stretches are in Table 1.
The uncertainty of the future RSL rise (figures not shown, but can be easily visualized online at https://www.dmi.dk/klimaatlas/) is of course very large, and has quite different sources (see the discussion of SROCC SLR uncertainty in Hieronymus and Kalén, 2020).
The present consensus on particularly the higher percentiles (95 percentile and above) is that they cannot be constructed meaningfully by statistical analysis of data from the existing climate model ensembles (Jevrejeva et al., 2016). This is in part due to the lack of interactive glacier and ice sheet modules in the applied climate models, and partly due to a limited physical understanding of the processes that have been suggested to lead to instabilities in the Antarctic Ice sheet as ocean and atmospheric temperatures increase (DeConto and Pollard, 2016; Bamber et al., 2019). After consultations with Danish experts, the expert elicitation of Bamber et al. (2019) is chosen as the basis for a 95 percentile estimate. This expert judgement concludes that for a five degree warming there is a 5% risk that global mean sea-level will exceed 2.4 m in the year 2100, where 1.8 m is directly linked to ice sheet melting. We use 2.4 m directly as the best estimate available for the 95 percentile for RCP8.5 2071–2100 period. As GMSL rise is both one of the most certain (the sea level will rise) and uncertain (with regards to the magnitude of the sea level rise) components of climate change, and subject to intense investigations, it can be expected that these numbers will be updated in future versions of the Climate Atlas.
In Denmark, water levels which exceed the 20-year return level are defined as storm surges by the Danish Storm Council. A return level is often used in statistics for coastal engineering purposes to describe the level the water reaches on average once in a return period. There is a large variation of local 20-year return levels, due to e.g., variable tidal range and wind conditions between different locations. Here we examine the return level change at 5 tide gauge locations in the Skagerrak-Kattegat Seas. Figure 6 shows a typical statistical graph to describe storm surge statistics with the return level on y-axis as function of the return period on x-axis.
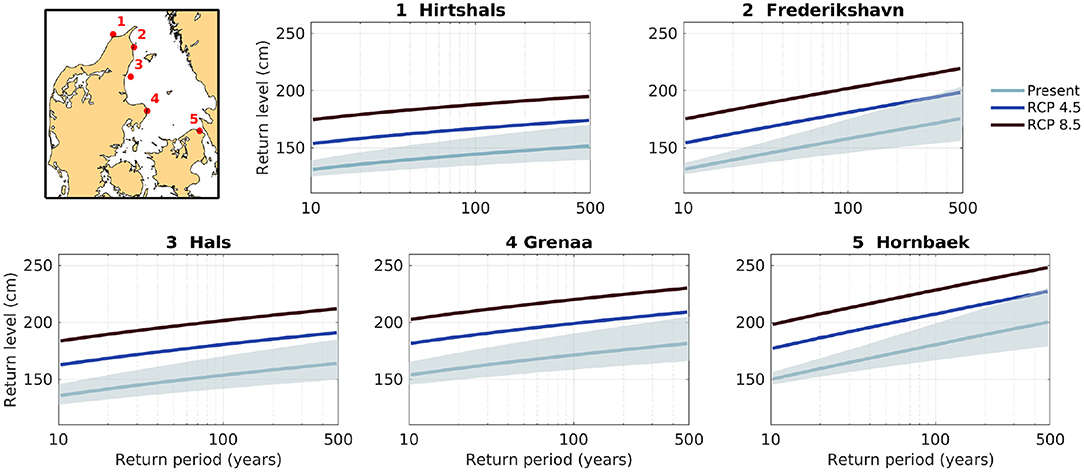
Figure 6. The expected extreme sea level (ESL, cm) with the corresponding return period at x-axis at 5 tide gauge locations in Skagerrak-Kattegat (location in upper-left panel) in present and future conditions (in 2070–2100) under RCP4.5 (light blue lines) and RCP8.5 (red lines) scenarios. The mean sea levels added to the present day statistics are different values (in Figure 5) at 5 tide gauge locations. The gray lines are based on tide gauge observations, and the gray bands refer to the 5–95% uncertainty range in the fit of the extreme value distribution to observations from Ditlevsen et al. (2019).
The present day storm surge statistics used for the reference period in the Climate Atlas are from the authoritative statistics, which is provided by KDI (Figure 6, gray lines and uncertainty). KDI update the authoritative statistics reports approximately every 5 years, with the latest one published in 2018 and revised in 2019 (Ditlevsen et al., 2019). The storm surge statistics are based on measured water levels at tide gauge stations along the Danish coasts with a sufficiently long time-series. The statistics report published in 2018, which is used for the Climate Atlas, includes measurements until the beginning of 2017. For individual stations, different statistical models (Weibull or Log-normal distribution) are applied, giving an assessment of how frequently extreme water levels are to be expected.
There is no doubt that adding the mean SLR (different SLR values at 5 locations in Figure 5) to the present day return level curve already provides us with a quite different image for what can be considered as an extreme event at the end of this century (Figure 6, blue and red curves). This combined presentation of present and future scenarios return level graphs can help to interpret the “amplification factor,” referring to the multiplication factor by which the frequency of flooding of a given height increases (Buchanan et al., 2017). For example, in Frederikshavn, a 500 year storm surge event will become a 10 year event under the RCP8.5 only because of the mean SLR. In Kattegat, a 100 year storm surge event will become an annual event at the end of this century only under RCP8.5 scenario.
The Danish Climate Atlas is not only a dataset, but also a climate information platform, since the municipalities can also obtain our interpretation of the data. Main concerns that users should be aware of when using output from the regionalized dataset presented in this study are summarized in the following.
• Ocean dynamics on local scale.
SLR varies from region to region. SROCC noted that regional changes in sea level associated with water temperature and salinity variations can be quite significant. The CMIP Phase 6 (CMIP6) will become available soon to assess the contribution of the regional ocean dynamics contribution to the SLR.
Regional ocean dynamics have a sea level signal associated (Bilbao et al., 2015). For instance, a change in the average local wind patterns on time scales up to some days are accountable for occasional strong sea level changes in the inner Danish waters lasting for up to a month, hence contributing to seasonal but also interannual variability of the Baltic Sea mean sea level (Mohrholz, 2018). The dynamic effects are included in ocean models of climate change and impacts depending on the scales resolved. Regional steric effects occur if the climate change signal of salinity or temperature is amplified. Studies of these effects are conducted by the author team with a fine scale regional ocean model (see section 2.4, item 5).
• Land-uplift in the future.
GIA is one of the known phenomena resulting in vertical land motion at decadal to millennia timescales. However, we can not neglect that many other natural and anthropogenic processes can also invoke vertical land motion at vastly different time scales (e.g., earthquake, groundwater depletion, or dam building), see the detailed discussion in Woodworth (2006) and Woodworth et al. (2019). Such a vertical land motion dataset on meso-scale is still missing.
For the Baltic Sea, the contribution of deceleration of GIA to the acceleration of RSL was rather small, and GIA alone can not fully explain the acceleration of RLS in the past century (Hünicke and Zorita, 2016). We only consider GIA in our local dataset, while factors judged to have a significant influence on SLR in the future will be further updated when they become available, e.g., the component of nonlinear elastic uplift from present-day ice loading (Ludwigsen et al., 2020).
• Connecting mean SLR with ESL rise.
Our ESL results are in line with SROCC that a 100 year storm surge event today will become an annual event for most coasts of the world in the mid of this century. Nevertheless, the milestone will only be reached at the second half of this century in the inner Danish waters. The precise timing of the milestone relies on the emission scenarios and a reliable sea level monitoring framework.
In Denmark, the local sea level has been measured with tide gauges since the end of the nineteenth century. Long records exist at only 8–10 stations, while many locations have a rather short record. This makes the uncertainty of return level estimates highly variable. Moreover, these time series have data gaps and inconsistencies due to e.g., instrument malfunctions or replacements. Reconstruction work of monthly and annual mean sea level from 14 stations with more than 20 years of data was carried out by Madsen et al. (2019a), and available online in Hansen (2018). However, the gap-filling of the historical storm surge events, which in turn affects the high water statistics, is still ongoing work for the author teams.
Changes in physical processes (e.g., tides, wind storms, waves) as well as their respective interactions can cause water level variability to become of an even higher concern in the future. Understanding the combined future impact of these physical processes is a big challenge. This is especially true for the local scales considered in the Climate Atlas. Therefore, a detailed hydrodynamical model has been developed and operated at DMI for operational storm surge modeling (Berg and Poulsen, 2012). This model serves to provide sufficient details and knowledge for the Climate Atlas, where the model is run with atmospheric forcing from climate models, and with the same high level of details in coastline and bathymetry as in the operational model setup. Finally, the ongoing build-up of an ensemble of ocean climate model simulations, based on this operational model, will further provide the Climate Atlas users with the ESL rise information and associated uncertainty estimates they require. A very similar modeling framework has already been established in Sweden for a similar initiative (Dieterich et al., 2019).
• Uncertainty and next centuries.
The real barrier for translating uncertainty estimation to flood risk management is the extant communication challenge, i.e., the communication between scientists developing climate projections and those professional groups who are the recipients for flood risk estimates and warnings (Faulkner et al., 2007). After consultations with relevant stakeholders, the upper limit of the SLR projection by 2100 is of most concerns to them, i.e., the small but significant risk of rapid sea level rise outside the likely estimates which is mirrored in relatively high numbers for the upper percentiles for GMSL (Jevrejeva et al., 2014).
Another uncertainty worth to communicate with the municipalities is that although the IPCC report is based on the publications of a large group of highly recognized researchers, other publications are critical of the IPCC assessments, and present sea level predictions resulting in both lower (Mörner, 2013) and higher (Rahmstorf, 2010) future sea level rise. More transparent essential climate variables data platforms, allowing users to extract past, current, and future climate data by themselves, are key for enabling open and evidence-based climate services (Bojinski et al., 2014). This emphasizes the need for regional climate data platforms such as the Danish Climate Atlas.
Beyond 2100, global sea level rise will continue to increase with high confidence primarily due to continued thermal expansion and loss of ice from both Greenland and Antarctic ice sheets, including contributions from both surface melting and dynamical mass loss. These two critical issues need to be taken into account when looking beyond year 2100.
First, for Antarctica, it is worthwhile to note that intense research on the ice-sheets' mass balance is ongoing, and it is expected that more precise knowledge will become available in the coming years. The dynamical ice loss may include new instabilities such as the so called Marine-Ice-Cliff-Instability (DeConto and Pollard, 2016), but our physical understanding is limited and confidence low for this contribution, as also reported in new studies (Edwards et al., 2019). At present, it is widely acknowledged that there is a small but not negligible risk of large and rapid changes in the ice sheet contributions to GMSL rise especially from the Antarctic ice sheet (DeConto and Pollard, 2016; Bamber et al., 2019), and that SLR will continue for centuries, with a speed that strongly depends on greenhouse gas emissions (Oppenheimer et al., 2019). Therefore, the difference between SROCC and AR5 is larger for longer time scales. SROCC estimates that the likely range of Antarctic mass loss in 2,300 translates into 7–37 cm GMSL rise for RCP2.6 and 60–289 cm for RCP8.5. That is a big change which further emphasizes the importance of mitigation.
For continued increase of global mean temperatures in the range of 1–4oC, consistent with unchecked emissions (RCP8.5 and its Extended Concentration Pathways beyond 2100), the Greenland ice sheet surface mass loss will increase and a complete mass loss is projected as a direct result over the next millennia or more. The exact path depends strongly on the emission scenario and there is medium confidence in the interval for the critical temperatures for irreversible and continued melt.
Since AR5 new knowledge of the Antarctic contribution in particular explains why SROCC estimates are significantly higher. For RCP8.5 in the year 2300 the likely range of global mean sea-level is 2.3–5.4 m. With a large Antarctic contribution, numbers corrected to the Danish Waters will be slightly higher. Considering the large uncertainty this has not been pursued and no attempt is made to describe the regional differences due to land rise, which would generally be a negative local correction. Therefore, areas like the Skagerrak-Kattegat Seas will keep the same accelerating rate as other places in the world. DMI suggests to use the global estimates directly for Denmark, and to be prepared for updates of these multi-century numbers in the next years, as new knowledge appear.
After carefully considering above mentioned limitations of climate data, precise climate projections can go into decisions on spatial climate adaptation plans. In particular, for the study area in this paper, the Skagerrak-Kattegat Seas, the new SROCC projections should be adopted in the decision making plans to replace the previous ones based on AR5, since considerable research has been conducted on the sea-level problem since AR5. As a results of this transition, due to the new information from the SROCC projections, municipalities along the coastal stretches in the Skagerrak-Kattegat Seas may need to reconsider their protection levels against future risk of flooding under RCP8.5 scenario, since a 100 year storm surge event today will become an annual event as we approach the end of this century. More importantly, SLR along the Danish coasts will certainly accelerate beyond 2100 at the same rate as other places in the world.
The datasets presented in this study can be found in online repositories. The datasets for this study can be found in different data formats, like netcdf, excel, maps, and statistics graphs through the link from DMI home webpage https://www.dmi.dk/klimaatlas/.
JS: drafting of the manuscript and analysis and interpretation of data. EA: acquisition of data and analysis and interpretation of data. JN and SO: analysis and interpretation of data. KM: study conception and design and project coordinator. All authors contributed to the article and approved the submitted version.
This research was funded by the Danish State through the Danish Climate Atlas.
The authors declare that the research was conducted in the absence of any commercial or financial relationships that could be construed as a potential conflict of interest.
We would like to acknowledge Per Knudsen for providing the land-uplift data and advice on how to interpret the data.
Auken, I. (2013). Forord. I Klimatilpasningsplaner og Klimalokalplaner Vejledning. Technical report, Miljøministeriet, Naturstyrelsen.
Bamber, J. L., Oppenheimer, M., Kopp, R. E., Aspinall, W. P., and Cooke, R. M. (2019). Ice sheet contributions to future sea-level rise from structured expert judgment. Proc. Natl. Acad. Sci. U.S.A. 116, 11195–11200. doi: 10.1073/pnas.1817205116
Bamber, J. L., Westaway, R. M., Marzeion, B., and Wouters, B. (2018). The land ice contribution to sea level during the satellite era. Environ. Res. Lett. 13:063008. doi: 10.1088/1748-9326/aac2f0
Berg, P., and Poulsen, J. W. (2012). Implementation Details for HBM. Technical Report 12-11, Danish Meteorological Institute.
Bilbao, R. A. F., Gregory, J. M., and Bouttes, N. (2015). Analysis of the regional pattern of sea level change due to ocean dynamics and density change for 1993–2099 in observations and CMIP5 AOGCMs. Clim. Dyn. 45, 2647–2666. doi: 10.1007/s00382-015-2499-z
Bojinski, S., Verstraete, M., Peterson, T. C., Richter, C., Simmons, A., and Zemp, M. (2014). The concept of essential climate variables in support of climate research, applications, and policy. Bull. Am. Meteorol. Soc. 95, 1431–1443. doi: 10.1175/BAMS-D-13-00047.1
Buchanan, M. K., Oppenheimer, M., and Kopp, R. E. (2017). Amplification of flood frequencies with local sea level rise and emerging flood regimes. Environ. Res. Lett. 12:064009. doi: 10.1088/1748-9326/aa6cb3
Calafat, F. M., and Marcos, M. (2020). Probabilistic reanalysis of storm surge extremes in Europe. Proc. Natl. Acad. Sci. U.S.A. 117, 1877–1883. doi: 10.1073/pnas.1913049117
Church, J., Clark, P., Cazenave, A., Gregory, J., Jevrejeva, S., Levermann, A., et al. (2013). Sea Level Change. Climate Change 2013: the Physical Science Basis. Contribution of Working Group I to the Fifth Assessment Report of the Intergovernmental Panel on Climate Change. Cambridge; New York, NY: Cambridge University Press, 1137–1216.
Church, J. A., Clark, P. U., Cazenave, A., Gregory, J. M., Jevrejeva, S., Levermann, A., et al. (2013). Sea-level rise by 2100. Science 342:1445. doi: 10.1126/science.342.6165.1445-a
Dangendorf, S., Marcos, M., Wöppelmann, G., Conrad, C. P., Frederikse, T., and Riva, R. (2017). Reassessment of 20th century global mean sea level rise. Proc. Natl. Acad. Sci. U.S.A. 114, 5946–5951. doi: 10.1073/pnas.1616007114
DeConto, R. M., and Pollard, D. (2016). Contribution of Antarctica to past and future sea-level rise. Nature 531, 591–597. doi: 10.1038/nature17145
Dieterich, C., Gröger, M., Arneborg, L., and Andersson, H. C. (2019). Extreme sea levels in the Baltic Sea under climate change scenarios-Part 1: Model validation and sensitivity. Ocean Sci. 15, 1399–1418. doi: 10.5194/os-15-1399-2019
Ditlevsen, C., Ramos, M., Sørensen, C., Ciocan, U., and Piontkowitz, T. (2019). Højvandsstatistikker 2017. Technical report, Kystdirektoratet.
Edwards, T., Brandon, L., Durand, M. A. G., and Edwards, N. R. (2019). Revisiting Antarctic ice loss due to marine ice-cliff instability. Nature 566, 58–64. doi: 10.1038/s41586-019-0901-4
Faulkner, H., Parker, D., Green, C., and Beven, K. (2007). Developing a translational discourse to communicate uncertainty in flood risk between science and the practitioner. AMBIO 36, 692–704. doi: 10.1579/0044-7447(2007)36[692:DATDTC]2.0.CO;2
Ghanbari, M., Arabi, M., Obeysekera, J., and Sweet, W. (2019). A coherent statistical model for coastal flood frequency analysis under nonstationary sea level conditions. Earth's Fut. 7, 162–177. doi: 10.1029/2018EF001089
Golledge, N. R., Keller, E. D., Gomez, N., Naughten, K. A., Bernales, J., Trusel, L. D., et al. (2019). Global environmental consequences of twenty-first-century ice-sheet melt. Nature 566, 65–72. doi: 10.1038/s41586-019-0889-9
Gregory, J. M., Griffies, S. M., Hughes, C. W., Lowe, J. A., Church, J. A., Fukimori, I., et al. (2019). Concepts and terminology for sea level: mean, variability and change, both local and global. Surv. Geophys. 40, 1251–1289. doi: 10.1007/s10712-019-09525-z
Grinsted, A., Jevrejeva, S., Riva, R., and Dahl-Jensen, D. (2015). Sea level rise projections for northern Europe under RCP8.5. Clim. Res. 64, 15–23. doi: 10.3354/cr01309
Hallegatte, S., Ranger, N., Mestre, O., Dumas, P., Corfee-Morlot, J., Herweijer, C., et al. (2011). Assessing climate change impacts, sea level rise and storm surge risk in port cities: a case study on Copenhagen. Clim. Change 104, 113–137. doi: 10.1007/s10584-010-9978-3
Hansen, L. (2018). Sea Level Data 1889-2017 From 14 Stations in Denmark Mean, Maximum and Minimum Values Calculated on Monthly and Yearly Basis Including Plots of Mean Values. Technical Report 18-16, Danish Meteorological Institute.
Hay, C. C., Morrow, E., Kopp, R. E., and Mitrovica, J. X. (2015). Probabilistic reanalysis of twentieth-century sea-level rise. Nature 517:481. doi: 10.1038/nature14093
Hewitt, C., Mason, S., and Walland, D. (2012). The global framework for climate services. Nat. Clim. Change 2, 831–832. doi: 10.1038/nclimate1745
Hieronymus, M., and Kalén, O. (2020). Sea-level rise projections for Sweden based on the new IPCC special report: the ocean and cryosphere in a changing climate. Ambio 49, 1587–1600. doi: 10.1007/s13280-019-01313-8
Hinkel, J., Church, J. A., Gregory, J. M., Lambert, E., Le Cozannet, G., Lowe, J., et al. (2019). Meeting user needs for sea level rise information: a decision analysis perspective. Earth's Fut. 7, 320–337. doi: 10.1029/2018EF001071
Hinkel, J., Lincke, D., Vafeidis, A. T., Perrette, M., Nicholls, R. J., Tol, R. S. J., et al. (2014). Coastal flood damage and adaptation costs under 21st century sea-level rise. Proc. Natl. Acad. Sci. U.S.A. 111, 3292–3297. doi: 10.1073/pnas.1222469111
Holgate, S. J., Matthews, A., Woodworth, P. L., Rickards, L. J., Tamisiea, M. E., Bradshaw, E., et al. (2013). New data systems and products at the permanent service for mean sea level. J. Coast. Res. 29, 493–504. doi: 10.2112/JCOASTRES-D-12-00175.1
Hünicke, B., and Zorita, E. (2016). Statistical analysis of the acceleration of Baltic mean sea-level rise, 1900–2012. Front. Mar. Sci. 3:125. doi: 10.3389/fmars.2016.00125
Jevrejeva, S., Grinsted, A., and Moore, J. C. (2014). Upper limit for sea level projections by 2100. Environ. Res. Lett. 9:104008. doi: 10.1088/1748-9326/9/10/104008
Jevrejeva, S., Jackson, L. P., Grinsted, A., Lincke, D., and Marzeion, B. (2018). Flood damage costs under the sea level rise with warming of 1.5 °C and 2 °C. Environ. Res. Lett. 13:074014. doi: 10.1088/1748-9326/aacc76
Jevrejeva, S., Jackson, L. P., Riva, R. E. M., Grinsted, A., and Moore, J. C. (2016). Coastal sea level rise with warming above 2 °C. Proc. Natl. Acad. Sci. U.S.A. 113, 13342–13347. doi: 10.1073/pnas.1605312113
Keskitalo, E. C. H., Juhola, S., Baron, N., Fyhn, H., and Klein, J. (2016). Implementing local climate change adaptation and mitigation actions: the role of various policy instruments in a multi-level governance context. Climate 4:7. doi: 10.3390/cli4010007
Kierulf, H. P., Steffen, H., Simpson, M. J. R., Lidberg, M., Wu, P., and Wang, H. (2014). A GPS velocity field for Fennoscandia and a consistent comparison to glacial isostatic adjustment models. J. Geophys. Res. 119, 6613–6629. doi: 10.1002/2013JB010889
Kirezci, E., Young, I. R., Ranasinghe, R., Muis, S., Nicholls, R. J., Lincke, D., et al. (2020). Projections of global-scale extreme sea levels and resulting episodic coastal flooding over the 21st Century. Sci. Rep. 10:11629. doi: 10.1038/s41598-020-67736-6
Kopp, R. E., Horton, R. M., Little, C. M., Mitrovica, J. X., Oppenheimer, M., Rasmussen, D. J., et al. (2014). Probabilistic 21st and 22nd century sea-level projections at a global network of tide-gauge sites. Earth's Fut. 2, 383–406. doi: 10.1002/2014EF000239
Kulp, S. A., and Strauss, B. H. (2019). New elevation data triple estimates of global vulnerability to sea-level rise and coastal flooding. Nat. Commun. 10:4844. doi: 10.1038/s41467-019-13552-0
Little, C. M., Oppenheimer, M., and Urban, N. M. (2013). Upper bounds on twenty-first-century Antarctic ice loss assessed using a probabilistic framework. Nat. Clim. Change 3, 654–659. doi: 10.1038/nclimate1845
Ludwigsen, C. A., Khan, S. A., Andersen, O. B., and Marzeion, B. (2020). Vertical land motion from present-day deglaciation in the wider Arctic. Geophys. Res. Lett. 47:e2020GL088144. doi: 10.1029/2020GL088144
Madsen, K. S., Høyer, J. L., Suursaar, Ü., She, J., and Knudsen, P. (2019a). Sea level trends and variability of the Baltic sea from 2D statistical reconstruction and altimetry. Front. Earth Sci. 7:243. doi: 10.3389/feart.2019.00243
Madsen, K. S., Murawski, J., Blokhina, M., and Su, J. (2019b). Sea level change: mapping danish municipality needs for climate information. Front. Earth Sci. 7:81. doi: 10.3389/feart.2019.00081
Marcos, M., Calafat, F. M., Berihuete, Á., and Dangendorf, S. (2015). Long-term variations in global sea level extremes. J. Geophys. Res. 120, 8115–8134. doi: 10.1002/2015JC011173
Masina, M., and Lamberti, A. (2013). A nonstationary analysis for the Northern Adriatic extreme sea levels. J. Geophys. Res. 118, 3999–4016. doi: 10.1002/jgrc.20313
Meier, H. E. M., Broman, B., and Kjellström, E. (2004). Simulated sea level in past and future climates of the Baltic Sea. Climate Res. 27, 59–75. doi: 10.3354/cr027059
Mitrovica, J. X., Gomez, N., and Clark, P. U. (2009). The sea-level fingerprint of West Antarctic collapse. Science 323, 753–753. doi: 10.1126/science.1166510
Mitrovica, J. X., Gomez, N., Morrow, E., Hay, C., Latychev, K., and Tamisiea, M. (2011). On the robustness of predictions of sea level fingerprints. Geophys. J. Int. 187, 729–742. doi: 10.1111/j.1365-246X.2011.05090.x
Mitrovica, J. X., Hay, C. C., Kopp, R. E., Harig, C., and Latychev, K. (2018). Quantifying the sensitivity of sea level change in coastal localities to the geometry of polar ice mass flux. J. Clim. 31, 3701–3709. doi: 10.1175/JCLI-D-17-0465.1
Mitrovica, J. X., and Milne, G. A. (2003). On post-glacial sea level: I. General theory. Geophys. J. Int. 154, 253–267. doi: 10.1046/j.1365-246X.2003.01942.x
Mohrholz, V. (2018). Major Baltic inflow statistics?revised. Front. Mar. Sci. 5:384. doi: 10.3389/fmars.2018.00384
Møller, J. T. (1997). “Denmark,” in Geomorphological Hazards of Europe, Vol. 5 of Developments in Earth Surface Processes, eds C. Embleton and C. Embleton-Hamann (Amsterdam: Elsevier), 91–98. doi: 10.1016/S0928-2025(97)80005-3
Mörner, N.-A. (2013). Sea level changes past records and future expectations. Energy Environ. 24, 509–536. doi: 10.1260/0958-305X.24.3-4.509
Moser, S. C., and Ekstrom, J. A. (2010). A framework to diagnose barriers to climate change adaptation. Proc. Natl. Acad. Sci. U.S.A. 107, 22026–22031. doi: 10.1073/pnas.1007887107
Muis, S., Apecechea, M. I., Dullaart, J., de Lima Rego, J., Madsen, K. S., Su, J., et al. (2020). A high-resolution global dataset of extreme sea levels, tides, and storm surges, including future projections. Front. Mar. Sci. 7:263. doi: 10.3389/fmars.2020.00263
Muis, S., Verlaan, M., Winsemius, H. C., Aerts, J. C., and Ward, P. J. (2016). A global reanalysis of storm surges and extreme sea levels. Nat. Commun. 7:11969. doi: 10.1038/ncomms12913
Nerem, R. S., Beckley, B. D., Fasullo, J. T., Hamlington, B. D., Masters, D., and Mitchum, G. T. (2018). Climate-change-driven accelerated sea-level rise detected in the altimeter era. Proc. Natl. Acad. Sci. U.S.A. 115, 2022–2025. doi: 10.1073/pnas.1717312115
Olesen, M., Madsen, K. S., Ludwigsen, C. A., Boberg, F., Christensen, T., Cappelen, J., et al. (2014). Fremtidige Klimaforandringer i Danmark. Technical Report 14-06, Danish Meteorological Institute.
Oppenheimer, M., Glavovic, B., Hinkel, J., van de Wal, R., Magnan, A. K., Abd-Elgawad, A., et al. (2019). “Sea level rise and implications for low-lying islands, coasts and communities,” in IPCC Special Report on the Ocean and Cryosphere in a Changing Climate, eds H.-O. PRörtner, D. C. Roberts, V. Masson-Delmotte, P. Zhai, M. Tignor, E. Poloczanska, K. Mintenbeck, A. Alegría, M. Nicolai, A. Okem, J. Petzold, B. Rama, N. M. Weyer.
Permanent Service for Mean Sea Level (PSMSL) (2020). Tide Gauge Data. Available online at: http://www.psmsl.org/data/obtaining/ (Retrieved 13 April, 2020).
Prahl, B. F., Boettle, M., Costa, L., Kropp, J. P., and Rybski, D. (2018). Damage and protection cost curves for coastal floods within the 600 largest European cities. Sci. Data 5:180034. doi: 10.1038/sdata.2018.34
Rahmstorf, S. (2010). A new view on sea level rise. Nat. Clim. Change 1, 44–45. doi: 10.1038/climate.2010.29
Sella, G. F., Stein, S., Dixon, T. H., Craymer, M., James, T. S., Mazzotti, S., et al. (2007). Observation of glacial isostatic adjustment in stable? North America with GPS. Geophys. Res. Lett. 34. doi: 10.1029/2006GL027081
Shepherd, A., Ivins, E., Rignot, E., Smith, B., van den Broeke, M., Velicogna, I., et al. (2018). Mass balance of the Antarctic ice sheet from 1992 to 2017. Nature 558, 219–222. doi: 10.1038/s41586-018-0179-y
Slangen, A. B., Meyssignac, B., Agosta, C., Champollion, N., Church, J. A., Fettweis, X., et al. (2017). Evaluating model simulations of twentieth-century sea level rise. Part I: global mean sea level change. J. Clim. 30, 8539–8563. doi: 10.1175/JCLI-D-17-0110.1
Sørensen, C., Broge, N. H., Molgaard, M. R., Schow, C. S., Thomsen, P., Vognsen, K., et al. (2016). Assessing future flood hazards for adaptation planning in a Northern European coastal community. Front. Mar. Sci. 3:69. doi: 10.3389/fmars.2016.00069
Sørensen, C. S. (2016). “Water NOT wanted-coastal floods and flooding protection in Denmark,” in Sicherung von Dämmen, Deichen und Stauanlagen: Handbuch für Theorie und Praxis, eds. R. A. Herrmann and J. Jensen (Siegen: Universität Siegen), 3–21.
Spada, G. (2017). Glacial isostatic adjustment and contemporary sea level rise: an overview. Surv. Geophys. 38, 153–185. doi: 10.1007/s10712-016-9379-x
Swart, R., [de Bruin], K., Dhenain, S., Dubois, G., Groot, A., and [von der Forst], E. (2017). Developing climate information portals with users: promises and pitfalls. Clim. Serv. 6, 12–22. doi: 10.1016/j.cliser.2017.06.008
Vestøl, O., Ågren, J., Steffen, H., Kierulf, H., and Tarasov, L. (2019). NKG2016LU: a new land uplift model for Fennoscandia and the Baltic Region. J. Geodesy 93, 1759–1779. doi: 10.1007/s00190-019-01280-8
Vousdoukas, M. I., Mentaschi, L., Voukouvalas, E., Bianchi, A., Dottori, F., and Feyen, L. (2018a). Climatic and socioeconomic controls of future coastal flood risk in Europe. Nat. Clim. Change 8, 776–780. doi: 10.1038/s41558-018-0260-4
Vousdoukas, M. I., Mentaschi, L., Voukouvalas, E., Verlaan, M., Jevrejeva, S., Jackson, L. P., et al. (2018b). Global probabilistic projections of extreme sea levels show intensification of coastal flood hazard. Nat. Commun. 9:2360. doi: 10.1038/s41467-018-04692-w
Wahl, T., Haigh, I. D., Nicholls, R. J., Arns, A., Dangendorf, S., Hinkel, J., et al. (2017). Understanding extreme sea levels for broad-scale coastal impact and adaptation analysis. Nat. Commun. 8:16075. doi: 10.1038/ncomms16075
Wahl, T., Haigh, I. D., Woodworth, P. L., Albrecht, F., Dillingh, D., Jensen, J., et al. (2013). Observed mean sea level changes around the North Sea coastline from 1800 to present. Earth-Sci. Rev. 124, 51–67. doi: 10.1016/j.earscirev.2013.05.003
Watson, C. S., White, N. J., Church, J. A., King, M. A., Burgette, R. J., and Legresy, B. (2015). Unabated global mean sea-level rise over the satellite altimeter era. Nat. Clim. Change 5, 565–568. doi: 10.1038/nclimate2635
Woodworth, P. L. (2006). Some important issues to do with long-term sea level change. Philos. Trans. R. Soc. A 364, 787–803. doi: 10.1098/rsta.2006.1737
Woodworth, P. L., Hunter, J., Marcos, M., Caldwell, P., Menéndez, M., and Haigh, I. (2016). Towards a global higher-frequency sea level dataset. Geosci. Data J. 3, 50–59. doi: 10.1002/gdj3.42
Woodworth, P. L., Melet, A., Marcos, M., Ray, R. D., Wöppelmann, G., Sasaki, Y. N., et al. (2019). Forcing factors affecting sea level changes at the coast. Surv. Geophys. 40, 1351–1397. doi: 10.1007/s10712-019-09531-1
Keywords: sea level rise, IPCC SROCC, North Sea, Baltic Sea, Denmark, storm surge
Citation: Su J, Andrée E, Nielsen JW, Olsen SM and Madsen KS (2021) Sea Level Projections From IPCC Special Report on the Ocean and Cryosphere Call for a New Climate Adaptation Strategy in the Skagerrak-Kattegat Seas. Front. Mar. Sci. 8:629470. doi: 10.3389/fmars.2021.629470
Received: 14 November 2020; Accepted: 09 April 2021;
Published: 12 May 2021.
Edited by:
Michael Dylan Sparrow, World Meteorological Organization, SwitzerlandReviewed by:
Helena Granja, University of Minho, PortugalCopyright © 2021 Su, Andrée, Nielsen, Olsen and Madsen. This is an open-access article distributed under the terms of the Creative Commons Attribution License (CC BY). The use, distribution or reproduction in other forums is permitted, provided the original author(s) and the copyright owner(s) are credited and that the original publication in this journal is cited, in accordance with accepted academic practice. No use, distribution or reproduction is permitted which does not comply with these terms.
*Correspondence: Jian Su, amlzQGRtaS5kaw==
Disclaimer: All claims expressed in this article are solely those of the authors and do not necessarily represent those of their affiliated organizations, or those of the publisher, the editors and the reviewers. Any product that may be evaluated in this article or claim that may be made by its manufacturer is not guaranteed or endorsed by the publisher.
Research integrity at Frontiers
Learn more about the work of our research integrity team to safeguard the quality of each article we publish.