 Dongsheng Qiao
 Guangning Zhi1
 Haizhi Liang
 Dezhi Ning
 Jun Yan
95% of researchers rate our articles as excellent or good
Learn more about the work of our research integrity team to safeguard the quality of each article we publish.
Find out more
REVIEW article
Front. Mar. Sci. , 26 February 2021
Sec. Ocean Solutions
Volume 8 - 2021 | https://doi.org/10.3389/fmars.2021.627453
This article is part of the Research Topic Innovation and System Integration for Offshore Renewable Energy Structures View all 6 articles
The physical model test interlinks the concept design and sea trial during the commercial utilization of wave energy converter. Aiming at the oscillating buoy wave energy converter, the energy conversion principle is firstly decomposed. Then, the model scale requirement of fluid motion and corresponding hydrodynamic similarity criterion considered in the physical model test are introduced. Finally, the solution of scaling orchestration problem is proposed considering the overall model scale in different energy conversion processes. The hydrodynamic similarity criterion is selected based on the working mechanism of the energy-capturing body only in contact with water, and the model scale requirements during the other stages of energy conversion structure are determined by the main mechanical factors. The first-stage energy conversion of device is recommended to meet the Froude similarity requirements, while the second-stage and third-stage energy conversions only need to meet the power similarity requirements. The power scale ratio in the three energy conversions is recommended to be consistent with the Froude similarity, and there are no requirements of geometric shape of second-stage and third-stage energy conversions to meet the similarity criteria.
As a new type of renewable energy, wave energy has unique advantages compared with solar and wind energy. The wave energy is mainly concentrated on the surface of ocean, and its energy concentration is high. The reserves of wave energy resources are considerable. According to the assessment of global wave energy resources by Mork et al. (2010), the global annual wave energy reserves are 32,412.0 TWh, and the global annual power consumption is 21,371 TWh based on the data provided by IEA (2020), which shows the global wave energy reserves are huge. The natural seasonal variation of wave energy in temperate regions meets its seasonal electricity demand, and the wave energy has little impact on the environment (Clément et al., 2002). The application of wave energy can enrich the resource structure, ensure the diversity of energy, reduce the dependence on fossil energy, and have a positive impact on the global environmental situation (Astariz and Iglesias, 2015).
For the development of wave energy, the power of waves per unit length (along the wave crest or the shoreline direction) is commonly used as the evaluation index of waves. The wave power suitable for the utilization of wave energy converters (WECs) is in the range of 20–70 kW/m, generally in the middle and high latitudes. If the wave power is less than 20k W/m, the economics of WECs will be poor. If the wave power is more than 70 kW/m, it will threaten the survival and reliability of WECs. The small seasonal variability of wave conditions is also conducive to the operation of WECs. The large changes of wave conditions will not only make the wave energy extraction efficiency lower but also bring great challenges to the reliability of WECs (Falcão, 2010). Mork et al. (2010) divided the global wave energy resources into eight levels according to the wave power, and the ratio of the minimum monthly wave power to the annual average wave power is used to define the seasonal change of wave power. Considering the different levels of wave energy resources and the seasonal change of wave power, the southern coasts of South America, Africa, and Australia are the ideal locations for wave energy development.
To achieve the capture of wave energy, the development and optimization of WECs are essential. At present, various principles of WECs have been proposed, and there were thousands of patent applications for wave energy technology as early as 1980 (McCormick, 2013), which shows the development and utilization of wave energy have long received the attention of scientists. Although there are many different principles of WEC, the research and development of most wave energy technologies are still far from the commercial application (Sheng, 2019). The relatively mature wave energy technologies are mainly divided into the following three types: oscillating water column (OWC), overtopping converters, and oscillating body (Falcão, 2010). So far, some WECs developed based on the above three technologies have been tested in real sea conditions and even connected to the grid.
The OWC WEC is divided into two types: fixed and floating. The main structure of OWC is composed of an air chamber, air turbine, generator, pressure relief valve, etc., as shown in Figure 1. The wave surface oscillation below the air chamber creates the pressure difference between the air chamber and the outside, forces the air to gush out of the air chamber, drives the air turbine to rotate, and then drives the generator to generate electricity. The role of the pressure relief valve is to supplement air to the air chamber. If the OWC is built near the coastline, the device can be easily integrated with the breakwater to protect the coastline and generate electricity together (Medina-Lopez et al., 2015).
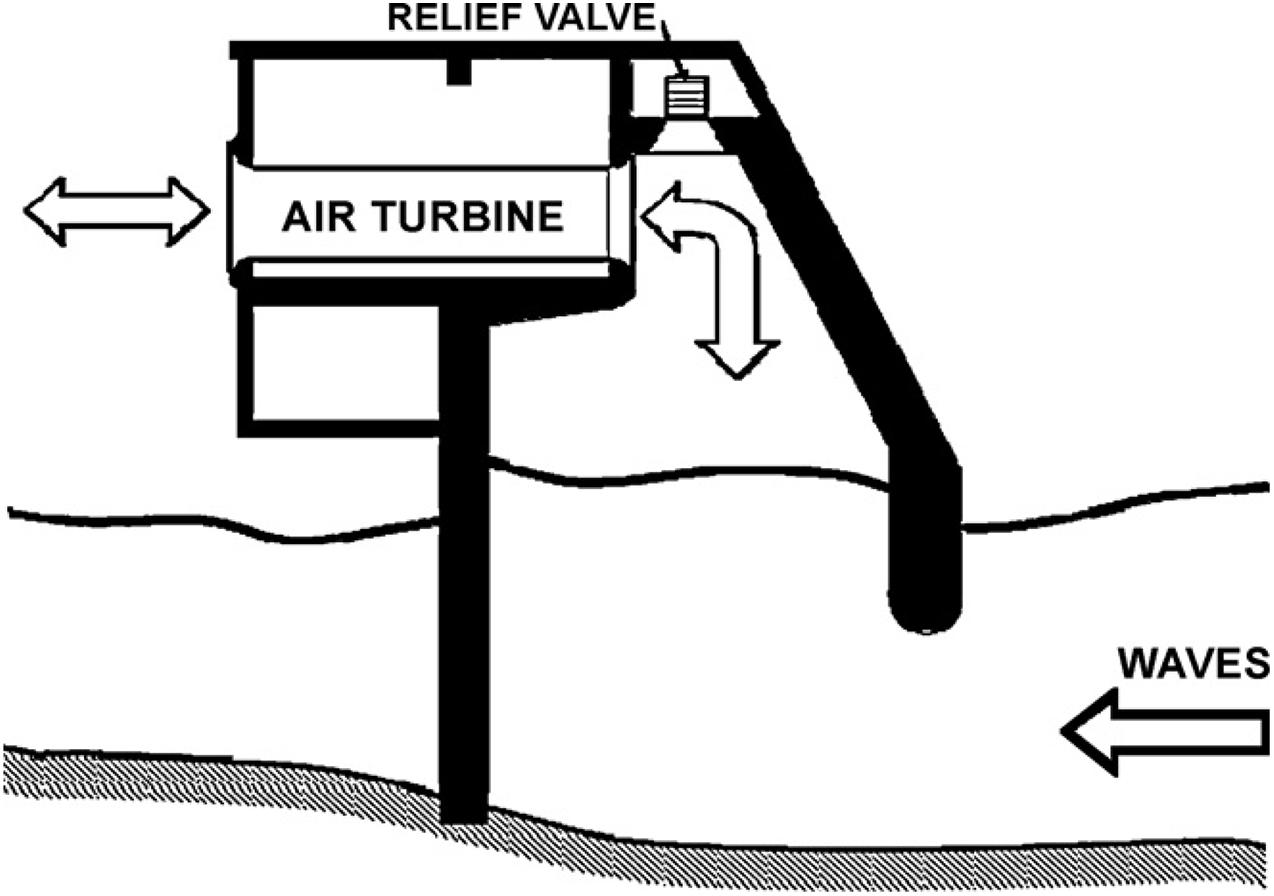
Figure 1. Schematic diagram of OWC (Falcão, 2010).
The Japan Marine Science R&D Center developed a WEC based on OWC technology with the name of Mighty Whale, and deployed near the Gokasho Bay, Japan, in 1998 (Washio et al., 2000). With the Japanese government no longer providing high research costs, this sea trial project ended in March 2002. The Wavegen Company in the United Kingdom developed a WEC based on OWC technology with the name of LIMPET, and put into operation on Islay island in 2000 (Heath et al., 2001). Due to the incorrect estimation of wave power, the performance of this device was poor and it was decommissioned in 2012. The EVE Energy Company in Spain built a WEC power station based on OWC technology with the name of Mutriku, as shown in Figure 2, and successfully connected to the grid in 2011 (Ibarra-Berastegi et al., 2018). This device is still in good service with relatively stable performance, besides the serious noise pollution.
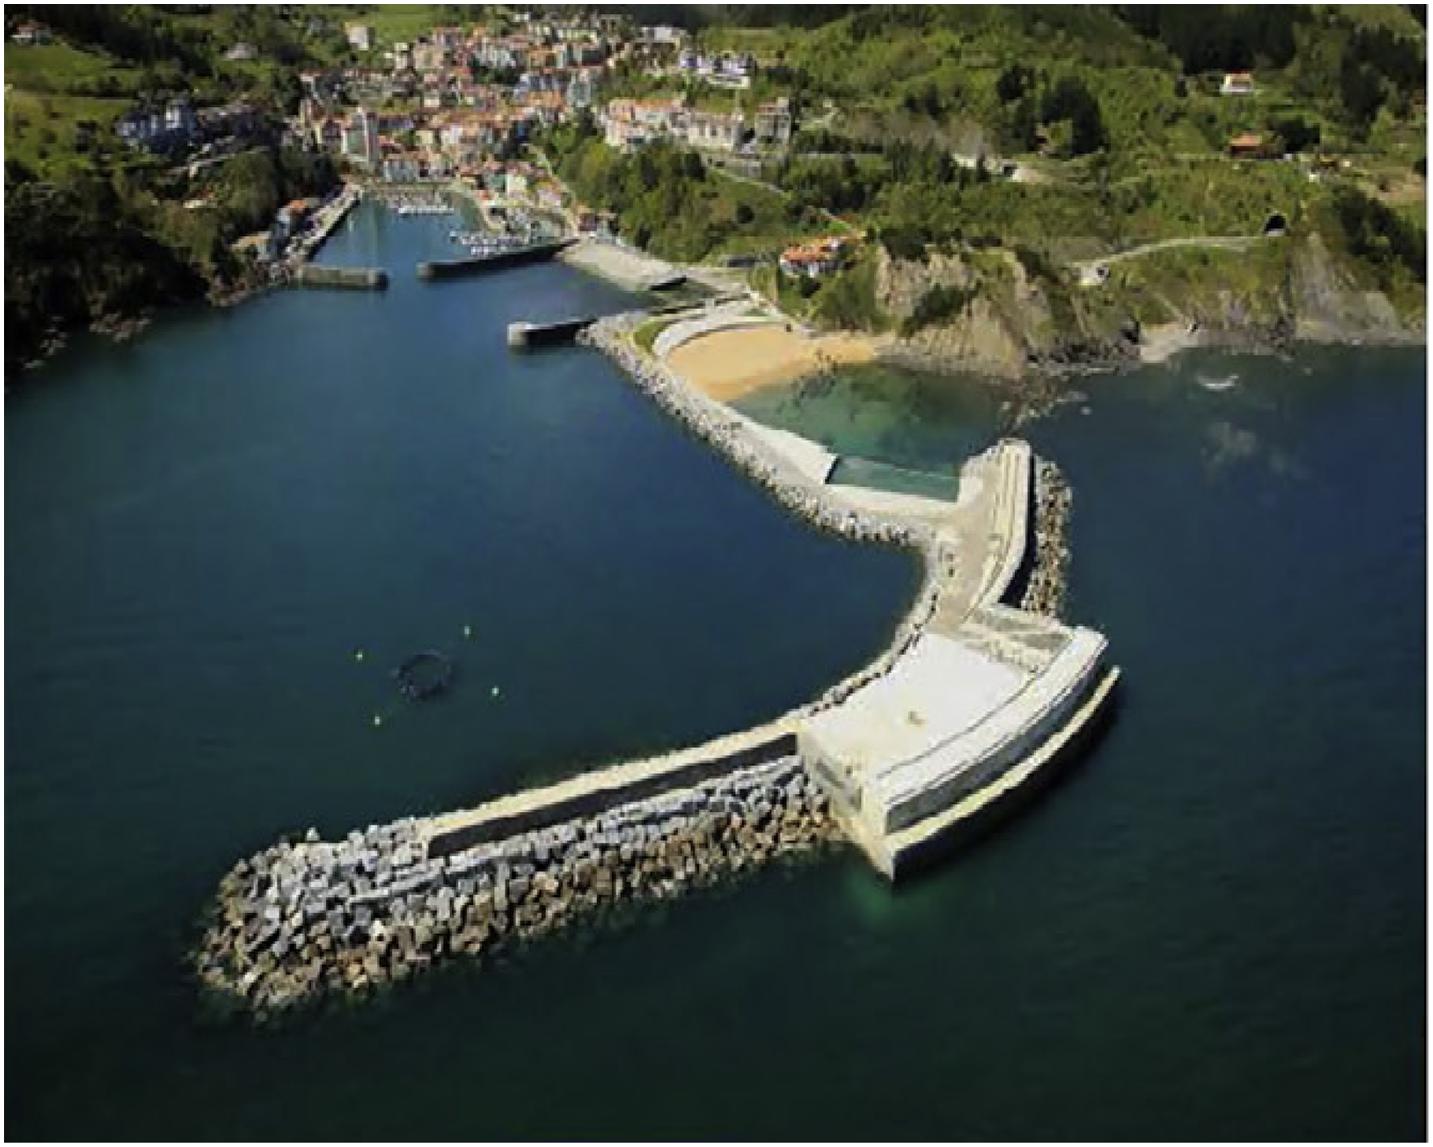
Figure 2. OWC integrated into Mutriku breakwater (Pérez-Collazo et al., 2015).
The overtopping WEC can also be divided into two types: fixed and floating. This type of device can capture the water close to the wave crest by over spilling and introduce the water into a reservoir where the level of stored water is higher than the average free-surface level of surrounding sea. The potential energy of the stored water is converted into electricity using the conventional low-head hydraulic turbines (Falcão, 2010). Although this device can capture huge energy, the large size, high cost, and serious impact on the surrounding environment restrict its utilization.
A WEC based on overtopping converters technology with the name of Wave Dragon was put into testing in Nissum Bredning of Denmark in 2003, and it has been running for more than 20,000 h (Kofoed et al., 2006), as shown in Figure 3. The financial crisis has caused a delay in the plans for deploying the first full scale Wave Dragon.
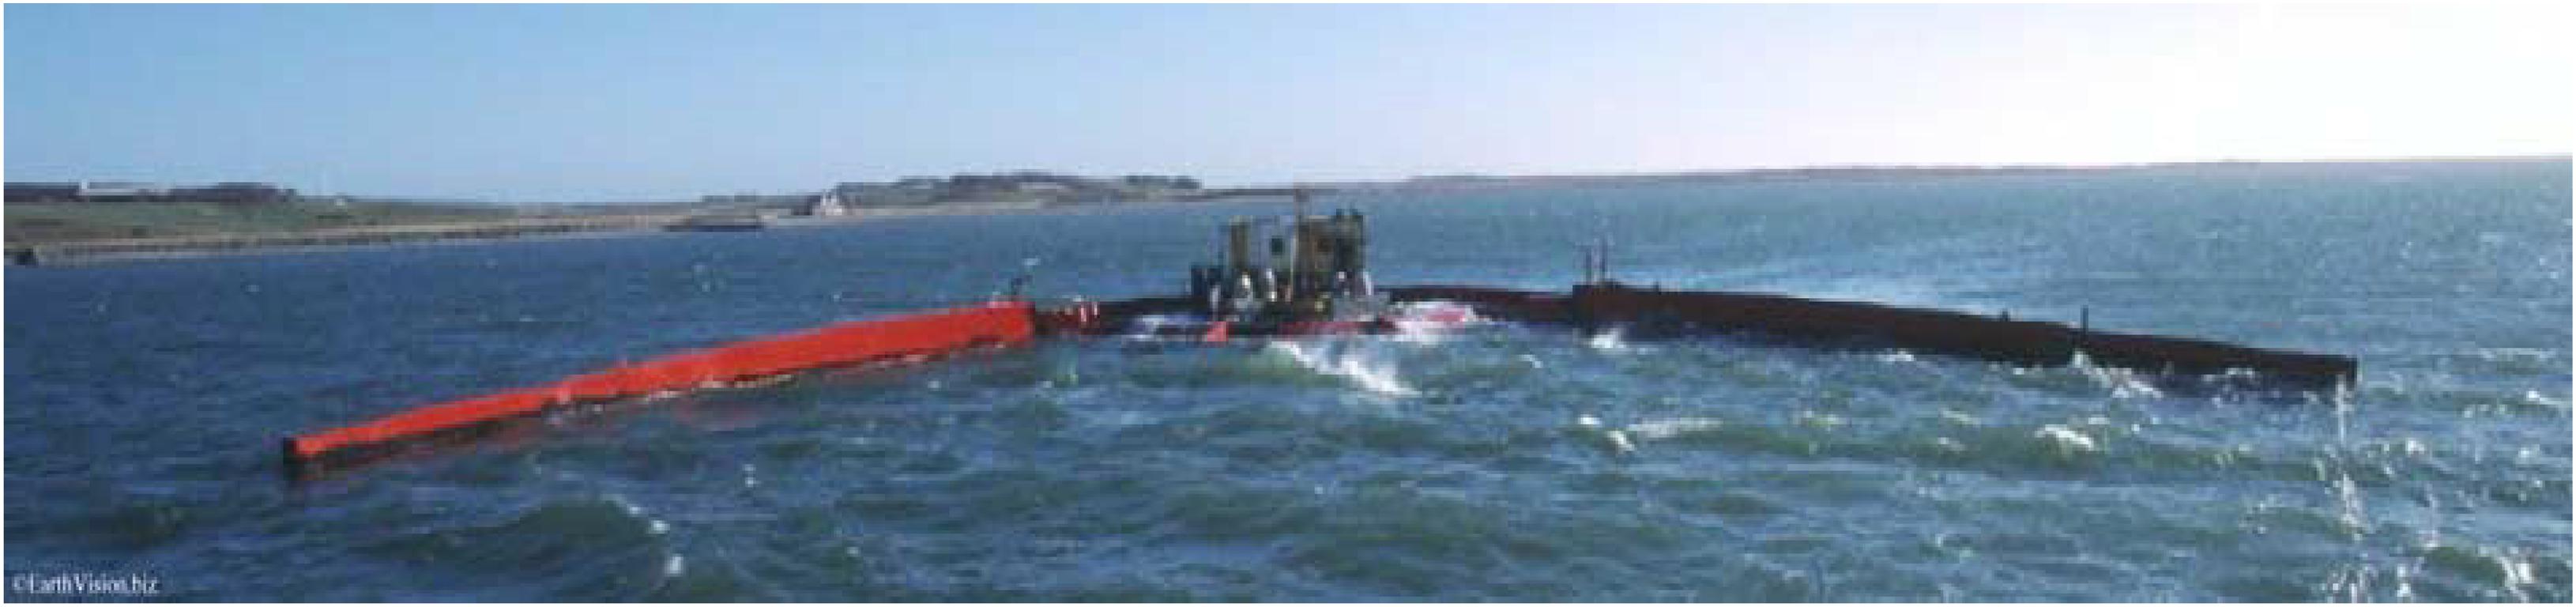
Figure 3. Wave Dragon (Kofoed et al., 2006).
There are many types of oscillating body WECs, such as the single-body heaving buoys, the two-body heaving systems, the fully submerged heaving systems, the pitching devices, the bottom-hinged systems, and the multi-body systems. This type of device is generally composed of energy capture bodies, power-take-off (PTO), and generators. It relies on waves to drive the energy capture body to oscillate, and the kinetic energy of the energy capture body is absorbed by PTO and transmitted to the generator for power generation. With the development of WEC mooring, maintenance, and underwater cables, this type of device is widely used in the offshore and deep water area.
The Teamwork Technology BV Company in the Netherlands developed a WEC based on oscillating body technology with the name of Archimedes Wave Swing (AWS), as shown in Figure 4, and completed the sea trial in Portugal in 2004 (Valério et al., 2007). With a brake problem that seriously affected the performance, and the allowed license of time limit issued by the Portuguese Maritime Administration, the sea trail ended shortly (Prado and Polinder, 2013). The Pelamis Wave Power Company in the United Kingdom developed a WEC based on oscillating body technology with the name of Pelamis, and put into use near the northern coast of Portugal in 2008, which is also the world’s first grid-connected wave energy power plant (Palha et al., 2010), as shown in Figure 5. Due to the research and development costs of long-term sea trail, Pelamis Wave Power eventually closed due to the lack of financial support. The Wello Oy Company in Finland developed a WEC based on oscillating body technology with the name of Penguin, and carried out a demonstration operation at the sea test site in Cornwall of the United Kingdom in 2017 (Mahmud et al., 2018). There have been four successful sea trials in the North Sea and Cornwall’s sea to ensure the performance and reliability of the Penguin device.
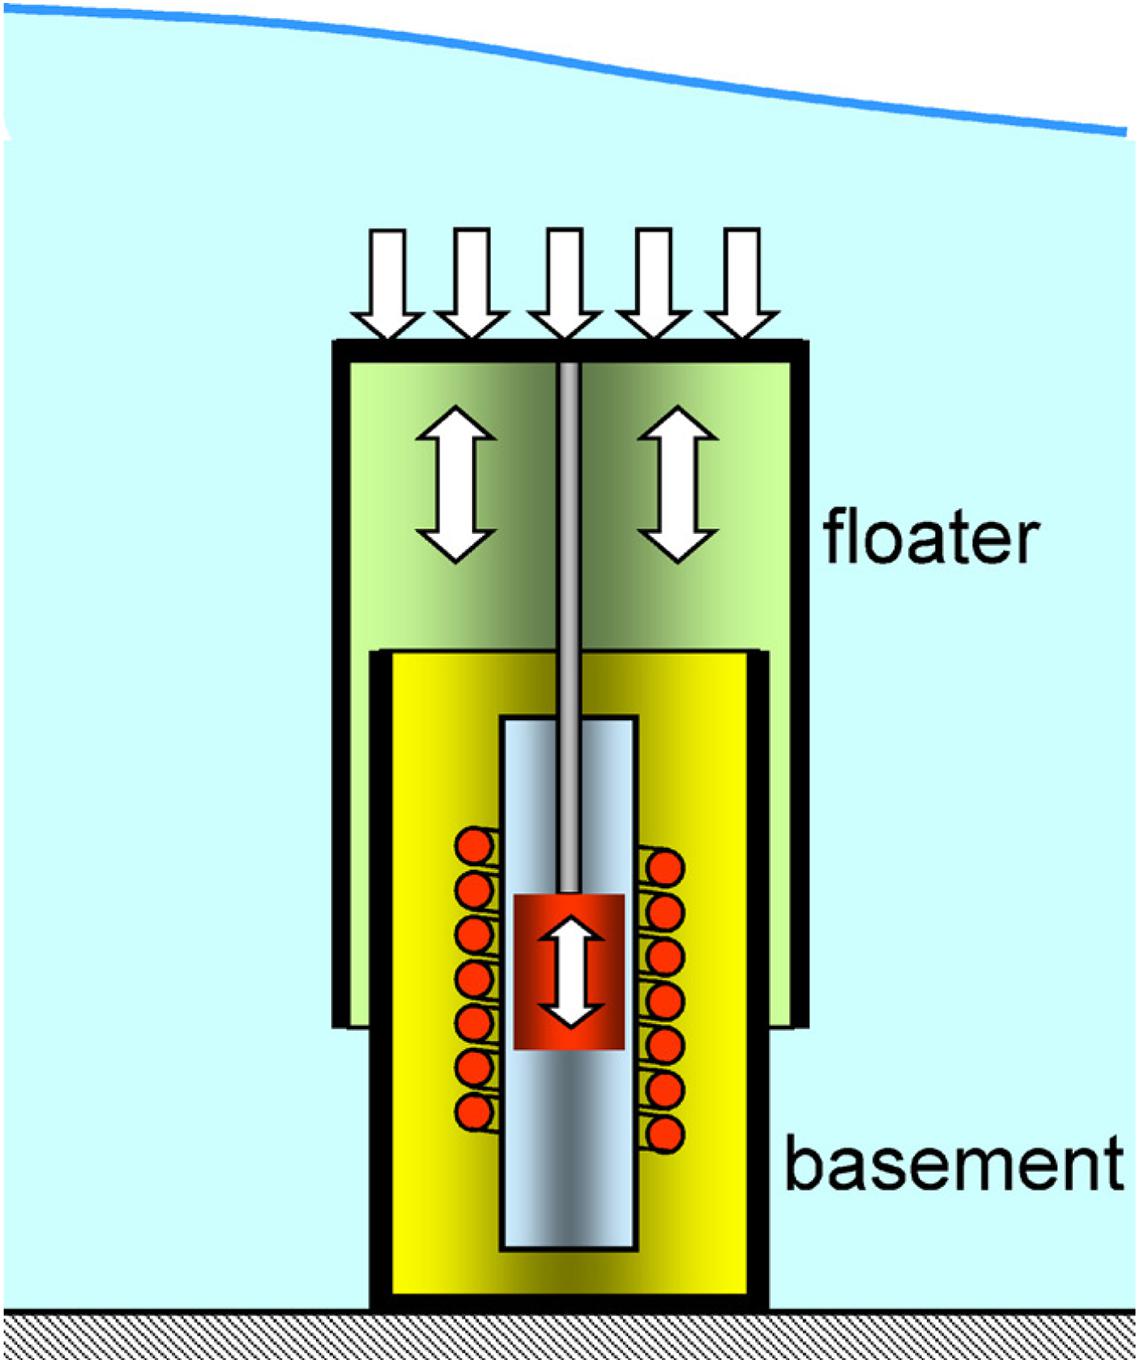
Figure 4. Principle of Archimedes Wave Swing (Falcão, 2010).
Figure 5. Pelamis wave farm (Falcão, 2010).
Besides, many other WECs have also been tested in real sea conditions, but they cannot be commercialized and have to be abandoned due to the high cost. For example, Aquamarine Power was unable to commercialize the developed WECs, which led to the company’s bankruptcy (Ma and Xia, 2016).
In the process of real sea trial, the reliability of the device usually needs to be considered as the first factor, and then the energy extraction efficiency. Therefore, the mild sea condition is selected as the sea trial test site. Meanwhile, multiple real sea trials should be carried out in different sea areas to test the performance of WECs comprehensively, and this will introduce huge costs. Therefore, in order to reduce the Research and Development costs and improve the reliability of WECs, it is necessary to conduct the instructive physical model tests before real sea trial.
The scaled physical model test of WECs could play the role of feasibility verification and structure selection in the initial stage of device design; meanwhile, it could also be used to investigate the effect of a single variable on the device performance (Payne, 2008). Holmes and Nielsen (2010) proposed a WEC development and testing guide, in which the WEC development process was divided into five steps: Concept Validation, Design Validation, Systems Validation, Device Validation, and Economics Validation, and the first three steps all need the support of scaled physical model test. Therefore, before conducting the long-term sea trial test, the physical model test should be conducted to verify the design principle, solve the reliability of key components, optimize the conversion efficiency, and other issues. The subsequent sea trial test is conducted to verify the survivability and reliability of WEC, which will greatly reduce the time and cost of the sea trial test, and thereby the whole Research and Development cost could be reduced. However, in the scaled physical model test process of WECs, due to the lack of corresponding specifications and technical support and other reasons (Sheng et al., 2014), sometimes it is impossible to accurately simulate the real working state of WECs, which causes a large deviation from the results of sea trail test.
The oscillating buoy WEC is usually composed of three parts: the energy capture body only indirectly contacts with water, PTO, and generator. In the scaled physical model test, the orchestration of the scaled relationship among the three parts is the key to accurately conduct the physical model test. Some scale similarity theories for the response analysis of traditional offshore structures have been proposed and recognized (Hughes, 1993; Chakrabarti, 1998; Vassalos, 1998), including the Froude similarity criterion, Reynolds similarity criterion, etc. However, in addition to the responses of energy capture body, the PTO and generator also need to be scaled at the same time, which often cannot be scaled using the same scale ratio of the energy capture body. In this way, it is necessary to consider the corresponding dominant characteristic parameters for the different parts of the WEC device to realize the model scale, and finally orchestrate the different model scale realization.
The scaling orchestration problem in the physical model test of oscillating buoy WEC is focused, and this paper is organized as follows: In section “Energy Conversion Process of Oscillating Buoy WEC”, the structure and working principle of the oscillating buoy WEC are introduced; in section “Similarity Criteria”, the hydrodynamic similarity theory is introduced; in section “Reynolds Similarity Criteria of WECs” and section “Froude Similarity Criteria of WECs”, the Reynolds similarity criteria and Froude similarity criteria of WECs are introduced, respectively; in section “Scaling Orchestration in Physical Model Test of Oscillating Buoy WEC”, the main mechanical factors, characteristic transmission parameters of the energy conversion structure of the oscillating buoy WEC at all stages, and the method of solving the scaling orchestration problem are proposed, and then some influencing factors that cannot be precisely controlled in the scaled model test are also pointed out.
The energy conversion process of oscillating buoy WEC can usually be divided into three stages (as shown in Figure 6): first-stage (wave energy-mechanical energy), second-stage (mechanical energy-hydraulic energy-mechanical energy or only mechanical energy transfer), and third-stage (mechanical energy-electrical energy) (Cui et al., 2009).
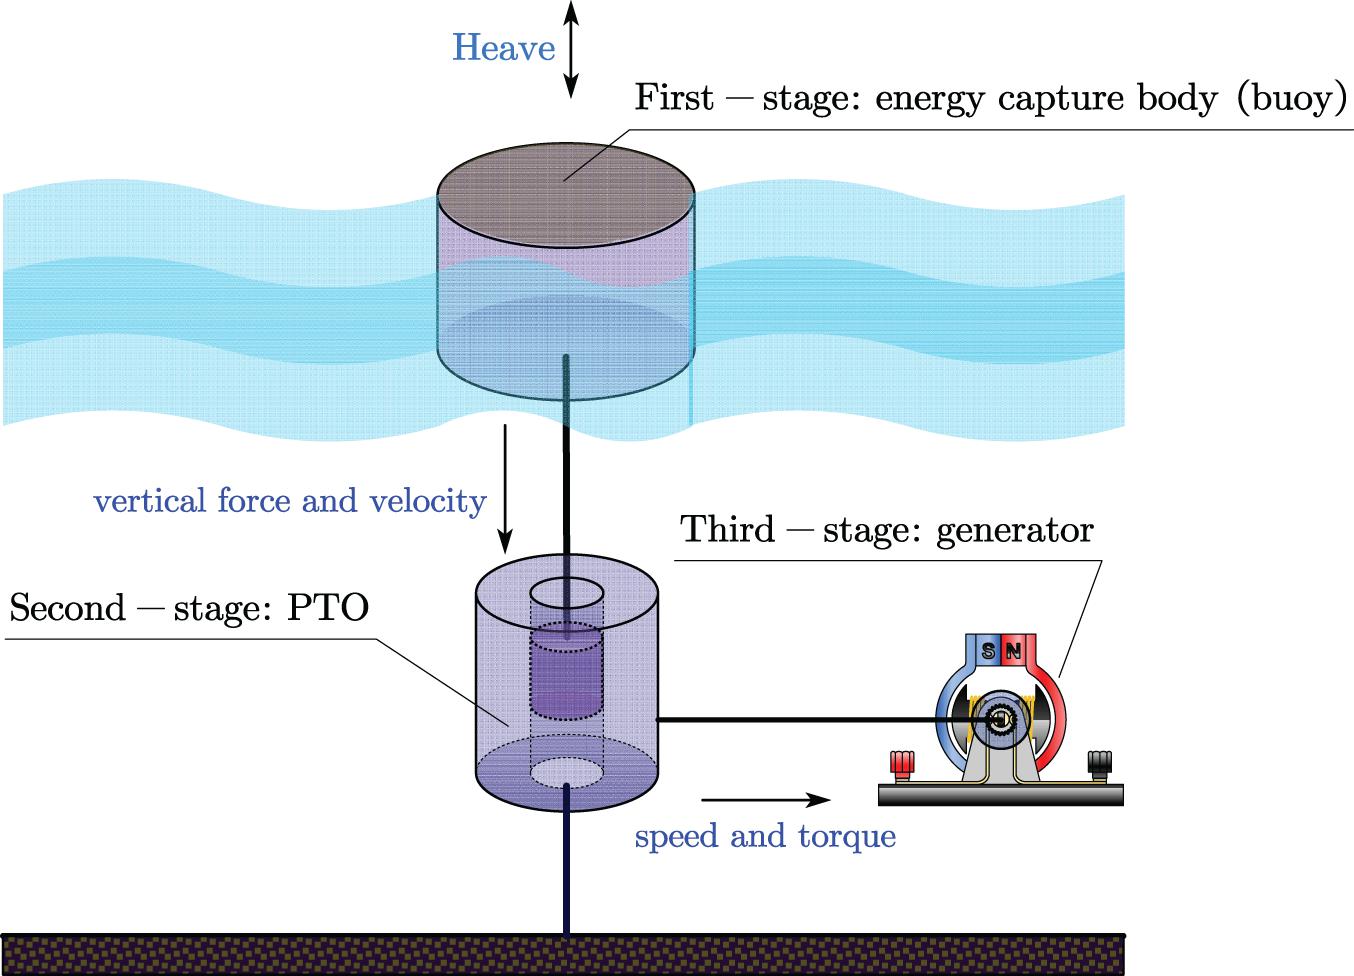
Figure 6. Single-degree-of-freedom heave oscillating buoy WEC.
The first-stage part refers to the energy capture body in the oscillating buoy WEC, which could convert the kinetic and potential of wave energy into its mechanical energy and then transfer it to the second-stage part, and the captured power in the first-stage part could be calculated by multiplying the velocity of buoy and PTO force. In the physical model test, it is generally possible to directly measure the displacement/velocity of the energy capture body using the displacement sensor, and the PTO force through placing sensors at the interface of first-stage and second-stage parts. The index to evaluate the performance of energy capture body is the energy capture width and the capture width ratio. The energy capture width refers to the ratio of the average power of energy capture body to the wave power per unit width. The capture width ratio refers to the ratio of energy capture width to the energy capture body width (Price et al., 2009; Sheng and Lewis, 2012; Babarit, 2015). In other words, the capture width ratio is the energy conversion efficiency of the first-stage part.
The second-stage part refers to the PTO connecting the energy capture body and the generator, and the function of this part is to convert the energy transferred from the energy capture body into the energy that drives the generator to operate. For example, the single-degree-of-freedom heave oscillating buoy wave energy device is shown in Figure 6, which converts the heave velocity and force into the form of speed and torque in the rotary generator. The commonly used PTO is generally divided into two types: hydraulic PTO device, which can store the energy transferred by the energy capture body into hydraulic energy and then into stable mechanical energy to drive the generator to operate; mechanical PTO device, which can change the energy transferred by the energy capture body into mechanical energy through a mechanical device to drive the generator to operate (Ahamed et al., 2020). The hydraulic PTO device usually includes the hydraulic cylinder, accumulator, controller, and hydraulic motor, etc. (Drew et al., 2009; Zhang et al., 2012). The energy is absorbed through a hydraulic cylinder and converted into hydraulic energy, and the hydraulic energy drives the hydraulic motor to rotate and transfers energy to the generator. The excess hydraulic energy could be stored by the accumulator, and then released when the energy absorbed in the hydraulic cylinder is insufficient, which can maintain the operation stability of hydraulic motor (Lasa et al., 2012). The advantage of the hydraulic PTO device is that it can well adapt the characteristics of high power and low-frequency waves, ensure the smooth operation of subsequent generators, and carry out the continuous phase control of the motion responses of buoy (Gaspar et al., 2016). The mechanical PTO device is generally composed of mechanical components, such as a variable speed gearbox, and the advantage is that the energy loss during the transmission process is small while the energy transmission efficiency is high (Penalba and Ringwood, 2016; Pendar and Sarjan, 2019). However, the energy transferred to the generator may be unstable, which is not conducive to the smooth operation of subsequent generators. Thinh and Binh (2019) improved the operational stability of mechanical PTO, but the stability is still worse than hydraulic PTO. In the physical model test of measuring the conversion efficiency of PTO device, a rotational speed and torque sensor is placed at the front end of the rotational generator, which could be used to calculate the energy transferred output from the second-stage part to the third-stage part. The transferred input from the first-stage part to the second-stage part could be obtained using the displacement and tension-compression sensors at the interface of first-stage and second-stage parts. In this way, the ratio of transferred input and output energy is the energy conversion efficiency of the second-stage part.
The third-stage part refers to the generator, which converts the energy transferred by the second-stage part into electric energy and transmits into the load or stores in a battery. In the physical model test, the electrical energy generated by the generator could be measured by the power analyzer (Mangalekar and Ugale, 2015). The working efficiency of the generator is the energy conversion efficiency of the third-stage part.
The total energy conversion efficiency of the oscillating buoy WEC is determined by the product of the respective energy conversion efficiencies of the three parts, as shown in the Equation 1.
where η is the total energy conversion efficiency of the oscillating buoy wave energy device; η1,η2,η3 and are the energy conversion efficiency of the first-stage, second-stage, third-stage parts, respectively.
In the physical model test including the fluid motion, the relevant similarity criteria must be satisfied to ensure the guiding significance of scaled model. Typically, the geometrical similarity, kinematical similarity, and dynamic similarity should be satisfied to ensure the similarity of fluid motion. The geometrical similarity is the presupposition and basis of kinematical similarity and dynamic similarity, the dynamic similarity is the dominant factor to determine the similarity of fluid motion, and the kinematical similarity is the manifestation of geometrical similarity and dynamic similarity (Hughes, 1993).
The geometrical similarity refers to the lengths of scaled model and the prototype model has a fixed scale factor in all dimensions and the same included angle. The scale factor could be defined in Equation 2.
where εL is the length scale factor; Lp and Lm are the geometrical length at the same part in the prototype and scaled model, respectively.
According to the relationship between length, area, and volume, the area scale factor and volume scale factor could be defined in Equations 3–4, respectively.
where Ap and Am are the geometrical area at the same part in the prototype and scaled model, respectively; Vp and Vm are the geometrical volume at the same part in the prototype and scaled model, respectively.
The kinematical similarity refers to the motions of scaled model and prototype model has a fixed scale factor, for example, the velocity similarity requires the velocity vector should be satisfied the velocity scale factor defined in Equation 5.
where εv is the velocity scale factor; vp and vm are the velocity vector in the prototype and scaled model, respectively.
According to the relationship between time, length, and velocity, the time scale factor εt could be defined in Equation 6.
Meanwhile, the acceleration scale factor, flow scale factor, and other motion parameters could also be defined according to the relationship between time, length, and velocity, etc.
The dynamic similarity refers to the force/moment acting on the same location of scaled model and prototype model has a fixed scale factor. For example, the force/moment due to the fluid-structure interaction in the prototype and scaled model should be proportional and parallel. The scale factor could be defined in Equation 7.
where εgra is the gravity scale factor; εsten is the viscous force scale factor; εF is the surface tension scale factor; εF is the acting force scale factor; Fp and Fm are the acting force in the prototype and scaled model, respectively; ερ is the density scale factor.
The Reynolds similarity criteria also refers to the viscous force similarity criteria, and the aim is to ensure the viscous force acting on the structure in the prototype and scaled model proportional and parallel. The Reynolds similarity criteria should be satisfied when the viscous force is the dominant mechanical factor in the physical model test, and the Reynolds needs to be the same in the prototype and scaled model.
The Reynolds number is a non-dimensional value, which could be used to represent the fluid flow condition, such as the motion of fluid is laminar or turbulent flow. Meanwhile, the Reynolds number also could be used to determine the resistance of fluid-structure interaction. The definition of Reynolds number is shown in Equation 8.
where Re is the Reynolds number; Finertia is the inertia force; Fvis is the viscous force; ρ is the density of fluid; L is the characteristic length; v is the characteristic velocity; μ is the dynamic viscosity.
According to Equation 8, the Reynolds number is only determined by the characteristic length and velocity for the fluid-structure interaction, and the chosen of characteristic velocity is the key problem for the offshore structure. The steady sailing speed of ship could be used as the characteristic velocity to calculate the Reynolds number for the traveling ship. However, for the approximate stationary WECs, the definition of Reynolds number is not well.
Newman (1977) defined the calculation of Reynolds number for the approximate stationary structure, as shown in Equation 9.
where ω is the circular frequency of structure responses.
Tao and Dray (2008) defined the calculation of Reynolds number for the oscillating heave plate based on KC number and β number, as shown in Equation 10.
where a is the response amplitude of oscillating heave plate; D is the diameter of circular heave plate.
In Equation 9, the characteristic velocity is replaced by ωL, but there is no specific physical meaning. In Equation 10, the characteristic velocity is replaced by aω, but the response amplitude of oscillating heave plate could not be obtained beforehand.
Considering the feasibility of calculating the Reynolds number, the amplitude of incident wave AW is chosen to replace the response amplitude in Equation 10, as shown in Equation 11 (Fitzgerald and Bergdahl, 2009; Jonkman, 2010). The characteristic velocity is calculated by ωAW, which means the maximum velocity of particle in the wave, and this method is commonly used in calculating the Reynolds number for WECs.
Considering the wave-WECs interaction, the gravity force is the usually dominant mechanical factor. However, the viscous force may have significant influence for some particular WECs structure, and the Reynolds similarity criteria needs to be considered. For example, in the two-body floating-point absorber WEC (Xu et al., 2019), the working principle is to use the relative motion between upper floater and bottom heave plate to drive the generator. Under the working condition, the bottom heave plate suffers large viscous force due to the small thickness, and the Reynolds similarity should be further considered.
The Froude similarity criteria also refers to the gravity force similarity criteria, which is commonly considered as the dominant similarity criteria in the physical model test of fluid-floating structure interaction. The aim is to ensure the gravity force acting on the structure in the prototype and scaled model proportional (Pecher and Peter, 2017). In order to satisfy the Froude similarity, the Froude number in the prototype and scaled model should be equal (Heller, 2016). The definition of Froude number is shown in Equation 12.
where G is the gravity force; g is the gravity acceleration.
According to Equation 8, the Reynolds number Re is relative with the characteristic length L and characteristic velocity v, in which the fluid in prototype and scaled model are both water with the same density ρ and dynamic viscosity μ. However, when the Froude similarity is satisfied firstly, the characteristic length L and characteristic velocity v need to be scaled together according to Equation 12, and this would cause the corresponding Reynolds number become smaller in the scaled model than that in the prototype model. The Froude similarity cannot consider the viscous force similarity of fluid flow, and the Froude and Reynolds similarity cannot be satisfied together. Therefore, in the physical model test designed by the Froude similarity, the dynamic similarity could be satisfied, but the kinematical similarity could not be satisfied. The viscous force in the scaled and prototype model could not satisfy the scale factor, and this could cause the scale effect (Le Méhauté and Hanes, 2005).
In order to decrease the scale effect, the Reynolds number should be increased to the critical value to satisfy the kinematical similarity. When the Reynolds number is large enough, the influence of model scale on the viscous force could be ignored, and the physical mechanism could be explained by the self-similarity (Gratton, 1991; Barenblat, 1996; Foss et al., 2007; Gratton, 1991) and Reynolds number invariance (Massey, 1989; Frisch and Kolmogorov, 1995). Fuchs and Hager (2012) conducted the physical model test of wave run-up to clarify that the scale effect could be ignored when the Reynolds number larger than 70,000. There are also some other researches clarify that the scale effect could be ignored when the Reynolds number larger than 105−3×10⁵ (Murzyn and Chanson, 2008; Felder and Chanson, 2009; Heller, 2011).
The Reynolds number could be increased through increasing the model size, fluid density, fluid velocity, or decreasing the fluid dynamic viscosity. In the physical model test, the way of increasing the model size and fluid density or decreasing the fluid dynamic viscosity is hard to realize, so the way of increasing the fluid velocity becomes the only feasible method. Adding grille in front of model or increasing the surface roughness of model could significantly increase the Reynolds number, and are commonly used in the physical model test.
As shown in section “Energy Conversion Process of Oscillating Buoy WEC” above, the energy conversion process of oscillating buoy WEC could be divided into three stages, and the dominant mechanical factor and feature transfer parameters are different in the three stages. Therefore, the model scale scheme in the physical model test of three stages could not satisfy the uniform similarity, and the model scale similarity criteria needs to be considered independently and orchestrated together. The specific scaling orchestration in physical model test of oscillating buoy WEC is proposed according to the similarities and differences between hydraulic and mechanical PTO devices.
The hydraulic PTO device uses the hydraulic device controller to precisely control the PTO force provided by the hydraulic cylinder. In the physical model test, the PTO force could be scaled to satisfy the dynamic similarity using control method, and this would greatly decrease the scale difficulty. The specific model scale similarity is proposed at the three-stages energy conversion process.
The first-stage part is the oscillating buoy, which is the energy capture body only interacting with fluid in the oscillating buoy WEC. Therefore, the gravity force similarity criteria is the dominant similarity criteria in the physical model test of fluid-floating structure interaction, and the Froude similarity must be satisfied preferentially. Meanwhile, besides the fluid force acting on the oscillating buoy, it also suffers the PTO force transmitted from the second-stage part, which also needs to satisfy the Froude similarity.
According to Equation 12, when the Froude similarity criteria is considered, the parameters scale factor in the prototype and scaled model could be obtained as shown in Table 1.
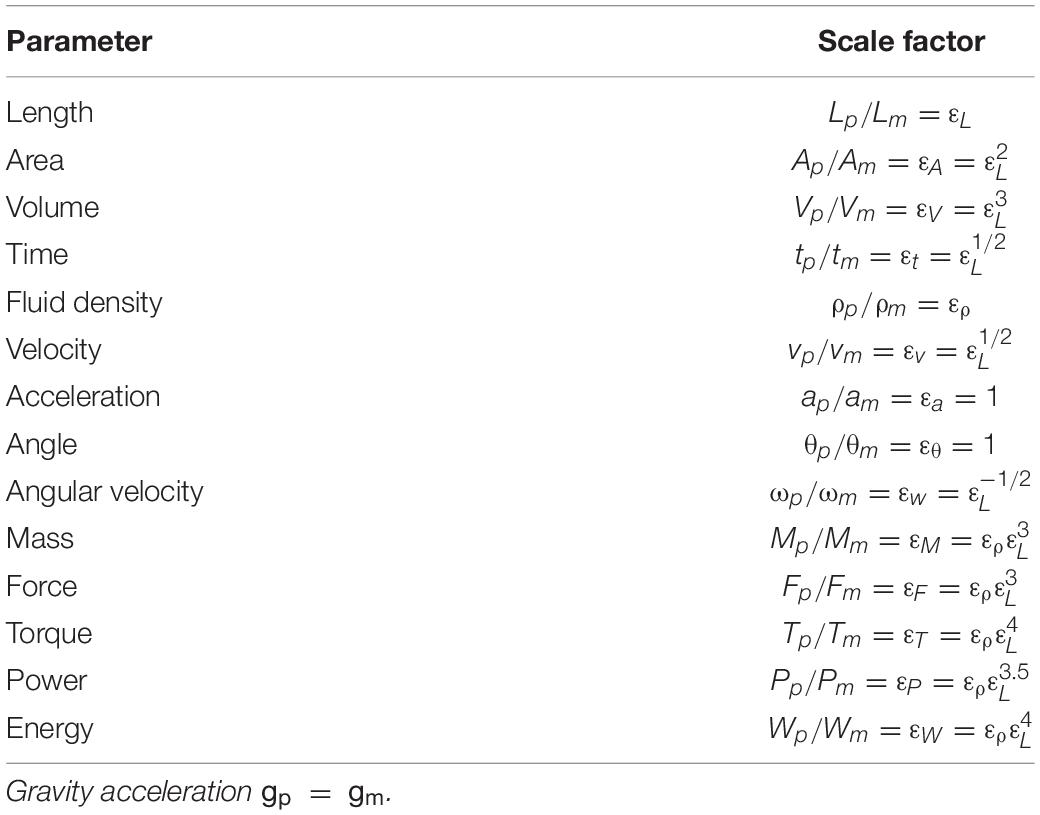
Table 1. Parameters scale factor in the first-stage part.
Because the power scale factor has been determined in the first-stage energy conversion, the power scale factor in the second-stage and third-stage energy conversion also needs to be kept as the same as that in the first-stage energy conversion, so the integral similarity could be satisfied in all three energy conversion stages. The energy conversion efficiency in the prototype and scaled model must be satisfied preferentially as the similarity criteria in the third-stage energy conversion.
The third-stage part is the generator, in which the input is mechanical energy and the output is electric energy. For the commonly used rotary generator, the input power of the generator could be described as the speed multiply by torque, which is equal with the electromagnetic torque of generator. Under the different speed and torque, the energy conversion efficiency of generator is also different. Therefore, in the design and selection of generator in the physical model test, the calibration should be conducted between the prototype and scaled generator to satisfy the same energy conversion efficiency, which needs to require the input power and output power with the same power scale factor.
Instead of only considering the power scale factor of generator, the electromagnetic torque of generator is further considered as the dominant scale factor in the third-stage energy conversion, which can both satisfy the requirements of speed and torque scale factor. Therefore, when the power transmitted from the second-stage part satisfies the power scale factor, the input speed and torque of generator could also satisfy the scale factor, and using this method is more convenient in the calibration process of the energy conversion efficiency of generator.
The regulation methods in the third-stage part are listed as follows: (1) The electromagnetic torque of generator is realized through the armature winding cutting the magnetic induction wire, and it is relative with the output current of generator. Therefore, adjusting the load to control the current could realize the regulation of the electromagnetic torque of generator (Aliprantis et al., 2000). The current in the load circuit could be regulated by an adjustable electronic load (Kuai and Yuvarajan, 2006; Serban et al., 2006). (2) The permanent magnet synchronous generator is commonly used in the WECs, and the energy loss includes the mechanical loss and electrical loss (Tommaso et al., 2006; Duan et al., 2012). During the calibration process of the energy conversion efficiency of generator, the energy conversion efficiency of the model generator would be much closer to that of the prototype under the same speed and torque by adjusting the mechanical parameters of the model generator.
The second-stage part connects the oscillating buoy and generator, and plays the role of transforming the energy form. The feasibility of model scale design is the key issue in the integrate physical model test. Similar with the second-stage part, the energy conversion efficiency in the prototype and scaled model also must be satisfied preferentially as the similarity criteria in the second-stage energy conversion.
The PTO force transmitted to the first-stage part is considered as the dominant scale factor in the second-stage energy conversion. When the PTO force satisfies the Froude similarity, the output power of first-stage energy conversion would also satisfy the similarity requirement, which is also the input power of second-stage energy conversion. Under the condition of electromagnetic torque of generator satisfying the similarity requirement, the output power with the speed and torque of second-stage energy conversion would also satisfy the similarity requirement when the energy conversion efficiency of second-stage energy conversion is the same in the prototype and scaled model. However, it is difficult to realize the same energy conversion efficiency of second-stage energy conversion with the reason of difficult control of energy loss. Considering the accuracy of physical model test, the energy loss should be calibrated between the prototype and scaled model when the energy loss is large.
The regulation methods in the second-stage part are listed as follows: (1) The accurately controlled components of hydraulic PTO device, including the hydraulic cylinder, accumulator, valves group, and hydraulic motor, etc., should be used in the model test to realize the accurately controlled PTO force to satisfy the similarity requirement (Henderson, 2006; Josset et al., 2007). (2) The energy loss in the hydraulic PTO device includes the viscous friction loss of fluid and the friction loss between components (Cristescu et al., 2016, 2017). The model test calibration method is suggested to keep the power loss similar in the prototype and scaled model, and the calibration results would directly influence the accuracy of model test results.
In the physical model test, the maximum disadvantage of mechanical PTO is that the PTO force could not be accurately controlled, so the model scale method shown in section “Second-Stage Energy Conversion” could not be used. Considering the PTO force as the dominant mechanical factor, using the load of generator to indirectly control the PTO force is proposed, and this method needs to consider the model scale in the second-stage and third-stage together.
The first-stage part in the hydraulic PTO or mechanical PTO both needs to be model scaled independently, and the similarity requirement and dominant factor are the same as shown in section “First-Stage Energy Conversion”.
There is no fluid-structure interaction in the second-stage and third-stage parts, so the geometrical similarity could be ignored. The energy conversion efficiency in the prototype and scaled model must be satisfied preferentially as the similarity criteria in the second-stage and third-stage energy conversion.
The PTO force transmitted to the first-stage part is considered as the dominant scale factor in the integrated second-stage and third-stage energy conversion, and the aim is to satisfy the Froude similarity in the first-stage energy conversion. Due to the difficult estimation and control of energy loss of the mechanical PTO force, the energy loss of second-stage and third-stage energy conversion should be calibrated together between the prototype and scaled model. The input power and output electric power of second-stage and third-stage energy conversion should also satisfy the power similarity.
The regulation method in the second-stage and third-stage parts is listed as follows: (1) The control of PTO force is realized through adjusting the current of generator load circuit. This process needs to combinedly calibrate and establish the relationship between the PTO force and the current of generator load circuit, considering the second-stage and third-stage parts together. (2) The combined calibration of energy conversion efficiency in the second-stage and third-stage energy conversion could be realized through adjusting the mechanical parameters to keep the energy loss satisfy the similarity requirement (De Backer et al., 2009). Due to the high complex structure, the calibration effect usually is worse than that in section “WEC with Hydraulic PTO”.
Regarding the physical model scale requirement of oscillating buoy WEC using hydraulic or mechanical PTO device, the similarity criteria, dominant scale factors, and the corresponding calibration strategies in the three stages energy conversion are summarized in Table 2.
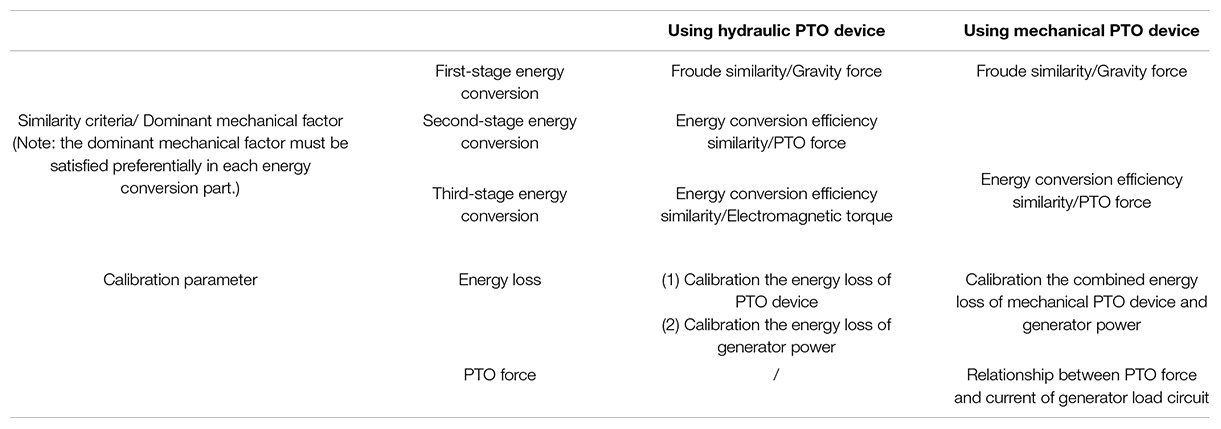
Table 2. Scaling orchestration of the oscillating buoy WEC.
In this paper, the requirements of model scale similarity in the physical model test of oscillating buoy WEC are focused. Based on the working principle, the energy conversion process is divided into three independent stages. The model scale schemes of oscillating buoy WEC using the hydraulic and mechanical PTO device are proposed to provide guidance and fundamental understanding for the physical model test design. Some conclusions are obtained:
(1) In the first-stage part, the Froude similarity should be considered as the dominant criteria, and the energy conversion efficiency similarity should be considered as the dominant criteria in the second-stage and third-stage parts.
(2) The geometrical similarity should be only considered in the first-stage part, while it could be ignored in the second-stage and third-stage parts.
(3) In the second-stage and third-stage parts, the transmitted power and the dominant mechanical factor also need to be satisfied with the Froude similarity.
(4) The dominant mechanical factors must be satisfied preferentially and calibrated accurately in each energy conversion part, which determine the success of physical model test.
(5) The calibration accuracy of PTO force and energy loss is the core difficult problem still need to be improved.
The datasets generated for this study are available on request to the corresponding authors.
DQ and DN proposed the conceptualization. GZ wrote the manuscript draft. HL and JY provided research methodology. BL provided research advice. All authors contributed to the article and approved the submitted version.
This work was supported by National Key R&D Program of China (Grant No. 2018YFB1501905); and the Fundamental Research Funds for the Central Universities.
BL was employed by the company Sortec Offshore Pte. Ltd.
The remaining authors declare that the research was conducted in the absence of any commercial or financial relationships that could be construed as a potential conflict of interest.
Ahamed, R., McKee, K., and Howard, I. (2020). Advancements of wave energy converters based on power take off (PTO) systems: a review. Ocean Eng. 204:107248. doi: 10.1016/j.oceaneng.2020.107248
Aliprantis, D., Papathanassiou, S., Papadopoulos, M., and Kladas, A. (2000). “Modeling and control of a variable-speed wind turbine equipped with permanent magnet synchronous generator,” in Proceedings of ICEM, Helsinki.
Astariz, S., and Iglesias, G. (2015). The economics of wave energy: a review. Renew. Sustain. Energy Rev. 45, 397–408. doi: 10.1016/j.rser.2015.01.061
Babarit, A. (2015). A database of capture width ratio of wave energy converters. Renewable Energy 80, 610–628. doi: 10.1016/j.renene.2015.02.049
Barenblat, G. (1996). Scaling, Self-similarity and Intermediate Asymptotics. Cambridge: Cambridge University Press. doi: 10.1017/CBO9781107050242
Chakrabarti, S. (1998). Physical model testing of floating offshore structures. Paper Presented at the Dynamic Positioning Conference, Houston, TX.
Clément, A., McCullen, P., Falcão, A., Gardner, F., Hammarlund, K., Lemonis, G., et al. (2002). Wave energy in Europe: current status and perspectives. Renew. Sustain. Energy Rev. 6, 405–431. doi: 10.1016/S1364-0321(02)00009-6
Cristescu, C., Dumitrescu, C., Vrânceanu, G., and Dumitrescu, L. (2016). Considerations on energy losses in hydraulic drive systems. Hidraulica Magazine 36–46.
Cristescu, C., Radoi, R., Dumitrescu, C., and Dumitrescu, L. (2017). Experimental research on energy losses through friction in order to increase lifetime of hydraulic cylinders. Paper Presented at the IOP Conference Series: Materials Science and Engineering, Galati. doi: 10.1088/1757-899X/174/1/012011
Cui, L., Wang, H., Xiong, Y., Guo, Y., Huang, Y., Wang, X., et al. (2009). The research on conversion efficiency testing technology of ocean wave power generation system in laboratory. Ocean Technol. 28, 115–118.
De Backer, G., Vantorre, M., De Beule, K., Beels, C., and De Rouck, J. (2009). Experimental investigation of the validity of linear theory to assess the behaviour of a heaving point absorber at the belgian continental shelf. Paper presented at the ASME 2009 28th International Conference on Ocean, Offshore and Arctic Engineering, Honolulu, HI. doi: 10.1115/OMAE2009-79781
Drew, B., Plummer, A. R., and Sahinkaya, M. N. (2009). A review of wave energy converter technology. Proce. Institution Mech. Eng. Part A. Power Energy 223, 887–902. doi: 10.1243/09576509JPE782
Duan, J., Zhao, K., Sun, L., Wang, Y., and Deng, X. (2012). Optimal efficiency joint control for permanent magnet synchronous generators. Trans. China Electrotechnical Soc. 27, 49–55.
Falcão, A. F. d. O (2010). Wave energy utilization: a review of the technologies. Renew. Sustain. Energy Rev. 14, 899–918. doi: 10.1016/j.rser.2009.11.003
Felder, S., and Chanson, H. (2009). Turbulence, dynamic similarity and scale effects in high-velocity free-surface flows above a stepped chute. Exp. Fluids 47, 1–18. doi: 10.1007/s00348-009-0628-3
Fitzgerald, J., and Bergdahl, L. (2009). Rigid moorings in shallow water: a wave power application. Part I: experimental verification of methods. Mar. Struct. 22, 809–835. doi: 10.1016/j.marstruc.2009.09.002
Foss, J., Panton, R., and Yarin, A. (2007). “Nondimensional representation of the boundary-value problem,” in Springer Handbook of Experimental Fluid Mechanics(Part A), eds C. Tropea, A. L. Yarin, and J. F. Foss (Berlin: Springer), 33–82. doi: 10.1007/978-3-540-30299-5_2
Frisch, U., and Kolmogorov, A. N. (1995). Turbulence: the Legacy of AN Kolmogorov. Cambridge: Cambridge University Press. doi: 10.1017/CBO9781139170666
Fuchs, H., and Hager, W. H. (2012). Scale effects of impulse wave run-up and run-over. J. Waterway Port Coastal Ocean Eng. 138, 303–311. doi: 10.1061/(asce)ww.1943-5460.0000138
Gaspar, J. F., Calvário, M., Kamarlouei, M., and Guedes Soares, C. (2016). Power take-off concept for wave energy converters based on oil-hydraulic transformer units. Renewable Energy 86, 1232–1246. doi: 10.1016/j.renene.2015.09.035
Gratton, J. (1991). Similarity and self similarity in fluid dynamics. Fundamentals Cosmic Phys. 15, 1–106.
Heath, T., Whittaker, T., and Boake, C. (2001). The design, construction and operation of the LIMPET wave energy converter (Islay, Scotland)[Land Installed Marine Powered Energy Transformer]. Paper Presented at the 4. European Wave Energy Conference, Aalborg.
Heller, V. (2011). Scale effects in physical hydraulic engineering models. J. Hydraulic Res. 49, 293–306. doi: 10.1080/00221686.2011.578914
Heller, V. (2016). Self-similarity and Reynolds number invariance in Froude modelling. J. Hydraulic Res. 55, 293–309. doi: 10.1080/00221686.2016.1250832
Henderson, R. (2006). Design, simulation, and testing of a novel hydraulic power take-off system for the Pelamis wave energy converter. Renewable Energy 31, 271–283. doi: 10.1016/j.renene.2005.08.021
Holmes, B., and Nielsen, K. (2010). Guidelines for the Development & Testing of Wave Energy Systems. Paris: International Energy Agency.
Hughes, S. A. (1993). Physical Models and Laboratory Techniques in Coastal Engineering. Singapore: World Scientific. doi: 10.1142/2154
Ibarra-Berastegi, G., Sáenz, J., Ulazia, A., Serras, P., Esnaola, G., and Garcia-Soto, C. (2018). Electricity production, capacity factor, and plant efficiency index at the Mutriku wave farm (2014–2016). Ocean Eng. 147, 20–29. doi: 10.1016/j.oceaneng.2017.10.018
IEA (2020). Data and Statistics: Electricity. Available online at: https://www.iea.org (accessed July 16, 2020).
Jonkman, J. (2010). Definition of the Floating System for Phase iv of OC3. Technical Report NREL/TP-500-47535. Golden, CO: National Renewable Energy Laboratory. doi: 10.2172/979456
Josset, C., Babarit, A., and Clément, A. H. (2007). A wave-to-wire model of the SEAREV wave energy converter. Proc. Institution Mech. Eng. Part M J. Eng. Mar. Environ. 221, 81–93. doi: 10.1243/14750902JEME48
Kofoed, J. P., Frigaard, P., Friis-Madsen, E., and Sørensen, H. C. (2006). Prototype testing of the wave energy converter wave dragon. Renewable Energy 31, 181–189. doi: 10.1016/j.renene.2005.09.005
Kuai, Y., and Yuvarajan, S. (2006). An electronic load for testing photovoltaic panels. J. Power Sources 154, 308–313. doi: 10.1016/j.jpowsour.2005.04.016
Lasa, J., Antolin, J. C., Angulo, C., Estensoro, P., Santos, M., and Ricci, P. (2012). Design, construction and testing of a hydraulic power take-off for wave energy converters. Energies 5, 2030–2052. doi: 10.3390/en5062030
Le Méhauté, B., and Hanes, D. M. (2005). Ocean Engineering Science, Vol. 9. Cambridge, MA: Harvard University Press.
Ma, C., and Xia, D. (2016). On the development and utilization countermeasures of marine renewable energy in China. Ocean Dev. Manage. 33, 51–56.
Mahmud, S., Nik, W. W., and Bakar, A. A. (2018). A preliminary review of the potential area to deploy wave energy converter in kuala terengganu shoreline. Paper Presented at the 11th International Conference on Marine Technology, Kuala Lumpur.
Mangalekar, Y. V., and Ugale, R. T. (2015). Electric motor power quality assessment using LabVIEW based smart power analyzer. Paper Presented at the 2015 IEEE Recent Advances in Intelligent Computational Systems (RAICS), Trivandrum. doi: 10.1109/RAICS.2015.7488435
Massey, B. S. (1989). Mechanics of Fluids, 6th Edn. London: Chapman and Hall. doi: 10.1007/978-1-4615-7408-8
Medina-Lopez, E., Allsop, W., Dimakopoulos, A., and Bruce, T. (2015). Conjectures on the Failure of the OWC Breakwater at Mutriku. Paper Presented at the COASTAL Structures and Solutions to Coastal Disasters Joint Conference, Boston, MA.
Mork, G., Barstow, S., Kabuth, A., and Pontes, M. T. (2010). Assessing the global wave energy potential. Paper presented at the International Conference on Offshore Mechanics and Arctic Engineering, Shanghai. doi: 10.1115/OMAE2010-20473
Murzyn, F., and Chanson, H. (2008). Experimental assessment of scale effects affecting two-phase flow properties in hydraulic jumps. Exp. Fluids 45, 513–521. doi: 10.1007/s00348-008-0494-4
Newman, J. N. (1977). Marine Hydrodynamics. Cambridge, MA: The MIT press. doi: 10.7551/mitpress/4443.001.0001
Palha, A., Mendes, L., Fortes, C. J., Brito-Melo, A., and Sarmento, A. (2010). The impact of wave energy farms in the shoreline wave climate: Portuguese pilot zone case study using Pelamis energy wave devices. Renewable Energy 35, 62–77. doi: 10.1016/j.renene.2009.05.025
Payne, G. (2008). Guidance for the experimental tank testing of wave energy converters. SuperGen Marine 254, 1–51.
Pecher, A., and Peter, K. J. (2017). Handbook of Ocean Wave Energy. Berlin: Springer Nature. doi: 10.1007/978-3-319-39889-1
Penalba, M., and Ringwood, J. (2016). A review of wave-to-wire models for wave energy converters. Energies 9:506. doi: 10.3390/en9070506
Pendar, M., and Sarjan, H. (2019). Design, fabrication, and testing of a shore-line wave energy converter with mechanical gear motion rectifier. Paper Presented at the 27th Iranian Conference on Electrical Engineering (ICEE), Yazd. doi: 10.1109/IranianCEE.2019.8786426
Pérez-Collazo, C., Greaves, D., and Iglesias, G. (2015). A review of combined wave and offshore wind energy. Renewable Sustain. Energy Rev. 42, 141–153. doi: 10.1016/j.rser.2014.09.032
Prado, M., and Polinder, H. (2013). Electrical Drives for Direct Drive Renewable Energy Systems. Sawston: Woodhead Publishing Limited.
Price, A. A. E., Dent, C. J., and Wallace, A. R. (2009). On the capture width of wave energy converters. Appl. Ocean Res. 31, 251–259. doi: 10.1016/j.apor.2010.04.001
Serban, I., Ion, C., Marinescu, C., and Cirstea, M. (2006). Electronic load controller for stand-alone generating units with renewable energy sources. Paper Presented at the IECON 32nd Annual Conference on IEEE Industrial Electronics, Paris. doi: 10.1109/IECON.2006.347688
Sheng, W. (2019). Wave energy conversion and hydrodynamics modelling technologies: a review. Renewable Sustain. Energy Rev. 109, 482–498. doi: 10.1016/j.rser.2019.04.030
Sheng, W., Alcorn, R., and Lewis, T. (2014). Physical modelling of wave energy converters. Ocean Eng. 84, 29–36. doi: 10.1016/j.oceaneng.2014.03.019
Sheng, W., and Lewis, A. (2012). Assessment of wave energy extraction from seas: numerical validation. J. Energy Resources Technol. 134:8. doi: 10.1115/1.4007193
Tao, L., and Dray, D. (2008). Hydrodynamic performance of solid and porous heave plates. Ocean Eng. 35, 1006–1014. doi: 10.1016/j.oceaneng.2008.03.003
Thinh, V. H., and Binh, P. C. (2019). A study on the wave energy converter using mechanical PTO. Paper Presented at the 2019 International Conference on System Science and Engineering (ICSSE), Dong Hoi. doi: 10.1109/ICSSE.2019.8823115
Tommaso, A. O. D., Miceli, R., Galluzzo, G. R., and Trapanese, M. (2006). Efficiency control for permanent magnet synchronous generators. Paper presented at the IEEE International Conference on Industrial Technology, Mumbai. doi: 10.1109/ICIT.2006.372565
Valério, D., Beirão, P., and Sá da Costa, J. (2007). Optimisation of wave energy extraction with the archimedes wave swing. Ocean Eng. 34, 2330–2344. doi: 10.1016/j.oceaneng.2007.05.009
Vassalos, D. (1998). Physical modelling and similitude of marine structures. Ocean Eng. 26, 111–123. doi: 10.1016/S0029-8018(97)10004-X
Washio, Y., Osawa, H., Nagata, Y., Fujii, F., Furuyama, H., and Fujita, T. (2000). The offshore floating type wave power device “mighty whale”: open sea tests. Paper Presented at the The 10th International Offshore and Polar Engineering Conference, Seattle, WA.
Xu, Q., Li, Y., Yu, Y.-H., Ding, B., Jiang, Z., Lin, Z., et al. (2019). Experimental and numerical investigations of a two-body floating-point absorber wave energy converter in regular waves. J. Fluids Struct. 91:102613. doi: 10.1016/j.jfluidstructs.2019.03.006
Keywords: wave energy converter, oscillating buoy, physical model test, similarity criteria, scaling orchestration
Citation: Qiao D, Zhi G, Liang H, Ning D, Yan J and Li B (2021) Scaling Orchestration in Physical Model Test of Oscillating Buoy Wave Energy Converter. Front. Mar. Sci. 8:627453. doi: 10.3389/fmars.2021.627453
Received: 09 November 2020; Accepted: 26 January 2021;
Published: 26 February 2021.
Edited by:
Kathleen Aviso, De La Salle University, PhilippinesReviewed by:
Nicolaos Theodossiou, Aristotle University of Thessaloniki, GreeceCopyright © 2021 Qiao, Zhi, Liang, Ning, Yan and Li. This is an open-access article distributed under the terms of the Creative Commons Attribution License (CC BY). The use, distribution or reproduction in other forums is permitted, provided the original author(s) and the copyright owner(s) are credited and that the original publication in this journal is cited, in accordance with accepted academic practice. No use, distribution or reproduction is permitted which does not comply with these terms.
*Correspondence: Haizhi Liang, bXJfbGlhbmdva0AxNjMuY29t; Dezhi Ning, ZHpuaW5nQGRsdXQuZWR1LmNu
Disclaimer: All claims expressed in this article are solely those of the authors and do not necessarily represent those of their affiliated organizations, or those of the publisher, the editors and the reviewers. Any product that may be evaluated in this article or claim that may be made by its manufacturer is not guaranteed or endorsed by the publisher.
Research integrity at Frontiers
Learn more about the work of our research integrity team to safeguard the quality of each article we publish.