 Delei Li1,2,3*
 Joanna Staneva4*
 Jean-Raymond Bidlot5
 Sebastian Grayek4
 Yuchao Zhu1,2,3
 Baoshu Yin1,2,3,6,7*
- 1CAS Key Laboratory of Ocean Circulation and Waves, Institute of Oceanology, Chinese Academy of Sciences, Qingdao, China
- 2Center for Ocean Mega-Science, Chinese Academy of Sciences, Qingdao, China
- 3Pilot National Laboratory for Marine Science and Technology, Qingdao, China
- 4Institute of Coastal Research, Helmholtz Zentrum Geesthacht, Geesthacht, Germany
- 5European Centre for Medium-Range Weather Forecasts (ECMWF), Reading, United Kingdom
- 6College of Earth and Planetary Sciences, University of Chinese Academy of Sciences, Beijing, China
- 7CAS Engineering Laboratory for Marine Ranching, Institute of Oceanology, Chinese Academy of Sciences, Qingdao, China
The ability of forecasting systems to simulate tropical cyclones is still insufficient, and currently, there is an increased interest in improving model performance for intense tropical cyclones. In this study, the impact of reducing surface drag at high wind speeds on modeling wind and wave conditions during the super Typhoon Lingling event over the northwest Pacific Ocean in 2019 is investigated. The model response with respect to the parameterization for momentum exchange at the ocean surface is demonstrated using a fully coupled regional atmosphere model (the Consortium for Small-Scale Modeling-Climate Limited-area Modeling, CCLM) and a wind wave model (WAM). The active two-way coupling between the atmosphere and ocean waves model is enabled through the introduction of sea state-dependent surface drag into the CCLM and updated winds into the WAM. The momentum exchange with the sea surface is modeled via the dependency of the roughness length (Z0) on the surface stress itself and, when applicable, on the wind speed. Several high-resolution runs are performed using one-way or two-way fully coupled regional atmosphere-wave (CCLM-WAM) models. The model simulations are assessed against the best track data as well as against buoy and satellite observations. The results show that the spectral nudging technique can improve the model’s ability to capture the large-scale circulation, track and intensity of Typhoon Lingling at regional scales. Under the precondition of large-scale constraining, the two-way coupling simulation with the proposed new roughness parameterization performs much better than the simulations used in older studies in capturing the maximum wind speed of Typhoon Lingling due to the reduced drag at extreme wind conditions for the new Z0.
Introduction
The air-sea interaction plays an important role in the coupled climate system through radiative exchanges, energy, mass, and momentum fluxes (Cavaleri et al., 2012a). The momentum flux at the air-sea interface not only is significant in determining the vertical structure of the lower part of the atmosphere boundary layer and the atmospheric circulation patterns (Janssen et al., 2002), but also greatly impacts wave dissipation and breaking as well as ocean circulation (Cavaleri et al., 2012a; Breivik et al., 2015). The transfer of momentum is usually parameterized in terms of drag coefficient or roughness length (Holthuijsen et al., 2012), which is the key element for wind and wave modeling. However, the impact of wind waves on air-sea interaction processes is usually neglected in coupled models for both forecasting and climate purposes. One reason for this is that the space and time scales of surface waves are much smaller than the atmosphere and ocean dynamic scales (Hasselmann, 1991). At the European Centre for Medium-range Weather Forecasts (ECMWF), the wave spectral model EC-WAM has been used for the fully coupled system since 1998 (Janssen, 2004). More recently, wave models have been implemented in many coupled model systems, and the impact of wind waves on air-sea interaction processes has been demonstrated at global and regional scales (Warner et al., 2010; Qiao et al., 2013; Breivik et al., 2015; Wahle et al., 2017).
Sea surface roughness determines the momentum and heat fluxes between the atmosphere and ocean and can affect climate and individual weather events (Moon et al., 2004; Wu et al., 2016; Staneva et al., 2017). Under swell conditions, surface waves can affect atmospheric mixing in neutral to slightly unstable stratified atmospheres (Rutgersson et al., 2012; Wu et al., 2017). In stand-alone atmospheric regional models, the roughness length over water surfaces is usually parameterized as a function of wind speed (e.g., Doms et al., 2011). However, since the roughness length is often underestimated by the atmospheric model (Wu et al., 2017), different modifications of the roughness parameterization have been implemented. However, tuning the parameters in the atmospheric model does not account for the non-linear interactions between the atmosphere and waves and is insufficient to replace the coupling between waves, especially during extreme storm conditions (Wahle et al., 2017; Wiese et al., 2019; Li et al., 2020). If an active sea state is considered, the roughness is estimated by the ocean wave model, which accounts for swell and wave age (e.g., Janssen et al., 2002; Wu et al., 2017; ECMWF, 2019). Active wave and atmosphere coupling yields modified roughness lengths over ocean surfaces (Lionello et al., 1998; Katsafados et al., 2016), which further affects the overlying atmosphere (Janssen, 2004; Wiese et al., 2019).
In many parameterizations, the increased roughness length for low wind speed calculated by the wave model potentially leads to an enhanced heat flux, which becomes essential for hurricane studies as it leads to an intensification of the hurricane (Bao et al., 2000). For hurricanes simulations, the decrease or saturation in surface drag for very high wind speeds shown to be critical leading to improvements in the prediction of intensification and decay of tropical cyclones (Chen et al., 2013; Donelan, 2018).
At the atmosphere-ocean interface, the momentum flux also plays a significant role in the momentum balance. It leads to a cross-isobar flow. As a result, low-pressure systems fill more quickly (Janssen, 2004). Over the ocean, this flux depends on the sea state. In particular, young sea states are associated with rough air flow and high friction. Hence, substantial changes in the surface roughness and friction velocity occur in areas of young sea states (Janssen et al., 2002).
Consequently, the enhanced transfer of momentum leads to more direct air flow into the center of the low-pressure system, and thus, the system fills up more quickly. This further tends to fill low-pressure systems (Janssen, 2004). Therefore, the effects that wind waves have on the evolution of a low-pressure system are determined by the dominant processes through which the system develops (momentum or heat). When an atmospheric model is coupled with a wave model, the momentum flux affected by wind waves causes less deepening of extratropical lows during the model simulation (Janssen, 2004). On the other hand, Bao et al. (2000) demonstrated that a hurricane can become deeper due to the coupling between the atmospheric and the wave model. The feedbacks between wind waves and the atmosphere create non-linear interactions within the dynamic structure of a storm or cyclone (Katsafados et al., 2016), leading to a thicker and more turbulent boundary layer.
Over the past decades, many parameterization schemes of sea surface roughness length and drag coefficient have been developed through wind and/or wave parameters such as 10 m wind speed, wave steepness, and wave age (Charnock, 1955; Wu, 1982; Taylor and Yelland, 2001; Guan and Xie, 2004; Edson et al., 2013; Donelan, 2018). Based on dimensional reasoning, Charnock (1955) proposed the Charnock relation, which indicates an increase in roughness length with increasing wind speed. Kitaigorodskii and Volkov (1965) suggested that the Charnock constant should depend on the fetch and the duration of the wind event. Hsu (1974) proposed that the Charnock constant should be proportional to the wave steepness. The wave age-dependent Charnock relation was later qualitatively supported by Donelan (1982). Taylor and Yelland (2001) proposed a sea surface roughness length parameterization based on the height and steepness of waves and demonstrated that it can accurately predict the behavior of the drag coefficient observed in wave tanks, lakes, and the open ocean. Based on composite datasets collected from different conditions, Drennan et al. (2005) found that the wave-age-dependent formulation performs better than the wave-steepness-dependent formulation for underdeveloped young wind-sea conditions, while the steepness-dependent formulation outperforms the wave-age-dependent formulation for general mixed sea conditions. Edson et al. (2013) found that the sea surface roughness formulation based on wind speed and wave age yields similar results for wind speeds of 5–25 m/s over open water since the inverse wave age varies linearly with wind speed under 25 m/s. Many other studies have proposed various forms of parameterization schemes based on wind speed (Fairall et al., 2003) or wave age (Johnson et al., 1998; Gao et al., 2006).
An empirical quadratic equation to parameterize the drag coefficient from the 10-m wind speed is proposed by Green and Zhang (2013). A parabolic model of the drag coefficient for storm surge simulations in the South China Sea is implemented by Peng and Li (2015). A semi-empirical model for estimating the foam impact on the variation of the drag coefficient was used in Golbraikh and Shtemler (2016). Donelan (2018) proposed a Reynolds number dependence of the oceanic sheltering coefficient, as well as a drag coefficient function of Reynolds number, wave age, and wind speed, and showed that the drag coefficient reached its peak at a wind speed of 30 m/s.
Studies have revealed that drag coefficients linearly increase with wind speed, as supported by field observations at low to moderate wind speeds (Wu, 1982; Petersen and Renfrew, 2009). However, according to field and laboratory observations, the drag coefficient saturates or even decreases for high wind speeds, but the values at which the drag coefficient levels off vary (Powell et al., 2003; Donelan et al., 2004; Zweers et al., 2010). Based on wind profiles from global positioning system (GPS) radiosondes released in tropical cyclones, Powell et al. (2003) found that the drag coefficient decreases at 33 m/s and decreases significantly from 40 m/s to 51 m/s. Using even more wind profiles from GPS radiosondes, Holthuijsen et al. (2012) found that the drag coefficient levels off at wind speeds of 30–35 m/s and that the roughness decreases to virtually zero by 80 m/s wind speed. According to laboratory extreme wind experiments, Donelan et al. (2004) concluded that the aerodynamic roughness saturates at a wind speed of 33 m/s. In contrast, Bi et al. (2015) found that the drag coefficient reaches a peak value of 0.002 at a wind speed of 18 m/s and decreases with increasing wind speed between 18 and 27 m/s. Other studies also reported different wind speeds at which the drag coefficient peaks, such as 30–40 m/s (Makin, 2005) or approximately 30 m/s (Zweers et al., 2010). Zhao et al. (2015) indicated that the drag coefficient peaks at a wind speed of 24 m/s in the coastal regions of the South China Sea, which is 5–15 m/s lower than that over the deep sea. Gao et al. (2020) showed that the relationship between the drag coefficient and wind speed has a parabolic form and that the saturated wind speed threshold is 22.33 m/when regressed from the drag coefficient.
The parameterization schemes of saturated or reduced drag coefficients at high wind speeds have been implemented or considered in atmospheric models (Zweers et al., 2010, 2015), ocean models (Zedler et al., 2009; Walsh et al., 2010), wave models (Moon et al., 2008), and atmosphere-ocean coupled models (Chen et al., 2018), showing improvements in modeling hurricane intensity, wave height and sea surface cooling. However, most implemented parameterizations are simple functions of wind speed and do not consider the impact of wave state on roughness length or drag coefficient. Recent state-of-the-art atmosphere-ocean wave coupled models (Liu et al., 2012a; Rizza et al., 2018; Kumar et al., 2020) consider the impact of reduced sea surface roughness at high wind speeds on air-sea interactions by using sea-spray related parameterization (Liu et al., 2012b; Wu et al., 2015), which leads to improvement in modeling observed cyclone features.
The regional atmosphere model CCLM has already been used in several studies coupled with waves (Cavaleri et al., 2012b; Wahle et al., 2017; Wiese et al., 2019). Skill assessments of the CCLM fully coupled to the wave model WAM over the East China Sea were performed by Li et al. (2020). Their results indicated that downscaled simulations tend to be closer to in situ observations than ERA5 reanalysis data in capturing wind variability and probability distribution; however, the biases during the extreme wind conditions were still high.
In addition to air-sea interactions, large-scale circulation is also significant for the modeling of typhoons, especially for typhoon development (Chan and Gray, 1982). It is essential for a regional atmospheric model to capture the large-scale background circulation appropriately by using spectral nudging (von Storch et al., 2000).
The present study investigates the impact of large-scale constraining and reduced surface drag at high wind speeds on modeling wind and wave conditions of super Typhoon Lingling. This typhoon featured an estimated maximum wind speed of 55 m/s and an estimated minimum sea level pressure of 930 hPa. It occurred in the northwest Pacific Ocean from 2 to 8 September 2019 and made landfall in North Korea. We conducted a series of experiments considering the spectral nudging technique and a newly introduced and further modified roughness length parameterization (ECMWF, 2020). The model simulations have been assessed against both coastal buoy observations and multisource satellite data. This parameterization considers both low and high wind regimes. It has been implemented in the ECMWF Integrated Forecasting System (IFS) CY47R1 and shows improvement in the relationship between maximum wind speed and minimum mean sea level pressure for tropical cyclones (Bidlot et al., 2020).
The paper is organized as follows. Section “Experimental Setups and Datasets” introduces the experimental setups and datasets. Section “Results” presents the results, including the validation of simulated wind and waves, and the investigation of the impacts of large-scale constraining and new parameterization. The summary and discussion are given in section “Summary and Discussion.”
Experimental Setups and Datasets
Model Description and Simulation Setups
The atmosphere-wave coupled model system used in this study consists of three components: a non-hydrostatic atmospheric model CCLM (Rockel et al., 2008), a third-generation wave model WAM (Group, 1988) and a model coupling interface OASIS3-MCT (Valcke, 2013), which allows synchronized exchanges of coupling information between the atmospheric model CCLM and the wave model WAM.
Atmospheric and Wave Models
The non-hydrostatic atmospheric model CCLM version 5.6 was used in the coupled model system. It is the climate version of the operational weather forecast model COSMO, which was developed by the German Weather Service (Rockel et al., 2008). The CCLM has been widely used for regional atmospheric simulations on time scales up to centuries and spatial resolutions between 1 and 50 km (e.g., Li, 2017; Li et al., 2019).
The wind wave model used in this study is WAM cycle 4.7, which maintains the basic physics and numerics of the WAM model as in Staneva et al. (2015). The source function integration scheme follows Hersbach and Janssen (1999). The wave parameterizations for wind input and whitecap dissipation of Ardhuin et al. (2010) were incorporated in the WAM version used here (ECMWF, 2019). The wave model simulations ran in shallow water mode, and wave breaking and depth refraction were taken into consideration.
Coupling of Models
The OASIS3-MCT version 3.0 coupler (Valcke, 2013) was implemented to interactively couple the atmospheric model CCLM and the wave model WAM.
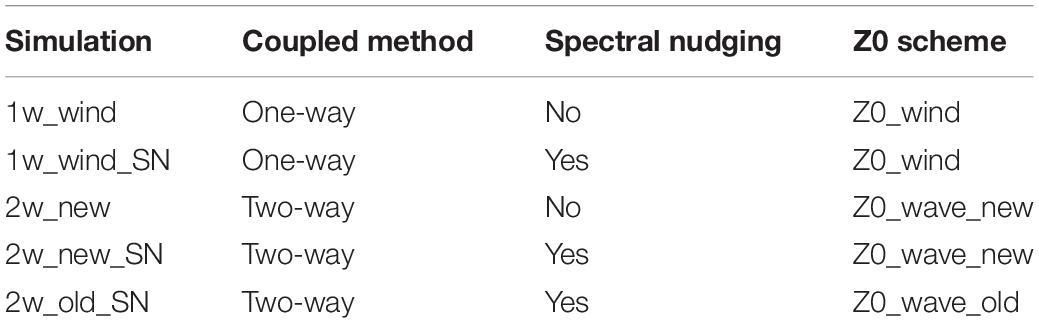
Table 1. Model experiments.
We performed one-way and two-way coupled CCLM-WAM simulations (Table 1, abbreviated as 1w and 2w). For all simulations, the model domain of the CCLM covers the blue rectangular regions shown in Figure 1, encompassing the whole area over which Typhoon Lingling passed. The horizontal resolution is 0.0625° with 200 × 488 grid points in the longitudinal and latitudinal directions. There are 40 vertical layers. Ten grid points are set as a sponge zone at each lateral boundary. The surface (surface specific humidity and sea surface temperature) and lateral boundary conditions are provided at every hour interval using the ECMWF Forecast data (ECMWF, 2019, more details are given in the next section) with a spatial resolution of approximately 9 km.
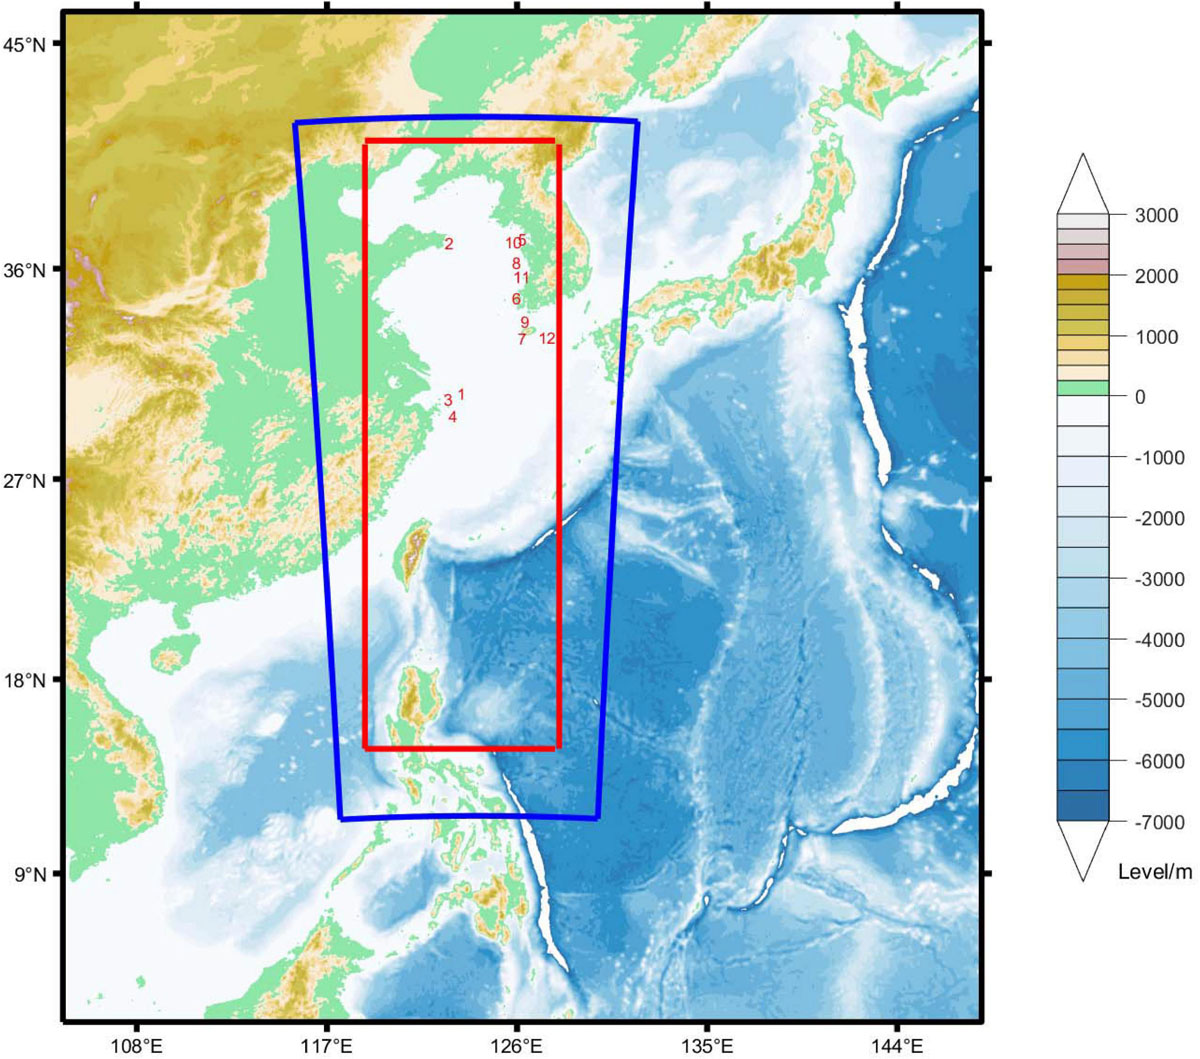
Figure 1. Topography of model areas: The outermost square indicates a domain for WAM simulation over the northwest Pacific region (resolution: 0.1°), the red square indicates the region for fine-resolution (0.05°) WAM simulation and CCLM-WAM coupling nested within the northwest Pacific WAM, and the blue square is the domain of CCLM simulations. Numbers in red indicate the locations of buoy observations (refer to Supplementary Table 1 for details).
The wave simulations over the red rectangle region (Figure 1) feature a spatial resolution of 0.05° (185 × 529 model grid points) forced by CCLM winds through one-way or two-way coupling. The model is downscaled inside a 0.1° northwest Pacific Ocean wave model, forced by ECMWF short-range forecast wind data (ECMWF, 2019). The wave model spectra consist of 36 directions and 30 frequencies, ranging from 0.04 to 0.66 Hz. The model topography is taken from the General Bathymetric Chart of the Oceans 1 min grid data.
In terms of one-way coupled model simulations, the atmospheric model provided wind velocities at 10 m height to the wave model through OASIS3-MCT, while there was no information sent back from the WAM model. For the two-way coupled model, the wave model was forced by wind simulated from the atmospheric model CCLM, and the sea surface roughness length was sent back from the WAM wave model to the atmospheric model CCLM. The spectral nudging technique (von Storch et al., 2000) was applied at every third timestep on horizontal wind fields in levels above 850 hPa for some of the model runs (Table 1). A height-dependent nudging coefficient was used, with value increasing from 850 hPa to upper levels by a square function. One-way coupled simulations with and without spectral nudging (SN) were conducted with wind speed-dependent roughness length parameterization named 1w_wind and 1w_wind_SN in Table 1). The wave-stress dependent roughness length parameterizations for two-way coupled simulations will be introduced in detail in section “Sea Surface Roughness Length Parameterizations.”
The exchange interval between the wave model and the atmosphere model is 6 min. All simulations runs were performed for the period from 27 August to 9 September 2019. The analyses in our study focused on the period from 2 to 7 September, covering the generation to the expiration of Typhoon Lingling over the northwest Pacific Ocean.
Datasets
To evaluate the model skills in capturing the wind and wave conditions during Typhoon Lingling, different wind and wave datasets were used as references, including the forcing ECMWF forecast data, the latest ERA5 reanalysis dataset, and buoy and satellite observations.
ECMWF and ERA5 Data
ECMWF short-range forecast data generated with ECMWF IFS CY46R1 were used to produce the forcing for the atmospheric model and the wave model simulation over the northwest Pacific Ocean. Forecast data from 0 to 12 UTC were collated using forecast steps of 0–11 h to yield an hourly data set. The data have a spatial resolution on the order of 9 km and 137 vertical levels. ECMWF IFS is an Earth System Model consisting of a global atmospheric model, a wave model and an oceanic dynamical model coupled to each other, and there are comprehensive data assimilation systems for the different model components, ingesting many different types of observations (ECMWF, 2019). Many data are used in ECMWF assimilation system, e.g., altimeter wave height data from Jason1/2, CRYOSAT-2, and Saral and backscatter signals for deriving the wind speed of scatterometer data from METOP-A/B were relevant to this work.
ERA5 is the latest global reanalysis dataset developed by the ECMWF, providing hourly estimates of large number of atmospheric, land and oceanic variables (Hersbach et al., 2020). It features a 30 km spatial resolution and 137 vertical levels from the surface to a height of 80 km at an hourly output frequency. The ERA5 reanalysis assimilates vast amounts of historical observations, including the altimeter wave height and scatterometer wind data as in the operational system. In comparison to ERA-interim reanalysis data, ERA5 features a much-improved troposphere, improved representation of tropical cyclones and more consistent sea surface temperature and sea ice values1. ERA-5 reanalysis has also proven to be highly effective in capturing wind and wave conditions over the East China Sea (Li et al., 2020).
Observation Datasets
In this study, the model-simulated wind and wave products are assessed against both in situ buoy observations and satellite observations.
We obtained in situ observations from 12 buoys (see Figure 1 for their locations and Supplementary Table 1 for details) including four buoy observations from the Marine Science Data Center (MSDC) of the Chinese Academy of Sciences, which are not assimilated in ECMWF analysis or ERA5 reanalysis. The Korean data, on the other hand, were obtained by ECMWF via the Global Telecommunication System (GTS), and wind and pressure data were assimilated by ECMWF (wave buoy data are not assimilated). The data were retrieved from the ECMWF archive. Wind speed and significant wave height are available at all in situ stations for validation. We adjusted the observed wind speed from the observation height to the 10 m height based on an empirical power law (e.g., Tobin et al., 2015).
In terms of satellite data, the wind speed data from Jason-2 and Jason-3 and the significant wave heights from Jason-3, Sentinel-3A, Sentinel-3B, Cryosat-2, and SARAL/ALtiKa were used as references. Their orbit coverage over the research domain during 2 September to 7 September 2019 is given in Supplementary Figure 1. The satellite measurements nearest to the model grid points and within 1 h from the simulated full hour were averaged and assigned as observations for the specific model grid. To assess the models’ skill in capturing wind and wave conditions, all simultaneous pairs between satellite observations and model grid points were selected if their differences are smaller than 10 m/s (2.5 m) for wind (wave).
Sea Surface Roughness Length Parameterizations
Turbulent momentum fluxes between the ocean and the atmosphere are generally parameterized in terms of the bulk formula drag coefficient (C_d):
where τ is the momentum flux or surface stress, ρair is the surface air density and U10is the wind speed at a height of 10 m above the surface. Under the neutral condition, C_d is usually parameterized as:
where κ is von Karman’s constant 0.4 and z_0 is the roughness length.
For the stand-alone atmospheric model CCLM or for one-way coupled CCLM-WAM model simulations (1w_wind, 1w_wind_SN in this study, Table 1), z_0 is parameterized based on the Charnock formulation (named Z0_wind in Table 1):
where the Charnock parameter α = 0.0123, g is the gravitational acceleration, and u^* is the friction velocity:
Following the work of Janssen (1991), for the two-way coupled CCLM-WAM model simulations, the Charnock parameter α is not constant but depends on the sea state through the wave-induced stress:
where τw is the wave-induced stress representing the momentum flux transferred from the atmosphere to the waves, and the tunable constant α is 0.0065. Therefore, the roughness length is formulated as:
which is abbreviated as Z0_wave_old (Table 1), and the corresponding simulation is 2w_old_SN.
To better fit the roughness length and drag coefficient to observations, a new parameterization scheme for the Charnock parameter has been proposed by Bidlot and implemented in ECMWF model cycle CY47R1 (ECMWF, 2020), which is applicable for high wind speed. Instead of a constant α in Equation (6) for all wind speeds, we set α to be a function of high wind speeds, allowing the Charnock parameter α to reduce sharply for wind speeds higher than 28 m/s and tail off for very high wind speeds (Z0_wave_new in Table 1):
where and =0.0001. Note that in ECMWF, implementation of (7) has used a threshold of 33 m/s rather than 28 m/s.
Figure 2 shows the relationship between the 10 m wind speed and roughness length or drag coefficient for five regional simulations. We find that for wind speeds less than 15 m/s, Z0 is similar among all simulations. However, their patterns vary for wind speeds larger than 15 m/s. Wind-dependent roughness lengths (1w_wind and 1w_wind_SN) increase slowly until approximately 50 m/s, with values smaller than the wave-dependent roughness length between 15 and 35 m/s and larger than 2w_new_SN for wind speeds larger than 35 m/s. In contrast, 2w_old_SN features the largest Z0 values among all simulations. The Z0 values of 2w_new and 2w_new_SN peak at approximately 28 m/s and decrease with wind speeds larger than 28 m/s.
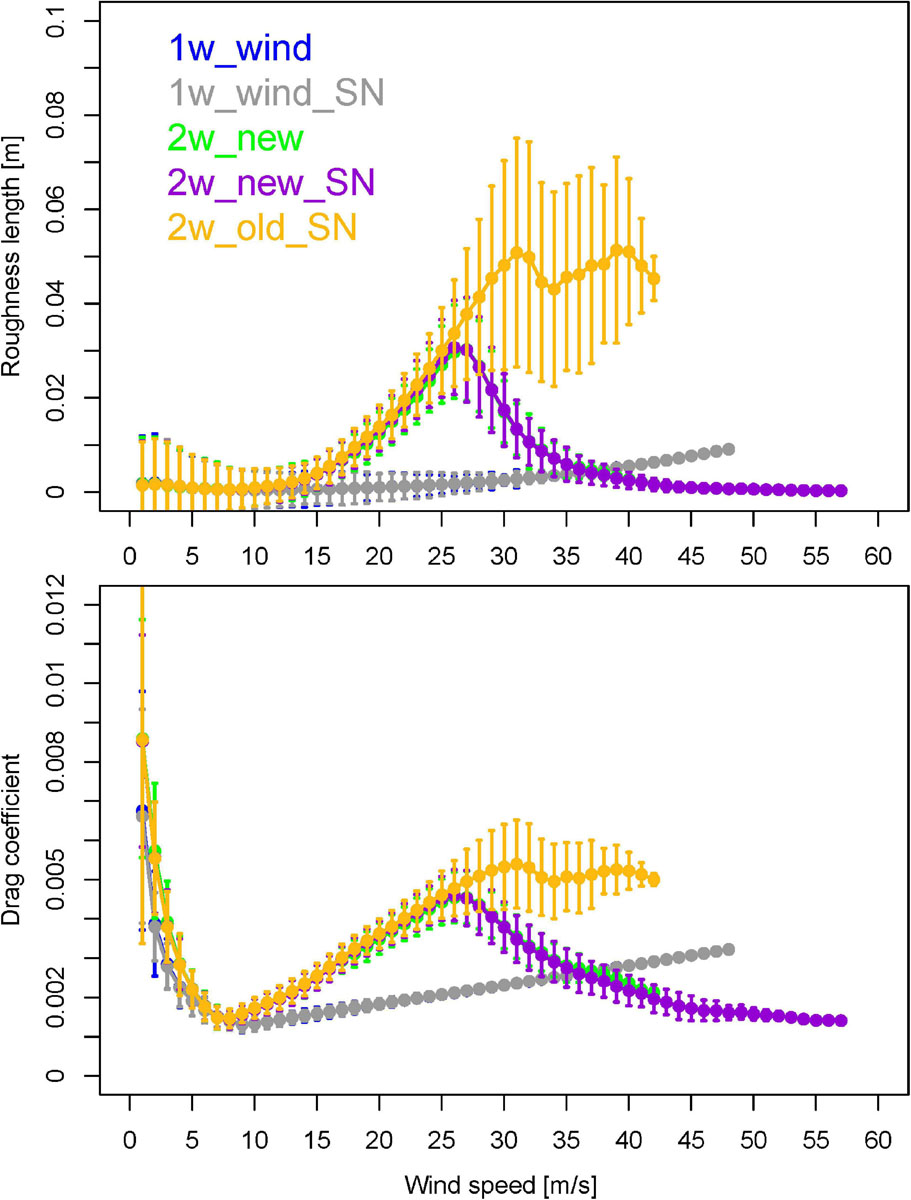
Figure 2. The relationship between wind speed and (upper panel) roughness length, and (lower panel) drag coefficient during Typhoon Lingling (2–7 September 2019) over the coupling domain for the five simulations. Error bars represent one standard deviation for each bin.
For the drag coefficient, we find that the wind-dependent drag coefficients (1w_wind and 1w_wind_SN) increase linearly from approximately 10 m/s to 50 m/s. In comparison, the old wave-dependent drag coefficients for 2w_old_SN features linearly increase between 10 and 30 m/s and saturate for wind speeds larger than 30 m/s. The other two simulations, 2w_new and 2w_new_SN, show similar patterns for Z0 (the upper panel of Figure 2). It is also clear that the drag coefficient for 2w_new_SN is the smallest for extreme wind speeds, and 1w_wind and 1w_wind_SN feature the smallest drag coefficient for wind speeds of 10–35 m/s. This variation in roughness length clearly impacts the wind and wave modeling, as explained in the following section.
Results
Model Validation
Figure 3A shows that our regional model simulations with spectral nudging, ECMWF data and ERA5 reanalysis are consistent with the best track data (BTD)2 in capturing the tracks of Typhoon Lingling. The great circle distances (GCDs, Figure 3B) are generally smaller than 40 km. In contrast, the simulations without spectral nudging do not capture the typhoon tracks well, with GCDs larger than 80 km. In terms of the minimum mean sea level pressure and maximum 10 m wind speed, the lower resolution ERA5 performs the worst among all modeled results. The maximum sea level pressure and maximum wind speed deviations from the observation are more than 50 hPa and 30 m/s, respectively. Overall, we find that simulation 2w_new_SN performs the best, while 1w_wind_SN ranks second. These two simulations show better skills than their counterpart simulations without spectral nudging (2w_new and 1w_wind, respectively). The results indicate the importance of large-scale constraining by spectral nudging to improve the model’s ability to capture the maximum intensity of super typhoons in downscaled regional model simulations. Furthermore, we find that 2w_new_SN is in better agreement with the BTD in capturing maximum wind speed than 2w_old_SN, which implies that the new roughness length formulation performs better than the old formulation. The tracks and the minimum sea level pressure of both simulations are similar. These results indicate that the new roughness length parameterization impacts the maximum wind speed (namely, for wind speeds larger than 28 m/s). However, it does not significantly influence the large-scale circulation patterns, which are also shown in Figures 4D,E.
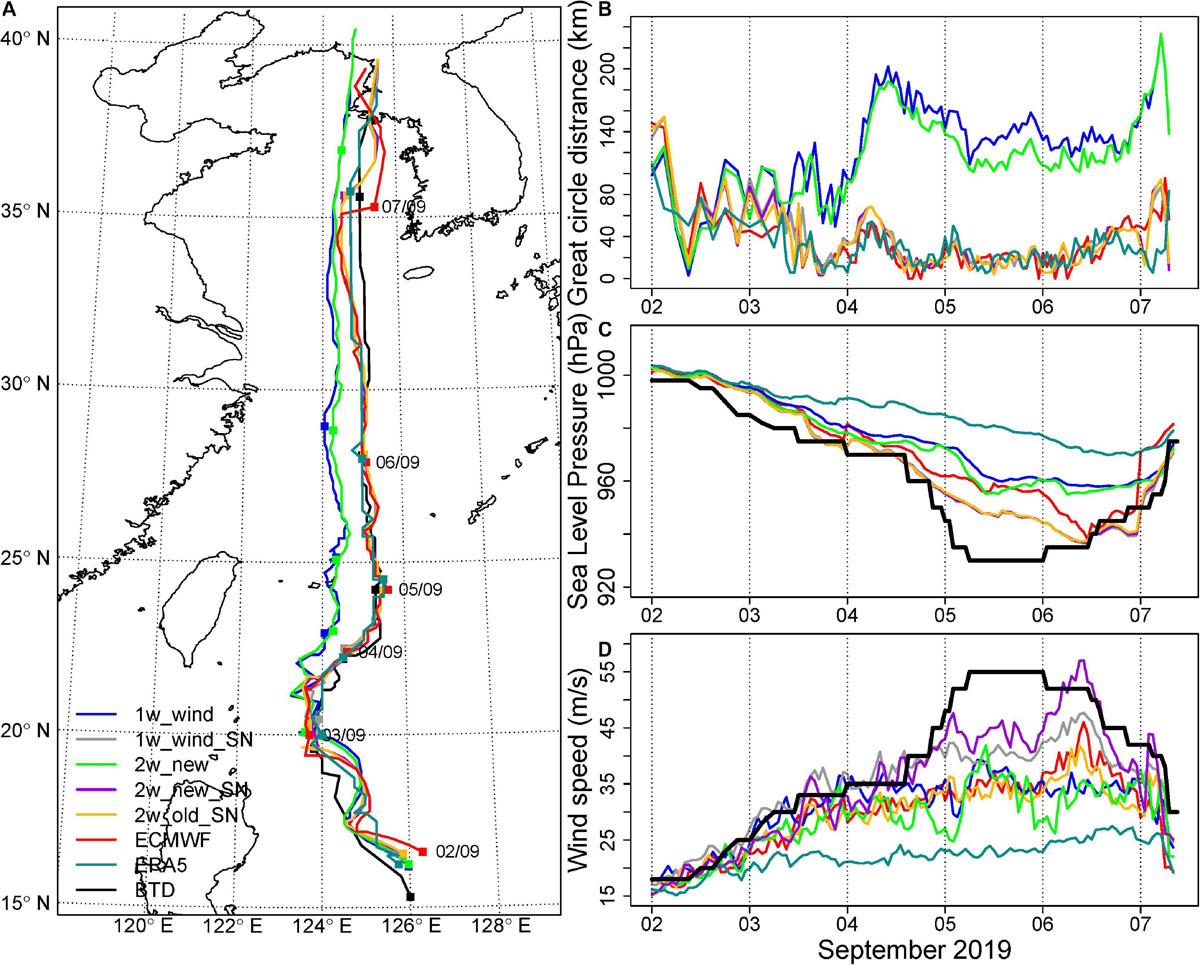
Figure 3. (A) Tracks of Typhoon Lingling from model results and best track data (BTD) from the China Meteorological Agency; time series of (B) great circle distances between modeled and observed tracks, (C) the minimum mean sea level pressure and (D) the maximum 10 m wind speed.
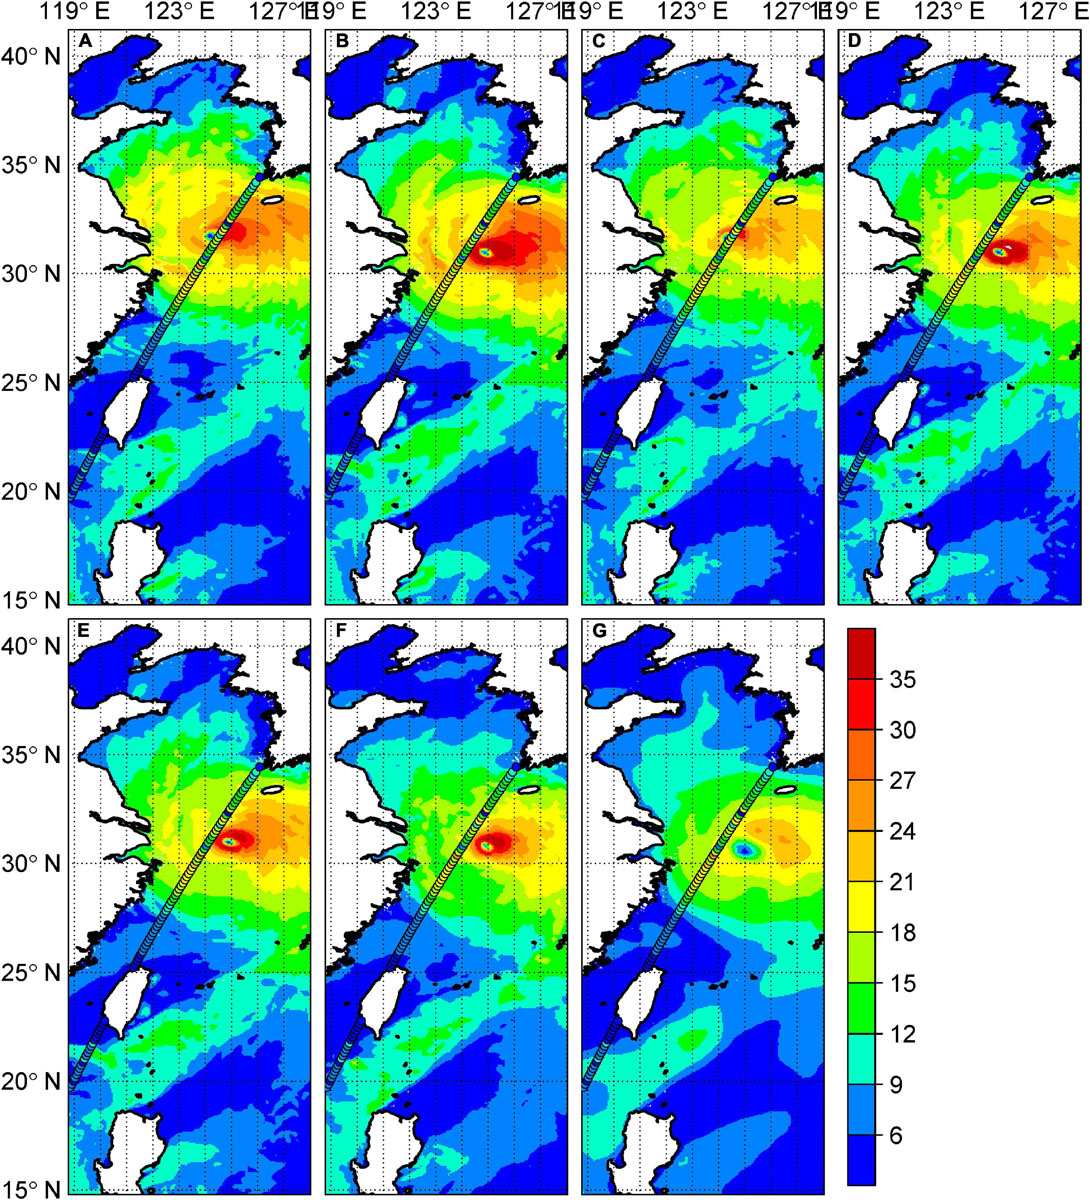
Figure 4. Snapshots of the modeled surface wind speed (m/s) at 10:00 UTC 6 September 2019 for (A) 1w_wind, (B) 1w_wind_SN, (C) 2w_new, (D) 2w_new_SN, (E) 2w_old_SN, (F) ECMWF, and (G) ERA5. The overlapping points represent the Jason2 satellite track.
The track differences between spectral nudging-constrained and unconstrained simulations also clearly exist in the wind speed field snapshot (Figure 4). We find that the satellite track passes over the typhoon center in the unconstrained simulations (Figures 4A,C), while it is far from the typhoon center in the constrained simulations. Though one-way coupling simulations greatly underestimate the maximum intensity of typhoons (Figure 3), we find that they (Figures 4A,B) tend to have a larger area featuring wind speed > 25 m/s than the two-way coupled model runs (Figures 4C–E) and the ECMWF data (Figure 4F). ERA5 features the weakest wind field among all simulations, with a maximum wind speed less than 25 m/s. In contrast, ECMWF forecast data feature stronger wind speeds with finer-scale information.
The direct comparisons between simulated and observed wind speed intensities along the satellite track (Figure 5) show that the one-way simulations (1w_wind and 1w_wind_SN) tend to overestimate satellite observations for strong wind speed due to the lack of feedback with the waves and the smaller roughness length (Figure 2). This bias is reduced in two-way coupling simulations, especially for simulations with the spectral nudging technique. We also find that even though ERA5 and ECMWF do not compare well in capturing the maximum typhoon wind intensities (Figure 2), they are comparable in capturing the observed wind < 20 m/s (Figures 5G,F).
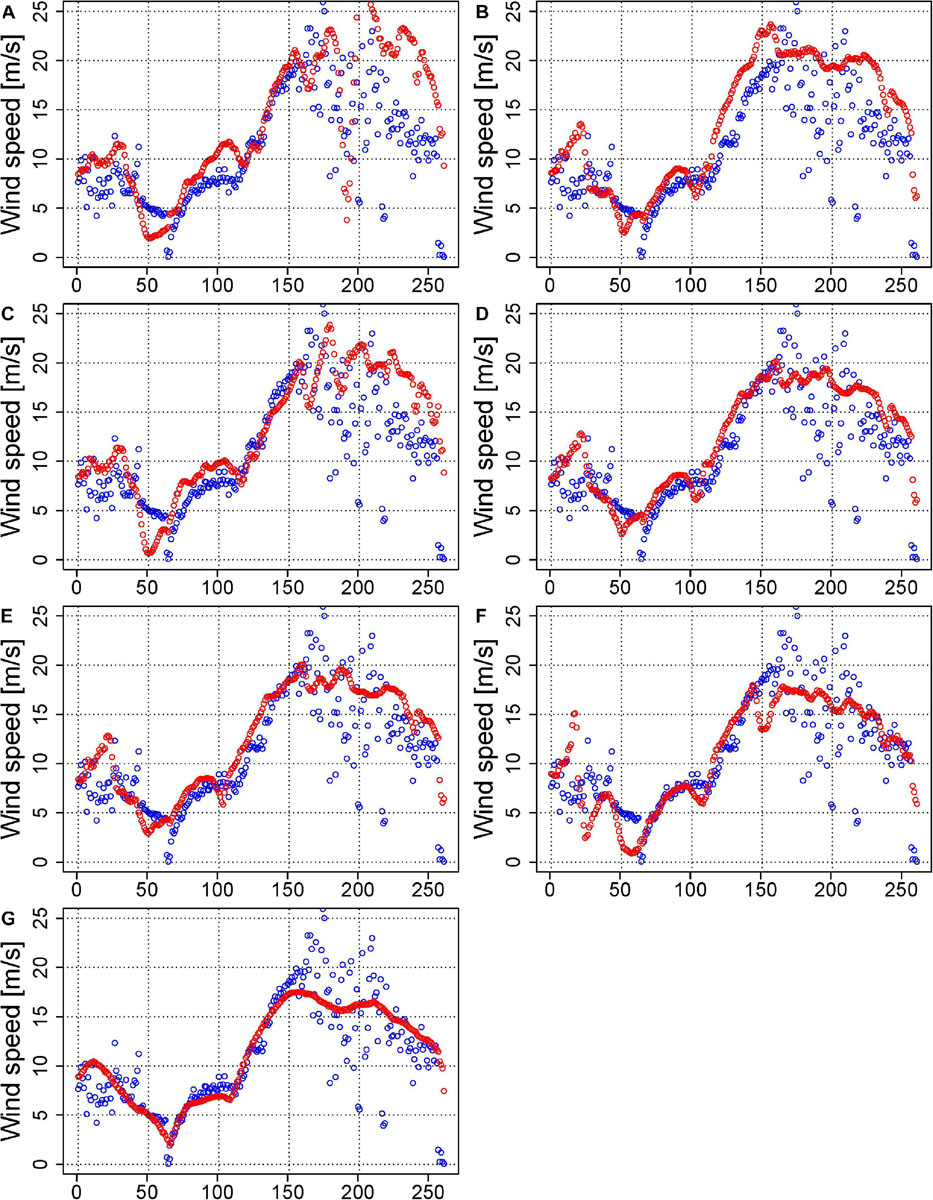
Figure 5. Comparisons between wind speeds from Jason2 satellite data (blue points) and modeled data (red points) along the ascending satellite track (from southwest to northeast direction) in Figure 3 for (A) 1w_wind, (B) 1w_wind_SN, (C) 2w_new, (D) 2w_new_SN, (E) 2w_old_SN, (F) ECMWF, and (G) ERA5.
Similarly, for the significant wave height (SWH), on 5 September 2019, the one-way forced simulations (Figures 6A,B) feature the largest areas of high SWH among all simulations (Figures 6A–G), while ERA5 shows the smallest areas of strong SWH (Figure 6G). This is consistent with the wind intensities shown in Figure 4. Two-way coupling simulations are generally similar to ECMWF forecast data in capturing SWH patterns. The comparison (Figure 7) indicates that the one-way forced simulations greatly overestimate the satellite observations. The bias is reduced for the 2w_new simulation and further reduced for the 2w_new_SN simulation. In contrast, we find that the ECMWF forecast dataset fits the observations the best, while the ERA5 reanalysis underestimates satellite observations to some extent. ECMWF performs well in capturing general wind/wave conditions and extreme wind, which is believed to be attributed to its high-resolution as well as its assimilation with a large number of observations.

Figure 6. Snapshots of the modeled significant wave height (m) at 13:00 UTC 5 September 2019 for (A) 1w_wind, (B) 1w_wind_SN, (C) 2w_new, (D) 2w_new_SN, (E) 2w_old_SN, (F) ECMWF, and (G) ERA5. The overlapping points represent the Sentinel-3B satellite track.
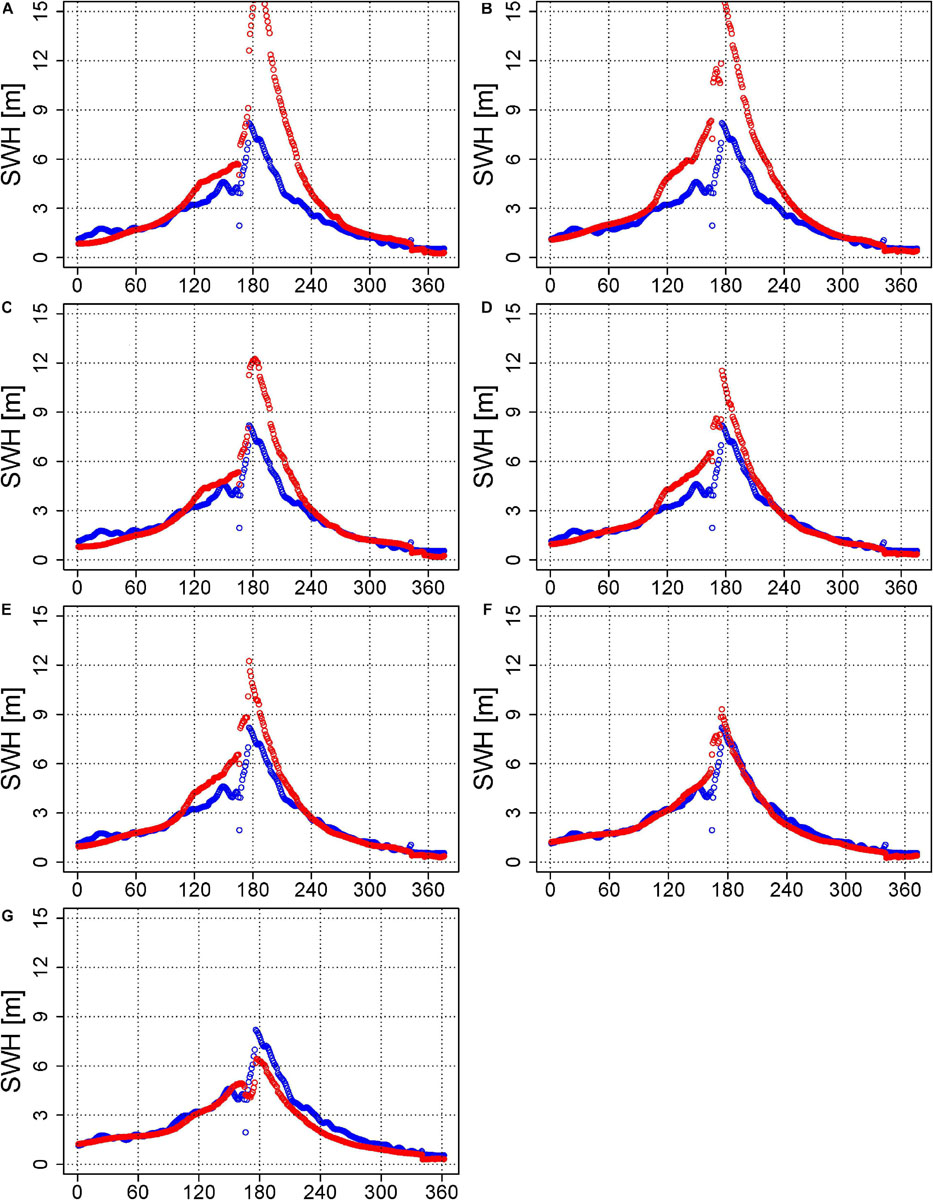
Figure 7. Comparisons between the significant wave heights of the Sentinel-3B satellite data (blue points) and modeled data (red points) along the ascending satellite track (from southeast to northwest direction) in Figure 6 for (A) 1w_wind, (B) 1w_wind_SN, (C) 2w_new, (D) 2w_new_SN, (E) 2w_old_SN, (F) ECMWF, and (G) ERA5.
In the following section, we will assess the simulated wind and waves’ skills in the coastal areas during the typhoon event. Figure 8 and Supplementary Figure 2 show little difference between simulations for capturing wind speeds less than 10 m/s for most coastal stations. The exception is seen mainly at stations 1, 3, and 4, where simulations without spectral nudging (1w_wind and 2w_new) overestimate observations during 5–6 September 2019. We can find a clear phase shift for simulations without spectral nudging (1w_wind and 2w_new) at almost all stations: the maximum wind speed for these two simulations occurs earlier than the observations and the other simulations. This is also consistent with the shift of typhoon tracks, as shown in Figures 3, 4, implying the significance of large-scale constraining by spectral nudging in simulating the typhoon event. 1w_wind_SN tends to overestimate strong wind speed during 6–7 September 2019, while 2w_new_SN, 2w_old_SN, ECMWF and ERA5 data are in better agreement with observations, with ECMWF and ERA5 being the best.
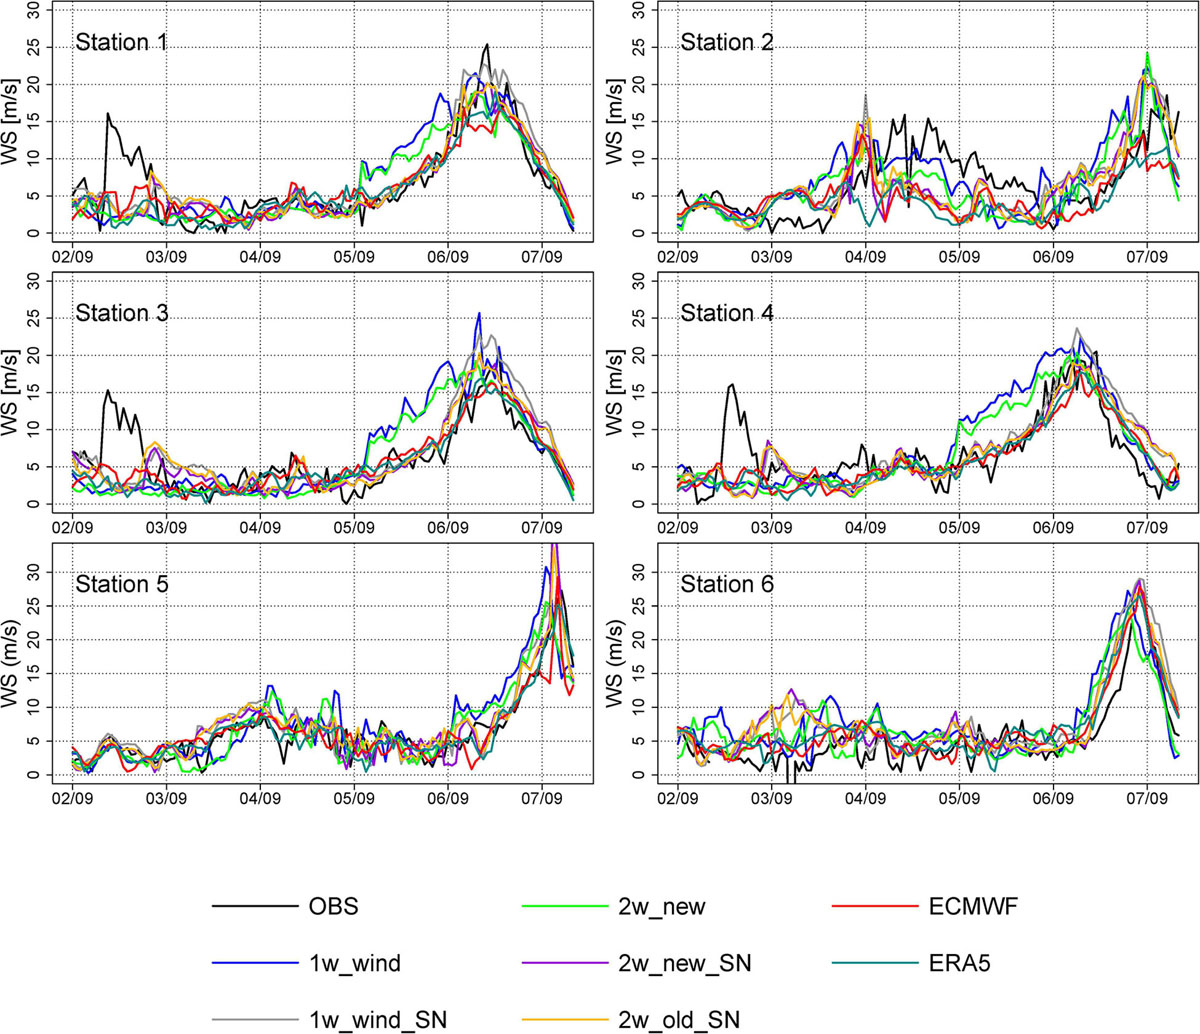
Figure 8. Time series of observed and modeled wind speeds from 2 to 7 September 2019 at different stations.
Figure 9 and Supplementary Figure 3 show that ECMWF fits the observed SWH the best, followed by the ERA5 reanalysis dataset. The ERA5 data underestimate observations at several stations, including stations 1, 3, 4, and 6. In general, the downscaling simulations overestimate the observed SWH in the extreme state. Similar to wind, the time of reaching maximum SWH values of the 1w_wind and 2w_new runs is shifted from the observations. The peak of the maximum SWH in the 2w_new_SN and 2w_old_SN simulations fits well with the observations. These two-way coupled model simulations perform better than the forced run (1w_wind_SN).
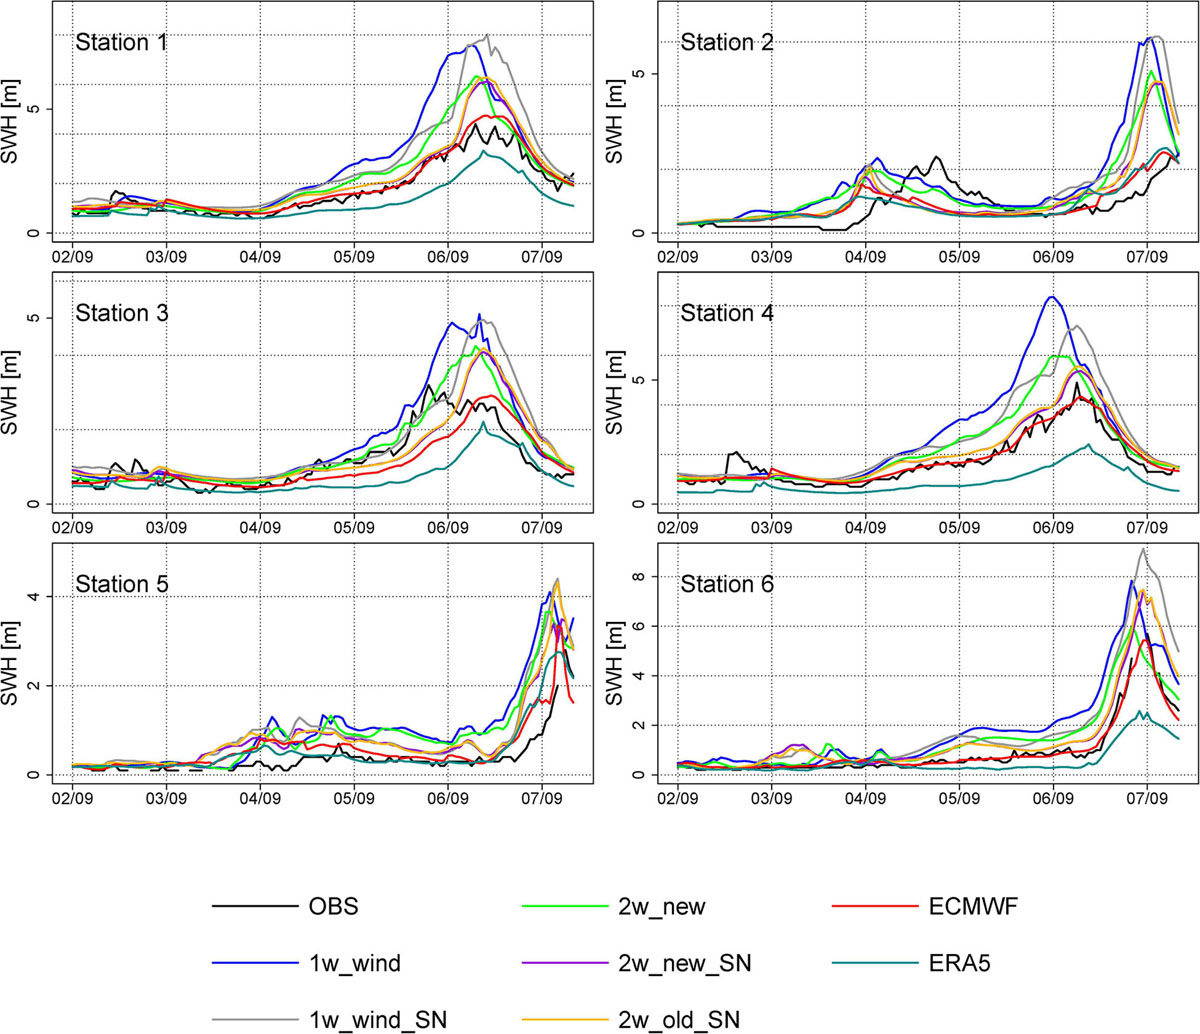
Figure 9. The same as Figure 8, but for significant wave height.
The performance of the different runs against the in situ observations is also shown in the Taylor diagrams (Supplementary Figures 4, 5). The simulations with spectral nudging feature better correlation coefficients with observations than those without spectral nudging. In contrast to one-way coupling simulations, two-way coupling simulations are generally closer to the observations, especially for the waves (Supplementary Figure 5), with normalized standard deviation close to 1 and smaller normalized centerd root mean square errors. The ECMWF and ERA5 data are closer to the observations than the other simulations at most stations for both wind and waves. Finally, 2w_new_SN and 2w_old_SN are generally consistent with each other. This means that although the two Z0 schemes will impact the extreme wind conditions, they will not significantly influence the overall modeling of total wind and wave conditions.
Statistics of Wind and Wave Conditions–Satellite Observations as a Reference
For more comprehensive validation, satellite data are used to assess the skills of the different simulations in capturing wind and wave conditions over the research domain during 2–7 September 2019. Figure 10 shows that the ERA5 reanalysis and ECMWF data fit the satellite observations better than the other simulations, both in terms of wind speed distribution and statistical measures, which is because they both assimilated satellite-observed wind vectors. Among all downscaling simulations, we find that one-way coupling simulations (1w_wind and 1w_wind_SN) greatly overestimate high wind speeds in the range of 10–20 m/s. This overestimation can be reduced by two-way coupling. Specifically, we find that 2w_new_SN and 2w_old_SN are generally consistent with each other, and they are better than 2w_new in capturing wind statistics, indicating that spectral nudging adds value to regional atmosphere modeling. The impact of the new roughness length parameterization is mainly limited to extreme wind speeds (as shown in Figure 2) rather than general winds.
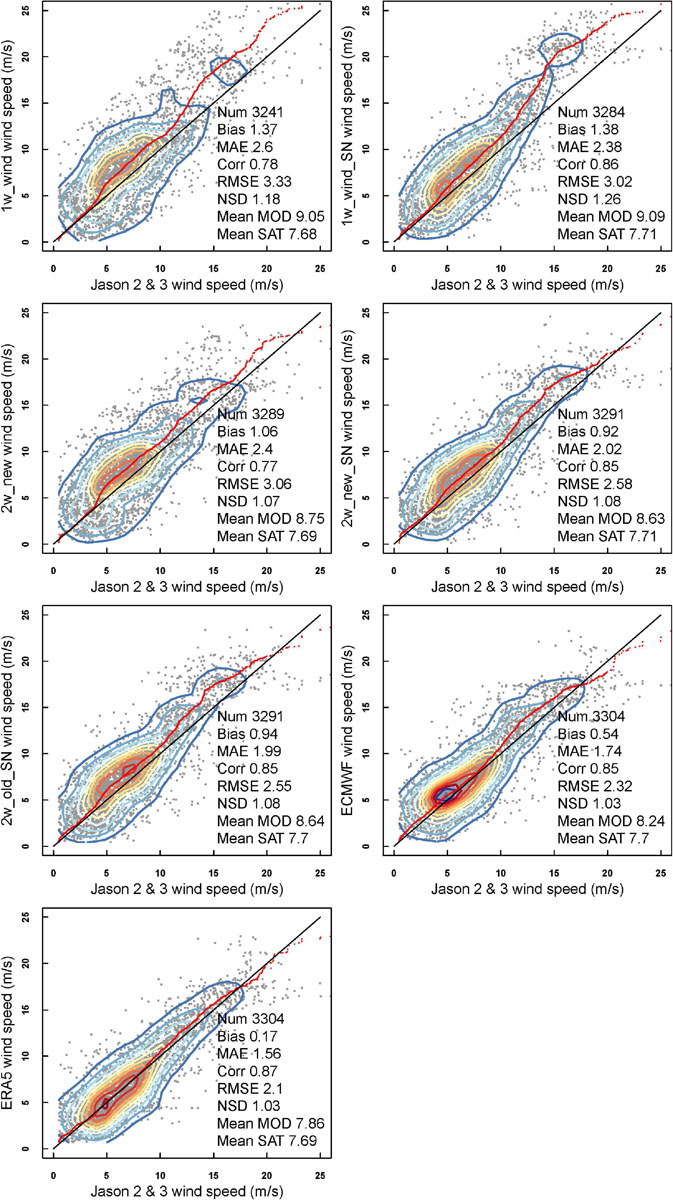
Figure 10. Comparison of the modeled wind speed (y-axis) with satellite wind observations (x-axis): qq plots (red dots) and scatter plots (gray dots). The kernel density estimations (contour lines) are included.
In terms of significant wave height, Figure 11 shows that ECMWF is slightly better than ERA5 in terms of bias and normalized standard deviation (NSD) and outperforms the other simulations. Two-way coupling simulations are better than one-way coupling simulations in generating wave conditions. Among them, 2w_new_SN and 2w_old_SN are consistent with each other, and they are worse than 2w_new in terms of bias and NSD.
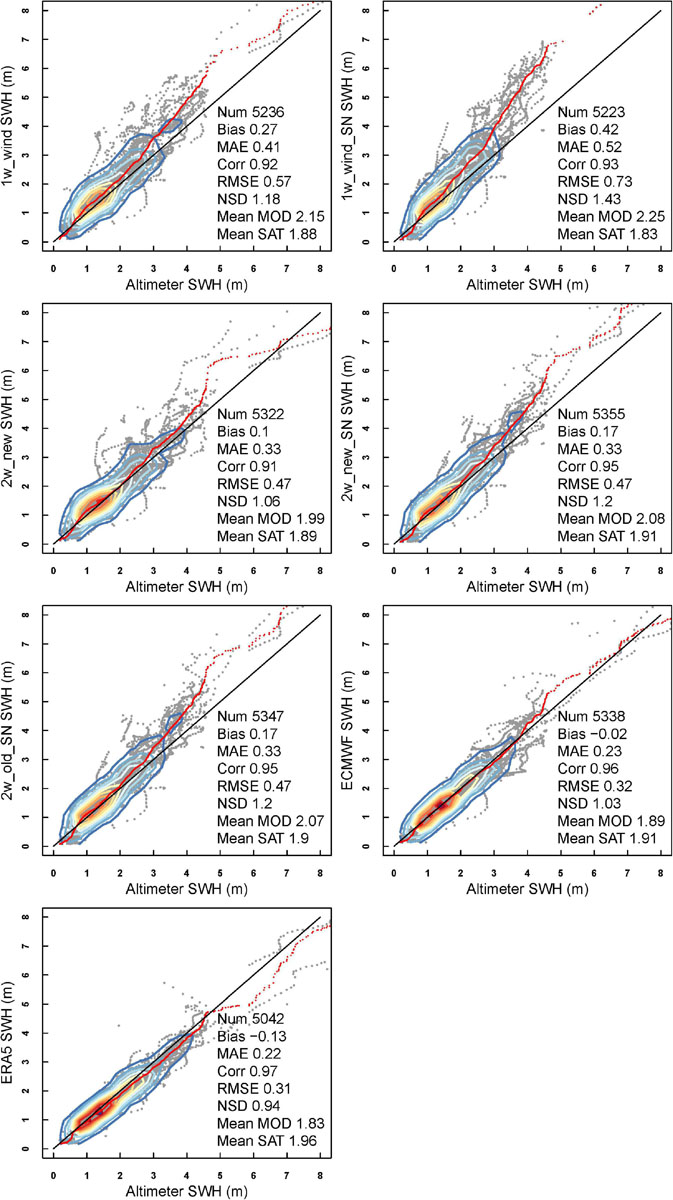
Figure 11. Comparison of the modeled significant wave height (y-axis) with satellite wave observations (x-axis): qq plots (red dots) and scatter plots (gray dots). The kernel density estimations (contour lines) are included.
The Impact of Large-Scale Constraining and Roughness Length Parameterization on Wind and Wave Modeling
Above all, we find that both large-scale constraining and roughness length parameterization greatly impact wind and wave modeling during Typhoon Lingling.
In terms of large-scale constraining, the simulations with spectral nudging show better quality in capturing typhoon tracks, mean sea level pressure, wind statistics and some aspects of wave conditions than the simulation without spectral nudging. The outperformance is attributed to the large-scale constraining by spectral nudging, such that the large-scale pattern in the regional climate model (RCM) is consistent with the forcing dataset and the RCM is free to develop local-scale processes on its own. In order to quantify the consistency between ECMWF and other simulations and ERA5 data in large- or small-scale signals, we performed scale separation by using the digital filter method (Feser and von Storch, 2005) on sea level pressure and calculated the pattern correlation coefficients (PCCs) between spatially filtered ECMWF and simulations and ERA5. Figure 12 shows that the PCCs between ECMWF and simulations with spectral nudging or ERA5 are very high for full fields and large-scale fields, with values larger than 0.95. In contrast, we find that the simulations without spectral nudging feature relatively low PCCs with ECMWF. For local-scale signals (Figure 12C), PCCs between simulations with spectral nudging and ECMWF are consistent with each other. They are still higher than those between simulations without spectral nudging and ECMWF, indicating that the large-scale constraining by spectral nudging will affect the generation of local-scale signals from dynamical downscaling. By comparison, ERA5 features the weakest relationship with ECMWF for local-scale signals due to its coarse resolution.

Figure 12. Time series of pattern correlation coefficient (PCC) of the sea level pressure between the ECMWF and simulations and ERA5 during Typhoon Lingling period for (A) full fields, (B) low-pass-filtered fields, and (C) high-pass-filtered fields.
Simulations with spectral nudging feature better skills in capturing the typhoon features. However, they still underestimate the maximum wind intensity of super Typhoon Lingling as revealed in Figure 3. By combining spectral nudging with the new parameterization of roughness length, we see better reproduction of the typhoon wind intensity.
The large-scale background circulation is critical for modeling the movement of typhoons. It is shown that 2w_new_SN performs better in capturing the typhoon tracks than 2w_new (Figure 3). We find a large difference in the wind speed field between 2w_new and 2w_new_SN (Figure 13C4), with the largest differences around typhoon centers: 2w_new generally features a larger (smaller) wind speed in the north (south) of the typhoon center, resulting in a stronger (weaker) wind sea. According to Li et al. (2020), a young sea under strong wind speeds will have a higher roughness length, which is apparently reflected in Figures 13C1–C3, featuring a similar distribution of Z0, DC and wind stress as the wind sea (Figure 13C4).
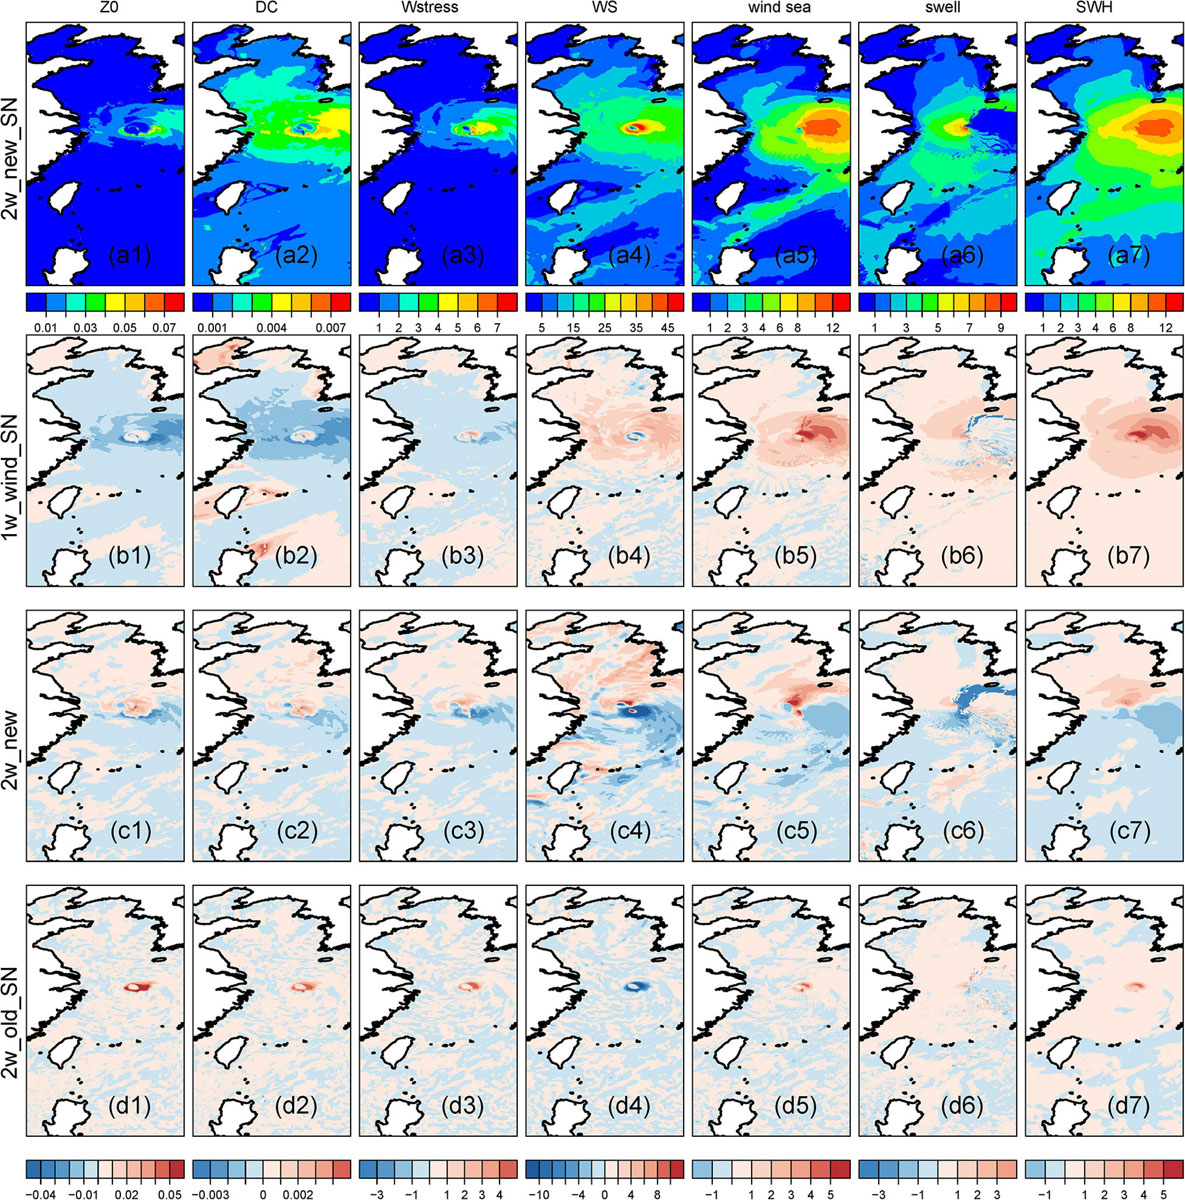
Figure 13. Impact of different simulation setups on sea surface roughness length (Z0, unit: m), drag coefficient (DC), wind stress (Wstress, unit: N/m2), wind speed (WS, unit: m/s), wind sea (unit: m), swell (unit: m) and significant wave height (SWH, unit: m) at 0900 UTC 6 September 2019: (a1-a7) simulation 2w_new_SN; (b1-b7) the differences between 1w_wind_SN and 2w_new_SN; (c1-c7) the differences between 2w_new and 2w_new_SN; (d1-d7) the differences between 2w_old_SN and 2w_new_SN.
In terms of sea surface roughness parameterization, the roughness length for the one-way coupling runs 1w_wind and 1w_wind_SN depends on the wind speed (Eq. 3), while it depends on both wind speed and wave state for the two-way coupled model run 2w_new_SN (Eqs 6 and 7). Figure 13 shows that 1w_wind_SN features a smaller Z0 than 2w_new_SN in most areas, leading to a smaller drag coefficient, lower wind stress, and consequently higher wind speed and stronger waves over a large part of the research domain. A small region around the typhoon center where 1w_wind_SN features a larger Z0, drag coefficient and wind stress and consequently a lower wind speed than 2w_new_SN.
2w_old_SN generally shows an increase in roughness length with increasing wind speed, while 2w_new_SN peaks in roughness length at a wind speed of 28 m/s and decreases with wind speeds greater than 28 m/s (Figure 2). In contrast, we find that 2w_old_SN generally features a larger roughness length, larger drag coefficient and larger wind stress than 2w_new_SN, which is more pronounced around the typhoon center. Consequently, 2w_old_SN has a relatively lower wind speed around the typhoon center than 2w_new_SN (Figure 13D4).
Summary and Discussion
In this study, we conducted several high-resolution atmosphere-wave coupled model simulations for super Typhoon Lingling in September 2019. We mainly focused on the impact of large-scale constraining and aerodynamic roughness length parameterizations on simulating wind and wave conditions, especially for extreme conditions, by comparing with data from both buoys and satellites. A new roughness length parameterization was implemented considering the decreases in roughness length under extreme wind conditions.
The main conclusions are summarized below:
(1) Large-scale constraining by the spectral nudging technique can improve the model’s ability to capture the large-scale circulation, track and minimum sea level pressure of Typhoon Lingling for both one-way and two-way coupled models. Under the precondition of large-scale constraining, the simulation with the new roughness length parameterization scheme (2w_new_SN) performs much better than the simulation with the old scheme (2w_old_SN) in capturing the maximum wind speed of Typhoon Lingling, which is caused by the reduced drag coefficient of the new Z0 scheme under extreme wind conditions. However, 2w_new_SN and 2w_old_SN show very similar performance in capturing general wind and wave conditions, as there is no difference in the roughness length for wind speeds less than 28 m/s. This improvement in simulating maximum wind speed confirms the results found by ECMWF (Bidlot et al., 2020).
(2) One-way coupling simulations underestimate the maximum wind speed of Typhoon Lingling. However, they overestimate strong wind speeds of 10–20 m/s and significant wave heights of 3–6 m, which is very pronounced in 1w_wind. The overestimation can be reduced using two-way coupling simulations. This is because the wind-dependent roughness length parameterization scheme is implemented in the one-way CCLM-WAM coupled model, resulting in relatively smaller roughness length under strong wind conditions and a relatively larger roughness length under extreme wind conditions.
(3) ERA5 reanalysis data perform the worst in capturing the maximum wind speed and minimum mean sea level pressure of Typhoon Lingling. In contrast, ECMWF forecast data and downscaled simulations show much improvement.
Accurately modeling and predicting super typhoons is still a challenge. The implementation of surface momentum flux parameterizations, the modeling of large-scale environmental circulation, the model resolution and the coupling between atmosphere and ocean are significant factors.
Previous studies reported different wind speeds at which the drag coefficient peaks, as we reviewed in the introduction section. In this study, the drag coefficient peaked at a wind speed of 28 m/s through the implementation of the value in the new roughness length parameterization in Eq. 7. To test the model sensitivity to the wind speed threshold, we ran another two simulations without spectral nudging. One simulation featured a decreased drag coefficient at a wind speed of 33 m/s, which is a typical wind speed at which the drag coefficient starts to decrease (Powell et al., 2003). The other simulation adopted the old Z0 parameterization scheme. These two simulations showed consistent results in capturing wind and wave conditions between each other, indicating that the regional model without spectral nudging cannot reach up to 33 m/s for wind speed, resulting in the involvement of the new Z0 scheme in the present study.
Guo and Zhong (2017) revealed that large-scale circulation constrained by spectral nudging can change the typhoon track both through dynamical and thermal factors, with the former being dominant one. It can directly adjust the local steering flow and impact the typhoon track, and it can modify the vertical wind shear, which modifies the location and symmetry of the severe inner convection and therefore changes the typhoon track. Supplementary Figures 6C4–C7 shows that there are changes in large-scale circulations at different pressure levels with the absence of spectral nudging. This will modify the location of the inner severe convection of the typhoon and will be accompanied by changes in the surface temperature and surface heat fluxes (Supplementary Figures 6C1–C3). Therefore, for modeling or predicting tropical cyclones accurately, one of the preconditions is the robust representation of the evolution of environmental large-scale circulation in the physical model. We also found that two-way coupling of the atmosphere and waves modified the surface heat fluxes and large-scale circulations at different levels (Supplementary Figures 6B1–B7). Although the related modification is not as significant as spectral nudging, it is more significant than modification by changing the Z0 scheme for extreme conditions (Supplementary Figures 6D1–D7).
Furthermore, the impact of atmosphere-wave coupling on a single depression is also dependent on the model resolution. If the resolution is too coarse to resolve the processes involved, the effect caused by coupling the wave model to the atmospheric model vanishes (Janssen et al., 2002; Wu et al., 2017). Wu et al. (2017) analyzed the effects of different roughness length parameterizations on the predictability of a storm. However, none of the tested parameterizations could reproduce the results of the coupled model simulations. The two-way coupling of wave and atmospheric models, when introduced into the high-resolution operational forecasts of ECMWF led to substantial improvements in several forecasting variables (e.g., ECMWF, 2019).
In addition, the energy of tropical cyclones is provided by the ocean through heat transport. Mogensen et al. (2017) revealed that upper ocean stratification is important for modeling the atmosphere-ocean coupled feedback and therefore, for predicting the development of tropical cyclones. The ocean state also partly determines the heat, moisture and momentum exchange between the atmosphere and ocean. Therefore, a high-resolution atmosphere-wave-ocean coupled model system is promising for realistically modeling tropical cyclones and the related interactions between the ocean and atmosphere.
With the development of model physics, the assimilation of vast amounts of observations and higher model resolution, the modeling of tropical cyclones can be advanced by the state-of-the-art global or regional model. Our study has shown the robust ability of a high-resolution regional CCLM-WAM coupled model with an advanced roughness length parameterization scheme to capture the super typhoon intensity. The model provides added value to the accurate modeling of the intensity of super typhoons, however, we only test one case of super typhoon “Lingling” in the present study using the one-way or two-way coupled CCLM-WAM with different Z0 scheme. To optimize the configurations for modeling or predicting super typhoons, it is necessary to conduct more sensitivity tests on different cases of super typhoons considering the factors including high-quality initial and boundary forcings, improved physical parameterizations, convective permitting modeling, coupled atmosphere-wave-ocean modeling. It is also of great significance to conduct long-term coupled model simulation with the optimal configurations, for studying the climatology, variability and climate change of super typhoons, or for predicting the extreme wind or waves. The latter is essential for marine-time planning or offshore wind farm implementation or maintenance.
Data Availability Statement
The datasets presented in this article are not readily available because the buoy observations are not allowed to be shared publicly.
Author Contributions
DL and JS: conceptualization and formal analysis. DL, J-RB, and SG: methodology and modeling. DL and YZ: validation and visualization. JS, J-RB, and BY resources and writing-review and editing. DL: writing – original draft preparation. JS and BY: supervision. All authors have read and agreed to the submission of the manuscript.
Funding
This work was supported through the National Key Research and Development Program of China (2017YFA0604100), National Natural Science Foundation of China (41706019), the Strategic Priority Research Program of the Chinese Academy of Sciences (XDB42000000), NSFC-Shandong Joint Fund (U1806227). We also acknowledge the funding by Initiative and Networking Fund of the Helmholtz Association through the project “Advanced Earth System Modeling Capacity (ESM),” and CLICCS Center of Excellence Project.
Conflict of Interest
The authors declare that the research was conducted in the absence of any commercial or financial relationships that could be construed as a potential conflict of interest.
Acknowledgments
We acknowledge German Climate Computing Center (DKRZ) and High-Performance Computing Center of Institute of Oceanology of Chinese Academy of Sciences for providing the computer hardware for modeling and subsequent analyses. Buoy observations supported by Yellow Sea ocean/East China Sea observation and research station of OMORN are acknowledged. We appreciate the wind and wave satellite data from the Copernicus Marine Environment Monitoring Service. Thanks also to the European Centre for Medium-Range Weather Forecasts for providing the ERA5 reanalysis data, ECMWF forecast data and buoy observations. The reanalysis dataset ERA5 is available at https://cds.climate.copernicus.eu/#!/search?text=ERA5&type=dataset. We thank Arno Behrens for helping with satellite observations.
Supplementary Material
The Supplementary Material for this article can be found online at: https://www.frontiersin.org/articles/10.3389/fmars.2021.613913/full#supplementary-material
Footnotes
- ^ https://confluence.ecmwf.int/pages/viewpage.action?pageId=74764925
- ^ http://www.tz121.com/mgtyphoon/typhoon/index/index
References
Ardhuin, F., Rogers, E., Babanin, A. V., Filipot, J. F., Magne, R., Roland, A., et al. (2010). Semiempirical dissipation source functions for ocean waves. Part I: definition, calibration, and validation. J. Phys. Oceanogr. 40, 1917–1941. doi: 10.1175/2010jpo4324.1
Bao, J. W., Wilczak, J. M., Choi, J. K., and Kantha, L. H. (2000). Numerical simulations of air-sea interaction under high wind conditions using a coupled model: a study of hurricane development. Month. Weath. Rev. 128, 2190–2210. doi: 10.1175/1520-0493(2000)128<2190:nsoasi>2.0.co;2
Bi, X. Y., Gao, Z. Q., Liu, Y. G., Liu, F., Song, Q. T., Huang, J., et al. (2015). Observed drag coefficients in high winds in the near offshore of the South China Sea. J. Geophys. Res. Atmos. 120, 6444–6459. doi: 10.1002/2015jd023172
Bidlot, J.-R., Prates, F., Ribas, R., Mueller-Quintino, A., Crepulja, M., and Vitart, F. (2020). ”Enhancing Tropical Cyclone Wind Forecasts”, in: ECMWF Newsletter. Available online at: https://www.ecmwf.int/node/19721 (accessed October 4, 2020).
Breivik, Ø, Mogensen, K., Bidlot, J.-R., Balmaseda, M. A., and Janssen, P. A. E. M. (2015). Surface wave effects in the NEMO ocean model: forced and coupled experiments. J. Geophys. Res. Oceans 120, 2973–2992. doi: 10.1002/2014jc010565
Cavaleri, L., Fox-Kemper, B., and Hemer, M. (2012a). Wind waves in the coupled climate system. Bull. Am. Meteorol. Soc. 93, 1651–1661. doi: 10.1175/bams-d-11-00170.1
Cavaleri, L., Roland, A., Dutour Sikiric, M., Bertotti, L., and Tor-risi, L. (2012b). “On the coupling of COSMO to WAM,” in Proceedings of the ECMWF Workshop on Ocean-Waves, 25-27 June 2012, ECMWF, Reading.
Chan, J. C. L., and Gray, W. M. (1982). Tropical cyclone movement and surrounding flow relationships. Month. Weather Rev. 110, 1354–1374. doi: 10.1175/1520-0493(1982)110<1354:tcmasf>2.0.co;2
Charnock, H. (1955). Wind stress on a water surface. Q. J. R. Meteorol. Soc. 81, 639–640. doi: 10.1002/qj.49708135027
Chen, S. S., Zhao, W., Donelan, M. A., and Tolman, H. L. (2013). Directional wind-wave coupling in fully coupled atmosphere-wave-ocean models: results from CBLAST-Hurricane. J. Atmos. Sci. 70, 3198–3215. doi: 10.1175/JAS-D-12-0157.1
Chen, Y. J., Zhang, F. Q., Green, B. W., and Yu, X. P. (2018). Impacts of ocean cooling and reduced wind drag on Hurricane Katrina (2005) based on numerical simulations. Month. Weather Rev. 146, 287–306. doi: 10.1175/Mwr-D-17-0170.1
Doms, G., Förstner, J., Heise, E., Herzog, H., Mironov, D., Raschendorfer, M., et al. (2011). A Description of the Nonhydrostatic Regional COSMO Model. Part II: Physical Parameterization. Offenbach: Deutscher Wetterdienst.
Donelan, M. A. (1982). “The dependence of the aerodynamic drag coefficient on wave parameters,” in Proceedings of the 1st International Conference on Meteorology and Airsea Interaction of the Constal Zone, Amer. Meteorol. Soc. (Boston, MA), 381–387.
Donelan, M. A. (2018). On the decrease of the oceanic drag coefficient in high winds. J. Geophys. Res. Oceans 123, 1485–1501. doi: 10.1002/2017JC013394
Donelan, M. A., Haus, B. K., Reul, N., Plant, W. J., Stiassnie, M., Graber, H. C., et al. (2004). On the limiting aerodynamic roughness of the ocean in very strong winds. Geophys. Res. Lett. 31:L18306. doi: 10.1029/2004gl01-9460
Drennan, W. M., Taylor, P. K., and Yelland, M. J. (2005). Parameterizing the sea surface roughness. J. Phys. Oceanogr. 35, 835–848. doi: 10.1175/Jpo2704.1
ECMWF (2020). “Part VII: ECMWF wave model,” in IFS Documentation CY47R1, (Reading: Shinfield Park). Available online at: https://www.ecmwf.int/en/elibrary/19311-part-vii-ecmwf-wave-model
Edson, J. B., Jampana, V., Weller, R. A., Bigorre, S. P., Plueddemann, A. J., Fairall, C. W., et al. (2013). On the exchange of momentum over the open ocean. J. Phys. Oceanogr. 43, 1589–1610. doi: 10.1175/Jpo-D-12-0173.1
Fairall, C. W., Bradley, E. F., Hare, J. E., Grachev, A. A., and Edson, J. B. (2003). Bulk parameterization of air-sea fluxes: updates and verification for the COARE algorithm. J. Clim. 16, 571–591. doi: 10.1175/1520-0442(2003)016<0571:bpoasf>2.0.co;2
Feser, F., and von Storch, H. (2005). A spatial two-dimensional discrete filter for limited-area-model evaluation purposes. Month. Weather Rev. 133, 1774–1786. doi: 10.1175/MWR2939.1
Gao, Z., Peng, W., Gao, C. Y., and Li, Y. (2020). Parabolic dependence of the drag coefficient on wind speed from aircraft eddy-covariance measurements over the tropical Eastern Pacific. Sci. Rep. 10:1805. doi: 10.1038/s41598-020-58699-9
Gao, Z. Q., Wang, Q., and Wang, S. P. (2006). An alternative approach to sea surface aerodynamic roughness. J. Geophys. Res. Atmos. 111:D22108. doi: 10.1029/2006jd007323
Golbraikh, E., and Shtemler, Y. M. (2016). Foam input into the drag coefficient in hurricane conditions. Dyn. Atmos. Oceans 73, 1–9. doi: 10.1016/j.dynatmoce.2015.10.005
Green, B. W., and Zhang, F. (2013). Impacts of air-sea flux parameterizations on the intensity and structure of tropical cyclones. Month. Weather Rev. 141, 2308–2324. doi: 10.1175/MWR-D-12-00274.1
Group, T. W. (1988). The WAM model-A third generation ocean wave prediction model. J. Phys. Oceanogr. 18, 1775–1810. doi: 10.1175/1520-0485(1988)018<1775:twmtgo>2.0.co;2
Guan, C. L., and Xie, L. (2004). On the linear parameterization of drag coefficient over sea surface. J. Phys. Oceanogr. 34, 2847–2851. doi: 10.1175/Jpo2664.1
Guo, X., and Zhong, W. (2017). The Use of a spectral nudging technique to determine the impact of environmental factors on the track of Typhoon Megi (2010). Atmosphere 8:257. doi: 10.3390/atmos8120257
Hasselmann, K. (1991). Ocean circulation and climate change. Tellus A 43, 82–103. doi: 10.1034/j.1600-0870.1991.00008.x
Hersbach, H., Bell, B., Berrisford, P., Hirahara, S., Horányi, A., Muñoz-Sabater, J., et al. (2020). The ERA5 global reanalysis. Q. J. R. Meteorol. Soc. 146, 1999–2049.
Hersbach, H., and Janssen, P. A. E. M. (1999). Improvement of the short-fetch behavior in the Wave Ocean Model (WAM). J. Atmos. Ocean. Technol. 16, 884–892. doi: 10.1175/1520-0426(1999)016<0884:iotsfb>2.0.co;2
Holthuijsen, L. H., Powell, M. D., and Pietrzak, J. D. (2012). Wind and waves in extreme hurricanes. J. Geophys. Res. Oceans 117:7983. doi: 10.1029/2012jc007983
Hsu, S. A. (1974). A Dynamic roughness equation and its application to wind stress determination at the air-sea interface. J. Phys. Oceanogr. 4, 116–120. doi: 10.1175/1520-0485(1974)004<0116:adreai>2.0.co;2
Janssen, P. (1991). Quasi-linear theory of wind-wave generation applied to wave forecasting. J. Phys. Oceanogr. 21, 1631–1642. doi: 10.1175/1520-0485(1991)021<1631:QLTOWW>2.0.CO;2
Janssen, P., Doyle, J. D., Bidlot, J., Hansen, B., and Viterbo, P. (2002). “Impact and feedback of ocean waves on the atmosphere,” in Advances in Fluid Mechanics, Atmosphere-Ocean Interactions, Vol. 1, ed. W. Perrie (Boston, MA: MIT Press), 155–197.
Johnson, H. K., Hojstrup, J., Vested, H. J., and Larsen, S. E. (1998). On the dependence of sea surface roughness on wind waves. J. Phys. Oceanogr. 28, 1702–1716. doi: 10.1175/1520-0485(1998)028<1702:otdoss>2.0.co;2
Katsafados, P., Papadopoulos, A., Korres, G., and Varlas, G. (2016). A fully coupled atmosphere-ocean wave modeling system for the Mediterranean Sea: interactions and sensitivity to the resolved scales and mechanisms. Geosci. Model. Dev. 9, 161–173. doi: 10.5194/gmd-9-161-2016
Kitaigorodskii, S. A., and Volkov, Y. A. (1965). On the roughness parameter of the sea surface and the calculation of momentum flux in the near-water layer of the atmosphere. Izv. Atmos. Ocean. Phys. 1, 973–988.
Kumar, R. R., Sandeepan, B. S., and Holland, D. M. (2020). Impact of different sea surface roughness on surface gravity waves using a coupled atmosphere-wave model: a case of Hurricane Isaac (2012). Ocean Dyn. 70, 421–433. doi: 10.1007/s10236-019-01327-6
Li, D. L. (2017). Added value of high-resolution regional climate model: selected cases over the Bohai Sea and the Yellow Sea areas. Intern. J. Climatol. 37, 169–179. doi: 10.1002/joc.4695
Li, D. L., Feng, J. L., Xu, Z. H., Yin, B. S., Shi, H. Y., and Qi, J. F. (2019). Statistical bias correction for simulated wind speeds Over CORDEX-East Asia. Earth Space Sci. 6, 200–211. doi: 10.1029/2018ea000493
Li, D. L., Staneva, J., Grayek, S., Behrens, A., Feng, J. L., and Yin, B. S. (2020). Skill assessment of an atmosphere-wave regional coupled model over the East China sea with a focus on typhoons. Atmosphere 11:252. doi: 10.3390/atmos11030252
Lionello, P., Malguzzi, P., and Buzzi, A. (1998). Coupling between the atmospheric circulation and the ocean wave field: an idealized case. J. Phys. Oceanogr. 28, 161–177. doi: 10.1175/1520-0485(1998)028<0161:cbtaca>2.0.co;2
Liu, B., Guan, C., Xie, L. A., and Zhao, D. (2012a). An investigation of the effects of wave state and sea spray on an idealized typhoon using an air-sea coupled modeling system. Adv. Atmos. Sci. 29, 391–406. doi: 10.1007/s00376-011-1059-7
Liu, B., Guan, C. L., and Xie, L. (2012b). The wave state and sea spray related parameterization of wind stress applicable from low to extreme winds. J. Geophys. Res. Oceans 117:C00J22. doi: 10.1029/2011jc007786
Makin, V. K. (2005). A note on the drag of the sea surface at hurricane winds. Bound. Layer Meteorol. 115, 169–176. doi: 10.1007/s10546-004-3647-x
Mogensen, K. S., Magnusson, L., and Bidlot, J.-R. (2017). Tropical cyclone sensitivity to ocean coupling in the ECMWF coupled model. JGR Oceans 122, 4392–4412. doi: 10.1002/2017jc012753
Moon, I. J., Ginis, I., and Hara, T. (2004). Effect of surface waves on air-sea momentum exchange. Part II: behavior of drag coefficient under tropical cyclones. J. Atmos. Sci. 61, 2334–2348. doi: 10.1175/1520-0469(2004)061<2334:eoswoa>2.0.co;2
Moon, I. J., Ginis, I., and Hara, T. (2008). Impact of the reduced drag coefficient on ocean wave modeling under hurricane conditions. Month. Weather Rev. 136, 1217–1223. doi: 10.1175/2007mwr2131.1
Peng, S., and Li, Y. (2015). A parabolic model of drag coefficient for storm surge simulation in the South China Sea. Sci. Rep. 5:15496. doi: 10.1038/srep15496
Petersen, G. N., and Renfrew, I. A. (2009). Aircraft-based observations of air-sea fluxes over Denmark Strait and the Irminger Sea during high wind speed conditions. Q. J. R. Meteorol. Soc. 135, 2030–2045. doi: 10.1002/qj.355
Powell, M. D., Vickery, P. J., and Reinhold, T. A. (2003). Reduced drag coefficient for high wind speeds in tropical cyclones. Nature 422, 279–283. doi: 10.1038/nature01481
Qiao, F., Song, Z., Bao, Y., Song, Y., Shu, Q., Huang, C., et al. (2013). Development and evaluation of an earth system model with surface gravity waves. Atmosphere 118, 4514–4524. doi: 10.1002/jgrc.20327
Rizza, U., Canepa, E., Ricchi, A., Bonaldo, D., Carniel, S., Morichetti, M., et al. (2018). Influence of Wave State and sea spray on the roughness length: feedback on medicanes. Atmosphere 9:301. doi: 10.3390/atmos9080301
Rockel, B., Will, A., and Hense, A. (2008). The regional climate model COSMO-CLM(CCLM). Meteorol. Zeitschr. 17, 347–348. doi: 10.1127/0941-2948/2008/0309
Rutgersson, A., Nilsson, E. O., and Kumar, R. (2012). Introducing surface waves in a coupled wave-atmosphere regional climate model: impact on atmospheric mixing length. J. Geophys. Res. Oceans 117:C00j15.
Staneva, J., Alari, V., Breivik, O., Bidlot, J. R., and Mogensen, K. (2017). Effects of wave-induced forcing on a circulation model of the North Sea. Ocean Dyn. 67, 81–101.
Staneva, J., Behrens, A., and Wahle, K. (2015). Wave modelling for the German Bight coastal-ocean predicting system. J. Phys. Conf. Ser. Phys. 633:012117.
Taylor, P. K., and Yelland, M. J. (2001). The dependence of sea surface roughness on the height and steepness of the waves. J. Phys. Oceanogr. 31, 572–590.
Tobin, I., Vautard, R., Balog, I., Breon, F. M., Jerez, S., Ruti, P. M., et al. (2015). Assessing climate change impacts on European wind energy from ENSEMBLES high-resolution climate projections. Clim. Chang. 128, 99–112. doi: 10.1007/s10584-014-1291-0
Valcke, S. (2013). The OASIS3 coupler: a European climate modelling community software. Geosci. Model Dev. 6, 373–388.
von Storch, H., Langenberg, H., and Feser, F. (2000). A spectral nudging technique for dynamical downscaling purposes. Month. Weather Rev. 128, 3664–3673.
Wahle, K., Staneva, J., Koch, W., Fenoglio-Marc, L., Ho-Hageman, H. T. M., and Stanev, E. V. (2017). An atmosphere-wave regional coupled model: improving predictions of wave heights and surface winds in the southern North Sea. Ocean Sci. 13, 289–301. doi: 10.5194/os-13-289-2017
Walsh, K. J. E., Sandery, P., Brassington, G. B., Entel, M., Siegenthaler-LeDrian, C., Kepert, J. D., et al. (2010). Constraints on drag and exchange coefficients at extreme wind speeds. J. Geophys. Res. Oceans 115:C005876. doi: 10.1029/2009jc005876
Warner, J. C., Armstrong, B., He, R., and Zambon, J. B. (2010). Development of a Coupled Ocean-Atmosphere-Wave-Sediment Transport (COAWST) modeling system. Ocean Model. 35, 230–244.
Wiese, A., Stanev, E., Koch, W., Behrens, A., Geyer, B., and Staneva, J. (2019). The impact of the two-way coupling between wind wave and atmospheric models on the lower atmosphere over the North Sea. Atmosphere 10:386.
Wu, J. (1982). Wind-stress coefficients over sea-surface from Breeze to Hurricane. J. Geophys. Res. Oceans 87, 9704–9706. doi: 10.1029/JC087iC12p09704
Wu, L., Rutgersson, A., Sahlée, E., and Guo Larsén, X. (2015). The impact of waves and sea spray on modelling storm track and development. Tellus A Dyn. Meteorol. Oceanogr. 67:27967.
Wu, L., Rutgersson, A., Sahlée, E., and Guo Larsén, X. (2016). Swell impact on wind stress and atmospheric mixing in a regional coupled atmosphere-wave model. J. Geophys. Res. Oceans 121, 4633–4648.
Wu, L., Sproson, D., Sahlée, E., and Rutgersson, A. (2017). Surface wave impact when simulating midlatitude storm development. J. Atmos. Ocean. Technol. 34, 233–248.
Zedler, S. E., Niiler, P. P., Stammer, D., Terrill, E., and Morzel, J. (2009). Ocean’s response to Hurricane Frances and its implications for drag coefficient parameterization at high wind speeds. J. Geophys. Res. Oceans 114:C005205. doi: 10.1029/2008jc005205
Zhao, Z. K., Liu, C. X., Li, Q., Dai, G. F., Song, Q. T., and Lv, W. H. (2015). Typhoon air-sea drag coefficient in coastal regions. J. Geophys. Res. Oceans 120, 716–727. doi: 10.1002/2014jc010283
Zweers, N. C., Makin, V. K., de Vries, J. W., and Burgers, G. (2010). A sea drag relation for hurricane wind speeds. Geophys. Res. Lett. 37:L21811. doi: 10.1029/2010gl045002
Keywords: atmosphere–wave coupled model, wind, wave, tropical cyclone, roughness length, spectral nudging, regional downscaling
Citation: Li D, Staneva J, Bidlot J-R, Grayek S, Zhu Y and Yin B (2021) Improving Regional Model Skills During Typhoon Events: A Case Study for Super Typhoon Lingling Over the Northwest Pacific Ocean. Front. Mar. Sci. 8:613913. doi: 10.3389/fmars.2021.613913
Received: 04 October 2020; Accepted: 11 January 2021;
Published: 12 February 2021.
Edited by:
Agustin Sanchez-Arcilla, Universitat Politecnica de Catalunya, SpainReviewed by:
Anastasios Papadopoulos, Hellenic Centre for Marine Research (HCMR), GreeceJian Shi, Hohai University, China
Copyright © 2021 Li, Staneva, Bidlot, Grayek, Zhu and Yin. This is an open-access article distributed under the terms of the Creative Commons Attribution License (CC BY). The use, distribution or reproduction in other forums is permitted, provided the original author(s) and the copyright owner(s) are credited and that the original publication in this journal is cited, in accordance with accepted academic practice. No use, distribution or reproduction is permitted which does not comply with these terms.
*Correspondence: Delei Li, ZGVsZWlsaUBxZGlvLmFjLmNu; Joanna Staneva, Sm9hbm5hLlN0YW5ldmFAaHpnLmRl; Baoshu Yin, YnN5aW5AcWRpby5hYy5jbg==