
94% of researchers rate our articles as excellent or good
Learn more about the work of our research integrity team to safeguard the quality of each article we publish.
Find out more
ORIGINAL RESEARCH article
Front. Mar. Sci., 04 June 2021
Sec. Marine Ecosystem Ecology
Volume 8 - 2021 | https://doi.org/10.3389/fmars.2021.607203
This article is part of the Research TopicUsing Ecological Models to Support and Shape Environmental Policy DecisionsView all 28 articles
The fate and effects of microplastics in the marine environment are an increasingly important area of research, policy and legislation. To manage and reduce microplastics in the seas and oceans, and to help understand causes and effects, we need improved understanding of transport patterns, transit times and accumulation areas. In this paper, we use a particle tracking model to investigate the differences in dispersal and accumulation of microplastics with different properties (floating and sinking) in the North Sea. In these simulations, particles were released with a uniform horizontal distribution, and also from rivers at rates proportional to the river runoff. The results showed that floating particles can accumulate temporarily on salinity fronts and in gyres, and are deposited predominantly on west-facing beaches. Sinking particles moved more slowly and less far, accumulated in deeper areas associated with fine sediments, and were deposited more on west- and north-facing beaches. The model was also applied to the MSC Zoe incident of 1 January 2019, in which 342 containers were lost north of the Dutch Wadden islands in the southern North Sea, tracking two types of microplastics with similar properties (∼5mm floating HDPE pellets and ∼0.6mm sinking PS grains) to identify release locations and potential accumulation areas. We used field observations collected by a citizen science initiative (waddenplastic.nl) to constrain the model results. For these simulations, particles were released along the ship’s trajectory and at locations on the trajectory where debris was found. The simulations of the MSC Zoe incident showed that over 90% of floating (∼5mm) HDPE pellets beached within 3–7 weeks, and predominantly on the more eastern Dutch Wadden Islands in agreement with the field observations, and that most of the sinking (∼0.6mm) PS grains were still at sea after 6 weeks, and a large proportion may have been deposited on German shores. The work is relevant to Descriptor 10 (Marine Litter) of the EU Marine Strategy Framework Directive.
Accumulating plastic pollution is now recognized as a growing environmental concern in the preservation of marine life (GESAMP, 2019). This concern stems from the continuously increasing production of plastic waste, the persistent character of plastic in the environment, and poor waste management and littering that allows plastic to find its way into the oceans (e.g., Bergmann et al., 2019) where it remains for long time periods. Plastic pollution has long been recognized as a threat and has therefore been included in the Marine Strategy Framework directive (MSFD, Descriptor 10: Marine Litter; EUC, 2008, 2017). Microplastics (smaller than 5 mm) are mentioned as being of particular concern as they can be ingested by animals and cause harm. The main aim of MSFD Descriptor 10 is to prevent plastics from entering the environment, but there are also guidelines for assessing the status, setting targets, monitoring and reporting (GESAMP, 2019). Efforts to set threshold values for marine litter for MSFD reporting are on-going (Werner et al., 2020).
Microplastic pollution has gained attention in the last decade (Galgani et al., 2010), as evidence that it is harming marine biota is mounting (e.g., Chapron et al., 2018). To manage and reduce microplastics in the marine environment, understanding of transport patterns, transit times and accumulation is needed. A recent review of ocean transport mechanisms is given by Van Sebille et al. (2020).
A comprehensive report on microplastics in the marine environment has been compiled by GESAMP (2016). Sources of (micro-)plastics in the marine environment are many, including production facilities, land- and sea-based consumers, and waste management facilities and processes. Plastics can enter the ocean from shipping, coasts, rivers or the atmosphere. Sources from shipping include waste disposal, sewage, and accidents. Shipping accidents can include loss of containers containing plastic items; a survey covering 2014–2016 estimated the world-wide annual loss, including catastrophic losses, at 1390 containers (World Shipping Council, 2017). Microplastics can either be produced as such (e.g., industrial granulates, or small parts), or be formed by fragmentation of macroplastics. Potential effects on the marine environment include changes in growth and feeding behavior (e.g., Chapron et al., 2018). Biota can also influence the fate of microplastics, e.g., through burial (e.g., Gebhardt and Forster, 2018) which prevents them temporarily from further dispersal, biofouling (e.g., Kooi et al., 2017) which changes their buoyancy, or incorporation in fecal pellets (e.g., Cole et al., 2016) which removes them from the water column and brings them to the sea bed.
Nevertheless, quantitative data on the amounts of plastics and in particular microplastics in the marine environment remain fragmented, and models may provide additional information (see the review of Canals et al., 2021, and references therein). This holds in particular for plastics on or in the sea bed, where observations are much more time consuming and expensive than at the sea surface. They also found that in particular global ocean models lack resolution near the sea bed to accurately represent currents in the boundary layer which are important for dispersal of sinking plastic particles. Regional sigma coordinate models fare better in this respect. As with any forward time-stepping model, good knowledge and representation of initial conditions, in this case sources of plastics and their release as a function of time, is of crucial importance for models accurately represent real-world plastic concentrations. Another important factor to simulate plastic dispersal is the buoyancy of plastic particles in sea water which affects their vertical position in the water column. As plastics have accumulated in the marine environment during several decades, and plastic sources and releases are typically not registered, accurate simulations of plastic distributions in general do not seem achievable. Moreover, during such long periods of time, changes in buoyancy and fragmentation would need to be predicted, and current knowledge is insufficient to include such processes in models (Canals et al., 2021). These uncertainties hold in particular for microplastics, which are often the products of fragmentation, and for which observations are only recently becoming available. Specific accidental releases of microplastics, however, provide opportunities to collect more precise source and destination data, allowing models to be used to help reconstruct the events.
In the night of January 1st 2019, the container vessel MSC Zoe lost 342 containers in a storm while sailing north of the Dutch Wadden islands1 (Figure 1B for a representation of part of the ship’s trajectory). More than 11 metric tons of semi-transparent 0.5-mm PS (polystyrene) granules were lost from a container that remained hanging over the side of the ship. These particles are slightly heavier than water, and would typically sink to the seabed (see Table 1 for characteristics). They may, however, be (re)suspended by currents and waves. So far, none of these granules have been found onshore or offshore, possibly because they resemble sand grains. Also, an unknown quantity of white HDPE (high density polyethylene) pellets, most likely also originating from MSC Zoe, washed up on the beaches in very large numbers, loose but also in bags, typically concentrated along the high-water mark. A more complete account of the immediate aftermath of the incident is given by Philippart et al. (2019).
It is unknown where the PS grains and HDPE pellets were lost exactly. Here, we will use a particle tracking model, coupled to a hydrodynamics model, in combination with the observations from citizen science platform (See text footnote 5) to identify potential release locations for the HDPE pellets. We will also run scenarios to simulate where the PS grains, which have as yet not been found, may have ended up.
To put these simulations into perspective, and illustrate some of the mechanisms influencing the transport of floating and sinking particles, we have also carried out two hypothetical, schematic release scenarios for particles with the same characteristics for the wider North Sea. These runs provide useful first insights into potential microplastics dispersal patterns and mechanisms, and potential accumulation areas in the North Sea. Lagrangian particle tracking models have been applied in the North Sea many times, to study subjects such as current patterns (e.g., Backhaus, 1985), radionuclide dispersal (Schönfeld, 1995), larvae dispersal (e.g., Savina et al., 2010; Tiessen et al., 2014), litter transport (Neumann et al., 2014), and 3D circulation (Ricker and Stanev, 2020).
The North Sea is a relatively shallow shelf sea with depths typically less than approximately 150 m (Figure 1).
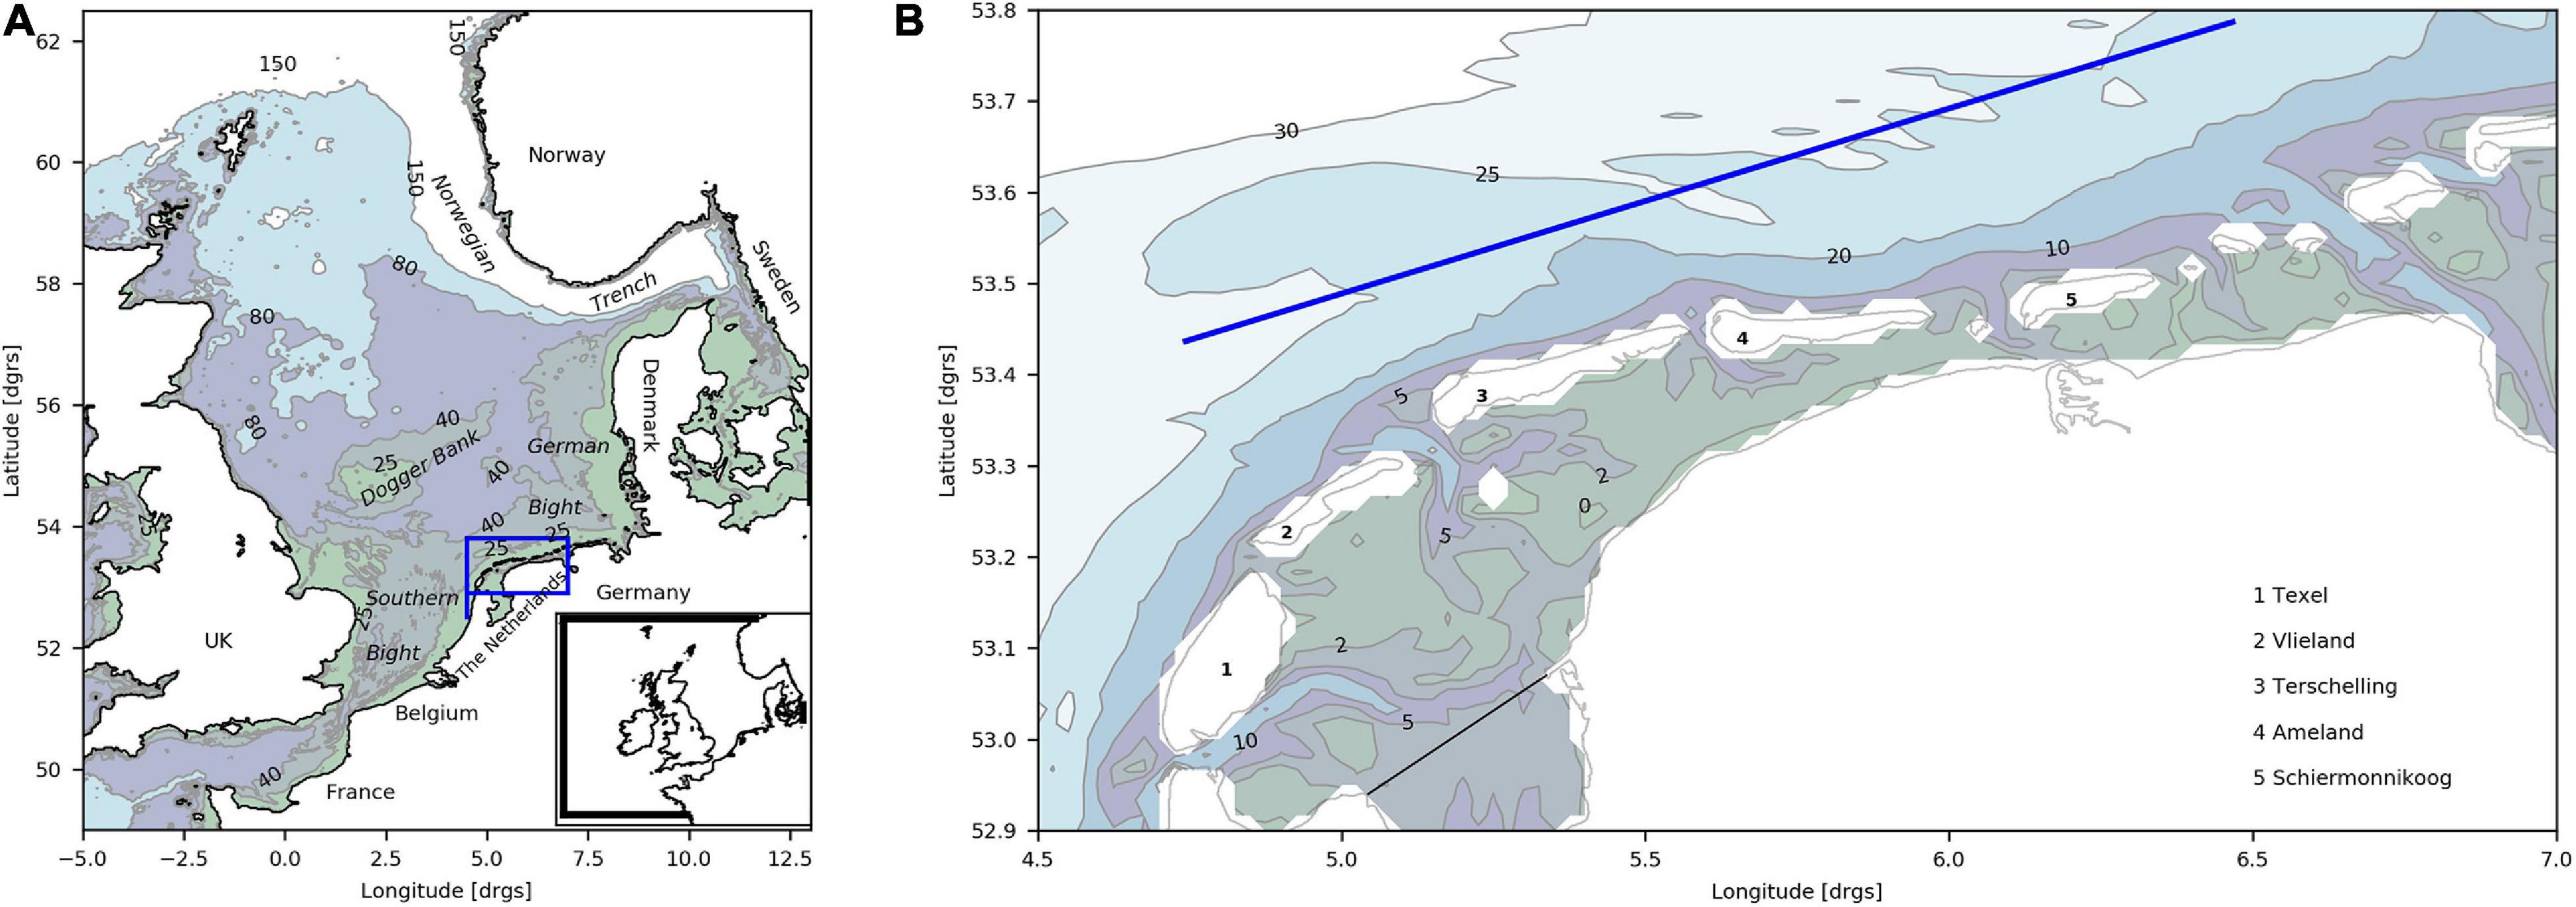
Figure 1. Topography of the area of interest. (A) The North Sea. Inset: full domain of the hydrodynamical model. Blue rectangle: Dutch Wadden Sea (B). (B) Dutch Wadden Sea and approximate route of MSC Zoe (blue line; Table 2). Bathymetry contours in m below mean sea level.
The tides in the North Sea are semi-diurnal, with dominant M2 tidal amplitudes over 2 m along the UK east coast, near Dover Strait, and in the German Bight, and amphidromic points near the Norwegian coast, in the central southern North Sea and in the southern bight of the North Sea (e.g., Davies et al., 1997). Maximum surface currents at spring tide are about 1.4 ms–1 in the western and southern parts of the Southern Bight of the North Sea, reducing to 0.3 ms–1 in the central North Sea (Hydrographical Survey, 2000).
Wind can induce depth-averaged surge currents of up to 1 ms–1 in the North Sea (Flather, 1987). The overall residual circulation pattern in the North Sea is anti-clockwise (e.g., North Sea Task Force, 1993; Holt et al., 2001). The time and depth-averaged atmospherically induced residual currents are about 1/3 of the tidal residuals and directed to the north in the southern bight, and to the northeast in the southern North Sea (Prandle, 1978). Combined residual current speeds in the Southern Bight are approximately 0.05 m/s (Prandle, 1978).
Thermal stratification occurs in summer to the northern parts of the southern North Sea whereas the southern parts remain well-mixed, and separated by the Frysian Front (Otto et al., 1990). Under stratified conditions, a subsurface jet induced by density differences transports water around the north, east and southeast slopes of the Dogger Bank into the Oyster Grounds (Brown et al., 1999; Hill et al., 2008). The thermal stratification breaks down in the autumn, and is absent throughout the winter.
On a more local scale, fresh-water outflow of the river Rhine forms a plume along the Dutch coast to the North, resulting in density-driven coastward near-bottom currents and offshore surface currents of several cms–1 (Visser, 1992; Simpson, 1997). A similar plume is present in the German Bight and associated with the river Elbe (e.g., Schrum, 1997). UK coastal waters converge in the East Anglian plume, which is mostly recognizable by its elevated levels of turbidity, crosses the North Sea to the northeast to the south of Dogger Bank (see Dyer and Moffat, 1998 for a detailed description).
The North Sea is one of the most heavily trafficked seas in the world, including cargo ships. An early survey of floating marine litter in the North Sea found several items per square km (Dixon and Dixon, 1983). A recent study using survey data from 1995 to 2017 revealed tens to over a hundred of litter items per square km on the sea floor (Maes et al., 2018). An inventory of harmonized Europe-wide data on beach litter (Hanke et al., 2019), drawing data from a number of sources, showed typical abundances of several hundreds of litter items per survey (typically a stretch of about 100 m of beach) for beaches boardering the North Sea. The numbers varied for each individual beach during the 5 years included in the study. Averaged over these 5 years, the spatial pattern in abundance of items showed little variation around the coasts of the North Sea, except for larger numbers in the Skagerrak area. The spatial distribution of sampled beaches was variable, with several tens of km between sampled beaches along the Continental coast, relatively few sampled beaches along the UK east coast, and no beaches sampled along the west coast of Norway. A recent survey of microplastics at the sea surface and in the sea bed of the southern North Sea (Lorenz et al., 2019) found concentrations of several tens per m2 at the surface, and several hundreds per kg sediment in the bed, the vast majority smaller than 100 μm.
The Wadden Sea (Figure 1B) is a UNESCO World Heritage site and conservation area. Most of the area is protected under the Natura 2000 Habitats Directive (EUC., 1992). It consists of substantial tidal flat areas and salt marshes, intersected by tidal creeks and channels. It includes a string of barrier islands, stretching from the northern Dutch coast to Germany and Denmark, which separate this coastal sea from the North Sea.
Field observation were carried out as part of a citizen science project. Volunteers could participate via a web-based mobile app, based on the ArcGIS Survey123 application, which was hosted at the website (See text footnote 5). In the webapp, participants were ask to locate the wrack line at the beach (along the high tide line), and randomly select a 0.4 × 0.4 m quadrat within this line. Next, users were asked to enter the observation date, note whether wrack was present within the quadrat, and record the number of pellets within the quadrat in categories (0, 1–10, 11–100, > 100). In addition, the webapp also asked whether other types of plastic were present within the quadrat, or within a 5 m radius. Participants were asked to space observations by at least 10 m when taking multiple samples.
The model consists of the 3D hydrodynamic model GETM2 (Burchard and Bolding, 2002, of which the development version maintained by the Leibniz Institute for Baltic Sea Research, IOW, was used) and an Individual Behavior Model (IBM) for particle tracking (General Individuals Tracking Model, GITM). Three-dimensional flow fields were stored every hour by the hydrodynamic model, and used off-line by the IBM to calculate particle advection and diffusion.
General Individuals Tracking Model solves the shallow-water, heat balance and density equations, and was run on a spherical grid covering the north-west European continental shelf with approximately 5 km horizontal resolution and with 25 layers in the vertical (van der Molen et al., 2016). The model was forced with realistic winds, temperature and humidity data derived from the European Centre for Medium-Range Weather Forecasts (ECMWF) ERA-5 reanalysis (Copernicus Climate Change Service (C3S), 2017). The open boundaries were forced with tidal elevations derived from gridded harmonic constituents based on Topex Poseidon satellite altimetry (Le Provost et al., 1998). Moreover, the open boundaries were forced with depth-resolved boundary conditions for temperature and salinity from the ECMWF ORAS4 Ocean reanalysis (Balsema et al., 2013)3. Fresh water was introduced into the model at 132 river mouth locations based on observations from the National River Flow Archive4 for UK rivers, the Agence de l’eau Loire-Bretagne, Agence de l’eau Seine-Normandie and IFREMER for French rivers, the DONAR database for Netherlands rivers, ARGE Elbe, the Niedersächsisches Landesamt für Ökologie and the Bundesanstalt für Gewässerkunde for German rivers, and the Institute for Marine Research, Bergen, for Norwegian rivers. The north-west European continental shelf model setup was used before in combination with GITM to investigate the dispersal of eggs and larvae of seabass (Beraud et al., 2017), of epifouling species on offshore structures (van der Molen et al., 2018a; Tidbury et al., 2020), and of spiny lobster (Whomersley et al., 2018). For the current work, the setup was updated to use the modern atmospheric and oceanic boundary conditions forcings mentioned above, and the bathymetrical representation of intertidal areas along the coasts of The Netherlands, Germany and Denmark was improved by reducing the drying threshold, ensuring drainage at low tide, and masking grid cells at the approximate location of barrier islands as land. These updates have not significantly changed the results of the setup, so readers are referred to earlier papers (van der Molen et al., 2016: tidal currents and elevations; van der Molen et al., 2018b: water temperature at stations) for validation results.
The IBM GITM includes particle advection and diffusion, and biological development and behavior. The advection-diffusion elements of GITM were based on a re-coded version of the lagrangian advection-diffusion method developed by Wolk (2003). The method uses a semi-analytical advection method, which provides a sub-gridcell approximation that ensures that particles follow stream lines exactly, and a random walk method with advective correction (Visser, 1997) to simulate diffusion (Hunter et al., 1993), which uses a constant diffusion coefficient in the horizontal and a variable diffusion coefficient in the vertical that is based on the vertical turbulent eddy diffusivity obtained from the turbulence closure model in GETM. The horizontal diffusion coefficient was set to 0.5 m2s–1 here, which results in jumps of up to 7 m in one 10 s model time step.
General Individuals Tracking Model allows specification of additional vertical motion of Lagrangian particles that was used here to simulate microplastics particles with simple floating or sinking behavior (a fixed vertical velocity) that did not change in time. Hence, particle size was not accounted for explicitly. As microplastics are small, particles were assumed not to be driven directly by wind. Particles near the sea bed remain in the water column, so represent microplastics with a negligible erosion shear stress threshold. Particles that touch the shoreline are assumed to have beached and are not advected further. Modeled Lagrangian particles have exact positions, so their trajectories are only influenced by the resolution of the hydrodynamics model through the extent in which the hydrodynamics are resolved. Particle characteristics are given below.
Separate model scenario runs were carried out with focus on the North Sea, and with focus on the MSC Zoe incident. These are described separately below.
The year 2017 was the last year for which complete forcing fields for the model were available when this study started: for 2018 and 2019, the open boundary forcing for temperature and salinity from the ORA-S4 repository was not yet available. Hence, we have used the year 2017 (after several years of spinup) for the North-Sea wide simulations to have the most realistic representation of the flow in the wider domain.
Three types of particle tracking runs were carried out to assess the general dispersal patterns in the wider North Sea: i) a neutrally buoyant particle test, ii) an instantaneous release scenario, and iii) a proportional release scenario from river mouths.
For illustration purposes, a model experiment was carried out releasing a single, neutrally buoyant particle at each river mouth or sluice location and plotting the particle tracks. The results were compared with the residual circulation.
To identify potential accumulation areas of marine microplastics, assuming absence of knowledge about sources, particles were released on 1 January 2017, distributed uniformly over the part of the model domain covering the North Sea and the eastern part of the English Channel (1 particle released in every grid cell, 53524 particles in total).
To obtain first estimates of dispersal patterns for particles from potential terrestrial sources, particles were released continuously throughout the year 2017 from the river mouths at rates proportional to the instantaneous river runoff (52306 particles in total).
For both the instantaneous release scenario and the Proportional release scenario from river mouths, runs were carried out with two different types of particles: positively buoyant (floating toward the surface), and negatively buoyant (sinking toward the bottom). Here, we assume that the properties of the particles do not change over time to provide insight into the spatial distributions of the (temporary) accumulation areas of these types of particles, and use the vertical velocities of the two types of micro-plastics lost by MSC Zoe as examples, where the vertical velocities were set to the end points and the mid points of the potential ranges to assess sensitivity (see Table 1). The standard settings for HDPE pellets were a vertical particle velocity of 0.06 ms–1 and −0.004 ms–1 for PS grains. For an overview of the model runs, see Table 2. In reality, the buoyancy of plastic particles may change over time: biofouling for instance, will decrease buoyancy (e.g., Chubarenko et al., 2016). As a result, real plastic particles in the sea will gradually change their behavior. In the model, the vertical drift of these particles is counter-acted by vertical mixing induced by turbulent diffusion, resulting in vertical distributions near the surface or bottom that depend on the balance between the local intensity of turbulent mixing and the particle’s vertical velocity. As the negatively buoyant particles have less than half the density of marine sediments, and also a lower settling velocity than the fine sands that constitute the typical matrix of sediments in the area, we may assume that, in absence of biological burial processes, these particles do not enter the sea bed for substantial periods of time. Hence, the reflective boundary condition of the model at the sea bed may lead to an over-estimate of transport rates, but presumably not by orders of magnitude.
Scenario runs were carried out to investigate the potential dispersal of the two types of micro-plastics lost by MSC Zoe, with particles parameterised in the same way as in North Sea Scenarios.
To represent HDPE pellets, 20100 particles were released at 67 positions (300 at each position), every 6 min on the course of MSC Zoe (using data from Marine Traffic, 2020). Of particles that beached within a rectangular area coinciding with where pellets were reported on (See text footnote 5) the release positions were analyzed to estimate the most likely areas where HDPE pellets may have been lost.
Subsequently, within these broader areas, specific model experiments were carried out releasing 10000 particles at four locations where recovery operations suggested that containers were lost, leading to the most likely origin of the HDPE pellets.
To represent PS grains, 20100 particles were released at 67 positions in the same way as the HDPE pellets. Because of lack of observations, and because the container that held the PS grains remained on board and may have lost its cargo anywhere or gradually, we could not do a similar exercise for the PS grains. Instead, we subdivided the trajectory of the MSC Zoe into four sections, and plotted the dispersal of the PS particles from each of these to get an impression of the fate of these grains if they had been lost there.
Most of the above scenario simulations were carried out with the three vertical velocities (ends of the ranges and mid-points) per particle type (Table 1). In addition, runs were carried out using a high value for the horizontal diffusion coefficient. A summary of the runs is included in Table 2.
The simulations were run from January to November 2019 to realistically reproduce the hydrodynamic conditions in the aftermath of the container loss on 1 January 2019. For the years 2018 (needed for spinup) and 2019, ORAS4 Ocean reanalysis results were not available at the start of the study, so climatological ocean boundary conditions were constructed for these years based on the ORAS4 data of the 10 year period 2008–2017. As the ocean boundaries are far away from the incident location in coastal waters, we expect this to have only a minor influence on the results. For river runoff also, climatologies were used to extend beyond the observed data.
In general, marine microplastics can be expected to be transported in the direction of the residual circulation. The modeled depth-averaged residual circulation, obtained from a tidal harmonic analysis for the year 1983 (Figure 2) carried out for model validation before running the hindcast up to the years used for this study, shows the anti-clockwise circulation pattern in the North Sea. Single, neutrally buoyant particles released at river mouths and sluices around the North Sea in the model followed this pattern unless they beached (Figure 2B).
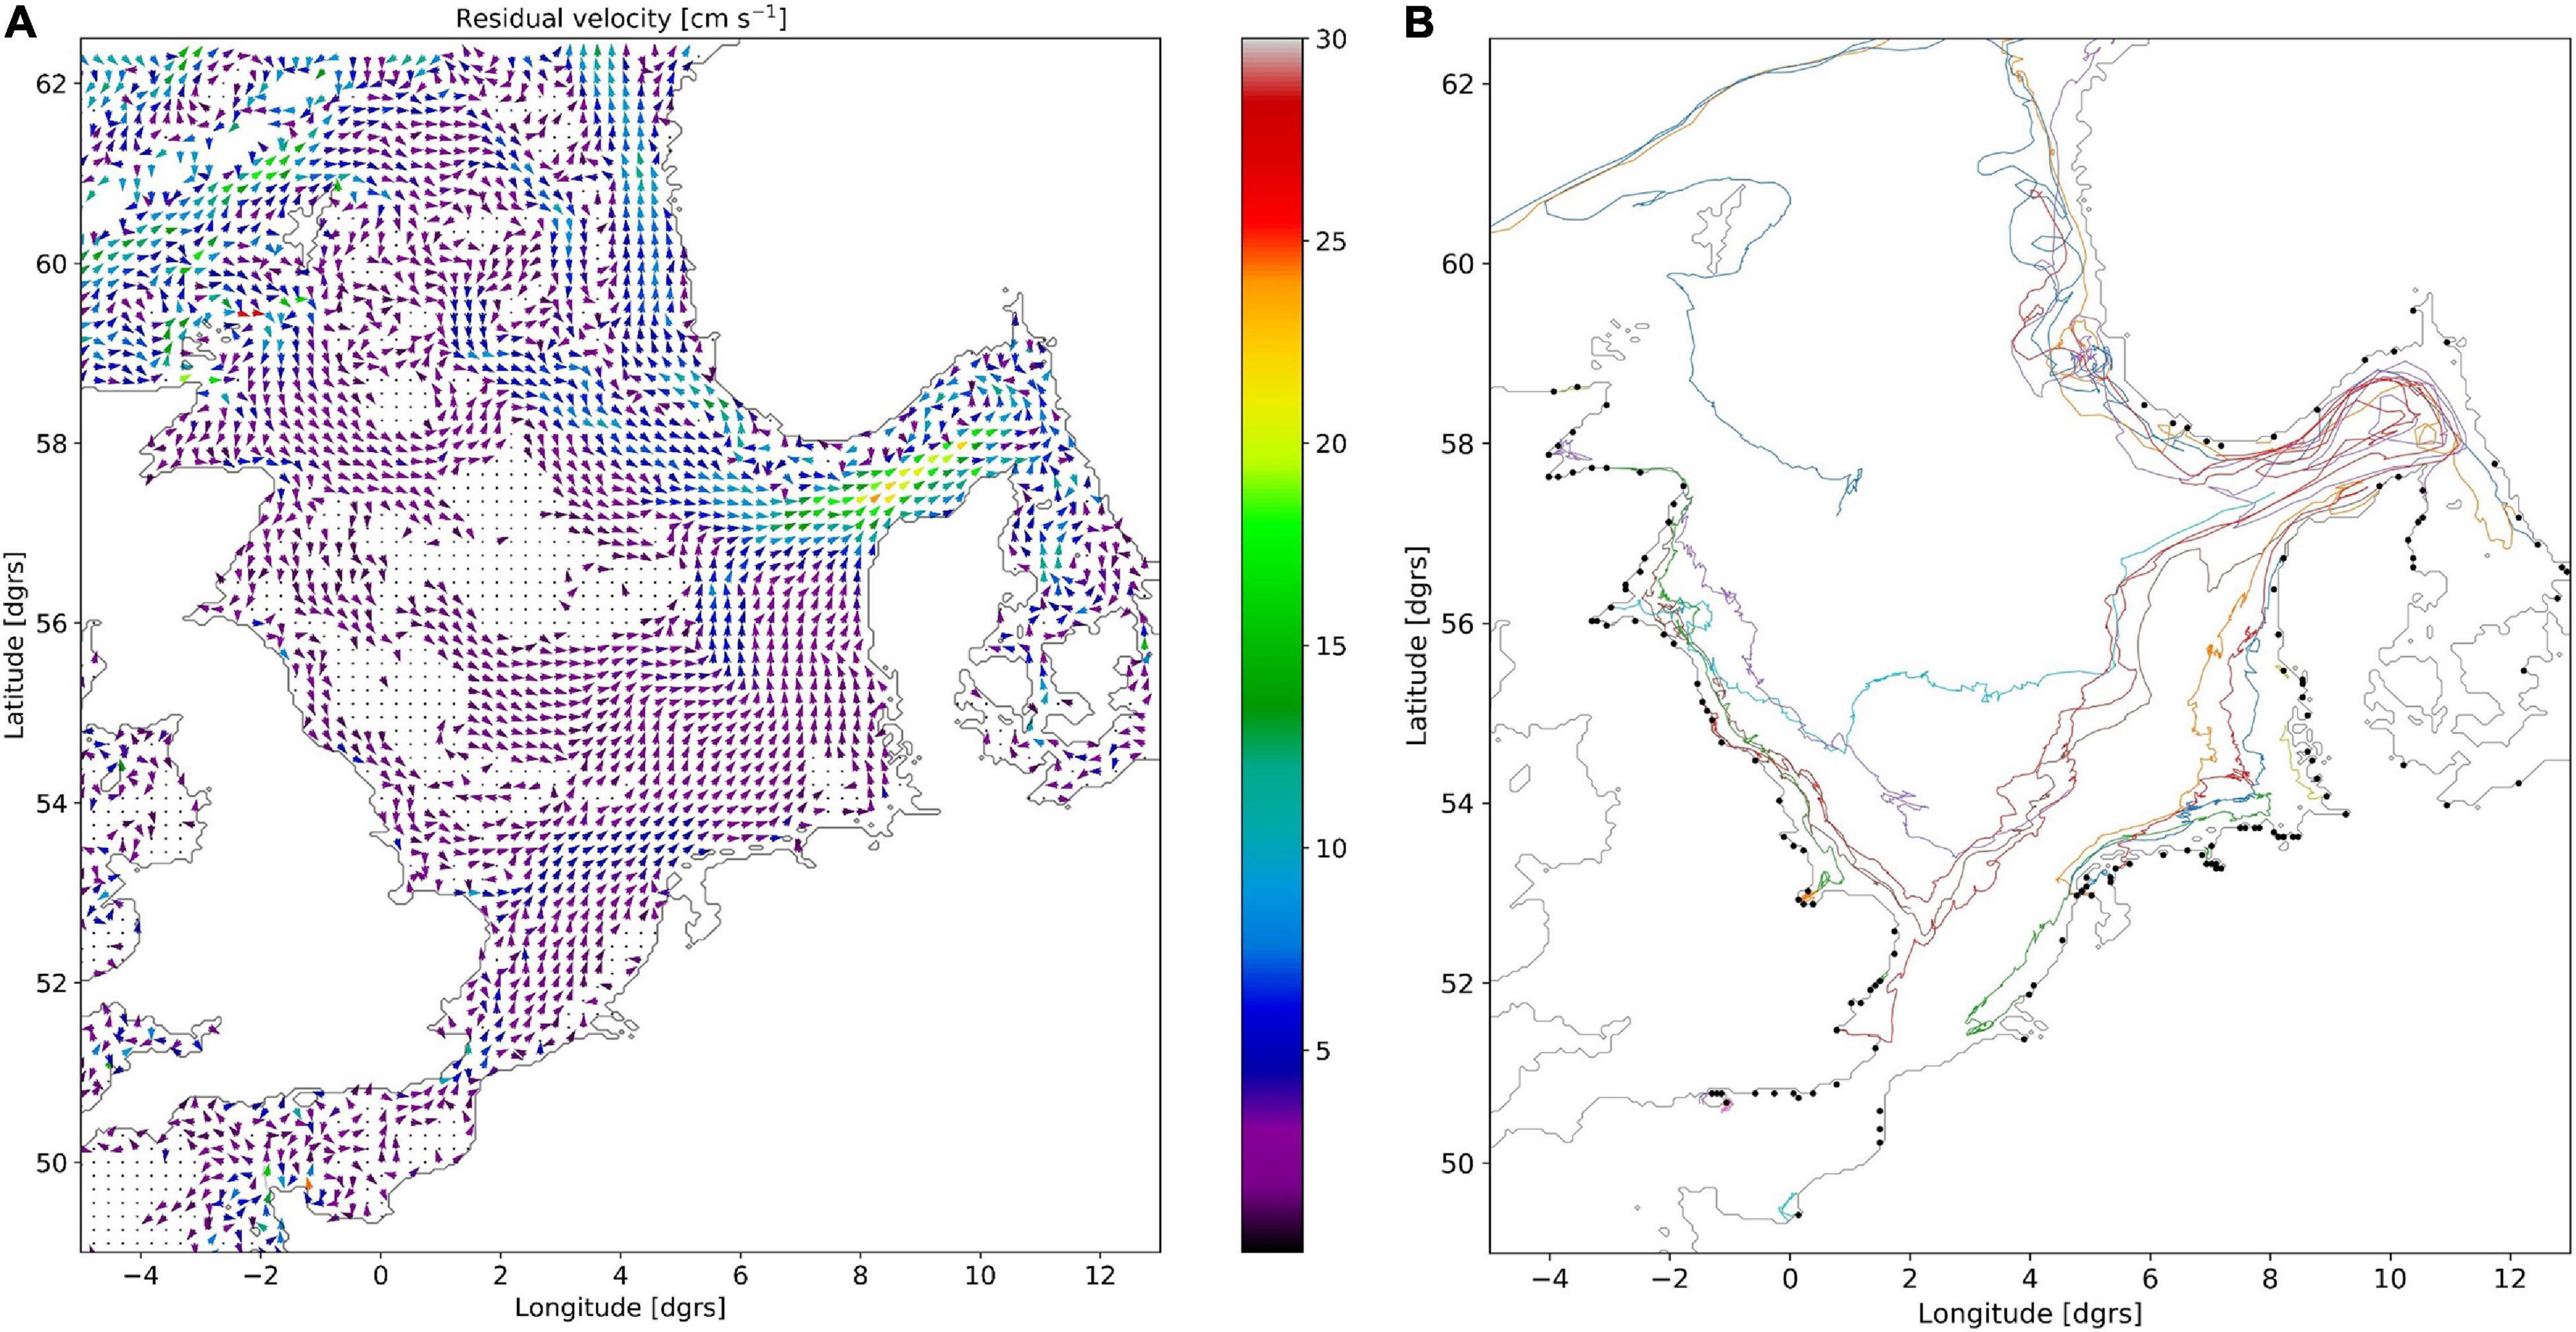
Figure 2. (A) Modeled depth-averaged residual velocity (in cm s–1) in the North Sea for 1983. Every third grid cell was plotted, and velocities smaller than 1 cm s–1 were omitted to highlight the overall pattern. (B) Tracks of neutrally buoyant particles released at river mouths on 1 January 2017, until 30 December 2017. The colors indicate tracks of individual particles, but note that spatially separated particle tracks may have the same color. For visibility, only every fifth track was plotted. The black dots are the river mouth locations. Directions of travel are generally in the direction of the residual circulation.
Results of the uniform, instantaneous release experiment showed, for floating particles and after a year, over 99% of particles had beached (Figure 3A). Particles beached on all North Sea coasts, but the highest concentrations were on the west-facing coast of Denmark. Floating particles beached only sporadically on the UK east coast. For sinking particles (Figure 3B), 45% of particles were still at sea at the end of the year. This contrast with the floating particles could be expected, as currents near the sea bed are generally weaker and the sea-bed topography plays a role. Sinking particles accumulated in the Oyster Grounds, off the central UK east coast, and in particular in the Skagerrak. Sinking particles also beached on all coasts, but were, in contrast with floating particles, more evenly distributed with higher concentrations on north-facing coasts and the Norwegian coast of the Skagerrak. The simulations with vertical particle velocities at the ends of the ranges resulted in similar distribution patterns (Figures 3C–F).
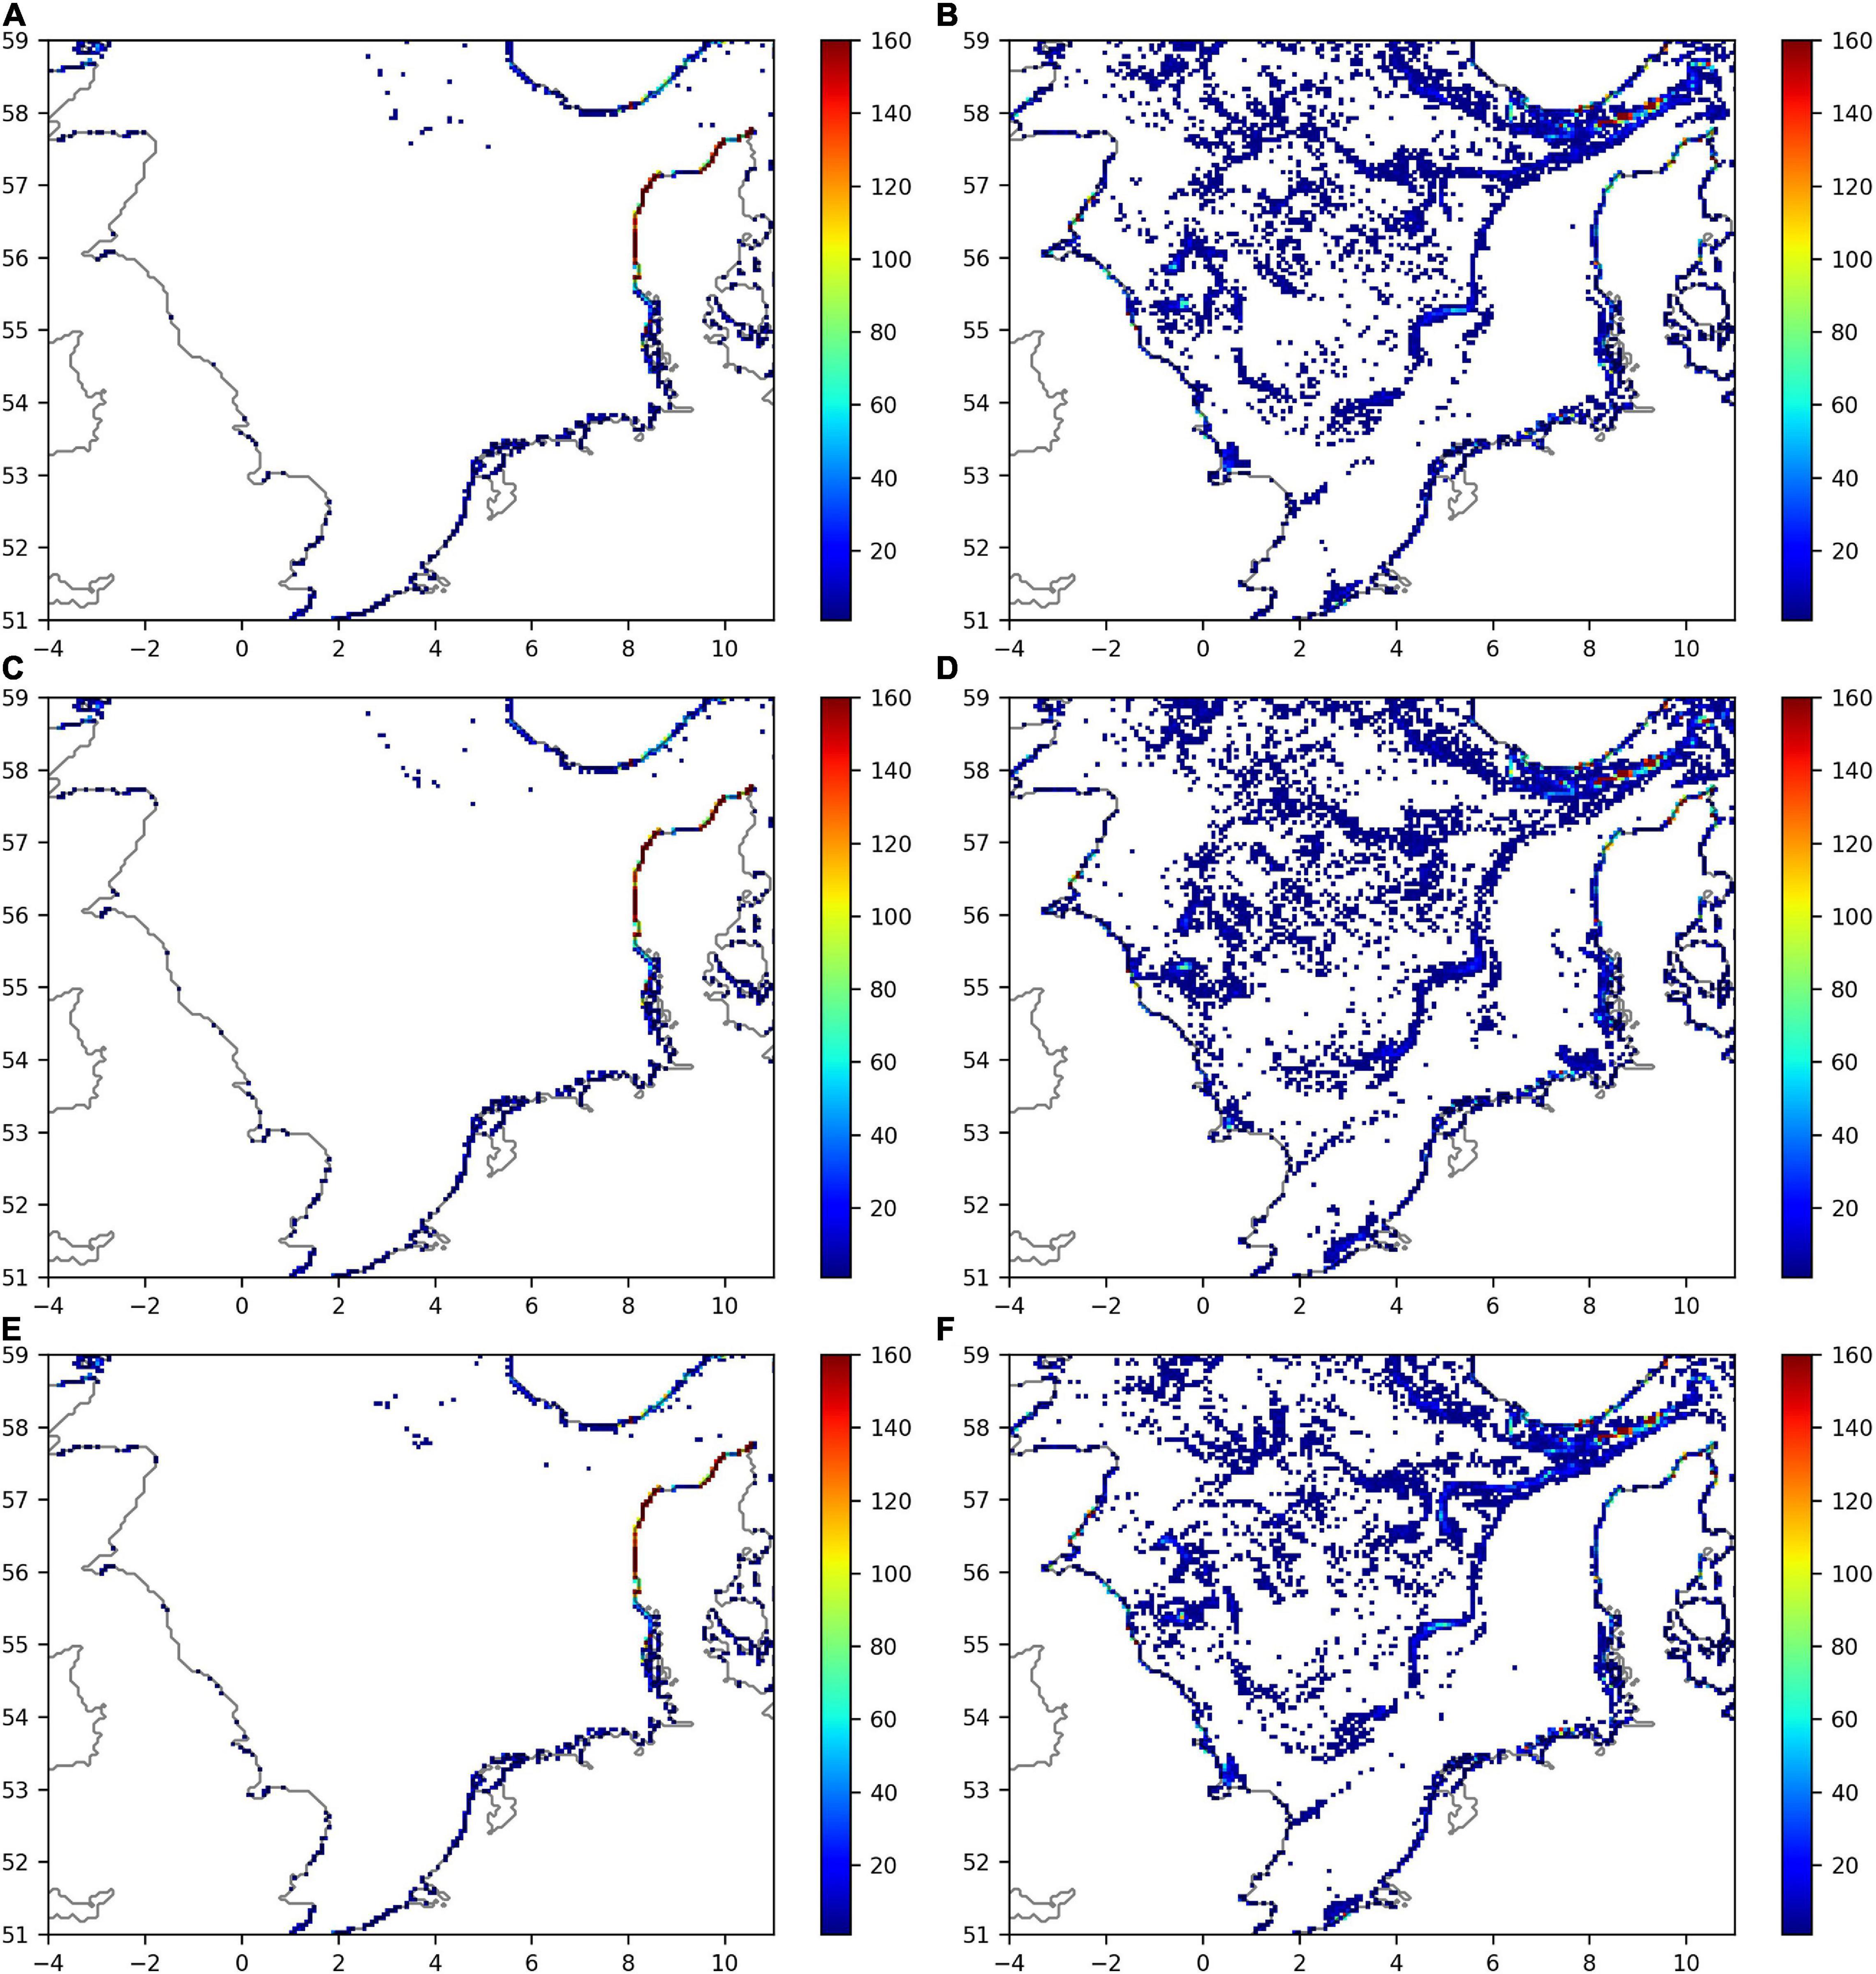
Figure 3. Particle densities (number of particles per grid cell) for the instantaneous release scenario on 30 December 2017. (A) Floating particles (0.06 ms–1), (B) sinking particles (−0.004 ms–1), (C) floating particles (0.05 ms–1), (D) sinking particles (−0.0015 ms–1), (E) floating particles (0.07 ms–1), (F) sinking particles (−0.006 ms–1). Coordinates are latitude and longitude in degrees.
Results for the proportional riverine release simulation case for floating particles (Figure 4A) showed, after a year, particles in elevated concentrations at sea in the Rhine plume, in low concentrations in a curved band across the North Sea from the UK to Denmark, and in the Skagerrak and the southern part of the Norwegian trench. Floating particles could still be at sea in this experiment as opposed to the uniform release experiment (Instantaneous Release Scenario), as here particles were released throughout the year. Particles had beached on all North Sea coasts, but in highest concentrations along the Dutch coast, the western Danish coast, and the southern tip of Norway. Sinking particles (Figure 4B) only rarely ended up offshore, and for most rivers, beached relatively near their river mouth of origin, resulting in high local particle concentrations. Apparently, transport mechanisms to bring coastally released sinking particles (far) offshore were weak, so this experiment does not show the offshore accumulations of sinking particles evident in the uniform release scenario, where particles started out offshore (Instantaneous Release Scenario). Also for this model experiment, the simulations with vertical particle velocities at the ends of the ranges resulted in similar distribution patterns (Figures 4C–F). In these results, the magnitude of the concentrations should not be interpreted as a realistic reflection of reality, as the assumed intensity of particles released proportionally to river runoff in the model is probably a strong simplification (other factors, such as population density and habits are likely to modulate this). Moreover, rivers are not the only sources of marine microplastics.
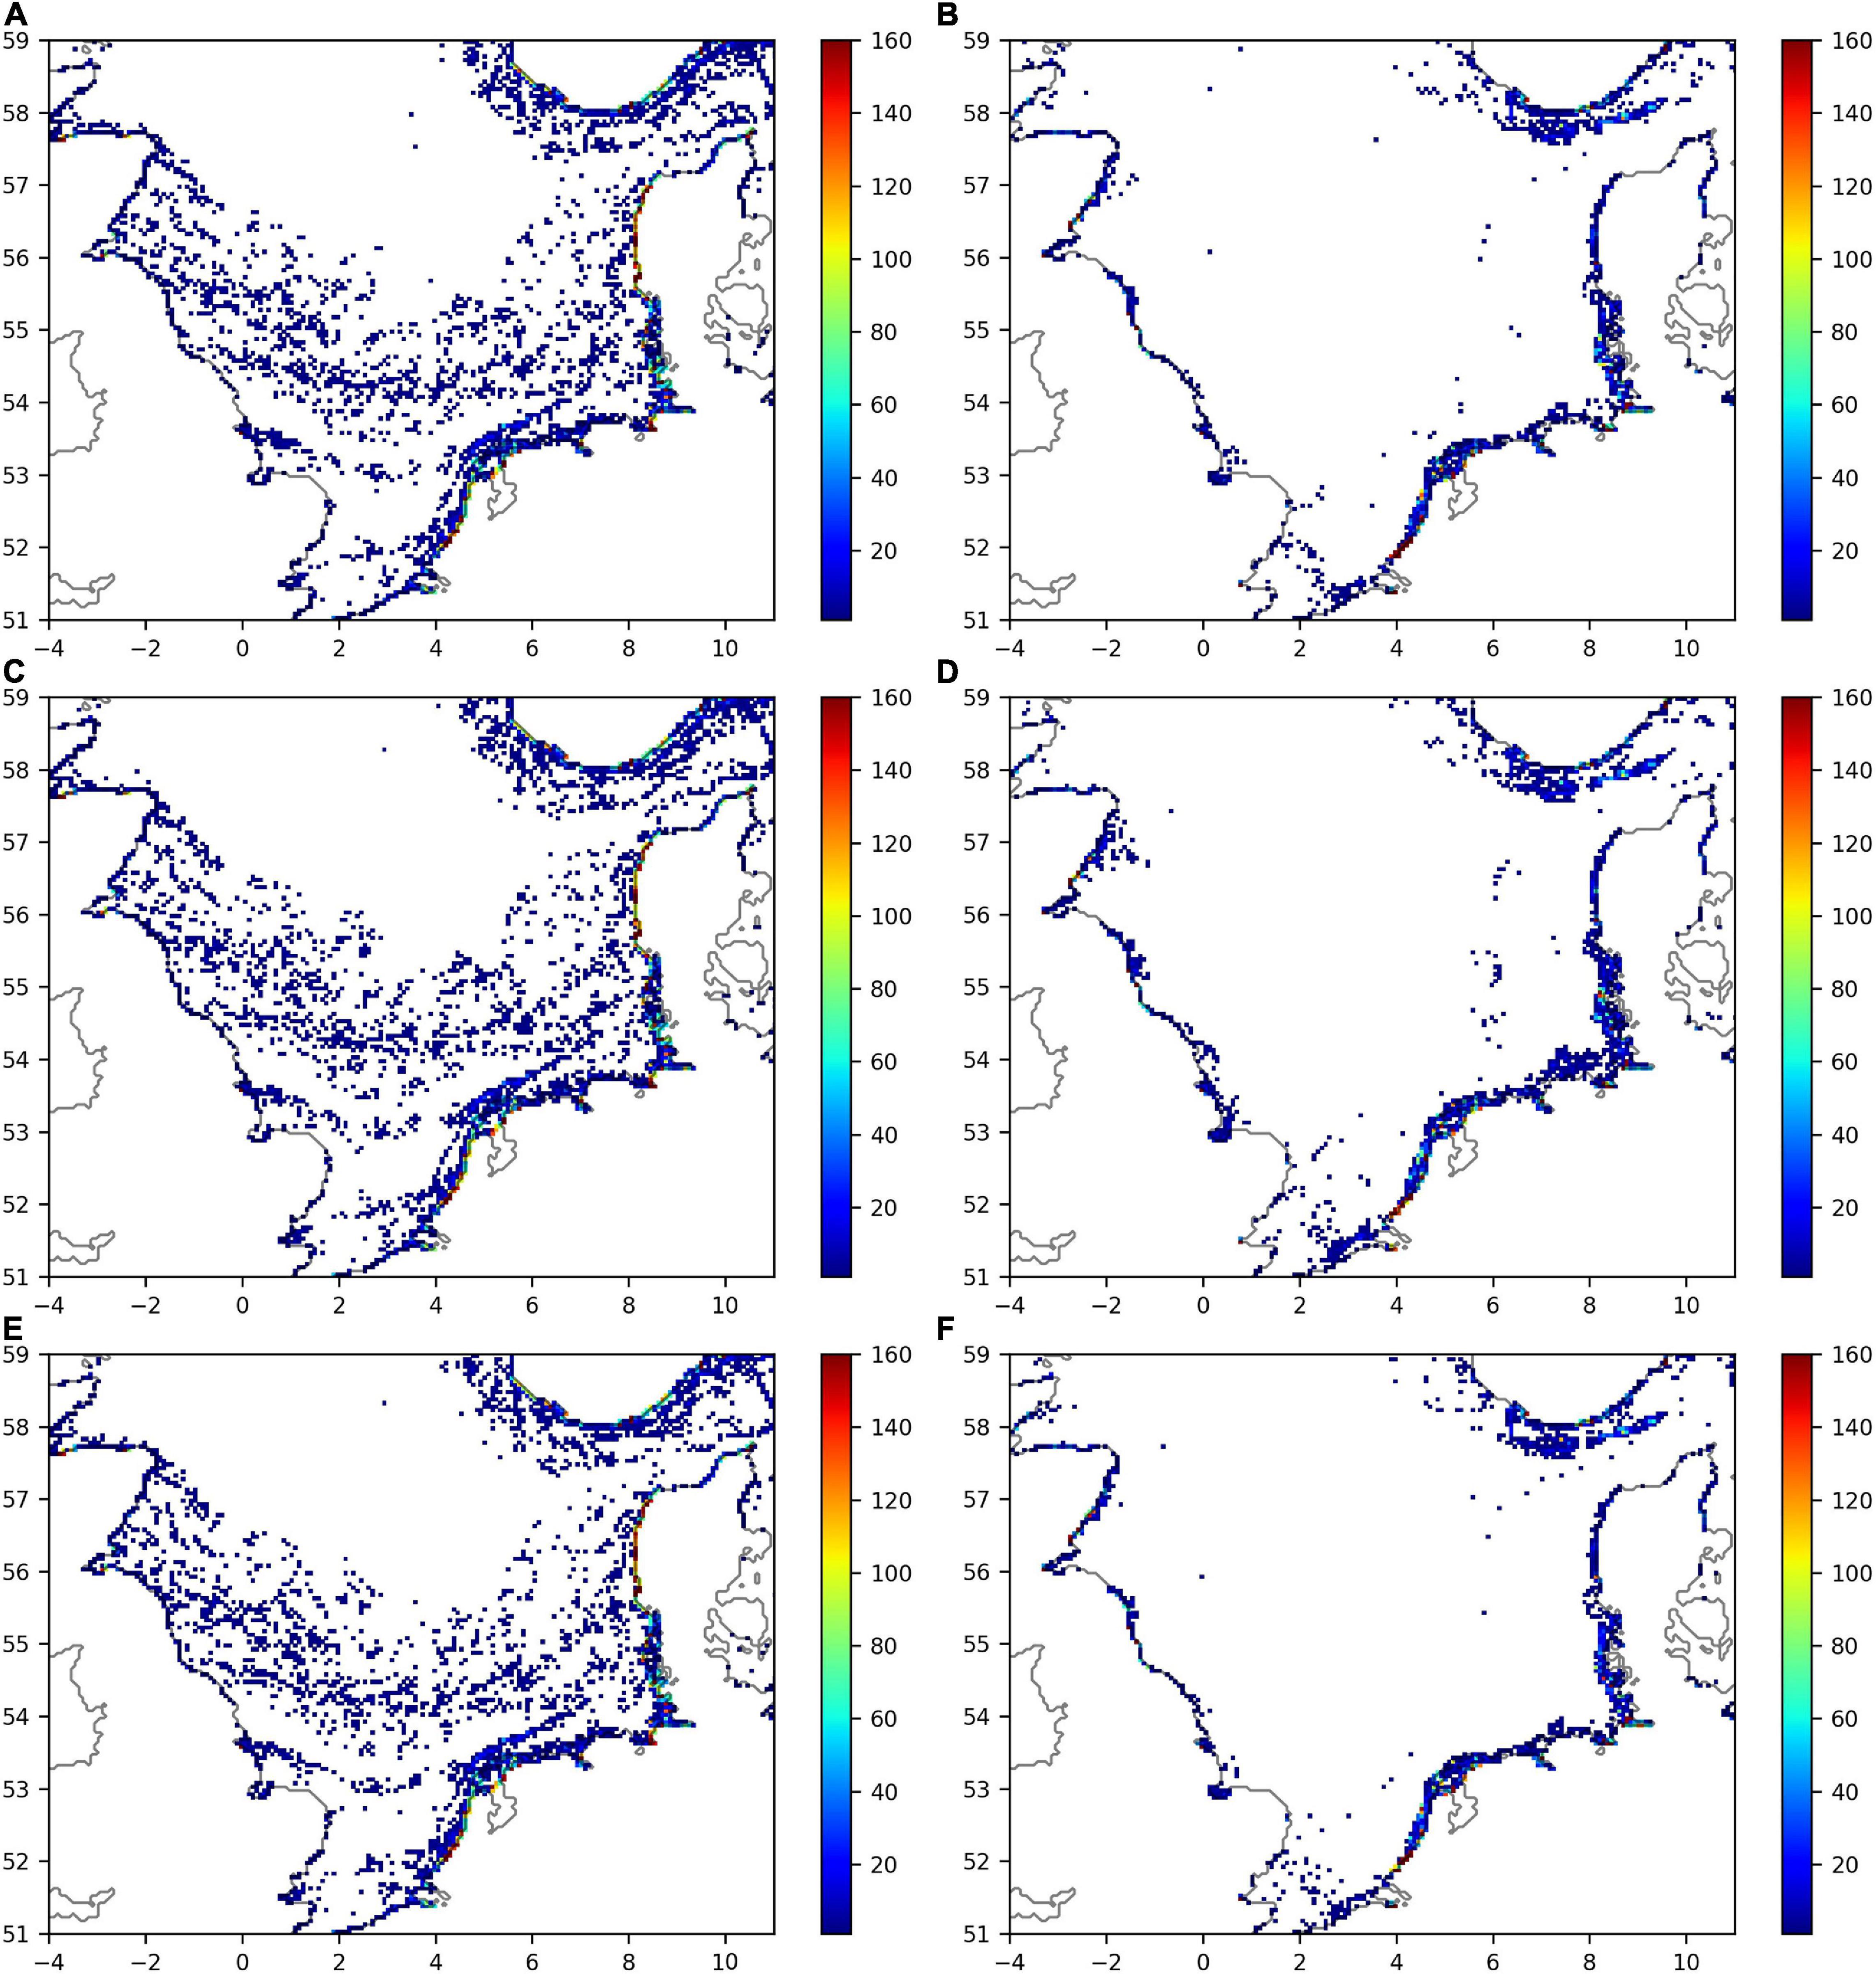
Figure 4. Particle densities (number of particles per grid cell) for the proportional release experiment. (A) Density on 30 December 2017 for floating particles (0.06 ms–1), (B) density on 30 December 2017 for sinking particles (−0.004 ms–1), (C) floating particles (0.05 ms–1), (D) sinking particles (−0.0015 ms–1), (E) floating particles (0.07 ms–1), (F) sinking particles (−0.006 ms–1). Coordinates are latitude and longitude in degrees.
In total, participants of the “Waddenplastic” citizen science project collected 440 individual observations between 01-01-2019 and 01-03-2019. Results demonstrate that the highest pellets densities (particularly the > 100 class, and 11–100 to a lesser degree) typically occurred at the most eastern Dutch Wadden Sea Islands (Schiermonnikoog and Rottum), and the mainland behind them (Figure 5). The majority of these observations were collected in the first 3 weeks after the incident, but do extend to the end of February 2019, as indicated by the bar plots (Figures 5B,D,F,H).
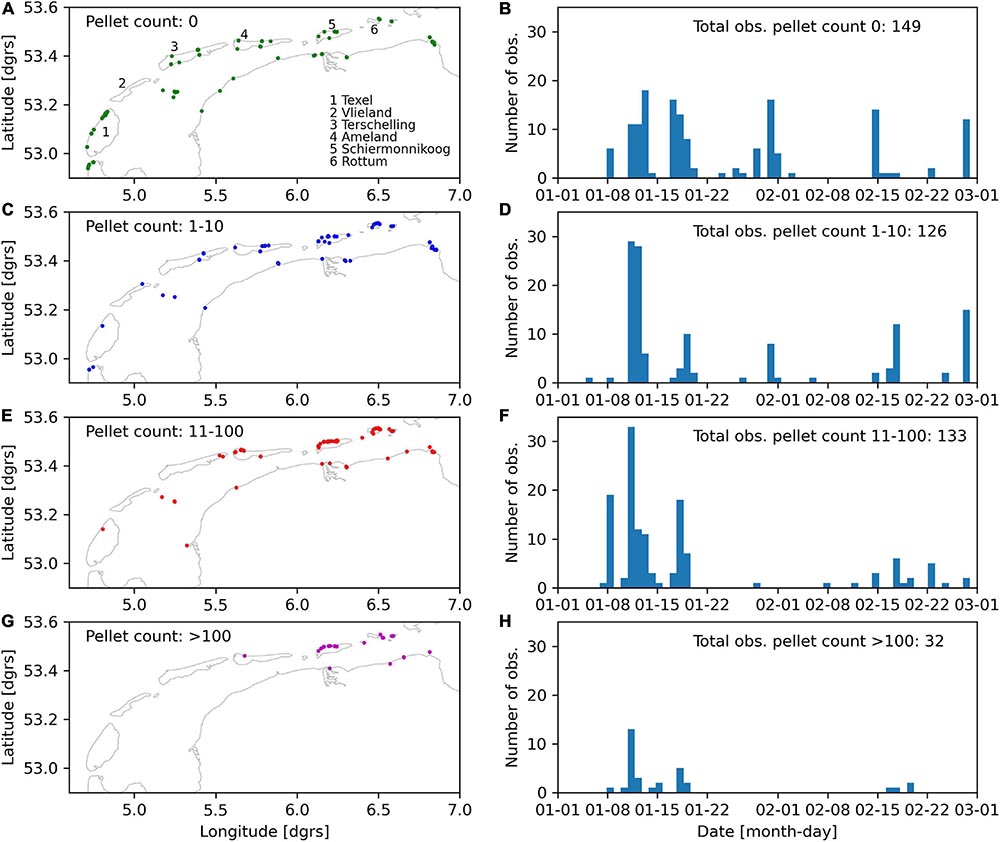
Figure 5. Observations of HDPE pellets at the surface in a 0.4 × 0.4 m rectangle, entered on (See text footnote 5) in January and February 2019; maps of spatial distribution and histograms with number of observations per day. (A,B) No pellets, (C,D) 1–10 pellets, (E,F) 11–100 pellets, (G,H) more than 100 pellets. Locations are in decimal degrees latitude and longitude. Every mark is a separate observation, i.e., each location was visited once.
For the experiment with a mid-range vertical particle velocity, around 50% of the particles representing floating HDPE pellets beached within 3 weeks in our model simulations (Figure 6B) under conditions of winds with a significant northerly component (Figure 6A). Simulations with vertical particle velocities at the ends of the range gave nearly identical results, and are not shown here. For the high horizontal diffusion coefficient of 12 m2s–1 around 50% of the particles representing floating HDPE pellets beached within 10 days, and more than 90% had beached within 17 days. Particles representing sinking PS grains remained active for much longer, with 50% still moving after 6 weeks for the high horizontal diffusion coefficient of 12 m2s–1 that showed the most rapid decline in the number of active particles (Figure 6C). For the experiments with a high horizontal diffusion coefficient of 12 m2s–1 the particles with the smallest sinking velocity remained active the longest.
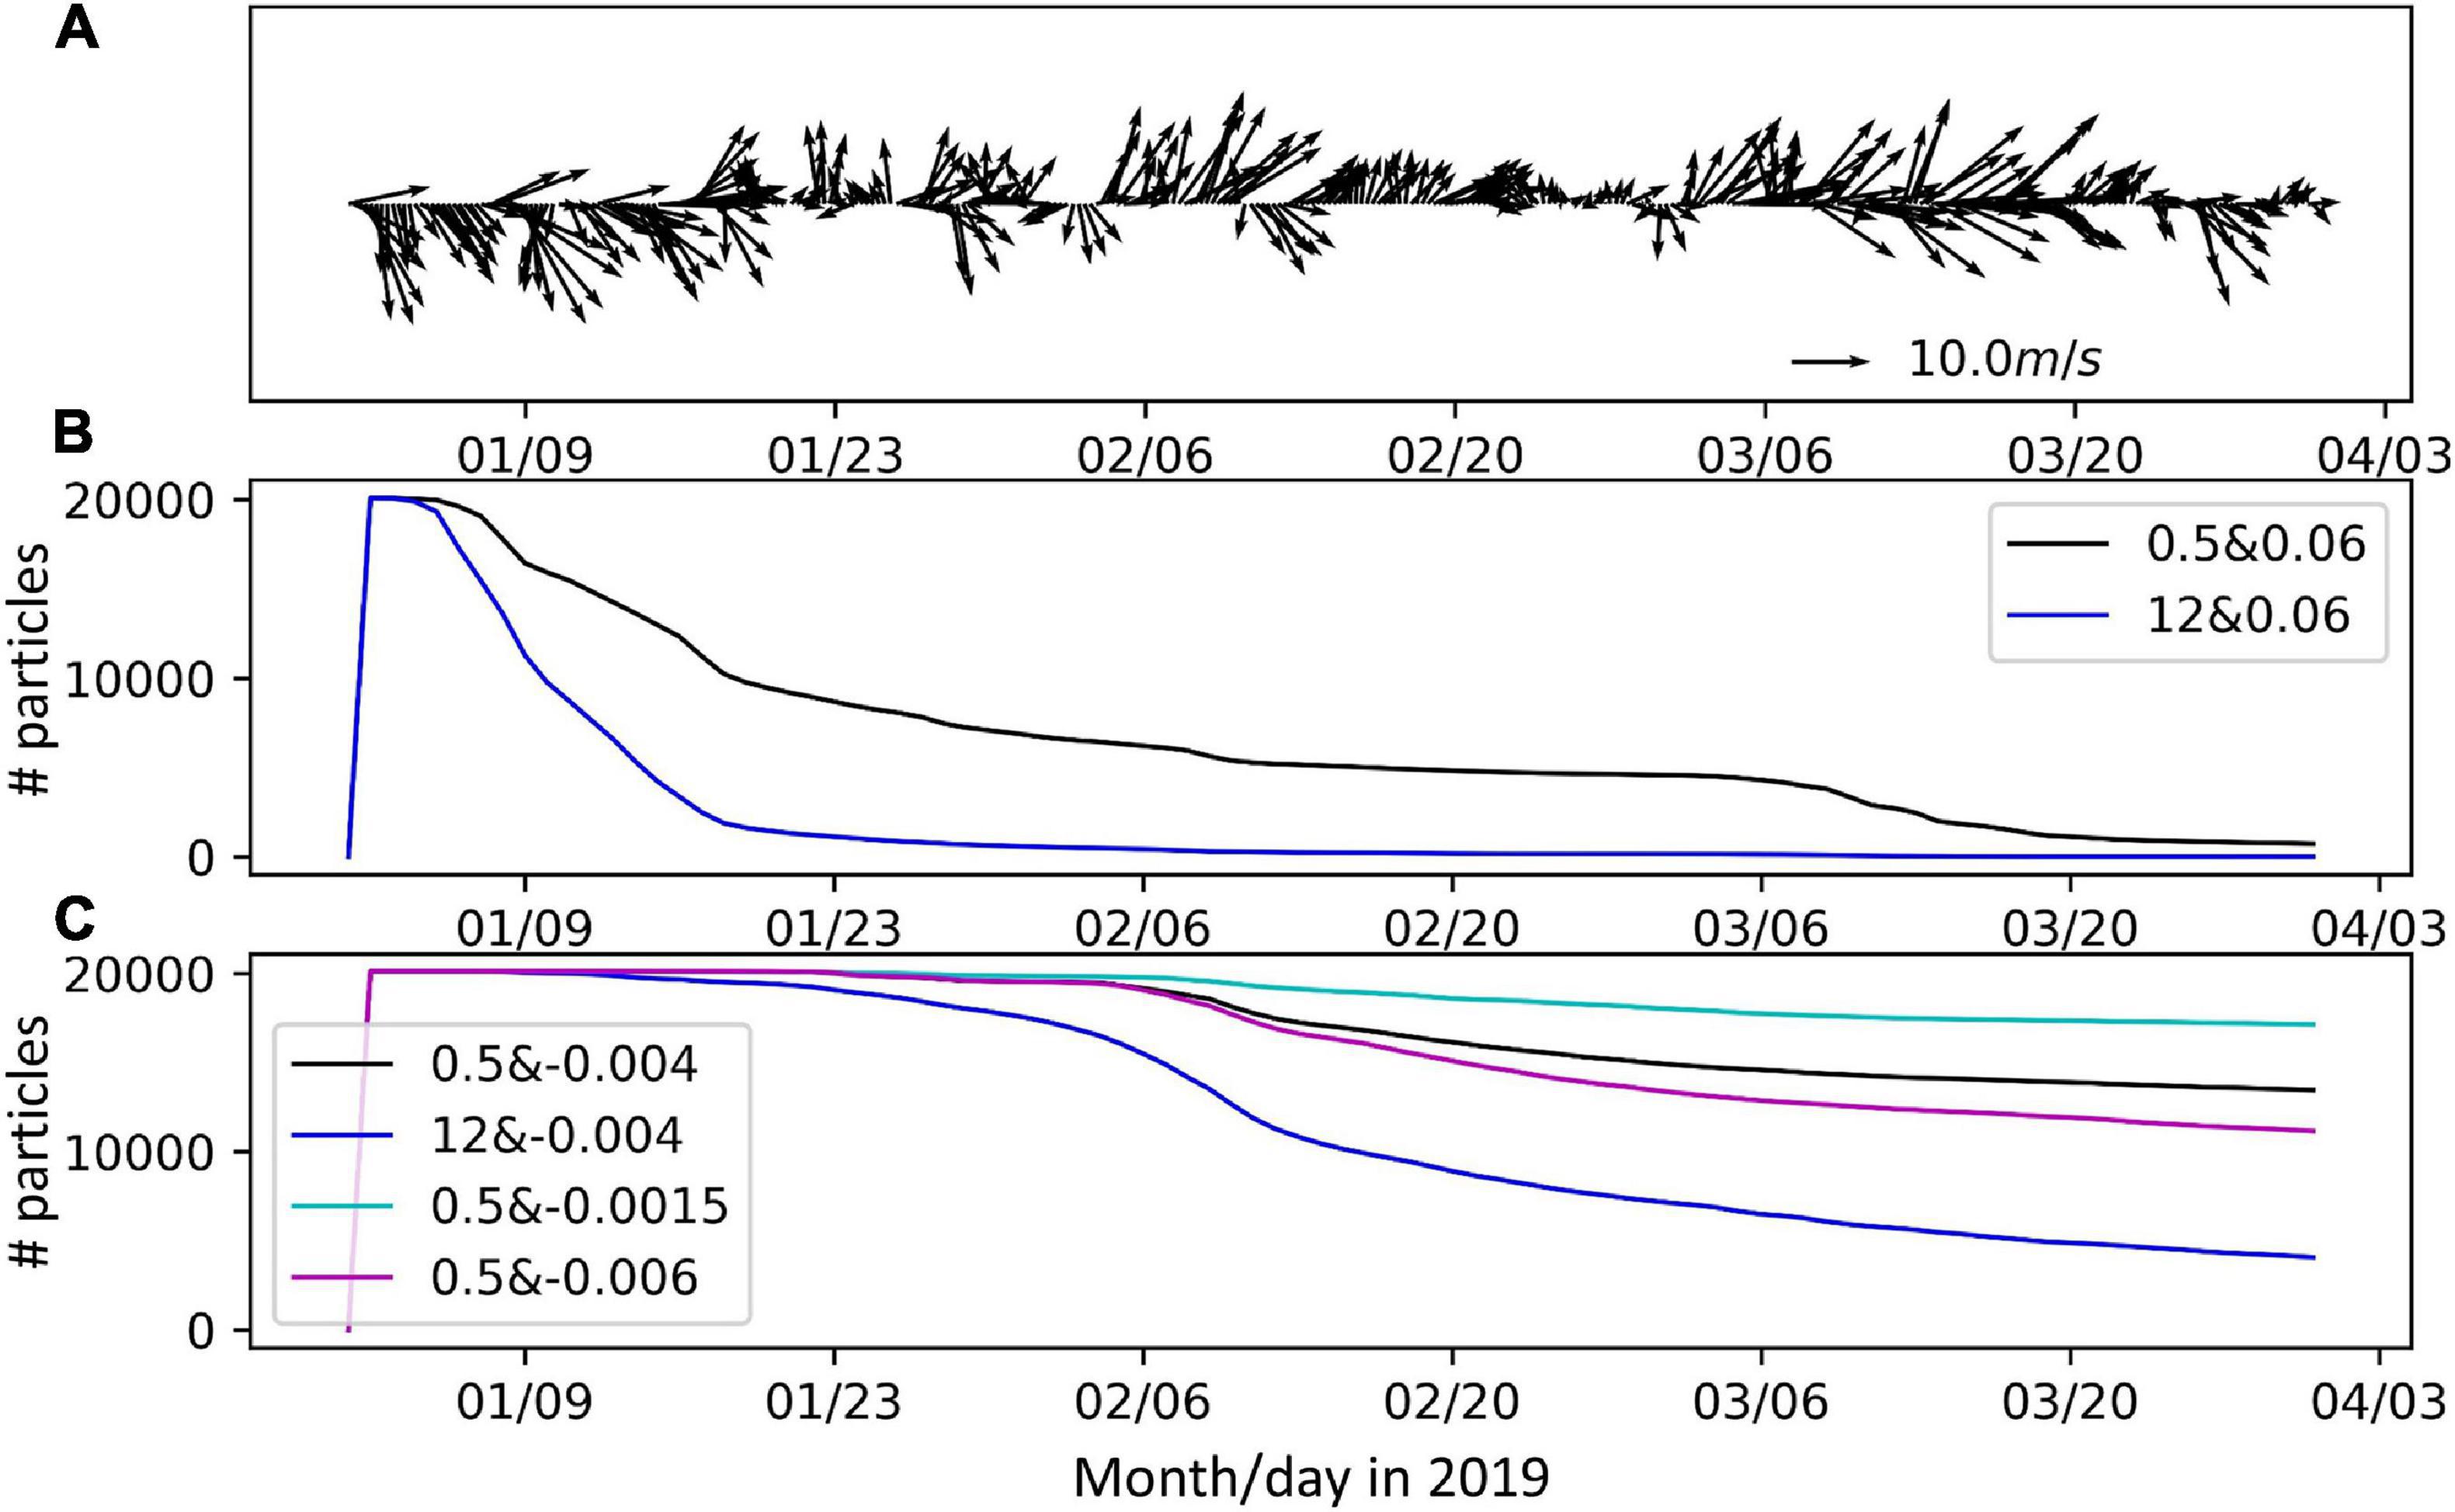
Figure 6. Time series of the simulated aftermath of the MSC Zoe incident. (A) Wind speed and direction to the north of Ameland (53.5N, 5.75E) at 6 h intervals from the ECMWF ERA5 reanalysis; (B) number of live particles representing HDPE pellets released along the trajectory of MSC Zoe; (C) number of live particles representing PS grains released along the trajectory of MSC Zoe. Legend: combination of diffusion coefficient and vertical particle velocity.
The reconstruction of the most likely release areas of the floating HDPE pellets are given in Figure 7 for the mid-range vertical particle velocity and both horizontal diffusion coefficients. The magenta rectangle represents the area where most pellets were found5 (Figure 5). The density of modeled particles in this area is plotted at a time when most particles had beached. Also plotted is the density of the same particles at their release positions on the trajectory of MSC Zoe. Of some of the particles, the tracks are also plotted to give an impression of the dispersal pathways. The density of particles on the trajectory of MSC Zoe can be interpreted as an indication of the probability of where the HDPE pellets were lost. The tracks suggest that the pellets first drifted in a south-westerly direction, then, after a change in wind speed and direction, in a south-easterly direction, and finally roughly along the coast to the east. The initial drift was more to the west than the wind direction, because of the Coriolis effect and because northerly winds set up a clock-wise circulation in the North Sea (Furnes, 1980). The results for the high horizontal diffusion coefficient were similar, but more smoothed than those for the low coefficient. The model results suggest that the highest release probability was north of Ameland and (western) Schiermonnikoog. Within this region, locations where cargo was found on the sea bed include north of the western side of Ameland, north of the inlet between Ameland and Schiermonnikoog, and north of the eastern end of Schiermonnikoog (Rijkswaterstaat, pers. comm.).

Figure 7. Results of reconstruction of the most likely release areas of HDPE pellets. The relative density of particles (fraction of the total number of particles released per 1 × 1 km rectangle) that arrived in the magenta rectangle is shown. Also shown is the relative density of the same particles (fraction of the total number of particles released per 1 × 1 km rectangle) at their starting positions along the trajectory of MSC Zoe. In addition, the tracks of a subset of these particles is show. The gray line is the the coast line. With a vertical velocity of 0.06 ms–1 and: (A) a horizontal diffusion coefficient of 0.5 m2s–1, (B) a horizontal diffusion coefficient of 12 m2s–1.
Dedicated release experiments from the four locations in the vicinity of Ameland and Schiermonnikoog where recovery operations suggested that containers were lost (Figure 8) showed that the position north of the inlet between Ameland and Schiermonnikoog gives a spatial distribution pattern that corresponds best with the observations from (See text footnote 5) (Figure 5). The release locations north of the western side of Ameland result in high densities of particles on Ameland which were not observed. Moreover, the release location to the north of the eastern end of Schiermonnikoog results in a low number of particles beaching on Schiermonnikoog, and none to the west, also not corresponding with observations. The experiment with a vertical particle velocity of 0.05 ms–1 for the position north of the inlet between Ameland and Schiermonnikoog (Figure 9E) resulted in very similar distributions as for the mid-range vertical particle velocity (Figure 9C). The experiment with the high horizontal diffusion coefficient of 12 m2s–1 resulted in more spatial spread of the particles, and higher concentrations due to a higher rate of beaching (Figure 9F).
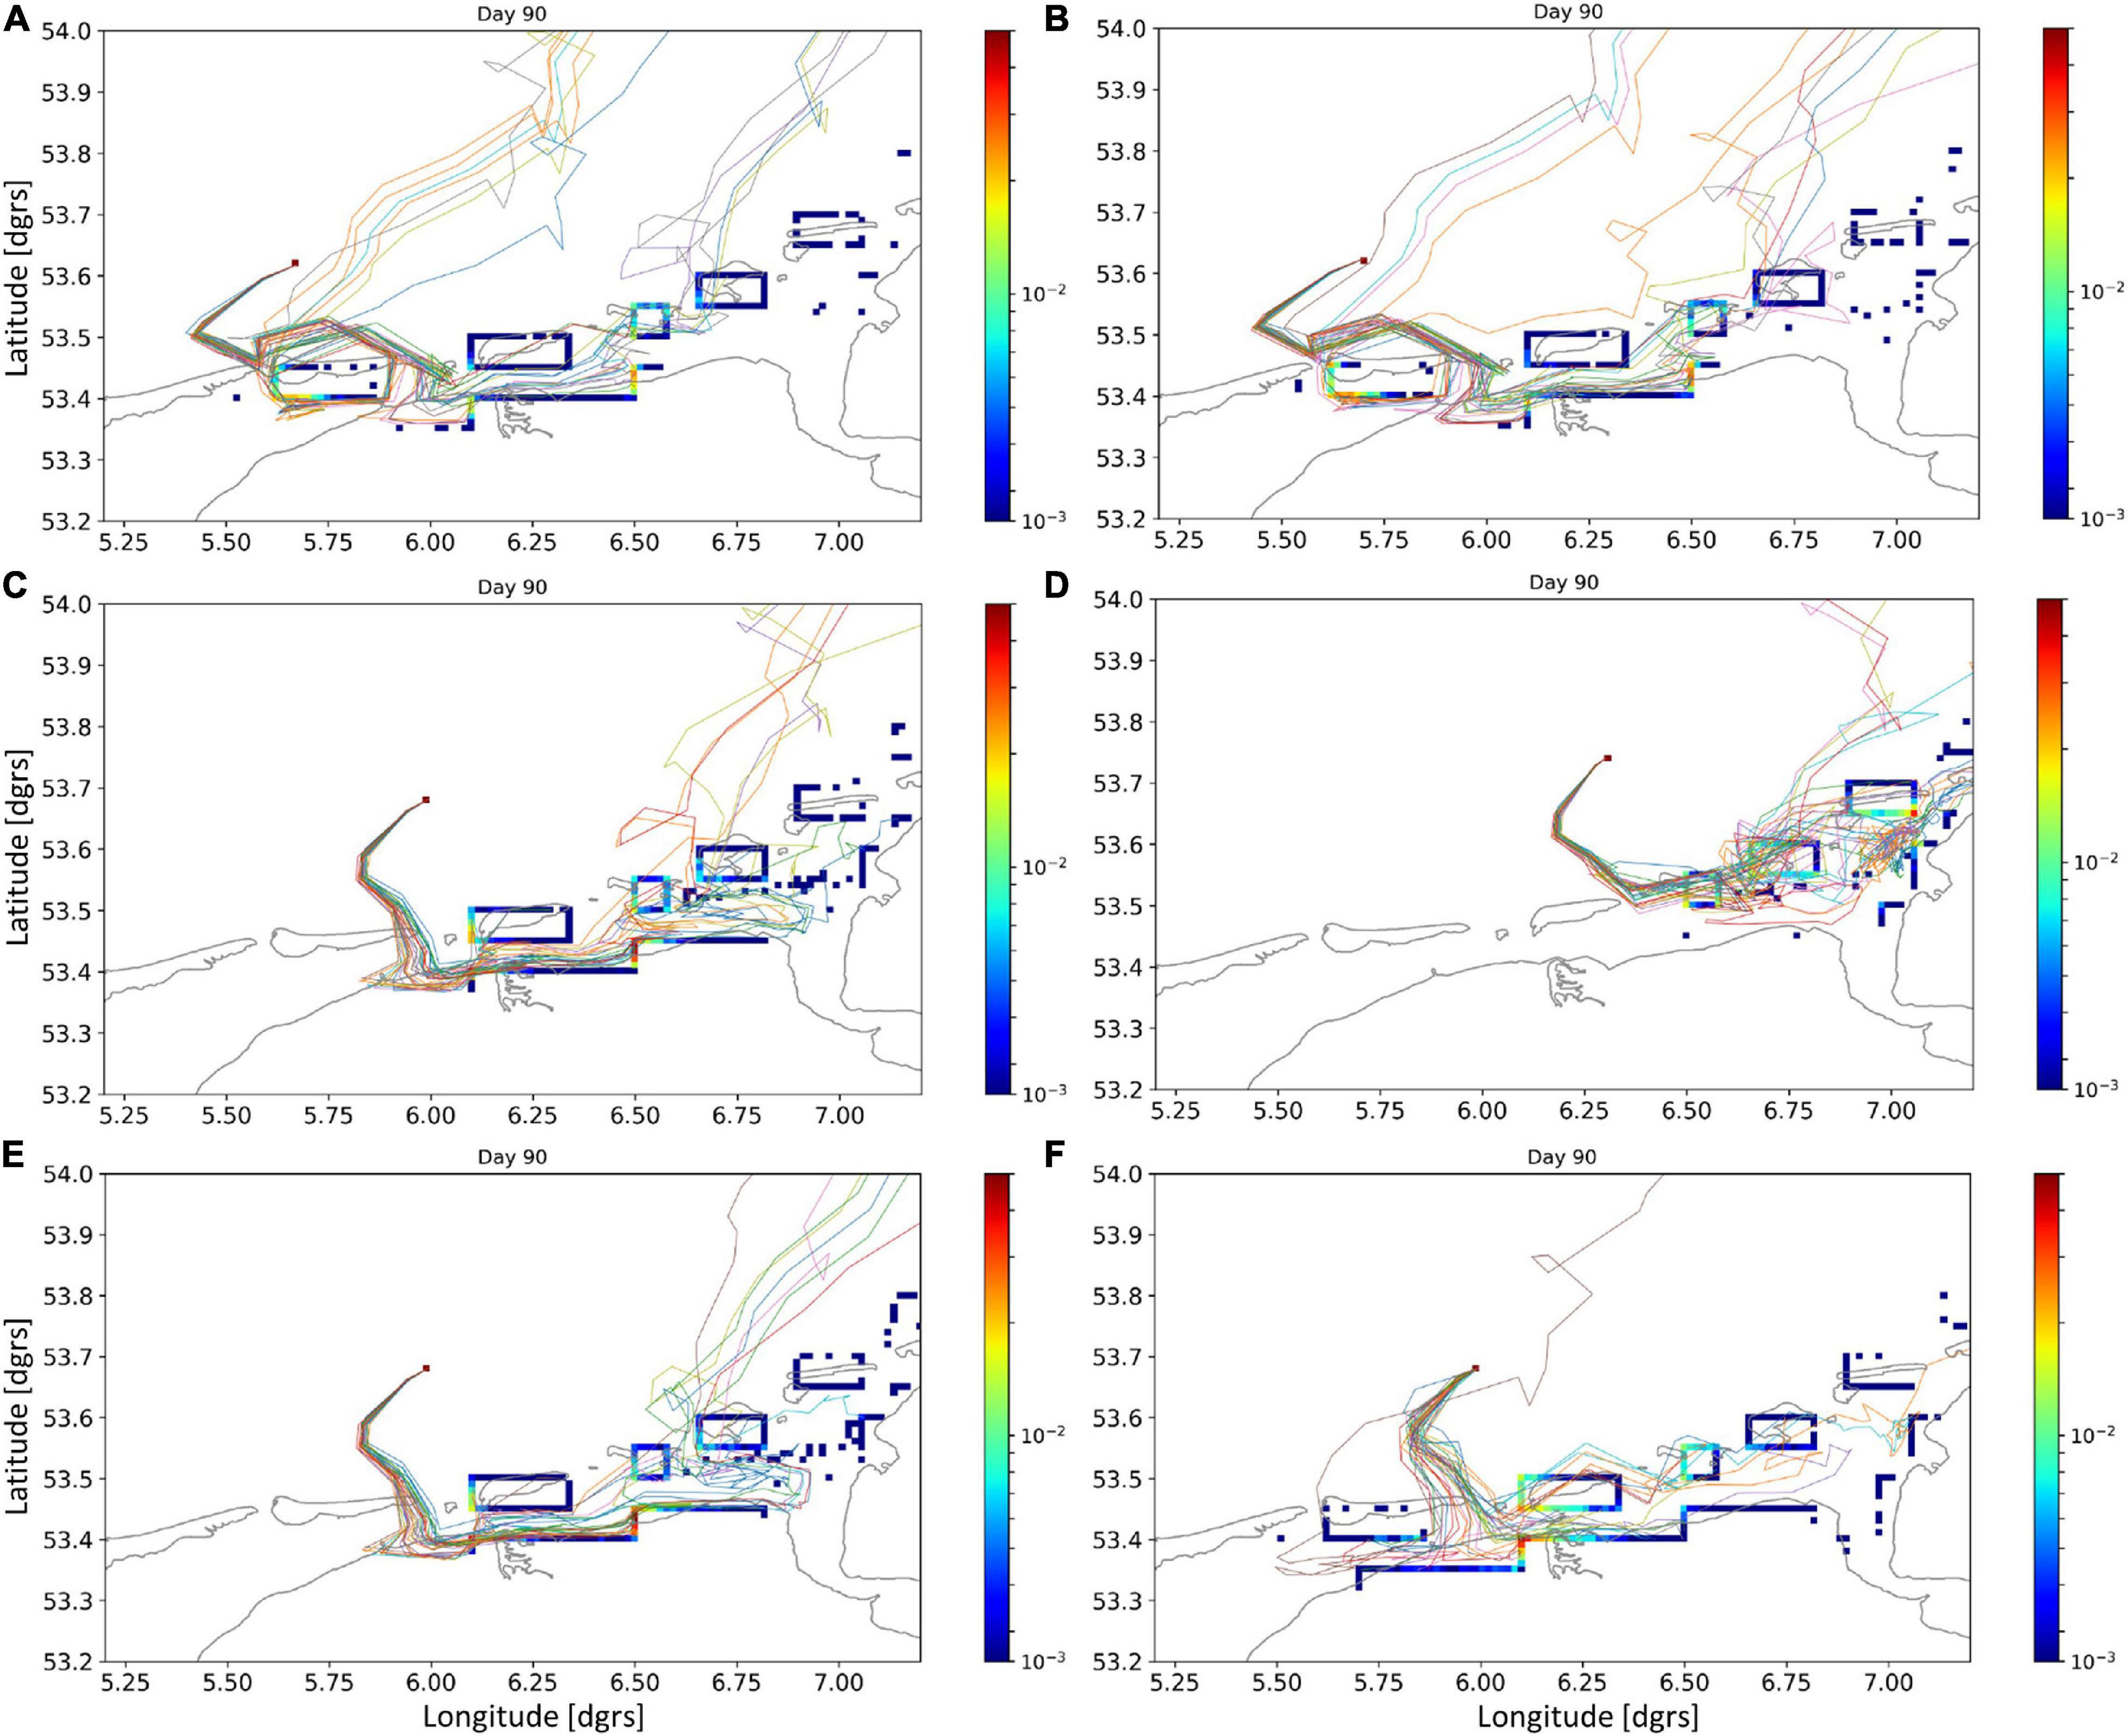
Figure 8. Results of releases of particles representing HDPE pellets from positions of estimated container loss (Rijkswaterstaat, pers. comm.) within the area of high release probability (Figure 7). Colors represent the fraction of particles released that arrived in a 1 × 1 km rectangle. (A–D) For the four estimated positions of container loss with a vertical velocity of 0.06 ms–1 and a diffusion coefficient of 0.5 m2s–1. (E,F): As (C), but with a vertical velocity of 0.05 ms–1 and a diffusion coefficient of 12 m2s–1, respectively.
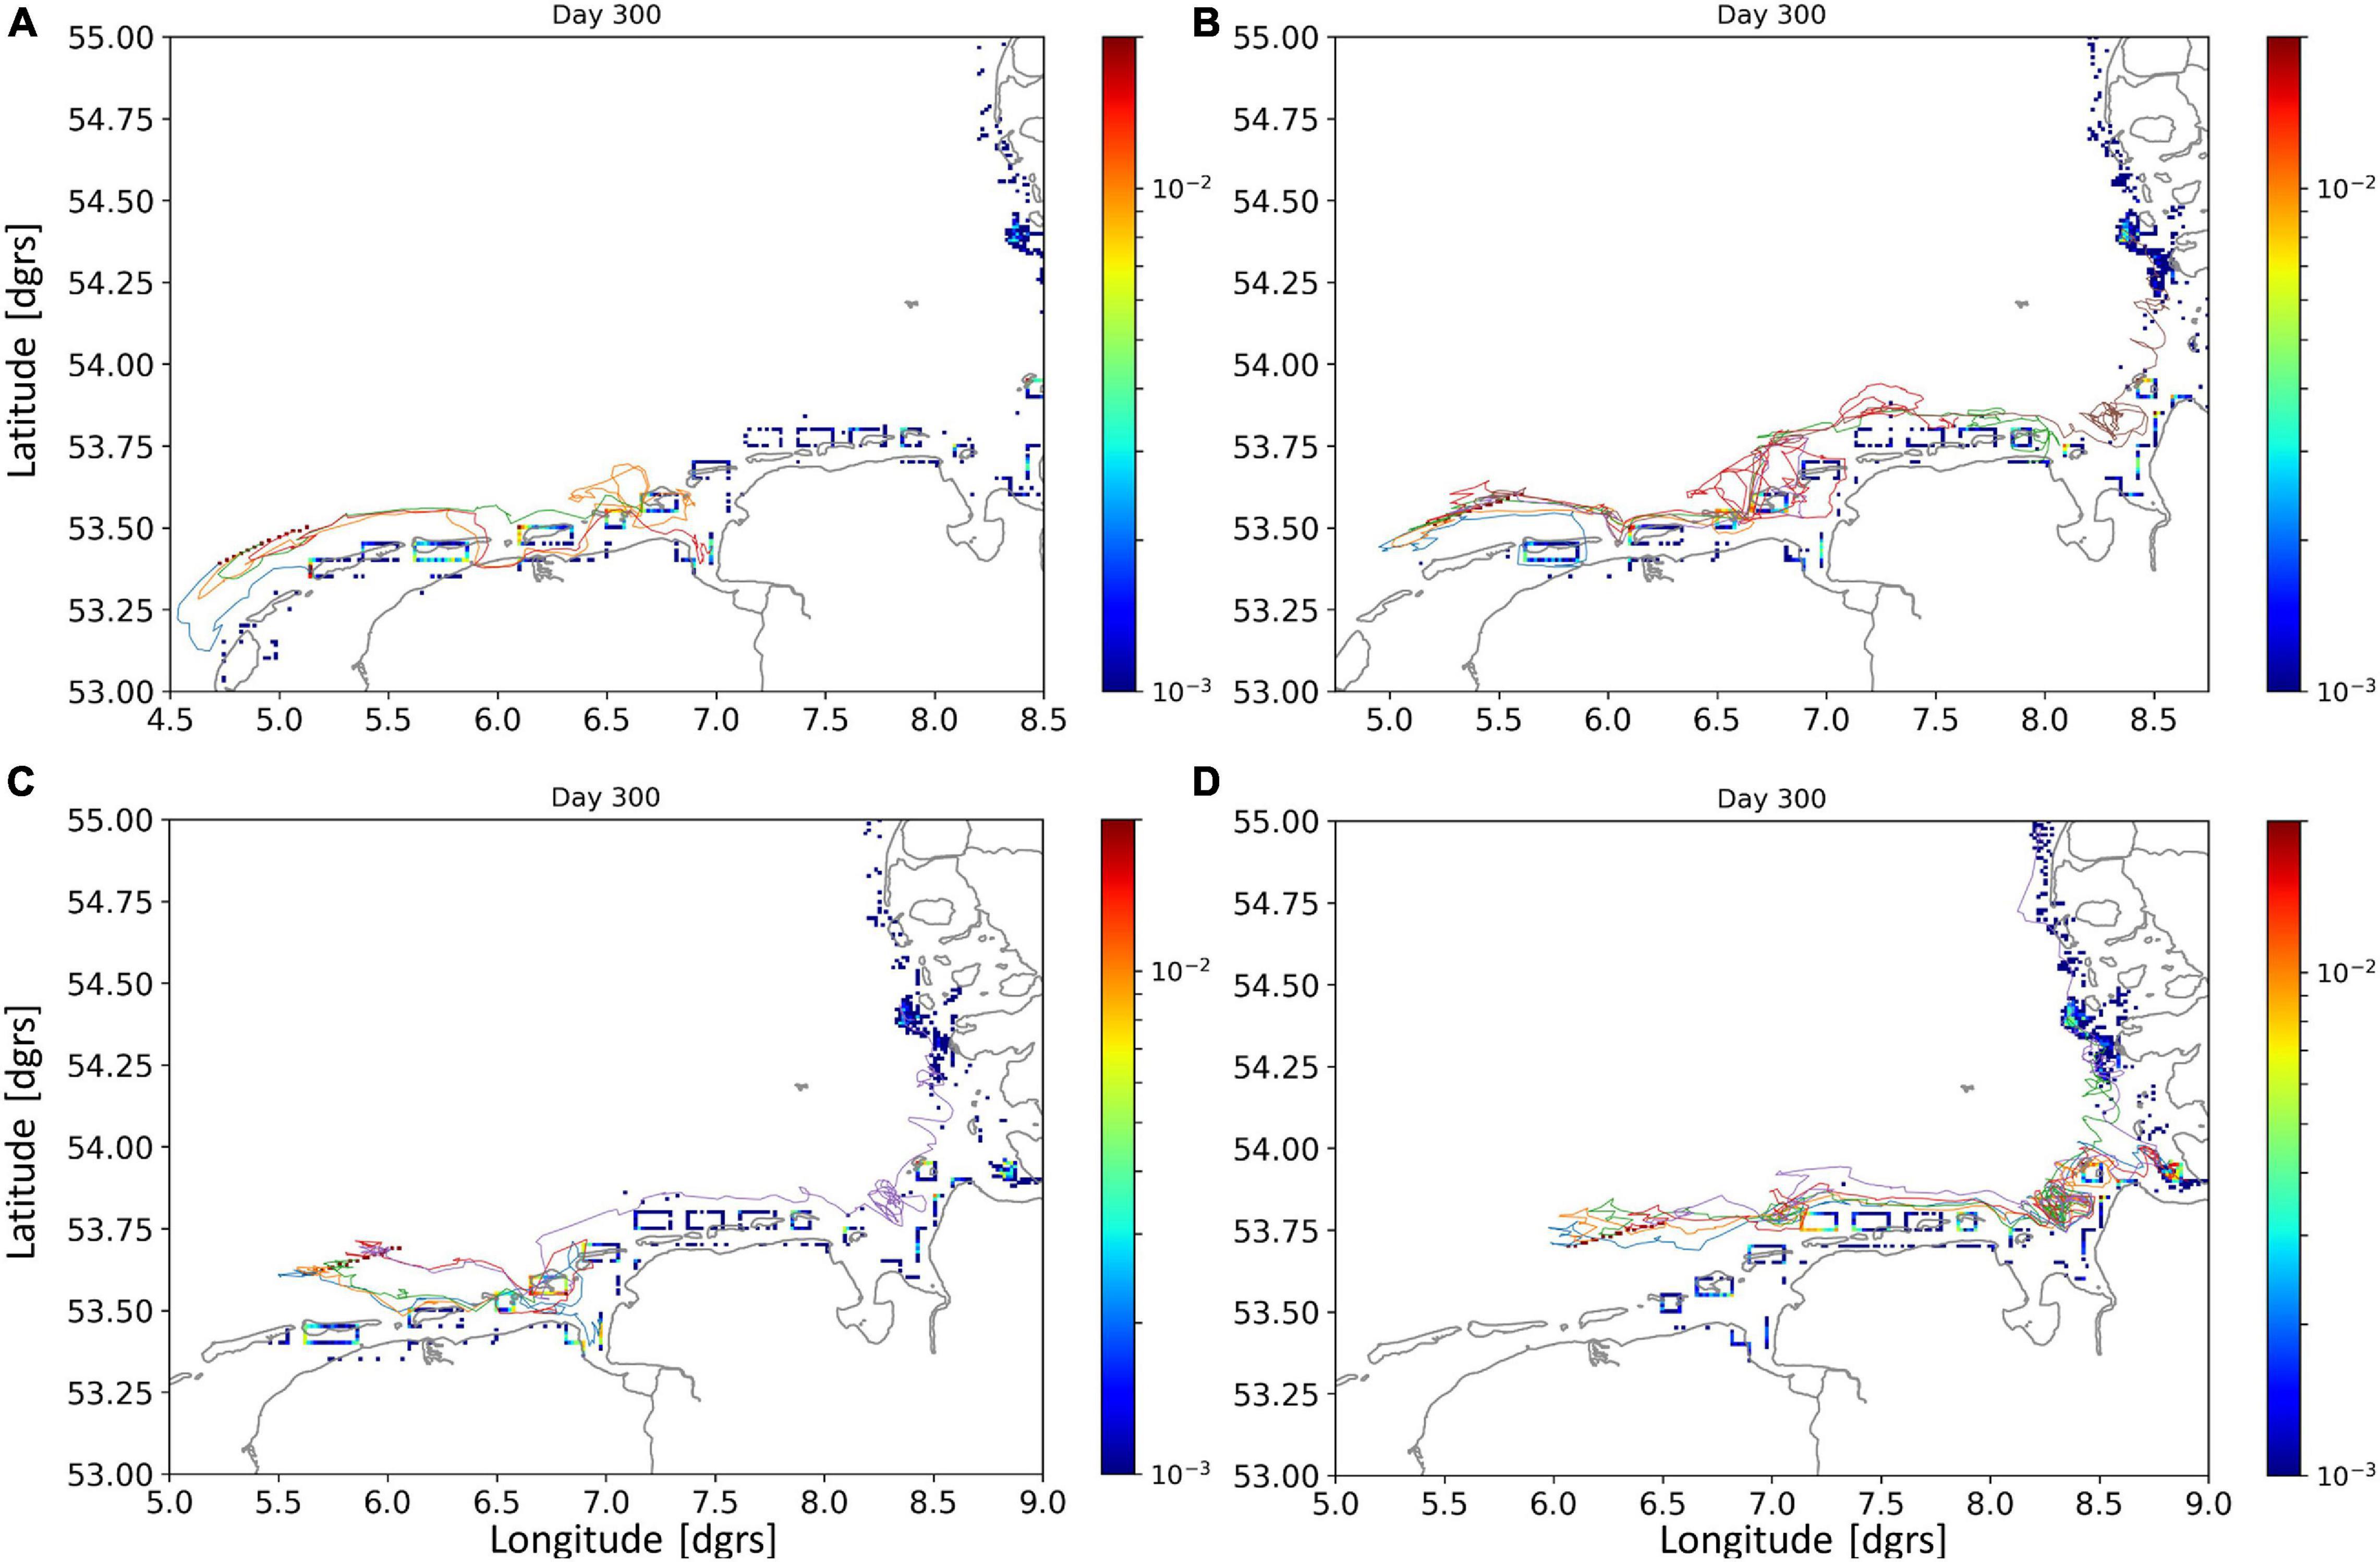
Figure 9. Results of releases of particles representing PS grains from four parts of the trajectory of MSC Zoe. Colors represent the fraction of particles released that arrived in a 1 × 1 km rectangle. Vertical velocity was −0.004 ms–1 and the horizontal diffusion coefficient was 0.5 m2s–1.
The tracking results of the particles representing sinking PS grains (Figure 9) released on the four sections of the trajectory of the MSC Zoe suggests that the grains remained much more offshore than the floating HDPE pellets, took much longer to reach the coast, and were transported much further to the east. Of all these sections, many particles (for numbers see Table 3) reached the German coast. Also, from the first three sections, particles reached Schiermonnikoog, and for all four sections the area between Ameland and the German border. Hence, within the Netherlands, and without additional information, this may be the area with the highest probability to find PS grains released by MSC Zoe in the field. For all four sections, higher modeled particle densities were simulated typically on the western ends of the islands. Along the coast of the main land, the shore south of Schiermonnikoog received high densities of particles from the releases on all but the easternmost section of the trajectory of the MSC Zoe. Larger sinking velocities resulted in less transport to the east as demonstrated for the third part of the trajectory (Figures 10A–C). High horizontal diffusion also resulted in less transport to the east (Figure 10D).
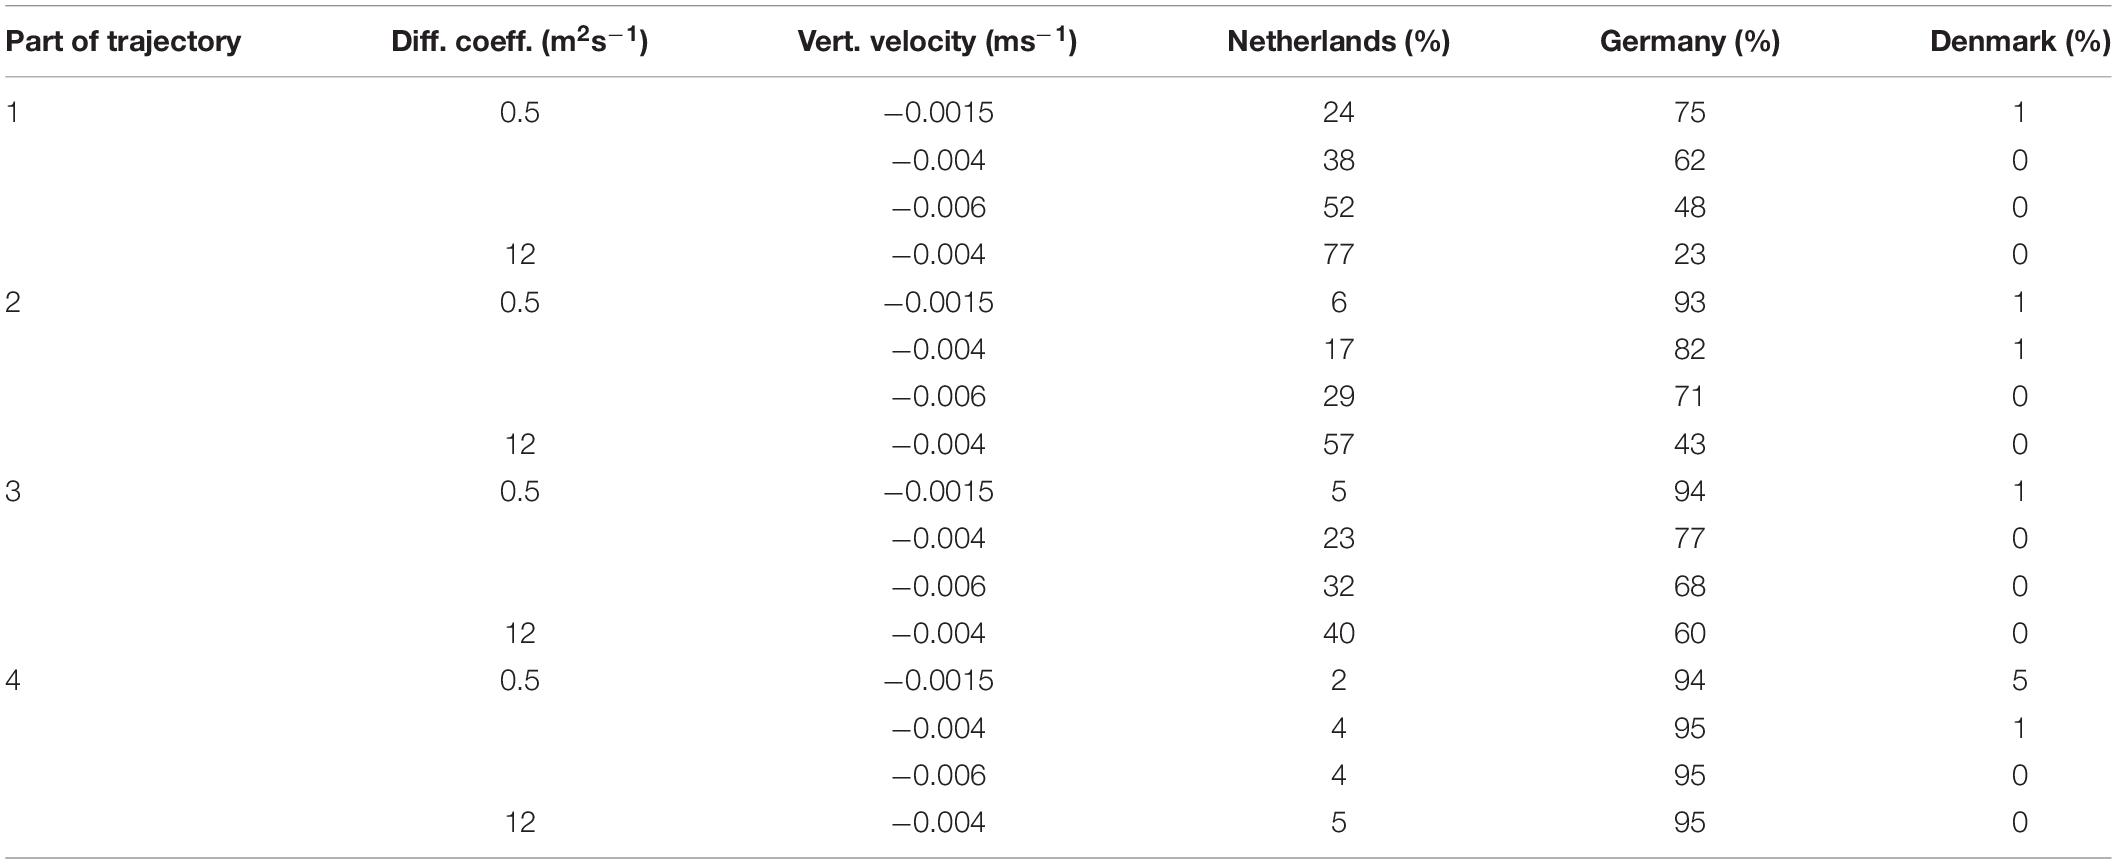
Table 3. Percentage of particles representing PS grains remaining in the Netherlands, or reaching Germany or Denmark, for releases on four parts of the trajectory of MSC Zoe (see also Figure 9), and different settings for the vertical partical velocity and horizontal diffusion coefficient.
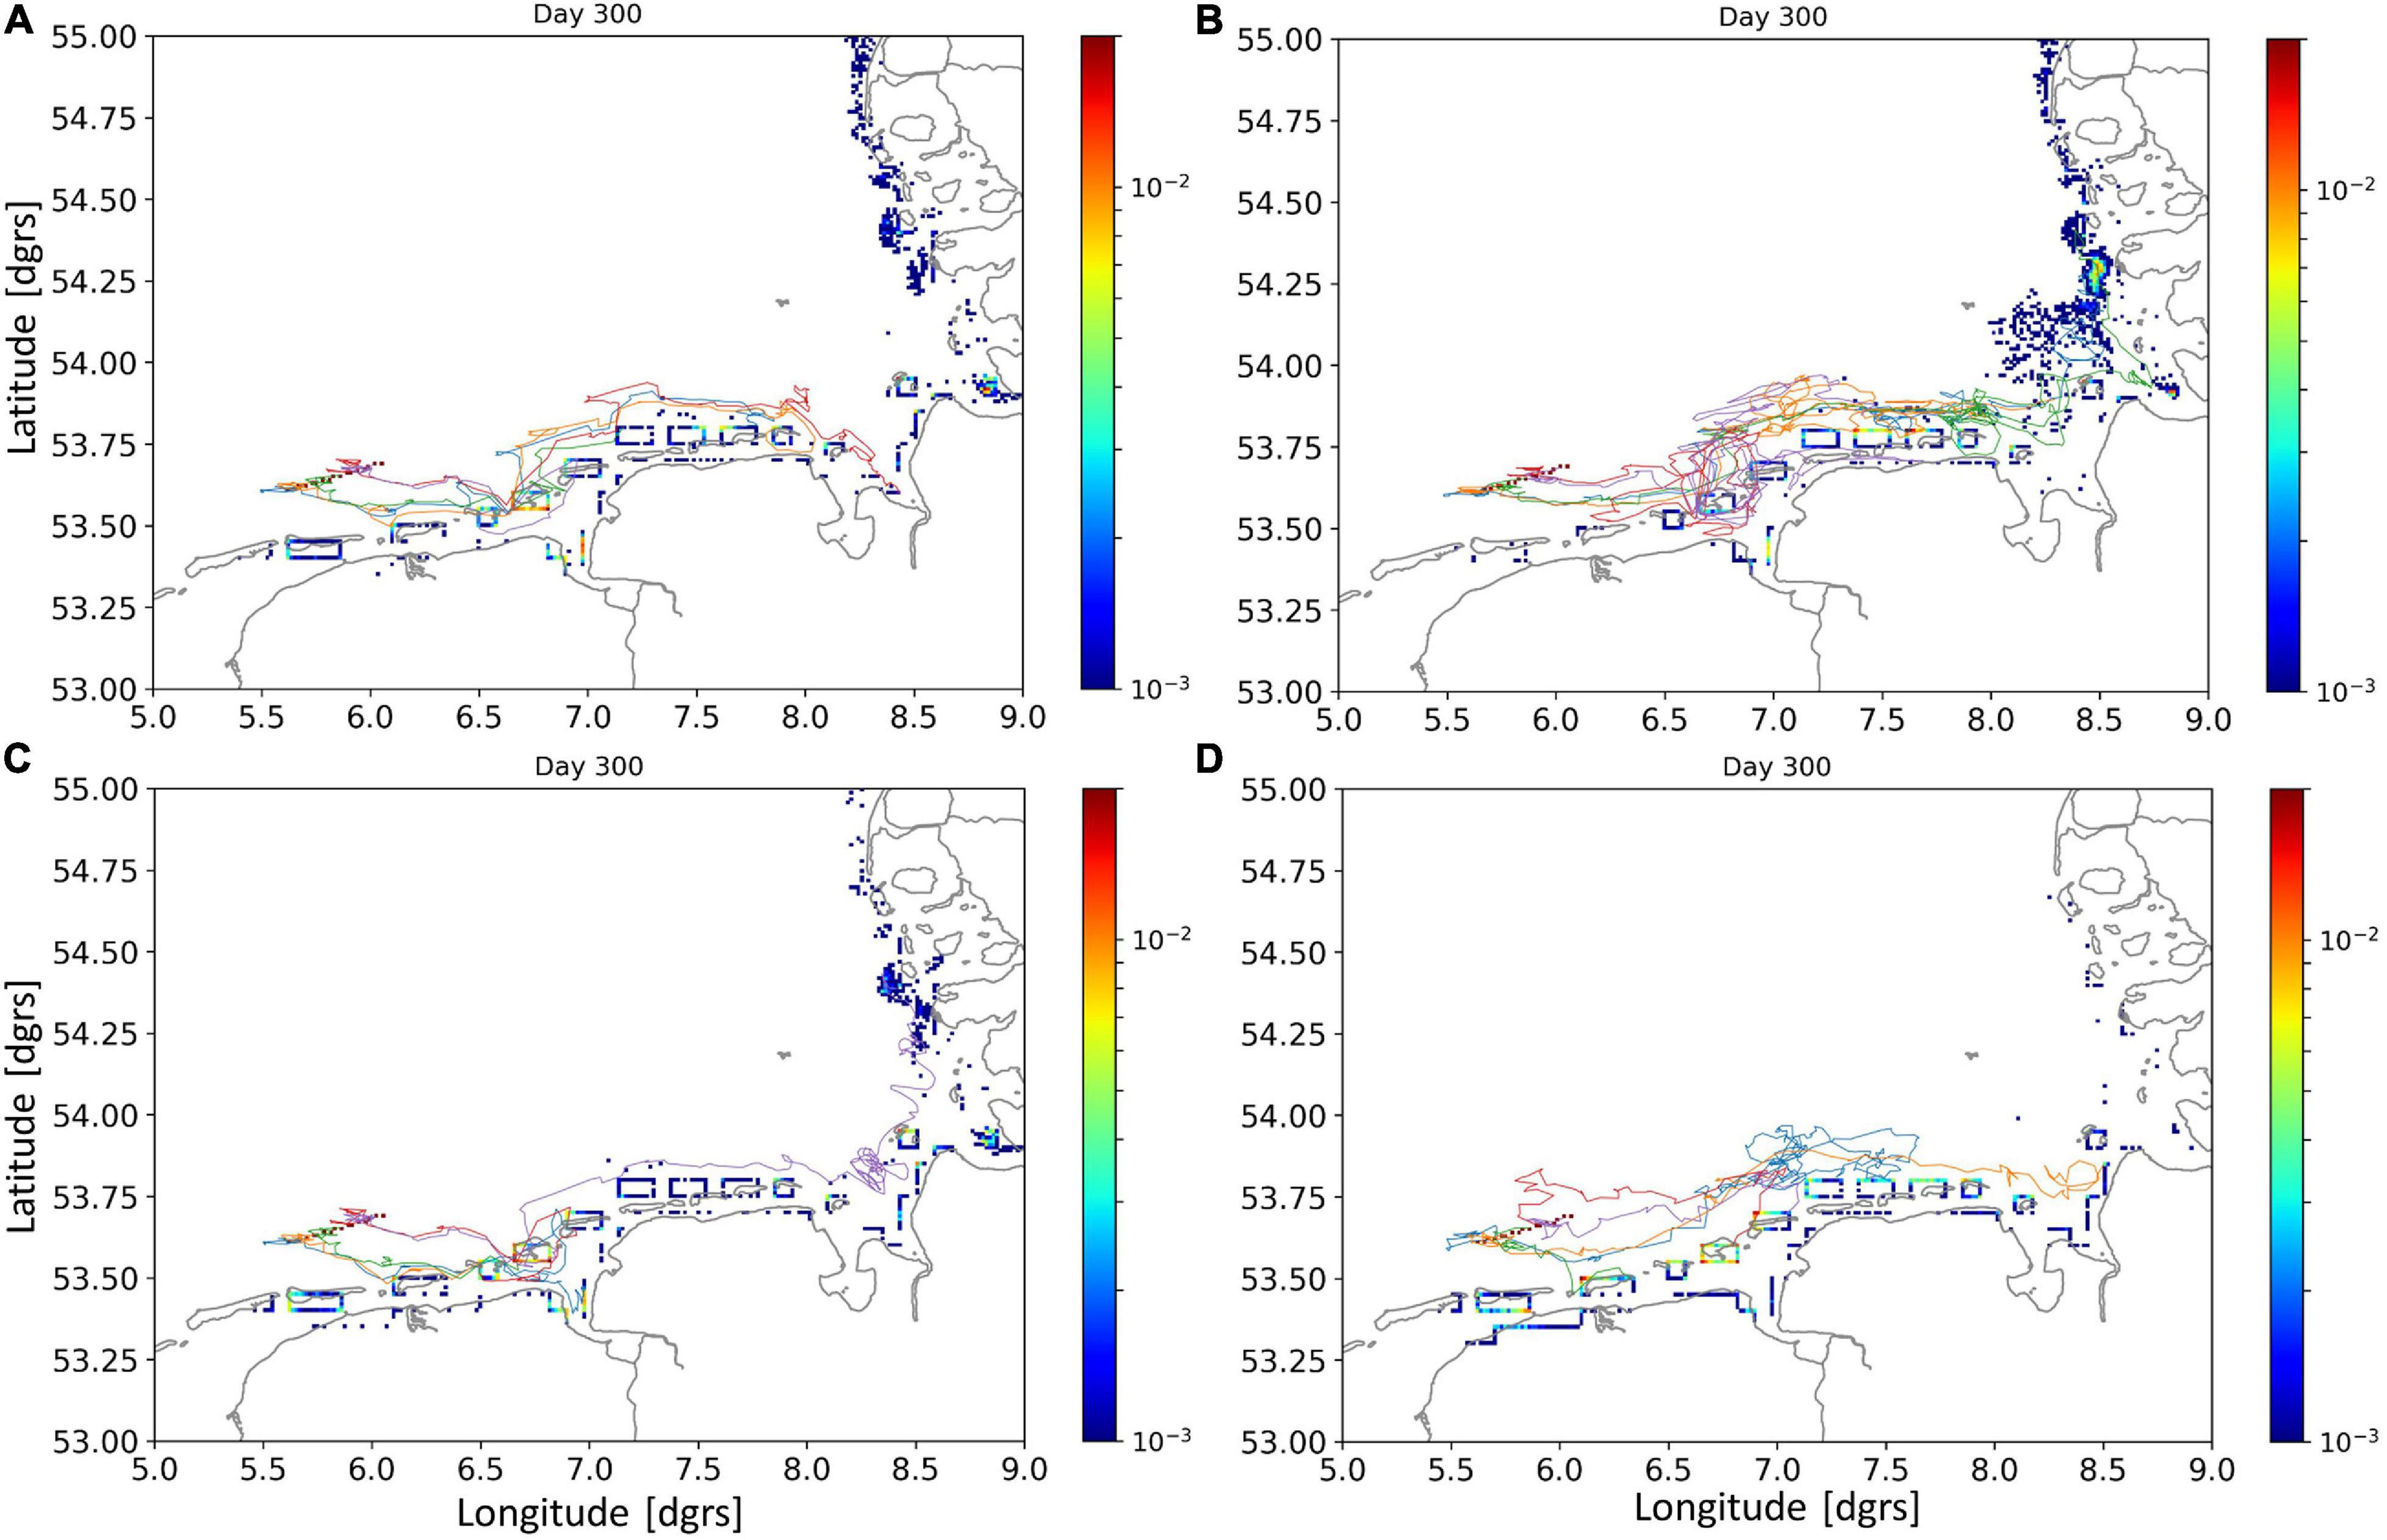
Figure 10. Sensitivity of the results for PS grains for the third part of the trajectory. (A) As Figure 9c; (B) with vertical velocity of −0.0015 ms–1; (C) with vertical velocity was −0.006 ms–1; (D) with a horizontal diffusion coefficient of 12 m2s–1.
Microplastic pollution has been incorporated in the EU Marine Strategy Framework Directive descriptor 10 (Marine Litter), and has potentially harmful effects on marine biota (e.g., Besseling et al., 2018). Hence, to manage and reduce microplastics in the marine environment we need to identify sources, understand transport patterns, transit times and accumulation sites. In this study, we have taken a modeling approach to this, focussing on the wider North Sea area. We have conducted a simultaneous release model, and experimentally modeled a proportional riverine release, both for floating and sinking microplastic pellets (HDPE and PS, respectively). We subsequently applied these models to the MSC Zoe incident in January 2019, where microplastics were released when this vessel lost 342 containers, and linked the model results to actual pellet counts through a citizen science initiative (See text footnote 5). Our model simulations showed that floating particles can accumulate temporarily on salinity fronts and in gyres, and are deposited predominantly on west-facing beaches. Sinking particles moved more slowly and less far, accumulated in deeper areas, and were deposited more on west- and north-facing beaches. The MSC Zoe model showed that floating HDPE pellets beached mostly within 3–7 7 weeks on the most eastern Dutch barrier islands, which was in agreement with citizen science observations. In contrast, sinking PS grains stayed at sea substantially longer (> 6 weeks) and were very likely deposited further east along German barrier island coastlines. However, no ground-truthing data was available for PS grains to validate the model. Our model results indicate pathways of marine microplastics transport that may help managing the clean-up of microplastics along northern European beaches, contributing to the EU Marine Strategy Framework Directive.
The dispersal of floating and sinking particles was substantially different in all model experiments. In shelf seas, such differences are caused by a combination of stratification and coriolis-induced velocity veering (e.g., Shapiro et al., 2004). Floating particles tended to concentrate in areas that are known for the presence of salinity fronts, in agreement with observations (Barnes et al., 2009), whereas concentrations of sinking particles were more related with large-scale sea-bed topography. These general results were also found in another modeling study (Ricker and Stanev, 2020). Over time, floating material in the area will beach, whereas a proportion of sinking material may remain at sea. The difference in transport paths of floating and sinking particles indicates that microplastics of mixed behavior (floating first, sinking later; e.g., because of biofouling or degradation) are likely to have different dispersal and accumulation characteristics, which will depend on the timing of the changes in buoyancy. This change will depend on the initial buoyancy of the microplastics, and on the rate and nature of the bio-fouling or degradation. The rate of bio-fouling is likely to depend on the time of year. In combination with the seasonality of stratification, this is an interesting topic that could be investigated further. Moreover, sinking plastics may get temporarily or permanently buried in the sea bed, and these processes need to be studied further to understand their importance and enable inclusion in models.
The physical processes within a Region Of Freshwater Influence (ROFI), such as that of the river Rhine which plays a significant role along the continental coast, are many, time-varying and complex, and depending on wind, tides and river runoff (Simpson, 1997). However, when fluctuating components are removed, on average an estuarine type circulation remains in the cross-shore direction, with surface currents having an offshore component, and bottom currents having an onshore component (Heaps, 1972; Simpson, 1997). Over a longer period of time, such as considered here, this density-driven circulation would tend to concentrate particles near the salinity front at the surface (Barnes et al., 2009), and near the coast at the bottom. Although the model is not expected to represent all the physical processes in the ROFI in detail because of the 5 km resolution, sinking particles in the Rhine ROFI area accumulated near the coast in correspondence with these mechanisms and floating particles accumulated at some distance away from the coast. Plots of particle density of the proportional release experiment with a mid-range vertical particle velocity of 0.06 ms–1 at four time slices in the year, and overlain with salinity contours (Figure 11) illustrate that these areas of higher density of floating particles indeed aligned with salinity features. We have plotted salinity contours here rather than density contours, because surface temperature gradients were relatively small, and salinity can be measured directly and defines the river plumes. A perfect fit for these is not expected, because of the time-varying components of the currents. A more rigorous study of these phenomena, with different assumptions but similar results, is given by Ricker and Stanev (2020).
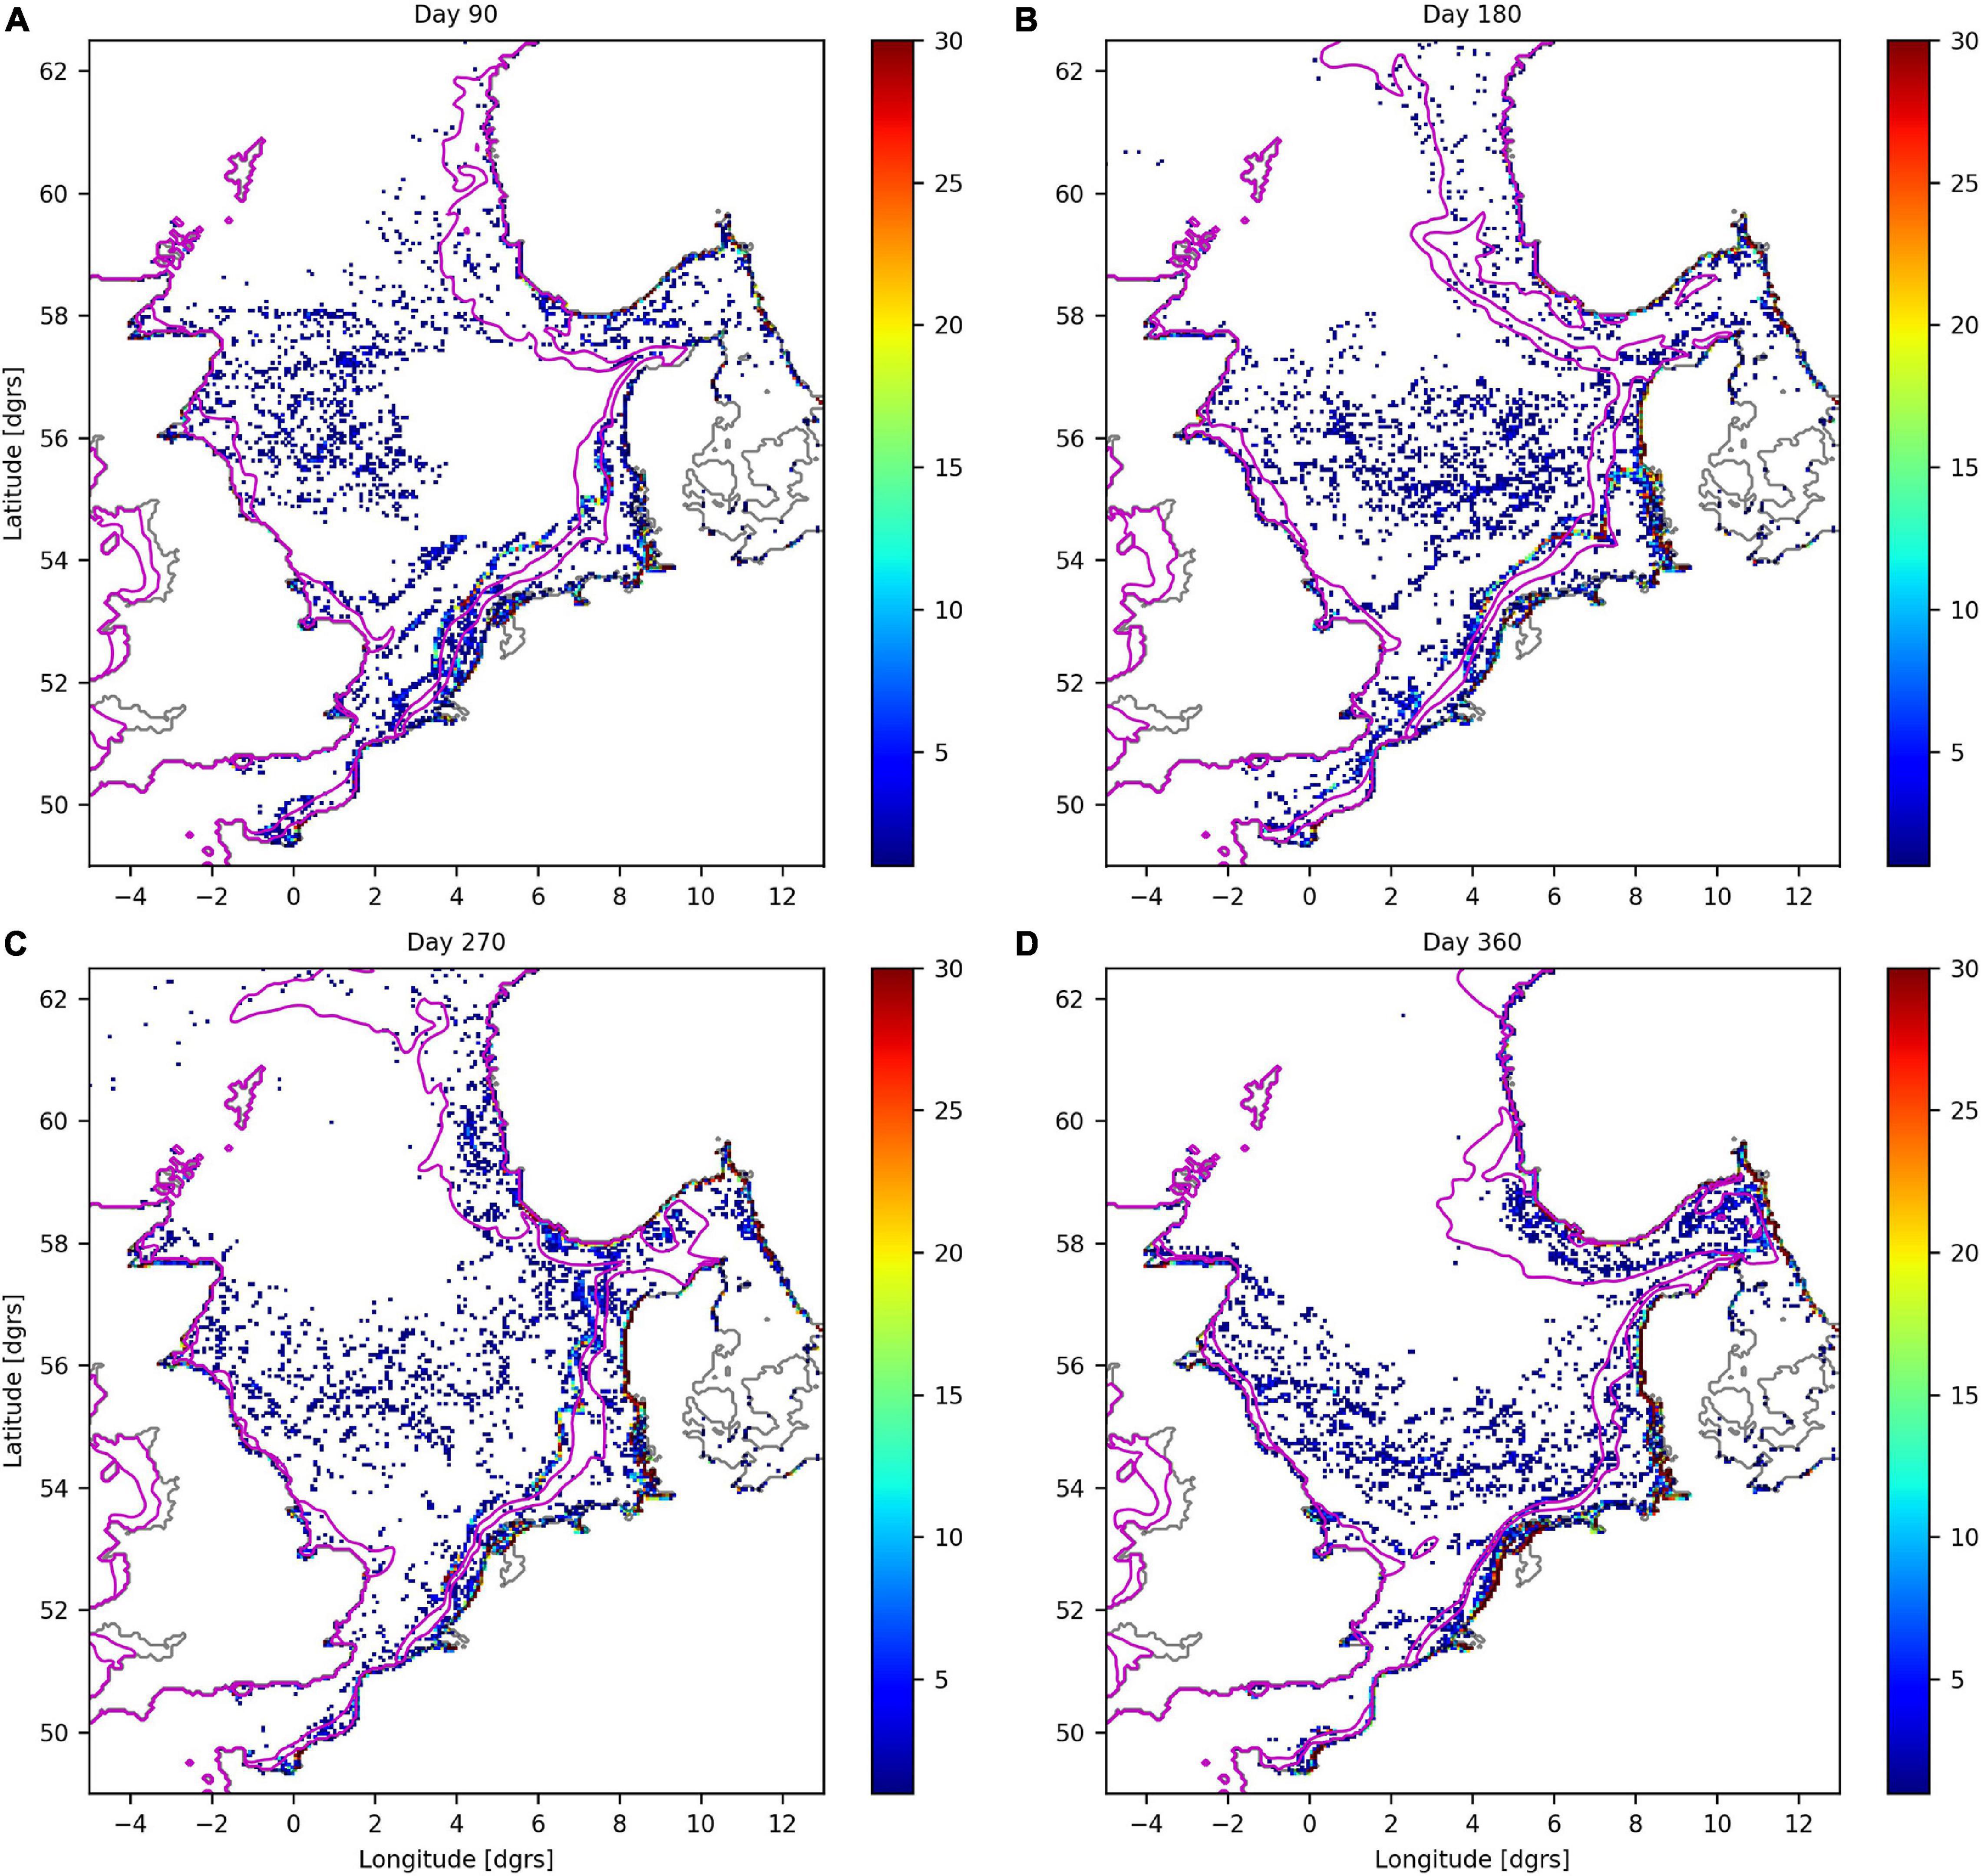
Figure 11. Particle densities (number of particles per grid cell) for the proportional release experiment for floating particles, for four time slices during the simulated year in 90 day intervals, with 33.0 and 34.5 salinity contours (magenta lines). (A) 31 March, (B) 29 June, (C) 27 September, and (D) 26 December.
The current results suggest the following (temporary) accumulation areas for the wider North Sea:
For floating particles:
• beaches (for the continental coast in particular west-facing beaches and the Wadden Sea, for Norway most coasts bordering the Norwegian Trench)
• the salinity front off the continental coast
• the gyre in the Skagerrak
For sinking particles:
• beaches (similar patterns as for floating particles but in different proportions)
• deeper areas (in particular the Oyster Grounds and the Norwegian Trench and Skagerrak)
The offshore accumulation areas of the sinking particles may be compared qualitatively with the observations of macro-litter (Maes et al., 2018), who found higher concentrations in the Oyster grounds area than elsewhere in the North Sea. Their study did not extend into the Norwegian Trench and the Skagerrak. Sinking micro-plastics have settling velocities that are more similar to those of silts and clays than sands. Hence, they may be expected to accumulate in the more muddy areas. Indeed, comparison of the spatial distribution pattern of sinking particles from the uniform release experiment with that of fine sediments in the North Sea (e.g., Van der Molen et al., 2017; Wilson et al., 2018) shows a reasonable level of correspondence. The data on beach (macro) litter (Hanke et al., 2019) does not show the details of the distribution of the beached model particles presented here. It is not clear, however, to which extent the model results can be compared with these data, as the data represent a wide range of macroplastics and other materials rather than specific microplastics, do not distinguish floating from sinking material, the sampled beaches were relatively widely inter-spaced. Moreover, the source locations of this material will have been different (and most likely included locally deposited litter) from the simulated sources used in this study.
The details of the density patterns of particles from these simulations are not expected to be realistic, because of the schematic nature of these simulations. However, they are sufficient to demonstrate the different fate of floating and sinking particles. A more realistic level of detail can only be achieved with more detailed information on the spatial and temporal distribution of sources of microplastics. Such information is only gradually starting to become available. For instance, estimations of macroplastics emissions in European river catchments show large differences between catchments (Roex et al., 2019), suggesting that this may also hold for microplastics, and challenging the assumption of proportionality to river runoff used here. Additional simulations could be considered for other years to assess potential interannual variability in microplastics dispersal, for instance by identifying and using contrasting years in terms of average wind patterns (i.e., residual circulation), temperature (i.e., stratification) and/or river runoff (i.e., source distribution). In a model assessment of residual circulation of the North Sea, Mathis et al. (2015), for instance, found standard deviations for the strength of annual in- and outflows of around 10% of the mean, so a limited effect on microplastic dispersal can be expected. Also, starting runs at different times of the year could be considered, however, comparing such experiments would have the additional complication that they would cover different periods of time.
The results of the simulations of the MSC Zoe incident showed that almost all of the floating HDPE pellets beached to the south and east of their release position within 3–7 weeks. The position of the beached pellets was confirmed by citizen science data (see text footnote 5) that was collected in the field in the 2 months after the incident. The HDPE pellet deposition did not follow the main pattern of dispersal evident in the North Sea wide model experiments, because of the specific wind conditions (northerly winds) during and in the days following the incident. Under more average, southwesterly wind conditions, the HDPE pellets would most likely have been transported much further to the East and North, and might have beached in large numbers on the German coast and/or the Danish west coast. Hence, it is advisable that international agreement is reached on updated guidelines for vessel routing (e.g., avoid shallow waters during storm) in the area in the interest of all parties to reduce the risk of similar incidents in the future. The simulations show that the most likely release position of the HDPE pellets was to the north of the inlet between Ameland and Schiermonnikoog (Zoutkamperlaag) if they were stored in a single container, but for this case the model does not represent the pellets found west of Schiermonnikoog. If they were stored in multiple containers, it is possible that pellets were also lost to the north of Ameland. It is also possible that transport processes due to waves, which were not represented in the model, have contributed to the dispersal of the HDPE pellets, and/or that a significant number of the bags that contained the pellets have remained intact for some time and these bags were influenced by an additional ‘sail effect’, or, although unlikely, originated from a different source.
In contrast, the sinking PS grains in the simulations of the MSC Zoe incident remained at sea for much longer than the HDPE pellets, because near-bed currents are weaker due to friction with the seabed, are much less susceptible to winds than surface currents, and are likely to have a different direction than the prevailing winds because of Ekman veering. The PS grains followed the residual circulation pattern to a much larger extent, and traveled much further to the East. The simulations suggest that it is likely that most of them reached the coasts of Germany and some even reached Denmark. The most likely location to find them in The Netherlands is on the beaches and in the back-barrier area of the island of Schiermonnikoog. A sampling program in these areas is therefore recommended.
The sensitivity experiments with different vertical particle velocities illustrate effects on the dispersal, in particular for the sinking PS grains. In the marine environment, this could lead to a level of sorting by the hydrodynamical processes, in similarity to sediment grains of different sizes. In this study, the differences between floating and sinking behavior resulted in larger differences in particle dispersal than the differences in vertical particle velocity within the expected ranges for HDPE pellets and PS grains. The horizontal diffusion coefficient affected the level of spreading of the particles. It also had a strong influence on the beaching of particles. This is not surprising, as in this model, in absence of the horizontal diffusion-driven random walk process, the semi-analytical particle advection scheme allows particles follow stream lines exactly, and particles cannot beach. Hence, in the current model, beaching is related directly the horizontal diffusion coefficient. In reality, near-shore wave-driven processes are likely to play a significant role in beaching of microplastics, and research into their effects and how these can be implemented in particle tracking models is desirable.
For reliable simulations of the details of the spatial distributions, in particular within the Wadden Sea, the current model is unsuitable, and a high-resolution model is required. First simulations with such a model, however, did not provide much additional insight into the dispersal of HDPE pellets, and it could not be applied to PS grains because the model domain was limited to the Dutch Wadden Sea area.
This study’s simulations have demonstrated that marine microplastics in the North Sea transgresses national boundaries. Hence, reducing the amounts of litter on the seabed and the beaches requires an international effort to eliminate both land-based and sea-based sources. Land-based sources can be dealt with using national legislation and enforcement, although international agreement is desirable. Sea-based sources can best be managed by international collaboration and enforcement. For the North Sea, such international cooperation, agreements and legislation are pursued by OSPAR6 and the EU Marine Strategy Framework Directive (EUC, 2008, 2017). Within the context of the EU Marine Strategy Framework Directive, the MSC Zoe incident illustrates that improved shipping guide lines to reduce the risk of such incidents should be investigated and implemented.
The datasets presented in this study can be found in online repositories. The names of the repository/repositories and accession number(s) can be found below: the datasets generated for this study can be found in the NIOZ Data Archiving System (DAS) via dataverse.nioz.nl under https://doi.org/10.25850/nioz/7b.b.8 (waddenplastic.nl data) and https://doi.org/10.25850/nioz/7b.b.9 (model output particle tracking model).
JM designed and conducted the modeling study, and wrote the first draft of the manuscript. SL compiled the riverine forcing for the model. LG, TH, and HO set up the citizen science project and the waddenplastic.nl web site, and collected part of the data. All authors contributed to revisions of the manuscript.
The MSC Zoe simulations were funded by Rijkswaterstaat through contract number 31147771.0001 (NIOZ contract 4439). LG was funded through the Dutch Research Council (NWO 016.VENI.181.087). An early version of the North-Sea scale simulations, carried out with a different model setup and different litter characteristics, was funded by the UK Department for Environment, Food and Rural affairs (Defra) through Cefas contract C5112.
The authors declare that the research was conducted in the absence of any commercial or financial relationships that could be construed as a potential conflict of interest.
We acknowledge numerous citizen scientists that have contributed to collecting field data on HDPE pellet dispersal after the MSC Zoe incident along the Dutch coast. We additionally acknowledge the Geodienst and Joke Bakker from the University of Groningen for supporting the website waddenplastic.nl. We wish to thank the two reviewers for their constructive comments, which led to significant improvements.
Backhaus, J. O. (1985). A three-dimensional model for 679 the simulation of shelf sea dynamics. Deutsche Hydrografische Zeitschrift 38, 165–187. doi: 10.1007/BF02328975
Balsema, M. A., Mogensen, K., and Weaver, A. T. (2013). Evaluation of the ECMWF ocean reanalysis system ORAS4. Q. J. R. Meteorol. Soc. 139, 1132–1161. doi: 10.1002/qj.2063
Barnes, D. A. K., Galgani, F., Thompson, R. C., and Barlaz, M. (2009). Accumulation and fragmentation of plastic debris in global environments. Phil. Trans. R. Soc. B 364, 1985–1998. doi: 10.1098/rstb.2008.0205
Beraud, C., van der Molen, J., Armstrong, M., Hunter, E., Fonseca, L., and Hyder, K. (2017). The influence of oceanographic conditions and larval behaviour to settlement success - the European seabass Dicentrarchus labrax (L.). ICES J. Mar. Sci. 75, 455–470. doi: 10.1093/icesjms/fsx195
Bergmann, M., Mützel, S., Primpke, S., Tekman, M. B., Trachsel, J., and Gerdts, G. (2019). White and wonderful? Microplastics prevail in snow from the Alps to the Arctic. Sci. Adv. 5:eaax1157. doi: 10.1126/sciadv.aax1157
Besseling, E., Redondo-Hasselerharm, P., Foekema, E. M., and Koelmans, A. (2018). Quantifying ecological risks of aquatic micro- and nanoplastic. Crit. Revi. Environ. Sci. Technol. 49, 32–80. doi: 10.1080/10643389.2018.1531688
Brown, J., Hill, A. E., Fernand, L., and Horsburgh, K. J. (1999). Observations of a seasonal jet-like circulation in the central North Sea cold pool margin. Estuar. Coast. Shelf Sci. 48, 343–355. doi: 10.1006/ecss.1999.0426
Burchard, H., and Bolding, K. (2002). GETM – a General Estuarine Transport Model. Scientific Documentation. Brussels: European Commission. Tech. Rep. EUR 20253 EN.
Canals, M., Pham, C. K., Bergmann, M., Gutow, L., Hanke, G., van Sebille, E., et al. (2021). The quest for seafloor macrolitter: a critical review of background knowledge, current methods and future prospects. Environ. Res. Lett. 16:023001. doi: 10.1088/1748-9326/abc6d4
Chapron, L., Peru, E., Engler, A., Ghiglione, J. F., Meisterzheim, A. L., Pruski, A. M., et al. (2018). Macro- and microplastics affect cold-water corals growth, feeding and behaviour. Sci. Rep. 8:15299. doi: 10.1038/s41598-018-33683-6
Chubarenko, I., Bagaev, A., Zobkov, M., and Esuikova, E. (2016). On some physical and dynamical properties of microplastic particles in marine environment. Mar. Pollut. Bull. 108, 105–112. doi: 10.1016/j.marpolbul.2016.04.048
Cole, M., Lindeque, P. K., Fileman, E., Clark, J., Lewis, C., Halsband, C., et al. (2016). Microplastics alter the properties and sinking rates of zooplankton faecal pellets. Environ. Sci. Technol. 50, 3239–3246. doi: 10.1021/acs.est.5b05905
Copernicus Climate Change Service (C3S), (2017). ERA5: Fifth Generation of ECMWF Atmospheric Reanalyses of the Global Climate. Copernicus Climate Change Service Climate Data Store (CDS), March 2019. Avaliable at: https://cds.climate.copernicus.eu/cdsapp#!/hom (accessed February 26, 2021).
Davies, A. M., Kwong, S. C. M., and Flather, R. A. (1997). Formulation of a variable-function three-dimensional model, with application to the M2 and M4 tide on the North-West European Continental Shelf. Cont. Shelf Res. 17, 165–204. doi: 10.1016/s0278-4343(96)00025-8
Dixon, T. J., and Dixon, T. R. (1983). Marine litter distribution and composition in the North Sea. Mar. Pollut. Bull. 14, 145–148. doi: 10.1016/0025-326x(83)90068-1
Dyer, K. R., and Moffat, T. J. (1998). Fluxes of suspended matter in the East Anglian plume. Southern North Sea. Cont. Shelf Res. 18, 1311–1331. doi: 10.1016/s0278-4343(98)00045-4
EUC, (2017). COMMISSION DIRECTIVE (EU) 2017/845 of 17 May 2017 Amending Directive 2008/56/EC of the European Parliament and of the Council as Regards the Indicative Lists of Elements to be Taken Into Account for the Preparation of Marine Strategies. Avaliable at: https://mcc.jrc.ec.europa.eu/main/document.py?code=201712062331&title=COMMISSION%20DIRECTIVE%20(EU)%202017/845%20of%2017%20May%202017 (accessed February 26, 2021).
EUC. (1992). Council Directive (92/43/EEC) of 21 May 1992 on the Conservation of Natural Habitats and of Wild Fauna and Flora. Avaliable at: https://eur-lex.europa.eu/legal-content/EN/TXT/?uri=celex%3A31992L0043
EUC, (2008). Directive 2008/56/ec of the European Parliament and of the Council of 17 June 2008 Establishing a Framework for Community Action in the Field of Marine Environmental Policy (Marine Strategy Framework Directive). Avaliable at: https://eur-lex.europa.eu/legal-content/EN/TXT/?uri=CELEX:32008L0056 (accessed February 26, 2021).
Flather, R. A. (1987). Estimates of extreme conditions of tide and surge using a numerical model of the North-west European Continental Shelf. Estuar. Coast. Shelf Sci. 24, 69–93. doi: 10.1016/0272-7714(87)90006-0
Furnes, G. K. (1980). Wind effects in the North Sea. J. Phys. Oceanogr. 10, 978–984. doi: 10.1175/1520-0485(1980)010<0978:weitns>2.0.co;2
Galgani, F., Fleet, D., van Franeker, J., Katsanevakis, S., Maes, T., Mouat, J., et al. (2010). “Marine strategy framework directive task Group 10 report marine litter,” in JRC Scientific and Technical Reports EUR 24340 EN - 2010, ed. N. Zampoukas, (Luxembourg: Office for Official Publications of the European Communities).
Gebhardt, C., and Forster, S. (2018). Size-selective feeding of Arenicola marina promotes long-term burial of microplastic particles in marine sediments. Environ. Pollut. 242, 1777–1786. doi: 10.1016/j.envpol.2018.07.090
GESAMP. (2016). “Sources, fate and effects of microplastics in the marine environment: part two of a global assessment,” in (IMO/FAO/UNESCO-IOC/UNIDO/WMO/IAEA/UN/UNEP/UNDP Joint Group of Experts on the Scientific Aspects of Marine Environmental Protection), eds P. J. Kershaw and C. M. Rochman, (London: GESAMP), 220. Rep. Stud. GESAMP No. 93.
GESAMP, (2019). “Guidelines or the monitoring and assessment of plastic litter and microplastics in the ocean,” in ), (IMO/FAO/UNESCO-IOC/UNIDO/WMO/IAEA/UN/UNEP/UNDP/ISA Joint Group of Experts on the Scientific Aspects of Marine Environmental Protection), eds P. J. Kershaw, A. Turra, and F. Galgani, (London: GESAMP), 130. Rep. Stud. GESAMP No. 99.
Hanke, G., Walvoort, D., van Loon, W., Addamo, A. M., Brosich, A., del Mar Chaves Montero, M., et al. (2019). EU Marine Beach Litter Baselines, EUR 30022 EN. Luxemburg: Publications Office of the European Union, doi: 10.2760/16903
Heaps, N. S. (1972). Estimation of density currents in the Liverpool Bay area of the Irish Sea. J. R. Astron. Soc. 30, 415–432. doi: 10.1111/j.1365-246X.1972.tb05825.x
Hill, A. E., Brown, J., Fernand, L., Holt, J., Horsburgh, K. J., Proctor, R., et al. (2008). Thermohaline circulation of shallow tidal seas. Geophys. Res. Lett. 35:L11605. doi: 10.1029/2008GL033459
Holt, J. T., James, I. D., and Jones, J. E. (2001). An s coordinate density evolving model of the northwest European continental shelf, part 2, Seasonal currents and tides. J. Geophys. Res. 106, 14035–14053. doi: 10.1029/2000JC000303
Hunter, J. R., Craig, P. D., and Philips, H. E. (1993). On the use of random walk models with spatially variable diffusivity. J. Computat. Phys. 106, 366–376. doi: 10.1016/S0021-9991(83)71114-9
Hydrographical Survey (2000). Tidal heights and streams, Coastal waters of the Netherlands and adjacent areas. Hydrographer of the Royal Dutch Navy, The Hague: HP33, 308.
Kooi, M., van Nes, E. H., Scheffer, M., and Koelmans, A. A. (2017). Ups and downs in the ocean: effects of biofouling on vertical transport of microplastics. Environ. Sci. Technol. 51, 7963–7971. doi: 10.1021/acs.est.6b04702
Le Provost, C., Lyard, F., Genco, M. L., and Rabilloud, F. (1998). A hydrodynamic ocean tide model improved by assimilation of a satellite altimeter-derived data set. J. Geophys. Res. 103, 5513–5529. doi: 10.1029/97JC01733
Lorenz, C., Roscher, L., Meyer, M. S., Hildebrandt, L., Prume, J., Löder, M. G. J., et al. (2019). Spatial distribution of microplastics in sediments and surface waters of the southern North Sea. Environ. Pollut. 252, 1719–1729. doi: 10.1016/j.envpol.2019.06.093
0Maes, T., Barry, J., Leslie, H. A., Vethaak, A. D., Nicolaus, E. E. M., Law, R. J., et al. (2018). Below the surface: twenty-five years of seafloor litter monitoring in coastal seas of North West Europe (1992–2017). Sci. Total Environ. 630, 790–798. doi: 10.1016/j.scitotenv.2018.02.245
Marine Traffic, (2020). Marine Traffic Information. Avaliable at: http://marinetraffic.com. (accessed May 27, 2020)
Mathis, M., Elizalde, A., Mikolajewicz, U., and Pohlmann, T. (2015). Variability patterns of the general circulation and sea water temperature in the North Sea. Prog. Oceanogr. 135, 91–122. doi: 10.1016/j.pocean.2015.04.009
Morét-Ferguson, S., Law, K. L., Proskurowski, G., Murphy, E. K., Peacock, E. E., and Reddy, C. M. (2010). The size, mass, and composition of plastic debris in the western North Atlantic Ocean. Mar. Pollut. Bull. 60, 1873–1878. doi: 10.1016/j.marpolbul.2010.07.020
Neumann, D., Callies, U., and Matthies, M. (2014). Marine litter ensemble transport simulations in the southern North Sea. Mar. Pollut. Bull. 86, 219–228. doi: 10.1016/j.marpolbul.2014.07.016
North Sea Task Force, (1993). North Sea Quality Status Report 1993, Frendensborg: Olsen and Olsen, 132.
Otto, L., Zimmerman, J. T. F., Furnes, G. K., Mork, M., Saetre, R., and Becker, G. (1990). Review of the physical oceanography of the North Sea. Netherlands J. Sea Res. 26, 161–238. doi: 10.1016/0077-7579(90)90091-T
Philippart, K., Hanssen, L., and van Dijk, J. (2019). Wat zijn de gevolgen van de door MSC Zoe verloren lading voor de Noordzeekustzone en de Waddenzee? Onderzoeks- en monitoringplan voor de korte- en langetermijngevolgen van microplastics voor het Waddengebied en haar bewoners. Position Paper 2019-01, Leeuwarden: Waddenacademie.
Prandle, D. (1978). Residual flows and elevations in the southern North Sea. Proc. R. Soc. Lond. Ser A 359, 189–228. doi: 10.1098/rspa.1978.0039
Ricker, M., and Stanev, E. V. (2020). Circulation of the European Northwest Shelf: a lagrangian perspective. Ocean Sci. 16, 637–655. doi: 10.5194/os-16-637-2020
Roex, E., Wolters, H., van Duijnhoven, N., Benitez Sanz, C., van der Meulen, M., and Wortelboer, R. (2019). Establishment of an EU Pressure Inventory”. Deliverable to Task B1 of the BLUE2 Project “Study on EU Integrated Policy Assessment for the Freshwater and Marine Environment, on the Economic Benefits of EU Water Policy and on the Costs of its Non- Implementation”. Report to DG ENV. Avaliable at: https://ec.europa.eu/environment/blue2_study/pdf/BLUE2_B1_FINAL_REPORT.pdf (accessed February 26, 2021).
Savina, M., Lacroix, G., and Ruddick, K. (2010). Modelling the transport of common sole larvae in the southern North Sea: influence of hydrodynamics and larval vertical movements. J. Mar. Syst. 81, 86–98. doi: 10.1016/j.jmarsys.2009.12.008
Schönfeld, W. (1995). Numerical simulation of the dispersion of artificial radionuclides in the English Channel and the North Sea. J. Mar. Syst. 6, 529–544. doi: 10.1016/0924-7963(95)00022-H
Schrum, C. (1997). Thermohaline stratification and instabilities at tidal mixing fronts: results of an eddy resolving model for the German Bight. Cont. Shelf Res. 17, 689–716. doi: 10.1016/S0278-4343(96)00051-9
Shapiro, G. I., Van der Molen, J., and De Swart, H. E. (2004). The effect of velocity veering on sand transport in a shallow sea. Ocean Dyn. 54, 415–423. doi: 10.1007/s10236-004-0089-4
Simpson, J. H. (1997). Physical processes in the ROFI regime. J. Mar. Syst. 12, 3–15. doi: 10.1016/S0924-7963(96)00085-1
Tidbury, H., Taylor, N., van der Molen, J., Garcia, L., Posen, P., Callaway, A., et al. (2020). Social network analysis, a tool for application to Marine Spatial Planning: the influence of offshore platforms on marine connectivity in the North Sea and the potential implications of decommissioning. J. Appl. Ecol. 57, 566–577. doi: 10.1111/1365-2664.13551
Tiessen, M. C. H., Fernand, L., Gerkema, T., van der Molen, J., Ruardij, P., and van der Veer, H. W. (2014). Numerical modelling of physical processes governing larval transport in the southern North Sea. Ocean Sci. 10, 357–376. doi: 10.5194/os-10-357-2014
van der Molen, J., Garcia, L., Whomersley, P., Callaway, A., Posen, P., and Hyder, K. (2018a). Modelling connectivity of larval stages of sedentary marine communities between offshore structures in the North Sea. Sci. Rep. 8:14772. doi: 10.1038/s41598-018-32912-2
van der Molen, J., Ruardij, J., Mooney, K., Kerrison, P., O’Connor, N. E., Gorman, E., et al. (2018b). Modelling potential production of macroalgae farms in UK and Dutch coastal waters. Biogeosciences 15, 1123–1147. doi: 10.5194/bg-15-1123-2018
van der Molen, J., Ruardij, P., and Greenwood, N. (2016). Potential environmental impact of tidal energy extraction in the Pentland Firth at large spatial scales: results of a biogeochemical model. Biogeoscienses 13, 2593–2609. doi: 10.5194/bg-13-2593-2016
Van der Molen, J., Ruardij, P., and Greenwood, N. (2017). A 3D SPM model for biogeochemical modelling, with application to the northwest European continental shelf. J. Sea Res. 127, 63–81. doi: 10.1016/j.seares.2016.12.003
Van Sebille, E., Aliani, S., Law, K. L., Maximenko, N., Alsina, J. M., Bagaev, A., et al. (2020). The physical oceanography of the transport of floating marine debris. Environ. Res. Lett. 15:023003. doi: 10.1088/1748-9326/ab6d7d
Visser, A. W. (1997). Using random walk models to simulate the vertical distribution of particles in a turbulent water column. Mar. Ecol. Prog. Ser. 158, 275–281. doi: 10.3354/meps158275
Visser, M. (1992). “. On the distribution of suspended matter and the density driven circulation in the Dutch coastal area,” in Dynamics and Exchanges in Estuaries and the Coastal Zone, Coastal Estuarine Studies 40, ed. D. Prandle, (Washington, D.C: AGU), 551–576. doi: 10.1029/CE040p0551
Werner, S., Fischer, E., Fleet, D., Galgani, F., Hanke, G., Kinsey, S., et al. (2020). Threshold Values for Marine Litter, EUR 30018 EN. Luxembourg: Publications Office of the European Union, doi: 10.2760/192427JRC114131
Whomersley, P., van der Molen, J., Holt, D., Trundle, C., and Fletcher, D. (2018). Modelling the dispersal of spiny lobster (Palinurus elephas) larvae from populations found in southwest England: implications for future fisheries management and conservation measures. Front. Mar. Sci. 5:58. doi: 10.3389/fmars.2018.00058
Wilson, R. J., Speirs, D. C., Sabatino, A., and Heath, M. R. (2018). A synthetic map of the northwest European Shelf sedimentary environment for applications in marine science. Earth Syst. Sci. Data 10, 109–130. doi: 10.5194/essd-10-109-2018
Wolk, F. (2003). Three-Dimensional Lagrancian Tracer Modelling in Wadden Sea Areas. Diploma thesis, Carl von Ossietzky University Oldenburg, Hamburg, 85.
World Shipping Council, (2017). Containers Lost at Sea - 2017 Update, Vol. 4. Avaliable at: http://www.worldshipping.org/industry-issues/safety/Containers_Lost_at_Sea_-_2017_Update_FINAL_July_10.pdf (accessed February 26, 2021).
Keywords: micro plastics, marine litter, particle tracking model, accumulation, anthropogenic impact, North Sea
Citation: van der Molen J, van Leeuwen SM, Govers LL, van der Heide T and Olff H (2021) Potential Micro-Plastics Dispersal and Accumulation in the North Sea, With Application to the MSC Zoe Incident. Front. Mar. Sci. 8:607203. doi: 10.3389/fmars.2021.607203
Received: 16 September 2020; Accepted: 15 February 2021;
Published: 04 June 2021.
Edited by:
Diego Macias, Consejo Superior de Investigaciones Científicas (CSIC), SpainReviewed by:
Giuseppe Suaria, National Research Council (CNR), ItalyCopyright © 2021 van der Molen, van Leeuwen, Govers, van der Heide and Olff. This is an open-access article distributed under the terms of the Creative Commons Attribution License (CC BY). The use, distribution or reproduction in other forums is permitted, provided the original author(s) and the copyright owner(s) are credited and that the original publication in this journal is cited, in accordance with accepted academic practice. No use, distribution or reproduction is permitted which does not comply with these terms.
*Correspondence: Johan van der Molen, am9oYW4udmFuLmRlci5tb2xlbkBuaW96Lm5s
Disclaimer: All claims expressed in this article are solely those of the authors and do not necessarily represent those of their affiliated organizations, or those of the publisher, the editors and the reviewers. Any product that may be evaluated in this article or claim that may be made by its manufacturer is not guaranteed or endorsed by the publisher.
Research integrity at Frontiers

Learn more about the work of our research integrity team to safeguard the quality of each article we publish.