 Savanna C. Barry1*
 A. Challen Hyman2
 Charles A. Jacoby3
 Laura K. Reynolds3
 Michal Kowalewski4Thomas K. Frazer5
- 1Nature Coast Biological Station, Florida Sea Grant, Institute of Food and Agricultural Sciences, University of Florida, Cedar Key, FL, United States
- 2Virginia Institute of Marine Science, William & Mary, Gloucester Point, VA, United States
- 3Soil and Water Sciences Department, Institute of Food and Agricultural Sciences, University of Florida, Gainesville, FL, United States
- 4Invertebrate Paleontology Division, Florida Museum of Natural History, University of Florida, Gainesville, FL, United States
- 5College of Marine Science, University of South Florida, St. Petersburg, FL, United States
Seagrasses form vast meadows of structurally complex habitat that support faunal communities with greater numbers of species and individuals than nearby unstructured habitats. The Gulf coast of peninsular Florida represents a natural laboratory ideally suited to the study of processes that shape seagrass-associated invertebrate and fish communities within meadows of a single species of seagrass, Thalassia testudinum. This suitability arises from a pronounced structural and chemical gradient that exists over ecologically relevant spatial and temporal scales, as revealed by extensive monitoring of water quality and seagrass. We hypothesized that seagrass-associated invertebrate communities would vary across five estuarine systems spread along a spatial gradient in phosphorus concentration, an important driver of seagrass and phytoplankton growth in this region. The quantitative results based on data acquired at 25 stations (75 samples, 52,086 specimens, and 161 taxa) indicated that each of the five estuarine systems were distinct with regard to species composition and differences among systems were driven by abundant or relatively common species. In addition, we found evidence to indicate food webs in seagrass meadows along this gradient may differ, especially in the relative dominance of algal grazers and predatory invertebrates. These changes in species composition and trophic roles could be driven by phosphorus directly, through increases in rates of primary production with higher concentrations of phosphorus, or indirectly, through nutrient-mediated changes in the physical structure of the seagrass canopy. Our results suggest that differences in the habitat created by T. testudinum under differing phosphorus supplies lead to ecologically significant shifts in macroinvertebrate communities.
Introduction
Globally, seagrasses are important structural components in shallow marine environments (Beck et al., 2001; Heck et al., 2003). Abundant and diverse faunal communities are common features of seagrass meadows, and many commercially exploited species are obligate inhabitants of seagrass for part or all of their life cycles (Seaman, 1985; Mattson et al., 2007). In addition, many seagrass-associated invertebrates and small fishes link benthic primary production to higher-level consumers (Adams, 1976; Brook, 1978; Fry and Parker, 1979; van Montfrans et al., 1984; Klumpp et al., 1992; Valentine and Heck, 1993; Heck et al., 1995; Heck et al., 2000; Valentine et al., 2000, 2008; Duffy et al., 2001). Thus, food web structure and production by higher trophic levels is expected to vary with differences in the abundance, diversity, and species composition of seagrass-associated invertebrates (Edgar and Shaw, 1995; Thormar et al., 2016).
The abundance, diversity, and community composition of seagrass-associated fish and invertebrates has been related to metrics describing the physical structure of vegetation, such as shoot biomass or density, leaf surface area, plant architecture, or root/rhizome biomass and thickness. Abundance, species richness, and diversity of seagrass-associated fauna often correlate positively with seagrass biomass and blade density (Heck and Wetstone, 1977; Heck and Orth, 1980b; Edgar and Shaw, 1995; Wyda et al., 2002; Franco et al., 2006; Hosack et al., 2006; Unsworth et al., 2007; Almeida et al., 2008; Parsons et al., 2013; Ávila et al., 2015). However, other studies have found inconsistent relationships between faunal abundance or diversity and seagrass biomass/density (Brook, 1978; Stoner, 1980, 1983; Virnstein et al., 1984; Worthington et al., 1992; Hovel et al., 2002; Moore and Hovel, 2010). Furthermore, considerable uncertainty surrounds the response of faunal communities to other differences in vegetative structure, such as percent cover (Hovel et al., 2002; Gribben and Wright, 2014; McCloskey and Unsworth, 2015), the identity and diversity of seagrass species (Heck and Wetstone, 1977; Nelson, 1980; Jernakoff and Nielsen, 1998), and leaf height or shape (Bell and Westoby, 1986a; Schneider and Mann, 1991a, b; Edgar and Robertson, 1992). Often, responses to differences in seagrass meadows are observed only for certain taxa within the community, only at certain scales, or only in certain time periods (Heck and Thoman, 1984; Bell and Westoby, 1986a, b; Hovel et al., 2002; Jelbart et al., 2007; Moore and Hovel, 2010; McCloskey and Unsworth, 2015). In addition, factors other than seagrass complexity can influence seagrass-associated faunal communities, such as nutrient enrichment (Hooks et al., 1976; Gil et al., 2006; Peterson et al., 2007; Armitage and Fourqurean, 2009; Daudi et al., 2012; Burghart et al., 2013; Tuya et al., 2013), exposure to waves and tides as determined by position within the estuary (Bell and Westoby, 1986b; Jelbart et al., 2007; Moore and Hovel, 2010; Parsons et al., 2013; Ávila et al., 2015), storms or other large-scale physical disturbances (Herkül et al., 2011; Patrick et al., 2020), and predation pressure (Stoner, 1980; Orth et al., 1984; Heck et al., 2000; Heck and Valentine, 2007; Mattila et al., 2008; Amundrud et al., 2015; Huang et al., 2015). Therefore, despite decades of effort, relatively few generalizable relationships have emerged that link differences in seagrass-associated faunal communities with metrics of seagrass complexity, particularly at spatial scales of kilometers or more (Boström et al., 2006), perhaps due to the challenges of finding suitable variation in environmental conditions and the complexity of meadows comprising one species of seagrass at such scales (e.g., Cardoso et al., 2007).
Along the Gulf coast of peninsular Florida, environmental conditions are well characterized due to extensive surveys of water quality and seagrass (Frazer et al., 1998; Jacoby and Frazer, 2013; Jacoby et al., 2015). Previous work in these estuarine systems has shown that the concentrations of total phosphorus (TP) and chlorophyll-a in the water column exhibit a consistent spatial pattern along a latitudinal gradient with values increasing from south to north, while variation in other water quality variables (e.g., total nitrogen) is less pronounced and not correlated with latitude (Frazer et al., 1998; Jacoby et al., 2012, 2015). Further work linked differences in shoot density, leaf morphology, growth rates, and allocation of aboveground and belowground biomass for the dominant seagrass, Thalassia testudinum, to the latitudinal variation in TP concentrations (Jacoby and Frazer, 2013; Jacoby et al., 2015; Barry et al., 2017, 2018). This region, therefore, represents a suitable natural laboratory where studies at ecologically relevant scales can help reconcile some of the inconsistencies that may arise from undefined environmental variation. However, the composition of faunal communities is not well studied in this region so basic information needed to provide context for future experimental manipulations is lacking.
In this study, we sampled invertebrate communities in meadows dominated by T. testudinum off the Gulf coast of peninsular Florida, along the spatial gradient in total phosphorus concentrations and T. testudinum leaf morphology. We hypothesized that the composition and abundance of faunal communities would vary in a consistent manner along the marked spatial gradients in TP, chlorophyll-a, and T. testudinum morphology. Specifically, we hypothesized that meadows dominated by T. testudinum along this gradient differ in habitat value and would harbor invertebrate communities that differ in species composition, size classes, and abundance. Identifying such patterns underpins future efforts to elucidate bottom-up or top-down controls.
Materials and Methods
Study System
The Gulf coast of peninsular Florida provides an ideal habitat for the development of seagrass meadows, and it currently houses one of the largest contiguous seagrass beds in the United States (Hale et al., 2004; Mattson et al., 2007). Extensive surveys of seagrasses and water quality revealed a persistent and stable spatial gradient in leaf morphology of the dominant seagrass, T. testudinum, and concentrations of total phosphorus (TP) and chlorophyll-a (chl-a) in the water column (Frazer et al., 1998; Jacoby et al., 2015; Barry et al., 2017; Supplementary Figures 1, 2). The spatial variation in TP has persisted for at least the 20-year period of record and occurs over tens of kilometers. The entire study region spans approximately 66-km, over which mean TP concentrations in the water column increase from approximately 7 μg/L at the most southern site to more than 20 μg/L at the most northern site (Barry et al., 2017). Concentrations of TP are highly correlated with mean concentrations of chl-a, which range from approximately 1.0 to 5.3 μg/L along the south-to-north gradient. Along the same gradient, mean leaf size of T. testudinum increases from 3.0 mm wide and 75.4 cm tall in the south (lowest TP and chl-a) to 4.8 mm wide and 301.6 cm tall in the north (highest TP and chl-a; Barry et al., 2017).
To capture the spatial gradient in TP, chl-a and T. testudinum leaf morphology, five sampling stations were selected in each of five estuarine systems: Weeki Wachee, Chassahowitzka, Homosassa, Crystal, and Waccasassa (n = 25 stations, Figure 1). Sampling stations were selected by revisiting the most offshore stations in each system where water quality and seagrass had been sampled concurrently during previous surveys (1–3 such stations per system). Additional stations (2–4 stations per system) were selected by transiting at least 100 m away from the previous station along a haphazard heading to locate an area dominated by T. testudinum (at least 60% of seagrass cover) in water deep enough to operate the suction sampler. Water depths at these sites ranged from 1.0 to 2.5 m and mean salinities ranged from 20–29‰ (mean ± SD = 23.95 ± 2.17‰).
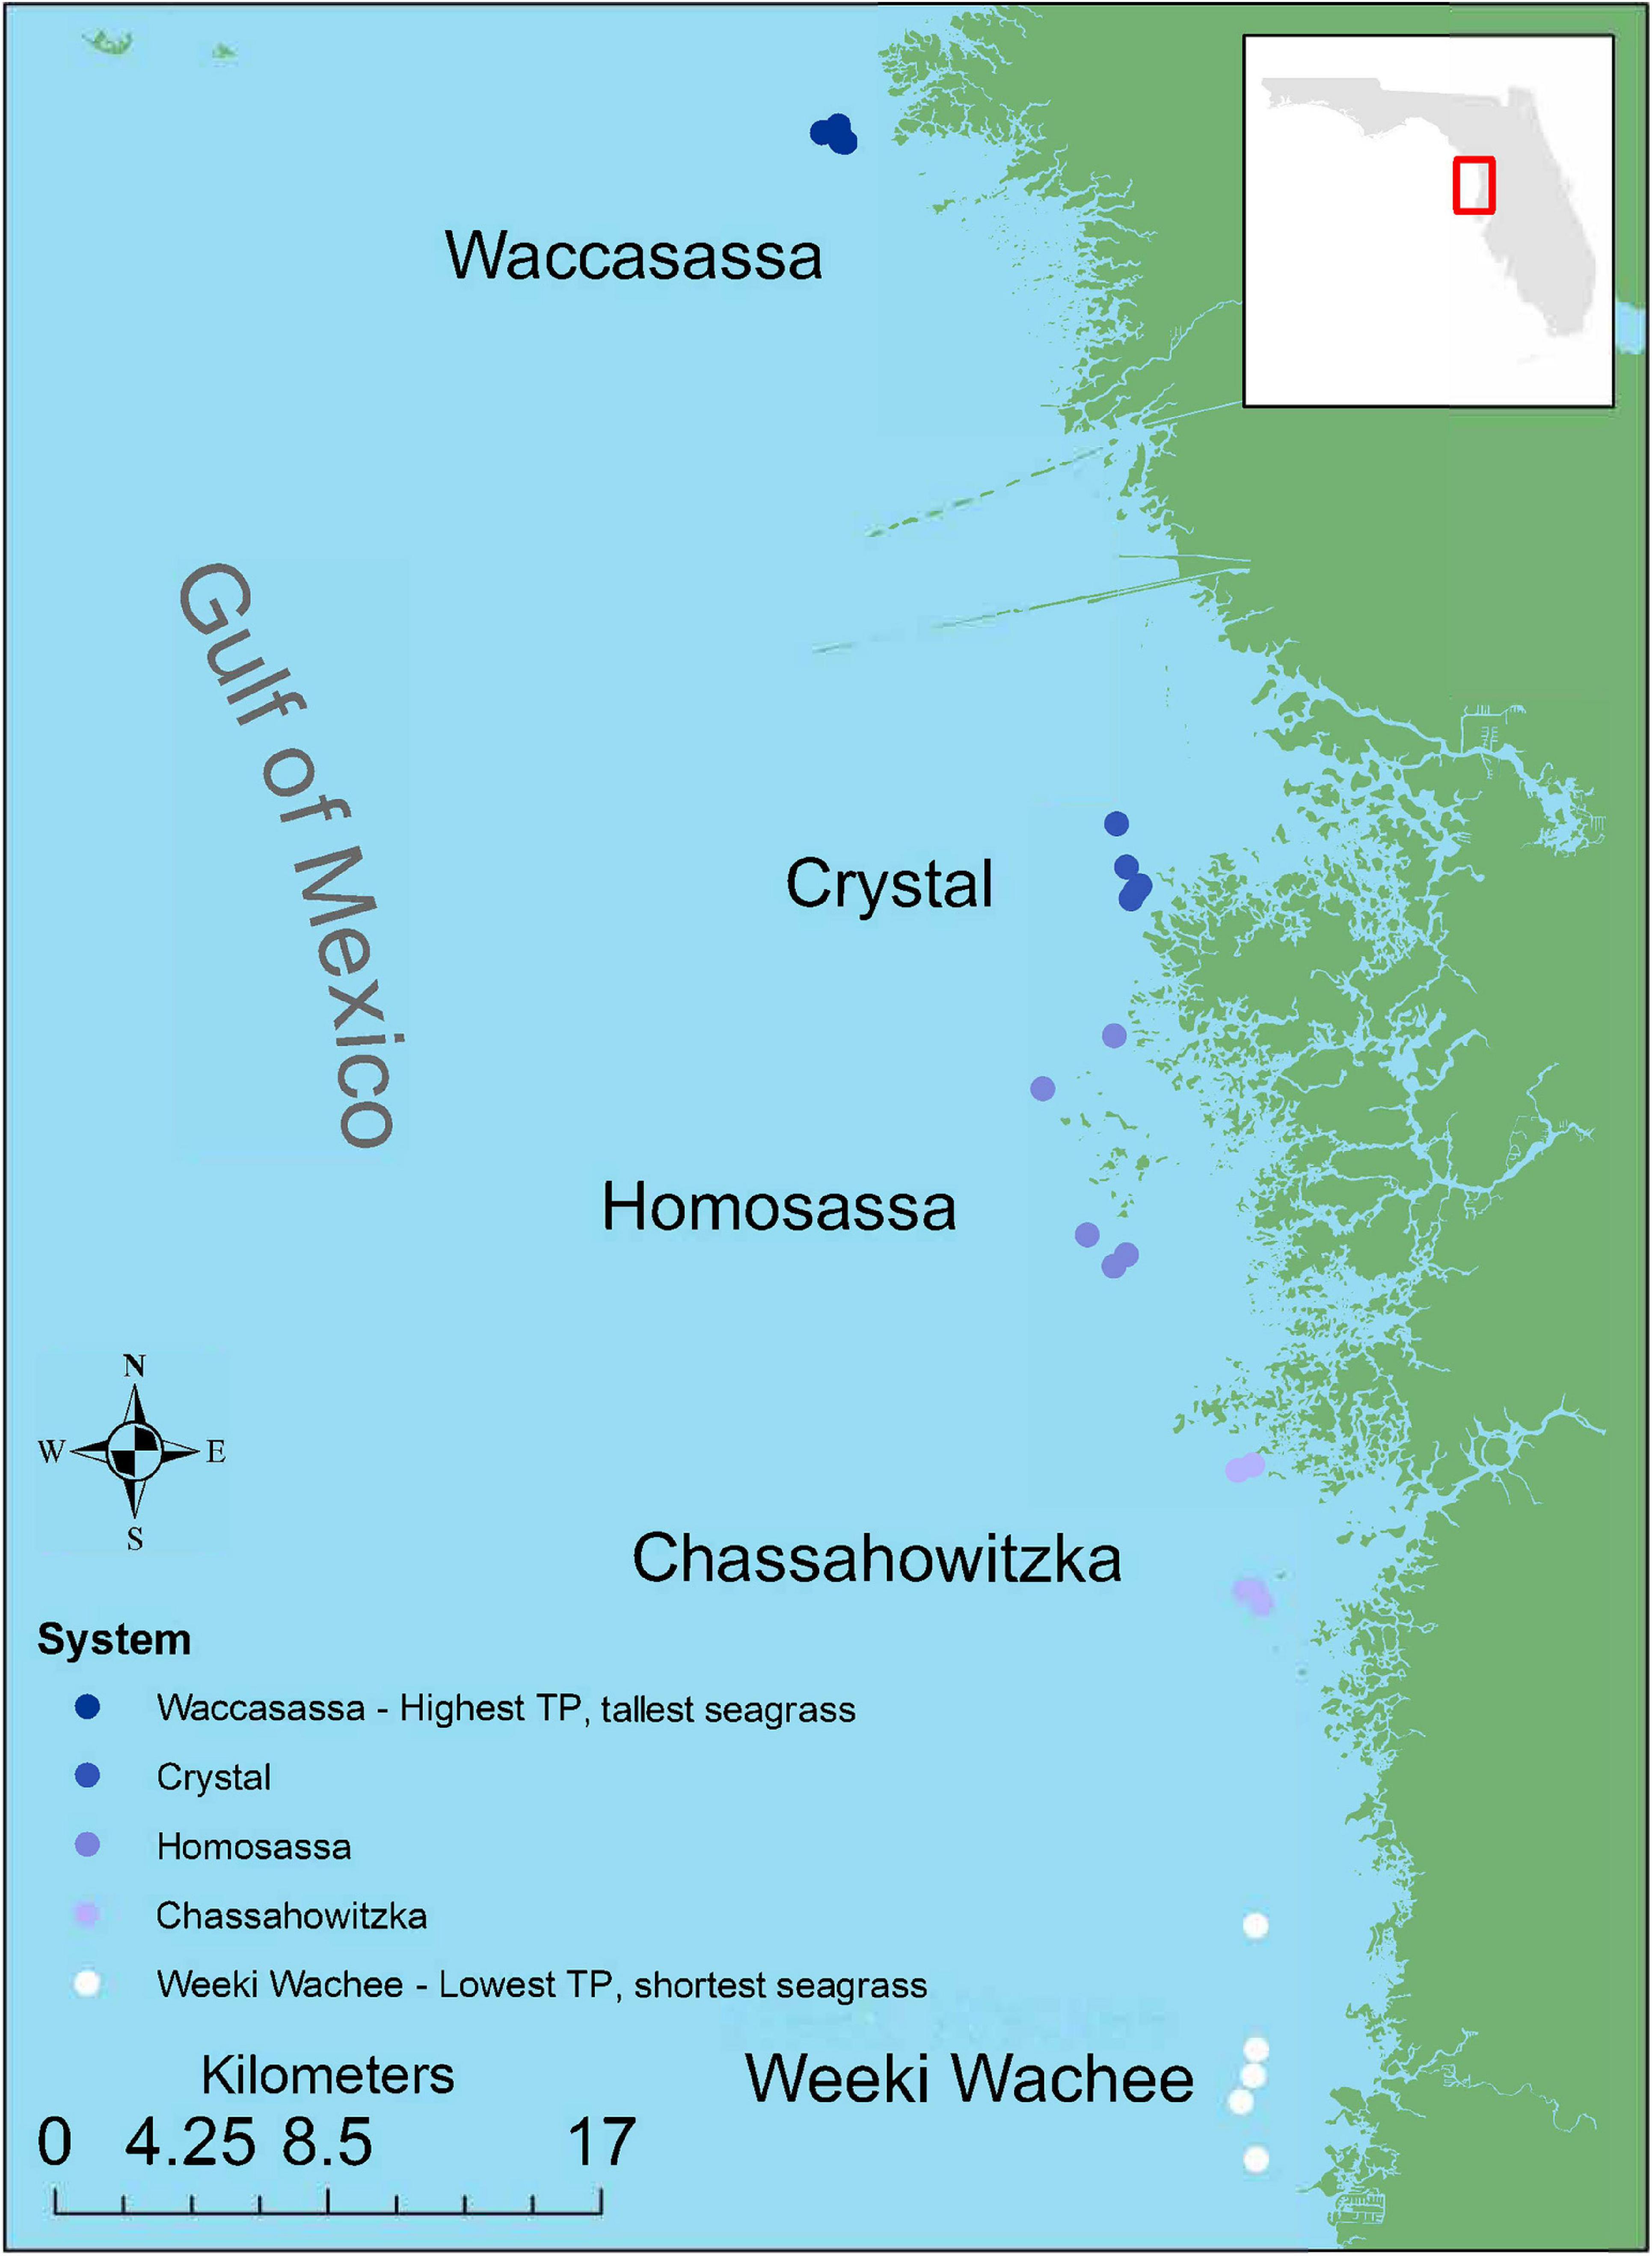
Figure 1. Study region and benthic invertebrate sampling stations. Colors indicate relative levels of long-term total phosphorus (TP) concentrations in the water column, with lighter colors indicating lower TP.
Sampling
Sampling of seagrass-associated invertebrates was conducted from 28 August to 02 September 2014; with all five stations within each estuarine system sampled on the same day. Upon arrival at each station, two anchors were deployed to prevent the vessel from swinging over the area to be sampled. At each station, a large open-ended cylinder with a metal-edged bottom (inside diameter 61 cm, sampling area = 0.29 m2) was deployed in three, separate undisturbed areas where percent cover was dominated by T. testudinum (n = 75 samples, 15 per estuarine system). The cylinder was staked down on four sides to prevent movement due to currents or wave action. For each sample, all aboveground biomass was collected carefully and rapidly sealed in a plastic bag, transported to the laboratory on ice, and stored frozen until processing.
After vegetation was cleared, the area inside the cylinder was sampled for 2 min with a Venturi suction dredge (5.1-cm diameter PVC pipe with 1.4-cm reducer nozzle connected to a 757-L-per-minute pump) fitted with a 700-μm mesh collection bag (Orth and van Montfrans, 1987). The Venturi suction dredge was selected because it has been consistently demonstrated to sample seagrass-associated invertebrates efficiently (Terlizzi and Russo, 1997; Raz-Guzman and Grizzle, 2001), with a measured capture efficiency of 88% (Orth and van Montfrans, 1987). This sampling method collected epifauna and infauna in the upper 10 cm of sediment. The Venturi suction dredge is likely to capture a representative sample of the total benthic community, as up to 98% of benthic macrofauna occur in or above the first 5 mm of sediment (Klumpp and Kwak, 2005). All material in the collection bag at the conclusion of the 2 min was transferred to a plastic bag and sealed, transported to the laboratory on ice, and stored frozen until processing.
Laboratory Processing
Samples were slowly thawed in fresh water, elutriated, and sieved into 4 separate size fractions (1–2, 2–4, 4–8, and >8-mm) to aid in sorting. To separate invertebrates from vegetation, each sample was rinsed vigorously in a 22-L bucket of fresh water for three thirty second periods. The water in the bucket was then sieved into the same four size classes. A 10% (wet weight) subsample of vegetative biomass was examined under a dissecting microscope to estimate the efficiency of rinsing. Vegetative biomass was sorted into five categories (T. testudinum leaves, Syringodium filiforme leaves, Halodule wrightii leaves, macroalgae, and belowground biomass) and dried for at least 5 days at 65°C before dry mass for each category was recorded. No effort was made to remove attached epiphytes, though much of this material was dislodged during rinsing.
Motile invertebrates that had retained intact soft tissues and life-like coloration, were considered to have been alive at the time of collection, and they were separated from each size fraction and identified to the lowest practical taxonomic level, usually species (see Supplementary Material for a list of identification guides used). The 2–4- and 1–2-mm size fractions were sorted with the aid of a sorting tray and a dissecting microscope. Representative individuals from each taxon were placed in separate vials of 90% ethanol to serve as references for confirming identifications. Each taxon was assigned a trophic role (epiphyte grazer, detritivore, etc.) using the best available information (see Supplementary Material for sources). When information for a specific taxon was not available, information for a closely related taxon was used.
Statistical Analyses
Univariate Indices
To facilitate comparisons, the univariate community indices examined were those commonly applied in other studies, i.e., abundance (total number of individuals per sample), species richness (total number of unique taxa per sample), Shannon–Weaver diversity, Pilou’s evenness, and Berger–Parker dominance. TP, chlorophyll-a, and seagrass morphology were not available at all localities where invertebrate sampling for the present study was conducted. However, previous and concurrent work in the same systems demonstrated variation in TP, chlorophyll-a, and seagrass morphology were strongly correlated with latitude along this stretch of the Florida coast, while other potentially influential water chemistry variables were not correlated with latitude (Barry et al., 2017). As a result, latitude served as a useful and useable proxy for variations in water column TP, water column chlorophyll-a, and T. testudinum leaf morphology across the five systems. Ordinary least squares regression was used to test for relationships between univariate indices and explanatory variables such as vegetative biomass, Shannon–Weaver diversity indices calculated using the types of vegetation cleared from each sampling area, and latitude. Abundances for each size class were analyzed separately against latitude, to determine if all size classes exhibited similar latitudinal patterns. When necessary, data were transformed to meet the assumptions of parametric linear analysis.
Community Composition
Community data were summarized at the species level (Supplementary Table 1) and for trophic roles before being tested for spatial differences. Before analyses, taxa that occurred in fewer than four of the 75 samples were removed from the data set and the double-Wisconsin standardization was applied to raw data matrices using the R package {vegan} (Oksanen et al., 2019). This method of standardization was chosen as it tends to reduce the influence of very abundant taxa and increase the influence of rare taxa, but applying different standardizations yielded qualitatively similar outcomes. The resulting matrices were then tested for spatial differences using permutation analysis of variance (PERMANOVA) implemented in PRIMER-E v.7 (Clarke and Gorley, 2015). Sampling stations were treated as nested within estuarine system and aboveground vegetative biomass (total dry weight, g) was included in the models as a covariate and the number of permutations set to 999. Significant PERMANOVAs were followed up with pairwise comparisons between estuarine systems in PRIMER-E v.7 (Clarke and Gorley, 2015), with the Benjamini–Hochberg procedure applied to adjust the false discovery rate to 5% (Waite and Campbell, 2006).
Significant PERMANOVAs can result from differences in both dispersion and location of groups (Anderson et al., 2008). Therefore, significant PERMANOVAs were followed up with tests of multivariate dispersion (PERMDISP). In addition, similarity percentage (SIMPER) analysis was performed to elucidate which taxa or trophic roles contributed significantly to group differences. For SIMPER analyses of aboveground biomass, this continuous variable was split at the mid-point of values into a categorical variable with two levels, high (36 g dry weight and above, n = 37) or low (35.9 g dry weight and below, n = 38). This approach provided similar levels of replication within groups and avoided unreliable results generated when SIMPER performs all pairwise comparisons of a continuous variable.
Plots of the results of non-metric multidimensional scaling (nMDS) were produced to aid in visualization of spatial patterns. We used the metaMDS function from the {vegan} package for R (R Development Core Team, 2020) with dimensions (k) set to two and auto-transform set to false. We used Bray–Curtis distances calculated on the double-Wisconsin standardized data, where taxa occurring in fewer than four samples were excluded. The metaMDS function was applied once to generate an initial solution and then a second time using the previous best solution as a starting point for the analysis. The output from the second run of metaMDS was used to produce visualization plots. We evaluated the stress of the nMDS result using the permutation-based ecological null model approach outlined in Dexter et al. (2018). We selected the “swsh_samp_c” null model method, which shuffles non-zero abundance values while preserving column (species) totals. We applied the shuffling algorithm to the double-Wisconsin standardized data to create 1,000 independent permutations. Ordinations were then carried out on permuted data frames using the same metaMDS settings as above. The stress value resulting from the observed data was compared to the distribution of stress values resulting from the ordinations of permuted data using a z-test (two-tailed alpha = 0.05). The above procedure was repeated for the trophic roles data to explore possible variations in trophic organization along the gradient sampled.
Beta-Diversity and Distance
As ecologists, we are often interested in determining the importance of environmental variation in structuring the biological communities we study. Variance partitioning methods can be applied to separate the relative importance of purely spatial (e.g., dispersal and colonization history) versus environmental (e.g., habitat and food supply) factors in shaping biological communities (Legendre et al., 2005; Yamada et al., 2014). In our study region, environmental variation is tightly linked to spatial variation, preventing strict separation of spatial and environmental factors. In fact, such a relationship is a common problem in variance partitioning (Legendre and Legendre, 1998; Tuomisto and Ruokolainen, 2006; Lichstein, 2007), though it reaches a level in this study system that makes latitude effectively interchangeable with environmental parameters, such as concentrations of chlorophyll-a and TP (see Supplementary Figure 1). In this study region, environmental variation that occurs on a larger scale, hereafter termed geographic distance, includes latitudinal variations in phosphorus and chlorophyll-a concentrations in the water column and the leaf morphology of the dominant seagrass, T. testudinum, factors that vary consistently across space and time (Frazer et al., 1998; Jacoby et al., 2015; Barry et al., 2017). Smaller-scale environmental variation, hereafter termed local environmental distance, includes differences in the benthic plant assemblages within each 0.29-m2 sampling area. Therefore, geographic distance in this context is mostly a proxy for background nutrient status of an estuarine system (i.e., severely phosphorus-poor in the south to moderately phosphorus-replete in the north, Figure 1) while local environmental distance refers to differences in the composition of the benthic plant community that occur over smaller scales (within station).
Beta-diversity, or turnover in species composition across space (Whittaker, 1960, 1972), was examined with two complementary analyses: inspection of linear patterns in pairwise distances between samples and variance partitioning using raw data matrices (Legendre et al., 2005; Tuomisto and Ruokolainen, 2006). For the linear analysis, pairwise Euclidean distances were calculated for a geographic data matrix (latitude and longitude of sampling stations) while Bray–Curtis dissimilarities between samples were calculated for the community data at the species level (retaining only species that occurred in at least four samples) and an environmental matrix containing data for dry weights of aboveground vegetation categories. These matrices represent geographic distance, beta-diversity, and local environmental distance, respectively. Separate linear polynomial models were fit to data on beta-diversity versus geographic distance and environmental distance to ascertain the pattern in species turnover across these two levels. Partial Mantel tests were applied to assess significance, given that pairwise distances are not independent and violate the assumptions of parametric hypothesis tests. Residual versus predicted scatter plots were inspected to ensure there was no evidence of spatial autocorrelation in the residuals.
To determine the relative importance of geographic vs. environmental distance in contributing to beta-diversity, we partitioned variance in the community composition using redundancy analysis ordination (Legendre et al., 2005). This analysis used raw data matrices, with the Hellinger transformation applied (Legendre and Gallagher, 2001), as opposed to distance matrices, allowing discrimination between variance in species composition that is due to geographic distance, with the effect of local environmental variation removed, and vice versa (Legendre et al., 2005).
Spatially structured patterns in species abundances along spatial gradients are considered evidence of environmental influence when underlying environmental variables also are spatially structured (Legendre et al., 2005; Tuomisto and Ruokolainen, 2006), as they are in this study region. Abundances of the twenty most common species in the data set were plotted against latitude to examine whether their distribution across the study region showed evidence of spatial structuring. Results in the affirmative would support the hypothesis that invertebrate communities of T. testudinum meadows along the gradient sampled are influenced by factors that vary spatially (e.g., variation in phosphorus concentrations and/or seagrass complexity). This procedure was repeated for data on trophic roles as well, to visualize latitudinal patterns in the abundance of the six trophic categories. Unless otherwise noted, all statistical analyses were carried out in Program R (R Development Core Team, 2020), with the assistance of the {vegan} package, version 2.5-6 (Oksanen et al., 2019).
Results
The 75 samples yielded 52,086 specimens from 86 families and 161 taxa (Supplementary Table 1). During inspection under a dissecting microscope, no organisms were found to remain on the 10% wet weight subsample of vegetation, likely because the relatively simple, strap-leafed morphology of T. testudinum allowed efficient separation of specimens during rinsing (Stallings et al., 2015). These samples generally contained little macroalgae, the primary type of vegetation that has been reported to pose problems for separating specimens (e.g., Stallings et al., 2015). In all 75 samples, T. testudinum accounted for 71.4 ± 17.2% (mean ± SD) of the vegetative biomass and 91.6 ± 12.4% (mean ± SD) of the seagrass biomass. The morphological patterns observed in T. testudinum collected in this effort were similar to patterns reported in previous studies (Supplementary Figure 2).
Univariate Indices
Generally, univariate indices showed little consistent spatial variation and did not correlate well with the spatial distribution of stations or associated variation in vegetative complexity (Table 1). Of all the metrics tested, only total invertebrate abundance per sample was found to exhibit significant spatial variation. Log10-transformed total abundance showed a weak positive relationship with latitude (R2 = 0.12, F1,73 = 10.35, p = 0.002, Figure 2) and addition of other explanatory variables such as aboveground biomass did not improve fit. Thus, most of the variation in total abundance remains unexplained. There was also a weak positive relationship between species richness and diversity indices for vegetation (R2 = 0.19, F1,73 = 17.35, p < 0.001), but addition of total faunal abundance improved fit significantly (R2 = 0.51, F2,72 = 36.96, pabundance < 0.001, pveg. diversity = 0.003, Figure 3). While invertebrate species richness generally increased with both increasing vegetative diversity indices and total faunal abundance, roughly half of the variation in invertebrate species richness remains unexplained.
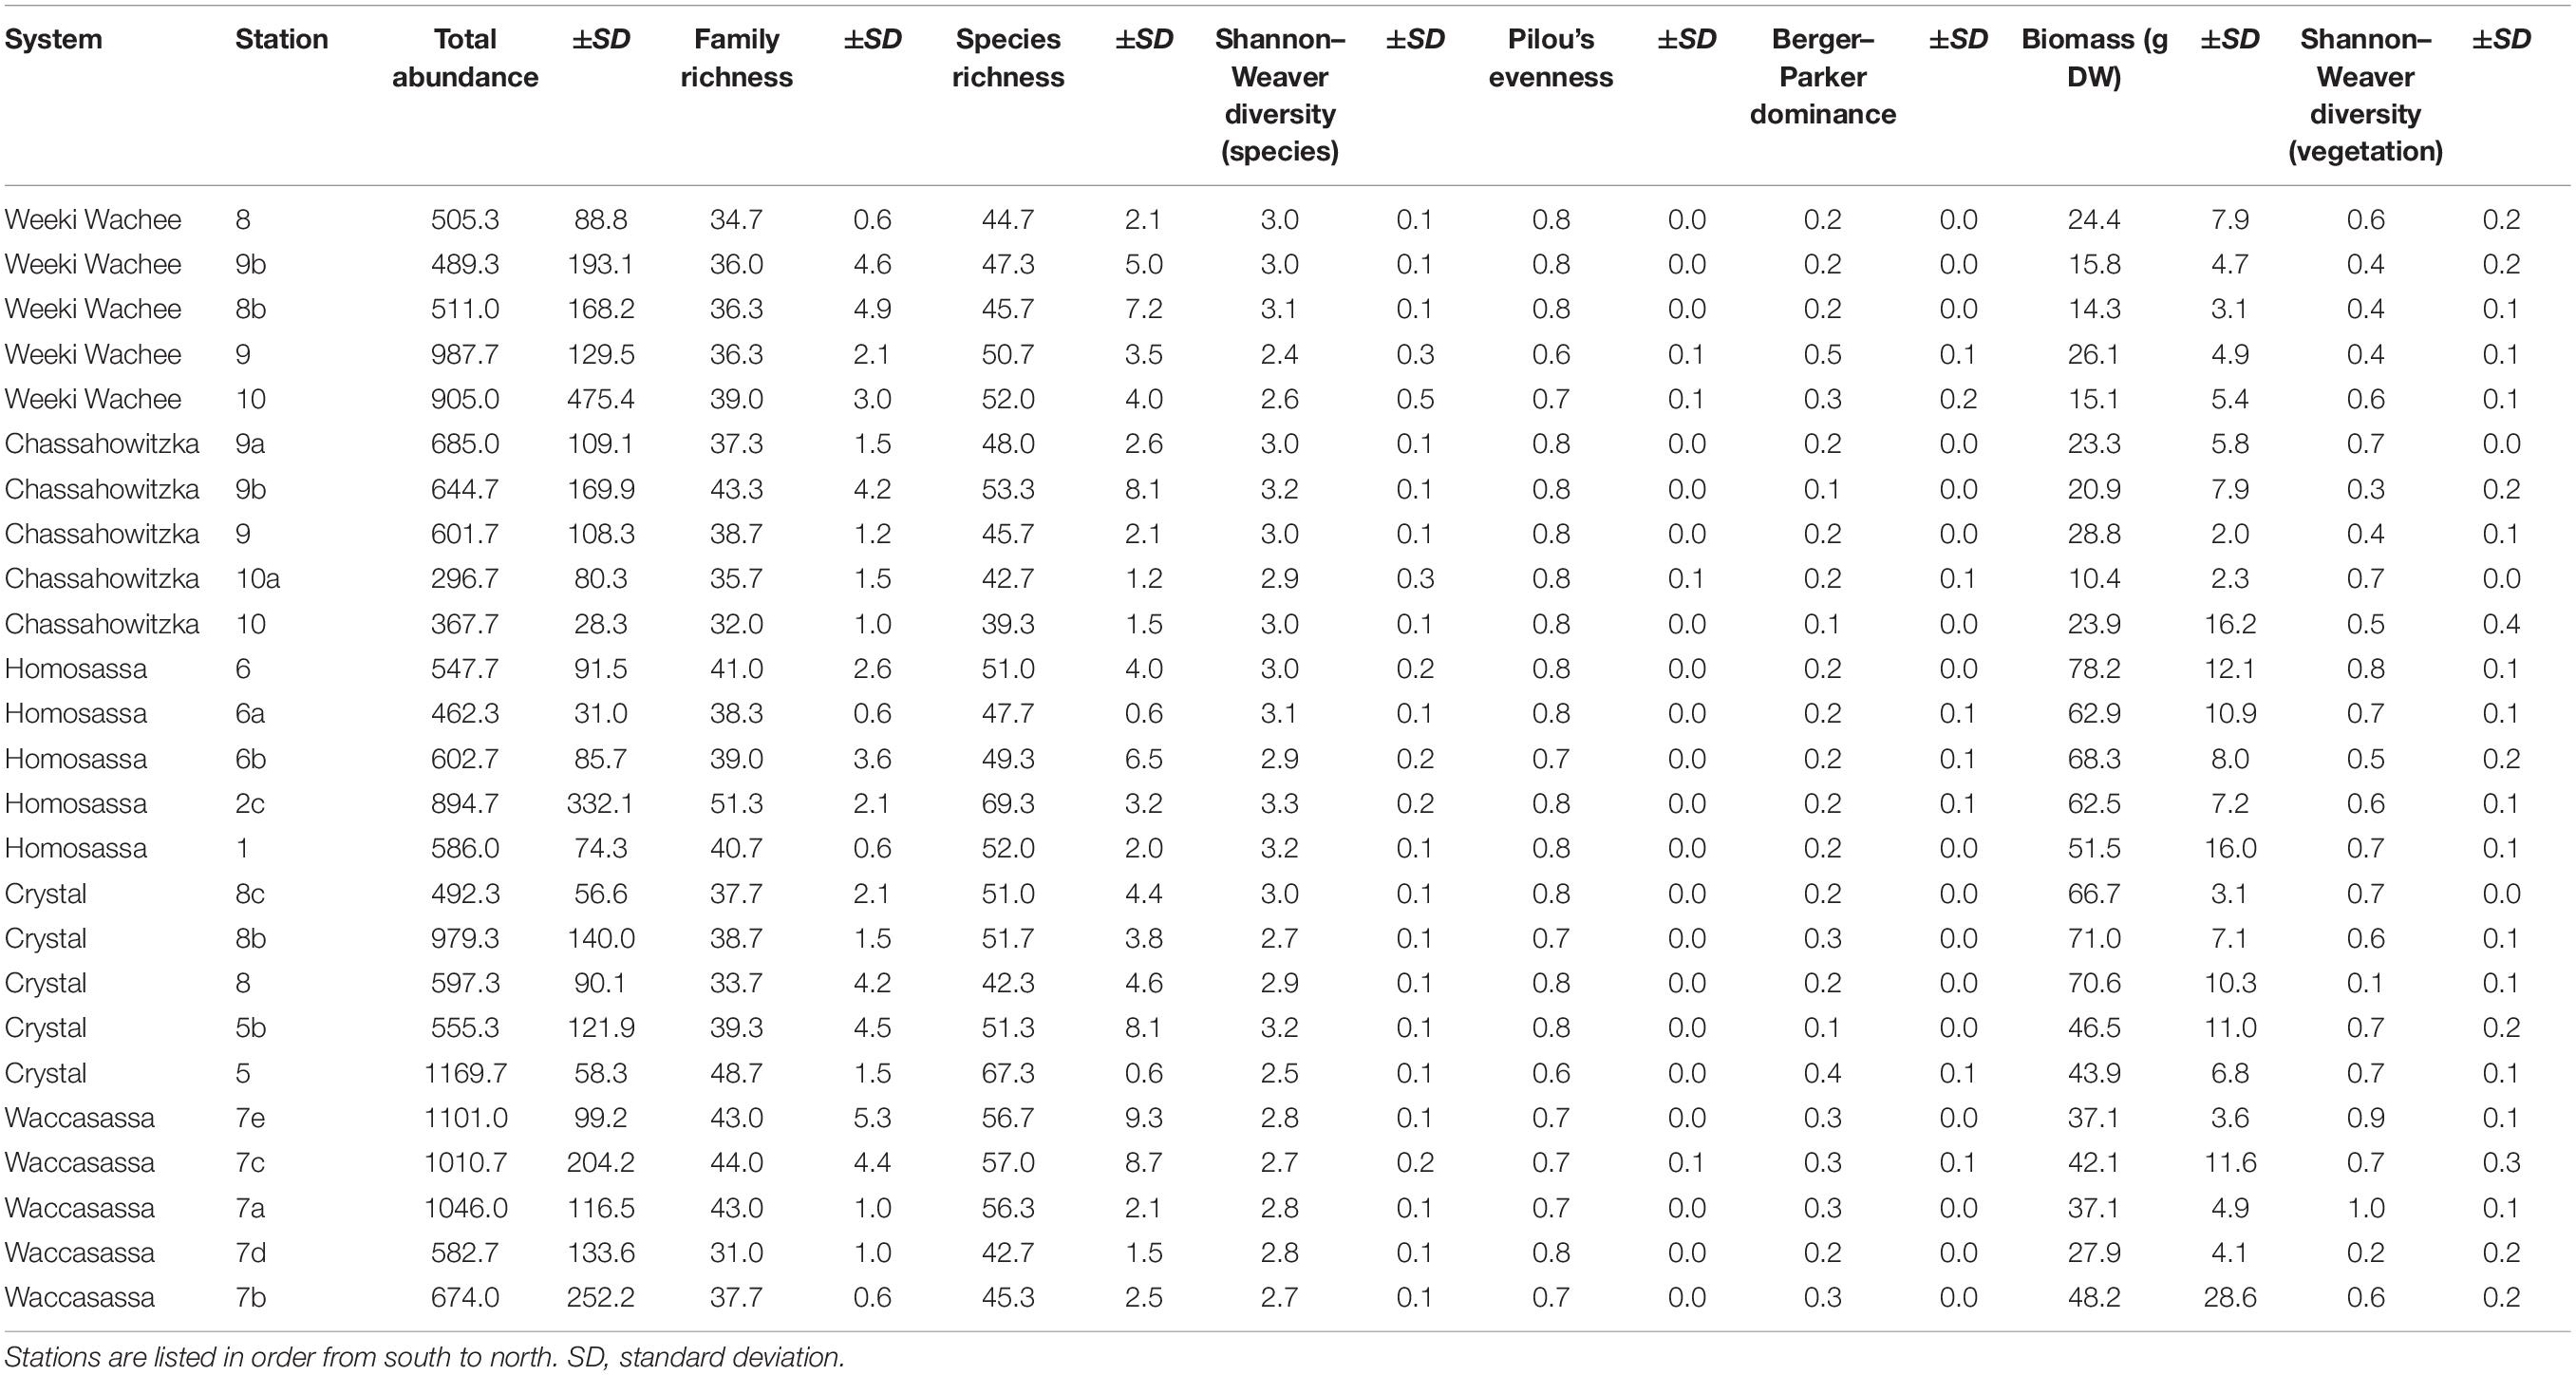
Table 1. Univariate community indices (mean ± standard deviation) summarized by station (n = 5 per station).
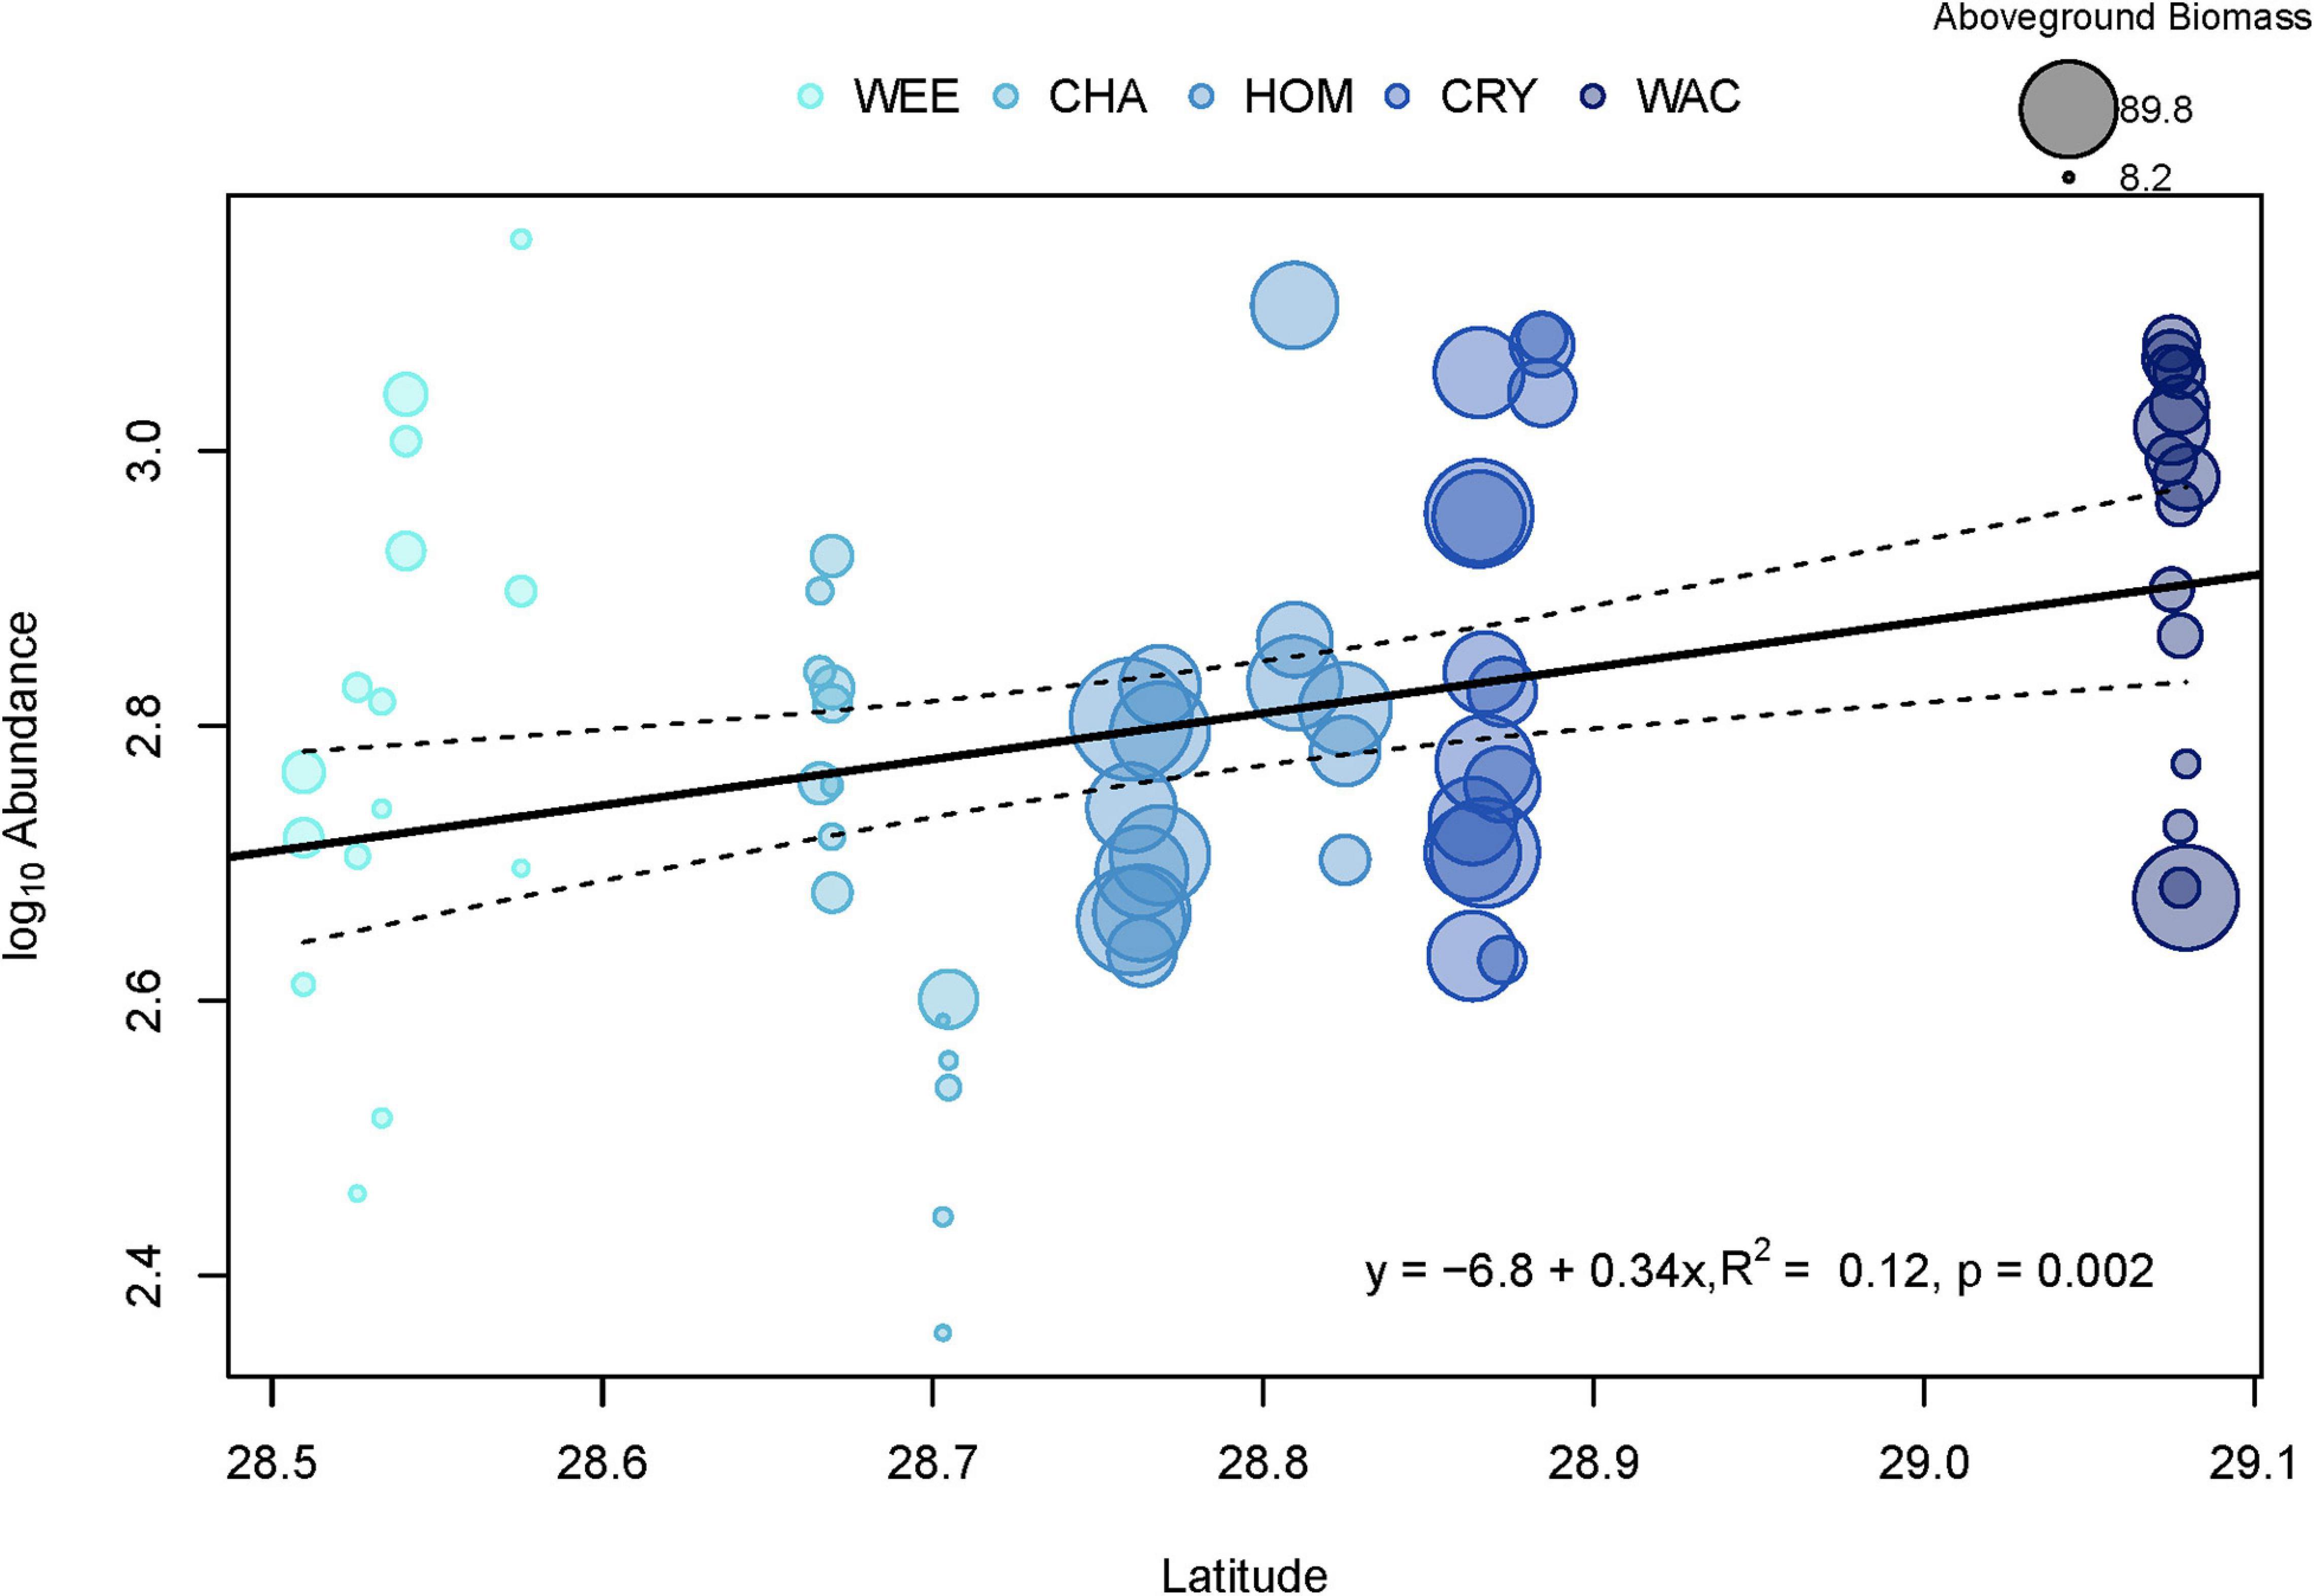
Figure 2. Linear regression of log10 total faunal abundances for each sample against latitude. WEE, Weeki Wachee; CHA, Chassahowitzka; HOM, Homosassa; CRY, Crystal River; WAC, Waccasassa. Dashed lines represent the 95% confidence interval of the fitted line (solid line). Colors indicate relative levels of long-term total phosphorus (TP) concentrations in the water column, with lighter colors indicating lower TP. Sizes of points represent the total dry weight of vegetative biomass in grams, with larger sizes indicating a higher aboveground vegetative biomass.
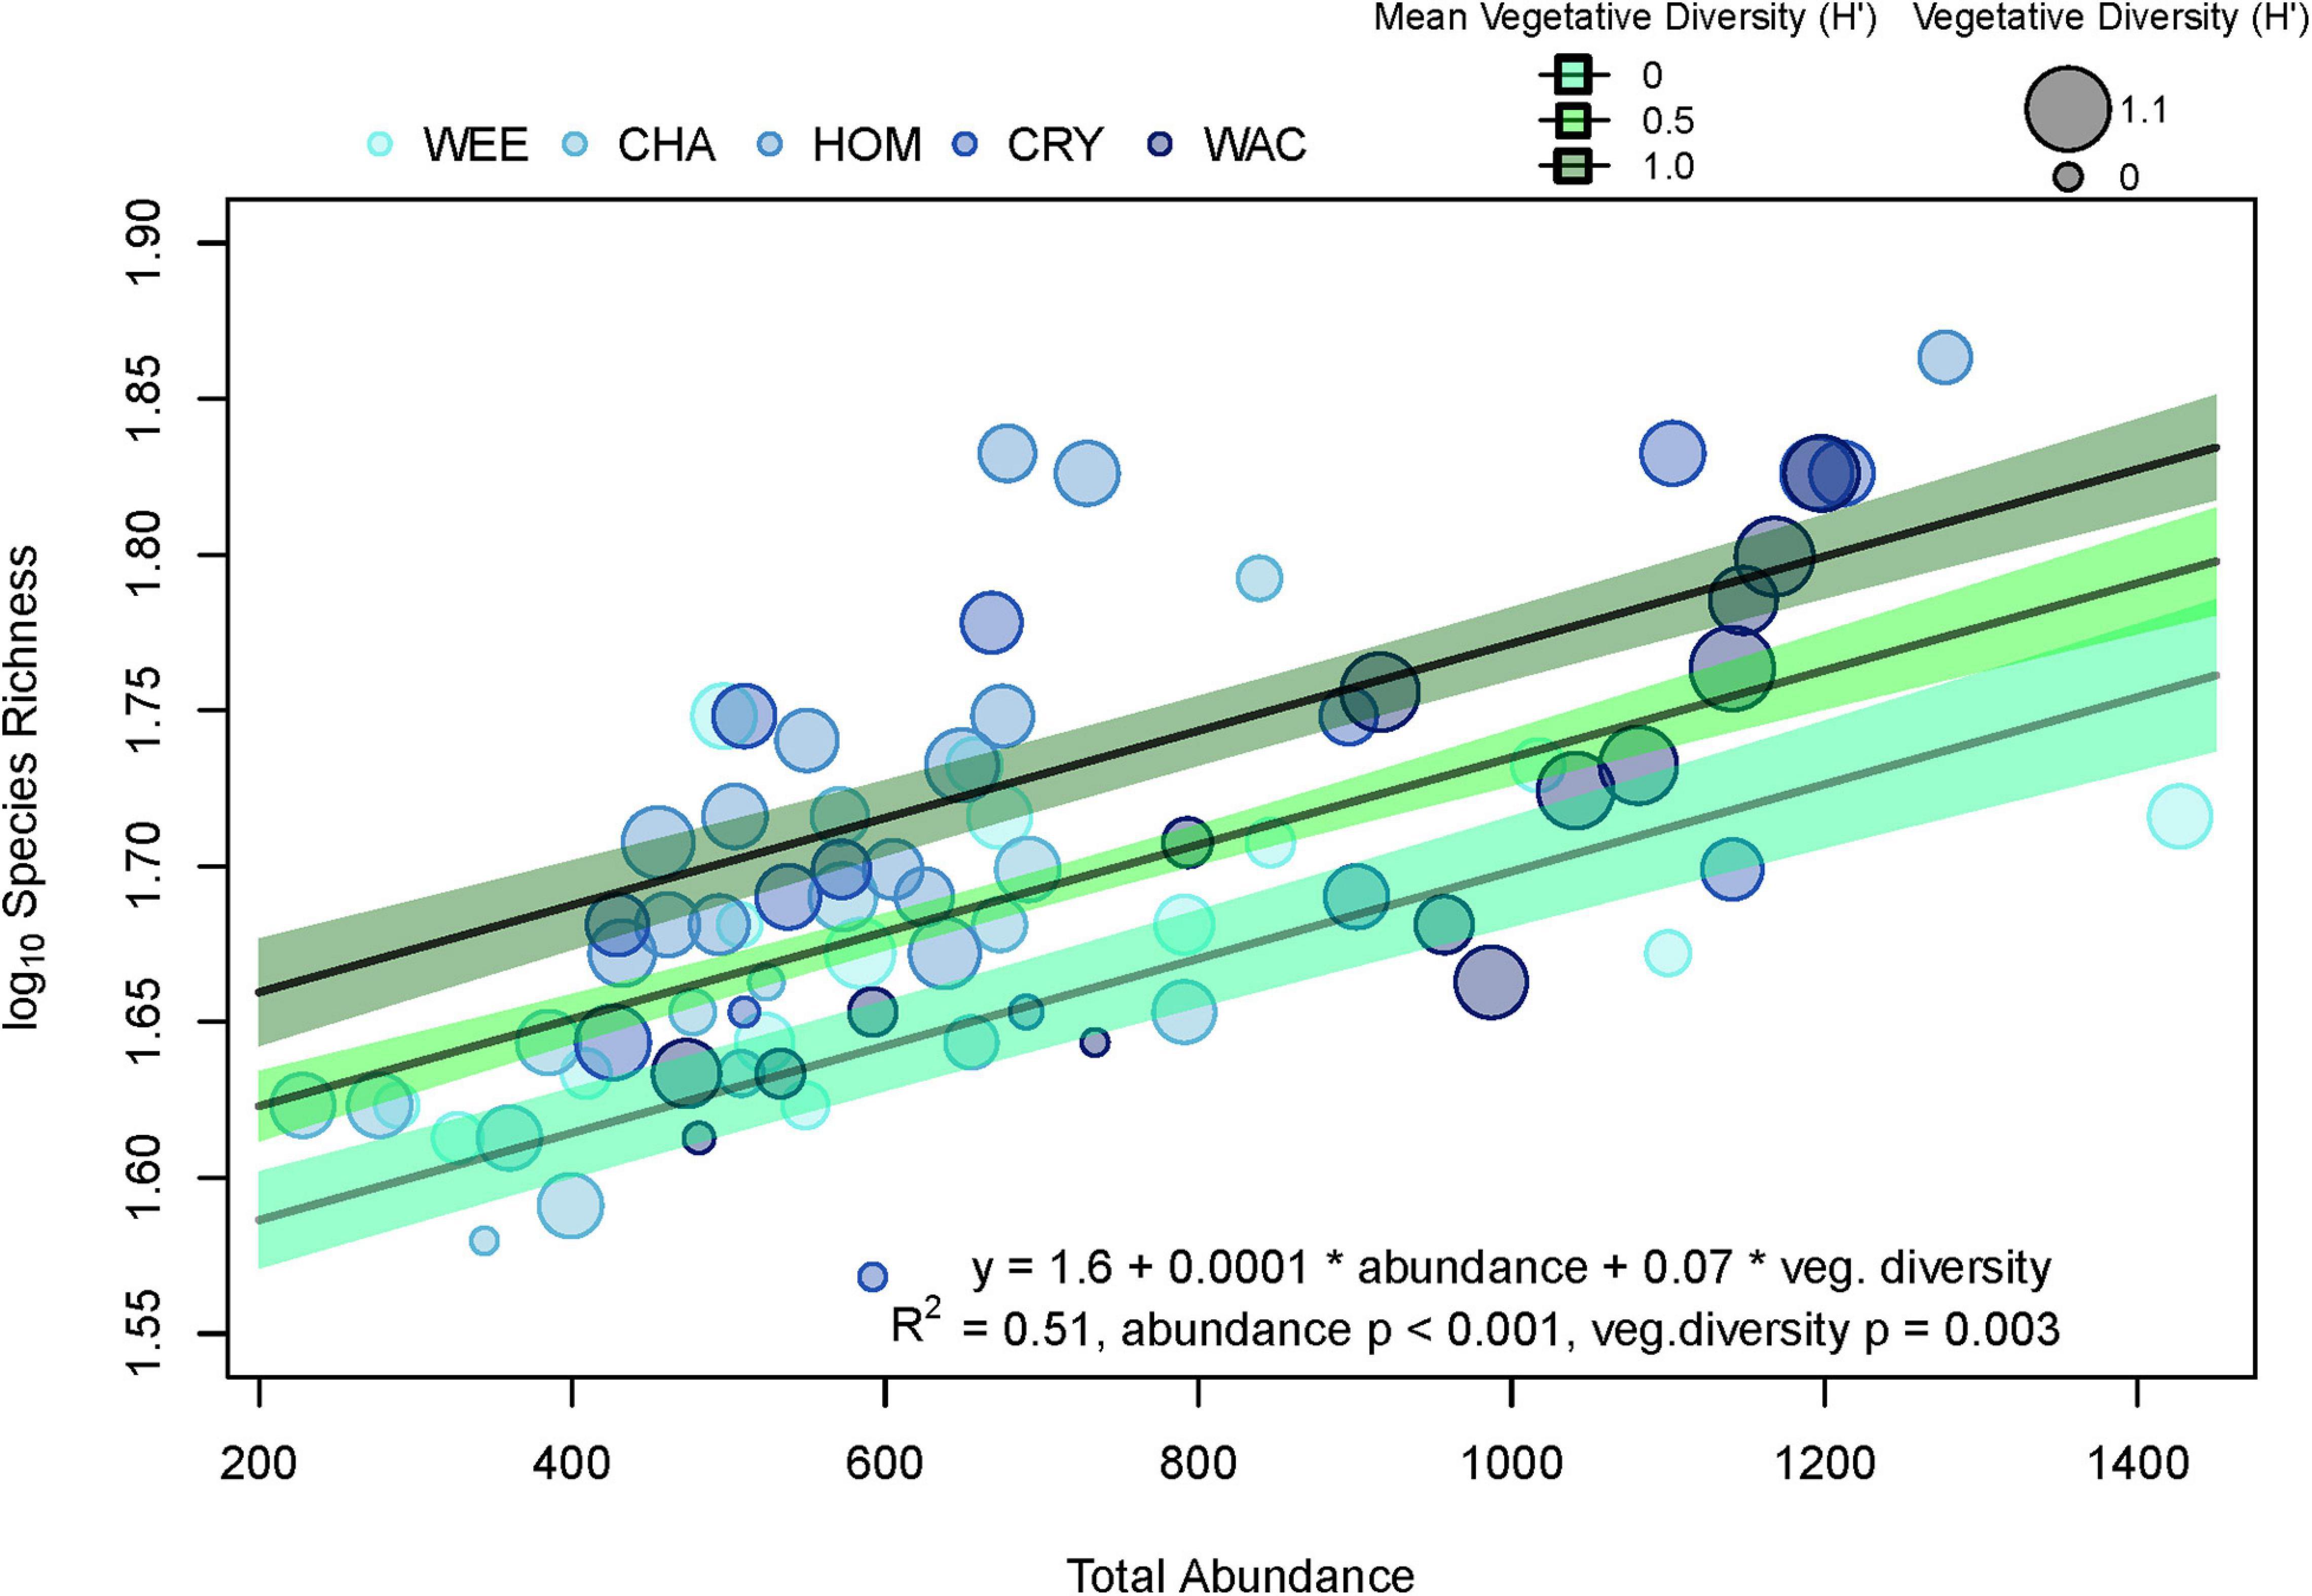
Figure 3. Linear regression of log10 species richness against total abundance and Shannon–Weaver vegetative diversity. WEE, Weeki Wachee; CHA, Chassahowitzka; HOM, Homosassa; CRY, Crystal River; WAC, Waccasassa. Three fitted lines (solid lines) were calculated from model fits by allowing total abundance to vary while holding vegetative diversity constant at three levels (0, 0.5, and 1). Green bands represent the 95% confidence intervals of the three fitted lines, with darker greens indicating higher vegetative diversity. Colors of points indicate relative levels of long-term total phosphorus (TP) concentrations in the water column, with lighter blues indicating lower TP. Sizes of points represent the vegetative diversity for individual samples, with larger sizes indicating higher vegetative diversity. *It is meant to signify multiplication.
Abundances within all four size class (1–2-, 2–4-, 4–8-, and >8-mm) showed at least minimal positive relationships with latitude (TP lowest and T. testudinum smallest in south and both increase with latitude), but the strengths of the correlations differed. Log-transformed abundances of the smallest (1–2-mm, R2 = 0.06, F1,73 = 4.77, p = 0.032) and largest (>8-mm, R2 = 0.05, F1,73 = 4.06, p = 0.048) size classes were very weakly correlated with latitude, with coefficients of determination below 0.1 (Figures 4A,D). Log-transformed abundances of the 2–4-mm size class showed a slightly stronger correlation with latitude (R2 = 0.10, F1,73 = 7.80, p = 0.007, Figure 4B) and abundances in the 4–8-mm size fraction showed a fairly strong relationship with latitude (R2 = 0.50, F1,73 = 73.76, p < 0.001, Figure 4C). The four size classes did not exhibit consistent spatial patterns in abundance, and the correlation for overall abundance was likely driven primarily by the 4–8-mm size fraction.
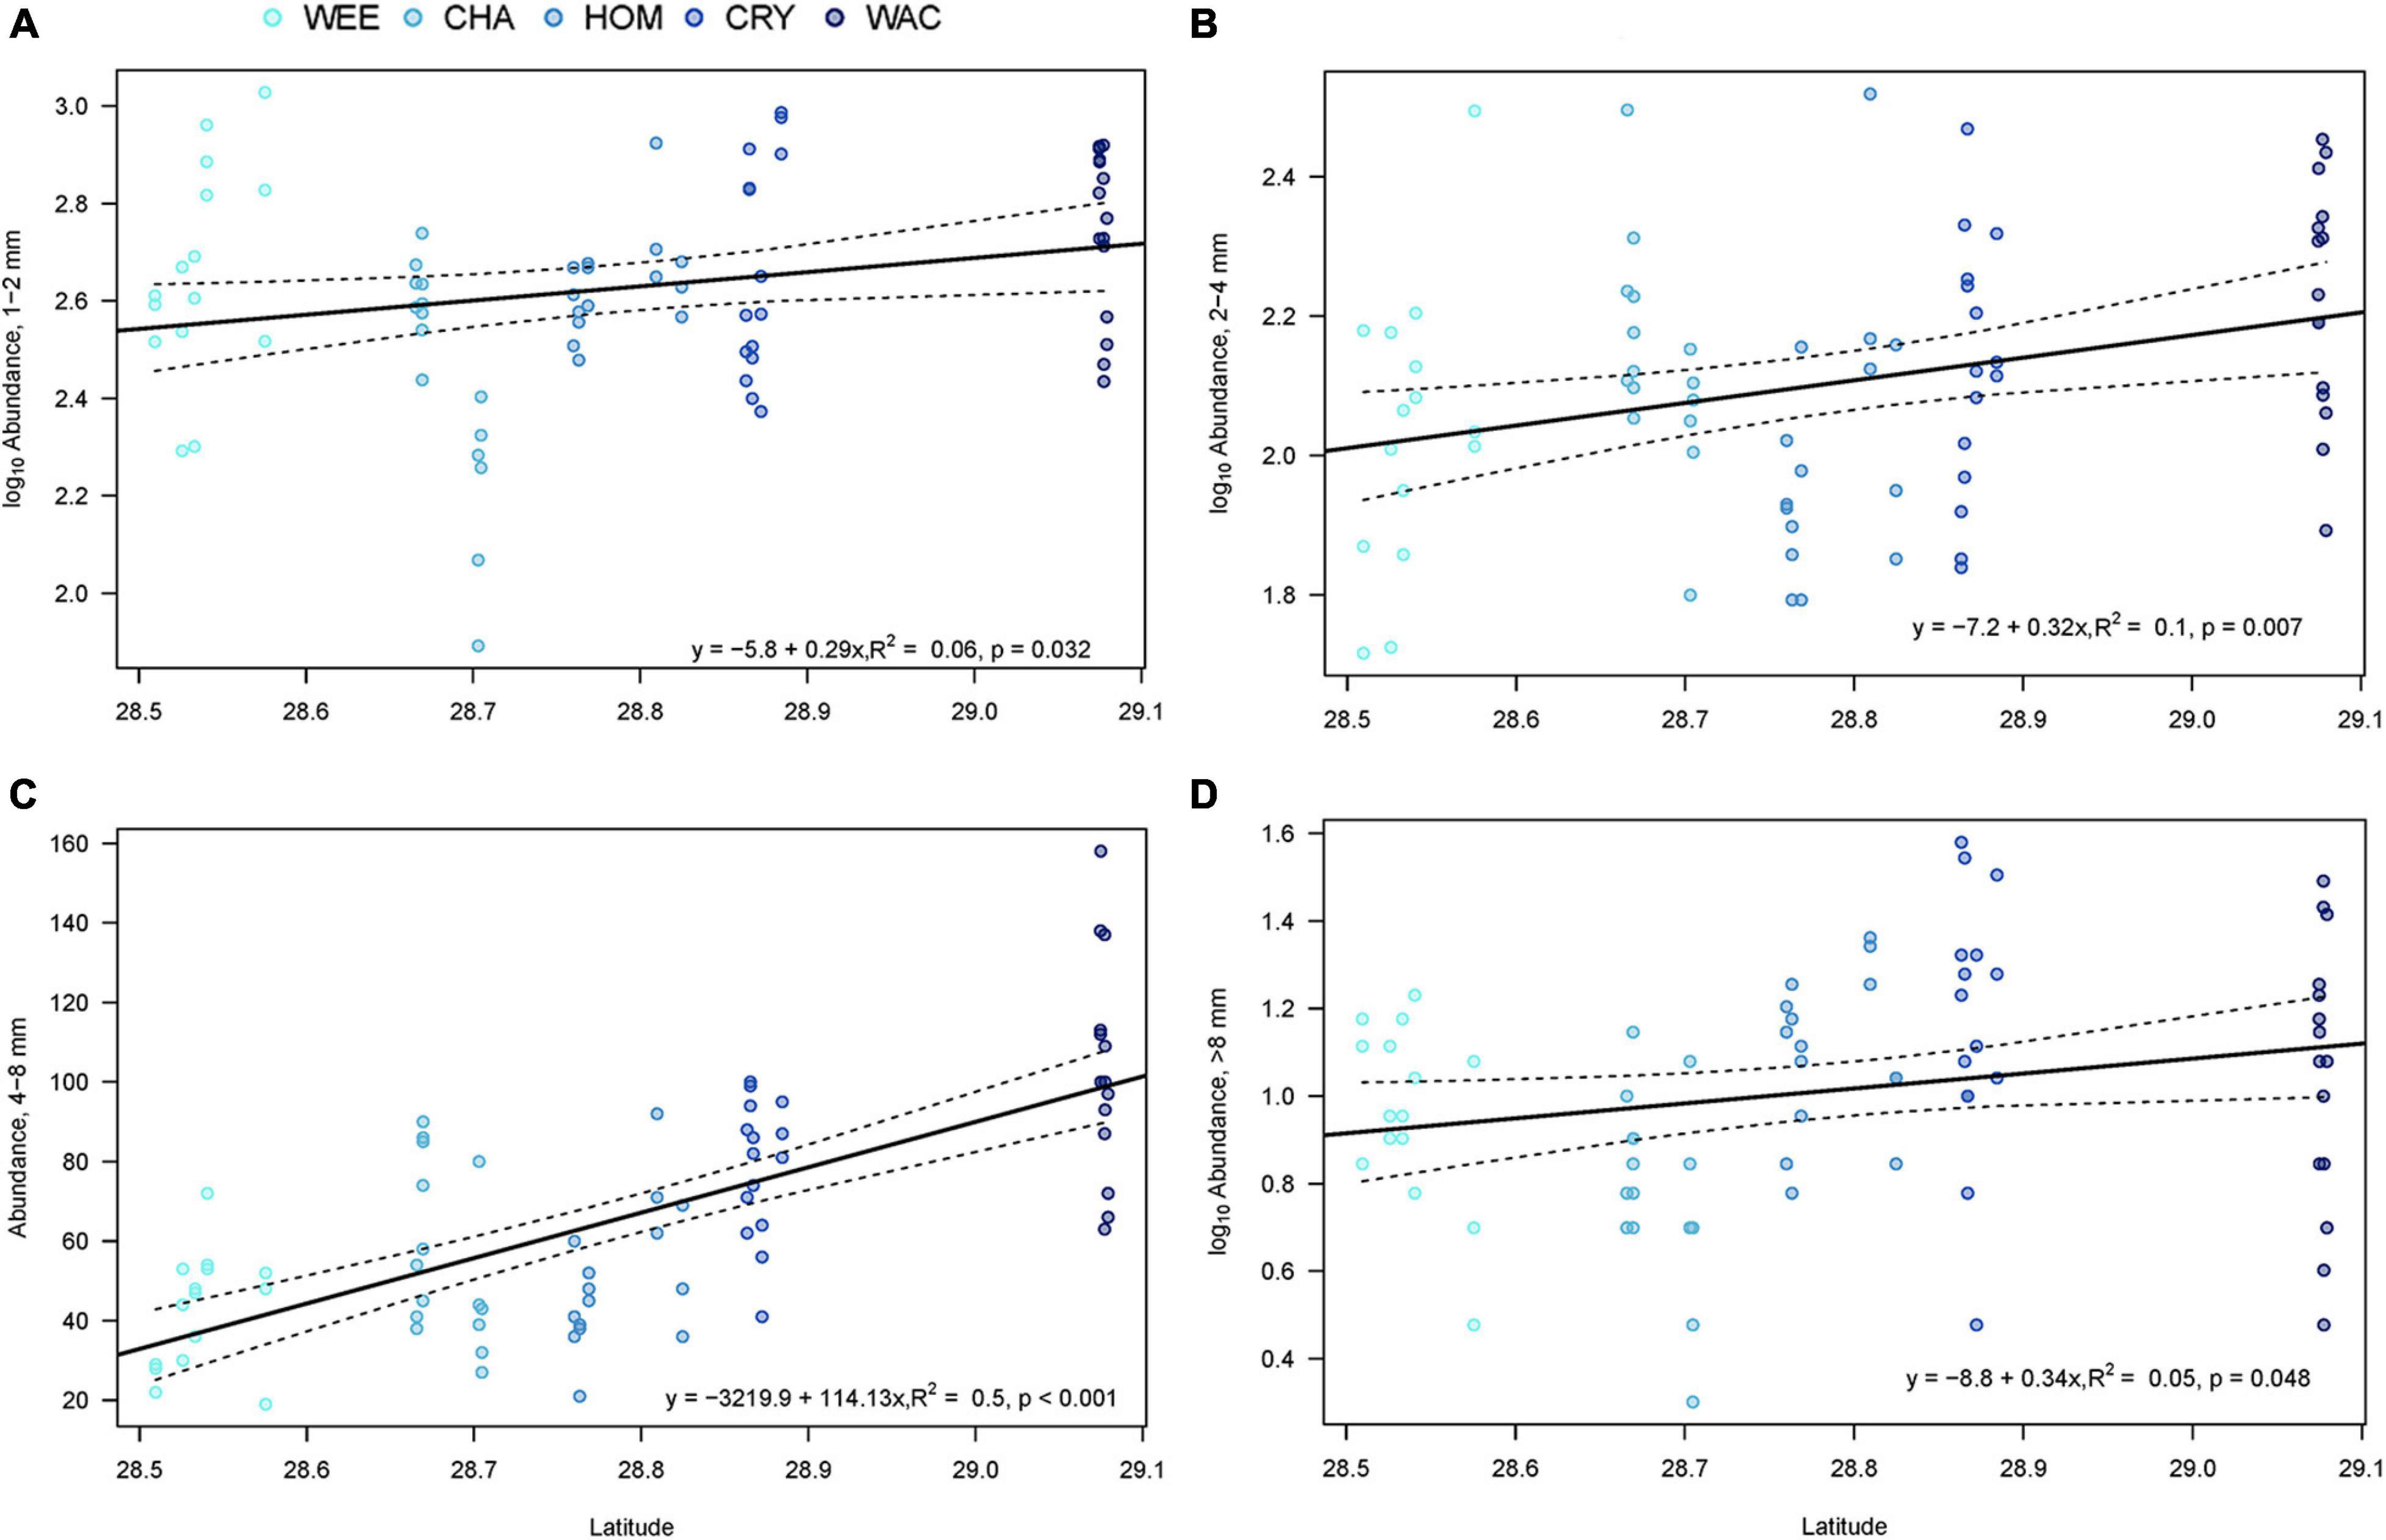
Figure 4. Linear regression of latitude against the total faunal abundance in each of four size classes: (A) 1–2-mm; (B) 2–4-mm, (C) 4–8-mm, (D) >8-mm. WEE, Weeki Wachee; CHA, Chassahowitzka; HOM, Homosassa; CRY, Crystal River; WAC, Waccasassa. Dashed lines represent the 95% confidence interval of the fitted line (solid line). Colors indicate relative levels of long-term total phosphorus (TP) concentrations in the water column, with lighter colors indicating lower TP.
Community Composition
Overall, invertebrate community composition was highly distinct across the gradient sampled. Differences were driven overwhelmingly by common and abundant taxa thought to perform important ecological functions in seagrass ecosystems.
Species-level assemblages showed remarkable spatial differences across the study region. PERMANOVA found that communities were significantly different across systems, stations within systems, and aboveground biomass levels (Table 2). Multiple pairwise comparisons showed species composition in any one particular estuarine system was significantly different from any of the others. The average among-system similarity was 28%, while the average within-system similarity was 43.5%.
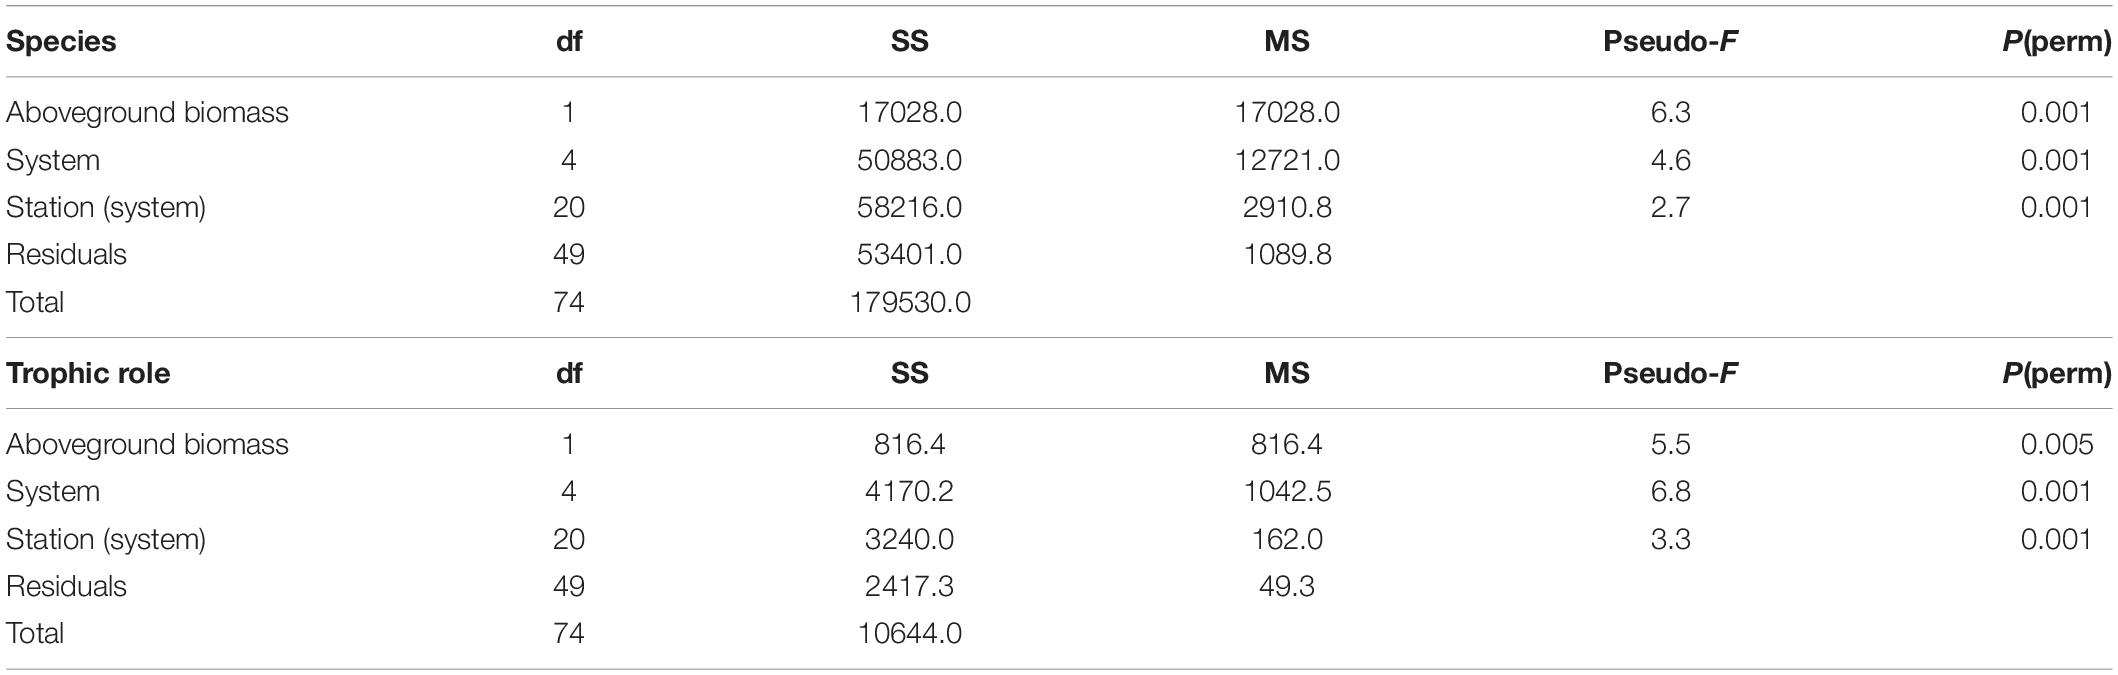
Table 2. PERMANOVA results for community data summarized by species and by trophic role.
Results of PERMDISP analysis (Supplementary Table 2) showed that significant differences in dispersion occurred among systems, but not among stations within systems. Specifically, Waccasassa had significantly lower group dispersion than Weeki Wachee, Chassahowitzka, and Crystal. Given the significant PERMDISP results, it is possible that differences in group dispersion contributed to the significant PERMANOVA results. However, differences in group dispersion cannot account for all of the significant effects found by PERMANOVA, and such variation was unlikely to be the major driver of the spatial differences in community composition, given the clear separation of groups on the nMDS plot (Figure 5A). The results of the permutation tests to evaluate the stress value for nMDS analyses yielded a highly significant result for both the species (observed stress = 0.21, mean permuted stress = 0.34, p < 0.001) and trophic level (observed stress = 0.19, mean permuted stress = 0.27, p < 0.001) data sets, indicating it is reasonable to proceed with interpretation of patterns as biologically meaningful (Dexter et al., 2018).
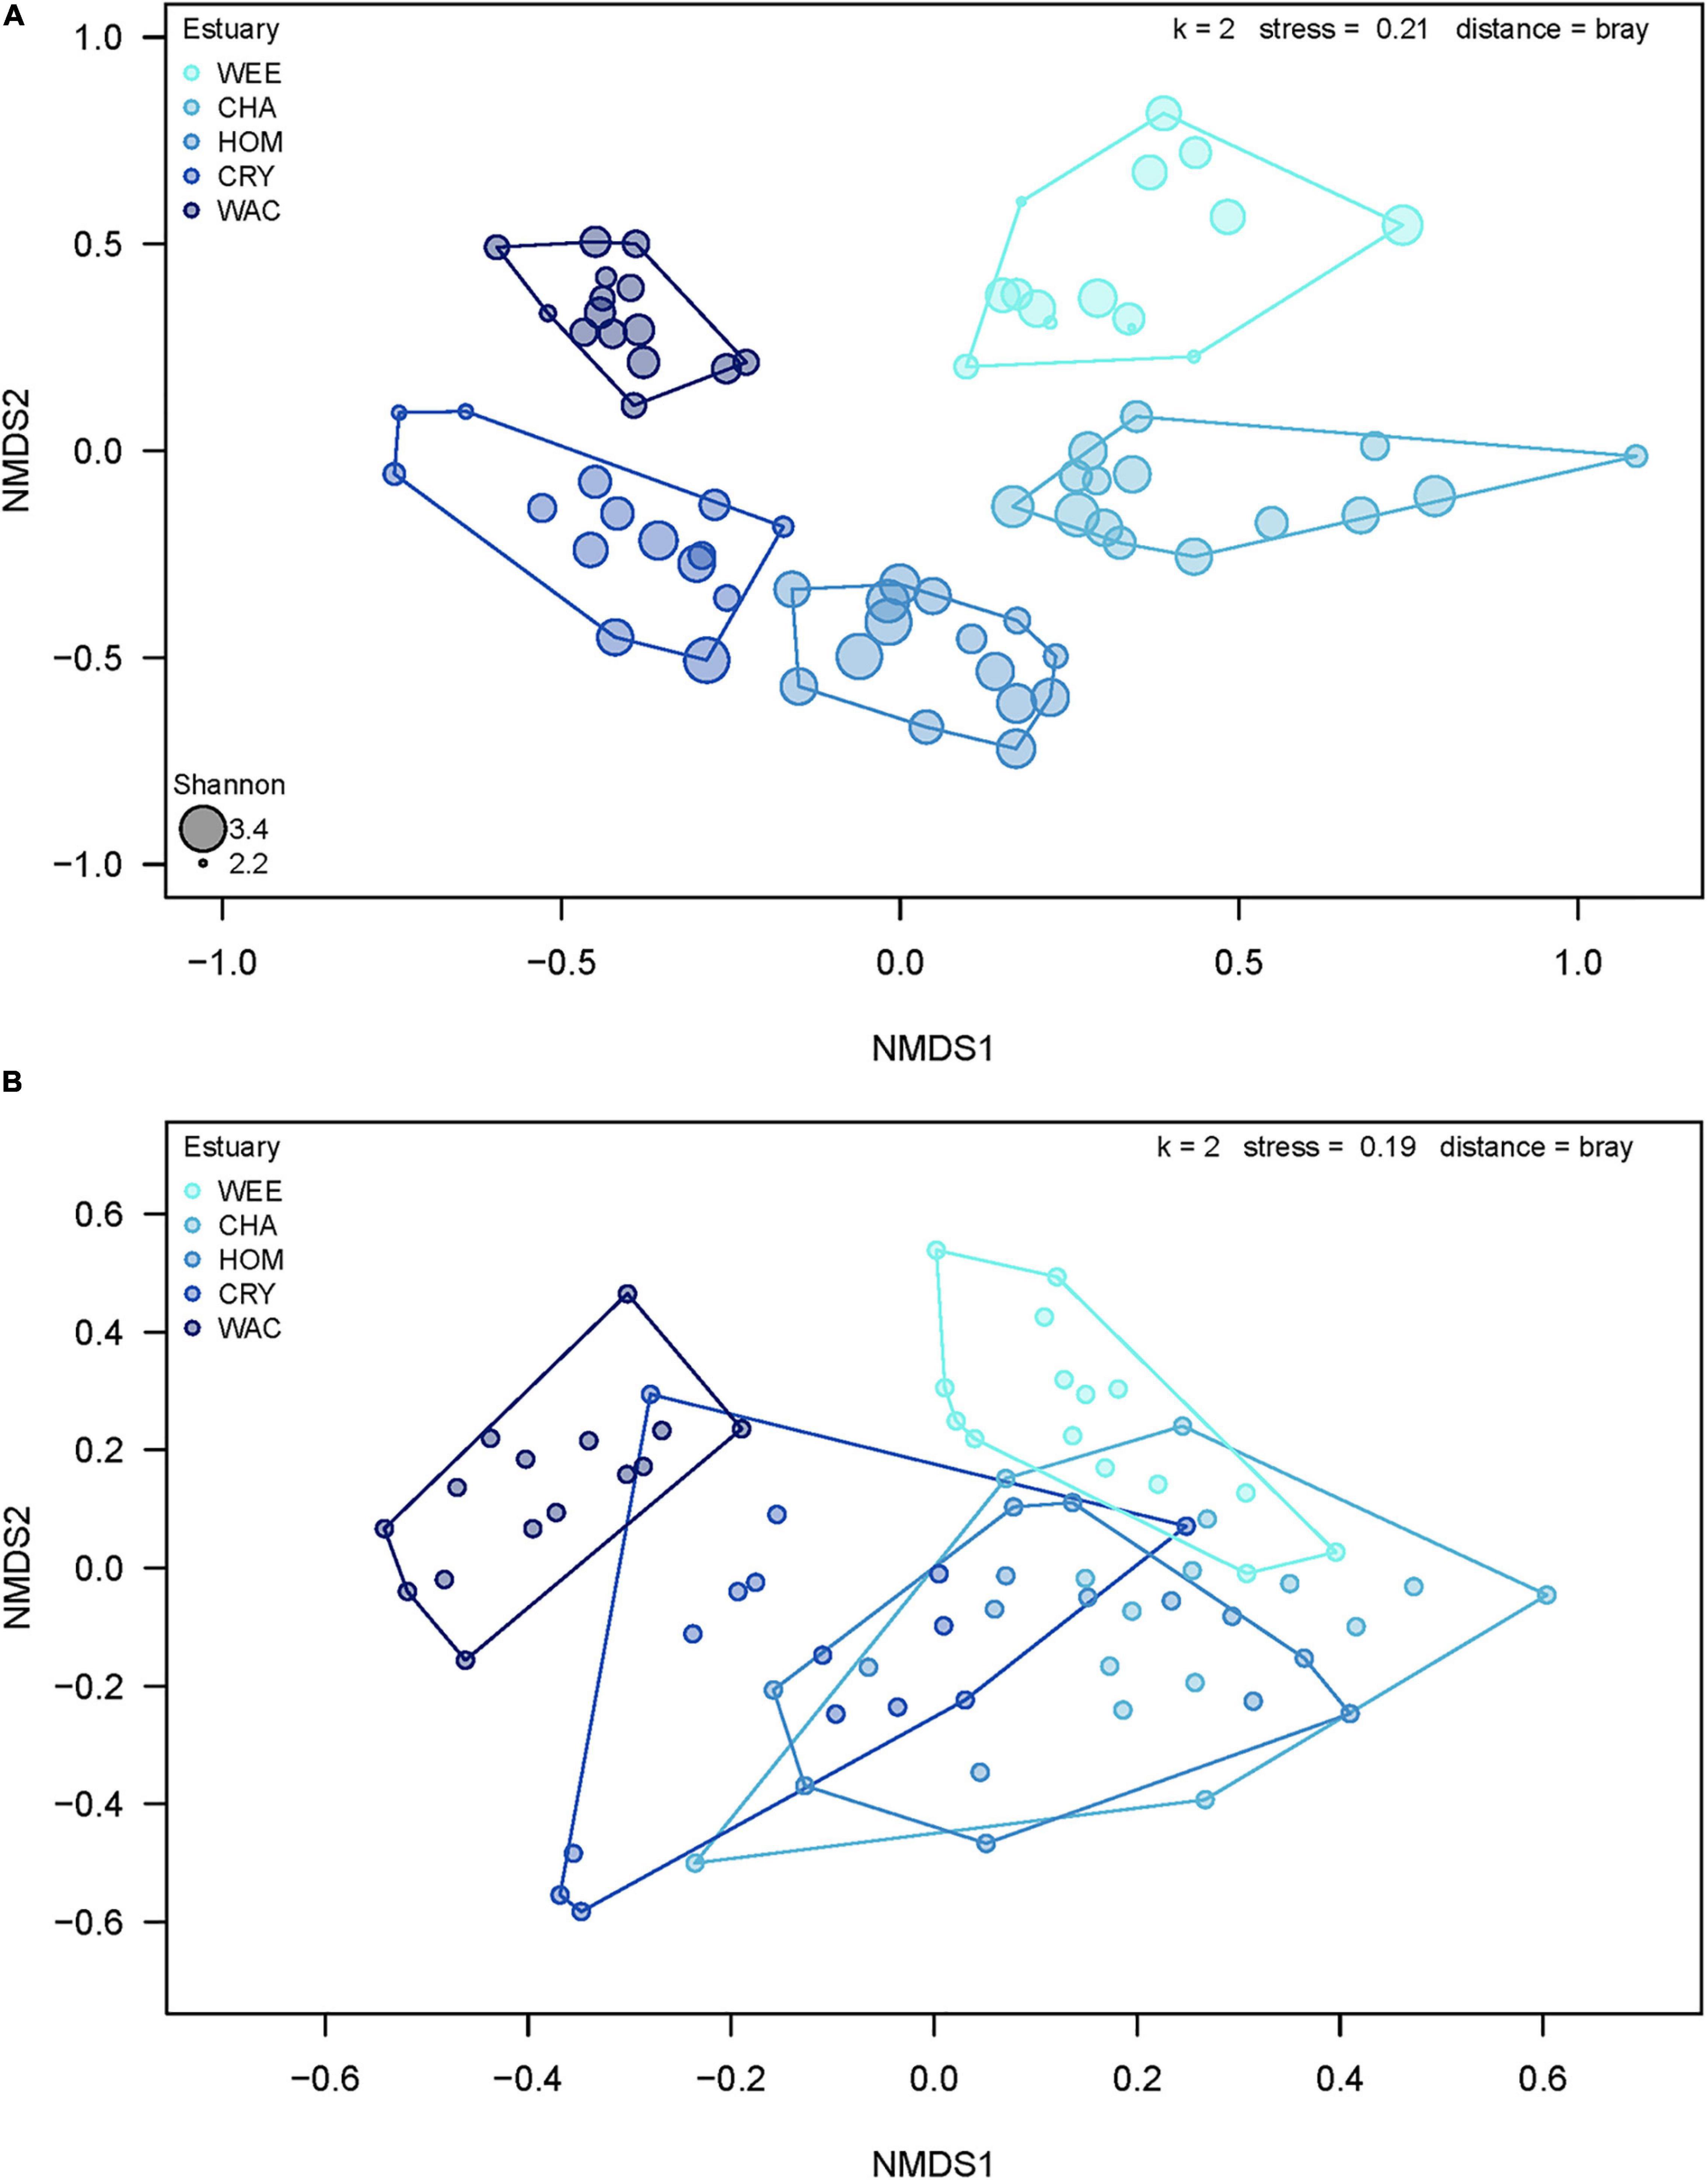
Figure 5. Plot of two-dimensional non-metric multidimensional scaling based on taxonomic data summarized (A) at the species level and (B) by trophic role. WEE, Weeki Wachee; CHA, Chassahowitzka; HOM, Homosassa; CRY, Crystal River; WAC, Waccasassa. Colors indicate relative levels of long-term total phosphorus (TP) concentrations in the water column, with lighter colors indicating lower TP. Sizes of points in (A) represent the Shannon–Weaver diversity of samples, with larger sizes indicating a higher diversity value.
Estuarine Systems
The overall mean dissimilarity between systems was 71% and very little overlap occurred between any groups on the nMDS plot (Figure 5A). The results of the SIMPER analysis showed that differences in community composition among systems were driven mostly by species that were abundant (at least 500 total individuals found) or common (found in more than 50% of samples). However, relatively rare species also contributed significantly to pairwise differences between some systems. In general, between seven and nine of the 10 most influential species in each comparison could be considered common or abundant in our samples. Given the large number of species recorded in this study, only the first 10 species contributing significantly to differences among systems are presented (Table 3), though many more species had smaller influences on the overall result (see Supplementary Table 3 for complete SIMPER results).
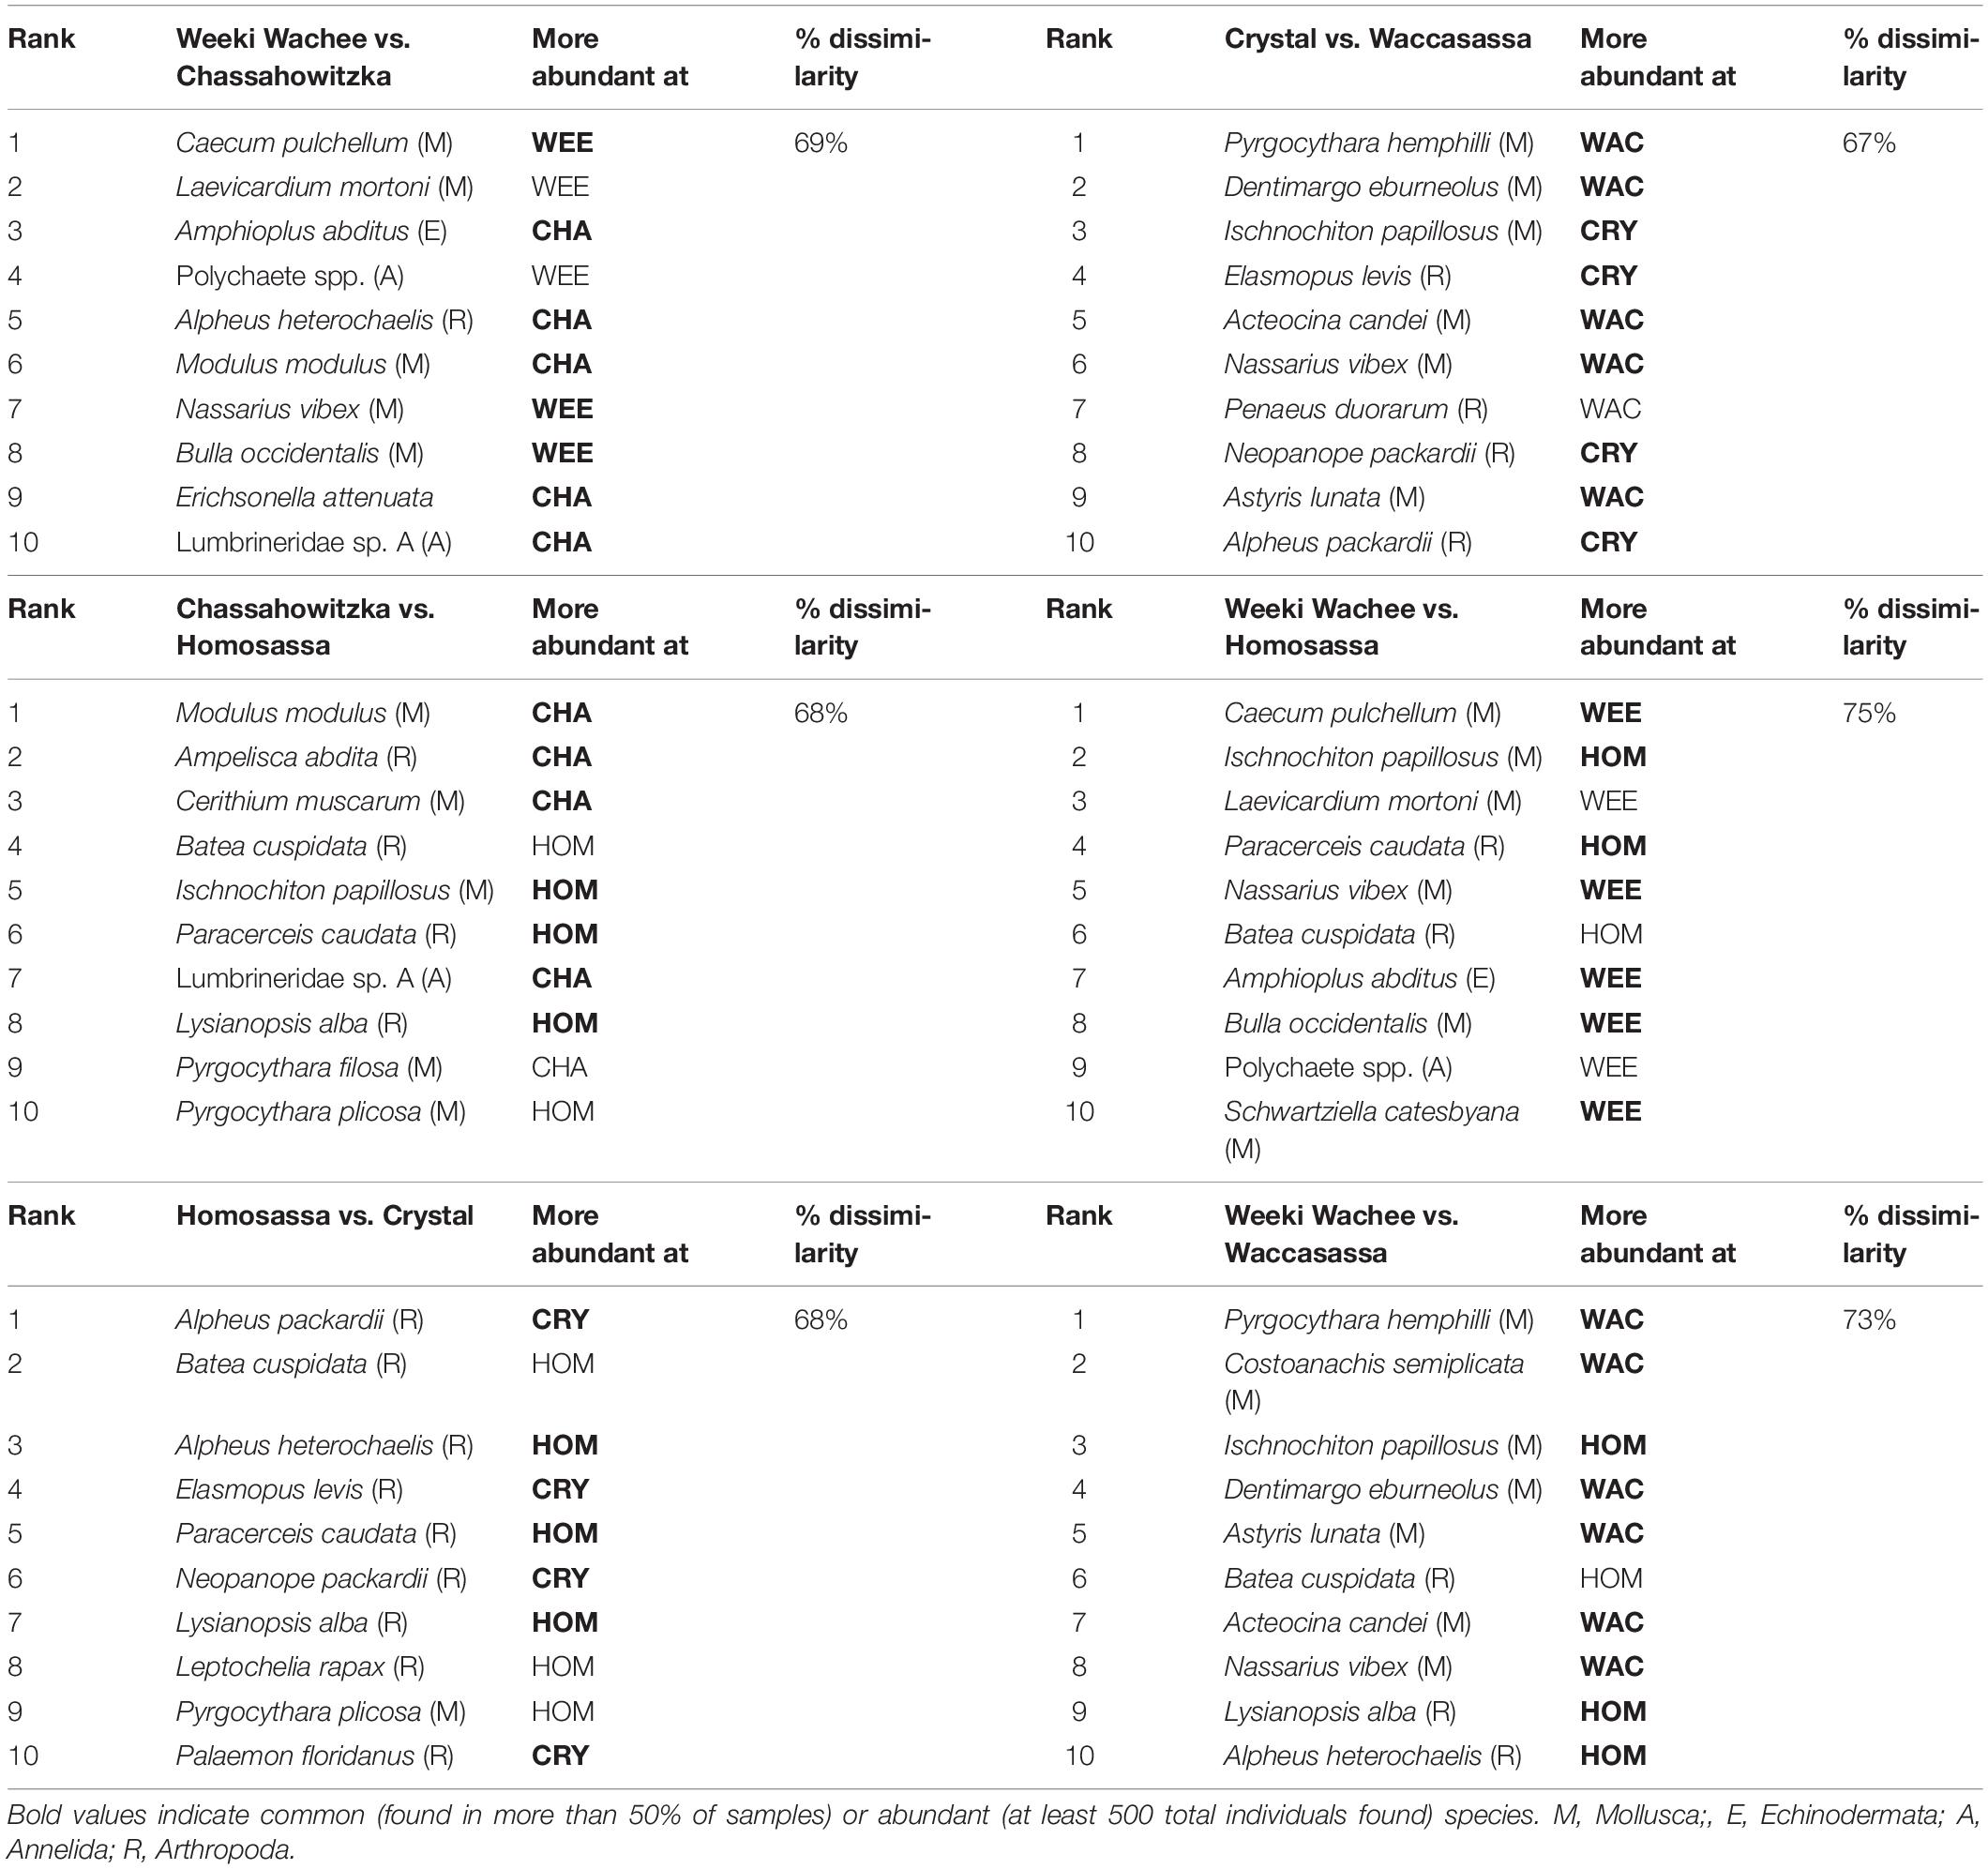
Table 3. Top 10 species contributing to significant differences between community composition among estuarine systems in SIMPER analyses.
Aboveground Biomass
The significant effect of aboveground biomass in the PERMANOVA was investigated further by examining species that contributed to group differences between two categories of aboveground biomass, high and low. Overall, species assemblages were 71% dissimilar between samples with low and high aboveground vegetative biomass (Table 4). Out of the 55 species with significant contributions to group differences, 32 (58%) were more abundant in samples with higher vegetative biomass while the remainder (42%) were more abundant in samples with lower vegetative biomass.
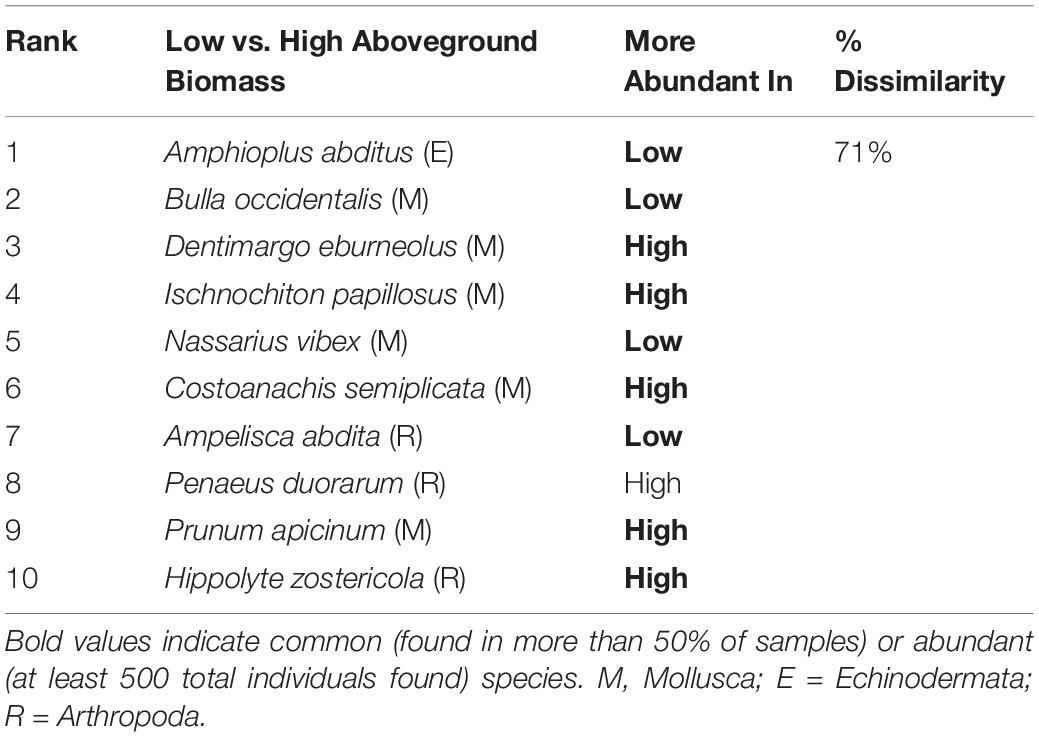
Table 4. Top 10 species contributing to significant differences between community composition among vegetative biomass categories in SIMPER analyses.
Trophic Role
Many of the differences in invertebrate communities among estuarine systems were driven by potentially important taxa, such as grazers and predators according to SIMPER analysis. The results of multivariate analyses of data summarized by trophic role largely agree with the above results, though fewer spatial differences exist. PERMANOVA analyses showed that significant differences in trophic roles existed among systems, stations within systems, and aboveground biomass (Table 2). Pairwise comparisons of adjacent estuaries revealed that, after Benjamini–Hochberg correction, Weeki Wachee, Chassahowitzka, Homosassa, and Crystal had similar trophic composition while the trophic assemblage of Waccasassa (the most northern estuarine system) differed significantly from all other systems. In addition, trophic composition in Weeki Wachee (the southern-most system) was significantly different from Crystal (the second-farthest north system). PERMDISP analysis indicated that significant differences in dispersion between groups occurred only between Waccasassa and Crystal, with no other differences in dispersion at the system or station within system level (Supplementary Tables 2.2, 2.4). Therefore, most of the significance found in PERMANOVA is likely due to differences in the composition of trophic roles and not differences in dispersion among samples. The plot of the results of the nMDS analysis on the trophic roles data (Figure 5B) helps visualize the above results, showing some separation among estuarine systems in multivariate space, but more overlap than was observed for the data summarized by species.
Results of SIMPER analysis revealed an overall mean dissimilarity of 32% for trophic composition among estuarine systems. Differences in the abundances of predators and epiphyte/macroalgal grazers primarily drove the differences observed, but filter feeders, omnivores, and detritivores sometimes had significant contributions (see Supplementary Table 3 for full SIMPER results). Predators were more abundant in Waccasassa and epiphyte/macroalgal grazers were more abundant in Weeki Wachee, Chassahowitzka, Homosassa, and Crystal. In addition, Crystal and Homosassa had a higher abundance of detritivores, Chassahowitzka had a higher abundance of filter feeders, and Weeki Wachee had a higher abundance of omnivores in comparison to Waccasassa.
Beta-Diversity and Distance
In general, there is evidence that both large and local scale environmental variation contributed significantly to spatial differences in species composition, or beta-diversity. Partial Mantel tests indicated that beta-diversity was significantly correlated with both geographic distance (Mantel correlation = 0.49, p = 0.001, Figure 6A) and local environmental distance (Mantel correlation = 0.38, p = 0.001, Figure 6B). Variation in beta-diversity was explained more strongly by geographic distance (adjusted R2 = 0.45) than local environmental distance (adjusted R2 = 0.16). Residual versus predicted scatter plots did not show evidence of residual autocorrelation. The polynomial fit between beta-diversity and geographic distance showed that species assemblages from samples closer together in space were more similar than samples that were farther apart. Specifically, beta-diversity increased rapidly and then reached an asymptote as geographic distance increased. Notably, the strong horseshoe-like arch effect displayed on the nMDS plot (Figure 5A) can be indicative of species turnover along a meaningful spatial gradient, and an arch is often observed when pairwise distances between points reach an asymptote as the number of shared species decreases.
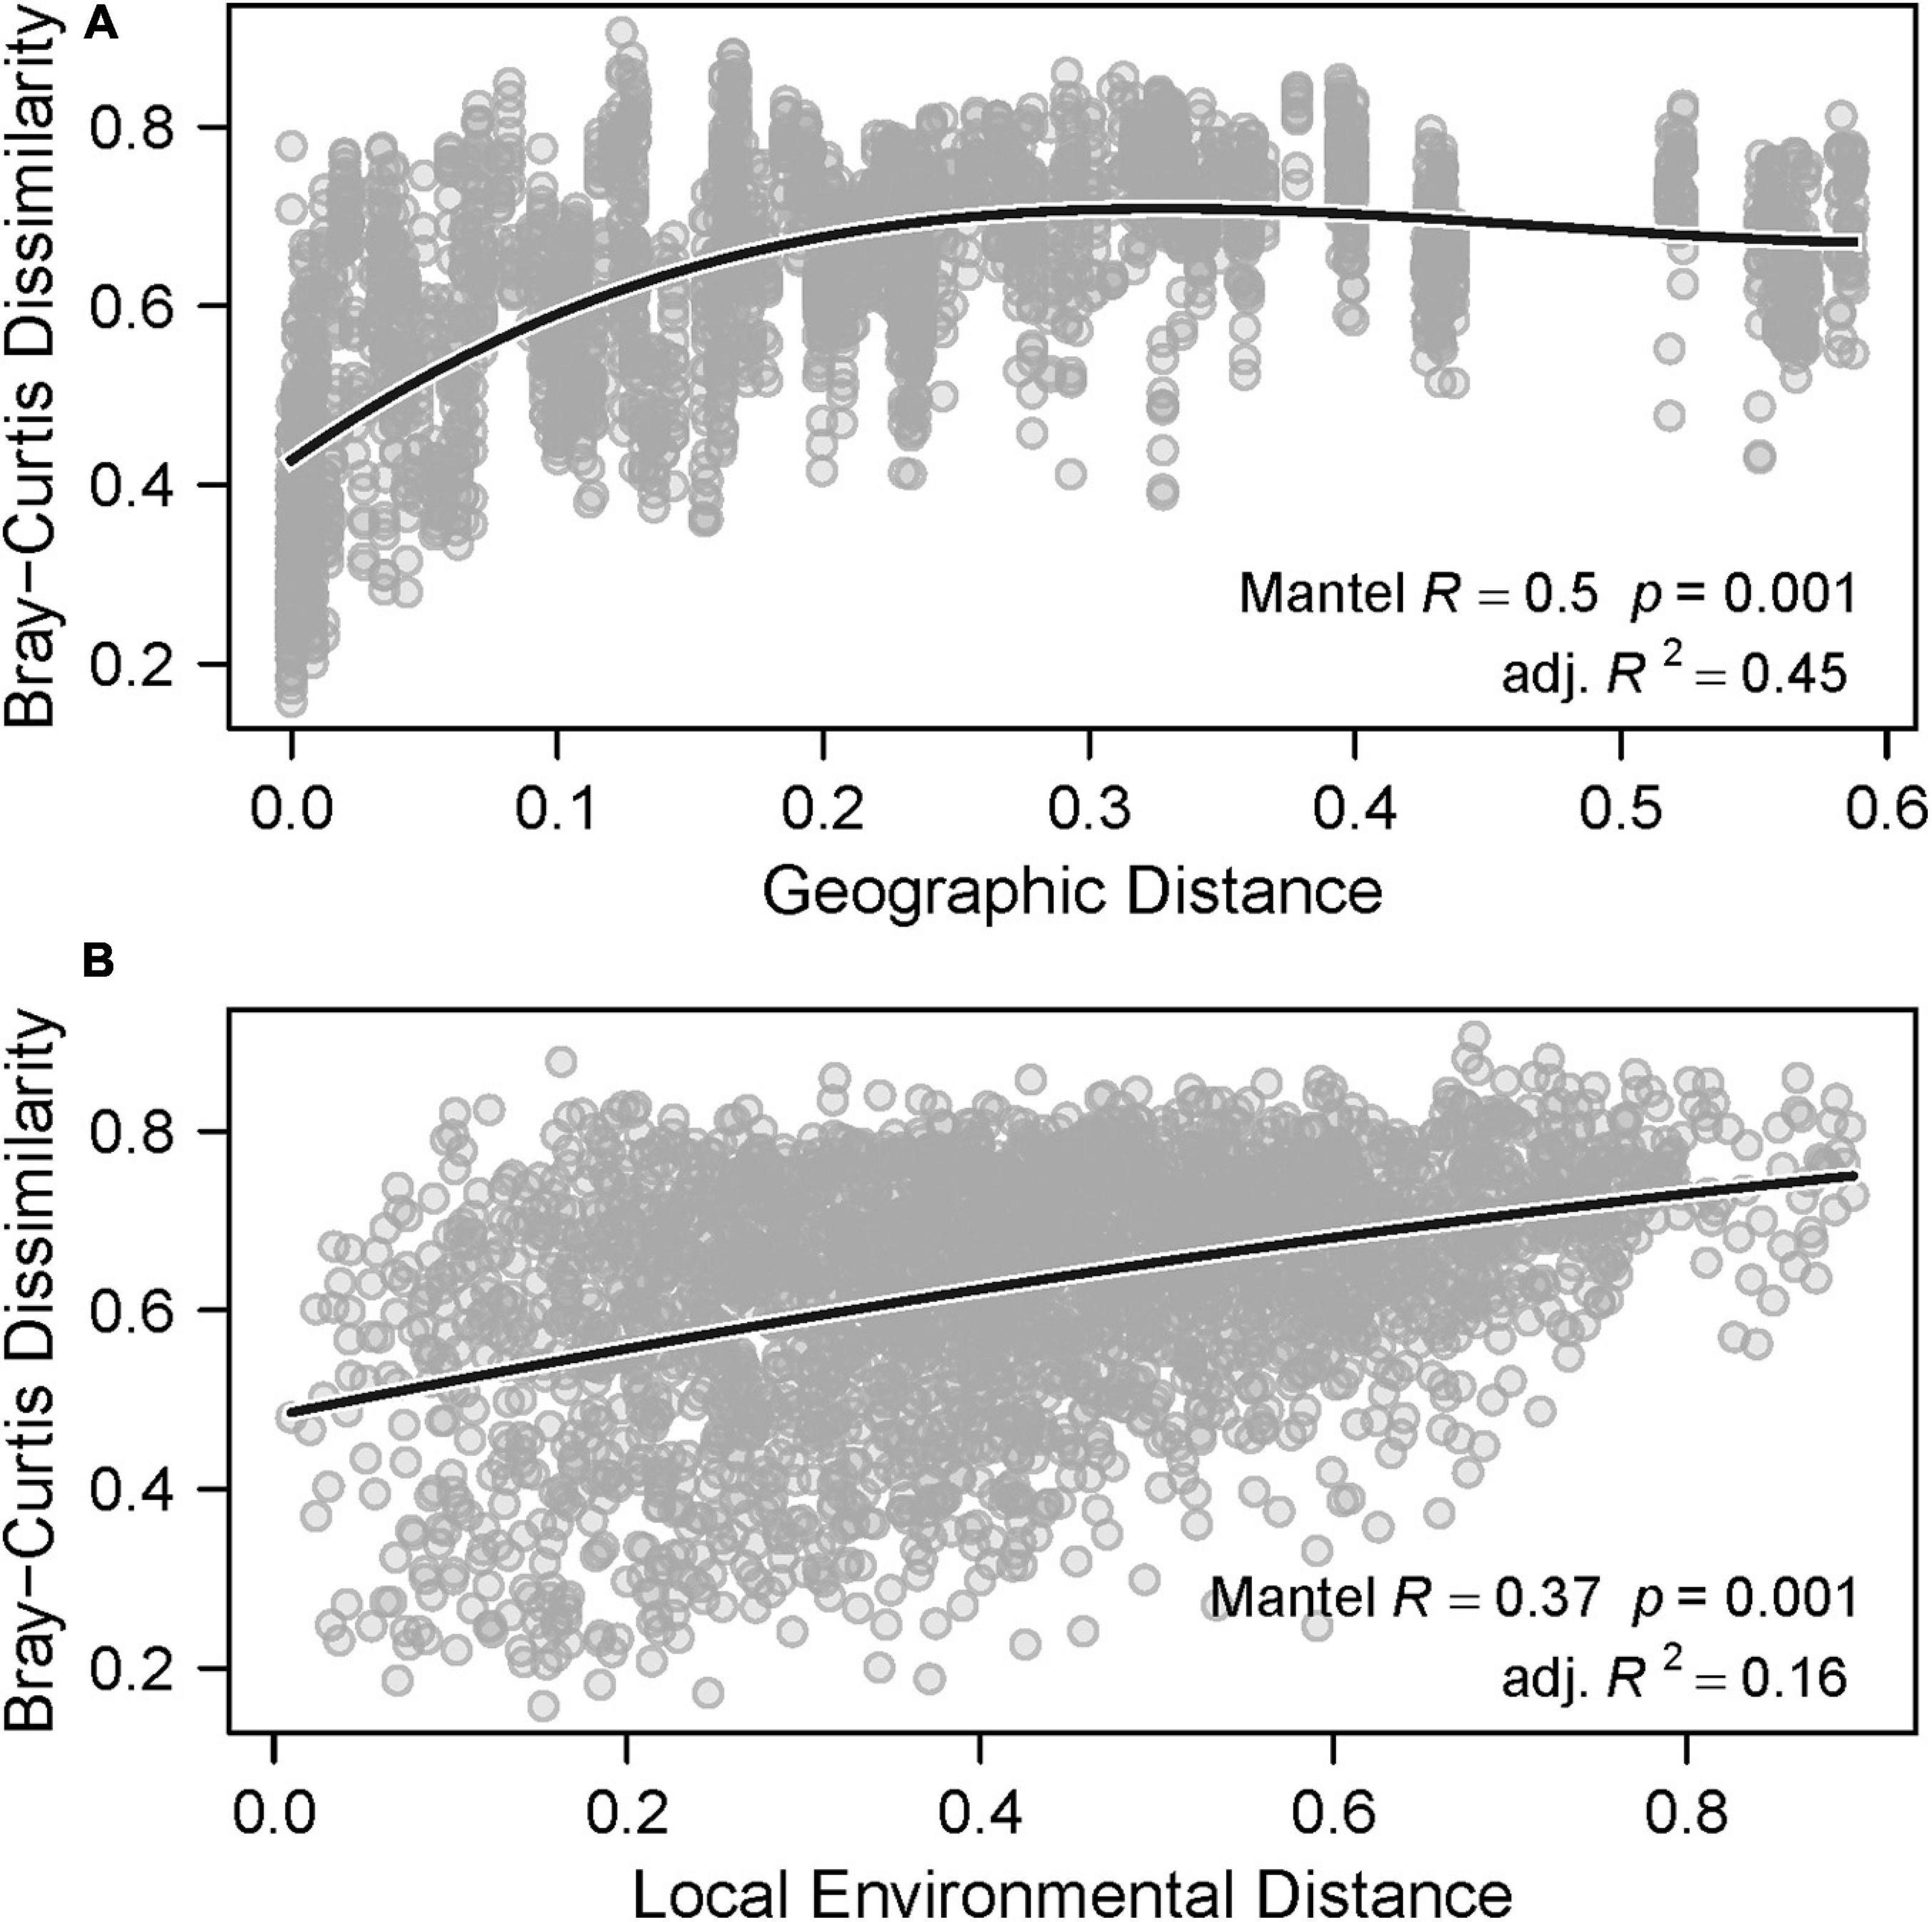
Figure 6. Beta-diversity against (A) geographic distance and (B) local environmental distance. The solid lines represent the polynomial fit.
The polynomial fit between beta-diversity and local environmental distance showed that species assemblages from samples with more similar vegetative communities were slightly more similar than those from samples with larger differences in vegetative communities. This effect, though somewhat weak, suggests that local environmental variation also contributes meaningfully to the spatial differences in community composition (i.e., beta-diversity) observed in these samples, and is consistent with results of the univariate analyses (Figure 3).
Redundancy analyses support the conclusion that both geographic and local environmental variation contribute to differences in species assemblages (Table 5). Variance partitioning showed that 20 and 15% of the variance in species assemblages can be explained by geographic location (p < 0.001) and local plant composition (p = 0.003), respectively (Table 4). Approximately 2% of the variance was shared between the two explanatory matrices, indicating that they were not strongly collinear.
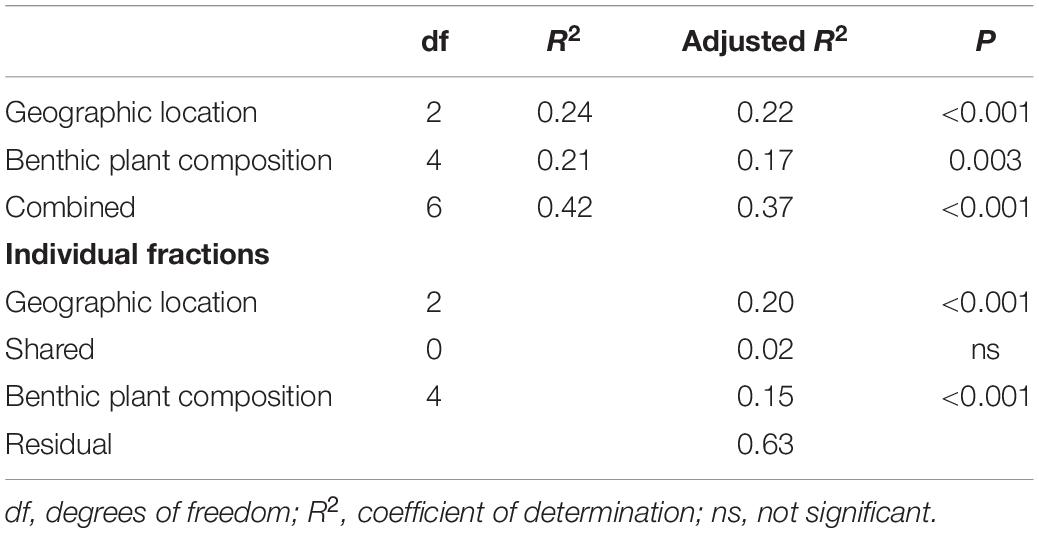
Table 5. Results of variance partitioning with redundancy analysis ordination.
The above results indicate that spatial differences in overall community composition are driven by both large and small-scale environmental differences (i.e., the chemical and structural gradients that vary with latitude and differences in the composition of vegetation that occurs within stations). This finding is further supported by inspection of spatial structuring in the abundances of the top twenty most abundant species (Figure 7). Every species examined showed evidence of spatial structuring, and patterns ranged from nearly linear (e.g., Prunum apicinum, Phascolion sp., Costoanachis semiplicata) to unimodal (e.g., Ischnochiton papillosus, Hippolyte pleuracantha, and Hippolyte zostericola) to bimodal (e.g., Pagurus maclaughlinae). Finally, data summarized by trophic role also show evidence of spatial structuring, with semi-linear (i.e., predators, epiphyte/algal grazers, and parasites) and non-linear (i.e., filter feeders and detritivores) latitudinal patterns evident (Figure 8).
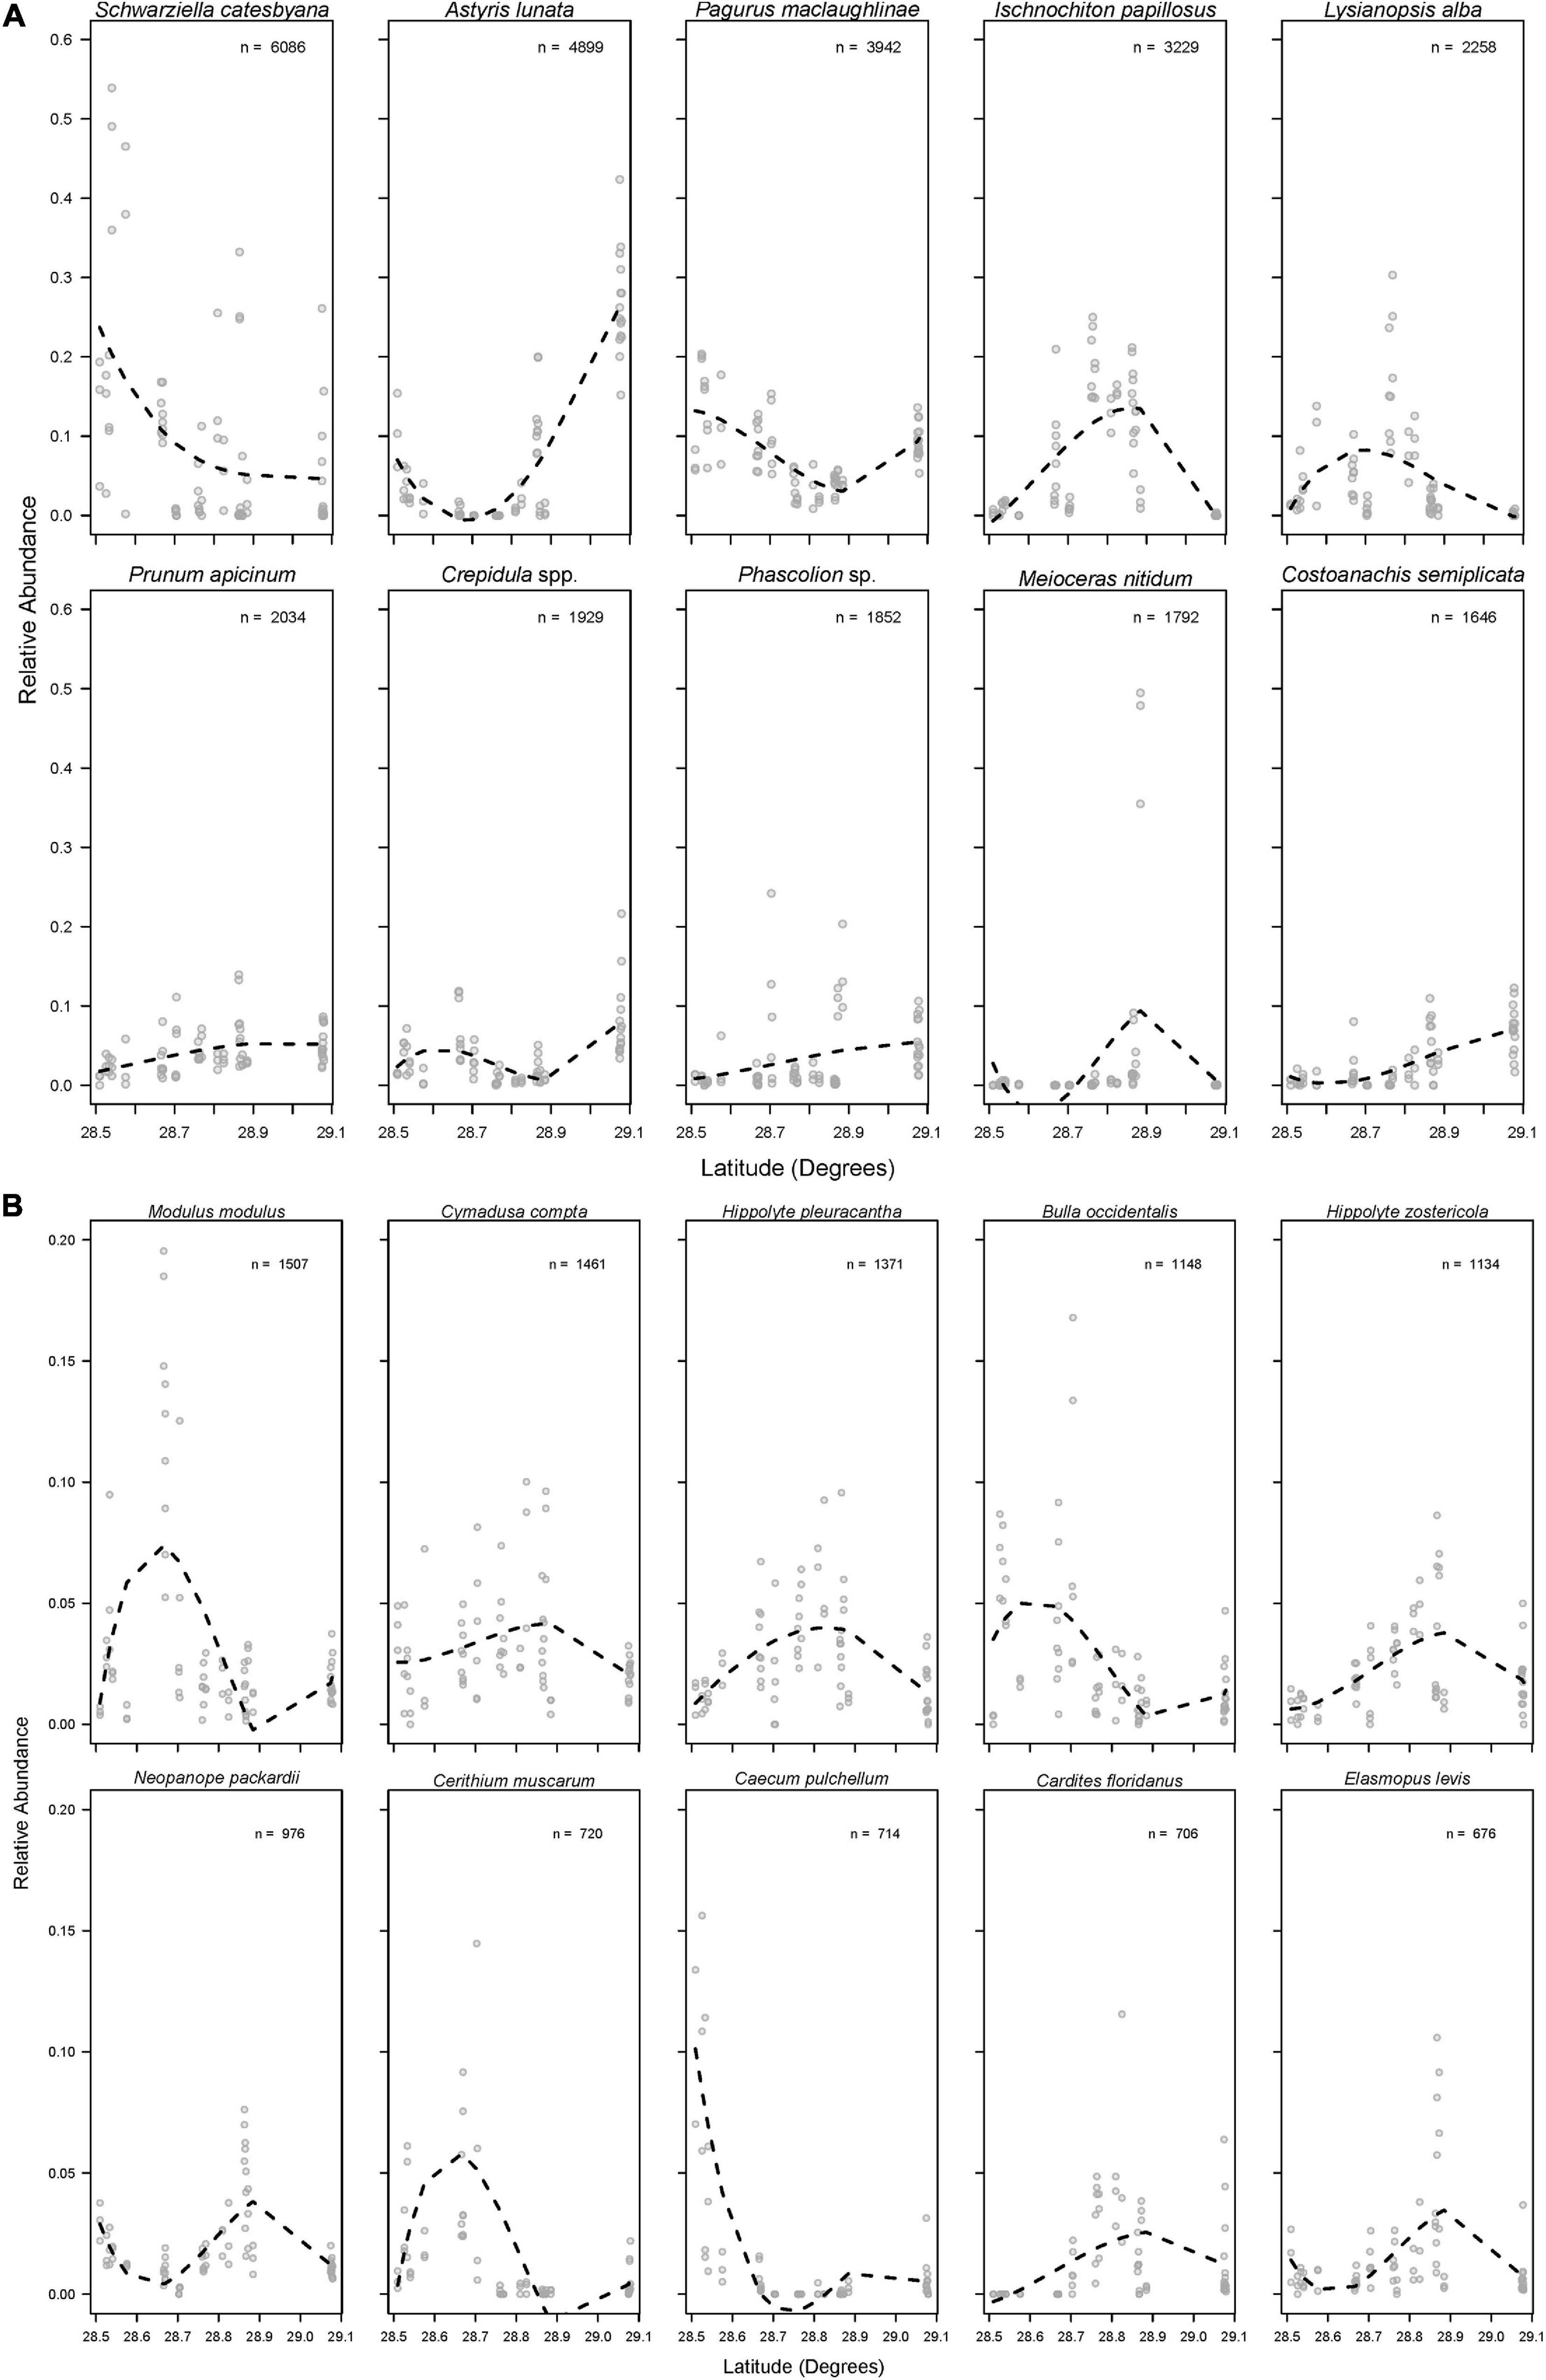
Figure 7. Relative abundances of the (A) 1st–10th and (B) 11th–20th most abundant species across latitude. Dashed lines represent the moving average of relative abundance across latitude. Note the different y-axis scales in each panel, “n” = the total number of each species found across all samples.
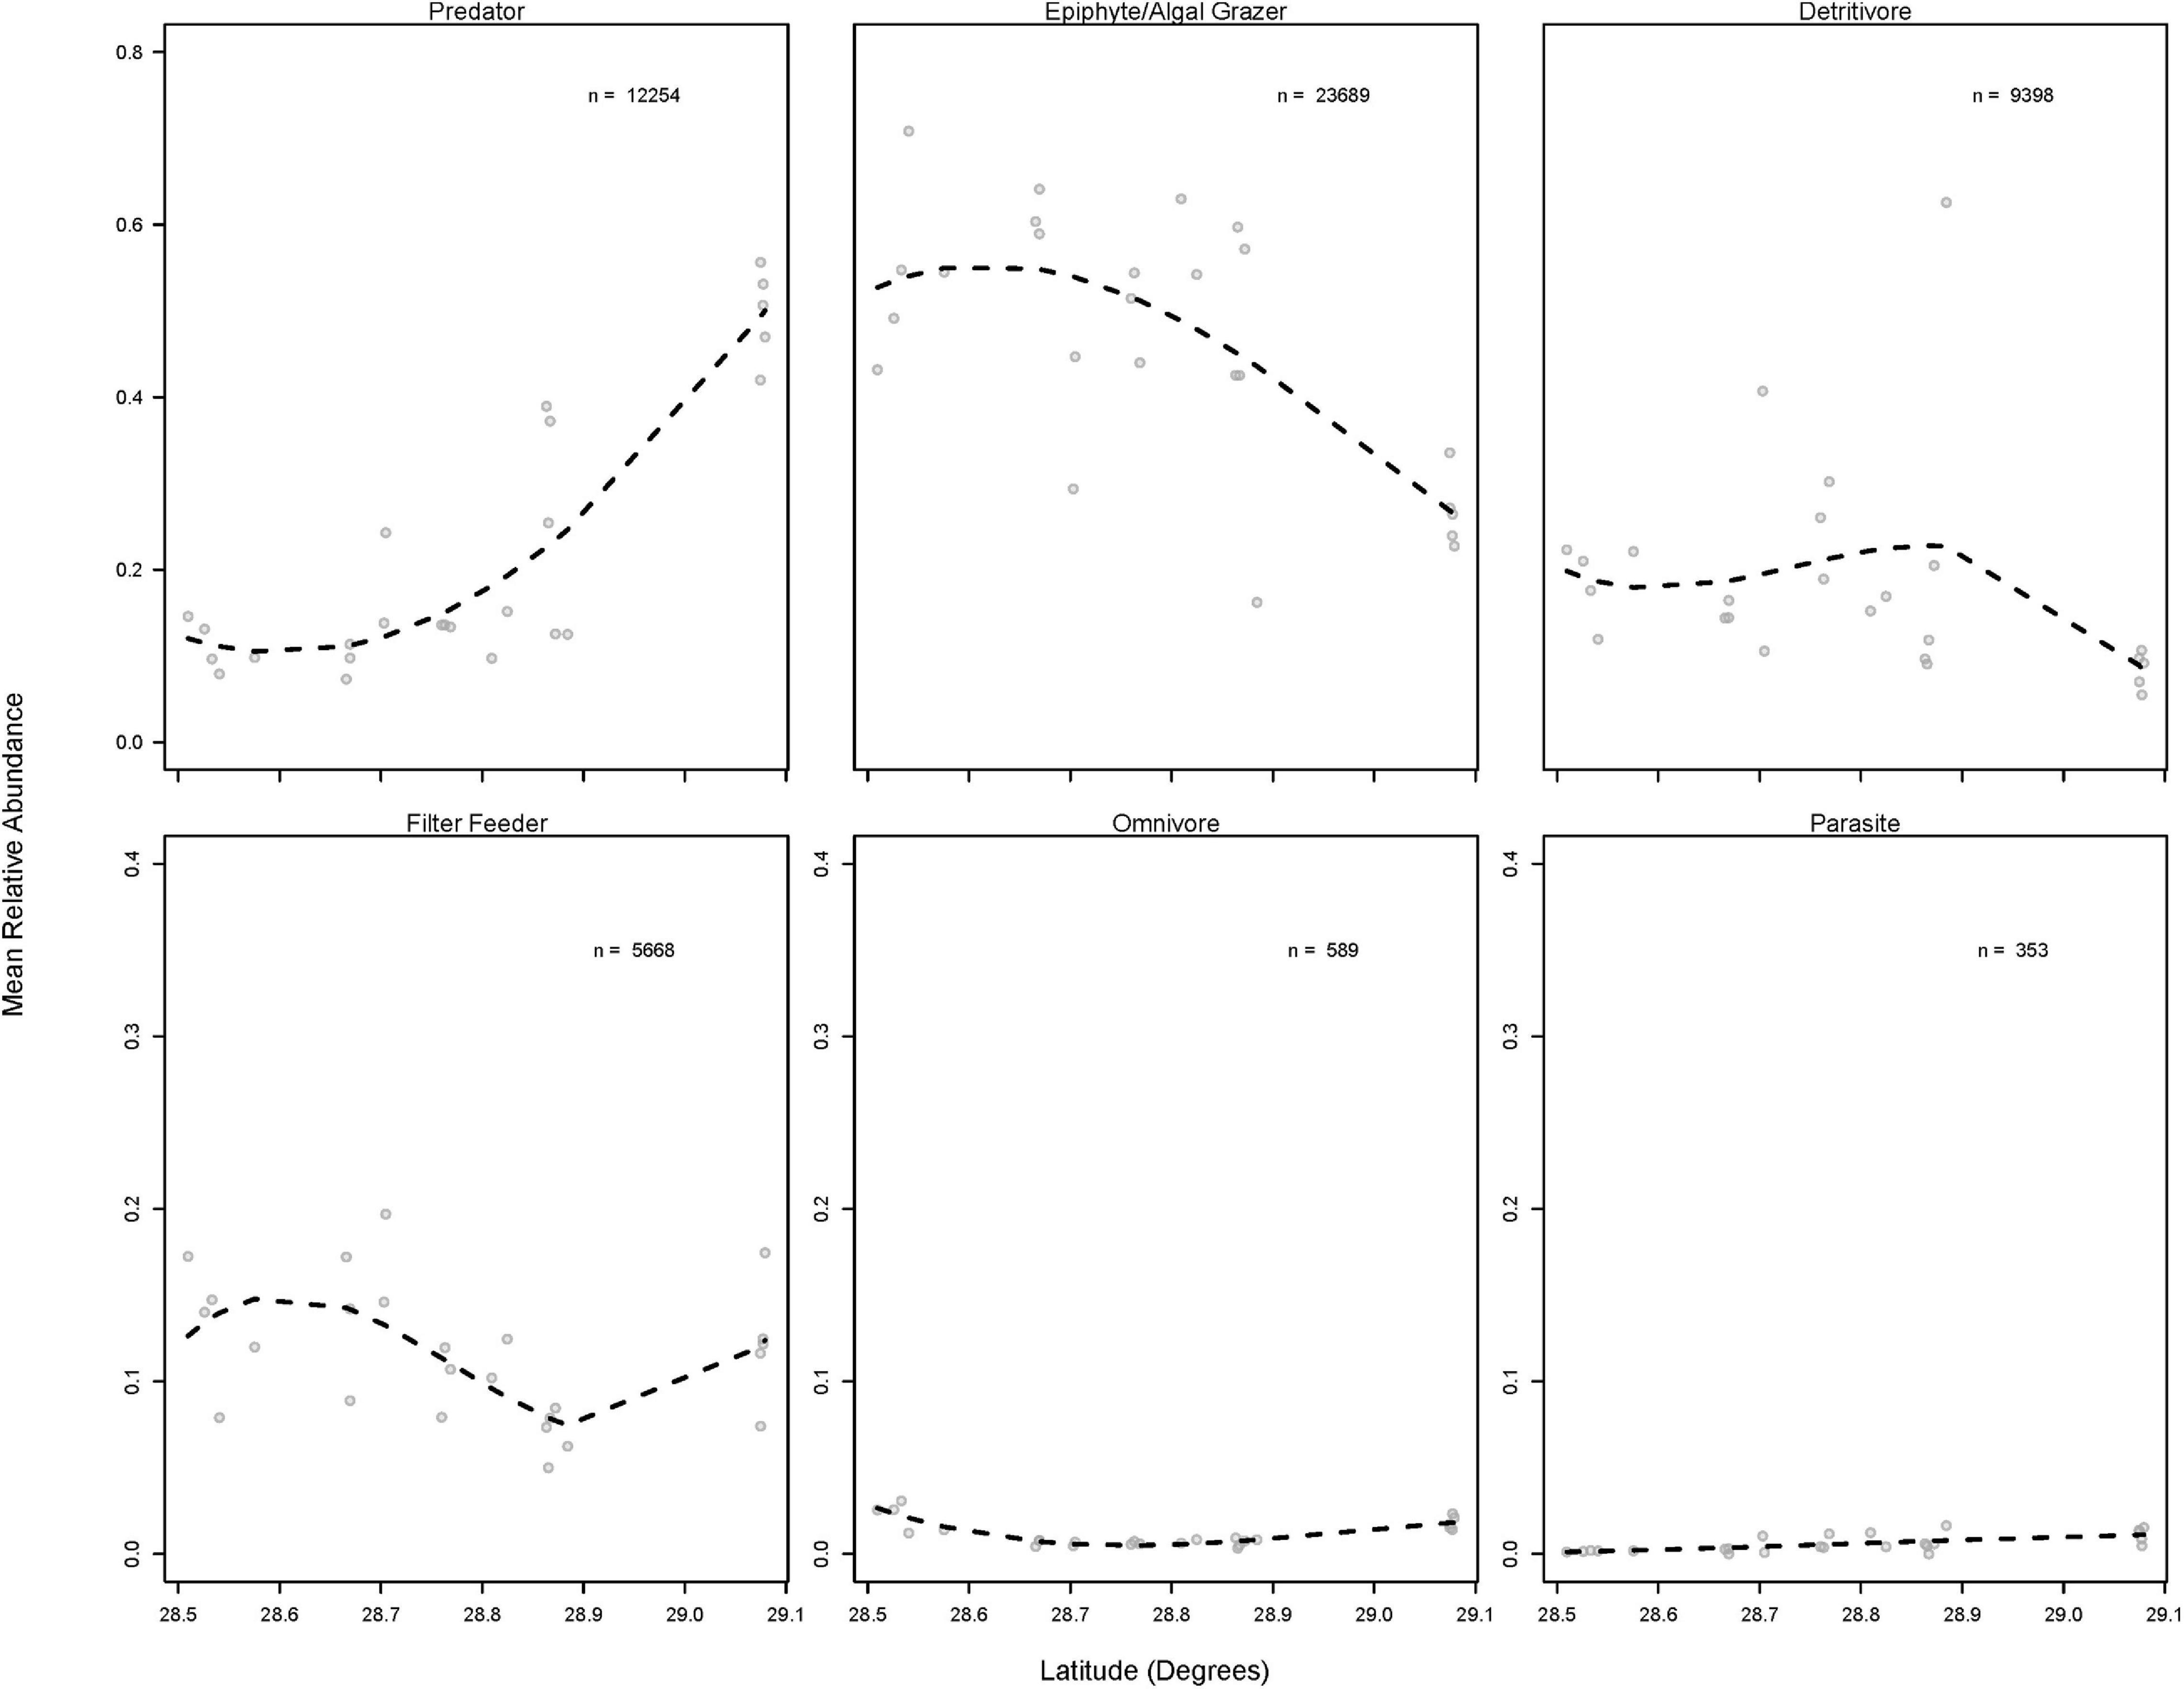
Figure 8. Relative abundance of members of six major trophic roles across latitude. Dashed lines represent the moving average of abundance across latitude. Note the different y-axis scales, “n” = the total number of each species found across all samples.
Discussion
In general, invertebrate communities in meadows along the Gulf coast of peninsular Florida dominated by Thalassia testudinum vary spatially, and we have presented multiple lines of evidence that suggest differences are influenced by environmental variation at both large and small spatial scales. The ecological relevance of the differences reported here is supported by the facts that a gradient in water quality has persisted for over a decade (Jacoby et al., 2015), the core of T. testudinum meadows has persisted for over two decades (Hale et al., 2004), and molluscan assemblages in the meadows have remained similar for centuries (Hyman et al., 2019).
Nutrient concentrations observed in an ecosystem and the structural complexity of the habitat, such as the patterns in TP concentrations and T. testudinum morphology previously documented in this system, are both known to influence seagrass-associated floral and faunal communities. Background nutrient status and the physical structure of seagrasses have been linked to differences in faunal abundance, diversity, and species composition in other systems (e.g., Heck and Orth, 1980a; Edgar and Shaw, 1995; Franco et al., 2006; Gil et al., 2006; Hosack et al., 2006; Jelbart et al., 2007; Peterson et al., 2007; Unsworth et al., 2007; Almeida et al., 2008; Burghart et al., 2013; Parsons et al., 2013; Ávila et al., 2015; McCloskey and Unsworth, 2015). Differences in faunal communities have been attributed to nutrient-mediated alterations in the refuge value of seagrasses (Bartholomew et al., 2000; Bartholomew, 2002; Gil et al., 2006; Peterson et al., 2007; Tuya et al., 2013), changes in the availability of food or space (Edgar, 1991; Klumpp et al., 1992; Edgar and Aoki, 1993; Duffy and Harvilicz, 2001), or alterations in predator-prey interactions in vegetation with differing complexity (Heck and Wetstone, 1977; Nelson, 1979a, b; Virnstein, 1979; Coen et al., 1981; Heck and Thoman, 1981; Orth et al., 1984; Camp et al., 2012; Wong, 2013). Therefore, it is reasonable to hypothesize that the spatial differences in seagrass-associated invertebrate communities revealed in this study are linked, directly and indirectly, to differences in the availability of phosphorus (Supplementary Figure 1), a major limiting nutrient in this system.
Redundancy analyses support the conclusion that both geographic and local environmental variation contribute to differences in species assemblages (Table 5). Variance partitioning showed that 20 and 15% of the variance in species assemblages can be explained by geographic location (p < 0.001) and local plant composition (p = 0.003), respectively (Table 4). Approximately 2% of the variance was shared between the two explanatory matrices, indicating that they were not strongly collinear.
Univariate Indices
Overall, univariate community indices did not show much spatial variation and did not correlate well with metrics of vegetative complexity. Two relationships with potential biological significance were identified: a weak positive relationship between total invertebrate abundance and latitude, which differed in strength across size classes, and a weak positive relationship between species richness, total abundance, and vegetative diversity. In this study region, more northern latitudes are characterized by higher concentrations of phosphorus, which may fuel higher levels of primary production by alleviating phosphorus limitation of the growth of phytoplankton and seagrasses (Frazer et al., 2002; Barry et al., 2017; Supplementary Figure 1). Therefore, it is possible that increasing inputs of phosphorus lead to increases in resources (food, space, or both) at the base of the food web (Edgar, 1991; Klumpp et al., 1992; Edgar and Aoki, 1993; Duffy and Harvilicz, 2001). This change may serve to increase abundances of organisms in a bottom-up fashion, an effect that has been observed in numerous studies of invertebrates in seagrasses (Bologna and Heck, 1999; Parker et al., 2001; Gil et al., 2006; Castejon-Silvo et al., 2012; Tuya et al., 2013).
The latitudinal increase in abundance was slightly more pronounced for the 2–4-mm size class and particularly strong for organisms in the 4–8-mm size class. Interestingly, most seagrass leaves in this study region range between 2 and 8 mm wide, and average leaf width increases with latitude (Barry et al., 2017; Supplementary Figure 2). Organisms whose body size closely matches the dimensions of the available refuge might be expected to respond to changes in refuge sizes to a greater degree than species who are either much smaller or much larger (Hixon and Beets, 1989; Bartholomew et al., 2000; Bartholomew, 2002). However, the coefficients of determination for most of the relationships between latitude and abundance were low and, therefore, nutrients and nutrient-driven changes in seagrass morphology are not the sole factors influencing total invertebrate abundance. But these results point to the possibility that variation in morphological characteristics within a species, such as leaf width, has been underappreciated in past studies.
The relationship between species richness and vegetative diversity was significant, but weak. A positive effect of vegetative diversity on species richness has been identified in other studies (e.g., Parker et al., 2001), and variance partitioning in this study identified local variation in the benthic plant community as an important contributor to differences in species composition. Therefore, there could be meaningful, albeit weak, effects of vegetation diversity on species richness in the seagrass meadows included in this effort. In this study, sampling focused on areas dominated by T. testudinum and, thus, did not capture the entire range of variation in benthic vegetation or types of substrate present in the broader region. For example, Hyman et al. (2019) documented notable differences in diversity and evenness between seagrass-dominated and open-sand substrates in the Steinhatchee estuary located north of the Waccasassa River.
Overall, we failed to uncover strong and consistent relationships between univariate community indices and environmental variables widely thought to be influential, such as aboveground biomass. Perhaps this is because of offsetting species-specific responses that are lost when data are summarized into univariate metrics. For example, a sizeable portion (∼42%) of species that differed significantly across aboveground biomass categories were less abundant when vegetative biomass was high. This likely offset the influence of the 58% of species that had a significantly higher abundance in higher aboveground biomass. This highlights the general lack of power of univariate indices to capture changes in invertebrate communities that occur along spatial gradients.
Community Composition
Multivariate analyses of invertebrate community composition revealed marked spatial differences across the study region. Significant differences between estuarine systems usually were driven by common and abundant taxa that occupied influential functional roles (i.e., grazers and predators), indicating that the changes in species identity likely represent ecologically relevant shifts between estuarine systems. For example, the higher abundances of many herbivorous crustacean species at Homosassa in comparison to Weeki Wachee, Chassahowitzka, and Waccasassa combined with the important role of crustacean grazers in controlling macroalgal and algal epiphyte growth may make that system more resilient in the face of increased nutrification (Orth and van Montfrans, 1984; Howard and Short, 1986; Neckles et al., 1993; Williams and Ruckelshaus, 1993; Duffy and Hay, 2000; Hughes et al., 2004) and could signal differences in secondary production (Brook, 1978; Klumpp et al., 1989, 1992; Valentine and Heck, 1993; Edgar and Shaw, 1995; Heck et al., 2000; Valentine et al., 2000). However, detritivores, deposit feeders, filter feeders, and predators also contributed to the differences between systems, indicating possible differences in several ecosystem functions, such as benthic-pelagic coupling, nutrient cycling, and detrital food web pathways. For example, some filter feeding species were more abundant at Waccasassa than at Crystal, potentially indicating that water column carbon sources (i.e., phytoplankton) are more important in the most nutrient-enriched system in this study region. Furthermore, the overall higher abundances of several predatory taxa at Waccasassa in comparison to other systems could indicate that invertebrate predators are relatively more important in structuring species assemblages at Waccasassa. It is important to note that we did not measure vertebrate (e.g., fish or bird) abundances in this effort, and there are likely important influences from these higher trophic levels whose abundances also may vary with seagrass structure or water quality conditions (Coen et al., 1981; Heck and Crowder, 1991; Rooker et al., 1998; Peterson et al., 2001). Overall, incorporating top-down controls and their interactions with bottom-up influences would be a valuable future contribution.
Aboveground biomass of benthic vegetation was a significant covariate in all multivariate analyses. Areas of higher seagrass biomass tended to have different community composition than those with lower seagrass biomass. In contrast, aboveground biomass did not exhibit a significant relationship with any of the univariate community indices. This result highlights the value of retaining taxonomic identities when studying community responses to variation in habitat or other environmental factors. For example, while many species were found to have higher abundances in areas of higher seagrass biomass, several other species such as the herbivorous hermit crab P. maclaughlinae tended to be more abundant in areas of lower seagrass biomass. Therefore, species-specific responses to local variations in seagrass biomass are evident and contribute to the overall variation in taxonomic composition.
While taxonomic composition across the study region was highly variable, the abundances of functional groups were less variable. Communities in the four southern (lower TP) systems, Weeki Wachee, Chassahowitzka, Homosassa, and Crystal, were dominated by epiphyte/macroalgal grazers. All four of these systems differed from Waccasassa, the northern-most system, which yielded elevated abundances of predators and depressed counts of epiphyte/macroalgal grazers. This result could indicate that grazing pressure on epiphytic algae and macroalgae, and perhaps secondary production of grazing invertebrates, is high in the four southern systems. Indeed, functional equivalence of seagrass invertebrate assemblages has been hypothesized to occur over large geographic distances (Barnes and Hendy, 2015). However, the identity of the herbivorous species differed significantly among the four southern-most systems, with crustacean and polyplacophoran grazers dominating at Homosassa, gastropod grazers dominating at Weeki Wachee and Chassahowitzka, and a mix of gastropod and crustacean grazers dominating at Crystal. Comparative studies have indicated that grazers of epiphytic algae are not necessarily functionally equivalent (Duffy, 1990; Jernakoff and Nielsen, 1997; Duffy and Hay, 2000; Duffy and Harvilicz, 2001; Duffy et al., 2001; Hays, 2005; Heck and Valentine, 2006). For example, species identity was an important factor determining per capita epiphyte grazing rates and secondary production in mesocosm experiments (Duffy et al., 2001). In these experiments, the herbivorous isopod Erichsonella attenuata had high per capita rates of grazing (Duffy et al., 2001) and, therefore, could potentially play an important role in regulating epiphytic algal accumulation despite its low overall abundance. A study in Florida Bay found that gastropod grazers were not able to control epiphytic algal growth after experimental nutrient addition (Peterson et al., 2007) while a study in Lady Bay, Australia found that crustacean mesograzers were able to control epiphytes under both mild and moderate nutrient addition scenarios (McSkimming et al., 2015). These results suggest that background nutrient concentrations and grazer identity are both important for predicting the relative importance of top-down and bottom-up effects on algal epiphytes. Therefore, even though the relative abundances of grazing taxa, as a group, do not differ significantly among the four southern-most estuarine systems, important differences in grazer identity that lead to different grazing rates and secondary production may exist. These possibilities should be explored further with field manipulations of grazer assemblages at different levels of background nutrient concentrations and mesocosm grazing experiments similar to Duffy et al. (2001) that test for functional redundancy among factorial combinations of species.
The increased dominance of predatory taxa at Waccasassa in comparison to other systems raises several interesting possibilities. Predatory gastropods, especially dove snails (Columbellidae), made up the bulk of the increase in relative predator abundance in this system. Predatory gastropods in the family Columbellidae feed on crustaceans, polychaetes, and other invertebrate prey (Taylor et al., 1980). Furthermore, carnivorous snails that scavenge or prey upon other mollusks (Marginellidae, Muricidae, and Coniidae) were relatively more common at Waccasassa. Therefore, it could be hypothesized that the decreased dominance of crustaceans, polychaetes, and herbivorous gastropods in that northern system is linked to higher predation by these carnivorous gastropods. Waccasassa generally has lower T. testudinum shoot density than more southern systems (Barry et al., 2017; Supplementary Figure 2) and epifaunal grazers may, thus, be more vulnerable to predation by visual predators such as fishes (e.g., Heck and Thoman, 1981; Stoner, 1982; Orth et al., 1984; Adams et al., 2004). Other differences in T. testudinum architecture among systems (e.g., average shoot height, leaf width; Supplementary Figure 2) also could contribute to differences in predation risk for epifaunal grazers (Bartholomew et al., 2000; Bartholomew, 2002). The hypothesis that important grazers experience different rates of predation across the study region should be explored with manipulative studies (e.g., tethering experiments across systems) and data should be collected on the abundance of other important predators of crustacean and gastropod grazers, such as the pinfish (Lagodon rhomboides).
nMDS, Beta-Diversity, and Distance
In general, species assemblages tend to vary predictably along spatial gradients when sampling designs capture ecologically relevant environmental variation. Subtle differences in ecologically influential variables may have pronounced effects on assemblage structure; often resulting in numbers of shared species among samples declining rapidly as geographic sampling location shifts and distances between samples increase (Legendre and Gallagher, 2001). The strongly arched presentation of groups on the nMDS plot support the hypothesis that invertebrate assemblage structure shifts distinctly and predictably along the latitudinal gradient sampled. The horseshoe-like shape in the nMDS (Figure 5A) is a common artifact of strong ecological gradients (e.g., Diaconis et al., 2008) when variation in assemblage structure can be largely attributed to one clear gradient and variation in said gradient exceeds what can be accounted for in a single ordination axis; causing the gradient to become distorted (arched) along both axes. Application of a color gradient visualizing latitudinal variation of samples further underscores the effect latitude in structuring the nMDS ordination results (Supplementary Figure 3).
Furthermore, a common phenomenon in spatially indexed data is that measurements from samples geographically closer together are often more similar that those of samples farther apart. Similar to directional gradational shifts mentioned above, this pattern is attributed to spatial variations in factors that produce differences in the variables of interest. It is no surprise, therefore, that beta-diversity analyses revealed species composition from samples closer in physical space and more similar with respect to the local benthic plant composition were more similar, and provide further support that our sampling design covered an ecologically meaningful spatial gradient. Larger-scale geographic variation was more strongly related to beta-diversity in both analyses, suggesting that the larger-scale spatial gradient in TP concentrations, chlorophyll-a concentrations, and T. testudinum leaf morphology (Barry et al., 2017; Supplementary Figures 1, 2) captures environmental variation that is more important in structuring faunal communities than the smaller-scale differences in benthic plant composition that did account for a smaller, though significant, proportion of the variance in beta-diversity.
The abundances of the twenty most abundant species recorded in this study showed evidence of spatial structuring, in that many species exhibited linear, unimodal, or, less commonly, bimodal patterns across latitude. Patterns of this kind are expected when environmental differences (such as resource availability or habitat structure) along spatial gradients influence species abundances (e.g., Tuomisto and Ruokolainen, 2006; Burghart et al., 2013), and they sum to result in change in species composition, or beta-diversity, along the spatial gradient. In addition, spatial structuring in the abundance of species with different trophic roles also was evident and points to a difference in trophic organization across the gradient. In combination, these results support the hypothesis that the taxonomic composition of invertebrate species inhabiting T. testudinum meadows along the central Gulf coast of Florida is significantly influenced by environmental changes along the gradient. However, we reiterate that these patterns are common in spatial data, and acknowledge that demonstrable correlation with certain variables does not mean that additional variables, e.g., predator density, storms, or other major disturbances, have no influence.
Conclusion
The data presented herein indicate that invertebrate communities of seagrass meadows dominated by a single species do vary spatially and in ways that are meaningful for ecosystem function. Known spatial gradients such as the concentration of phosphorus in coastal waters, are likely major drivers of invertebrate community composition. These influences could be both direct, with higher nutrient inputs increasing food or space resources for certain taxa (supported by variation in the abundances of functional trophic classes), or indirect, whereby nutrient inputs mediate changes in the physical environment (leaf morphology of the foundation species, T. testudinum) that alters the refuge value of seagrass habitat (supported by different body sizes responding differently to latitude). Previous work has demonstrated that total phosphorus (TP) concentrations in this system are linked with marked morphological differences in the leaves of T. testudinum, the dominant structure-forming plant (Barry et al., 2017) and there are several dimensions of seagrass structural complexity that vary in different ways across the gradient sampled (Supplementary Figure 2). Therefore, it is difficult to separate the direct and indirect effects of phosphorus concentrations in these systems using the data available, but future investigations could build upon our findings and investigate the mechanisms that drive the patterns we report.
These data provide background information about the taxa that inhabit seagrass meadows of this region. In addition, this effort highlighted specific taxa that differed between estuarine systems, and thus, may be targets of future research. Data like these can provide context for experimental manipulations that investigate ecosystem function (Dossena et al., 2012), be linked with environmental or paleoecological data to examine ecological change over time (Kidwell, 2001, 2007; Olszewski and Kidwell, 2007; Tyler and Kowalewski, 2017; Hyman et al., 2019), or identify species that may be useful indicators of environmental change (Schröder et al., 2015). More detailed information about the relative strength of bottom-up and top-down control of epiphytes, macroalgae, and the herbivorous species that keep them in check is important for the conservation, management and restoration of seagrass ecosystems (Hays, 2005; Heck and Valentine, 2006, 2007; Poore et al., 2009; Hammerschlag-Peyer et al., 2013; Duffy et al., 2015; Lefcheck and Duffy, 2015). For example, marine resource managers might be interested in linking spatial differences in nutrient inputs to secondary production of invertebrate species or the morphology and shoot density of seagrasses, given the relevance of these variables to many economically valuable fish and crustaceans (Edgar and Shaw, 1995; Rakocinski et al., 2008). Or, managers may be interested in the extent to which overfishing might impact seagrass resources indirectly via cascading effects on invertebrate communities (e.g., Heck and Valentine, 2007; Farina et al., 2014). The differences we report in the taxonomic and trophic composition of invertebrate communities across these estuarine systems may signify important variations in ecosystem processes, such as control of algal epiphytes and secondary production, which deserve further investigation.
Data Availability Statement
Raw data used in this study will be made available upon receipt of a reasonable request to the corresponding author.
Author Contributions
SB, CJ, MK, and TF conceived of the study. SB and AH performed field and lab work. SB, MK, and CJ performed analyses and produced figures. SB, CJ, MK, AH, LR, and TF interpreted data. SB drafted the manuscript. AH, LR, MK, CJ, and TF revised the manuscript. TF contributed funding. All authors contributed to the article and approved the submitted version.
Funding
We thank the Cynthia A. Melnick Endowment for a grant that covered much of the cost of field work for this project and the UF Graduate School and Cornett Fellowships for generous financial support. This publication was supported by the National Sea Grant College Program of the U.S. Department of Commerce’s National Oceanic and Atmospheric Administration (NOAA), Grant No. NA 18OAR4170085. The views expressed are those of the authors and do not necessarily reflect the view of these organizations.
Conflict of Interest
The authors declare that the research was conducted in the absence of any commercial or financial relationships that could be construed as a potential conflict of interest.
Acknowledgments
We thank A. Johnson and S. Notestein for assistance in constructing the Venturi suction dredge. We thank S. Notestein, M. Edwards, P. Gardner, and E. Oehmig for field assistance. We thank K. Goforth, M. Quintiliani, and L. Spiers for assistance with lab work. We thank G. Paulay, K. Cummings, and J. Slapcinsky in the Florida Museum of Natural History for assistance with specimen identification.
Supplementary Material
The Supplementary Material for this article can be found online at: https://www.frontiersin.org/articles/10.3389/fmars.2021.596966/full#supplementary-material
References
Adams, A. J., Locascio, J. V., and Robbins, B. D. (2004). Microhabitat use by a post-settlement stage estuarine fish: evidence from relative abundance and predation among habitats. J. Exp. Mar. Biol. Ecol. 299, 17–33. doi: 10.1016/j.jembe.2003.08.013
Adams, S. (1976). Feeding ecology of eelgrass fish communities. Trans. Am. Fish. Soc. 105, 514–519. doi: 10.1577/1548-8659(1976)105<514:feoefc>2.0.co;2
Almeida, C., Coelho, R., Silva, M., Bentes, L., Monteiro, P., Ribeiro, J., et al. (2008). Use of different intertidal habitats by faunal communities in a temperate coastal lagoon. Estuar. Coast. Shelf Sci. 80, 357–364. doi: 10.1016/j.ecss.2008.08.017
Amundrud, S. L., Srivastava, D. S., and O’Connor, M. I. (2015). Indirect effects of predators control herbivore richness and abundance in a benthic eelgrass (Zostera marina) mesograzer community. J. Anim. Ecol. 84, 1092–1102. doi: 10.1111/1365-2656.12350
Anderson, M., Gorley, R. N., and Clarke, K. (2008). PERMANOVA+ for Primer: Guide to Software and Statistical Methods. Plymouth: PRIMER-E Ltd.
Armitage, A. R., and Fourqurean, J. W. (2009). Stable isotopes reveal complex changes in trophic relationships following nutrient addition in a coastal marine ecosystem. Estuaries Coasts 32, 1152–1164. doi: 10.1007/s12237-009-9219-z
Ávila, E., Yanez, B., and Elena Vazquez-Maldonado, L. (2015). Influence of habitat structure and environmental regime on spatial distribution patterns of macroinvertebrate assemblages associated with seagrass beds in a southern Gulf of Mexico coastal lagoon. Mar. Biol. Res. 11, 755–764. doi: 10.1080/17451000.2015.1007875
Barnes, R. S. K., and Hendy, I. W. (2015). Functional uniformity underlies the common spatial structure of macrofaunal assemblages in intertidal seagrass beds. Biol. J. Linn. Soc. Lond. 115, 114–126. doi: 10.1111/bij.12483
Barry, S. C., Jacoby, C. A., and Frazer, T. K. (2017). Environmental influences on growth and morphology of Thalassia testudinum. Mar. Ecol. Prog. Ser. 570, 57–70. doi: 10.3354/meps12112
Barry, S. C., Jacoby, C. A., and Frazer, T. K. (2018). Resilience to shading influenced by differential allocation of biomass in Thalassia testudinum. Limnol. Oceanogr. 63, 1817–1831. doi: 10.1002/lno.10810
Bartholomew, A. (2002). Faunal colonization of artificial seagrass plots: the importance of surface area versus space size relative to body size. Estuaries 25, 1045–1052. doi: 10.1007/BF02691351
Bartholomew, A., Diaz, R., and Cicchetti, G. (2000). New dimensionless indices of structural habitat complexity: predicted and actual effects on a predator’s foraging success. Mar. Ecol. Prog. Ser. 206, 45–58. doi: 10.3354/meps206045
Beck, M., Heck, K., Able, K., Childers, D., Eggleston, D., Gillanders, B., et al. (2001). The identification, conservation, and management of estuarine and marine nurseries for fish and invertebrates. Bioscience 51, 633–641. doi: 10.1641/0006-3568(2001)051[0633:ticamo]2.0.co;2
Bell, J., and Westoby, M. (1986a). Importance of local changes in leaf height and density to fish and decapods associated with seagrasses. J. Exp. Mar. Biol. Ecol. 104, 249–274. doi: 10.1016/0022-0981(86)90109-7
Bell, J., and Westoby, M. (1986b). Variation in seagrass height and density over a wide spatial scale: effects on common fish and decapods. J. Exp. Mar. Biol. Ecol. 104, 275–295. doi: 10.1016/0022-0981(86)90110-3
Bologna, P., and Heck, K. (1999). Macrofaunal associations with seagrass epiphytes: relative importance of trophic and structural characteristics. J. Exp. Mar. Biol. Ecol. 242, 21–39. doi: 10.1016/S0022-0981(99)00092-1
Boström, C., Jackson, E. L., and Simenstad, C. A. (2006). Seagrass landscapes and their effects on associated fauna: a review. Estuar. Coast. Shelf Sci. 68, 383–403. doi: 10.1016/j.ecss.2006.01.026
Brook, I. (1978). Comparative macrofaunal abundance in turtlegrass (Thalassia testudinum) communities in South Florida characterized by high blade density. Bull. Mar. Sci. 28, 212–217.
Burghart, S. E., Jones, D. L., and Peebles, E. B. (2013). Variation in estuarine consumer communities along an assembled eutrophication gradient: implications for trophic instability. Estuaries Coasts 36, 951–965. doi: 10.1007/s12237-013-9611-6
Camp, E. V., Gwinn, D. C., Pine, W. E., and Frazer, T. K. (2012). Changes in submersed aquatic vegetation affect predation risk of a common prey fish Lucania parva (Cyprinodontiformes: Fundulidae) in a spring-fed coastal river. Fish. Manag. Ecol. 19, 245–251. doi: 10.1111/j.1365-2400.2011.00827.x
Cardoso, P. G., Raffaelli, D., and Pardal, M. A. (2007). Seagrass beds and intertidal invertebrates: an experimental test of the role of habitat structure. Hydrobiologia 575, 221–230. doi: 10.1007/s10750-006-0375-x
Castejon-Silvo, I., Dominguez, M., Terrados, J., Tomas, F., and Morales-Nin, B. (2012). Invertebrate response to nutrient-driven epiphytic load increase in Posidonia oceanica meadows. Estuar. Coast. Shelf Sci. 112, 225–235. doi: 10.1016/j.ecss.2012.07.028
Coen, L., Heck, K., and Abele, L. (1981). Experiments on competition and predation among shrimps of seagrass meadows. Ecology 62, 1484–1493. doi: 10.2307/1941505
Daudi, L. N., Lugomela, C., Uku, J. N., and De Troch, M. (2012). Effect of nutrient enrichment on seagrass associated meiofauna in Tanzania. Mar. Environ. Res. 82, 49–58. doi: 10.1016/j.marenvres.2012.09.005
Dexter, E., Rollwagen-Bollens, G., and Bollens, S. M. (2018). The trouble with stress: a flexible method for the evaluation of nonmetric multidimensional scaling. Limnol. Oceanogr. Methods 16, 434–443. doi: 10.1002/lom3.10257
Diaconis, P., Goel, S., and Holmes, S. (2008). Horseshoes in multidimensional scaling and local kernel methods. Ann. Appl. Stat. 2, 777–807. doi: 10.1214/08-AOAS165
Dossena, M., Yvon-Durocher, G., Grey, J., Montoya, J. M., Perkins, D. M., Trimmer, M., et al. (2012). Warming alters community size structure and ecosystem functioning. Proc. R. Soc. B. 279, 3011–3019. doi: 10.1098/rspb.2012.0394
Duffy, J. E. (1990). Amphipods on seaweeds: Partners or pests? Oecologia 83, 267–276. doi: 10.1007/BF00317764
Duffy, J. E., and Harvilicz, A. (2001). Species-specific impacts of grazing, amphipods in an eelgrass-bed community. Mar. Ecol. Prog. Ser. 223, 201–211. doi: 10.3354/meps223201
Duffy, J. E., and Hay, M. (2000). Strong impacts of grazing amphipods on the organization of a benthic community. Ecol. Monogr. 70, 237–263. doi: 10.1890/0012-9615(2000)070[0237:siogao]2.0.co;2
Duffy, J. E., MacDonald, K., Rhode, J., and Parker, J. (2001). Grazer diversity, functional redundancy, and productivity in seagrass beds: an experimental test. Ecology 82, 2417–2434. doi: 10.2307/2679926
Duffy, J. E., Reynolds, P. L., Bostroem, C., Coyer, J. A., Cusson, M., Donadi, S., et al. (2015). Biodiversity mediates top-down control in eelgrass ecosystems: a global comparative-experimental approach. Ecol. Lett. 18, 696–705. doi: 10.1111/ele.12448
Edgar, G. (1991). Artificial algae as habitats for mobile epifauna: factors affecting colonization in a Japanese Sargassum bed. Hydrobiologia 226, 111–118. doi: 10.1007/BF00006812
Edgar, G., and Aoki, M. (1993). Resource limitation and fish predation: their importance to mobile epifauna associated with Japanese Sargassum. Oecologia 95, 122–133. doi: 10.1007/BF00649515
Edgar, G. J., and Robertson, A. I. (1992). The influence of seagrass structure on the distribution and abundance of mobile epifauna: pattern and process in a Western Australian Amphibolis bed. J. Exp. Mar. Biol. Ecol. 160, 13–31. doi: 10.1016/0022-0981(92)90107-L
Edgar, G. J., and Shaw, C. (1995). The production and trophic ecology of shallow-water fish assemblages in southern Australia. III. General relationships between sediments, seagrasses, invertebrates and fishes. J. Exp. Mar. Biol. Ecol. 194, 107–131. doi: 10.1016/0022-0981(95)00085-2
Farina, S., Arthur, R., Pages, J. F., Prado, P., Romero, J., Verges, A., et al. (2014). Differences in predator composition alter the direction of structure-mediated predation risk in macrophyte communities. Oikos 123, 1311–1322. doi: 10.1111/oik.01382
Franco, A., Franzoi, P., Malavasi, S., Riccato, F., and Torricelli, P. (2006). Fish assemblages in different shallow water habitats of the Venice Lagoon. Hydrobiologia 555, 159–174. doi: 10.1007/s10750-005-1113-5
Frazer, T. K., Hoyer, M. V., Notestein, S. K., Canfield, D. E., Vose, F. E., Leavens, W. R., et al. (1998). Nitrogen, Phosphorus and Chlorophyll Relations in Selected Rivers and Nearshore Coastal Waters Along the Big Bend Region of Florida. Annual Report. Brooksville, FL: Southwest Florida Water Management District.
Frazer, T. K., Phlips, E. J., Notestein, S. K., and Jett, C. (2002). Nutrient Limiting Status of Phytoplankton in Five Gulf Coast Rivers and their Associated Estuaries. Final Report. Brooksville, FL: Southwest Florida Water Management District.
Fry, B., and Parker, P. (1979). Animal diet in Texas seagrass meadows: δ13C evidence for the importance of benthic plants. Estuar. Coast. Mar. Sci. 8, 499–509. doi: 10.1016/0302-3524(79)90031-8
Gil, M., Armitage, A. R., and Fourqurean, J. W. (2006). Nutrient impacts on epifaunal density and species composition in a subtropical seagrass bed. Hydrobiologia 569, 437–447. doi: 10.1007/s10750-006-0147-7
Gribben, P. E., and Wright, J. T. (2014). Habitat-former effects on prey behaviour increase predation and non-predation mortality. J. Anim. Ecol. 83, 388–396. doi: 10.1111/1365-2656.12139
Hale, J. A., Frazer, T. K., Tomasko, D. A., and Hall, M. O. (2004). Changes in the distribution of seagrass species along Florida’s central Gulf Coast: iverson and Bittaker revisited. Estuaries 27, 36–43. doi: 10.1007/BF02803558
Hammerschlag-Peyer, C. M., Allgeier, J. E., and Layman, C. A. (2013). Predator effects on faunal community composition in shallow seagrass beds of the Bahamas. J. Exp. Mar. Biol. Ecol. 446, 282–290. doi: 10.1016/j.jembe.2013.06.002
Hays, C. (2005). Effect of nutrient availability, grazer assemblage and seagrass source population on the interaction between Thalassia testudinum (turtle grass) and its algal epiphytes. J. Exp. Mar. Biol. Ecol. 314, 53–68. doi: 10.1016/j.jembe.2004.08.017
Heck, K. L. Jr., Able, K., Roman, C., and Fahay, M. (1995). Composition, abundance, biomass, and production of macrofauna in a New England estuary: comparisons among eelgrass meadows and other nursery habitats. Estuaries 18, 379–389. doi: 10.2307/1352320
Heck, K. L. Jr., and Crowder, L. B. (1991). “Habitat structure and predator—prey interactions in vegetated aquatic systems,” in Habitat Structure, Population and Community Biology Series, eds S. S. Bell, E. D. McCoy, and H. R. Mushinsky (Dordrecht: Springer), 281–299. doi: 10.1007/978-94-011-3076-9_14
Heck, K. L. Jr., Hays, G., and Orth, R. J. (2003). Critical evaluation of the nursery role hypothesis for seagrass meadows. Mar. Ecol. Prog. Ser. 253, 123–136. doi: 10.3354/meps253123
Heck, K. L. Jr., and Orth, R. J. (1980a). “Seagrass habitats the roles of habitat complexity competition and predation in structuring associated fish and motile macroinvertebrate assemblages,” in Estuarine Perspectives, ed. V. S. Kennedy (New York, NY: Academic Press), 449–464. doi: 10.1016/b978-0-12-404060-1.50043-5
Heck, K. L. Jr., and Orth, R. J. (1980b). Structural components of eelgrass (Zostera marina) meadows in the lower Chesapeake Bay: Decapod Crustacea. Estuaries 3, 289–295. doi: 10.2307/1352084
Heck, K. L. Jr., Pennock, J., Valentine, J., Coen, L., and Sklenar, S. S. (2000). Effects of nutrient enrichment and large predator removal on seagrass nursery habitats: an experimental assessment. Limnol. Oceanogr. 45, 1041–1057. doi: 10.4319/lo.2000.45.5.1041
Heck, K. L. Jr., and Thoman, T. (1981). Experiments on predator-prey interactions in vegetated aquatic habitats. J. Exp. Mar. Biol. Ecol. 53, 125–134. doi: 10.1016/0022-0981(81)90014-9
Heck, K. L. Jr., and Thoman, T. (1984). The nursery role of seagrass meadows in the upper and lower reaches of the Chesapeake Bay. Estuaries 7, 70–92. doi: 10.2307/1351958
Heck, K. L. and Valentine, J. F. (2006). Plant-herbivore interactions in seagrass meadows. J. Exp. Mar. Biol. Ecol. 330, 420–436. doi: 10.1016/j.jembe.2005.12.044
Heck, K. L. and Valentine, J. F. (2007). The primacy of top-down effects in shallow benthic ecosystems. Estuaries Coasts 30, 371–381. doi: 10.1007/BF02819384
Heck, K. L. Jr., and Wetstone, G. (1977). Habitat complexity and invertebrate species richness and abundance in tropical seagrass meadows. J. Biogeogr. 4, 135–142. doi: 10.2307/3038158
Herkül, K., Kotta, J., and Partnojä, M. (2011). Effect of physical disturbance on the soft sediment benthic macrophyte and invertebrate community in the northern Baltic Sea. Boreal Environ. Res. 16, (Suppl. A), 209–219.
Hixon, M. A., and Beets, J. P. (1989). Shelter characteristics and Caribbean fish assemblages: experiments with artificial reefs. Bull. Mar. Sci. 44, 660–680.
Hooks, T., Heck, K. L. Jr., and Livingston, R. (1976). Inshore marine invertebrate community structure and habitat associations in northeastern Gulf of Mexico. Bull. Mar. Sci. 26, 99–109.
Hosack, G. R., Dumbauld, B. R., Ruesink, J. L., and Armstrong, D. A. (2006). Habitat associations of estuarine species: comparisons of intertidal mudflat, seagrass (Zostera marina), and oyster (Crassostrea gigas) habitats. Estuaries Coasts 29, 1150–1160. doi: 10.1007/BF02781816
Hovel, K., Fonseca, M., Myer, D., Kenworthy, W. J., and Whitfield, P. (2002). Effects of seagrass landscape structure, structural complexity and hydrodynamic regime on macrofaunal densities in North Carolina seagrass beds. Mar. Ecol. Prog. Ser. 243, 11–24. doi: 10.3354/meps243011
Howard, R. K., and Short, F. T. (1986). Seagrass growth and survivorship under the influence of epiphyte grazers. Aquat. Bot. 24, 287–302. doi: 10.1016/0304-3770(86)90063-X
Huang, A. C., Essak, M., and O’Connor, M. I. (2015). Top–down control by great blue herons Ardea herodias regulates seagrass-associated epifauna. Oikos 124, 1492–1501. doi: 10.1111/oik.01988
Hughes, A., Bando, K., Rodriguez, L., and Williams, S. (2004). Relative effects of grazers and nutrients on seagrasses: a meta-analysis approach. Mar. Ecol. Prog. Ser. 282, 87–99. doi: 10.3354/meps282087
Hyman, A. C., Frazer, T. K., Jacoby, C. A., Frost, J. R., and Kowalewski, M. (2019). Long-term persistence of structured habitats: seagrass meadows as enduring hotspots of biodiversity and faunal stability. Proc. R. Soc. B 286:20191861. doi: 10.1098/rspb.2019.1861
Jacoby, C. A., and Frazer, T. K. (2013). Linking Seagrass Performance Measures to Water Quality. Final Report. Gainesville, FL: Florida Fish and Wildlife Conservation Commission.
Jacoby, C. A., Frazer, T. K., Edwards, M. A., and Frost, J. R. (2015). Water Quality Characteristics of the Nearshore Gulf Coast Waters Adjacent to Citrus, Hernando and Levy Counties: Project COAST 1997-2014. Final Report. Brooksville, FL: Southwest Florida Water Management District.
Jacoby, C. A., Frazer, T. K., Saindon, D. D., and Notestein, S. K. (2012). Water Quality Characteristics of the Nearshore Gulf Coast Waters Adjacent to Citrus, Hernando and Levy Counties: Project COAST 1997-2010. Annual Report. Brooksville, FL: Southwest Florida Water Management District.
Jelbart, J. E., Ross, P. M., and Connolly, R. M. (2007). Patterns of small fish distributions in seagrass beds in a temperate Australian estuary. J. Mar. Biolog. Assoc. U.K. 87, 1297–1307. doi: 10.1017/S0025315407053283
Jernakoff, P., and Nielsen, J. (1997). The relative importance of amphipod and gastropod grazers in Posidonia sinuosa meadows. Aquat. Bot. 56, 183–202. doi: 10.1016/S0304-3770(96)01112-6
Jernakoff, P., and Nielsen, J. (1998). Plant–animal associations in two species of seagrasses in Western Australia. Aquat. Bot. 60, 359–376. doi: 10.1016/S0304-3770(97)00100-9
Kidwell, S. M. (2001). Preservation of species abundance in marine death assemblages. Science 294, 1091–1094. doi: 10.1126/science.1064539
Kidwell, S. M. (2007). Discordance between living and death assemblages as evidence for anthropogenic ecological change. Proc. Natl. Acad. Sci. U.S.A. 104, 17701–17706. doi: 10.1073/pnas.0707194104
Klumpp, D., Salita-Espinosa, J. S., and Fortes, M. D. (1992). The role of epiphytic periphyton and macroinvertebrate grazers in the trophic flux of a tropical seagrass community. Aquat. Bot. 43, 327–349. doi: 10.1016/0304-3770(92)90046-L
Klumpp, D. W., Howard, R. K., and Pollard, D. A. (1989). “Trophodynamics and nutritional ecology of seagrass communities,” in Biology of Seagrasses, eds A. W. D. Larkum, A. J. McComb, and S. A. Shepherd (Amsterdam: Elsevier), 394–457.
Klumpp, D. W., and Kwak, S. N. (2005). Composition and abundance of benthic macrofauna of a tropical seagrass bed in North Queensland, Australia. Pac. Sci. 59, 541–560. doi: 10.1353/psc.2005.0046
Lefcheck, J. S., and Duffy, J. E. (2015). Multitrophic functional diversity predicts ecosystem functioning in experimental assemblages of estuarine consumers. Ecology 96, 2973–2983. doi: 10.1890/14-1977.1
Legendre, P., Borcard, D., and Peres-Neto, P. (2005). Analyzing beta diversity: partitioning the spatial variation of community composition data. Ecol. Monogr. 75, 435–450. doi: 10.1890/05-0549
Legendre, P., and Gallagher, E. (2001). Ecologically meaningful transformations for ordination of species data. Oecologia 129, 271–280. doi: 10.1007/s004420100716
Lichstein, J. W. (2007). Multiple regression on distance matrices: a multivariate spatial analysis tool. Plant Ecol. 188, 117–131. doi: 10.1007/s11258-006-9126-3
Mattila, J., Heck, K. L. Jr., Millstein, E., Miller, E., Gustafsson, C., Williams, S., et al. (2008). Increased habitat structure does not always provide increased refuge from predation. Mar. Ecol. Prog. Ser. 361, 15–20. doi: 10.3354/meps07392
Mattson, R. A., Frazer, T. K., Hale, J., Blitch, S., and Ahijevych, L. (2007). “Florida Big Bend,” in Seagrass status and trends in the northern Gulf of Mexico, 1940–2002. United States Geological Survey Scientific Investigations Report 2006-5287 and U.S. Environmental Protection Agency 855-R-04-003, eds L. Handley, D. Altsman, and R. DeMay (Washington, DC: U.S. Environmental Protection Agency), 171–188.
McCloskey, R. M., and Unsworth, R. K. F. (2015). Decreasing seagrass density negatively influences associated fauna. PeerJ 3:e1053. doi: 10.7717/peerj.1053
McSkimming, C., Tanner, J. E., Russell, B. D., and Connell, S. D. (2015). Compensation of nutrient pollution by herbivores in seagrass meadows. J. Exp. Mar. Biol. Ecol. 471, 112–118. doi: 10.1016/j.jembe.2015.05.018
Moore, E. C., and Hovel, K. A. (2010). Relative influence of habitat complexity and proximity to patch edges on seagrass epifaunal communities. Oikos 119, 1299–1311. doi: 10.1111/j.1600-0706.2009.17909.x
Neckles, H. A., Wetzel, R. L., and Orth, R. J. (1993). Relative effects of nutrient enrichment and grazing on epiphyte-macrophyte (Zostera marina L.) dynamics. Oecologia 93, 285–295. doi: 10.1007/BF00317683
Nelson, W. G. (1979a). Experimental studies of selective predation on amphipods: consequences for amphipod distribution and abundance. J. Exp. Mar. Biol. Ecol. 38, 225–245. doi: 10.1016/0022-0981(79)90069-8
Nelson, W. G. (1979b). An analysis of structural pattern in an eelgrass (Zostera marina L.) amphipod community. J. Exp. Mar. Biol. Ecol. 39, 231–264. doi: 10.1016/0022-0981(79)90129-1
Nelson, W. G. (1980). Comparative study of amphipods in seagrasses from Florida to Nova Scotia. Bull. Mar. Sci. 30, 80–89.
Oksanen, J., Blanchet, F. G., Friendly, M., Kindt, R., Legendre, P., McGlinn, D., et al. (2019). vegan: Community Ecology package. R package version 2.5-6. Available online at: https://CRAN.R-project.org/package=vegan (accessed June 14, 2020).
Olszewski, T. D., and Kidwell, S. M. (2007). The preservational fidelity of evenness in molluscan death assemblages. Paleobiology 33, 1. doi: 10.1666/05059.1
Orth, R. J., Heck, K. L. Jr., and van Montfrans, J. (1984). Faunal communities in seagrass beds: a review of the influence of plant structure and prey characteristics on predator prey relationships. Estuaries 7, 339–350. doi: 10.2307/1351618
Orth, R. J., and van Montfrans, J. (1984). Epiphyte seagrass relationships with an emphasis on the role of micrograzing: a review. Aquat. Bot. 18, 43–69. doi: 10.1016/0304-3770(84)90080-9
Orth, R. J., and van Montfrans, J. (1987). Utilization of a seagrass meadow and tidal marsh creek by blue crabs Callinectes sapidus I. Seasonal and annual variations in abundance with emphasis on post settlement juveniles. Mar. Ecol. Prog. Ser. 41, 283–294.
Parker, J., Duffy, J., and Orth, R. J. (2001). Plant species diversity and composition: experimental effects on marine epifaunal assemblages. Mar. Ecol. Prog. Ser. 224, 55–67. doi: 10.3354/meps224055
Parsons, D. M., Morrison, M. A., Thrush, S. F., Middleton, C., Smith, M., Spong, K. T., et al. (2013). The influence of habitat structure on juvenile fish in a New Zealand estuary. Mar. Ecol. 34, 492–500. doi: 10.1111/maec.12050
Patrick, C. J., Yeager, L., Armitage, A. R., Carvallo, F., Congdon, V. M., Dunton, K. H., et al. (2020). A system level analysis of coastal ecosystem responses to hurricane impacts. Estuaries Coasts 43, 943–959. doi: 10.1007/s12237-019-00690-3
Peterson, B. J., Frankovich, T. A., and Zieman, J. C. (2007). Response of seagrass epiphyte loading to field manipulations of fertilization, gastropod grazing and leaf turnover rates. J. Exp. Mar. Biol. Ecol. 349, 61–72. doi: 10.1016/j.jembe.2007.04.012
Peterson, B. J., Thompson, K. R., Cowan, J. H. Jr., and Heck, K. L. Jr. (2001). Comparison of predation pressure in temperate and subtropical seagrass habitats based on chronographic tethering. Mar. Ecol. Prog. Ser. 224, 77–85. doi: 10.3354/meps224077
Poore, A. G. B., Campbell, A. H., and Steinberg, P. D. (2009). Natural densities of mesograzers fail to limit growth of macroalgae or their epiphytes in a temperate algal bed. J. Ecol. 97, 164–175. doi: 10.1111/j.1365-2745.2008.01457.x
R Development Core Team (2020). R: A Language and Environment for Statistical Computing. Vienna: R Foundation for Statistical Computing.
Rakocinski, C. F., Moncreiff, C. A., Peterson, M. S., VanderKooy, K. E., and Randall, T. A. (2008). Habitat condition and associated macrofauna reflect differences between protected and exposed seagrass landscapes. Gulf Carib. Res. 20, 11–19. doi: 10.18785/gcr.2001.03
Raz-Guzman, A., and Grizzle, R. E. (2001). “Techniques for quantitative sampling of infauna and small epifauna in seagrass,” in Global Seagrass Research Methods, eds F. T. Short and R. G. Coles (Amsterdam: Elsevier Science), 237–253. doi: 10.1016/B978-044450891-1/50013-X
Rooker, J., Holt, G., and Holt, S. (1998). Vulnerability of newly settled red drum (Sciaenops ocellatus) to predatory fish: Is early-life survival enhanced by seagrass meadows? Mar. Biol. 131, 145–151. doi: 10.1007/s002270050305
Schneider, F., and Mann, K. (1991a). Species-specific relationships of invertebrates to vegetation in a seagrass bed I. Correlational studies. J. Exp. Mar. Biol. Ecol. 145, 101–117. doi: 10.1016/0022-0981(91)90008-K
Schneider, F. I., and Mann, K. H. (1991b). Species specific relationships of invertebrates to vegetation in a seagrass bed. II. Experiments on the importance of macrophyte shape, epiphyte cover and predation. J. Exp. Mar. Biol. Ecol. 145, 119–139. doi: 10.1016/0022-0981(91)90009-L
Schröder, M., Sondermann, M., Sures, B., and Hering, D. (2015). Effects of salinity gradients on benthic invertebrate and diatom communities in a German lowland river. Ecol. Indic. 57, 236–248. doi: 10.1016/j.ecolind.2015.04.038
Seaman, W. (1985). Florida Aquatic Habitat and Fishery Resources. Kissimmee, FL: Florida Chapter of the American Fisheries Society.
Stallings, C. D., Mickle, A., Nelson, J. A., McManus, M. G., and Koenig, C. C. (2015). Faunal communities and habitat characteristics of the Big Bend seagrass meadows, 2009–2010. Ecology 96, 304–304. doi: 10.1890/14-1345.1
Stoner, A. (1980). Abundance, reproductive seasonality and habitat preferences of amphipod crustaceans in seagrass meadows of Apalachee Bay, Florida. Contrib. Mar. Sci. 23, 63–77.
Stoner, A. (1983). Distribution of fishes in seagrass meadows - role of macrophyte biomass and species composition. Fish. Bull. NOAA 81, 837–846.
Stoner, A. W. (1982). The influence of benthic macrophytes on the foraging behavior of pinfish, Lagodon rhomboides (Linnaeus). J. Exp. Mar. Biol. Ecol. 58, 271–284. doi: 10.1016/0022-0981(82)90134-4
Taylor, J. D., Morris, N. J., and Taylor, C. N. (1980). Food specialization and the evolution of predatory prosobranch gastropods. Palaentology 23, 375–409.
Terlizzi, A., and Russo, G. F. (1997). The molluscan taxocoene of differently-exposed Cymodocea nodosa beds: year-long structural patterns and sampling methods. Boll. Malacol. 33, 77–82.
Thormar, J., Hasler-Sheetal, H., Baden, S., Boström, C., Clausen, K. K., Krause-Jensen, D., et al. (2016). Eelgrass (Zostera marina) food web structure in different environmental settings. PLoS One 11:e0146479. doi: 10.1371/journal.pone.0146479
Tuomisto, H., and Ruokolainen, K. (2006). Analyzing or explaining beta diversity? Understanding the targets of different methods of analysis. Ecology 87, 2697–2708.
Tuya, F., Viera-Rodriguez, M. A., Guedes, R., Espino, F., Haroun, R., and Terrados, J. (2013). Seagrass responses to nutrient enrichment depend on clonal integration, but not flow-on effects on associated biota. Mar. Ecol. Prog. Ser. 490, 23–35. doi: 10.3354/meps10448
Tyler, C., and Kowalewski, M. (2017). Surrogate taxa and fossils as reliable proxies of spatial biodiversity patterns in marine benthic communities. Proc. R. Soc. B 284:20162839. doi: 10.1098/rspb.2016.2839
Unsworth, R. K. F., De Grave, S., Jompa, J., Smith, D. J., and Bell, J. J. (2007). Faunal relationships with seagrass habitat structure: a case study using shrimp from the Indo-Pacific. Mar. Freshw. Res. 58, 1008–1018. doi: 10.1071/MF07058
Valentine, J. F., and Heck, K. L. Jr. (1993). Mussels in seagrass meadows: their influence on macroinvertebrate abundance and secondary production in the Northern Gulf of Mexico. Mar. Ecol. Prog. Ser. 96, 63–74.
Valentine, J. F., Heck, K. L. Jr., Blackmon, D. Jr., Goecker, M. E., Christian, J., Kroutil, R. M., et al. (2008). Exploited species impacts on trophic linkages along reef-seagrass interfaces in the Florida Keys. Ecol. Appl. 18, 1501–1515. doi: 10.1890/07-1720.1
Valentine, J. F., Heck, K. L. Jr., Kirsch, J. R., and Kirsch, K. D. (2000). The importance of the grazing pathway in seagrass food webs: a changing paradigm. Biol. Mar. Mediterr. 7, 290–293.
van Montfrans, J., Wetzel, R., and Orth, R. J. (1984). Epiphyte-grazer relationships in seagrass meadows: consequences for seagrass growth and production. Estuaries 7, 289–309. doi: 10.2307/1351615
Virnstein, R. (1979). Predation on estuarine infauna: response patterns of component species. Estuaries 2, 69–86. doi: 10.2307/1351631
Virnstein, R., Nelson, W., Lewis, F., and Howard, R. (1984). Latitudinal patterns in seagrass epifauna: Do patterns exist, and can they be explained? Estuaries 7, 310–330. doi: 10.2307/1351616
Waite, T. A., and Campbell, L. G. (2006). Controlling the false discovery rate and increasing statistical power in ecological studies. Écoscience 13, 439–442.
Whittaker, R. H. (1960). Vegetation of the Siskiyou Mountains, Oregon and California. Ecol. Monogr. 30, 279–338.
Williams, S., and Ruckelshaus, M. (1993). Effects of nitrogen availability and herbivory on eelgrass (Zostera marina) and epiphytes. Ecology 74, 904–918. doi: 10.2307/1940815
Wong, M. C. (2013). Green crab (Carcinus maenas (Linnaeus, 1758)) foraging on soft-shell clams (Mya arenaria Linnaeus, 1758) across seagrass complexity: behavioural mechanisms and a new habitat complexity index. J. Exp. Mar. Biol. Ecol. 446, 139–150. doi: 10.1016/j.jembe.2013.05.010
Worthington, D., Ferrell, D., Mcneill, S., and Bell, J. (1992). Effects of the shoot density of seagrass on fish and decapods: are correlation evident over larger spatial scales. Mar. Biol. 112, 139–146. doi: 10.1007/BF00349737
Wyda, J. C., Deegan, L. A., Hughes, J. E., and Weaver, M. J. (2002). The response of fishes to submerged aquatic vegetation complexity in two ecoregions of the mid-Atlantic bight: buzzards Bay and Chesapeake Bay. Estuaries 25, 86–100. doi: 10.1007/BF02696052
Keywords: beta diversity (β), Gulf of Mexico (GOM), Florida (United States), trophic composition, seagrass, Thalassia testudinum, habitat value
Citation: Barry SC, Hyman AC, Jacoby CA, Reynolds LK, Kowalewski M and Frazer TK (2021) Variation in Seagrass-Associated Macroinvertebrate Communities Along the Gulf Coast of Peninsular Florida: An Exploration of Patterns and Ecological Consequences. Front. Mar. Sci. 8:596966. doi: 10.3389/fmars.2021.596966
Received: 20 August 2020; Accepted: 12 February 2021;
Published: 04 March 2021.
Edited by:
Christos Dimitrios Arvanitidis, Hellenic Centre for Marine Research (HCMR), GreeceReviewed by:
Rafael Sarda, Consejo Superior de Investigaciones Científicas (CSIC), SpainW. Judson Kenworthy, Independent Researcher, Beaufort, United States
Copyright © 2021 Barry, Hyman, Jacoby, Reynolds, Kowalewski and Frazer. This is an open-access article distributed under the terms of the Creative Commons Attribution License (CC BY). The use, distribution or reproduction in other forums is permitted, provided the original author(s) and the copyright owner(s) are credited and that the original publication in this journal is cited, in accordance with accepted academic practice. No use, distribution or reproduction is permitted which does not comply with these terms.
*Correspondence: Savanna C. Barry, c2F2YW5uYS5iYXJyeUB1ZmwuZWR1