 Christine Rees1
 Julie Janssens1*
 Kendall Sherrin1
 Peter Hughes2Stephen Tibben1Merinda McMahon1
 Jack McDonald1
 Alicia Camac1Cassie Schwanger1
 Andreas Marouchos1
- 1Commonwealth Scientific and Industrial Research Organisation (CSIRO), National Collections and Marine Infrastructure (NCMI), Hobart, TAS, Australia
- 2Commonwealth Scientific and Industrial Research Organisation (CSIRO), National Collections and Marine Infrastructure (NCMI), Perth, WA, Australia
Ammonium is a fundamental nutrient for phytoplankton growth in seawater and is a key component of the microbial loop. Ammonium measured in parallel with other nutrients is crucial in understanding the small temporal scale changes in oceanographic ecology. Despite the importance of measuring ammonium at sea, owing to its lability, there is no consensus on the best method. The lack of availability of certified reference materials for ammonium in seawater also makes it difficult to assess the accuracy and reproducibility of ammonium measurements. In this study we present a modified segmented flow analysis method using ortho-phthaldialdehyde (OPA) with fluorescence detection to measure ammonium at sea together with four other macro-nutrients (nitrate, nitrite, silicate and phosphate) in near real time. An in-house ammonium quality control (QC) material was produced to improve the accuracy and repeatability of the measurement at sea. The QC was prepared following two different methods and stored in two types of containers. The suitability of the in-house QC’s as a reference material were assessed onboard the RV Investigator in 2018 during two oceanographic voyages, including one on the repeat SR03 CLIVAR transect. This paper describes the production and assessment of the in-house QC for ammonium in seawater, providing groundwork for creating a short-term stable ammonium reference material for sea going voyages. The uncertainty of this method of ammonium measurement was found to be 0.10 μmol/L at ammonium concentration of 1.0 μmol/L. Results show that preparation of the QC inside a laminar flow cabinet and directly into 10 mL polypropylene sample tubes just prior to the commencement of the voyage improved its stability.
Introduction
The interface between the lower atmosphere and the sea surface is an active layer for exchange of nitrogen compounds (e.g., Liss and Galloway, 1993). The gas ammonia (NH3) and its protonated form ammonium (NH4+) are key components of the nitrogen cycle (e.g., Johnson et al., 2008). In the ocean, primary productivity and the associated fixation of carbon through photosynthesis is often regulated by the nitrogen budget (Voss et al., 2013). Ammonium, similarly to other dissolved inorganic macro-nutrients [nitrate (NO3–), phosphate (PO43–), silicate (SiO44–), and nitrite (NO2–)], is also a vital source of food and energy for microorganisms in the marine environment. Sources of ammonium in the marine environment include: (1) breakdown of organic nitrogen (mineralisation), by both free bacteria and those within zooplankton and other heterotrophs, (2) denitrification, i.e., reduction of nitrate via bacterial activity, primarily within sub-oxic environments (3) as an intermediate product of atmospheric N2 fixation, and (4) anthropogenic sources (Wheeler and Kokkinakis, 1990). Ammonium is also produced as a product of cell senescence and is often present in very high concentrations after eutrophication events have occurred (Zehr and Ward, 2002). The importance of ammonium is signified both by its preferential assimilation over nitrate by phytoplankton (Wheeler and Kokkinakis, 1990), and the toxicity it can pose to fish and other marine life at high concentrations (Eddy, 2005).
In coastal waters and particularly in the nutrient rich Southern Ocean, accurate measurements of ammonium are key to understanding small temporal scale oceanographic ecology. Ammonium concentrations in the Southern Ocean are generally low (<0.5 μmol/L; e.g., Goeyens et al., 1995), although high concentrations have been found in the marginal ice zone and near land masses (up to 4 μmol/L; e.g., Koike et al., 1986; Owens et al., 1991). Even though availability of ammonium is thought to be key to the regulation of phytoplankton productivity near the ice edge (Goeyens et al., 1995), and has received an increased attention in regards to the nitrogen cycle (Wan et al., 2018; Zakem et al., 2018), ammonium studies in the Southern Ocean remain sparse (e.g., Bianchi et al., 1997).
Collecting near real time concentration of ammonium while at sea is invaluable, but the accurate and traceable determination of ammonium has historically been difficult; particularly in comparison with the methodology and processes used for other macro-nutrients. This is attributed to three factors: (1) the high chance of sample contamination during sampling and analysis (e.g., Liddicoat et al., 1975; Aminot et al., 1997; Li et al., 2005), (2) lack of consensus for a standard method for ammonium analysis (Becker et al., 2020), and (3) the lack of a certified reference material (CRM) ensuring accuracy of analysis. There are readily available CRM’s (e.g., KANSO, SCOR-JAMSTEC, NMIJ) for the other macro-nutrients. To date, ammonium concentration in certified reference material for nutrients in seawater (RMNS) is not stable enough to be used as a reference material (A. Murao pers.comm).
Certified reference materials are essential to ensure consistency and traceability of measurement. Allowing comparability of measurements between laboratories and therefore detect changes in nutrient levels due to human impact or shifts in physical processes (Ayoama and Hydes, 2010) is paramount. Consideration of these factors as well as instrument reliability are fundamental to the successful measurement of ammonium.
In addition to these three factors, ammonium analysis is not presently required for long-term ocean studies by the Global Ocean Ship-Based Hydrographic Investigations Program (GO-SHIP1). GO-SHIP considers ammonium measurement as an ancillary measurement (level 3 data: address a scientific question unique to the region of investigation). Consequently, there is no consistent practice in measuring ammonium (see Ma et al., 2014; Šraj et al., 2014 and Zhu et al., 2019 for comprehensive reviews on ammonium measurements) alongside the other formally recommended macro-nutrients. Prior to 2015 the analysis of ammonium was not a routine measurement conducted by the CSIRO hydrochemistry team at sea. When ammonium data was made available, it was often reported on preserved or frozen samples or without detailed methodology. While GO-SHIP does not require ammonium bottle data, it was evident that investigators saw increased value in ammonium results alongside other nutrients (level 1 data: data of highest priority) and continued to request ammonium analysis. As a result, efforts were made to ensure robust, near real time ammonium data was reported in parallel with other macro-nutrients. The method used to measure ammonium in seawater in this study is based on the fluorometric analysis technique described in 1997 (Kérouel and Aminot, 1997) and one of the recommended methods in Becker et al. (2020). The fluorometric method is more sensitive in seawater compared to the other commonly used indophenol blue (IPB) method (Šraj et al., 2014; Becker et al., 2020; and reference therein; Zhu et al., 2018, 2019 and reference therein). Interference from primary amines is negligible (Genfa and Dasgupta, 1989; Kérouel and Aminot, 1997; Johnson et al., 2007; Horstkotte et al., 2011; Ma et al., 2014). Finally, the fluorometric method is advantageous as it does not use the odorous compound phenol, hydroxide precipitation does not occur and separation of chemical waste products from acidic waste is not required (Brzezinski, 1987; Zhu et al., 2019). This is important when working at sea in a small, confined space.
The method was applied in parallel with the measurement of silicate, phosphate, nitrite, and nitrate + nitrite (NOx) as described in Rees et al. (2019). An internal quality control material was utilized to quantify the reproducibility and measurement uncertainty associated with the reported ammonium data during two oceanographic voyages.
Materials and Procedures
Ammonium Analysis
Firstly, modifications to Kérouel and Aminot (1997) are described, then the implementation of additional precautions are detailed. These precautions aim to reduce contamination during sample collection and analysis. Ammonium in seawater is reacted with ortho-phtaldialdehyde (OPA) in the presence of borate buffer (pH of 9.0–9.5) and sulfite at 75°C, to produce an intensely fluorescent product proportional to the ammonium concentration. Two major modifications from Kérouel and Aminot’s (1997) method are; (1) incorporation of the borate buffer into the working reagent, and (2) simplification of the auto-analyzer’s chemistry manifold to enable the measurement of ammonium in parallel with other macro-nutrients (NO3– + NO2– = NOx, phosphate PO43–, silicate SiO44–, and nitrite NO2–).
Instrument
Ammonium concentrations were measured with a JASCO FP-2020 Fluorometer attached to a segmented flow analyzer (SFA); Seal Analytical Inc., AA3 HR Autoanalyzer. The emission is measured at 460 nm following excitation at 370 nm. The instrument was configured with the Seal Analytical Autoanalyzer Applications method for Ammonia (Method-No. G-327-05 Rev. 4), which is based on the method developed by Kérouel and Aminot (1997). Three modifications were made to the chemistry manifold to improve the peak shape and simplify procedures, (1) The debubbler on the sample line at the start of the pump was removed, (2) an additional 10 turn coil of the 2.0 mm internal diameter tubing was added before entering the fluorometer (Figure 1) the diluent line consisting of 0.2 g of sodium chloride per liter was also removed. The SFA was set up with a sample to wash ratio of 2:1; 80 s sample and 40 s wash. The air supply for segmentation and headspace above the OPA reagent container was scrubbed of ammonium by drawing the air through a 100 mL Schott® gas washing bottle containing approximately 30 mL of 10% (v/v) sulfuric acid (H2SO4 98%, Merck) with no frit on the bubbler stem. A custom sample rack was designed (and built) to fit onto the auto-sampler to hold 42 of the 50 mL sample tubes.
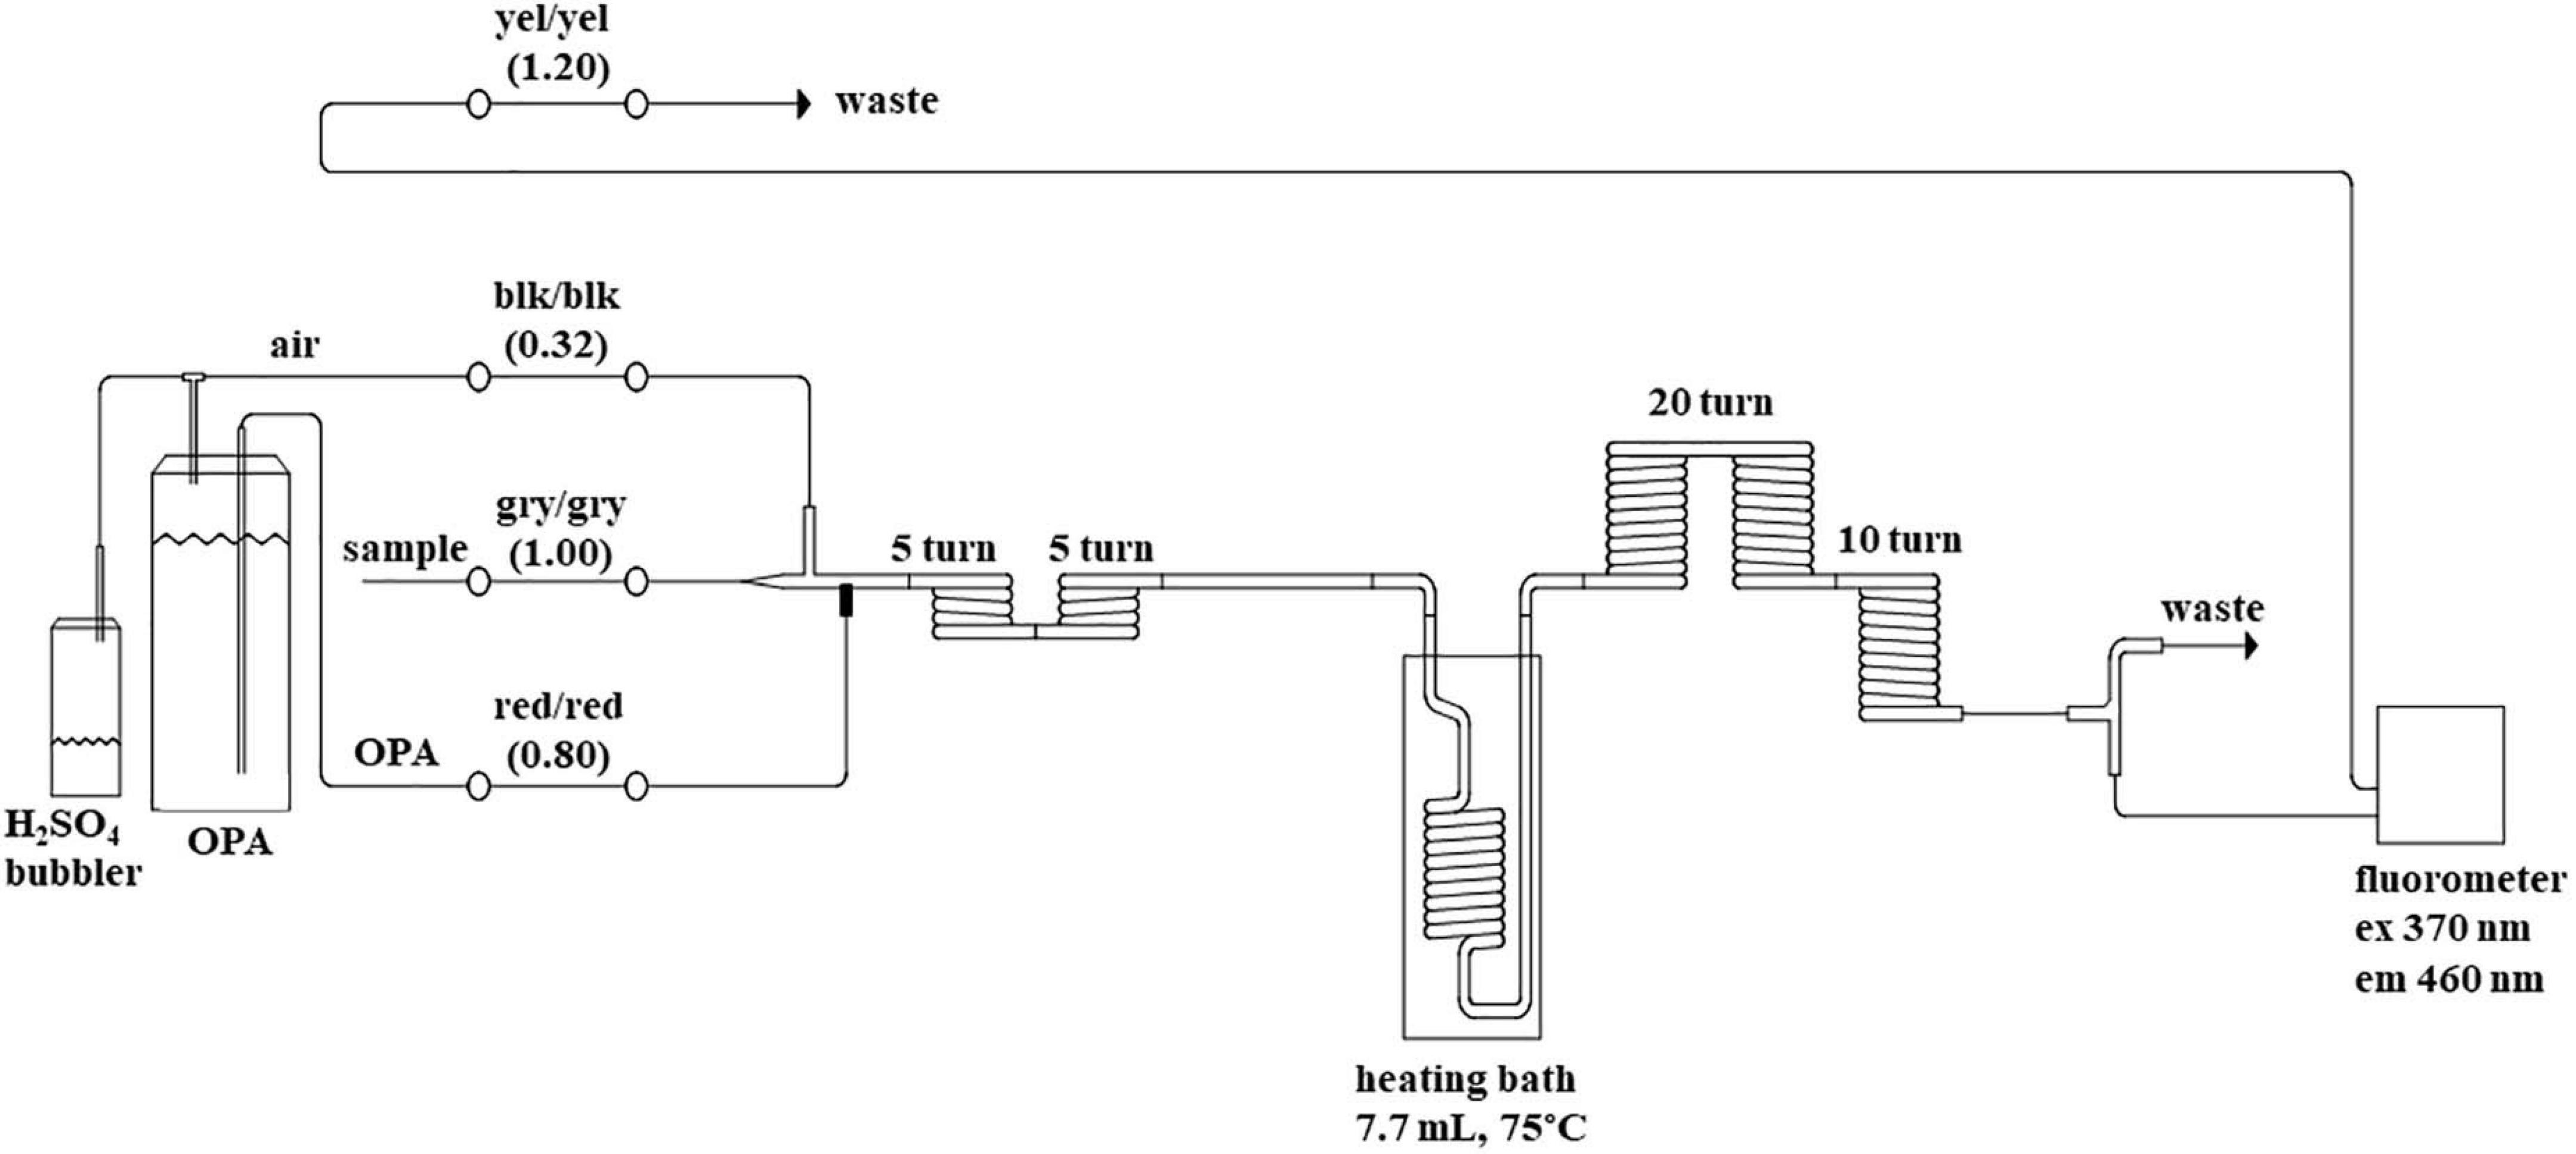
Figure 1. Flow diagram of the segmented flow system for ammonium. Color codes for peristaltic pump tube flow rate (blk = black, yel = yellow, gry = gray) are in brackets (mL per minute). Details of reagent preparation are within the text. Ex = excitation wavelength and Em = emission wavelength. The internal diameter of the glass component is 2.0 mm.
Reagents
All chemicals used were analytical reagent grade. The working reagent was made by dissolving 45 g of disodium tetraborate decahydrate (Merck) in 1425 mL ultra-pure deionized water. Next, 30 mL of stock OPA (Alfa Aeser A13299.18, 98%, 4.0 g OPA dissolved in 100 mL ethanol) was mixed in, followed by 3.0 mL stock sodium sulfite (0.4 g sodium sulfite dissolved in 50 mL ultra-pure deionized water). The final volume was diluted to 1.5 L with ultra-pure deionized water and 1.5 mL of Brij® 35 solution (30% w/w, Merck) was added while stirring on a magnetic stir plate. The reagent was stabilized in the dark for at least 8 h to reduce background fluorescence before use (Goyal et al., 1988; Becker et al., 2020) and stored in a glass amber bottle away from reagents containing ammonium. To reduce the possibility of contamination, ammonium reagents (OPA) were prepared separately from the reagents required for phosphate, silicate and nitrate analyzes and had dedicated conical flasks with caps to reduce ambient air exposure. Reagent and standard preparations were also separated by 12 h shifts aboard the ship to mitigate the stock and calibration standards exposure to reagents containing ammonium.
Low Nutrient Seawater
Low nutrient seawater (LNSW) for the preparation of the calibrants and QC’s was used to minimize any “matrix effects” (e.g., Goyal et al., 1988; Becker et al., 2020). The LNSW was collected in June 2016 from oligotrophic surface ocean water East of Brisbane, Australia during a voyage along the P15S hydrographic line. The water was collected via the ship’s underway seawater supply line and stored in two 1000 L transparent HDPE tanks on the upper deck of the ship. The LNSW was exposed to sunlight and aged for one year to ensure all nutrients were removed (Gordon et al., 1993; Becker et al., 2020). For laboratory use, 20 L HDPE carboys (cleaned with 1.2% (v/v) Hypochlorite solution (Hypochlorite 12%, Orica), rinsed 3 times with ultra-pure deionized water and rinsed with the filtered seawater) were filled from the 1000 L tank via an in line particulate filter (5 μm carbon block cartridge). After the LNSW has been filtered, an AA3 run was carried out to ensure target nutrient levels are very low. In addition to this, the concentration of LNSW is measured during each analytical run to ensure no contamination in the matrix of the calibrants.
Calibration Standards
All glassware used to prepare primary, intermediate, and calibrations standards were class A and acid cleaned (10% v/v HCl solution 32%, Merck). An ammonium primary standard (10 mmol/L) was prepared prior to the voyage from high-purity ammonium sulfate [(NH4)2SO4, Merck], in ultra-pure deionized water. The primary standard was decanted into an acid cleaned 1 L high density polyethylene (HDPE) square screw cap bottle with Parafilm® around the cap and stored in the dark at 4°C.
An intermediate standard (0.8 mmol/L) was made every 72 h and stored in the dark at 4°C at 100% relative humidity. Six working calibration standards were made from the intermediate standard diluted in LNSW at 21°C. The calibration range was set to 0.00–2.00 μmol/L NH4+ evenly distributed standards using quadratic regression curve fit. The zero-calibration standard consisted of LNSW made to volume in a glass volumetric flask. The highest concentration standard was also used for the primer and drift solutions.
Preparation of Internal Quality Controls for Ammonium
Two approaches were used to develop an internal QC for ammonium in seawater to better understand reproducibility and potential ammonium contamination across a voyage. Method 1 was prepared prior to, and used during, a voyage commencing on the 11th of January 2018 (voyage reference in2018_v01, hereafter referred as voyage 1). Method 2 was used for a voyage commencing on the 11th of September 2018 (voyage reference in2018_v04, hereafter referred as voyage 2). Figure 2 summarizes the preparation process and storage of the internal QC’s.
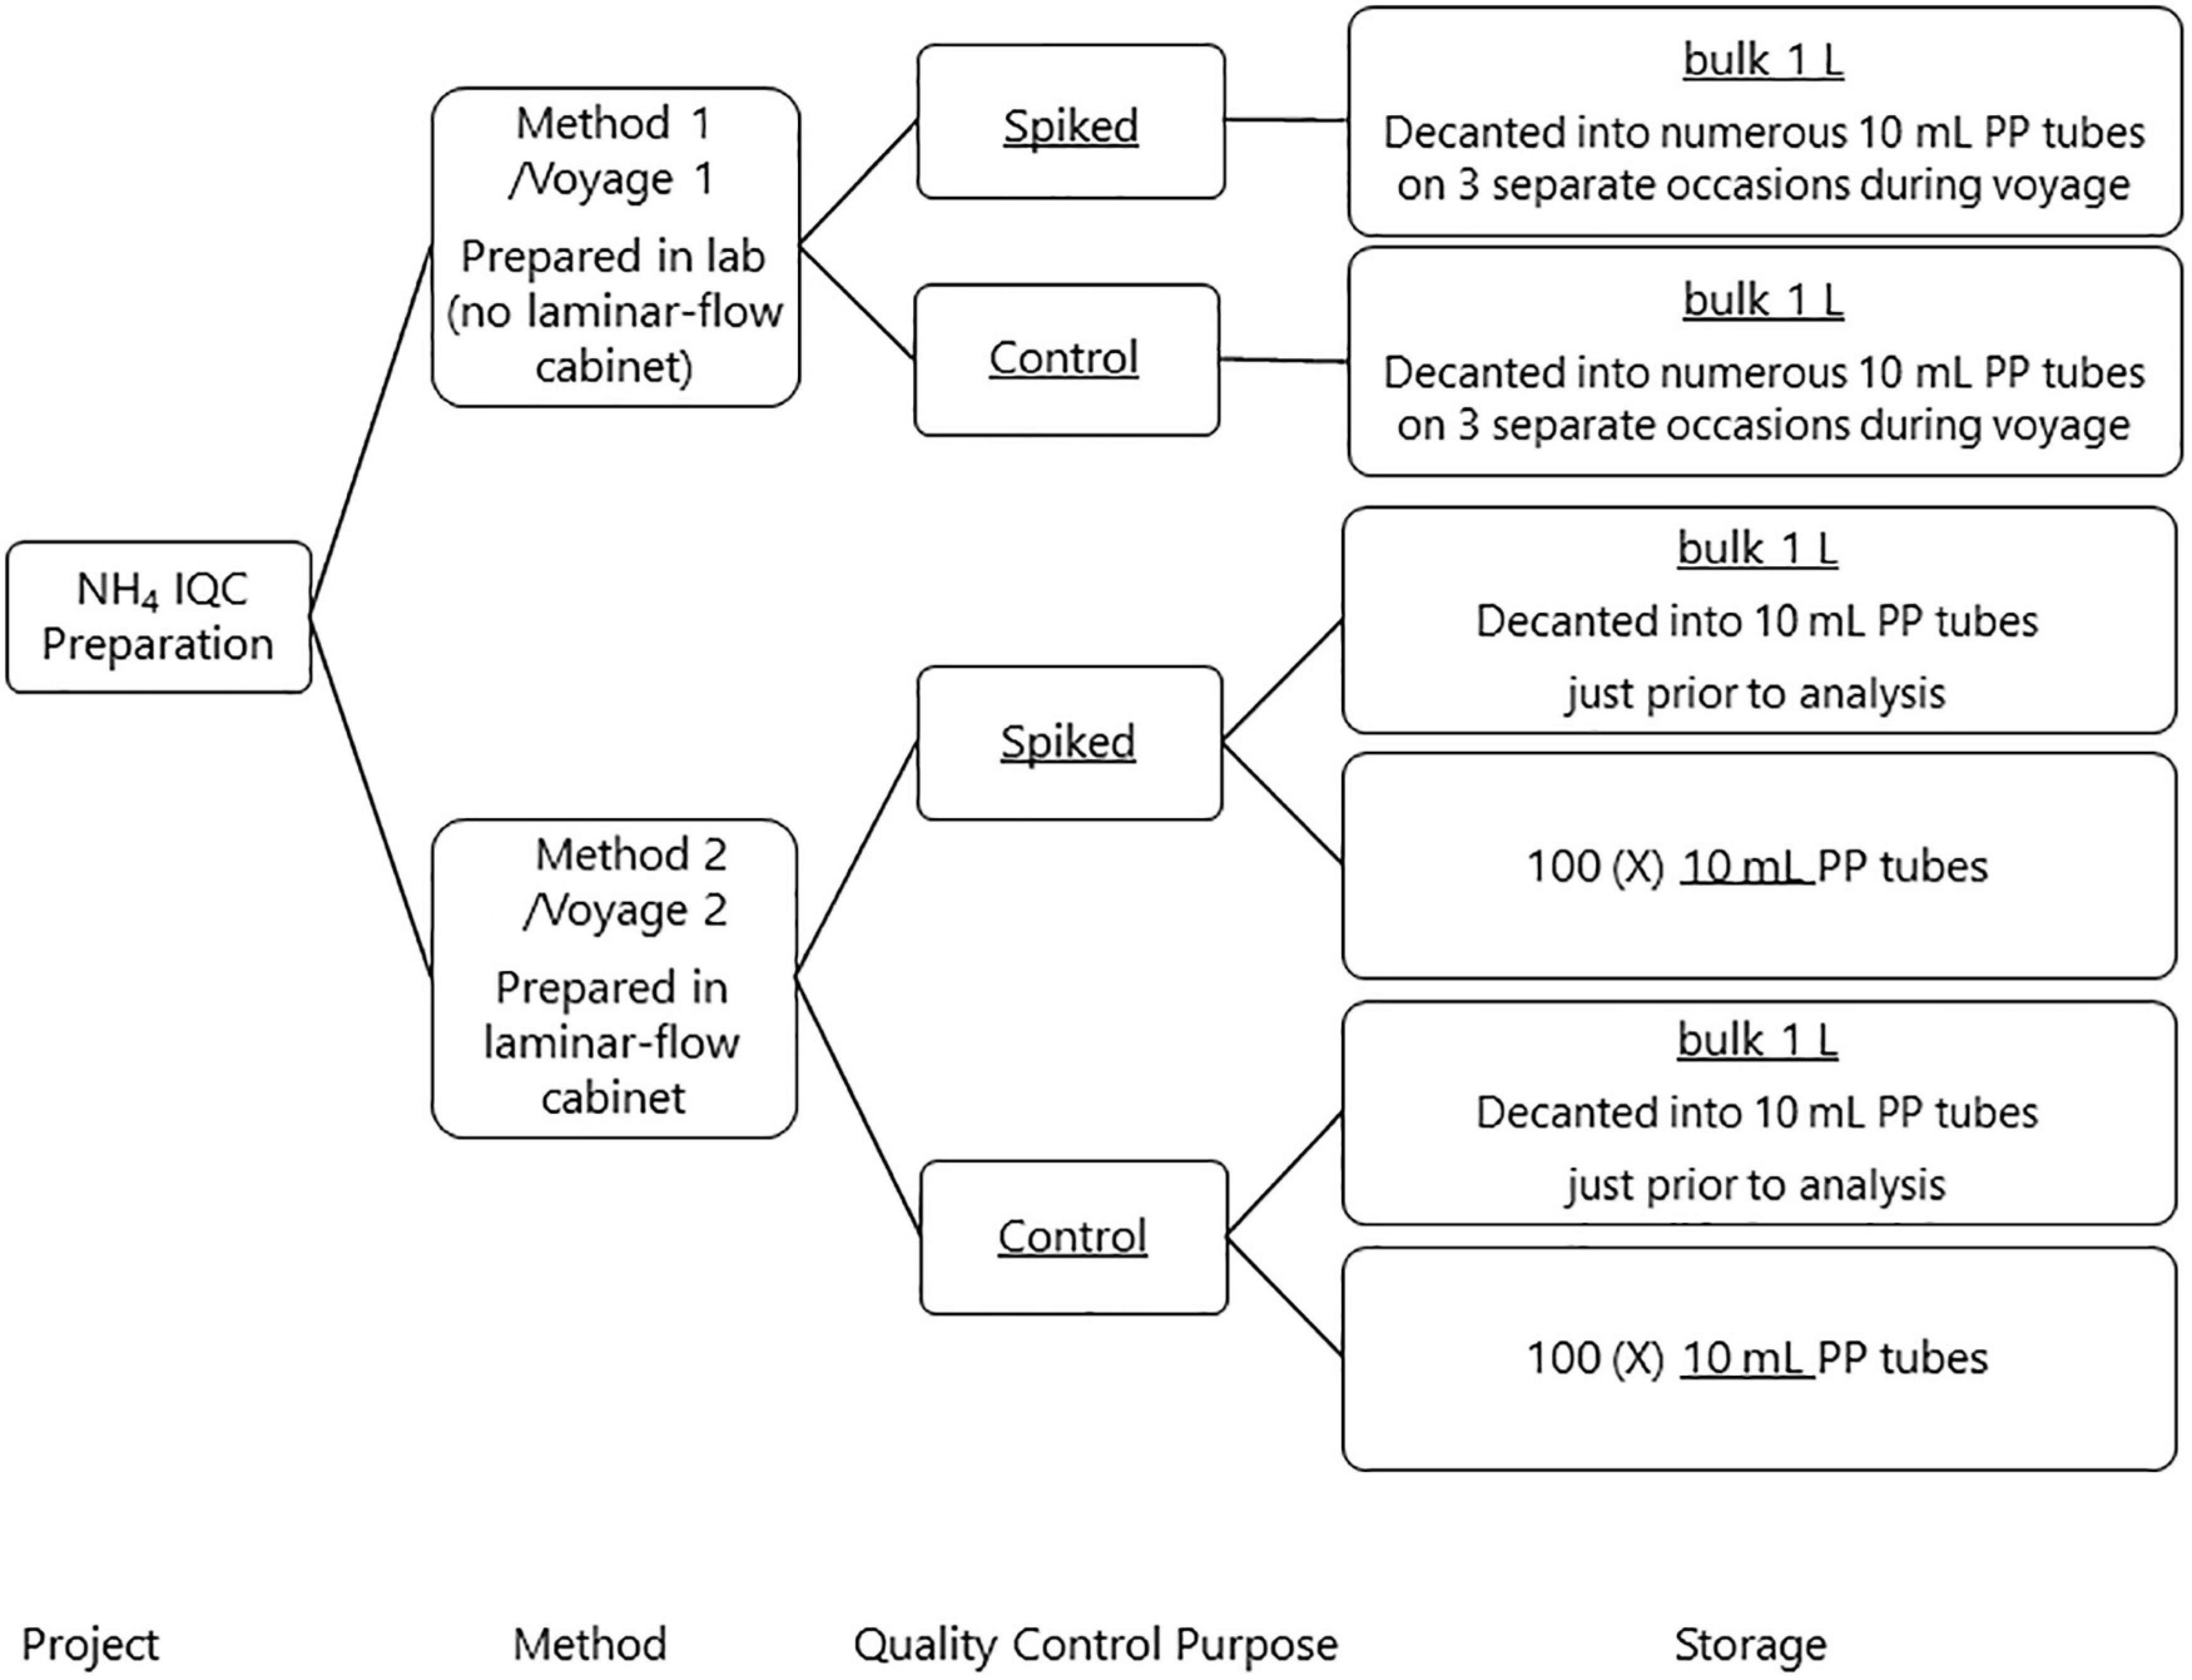
Figure 2. Ship track (gray line) and CTD station (crosses) on the in2018_v01 (voyage 1) GO-SHIP SR03 transect, S04 and P11S lines. Stations 31 and 56 are highlighted with the gray dots.
Internal QC Method 1
The internal QC material for voyage 1 was prepared on the 28th September 2017 by filtering LNSW through a 0.2 μm Acropak filter from a 20 L HDPE carboy into 4 square 1 L HDPE bottles (Nalgene®) and then autoclaved (at 121°C and 15 psi for 20 min; Aminot and Kérouel, 1991; Aminot and Kérouel, 1995). The Spiked QC was prepared from an OSIL Nutrient Standard Solutions Kit to ensure independence from the working calibration solutions. The Nutrient Standard Solutions were pipetted (Finnpipette®) into a 1 L glass volumetric flask and made to volume with the autoclaved LNSW, resulting in nominal concentrations of 1.00 μmol/L for ammonium. The flask was well mixed and poured into a dry acid-cleaned 1 L HDPE bottle with the lid screwed shut, Parafilm® wrapped around it and stored in the dark at 4°C.
A Control was also prepared to account for any nutrients already in the LNSW and any introduced during the autoclaving. The autoclaved LNSW was well mixed, poured into a dry acid cleaned 1 L HDPE bottle, lid screwed shut and wrapped with parafilm® and stored in the dark at 4°C. An initial measurement was made on the Spiked QC and Control in October 2017 and another measurement in December 2017 (Table 1).
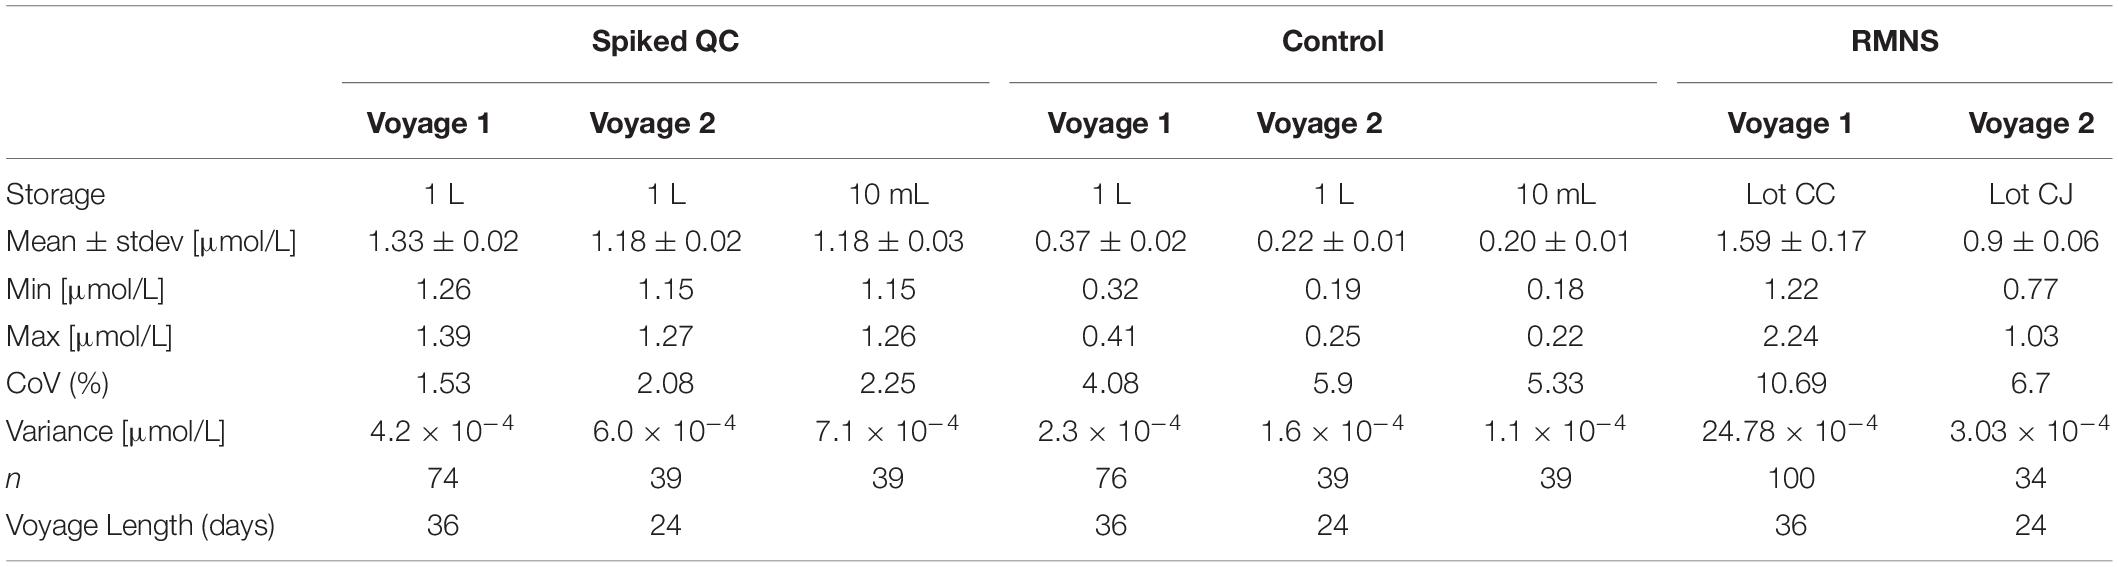
Table 1. Ammonium mean concentration and standard deviation (Stdev) in μmol/L, minimum and maximum concentration (in μmol/L), coefficient of variation (CoV, in%), variance (in μmol/L) and number of samples analyzed from bulk solution, 10 mL tubes, and reference material for nutrients in seawater (RMNS) (n) during voyage 1 and voyage 2, and length of the voyage (in days).
On three separate occasions during the voyage, the Control and Spiked QC were decanted into several 10 mL polypropylene (PP) screw lid sample tubes (Sarstedt Australia) and parafilm® placed around the lids and stored in the dark at 4°C. During analysis of the nutrient samples from each conductivity, temperature, and depth (CTD) station, the Spiked QC sample and the Control were analyzed.
Internal QC Method 2
A second Spiked QC and Control was prepared on the 5th of September 2018 by filtering approximately 8 L of LNSW through a 0.2 μm Acropak filter from a 20 L HDPE carboy into two 4 L polycarbonate bottles and then autoclaved (at 121°C and 15 psi for 20 min; Aminot and Kérouel, 1991; Aminot and Kérouel, 1995). The preparation of these QCs follows the method described above except that all preparations were done in a laminar flow cabinet. Two storage mediums were used for bottling the Spiked QC and Control. The first storage container was a 1 L HDPE square bottle and considered as the bulk solution (hereafter referred to as bulk). The second was 10 mL PP screw lid sample tubes, where the QC was bottled individually into the 100 sample tubes directly from the manufacturer.
Initial measurements of both storage mediums of Spiked QC’s and Controls were made on shore on the 7 September 2018, prior to the commencement of the voyage. The bulk Spiked QC and bulk Control were decanted into two 30 mL PP sample tubes, each sample tube was analyzed three times. Six 10 mL Spiked QC’s and six 10 mL Controls were assayed once each. During the voyage 10 mL Control, 10 mL Spiked QC and the bulk QC’s decanted into 10 mL PP sample just prior to analysis were included in every analytical run.
Voyage Information
Sampling Process
During both voyages water samples were collected using a CTD rosette fitted with 36, 12 L Niskin bottles for the measurement of salinity, dissolved oxygen, and nutrients (NOx, phosphate, silicate, nitrite, and ammonium). Dissolved oxygen was sampled first from the Niskin bottles, directly followed by sampling for nutrient measurements. Extra precautions to reduce ammonium contamination were implemented, scientific staff collecting nutrient samples had to be non-smokers and wear vinyl gloves. Following recommendations from Becker et al. (2020), smokers were also discouraged from entering the CTD laboratory to minimize the risk of contamination. Scientific staff who were smokers and needed to be within the CTD space were required to have showered and changed into smoke free clothes before entering the CTD laboratory.
Samples were collected in re-usable 50 mL tubular HDPE bottles with HDPE white ribbed caps (insert free) from Measom Freer, Leicestershire, United Kingdom (bottle part number: 1212PE and cap part number: 5324R), which constitutes a change from the described 10 mL PP (Rees et al., 2019). The HDPE bottles and caps were washed prior to sample collection with 10% (v/v) Hydrochloric acid solution (HCl 32%, Merck) then rinsed 3 times with ultra-pure deionized water and allowed to drain upside down on Teri Wipes®. The bottles were used repeatedly with the same washing routine between each CTD station. For each CTD deployment, one 50 mL nutrient sample was collected per depth, except for the deepest sample which was collected in duplicate. The duplicate samples were analyzed to evaluate and assess potential contamination during sampling and processing operations.
Voyage 1
The aim of voyage 1 was to quantify changes in Antarctic Bottom Water in the Australian Antarctic Basin. One hundred and eight full-depth (within 14 m of the bottom) CTD deployments were sampled for nutrients during the 43-day voyage on RV Investigator in January and February 2018. The oceanographic measurements were conducted along the CLIVAR Southern Ocean repeat meridional section SR03 (140°E), followed by Adelie land shelf stations, small meridional sections along 150°E (the south end of CLIVAR section P11S) and 132°E and several stations along CLIVAR zonal section S04 (Figure 3). The 2825 nutrients samples collected from the surface to depths > 5000 m were analyzed in 103 analytical runs.
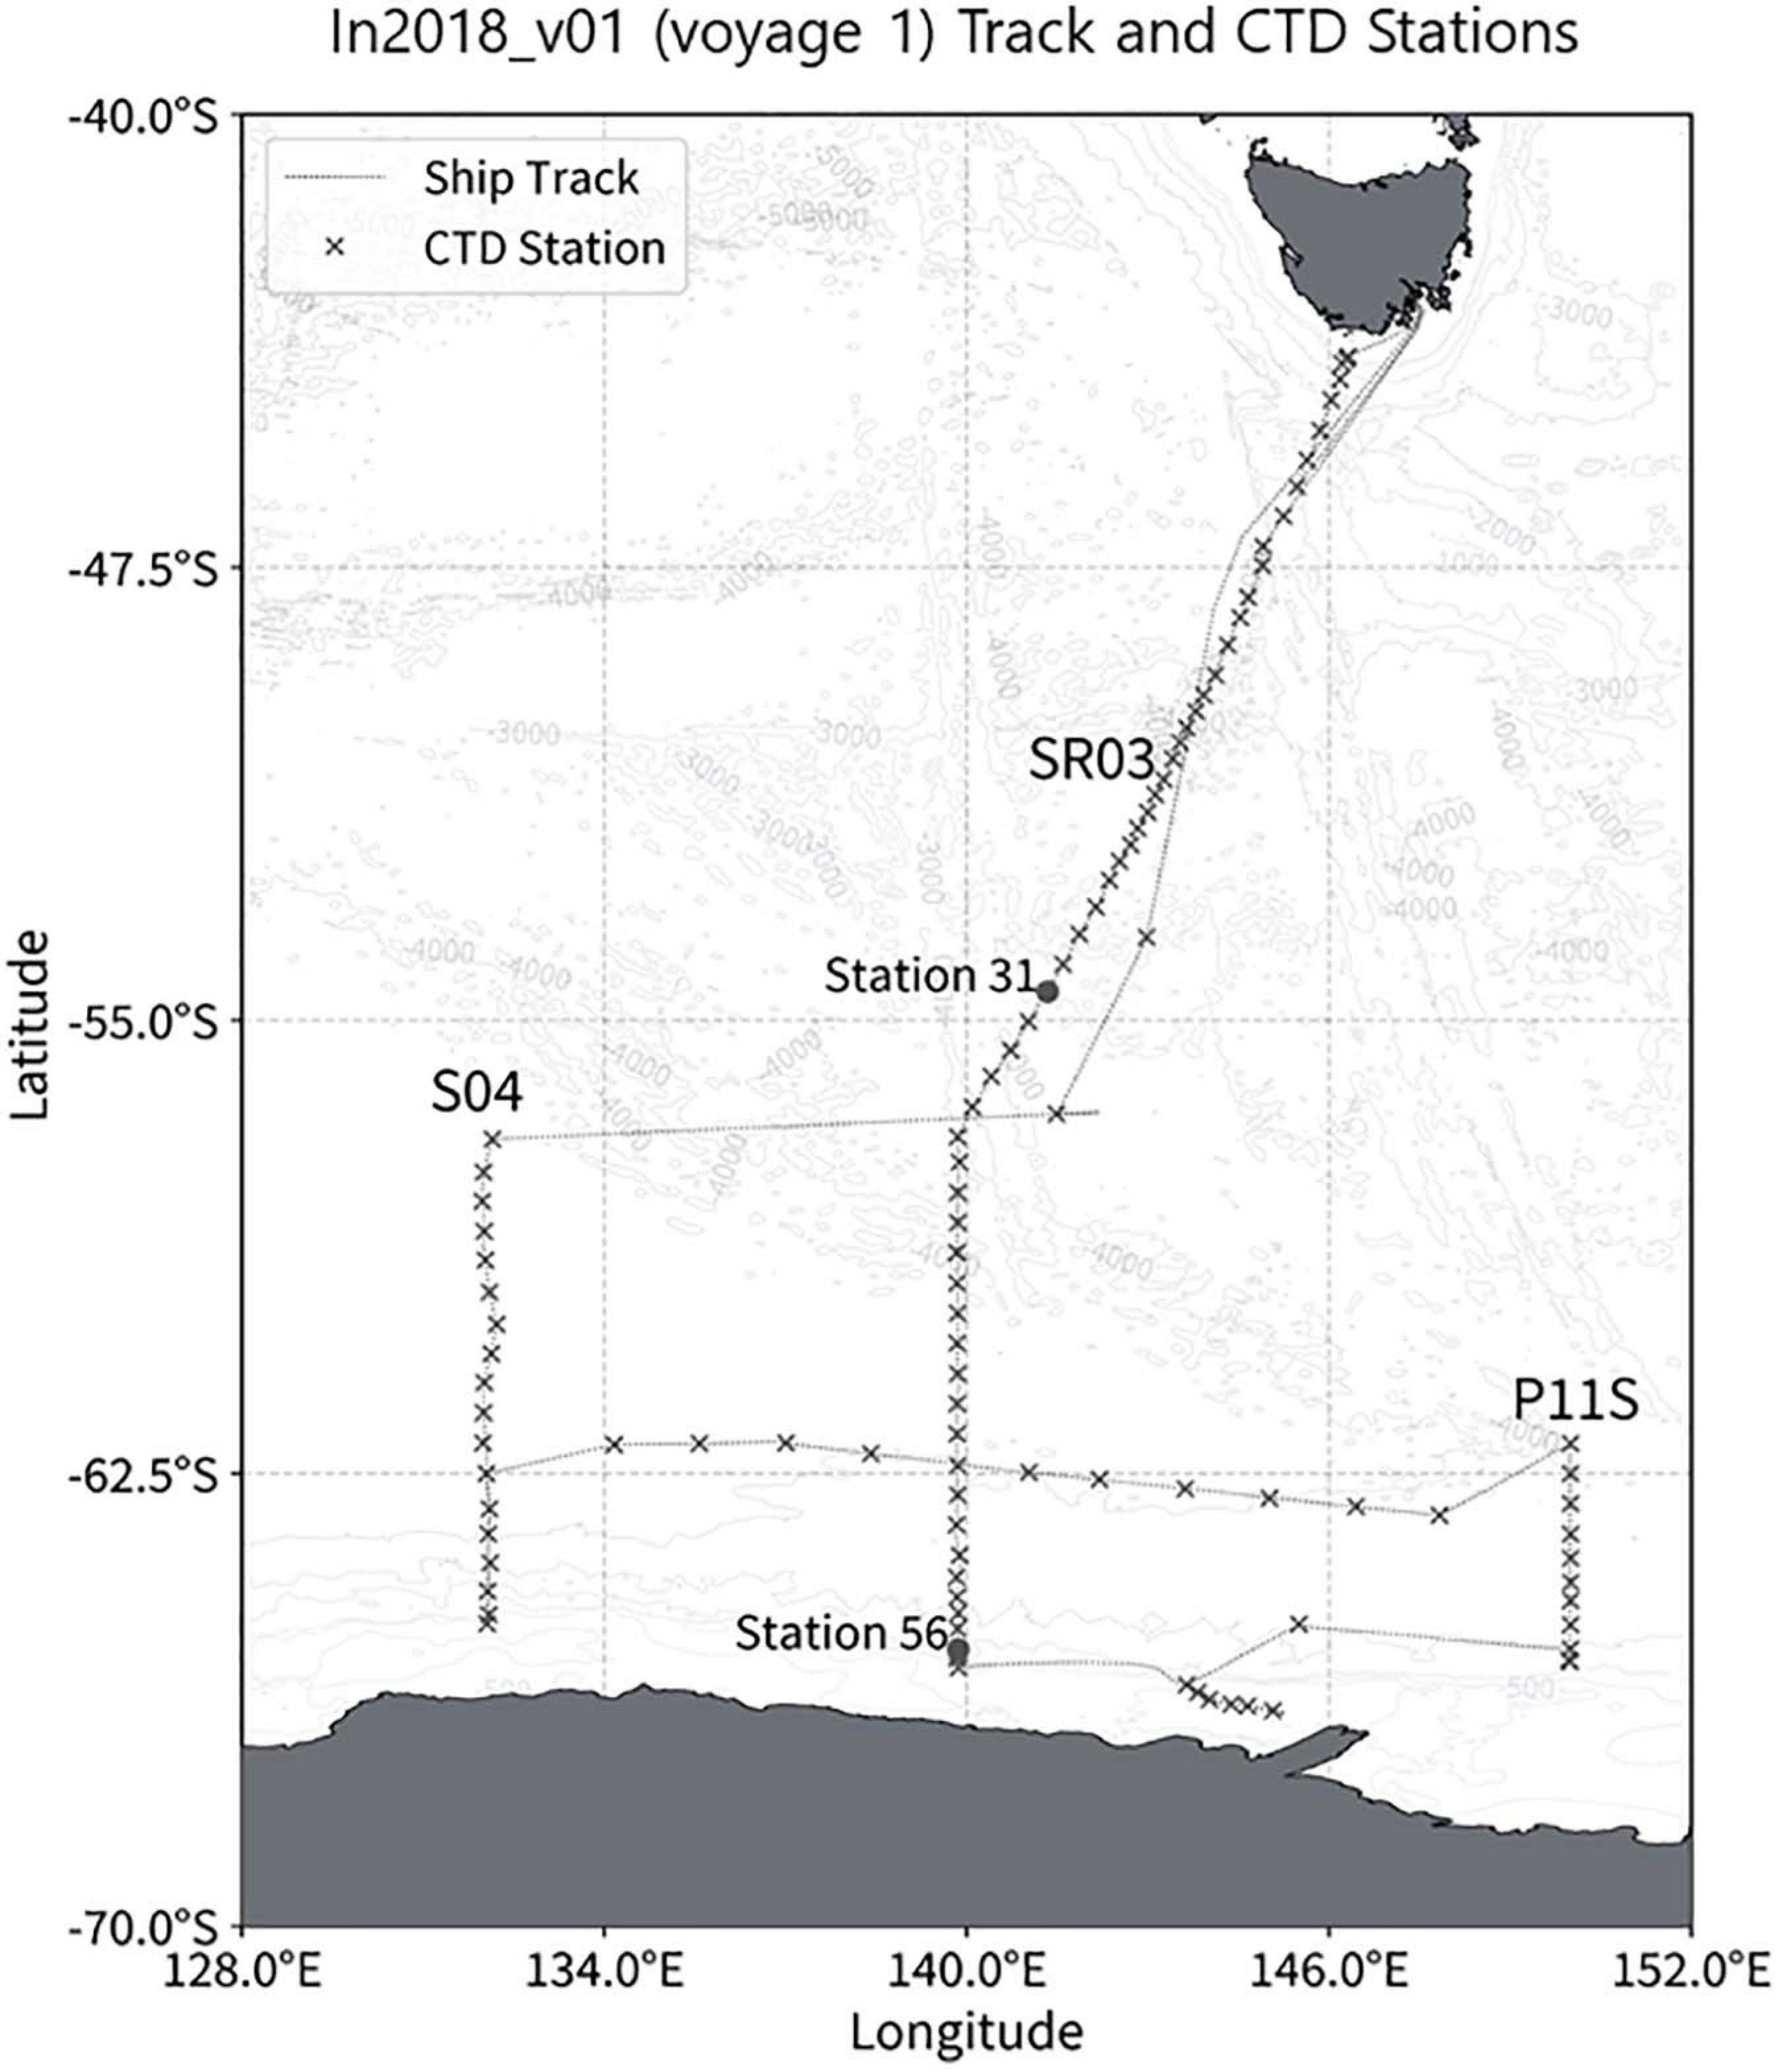
Figure 3. Flow diagram summarizing the preparation and storage of internal QC’s prior to voyage 1 and voyage 2.
Voyage 2
The objective of Voyage 2 was to characterize the sources and biogeochemical cycling of iron and associated nutrients, and their impact on productivity southwest, southeast, and northeast of Tasmania, Australia. Twenty-five CTD deployments were conducted on board RV Investigator over 28 days during September and October 2018. A total of 1083 nutrient samples were analyzed in 36 analytical runs.
Analysis Sequence
The analysis sequence for the tray protocol was similar to that described in Rees et al. (2019), with a few minor modifications. An extra Null sample (ultra-pure deionized water wash) was included before the baseline measurement (ultra-pure deionized water) to ensure that the instrument had come back down to the correct baseline measurement. The baseline measurement was taken from the wash pot. The reservoir for the ultra-pure deionized water, consisted of one 4 L HDPE container (wide screw cap lid type) with a small hole drilled into the lid to allow a straw to be placed into the container. The container was cleaned immediately prior to each analytical run with 1.2% (v/v) Hypochlorite solution (Hypochlorite 12%, Orica), rinsed 3 times with ultra-pure deionized water before being filled.
The sampler pump that fills the wash pot was kept at 10–12 mL/min to ensure a continual flow of water to reduce ammonium contamination from the sample probe as well as the atmosphere. The internal QC’s (Spiked QC and Control) were placed in the tray protocol immediately after the “Low-Level Precision Check” (LLPC) samples (4 sample tubes of LNSW), prior to the reference material for nutrients in seawater (RMNS from KANSO). The LLPC samples compares 3 times the standard deviation of the 4 LNSW samples to that of the nominal 0.02 μmol/L method detection limit (MDL). Measurement of these LNSW samples is a check of the analytical precision, if it is greater than the nominal MDL concentration then the investigation of the instrument is required and extra maintenance.
At the start of an analytical run, ultra-pure deionized water was pumped through all reagent lines for at least 30 min, followed by the reagents for 30 min. This provided a stable baseline before starting the run. Sample bottles remained tightly closed until just before analysis to avoid contamination from external sources (Van Oostende et al., 2017). Additionally, once the sample bottles were opened, aluminum foil was placed tightly over each individual sample bottle which would be pierced by the autosampler needle at time of sampling. Samples were always measured fresh, typically within 5 h of collection.
On completion of each run the ammonium channel was cleaned by placing the reagent straw in ultra-pure deionized water for a minimum of 10 min, followed by 10% (v/v) HCl acid (Merck) solution for 10 min, followed by another 10 min of ultra-pure deionized water. Following this cleaning process, the method maintained better than nominal analytical precision, as determined from the LLPC samples.
Ammonium in the Reference Material for Nutrients in Seawater
Ammonium concentrations were measured in the RMNS (KANSO) during both voyages (lot CC for voyage 1 and lot CJ during voyage 2). However, it must be noted that KANSO do not give a reference value for ammonium or state that ammonium is contained within the RMNS.
Statistical Analysis and Measurement Uncertainty
Data processing post analysis was completed through an in-house developed software program, Hydrology Processor (HyPro, Rees et al., 2019). Descriptive statistics were used to ascertain the accuracy and precision of the measurements from the repeated analysis of the internal QC’s (Spiked and Control). The mean, standard deviation, variance, and coefficient of variation (CoV) were used to summarize the reproducibility, relative accuracy, and precision of the analytical measurements for each voyage.
An F-test was used to determine if there were statistical differences in the magnitude of variance between the different manufactured batches of internal QC’s (voyage 1 vs. voyage 2), and also storage containers (10 mL vs. 1 L bulk, for voyage 2 only). The F-test was followed by a one-tail t test to assess if there was a discernible difference in the means of the groups (i.e., voyage 1 to voyage 2; 10 mL vs. bulk).
To determine if there was a statistically significant trend in the concentration of the internal QC’s over the duration of the voyage, least squares linear regression was applied. Assessing the significance of the slope coefficient was then interpreted as the significance of a trend in the concentration over the voyage length.
For all statistical tests performed in this study alpha = 0.05 was used as cut-off value for statistical significance and all analyzes were conducted using the data analysis toolpack (Excel for Office 365).
The measurement uncertainty (MU) was evaluated using the bottom-up approach described in “Quantifying uncertainty in analytical measurement” (Ellison and Williams, 2012). Three components contribute to the calculated uncertainty: the calibration curve, the standards, and instrument precision based on the QC (Figure 4). Calibration curve uncertainty is based on HyPro’s output of the calibration slope standard error. Stock standard uncertainty is calculated based on laboratory calibration data including purity of standards and calibration data from LabWare and is determined in the same process as the overall measurement uncertainty. Repeated measurements of the internal QC were used to derive the instrument precision uncertainty. The final reported MU reflects the combined uncertainty from these components based on analytical data and is reported as expanded; meaning it provides a 95% confidence interval with coverage factor of 2 for each result.
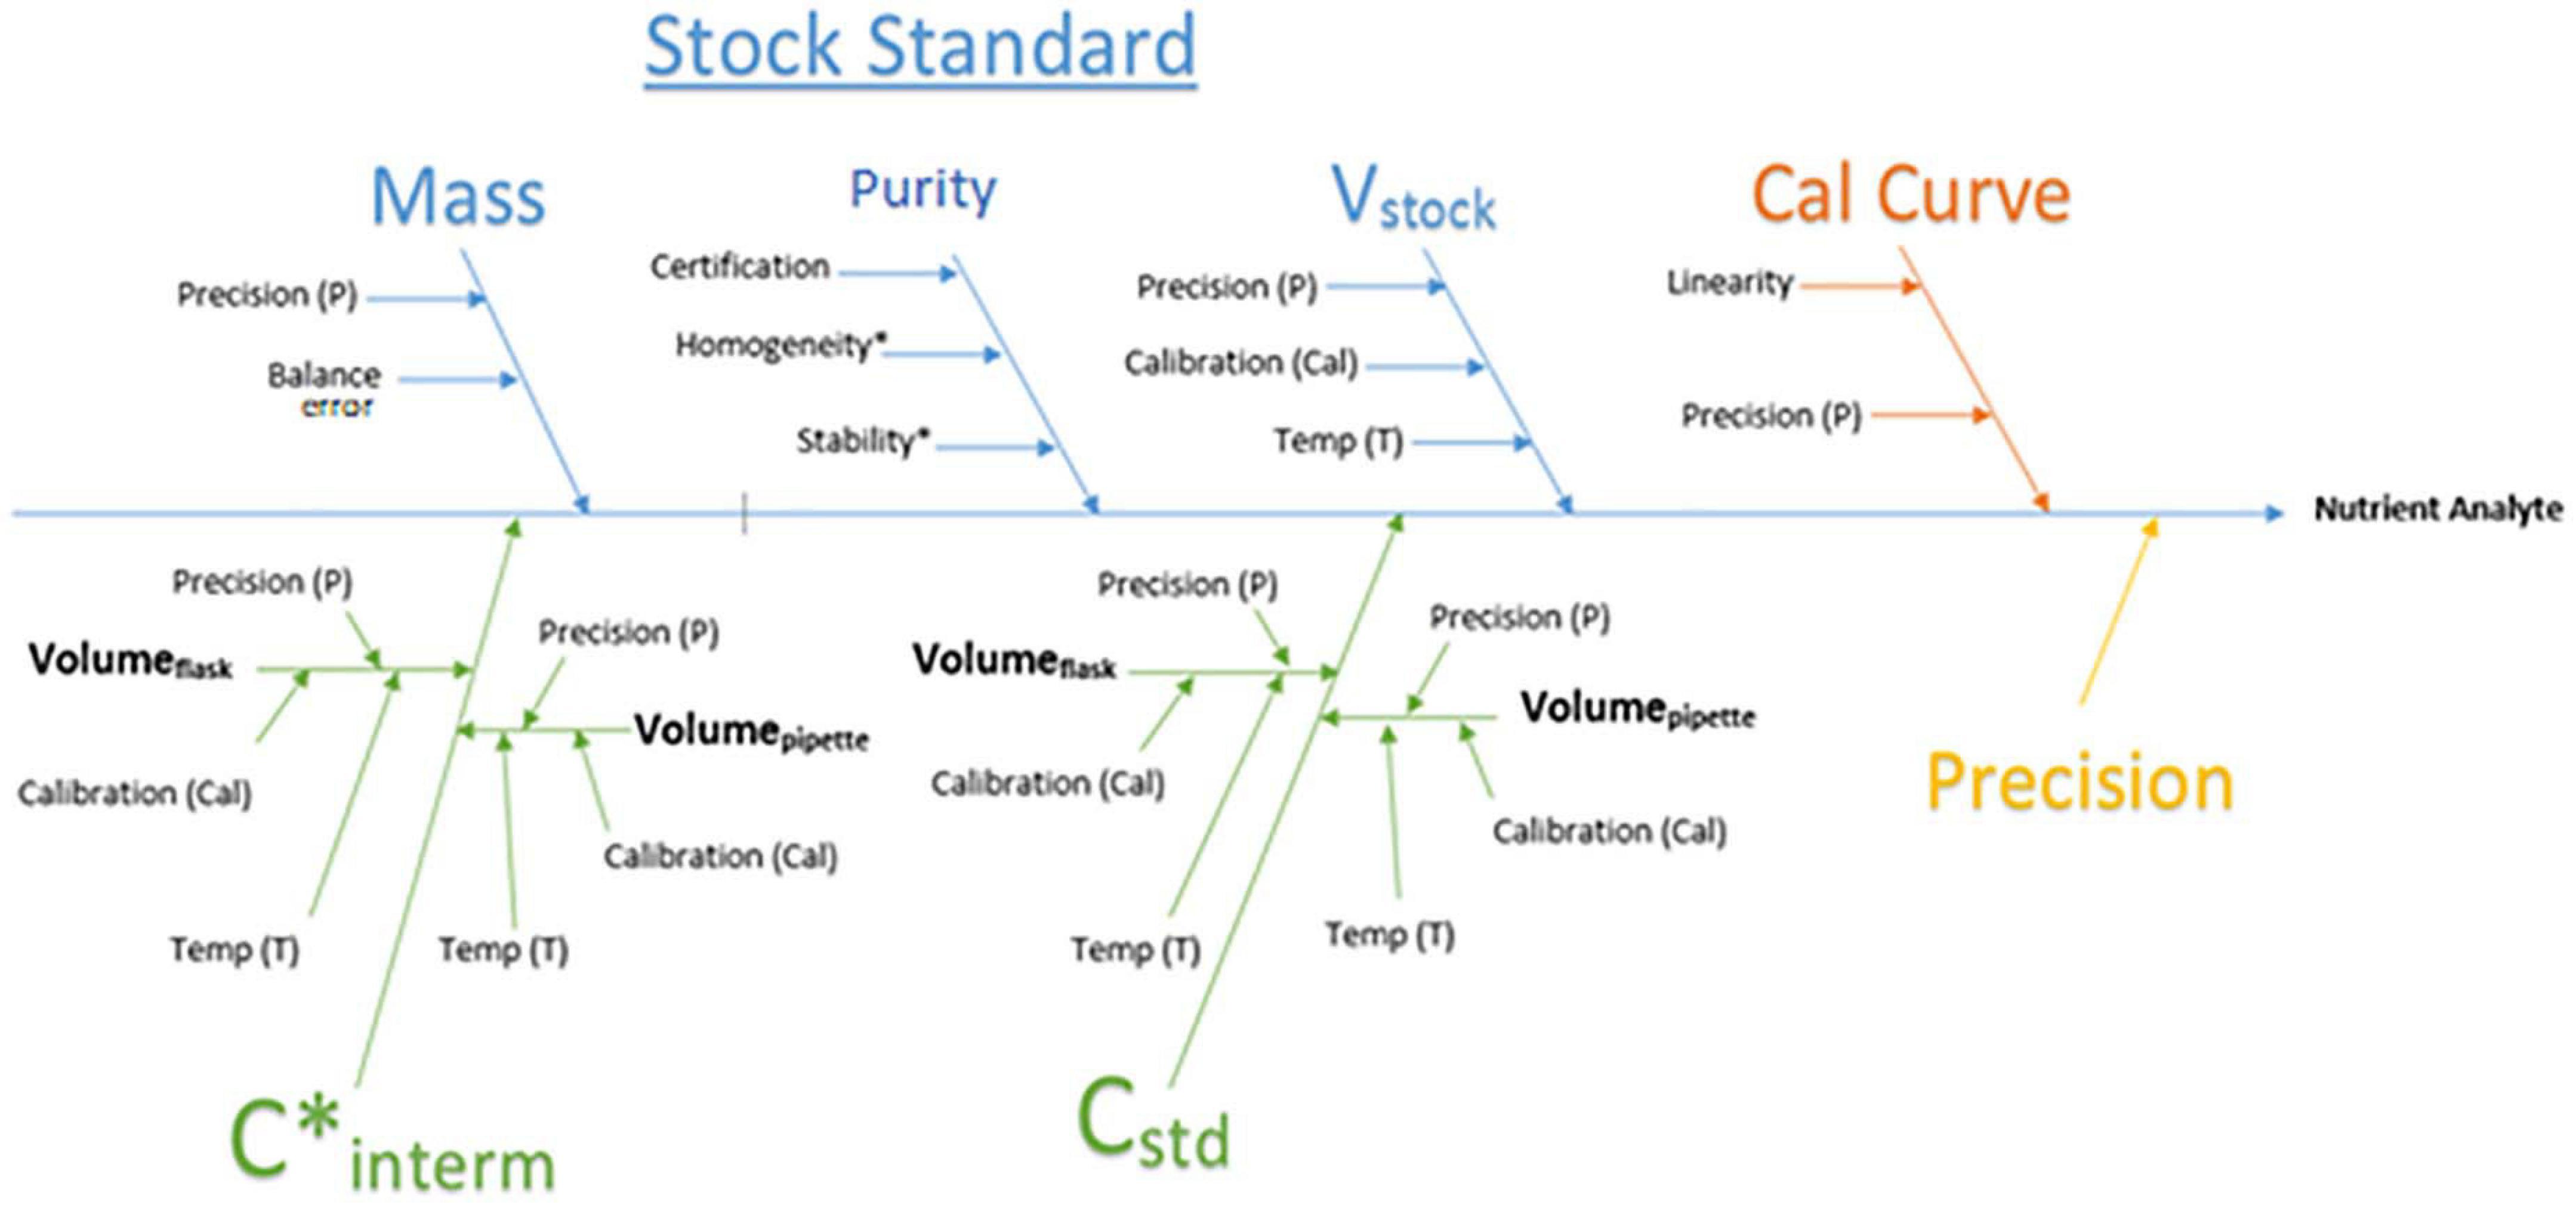
Figure 4. Process flowchart for the calculation of measurement uncertainty which incorporates the error from each section cumulative to the final result. Purity = Salt purity, V stock = stock volume, Cal curve = calibration curve, C* interm = concentration of intermediate, C std = concentration of standards.
Results
Voyage 1
CTD Bottle Data
The maximum ammonium concentration measured during the voyage was 1.61 μmol/L and the minimum was below detection limit (<0.02 μmol/L). The highest observed ammonium concentrations were found in the upper 150 m, with the maximum concentration in the 50 m to 150 m layer. Below 150 m, the concentration decreases with increasing depth until it is less than detectable limits (0.02 μmol/L) at approximately a depth of 220 m. Maximum concentrations were observed in the upper 115 m near the Antarctic continent, and in the sub surface layer around 61.5°S (Figures 5A,B). It is of interest to note the data for station 21, around 55°S, has results that are very slightly negative (Figure 5B). This illustrates one of the biggest challenges when analyzing ammonium in parallel with other nutrients which use ammonium-based reagents. Diligence and good laboratory practices are consistently required to ensure the instrument baseline does not become contaminated, which results in sample concentrations calculated as negative. Figure 6 shows the two types of ammonium depth profiles present on the SR03 transect. Figure 6A (deployment 31, 54°52S, 141°33W) is characteristic for waters North of the polar front with surface concentrations below 0.20 μmol/L. Figure 6B (deployment 56, 65°39S, 139°85W) is representative of waters South of the Polar front with surface concentrations above 0.50 μmol/L. Detailed nutrient data can be accessed on the Marine National Facility data portal (https://www.marlin.csiro.au/geonetwork/srv/eng/search#!b2fe5c bc-1bd0-49f0-a407-9fca1f2bff5a) (data accessed on 10.07.2020).
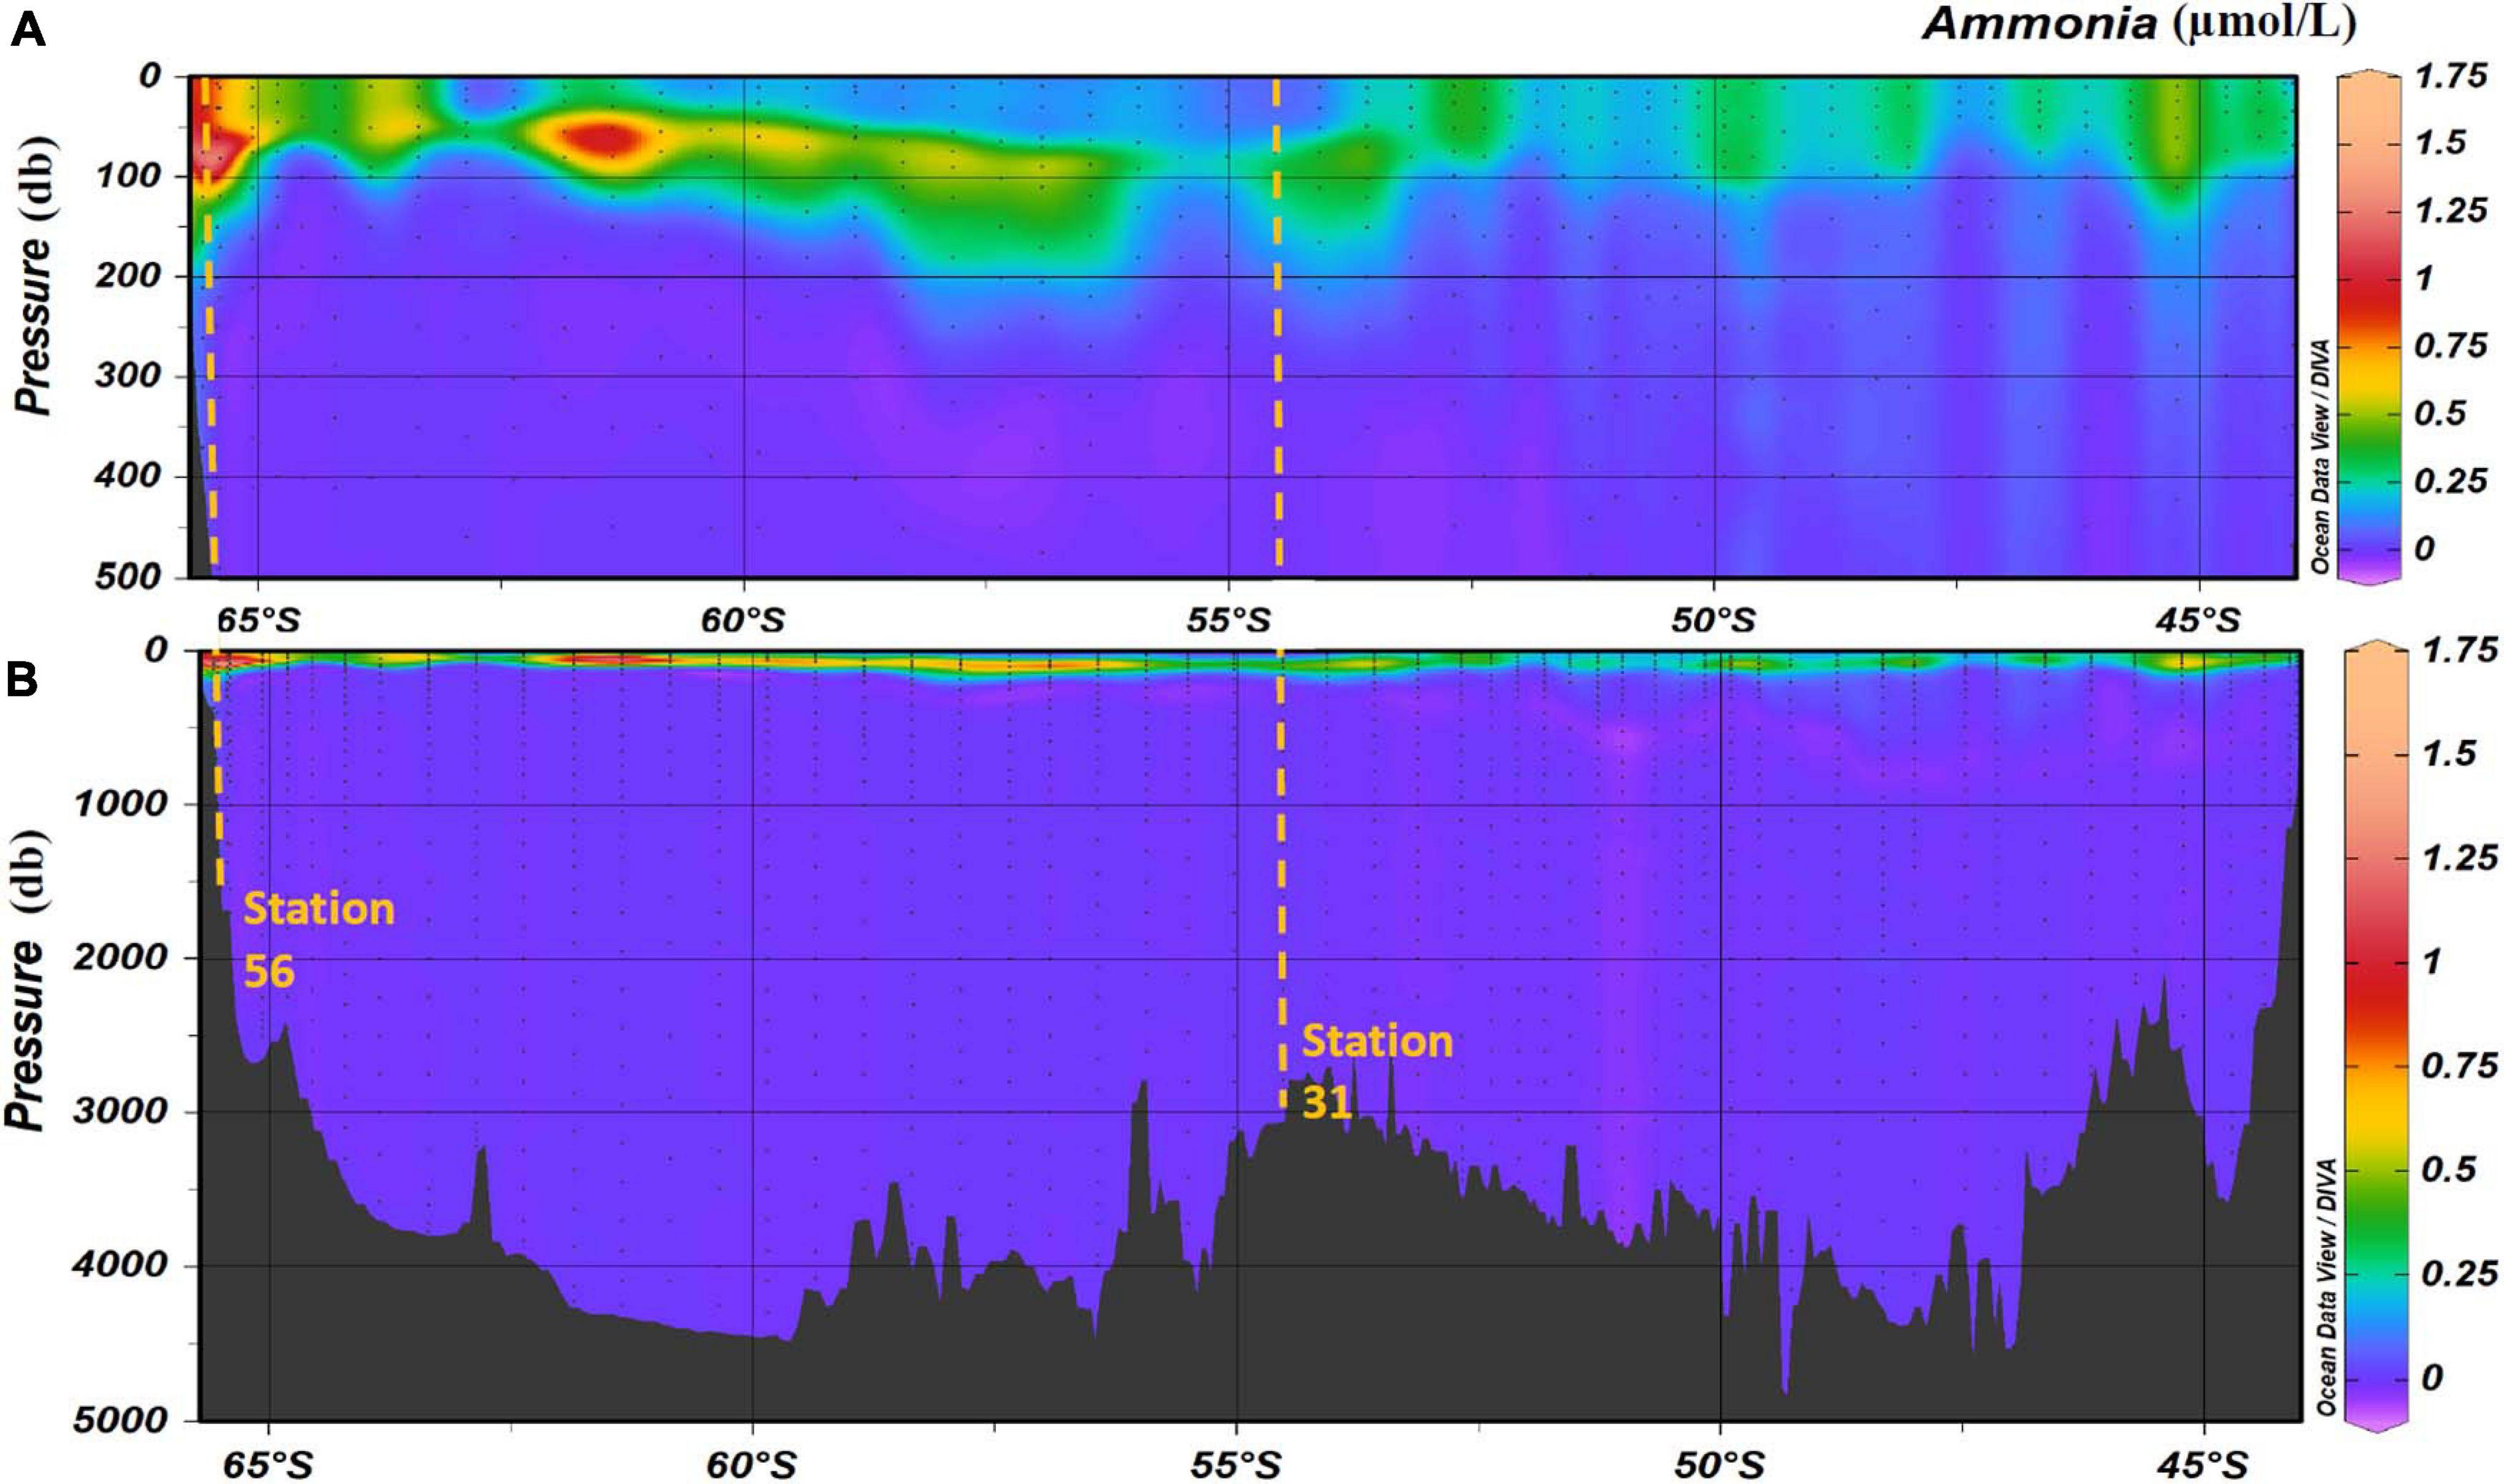
Figure 5. Ammonia concentration (in μmol/L) in the water column during along the SR03 transect (voyage 1). Panel (A) represents the top 500 m and panel (B) represents the entire water column. Stations 31 and 56 are highlighted with the orange dashed lines. Pressure is in decibar (db). Data were plotted using the Ocean Data View Software (Schlitzer, Reiner, Ocean Data View, https://odv.awi.de, 2020).
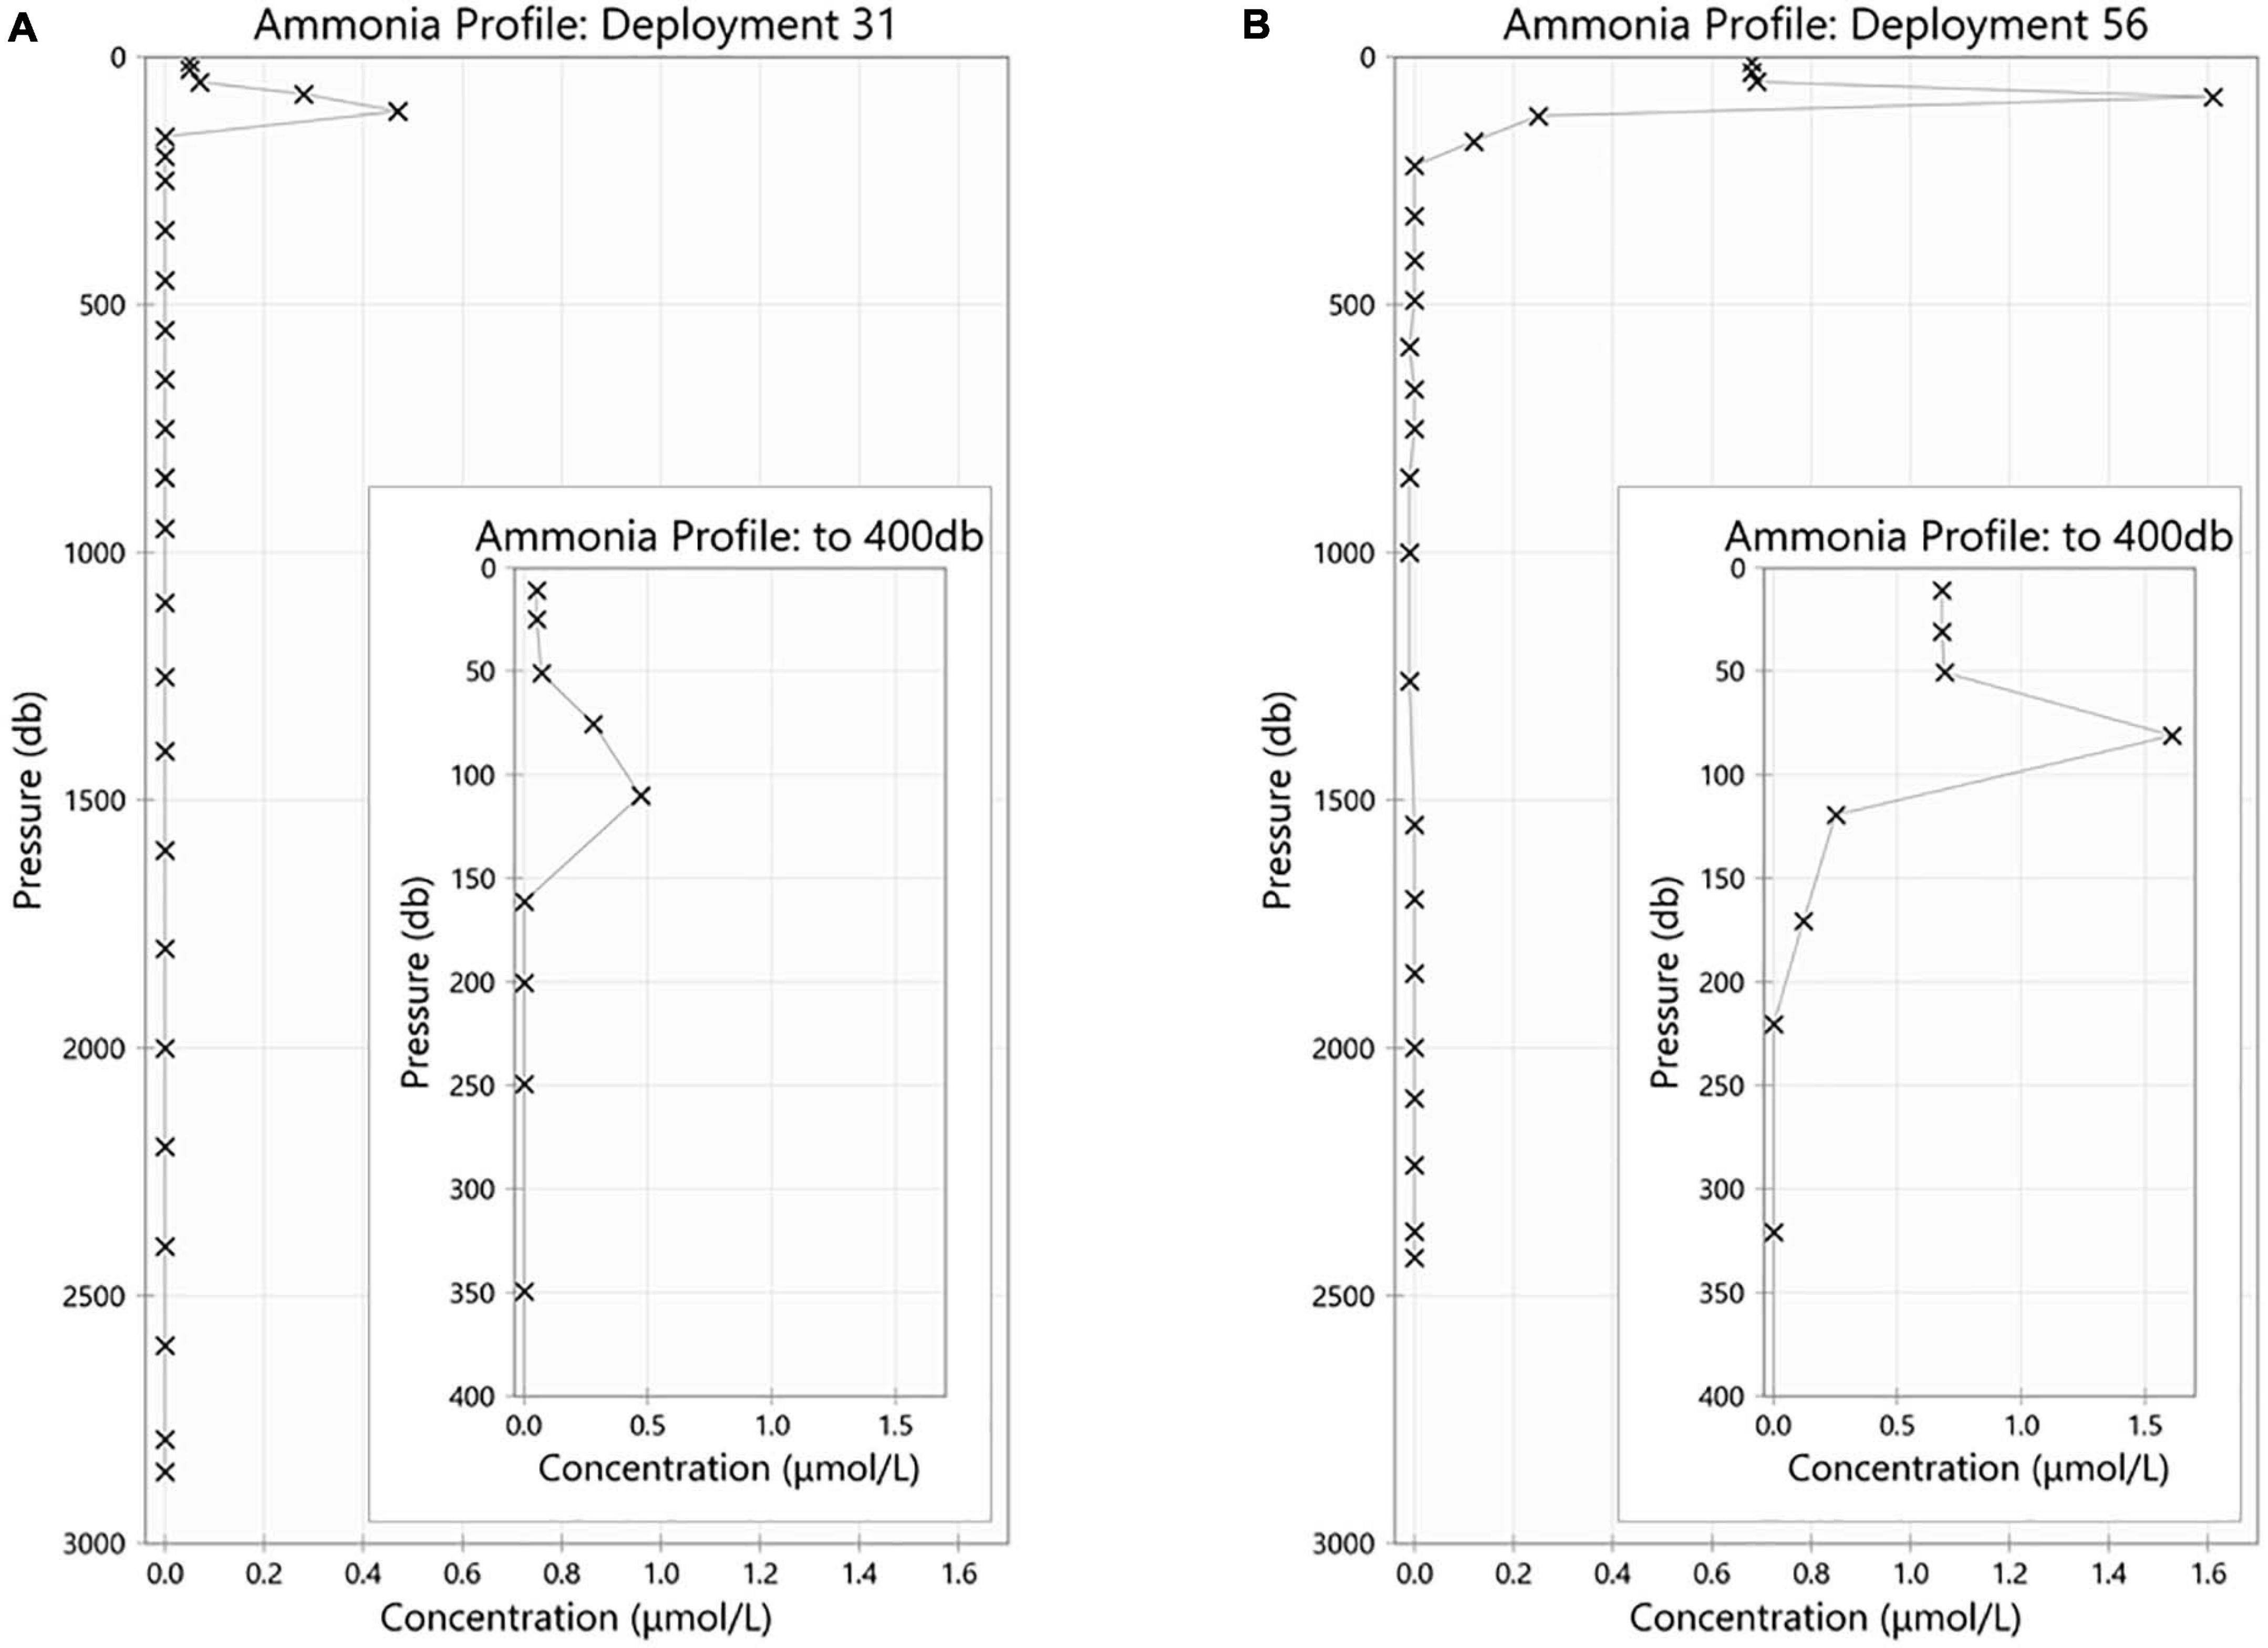
Figure 6. Ammonium (in μmol/L) profiles for CTD station (A) 31 and (B) 56. For both profile, the internal panel represents a magnification of the upper 400 m.
Analytical
The LLPC was below 0.02 μmol/L in every run. Both the baseline and sensitivity drift (highest concentration standard) were also below 2.5% in all runs, which is well below the manufacturers recommended maximum of 5%.
Sample Collection
The difference between the two duplicates collected for each run during voyage 1 is illustrated in Figure 7. All duplicates samples were below 0.02 μmol/L and predominantly below 0.002 μmol/L.
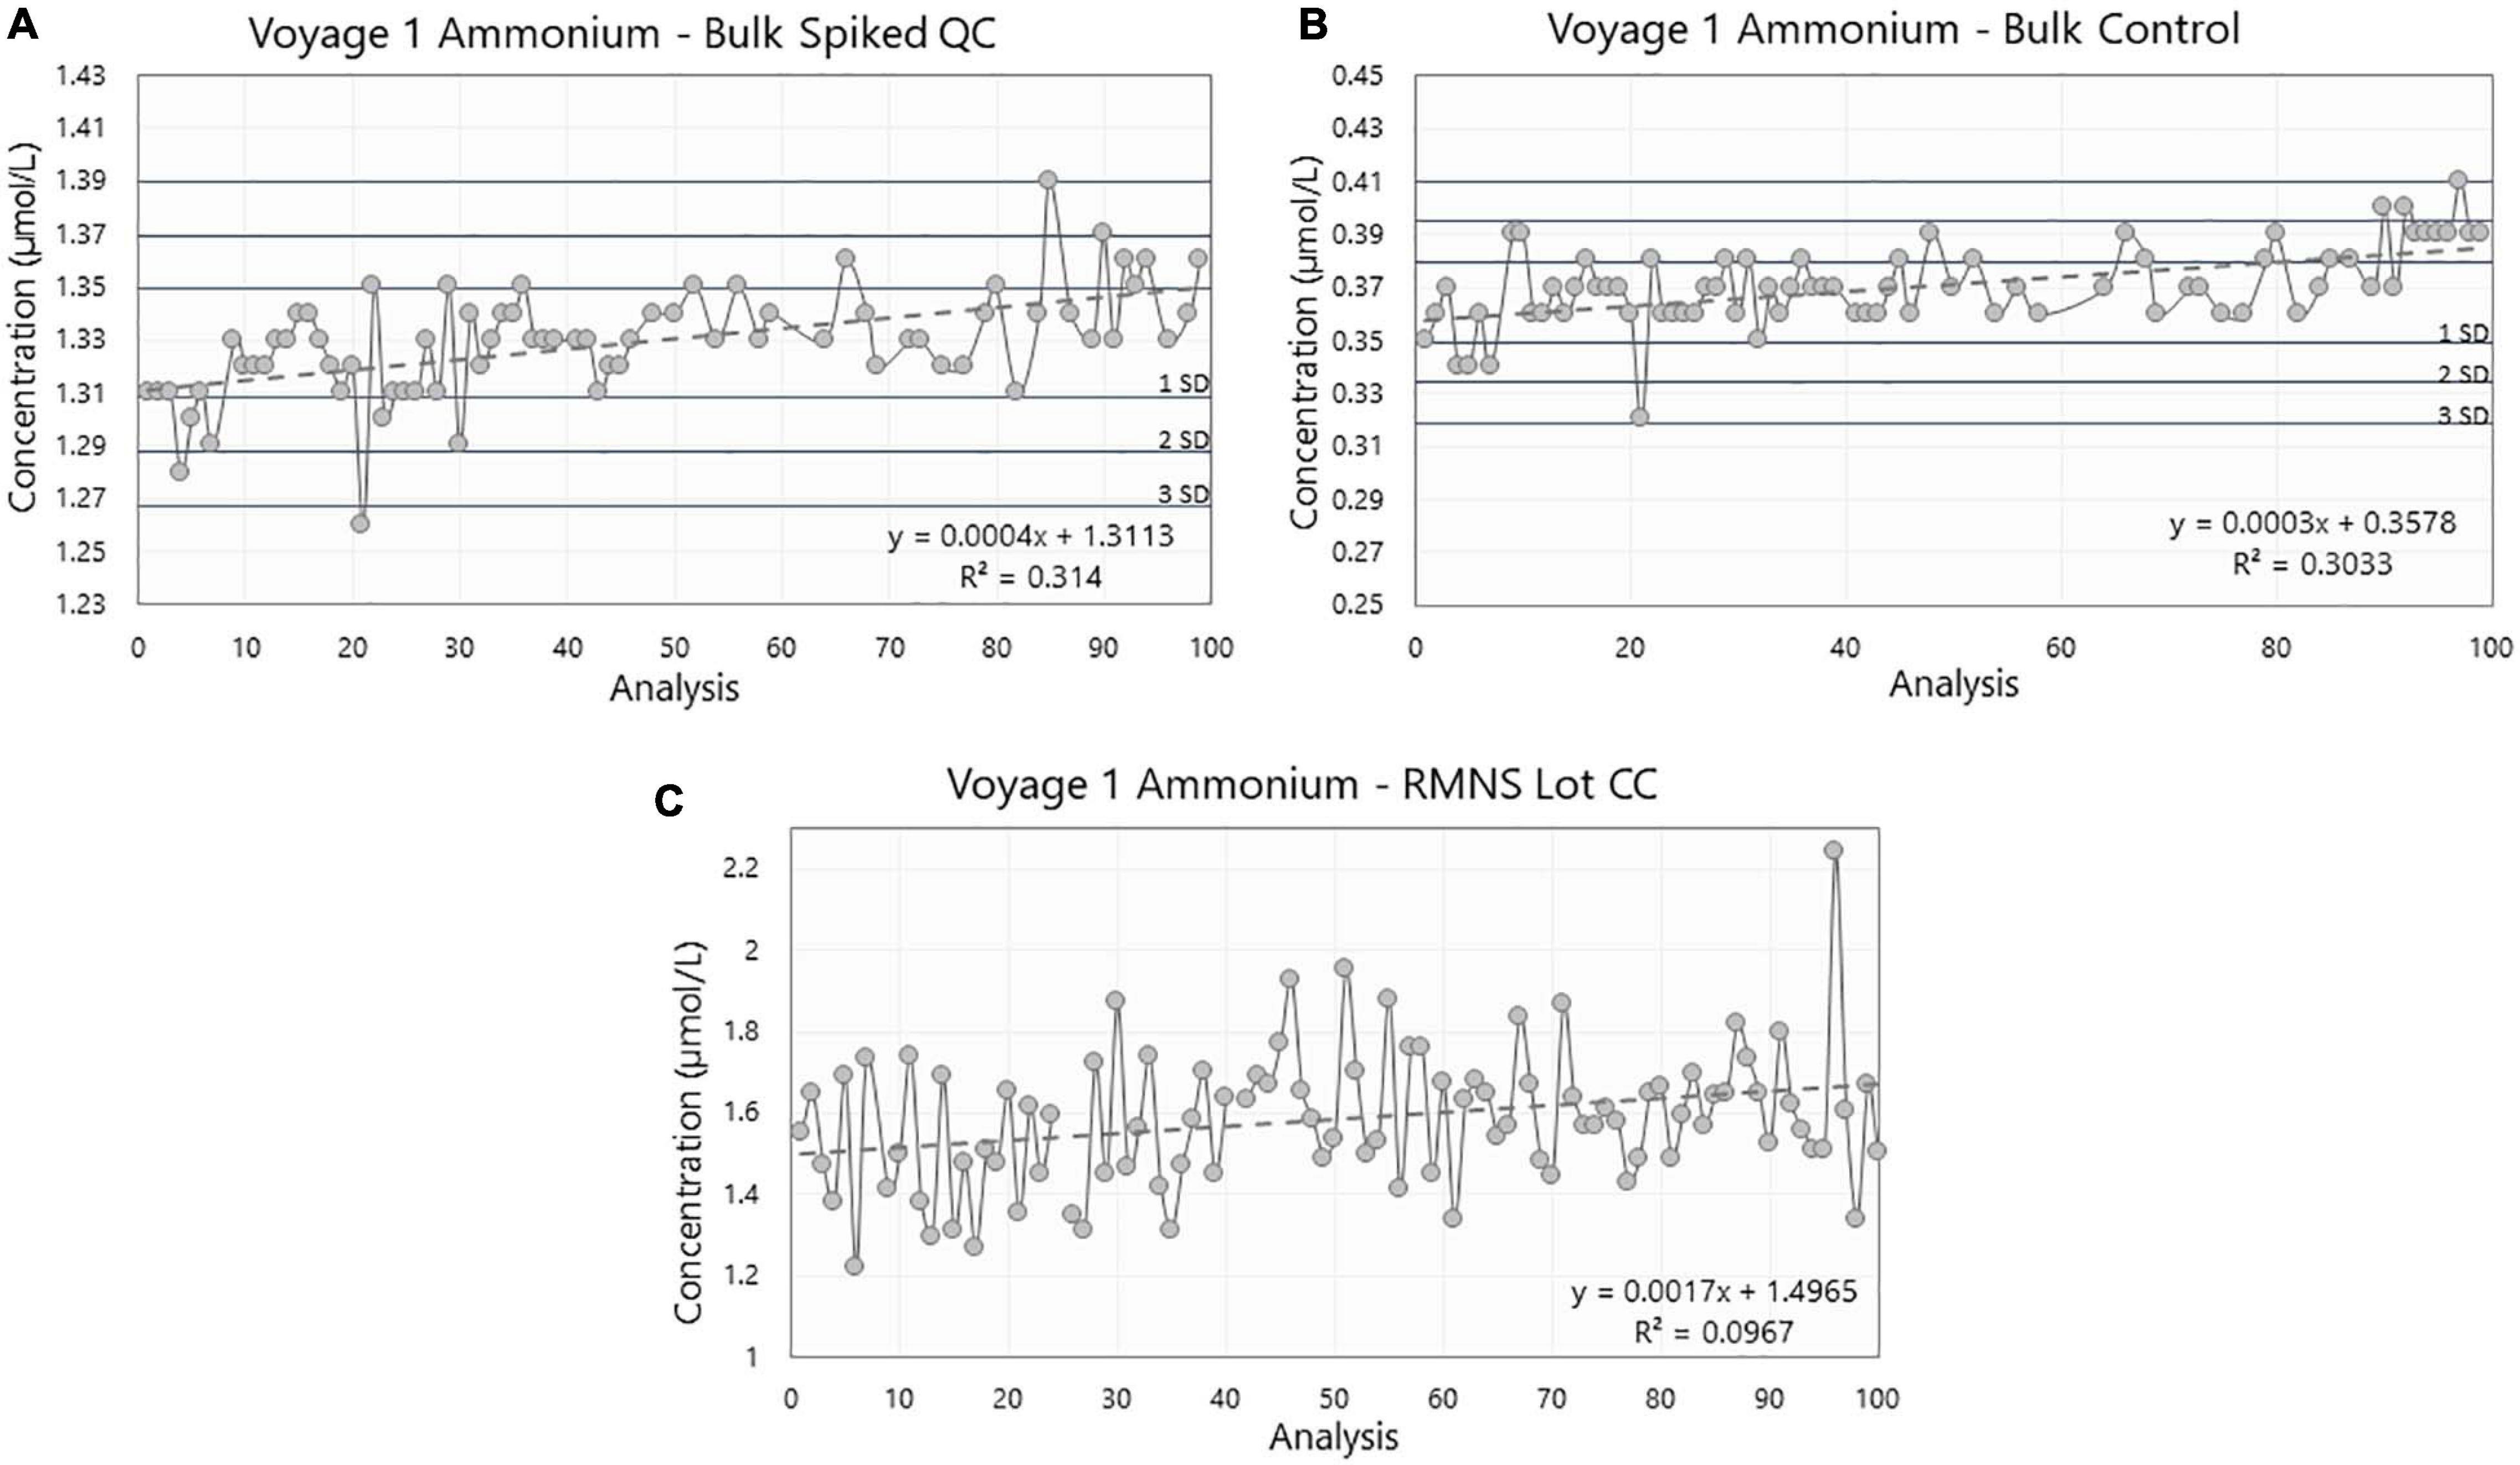
Figure 7. Ammonium concentration (in μmol/L) in (A) the Spiked QC, (B) the Control, and (C) the reference material for nutrients in seawater (RMNS) lot CC during the voyage 1 on board the RV Investigator. Horizontal lines are the standard deviation (SD) multiplied by 1, 2, and 3 centered around the mean which act as QC limits.
Quality Control
During voyage 1, the measured ammonium concentration in the Spiked QC ranged from 1.26 μmol/L to 1.39 μmol/L with a mean concentration of 1.33 ± 0.02 μmol/L (n = 74) and CoV of 1.53%. The Control measured ammonium from 0.32 μmol/L to 0.41 μmol/L with a mean concentration of 0.37 ± 0.02 μmol/L (n = 76) and CoV 4.08% (Figures 8A,B; Table 1). Thus the precision based on these standard deviations was constant in absolute terms and did not vary with the calibration solution concentrations.
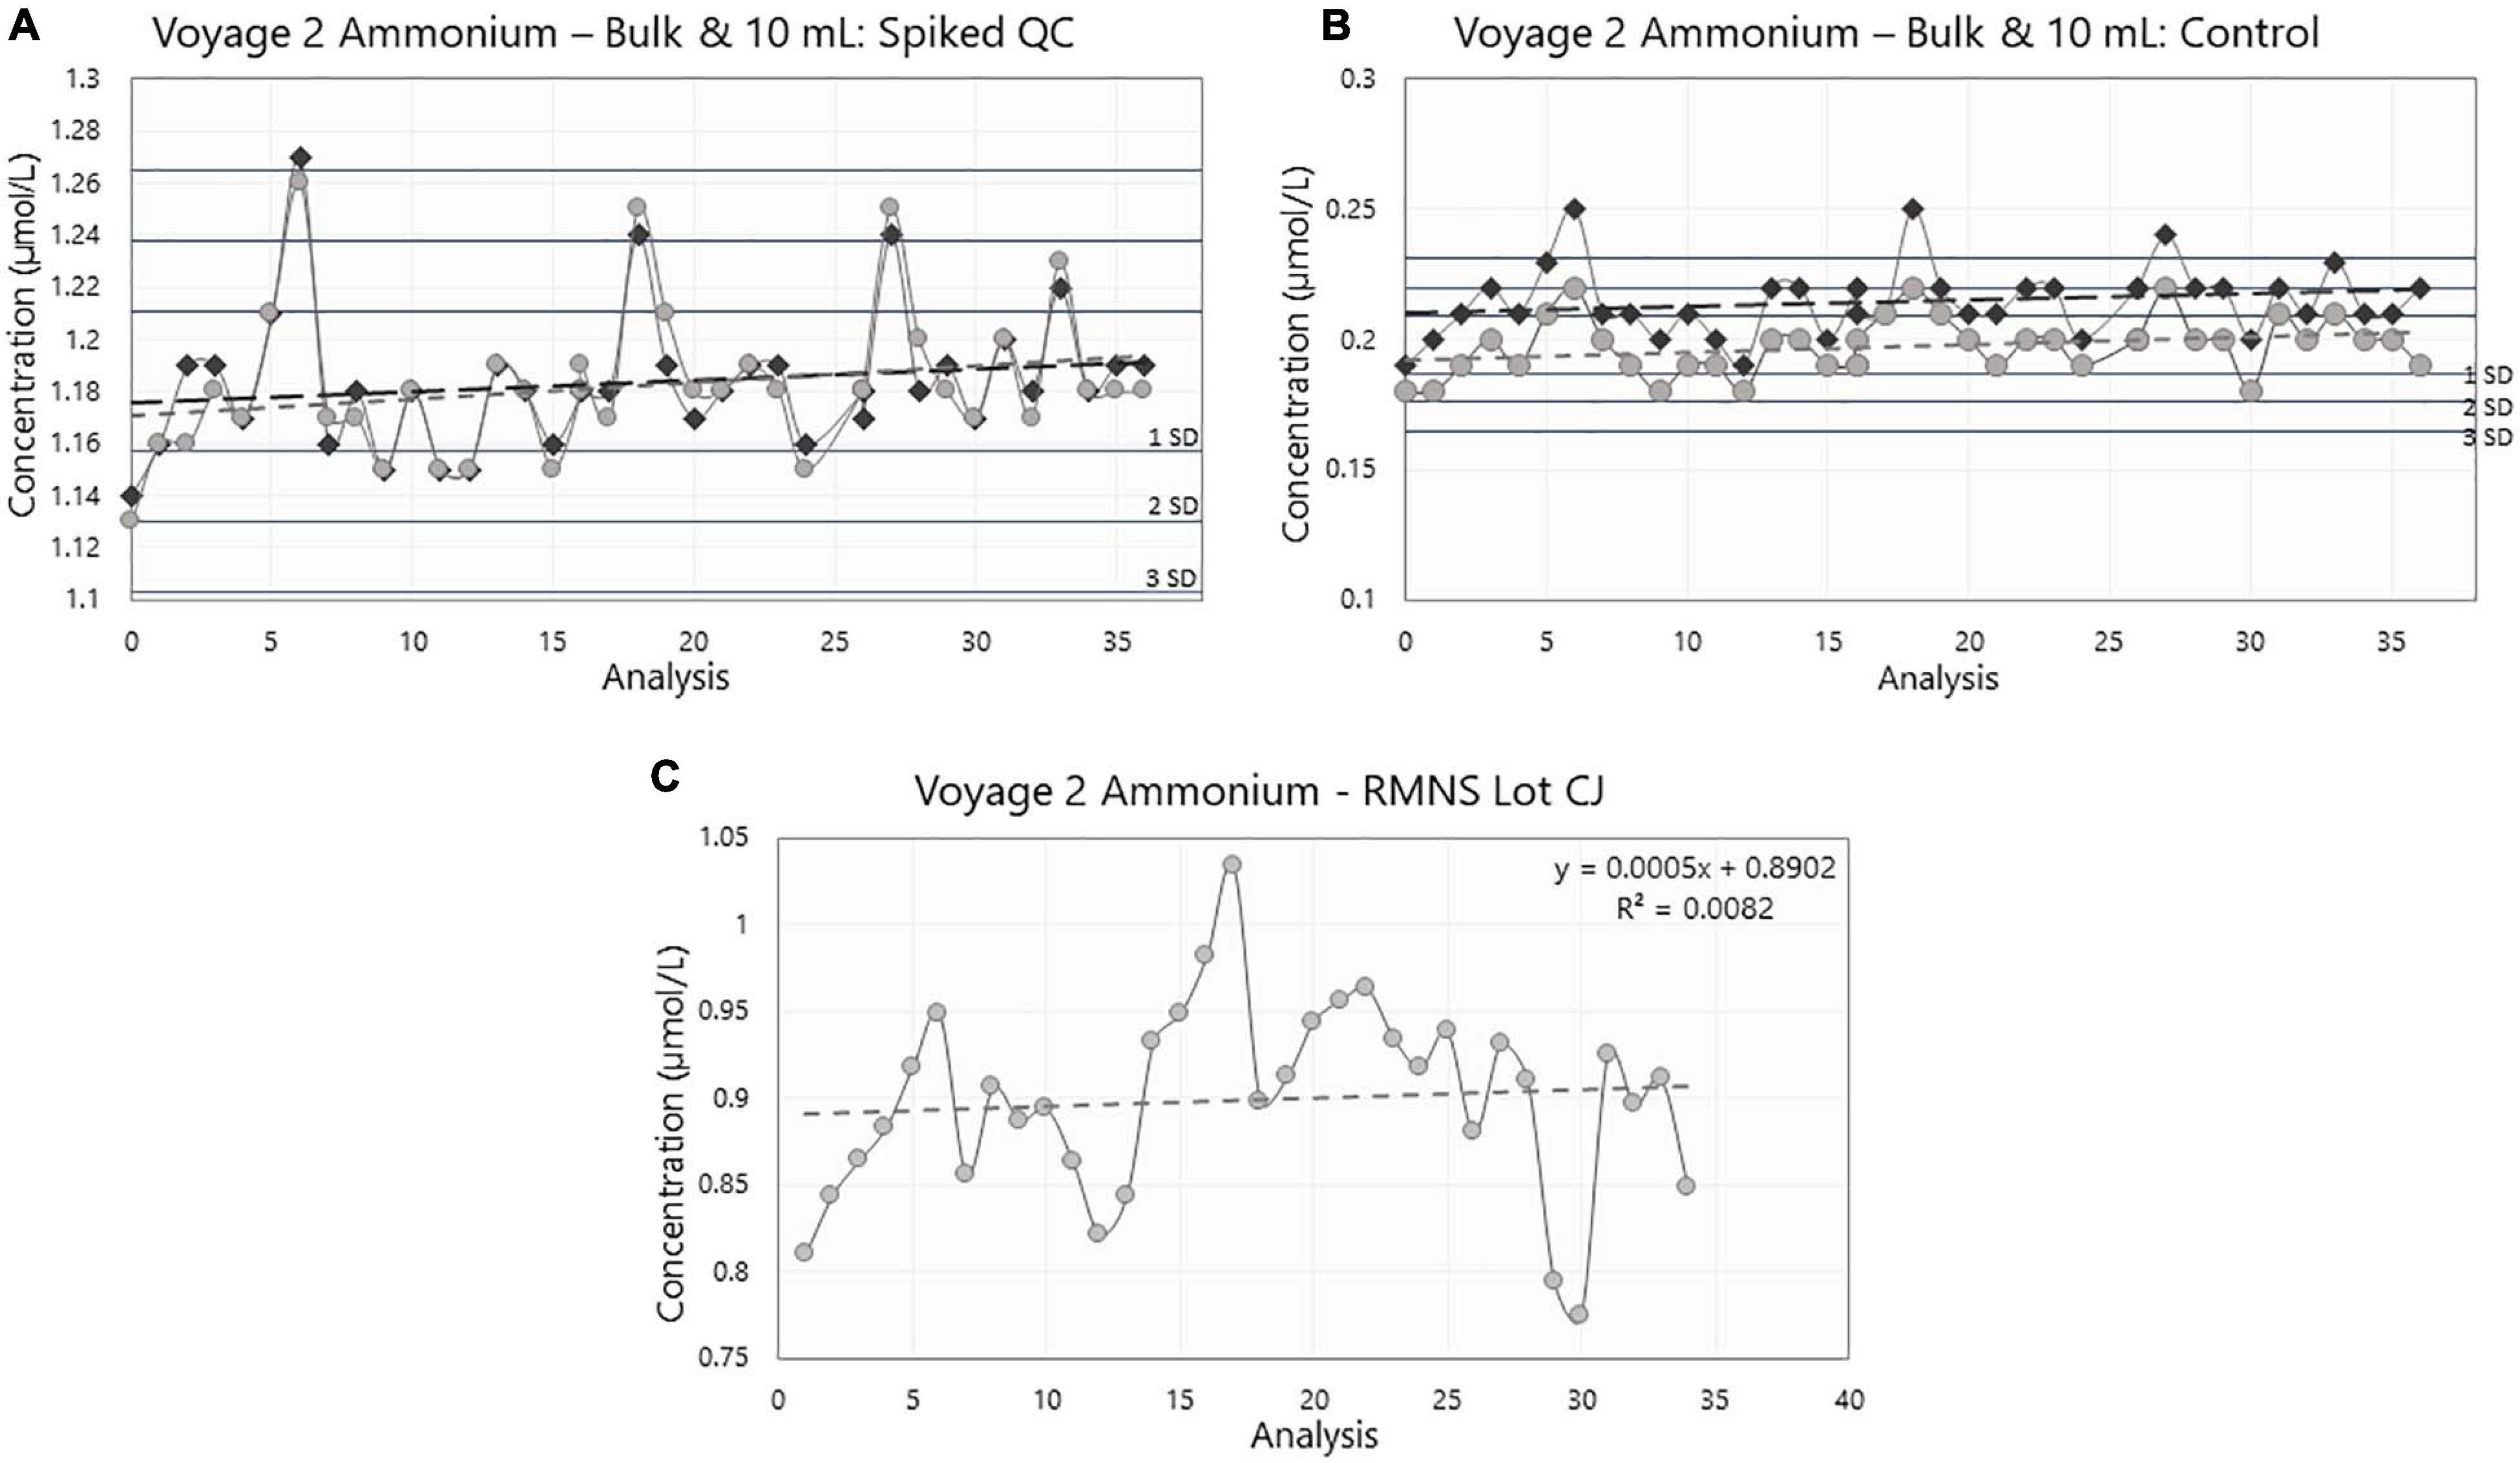
Figure 8. Ammonium concentration (in μmol/L) in (A) the bulk (dark gray) and 10 mL (light gray) Spiked QC, (B) the bulk (dark gray) and 10 mL (light gray) Control, and (C) the reference material for nutrients in seawater (RMNS) lot CJ during voyage 2 on board the RV Investigator. Horizontal lines are the standard deviation (SD) multiplied by 1, 2, and 3, centered around the mean acting as QC limits. For the charts with both the Bulk and 10 mL results, the lines are centered around the 10 mL mean.
The Spiked QC showed a range of 0.13 μmol/L over 36 analytical days and was found to have a statistically significant slope coefficient (R2 = 0.314, p < 0.001, Figure 8A). A similar result was also observed for the Control (R2 = 0.303, p < 0.001, Figure 8B). These correspond to an increase in the ammonium concentration of 1.1 × 10⁻³ μmol/L per day for the Spiked QC and 0.8 × 10⁻³ μmol/L per day for the Control. Possible causes of this drift are detailed in the Discussion.
The difference between the mean Spiked QC and mean Control was 0.96 ± 0.02 μmol/L (n = 74) which is comparable to the theoretical concentration of 1.00 ± 0.05 μmol/L.
The expanded measurement uncertainty (k = 2, precision) was calculated based on the QC across the voyage and found to be 0.10 μmol/L at ammonium concentration of 1 μmol/L.
Voyage 2
CTD Bottle Data
The ammonium concentrations measured during voyage 2 ranged from below detection limit (<0.02 μmol/L) to 0.61 μmol/L (n = 626). Detailed nutrients data from this voyage can be found online https://www.marlin.csiro.au/geonetwork/srv/eng/search#!604e1 04f-36ad-4f63-b8ac-8b1a3043f634 (data accessed on 10.07.2020).
Analytical
Similar to results from voyage 1, the measured LLPC calculated for each individual run was below 0.02 μmol/L. The baseline and sensitivity drift were both below 2.5% in each run during the entire duration of the voyage, well under the recommended maximum drift of 5% (as per manufacturer specifications).
Sample Collection
The duplicate samples showed good consistency. They were all below the method LLPC (0.02 μmol/L) and generally below 0.005 μmol/L except for run 5 which is just under 0.01 μmol/L (Figure 7).
Quality Control
During voyage 2, the measured ammonium concentration in the bulk Spiked QC’s for samples decanted pre analysis ranged from 1.15 μmol/L to 1.27 μmol/L (mean ± std = 1.18 ± 0.02 μmol/L, n = 39); and 1.15 μmol/L to 1.26 μmol/L (mean ± std = 1.18 ± 0.03 μmol/L, n = 39) for the samples stored in the 10 mL PP tubes. The ammonium concentration in the bulk Control ranged from 0.19 μmol/L to 0.25 μmol/L (mean ± std = 0.22 ± 0.01 μmol/L, n = 39). Minimum ammonium concentration in individual 10 mL PP tubes was 0.18 μmol/L and maximum concentration was 0.22 μmol/L (mean ± std = 0.20 ± 0.01 μmol/L, n = 39) (Figures 9A,B and Table 1).
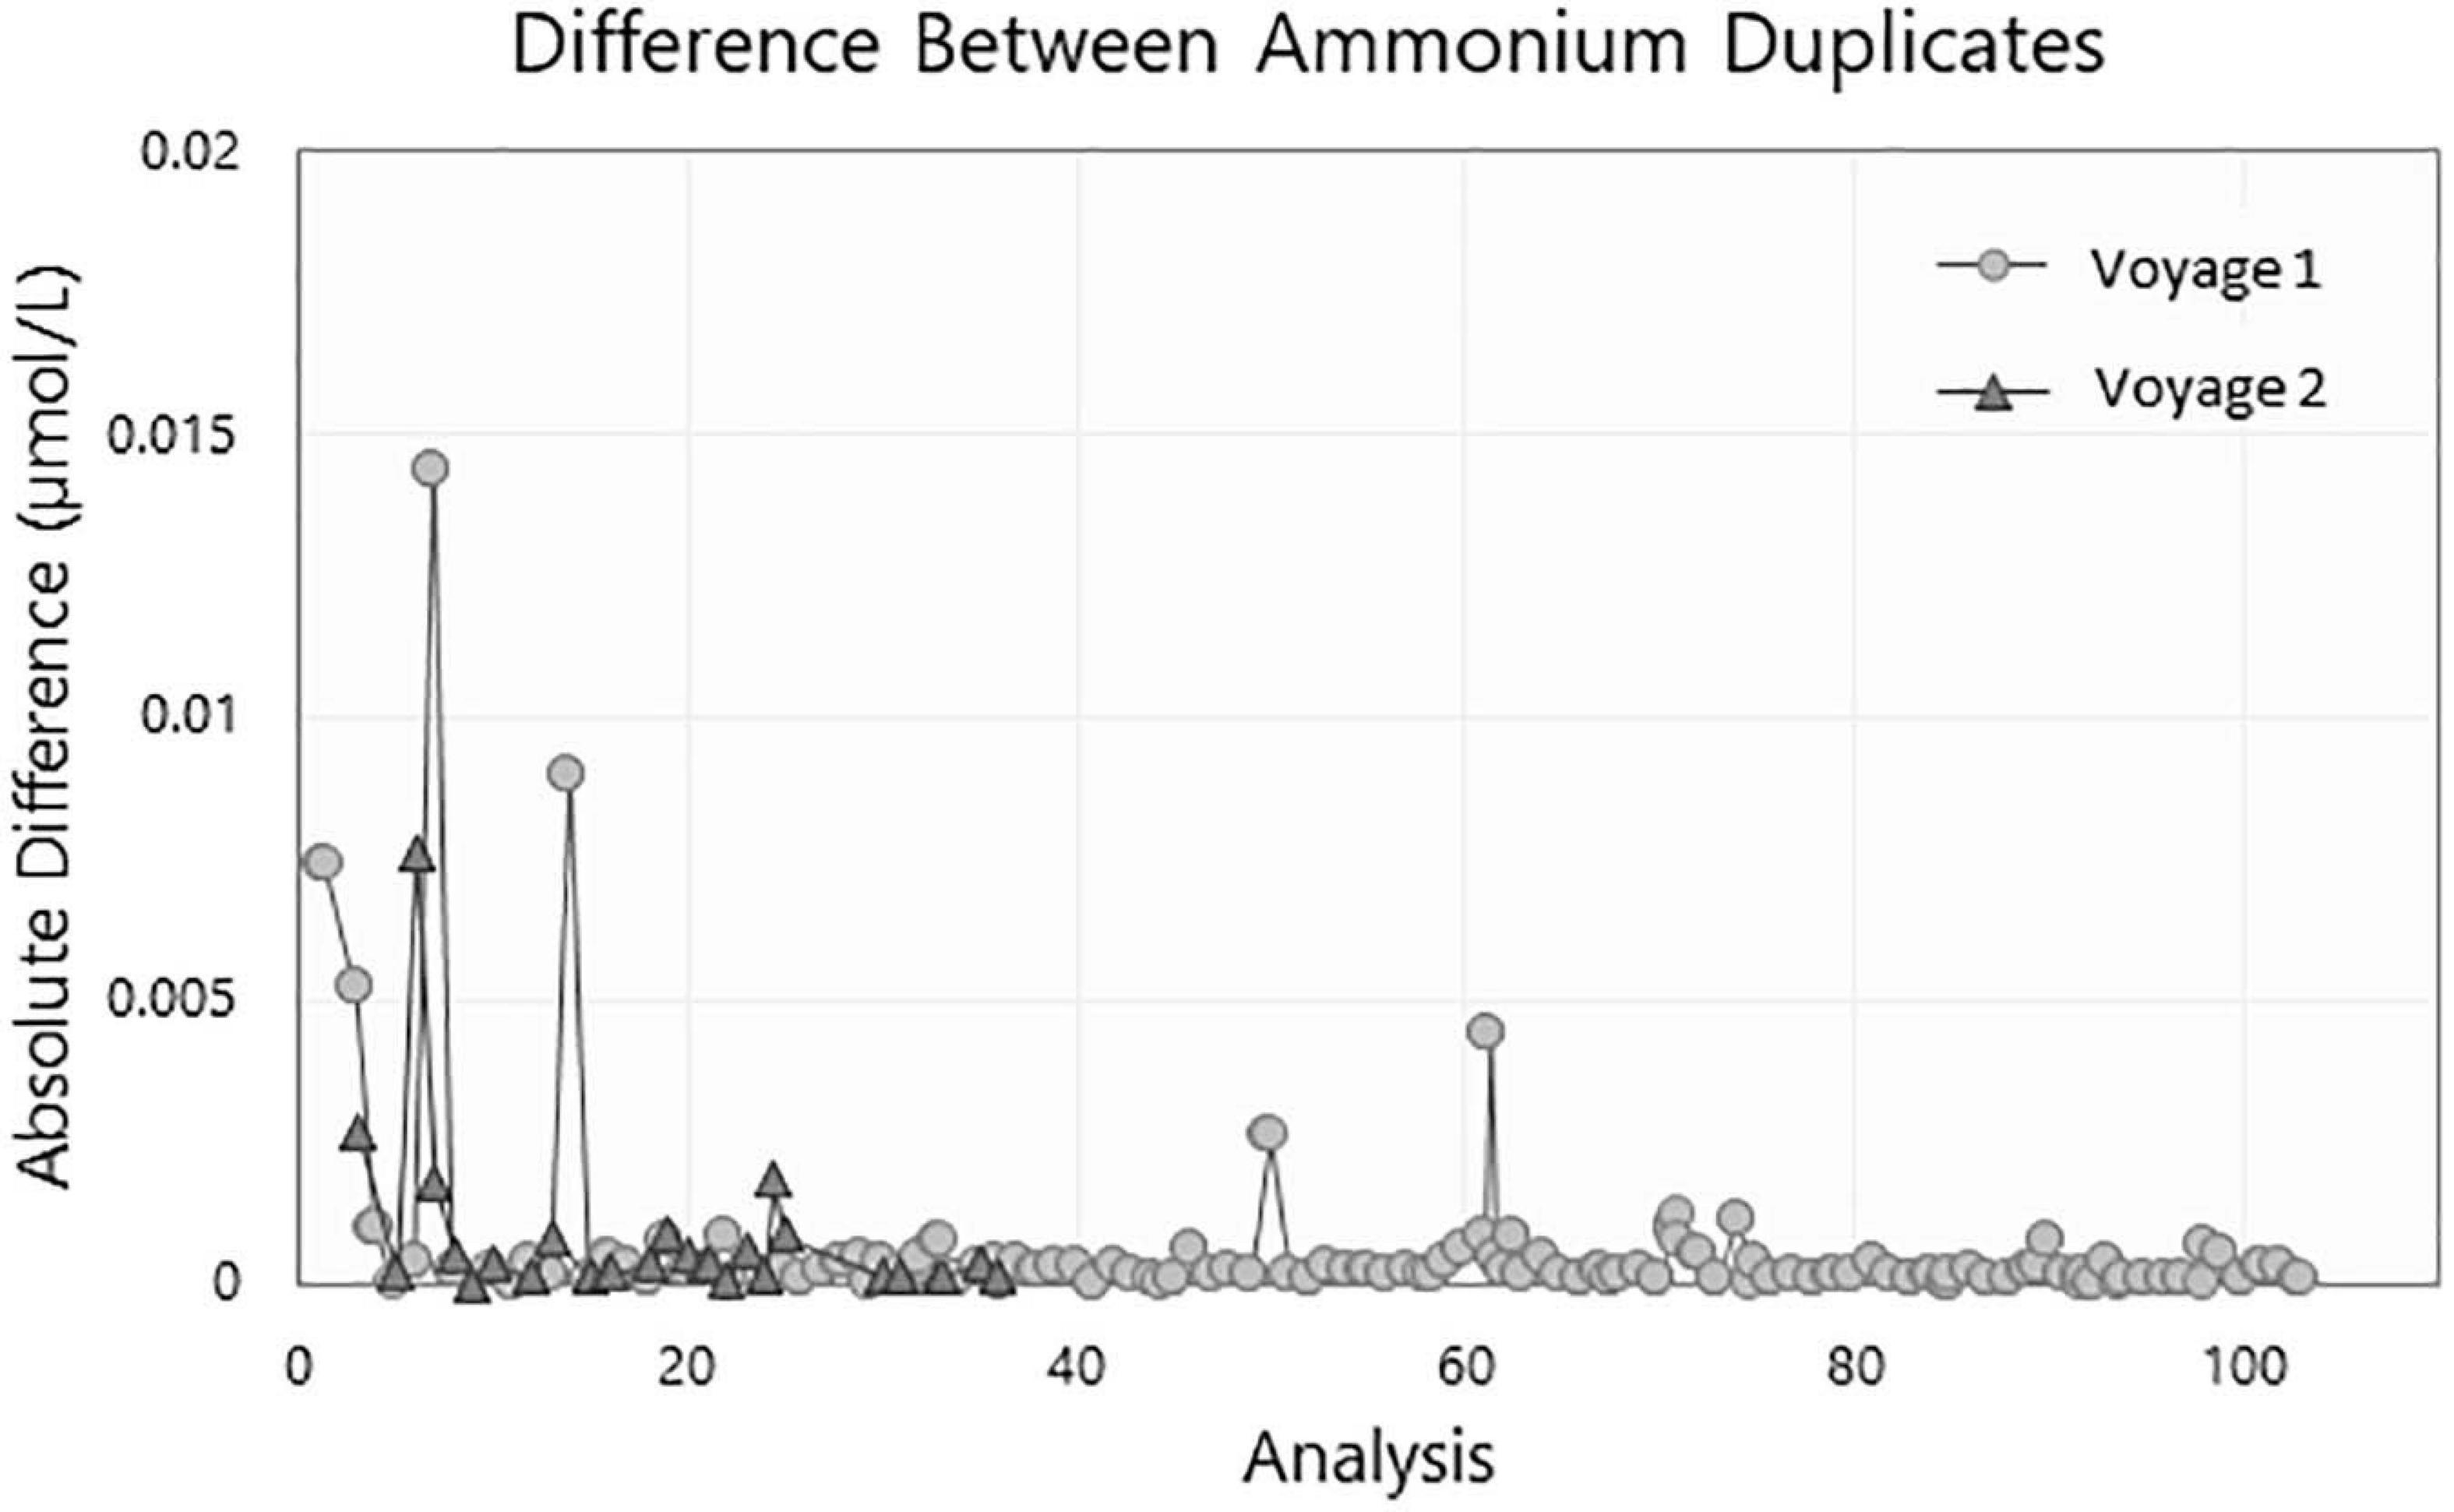
Figure 9. Difference of ammonium concentration in μmol/L between duplicate samples collected during voyage 1 (circle) and voyage 2 (triangle).
Results from the 10 mL Spiked QC and the 10 mL Control (Spiked: R2 = 0.027, p = 0.32; Control: R2 = 0.043, p = 0.20) and in bulk (Spiked: R2 = 0.016, p = 0.45; Control: R2 = 0.013, p = 0.50) during voyage 2 did not show a statistically significant trend in the data set. The internal QC’s were measured over 23 consecutive days during the voyage.
Variances in the measured concentrations between voyage 2 bulk storage and voyage 2 10 mL (Table 1) were not significantly different, this result was true for both the Spiked QC (F38,38, p = 0.314) and the Control (F38,38, p = 0.127).
Between the two storage mediums, the one-tail t test shows that mean measured concentrations were significantly different for the Controls (t = 6.68, df = 76, p < 0.001), with the bulk storage method having a greater mean concentration than that of the 10 mL sample tubes. However, for the Spiked QC’s there was not a significant difference between the bulk and the 10 mL sample tubes (t = 0.13, df = 76, p = 0.447).
The difference between the mean bulk Spiked QC and mean bulk Control was 0.97 ± 0.01 μmol/L (n = 39); and the 10 mL Spiked QC and the Control was 0.99 ± 0.02 μmol/L (n = 39) which are similar to the theoretical concentration of 1.00 ± 0.05 μmol/L.
The calculated expanded measurement uncertainty (k = 2, precision) based on the QC across the voyage was 0.09 μmol/L at ammonium concentration of 1 μmol/L.
RMNS
The mean ammonium concentration in the RMNS lot CC during voyage 1 was 1.59 ± 0.17 μmol/L (n = 100), the minimum was 1.22 μmol/L and the maximum was 2.24 μmol/L. The mean ammonium concentration in the RMNS lot CJ used during voyage 2 was 0.9 ± 0.06 μmol/L (n = 34) the minimum was 0.77 μmol/L, and the maximum was 1.03 μmol/L. Figure 8C shows that for voyage 1 there was a statistically significant (p = 0.005) upward trend for the RMNS. During voyage 2 no statistically significant (p = 0.61) change was observed (Figure 9C). However, the RMNS data was very scattered (Figure 10B) and there were limited observations which may have reduced or masked any statistical significance. Figures 10A,B. shows the median and the spread of the data for all Controls, Spiked QC’s and RMNS for both voyages. The internal QC’s prepared in the laminar flow had a smaller spread of data compared to the QC’s made in the open laboratory. The smaller spread was observed in the 10 mL Spiked QC made prior to voyage 2.
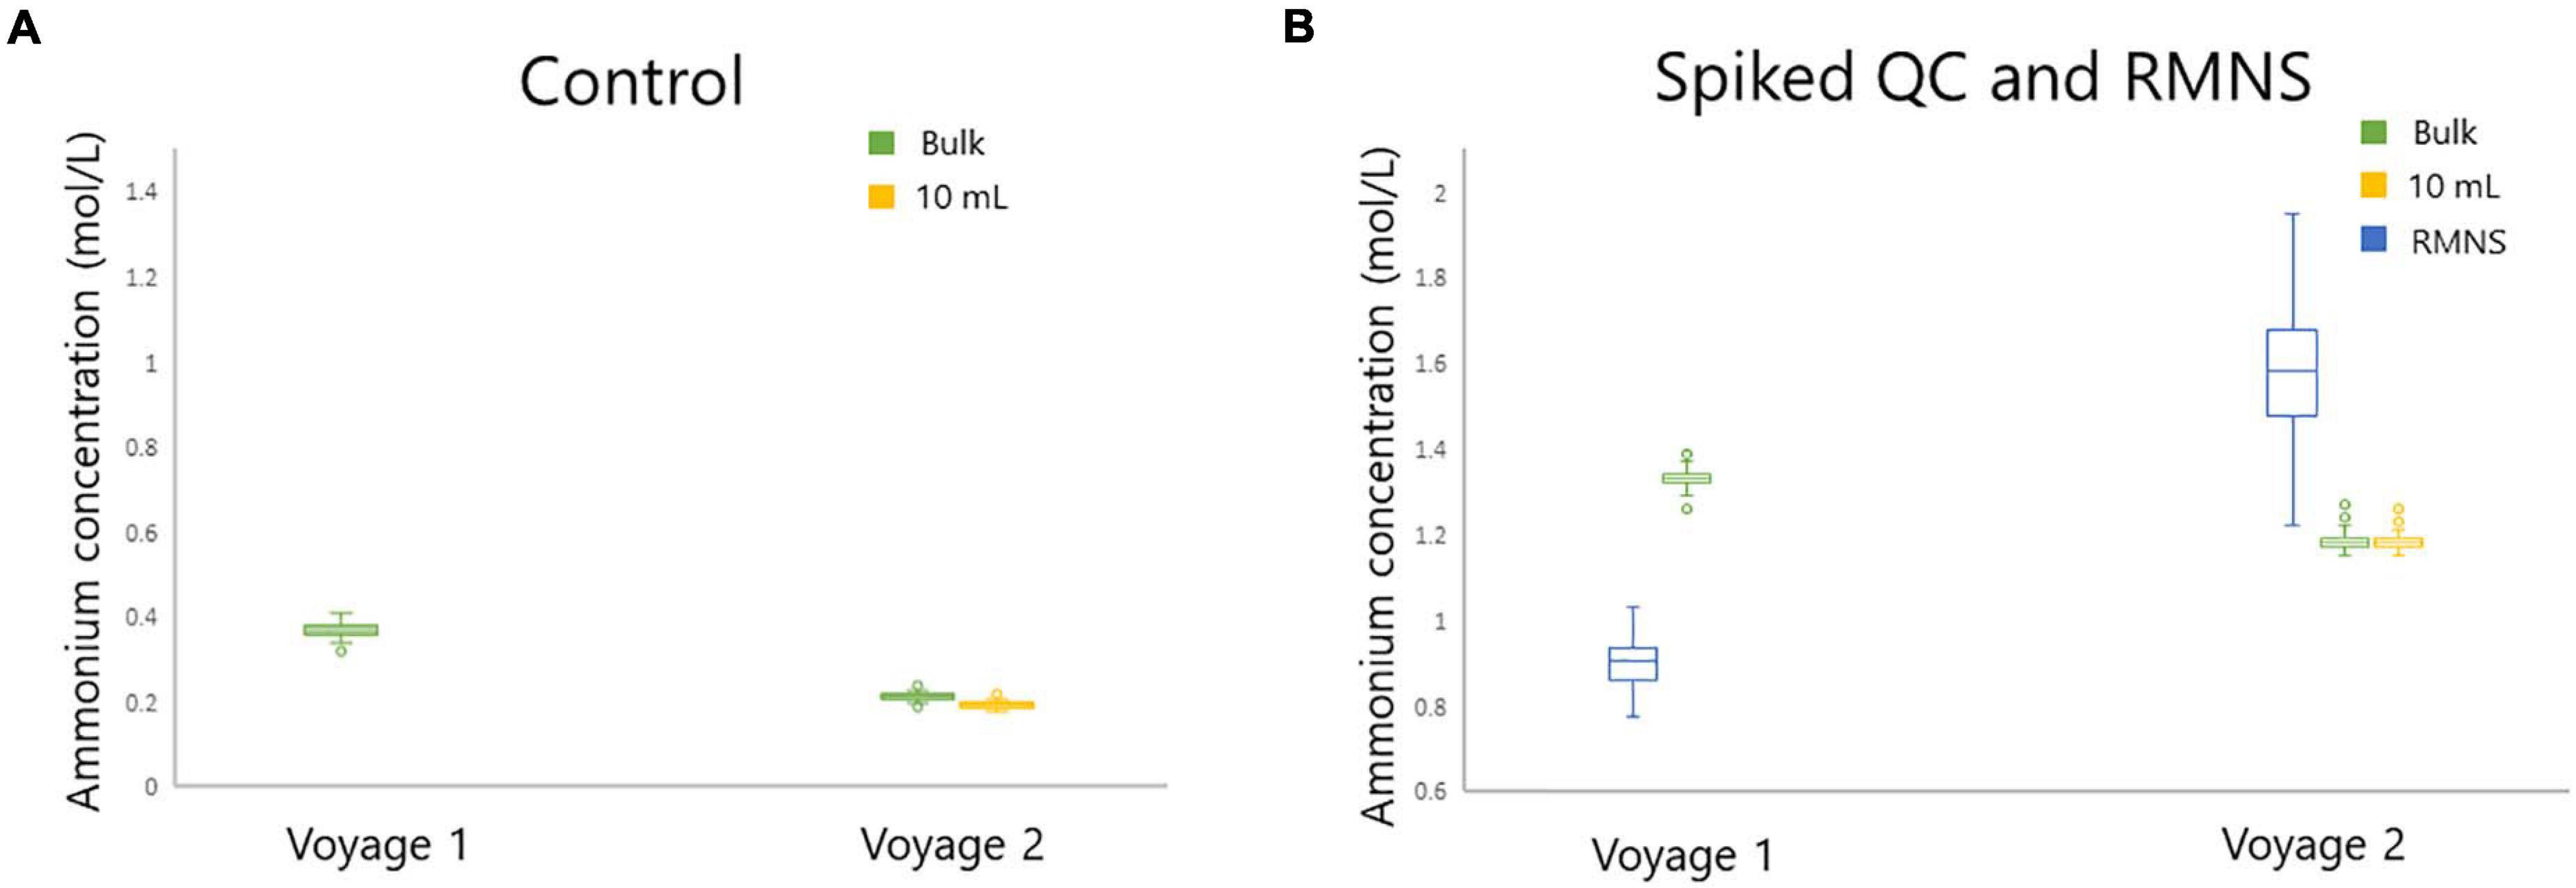
Figure 10. Standard box plot of the ammonium concentration (in μmol/L) for (A) the Control for bulk (green) and 10 mL (yellow) and (B) RMNS (blue), and the bulk Spiked QC (green), and 10 mL Spiked QC (yellow) during voyage 1 and voyage 2 on board the RV Investigator. Outlier points as shown as (○).
Discussion
Parallel Analyses
The continuous and near real time measurement of ammonium while at sea is invaluable to obtaining an accurate, instant picture of nutrient budgets. To achieve this on every run during a long oceanographic voyage in parallel with other macro-nutrients, it is essential to have a robust method from sample collection all the way to data processing and statistical analysis. This paper describes a comprehensive ammonium method expanding on current laboratory techniques to ensure reproducibility and reduce opportunity for contamination while at sea. All ammonium measurements described in this study were made while running the four other major macro-nutrients [nitrate + nitrite, nitrite, silicate, and phosphate, as described in Rees et al. (2019)] on the AA3.
Sample Collection to Analysis
Sources of ammonium contamination can come from air supplied to the laboratory with ammonium-based cleaning products, cigarette smoke or other exhaust fumes inadvertently pumped into the laboratory (Aminot et al., 1997). Also, within the laboratory itself, the reagents used to determine other nutrients can be a source of atmospheric ammonium contamination. For example, phosphate and silicate analysis require acidified ammonium molybdate, and nitrate analysis uses ammonium chloride buffer (Aminot et al., 1997). The controls implemented in this study proved successful as the baseline and sample drift remained low (<2.5%) and consistent agreement between duplicate samples.
Sample volume itself can contribute to contamination, as smaller volumes have a greater surface area to volume ratio that will remain in contact with the atmosphere for some time. Aminot et al. (1997) suggest not using a sample volume of less than 40–50 mL, and that transferring into smaller cups for the auto-sampler can be a significant source of contamination due to the extra handling. The nutrient samples in this study were collected in 50 mL HDPE sample bottles that were acid washed and reused. The custom rack that fits onto the auto-sampler tray removed the need to decant samples. This minimized handling of the samples.
Instrument
The debubbler and dilution lines as suggested by the manufacturer for the AA3 setup were removed as a good bubble pattern was possible without. This holds true for all 5 nutrient channels. The addition of a 10-turn coil to the manifold post heater (Figure 1) to allow the solution to cool slightly before entering the fluorescence detector resulted in better peak shape.
The ultra-pure deionized water which is used as the baseline during analysis can also become easily contaminated. Contamination is recognized on the analysis trace when LNSW samples or deep ocean samples are analyzed and the sample peaks become a dip below the baseline, the resulting concentration is calculated as a negative value. Baseline contamination can come from either filling the reservoir and letting it stand in the laboratory for too long prior to being used, or from the wash-pot, where the sample probe returns between each sample. The flowrate of the wash pot flush set to approximately 10–12 mL per minute ensureed fresh ultra-pure deionized water was introduced between each cup. The air for segmentation and the OPA working reagent were scrubbed of ammonium by bubbling through a 10% (v/v) sulfuric acid solution. These prevented the baseline from becoming contaminated during both voyages.
The cleaning sequence introduced at the end of every analytical run to strip excess borate from the glass tubing was found critical to eliminating partial blockages in the heater and coils post heater. Partial blockages will cause a change in peak timing, peak heights and peak shape which can be intermittent across a run, difficult to identify, and can lead to poor reproducibility.
Evaluation of the Run Performance
In the absence of a commercially available CRM, other parameters were used day to day to ensure the precision, reproducibility, and overall quality of the analytical runs. The baseline, sensitivity drift and the LLPC were utilized as indicators of the quality of a run. The drift for both the sensitivity and the baseline was below 2.5% and a low reproducible LLPC (<0.02 μmol/L) was achieved in every run. The modifications made to the original method was deemed to be robust and repeatable based on the consistency of the results. The effectiveness of the sampling protocols in reducing contamination was assessed with the duplicate samples. The small difference between duplicate samples (typically < 0.02 μmol/L, Figure 7) illustrates the absence of ammonium contamination during both the sampling and analytical process.
Internal QC Assessment
Voyage 1
The internal QC was produced to be independent from the working calibration solutions to try and validate accuracy of analyses and determine the error associated with the measurement. Prior to these voyages the hydrochemistry team at CSIRO did not routinely determine the consistency of ammonium measurement across a voyage, unlike other macro-nutrients where a commercially available CRM is consistently analyzed. The control limits imposed on the commercially available CRM are set using 1, 2, and 3% of the certified value, along with the CRM’s reported expanded uncertainty. The measurement aims to return the certified value within 1% while results greater than 3% indicate an issue with the analysis. The first internal QC and Control produced prior to voyage 1, indicates good accuracy of measurement and manufacture. This is supported by the difference between measured means of the Spiked QC and the Control being 0.96 ± 0.02 μmol/L, acceptably similar to the intended manufactured concentration of 1.00 ± 0.05 μmol/L.
A more traditional quality control chart approach of 1, 2 and 3 times the standard deviation of the mean for assessing the criteria of acceptance was used over the voyage (Figures 8A,B). This worked well with all results coming within the 3 standard deviations of the mean (0.06 μmol/L) except on two occasions. The calculated measurement uncertainty for this voyage was 0.10 μmol/L, which was greater than the 3 times the standard deviation of the mean indicating good measurement precision during the voyage. This approach for controlling the quality of the data works well. However, there was an observed statistically significant upward trend in ammonium concentration (Figures 7A,B) over the duration of voyage 1 in both the Spiked QC, and the Control. This was further investigated during Voyage 2 where QC’s were stored in two different type of containers.
Voyage 2
The difference between the measured means of the bulk Spiked QC and bulk Control QC of two container types were comparable to the intended manufactured concentration of 1.00 ± 0.05 μmol/L, indicating the analysis was accurate. The comparison between the different storage containers, bulk 1 L (decanted into 10 mL tubes just prior to analyses) and 10 mL PP sample tubes (made at the time of internal QC manufacture), showed that the mediums had the same level of variation across the voyage for the Spiked QC and Controls. This indicates that the analysis during the voyage was consistent, and that one container type did not introduce more error than the other. This is further supported by the measured means of bulk Spiked and 10 mL Spiked samples not being statistically significantly different. However, ammonium concentration in the bulk Control and 10 mL Control sample tubes showed slight, but statistically significant, different means, with the bulk having a higher mean concentration (Table 1). This may be due to the Controls having such low ammonium concentrations such that when the bulk 1 L container was opened multiple times and decanted into 10 mL sample tubes before analysis, the container became contaminated from the atmosphere. Whereas the 10 mL sample tubes were only opened once and used immediately by placing into the tray on the auto sampler. Any slight difference in the concentration of the means for the Spiked QCs might have been masked by the higher concentration.
Following the same quality control chart style (Figures 9A,B) described in voyage 1, the 10 mL Spiked QC was never out of statistical control limits. However, the bulk Spiked QC was outside the limits once and on two occasions bordered on the upper control limit. The calculated measurement uncertainty for this voyage was 0.09 μmol/L, which is consistent with the 3 times the standard deviation of the mean for the 10 mL Spiked QC.
Trends Over Voyages
While the cause of the upward trend during voyage 1 is unknown it could be attributed to several scenarios: (1) contamination during the manufacturing process, (2) accumulative atmospheric contamination caused by opening the containers a number of times during the voyage, (3) unidentifiable instrument drift over time, or (4) loss of sensitivity in calibration solution or reagent across the voyage. The RMNS also showed a similar trend during voyage 1, which supports previous observations from KANSO. This also suggests similar factors are affecting the internal QC’s and the RMNS analysis during the voyage. To date the reasons for this trend are unknown and this requires further investigation. The preparation of the QC’s under a laminar flow cabinet was an important step which reduced the spread of the measurements, as is shown in Figures 10A,B.
Manufacture of Internal QC
The main problem with manufacturing nutrient QC’s is that nutrient concentrations are unstable in unpreserved seawater due to microorganisms consuming or producing nutrients, and should be removed (Aminot and Kérouel, 1991). Mercuric Chloride (HgCl2) is commonly used as a preservative (e.g., The Royal Netherlands Institute for Sea Research (NIOZ), Scripps Institution of Oceanography, Becker et al., 2020). However, the use of HgCl2 is not ideal as it is hazardous to human health and the subsequent release of waste solutions containing mercury lead to chemical pollution of the environment (Aoyama et al., 2012), therefore its use should be avoided if possible. The technology of autoclaved seawater to manufacture nutrient CRM’s in seawater is well developed (e.g., Aminot and Kérouel, 1991, 1995; Ota et al., 2010). However results from the RMNS indicate the ammonium is unstable within the PP bottles or becomes contaminated during the manufacturing process, hence the reason to manufacture short-term in-house QC’s. The manufactured internal Spiked QC’s were homogeneous, made with natural seawater as sample matrix, not hazardous to humans or the environment and independent from primary standards. Further studies are required to determine the long-term stability of this approach and its potential use as a method for in-house preparation of an ammonium reference material.
Measurement Uncertainty
Results from the internal QC’s together with other data (described in the methods) did allow for calculation of measurement uncertainty for each voyage, which accounted for systematic and random errors within the analytical process (Hovind et al., 2011). However, the measurement uncertainty does not contain errors associated with bias or sampling. Without a certified reference material bias cannot be determined. In future to determine errors associated with sampling it would be best to collect multiple samples at the same depth. The chlorophyll max is ideal as ammonium concentrations within the open ocean are at the highest concentration in this location.
Ammonium Measurement During Voyages
Assuring quality in the ammonium measurements taken on an oceanographic cruise can be quite difficult. The introduction of the QC provided good framework to assess the accuracy and precision of the data and a mean for calculating MU, which are all required for robust measurements. The shipboard protocols implemented ensured that sample integrity remained intact. Moreover, confidence in the sample integrity has been ensured, both with the measurement of a sampling duplicate, and the fact deep water samples (>500 m) are consistently measured as below the detectable limit. Use of an appropriate calibration range also maintained the highest degree of accuracy for samples collected throughout the whole water column. Consequently, the methods, processes and protocols implemented in this paper culminate to provide very high-quality shipboard measurements of ammonium, that are not only robust but also repeatable.
Conclusion and Recommendations
The modifications to the analytical method along with the precautions taken for sample collection, handling and cleanliness of the segmented flow system between runs, combined with the improved tray protocol minimized the contamination of samples, significantly reduced the baseline and sample drift. Overall this allowed for robust measurements of ammonium in parallel with silicate, NOx, phosphate and nitrite during two voyages. In addition to that, the regular measurement of the in-house QC provides a robust method to check accuracy of the analysis. The data presented here demonstrates the internal QC solution prepared just prior to a voyage inside a laminar flow cabinet and directly stored into 10 mL PP tubes provides the most stable short-term measurement ensuring accuracy of the method for at least 30 days.
Data Availability Statement
The datasets presented in this study can be found in online repositories. The names of the repository/repositories and accession number(s) can be found in the article/supplementary material.
Author Contributions
CR, JJ, KS, PH, and CS performed conception and design, analysis and/or interpretation of data, and drafting and critically revising significant parts of the work. ST, MM, JM, and AC performed analysis and/or interpretation of data, and drafting and critically revising significant parts of the work. AM performed conception and design, and drafting and critically revising significant parts of the work. All authors contributed to the article and approved the submitted version.
Conflict of Interest
The authors declare that the research was conducted in the absence of any commercial or financial relationships that could be construed as a potential conflict of interest.
Acknowledgments
The authors would like to thank all those who have assisted the team in its efforts, the crew from the RV Investigator, all the PI’s from in2018_v01 and in2018_v04: Dr. Steve Rintoul, Dr. Michael Elwood, and Dr. April Abbott. Ship time for in2018_v01 and in2018_v04 onboard the RV Investigator was funded by the Marine National Facility. All data collected and made publicly available by the Marine National Facility (Marlin, http://www.marlin.csiro.au/geonetwork/srv/eng/search#fast=index&from=1&to=10&sortBy=changeDate&hitsperpage=10). The authors would also like to thank Tom Trull and Robert Kay for thoroughly reviewing the manuscript.
Footnote
References
Aminot, A., and Kérouel, R. (1991). Autoclaved sea water as a reference material for the determination of nitrate and phosphate in sea water. Anal. Chim. Acta 248, 277–283. doi: 10.1016/S0003-2670(00)80896-X
Aminot, A., and Kérouel, R. (1995). Reference material for nutrients in seawater: stability of nitrate, ammonia and phosphate in autoclaved samples. Mar. Chem. 49, 221–232. doi: 10.1016/0304-4203(95)00004-B
Aminot, A., Kirkwood, D. S., and Kérouel, R. (1997). Determination of ammonia in seawater by the indolphenol-blue method: evaluation of the ICES NUTS I/C 5 questionnaire. Mar. Chem. 56, 59–75. doi: 10.1016/S0304-4203(96)00080-1
Aoyama, M., Ota, H., Kimura, M., Kitao, T., Mitsuda, H., Murata, A., et al. (2012). Current status of homogeneity and stability of the reference materials for nutrients in seawater. Anal. Sci. 28, 911–916. doi: 10.2116/analsci.28.911
Ayoama, M., and Hydes, D. (2010). “How do we improve the comparability of nutrient measurements,” in Comparability of Nutrients in the World’s Ocean, eds E. M. S. Aoyama, M. Dickson, A. G. Hydes, D. J. Murata, A. Oh, J. R. Roose, et al. (Tsukuba, JP: Mother Tank), 1–10.
Becker, S., Aoyama, M., Woodward, E. M. S., Bakker, K., and Coverly, S. (2020). GO-SHIP Repeat hydrography nutrient manual: the precise and accurate determination of dissolved inorganic nutrients in seawater, using continuous flow analysis methods. Front. Mar. Sci. 7:581790. doi: 10.3389/fmars.2020.581790
Bianchi, M., Feliatra, F., Tréguer, P., Vincendeau, M. A., and Morvan, J. (1997). Nitrification rates, ammonium and nitrate distribution in upper layers of the water column and in sediments of the Indian sector of the Southern Ocean. Deep Sea Res. II Top. Stud. Oceanogr. 44, 1017–1032. doi: 10.1016/S0967-0645(96)00109-9
Brzezinski, M. A. (1987). Colorimetric determination of nanomolar concentrations of ammonium in seawater using solvent extraction. Mar. Chem. 20, 277–288. doi: 10.1016/0304-4203(87)90078-8
Eddy, F. B. (2005). Ammonia in estuaries and effects on fish. J. Fish Biol. 67, 1495–1513. doi: 10.1111/j.1095-8649.2005.00930.x
Ellison, S. L. R., and Williams, A. (Eds) (2012). Eurachem/CITAC guide: Quantifying Uncertainty in Analytical Measurements, Third Edition. ISBN 978-0-948926-30-3. Available online at: www.eurachem.org (accessed July 06, 2020).
Genfa, Z., and Dasgupta, P. K. (1989). Fluorimetric measurement of aqueous ammonium ion in a flow injection system. Anal. Chem. 61, 408–412. doi: 10.1021/ac00180a006
Goeyens, L., Tréguer, P., Baumann, M. E. M., Baeyens, W., and Dehairs, F. (1995). The leading role of ammonium in the nitrogen uptake regime of Southern Ocean marginal ice zones. J. Mar. Syst. 6, 345–361. doi: 10.1016/0924-7963(94)00033-8
Gordon, L. I., Jennings, J. C. Jr., Ross, A. A., and Krest, J. M. (1993). A suggested protocol for continuous flow automated analysis of seawater nutrients (Phosphae, Nitrate, Nitrite and Silicic Acid) in the WOCE hydrographic program and the joint global ocean fluxes study. WOCE Hydrographic Program Office Methods Manual WHPO 68/91, (Paris: WOCE Hydrographic Programme Office), 1–52.
Goyal, S. S., Rains, D. W., and Huffaker, R. C. (1988). Determination of ammonium Ion by Fluorometry or Spectrophotometry after On-Line Derivatization with o-Phthalaldehyde. Anal. Chem. 60, 175–179. doi: 10.1021/ac00153a016
Horstkotte, B., Duarte, C. M., and Cerdà, V. (2011). A miniature and field-applicable multipumping flow analyzer for ammonium monitoring in seawater with fluorescence detection. Talanta 85, 380–385. doi: 10.1016/j.talanta.2011.03.078
Hovind, H., Magnussen, B., Krysell, M., Lund, U., and Mäkinen, I. (2011). Internal Quality Control–Handbook for Chemical Laboratories. Nordtest Technical Report No. 569. Oslo: Nordic Innovation.
Johnson, M. T., Liss, P. S., Bell, T. G., Lesworth, T. J., Baker, A. R., Hind, A. J., et al. (2008). Field observations of the ocean-atmosphere exchange of ammonia: fundamental importance of temperature as revealed by a comparison of high and low latitudes. Glob. Biogeochem. Cycles 22, 1–15. doi: 10.1029/2007GB003039
Johnson, M. T., Sanders, R., Avgoustidi, V., Lucas, M., Brown, L., Hansell, D., et al. (2007). Ammonium accumulation during a silicate-limited diatom bloom indicates the potential for ammonia emission events. Mar. Chem. 106, 63–75. doi: 10.1016/j.marchem.2006.09.006
Kérouel, R., and Aminot, A. (1997). Fluorometric determination of ammonia in sea and estuarine waters by direct segmented flow analysis. Mar. Chem. 57, 265–275. doi: 10.1016/S0304-4203(97)00040-6
Koike, I., Holm-Hansen, O., and Biggs, D. (1986). Inorganic nitrogen metabolism by Antarctic phytoplankton with special reference to ammonium cycling. Mar. Ecol. Progress Ser. 30, 105–116. doi: 10.3354/meps030105
Li, Q. P., Zhang, J. Z., Millero, F. J., and Hansell, D. A. (2005). Continuous colorimetric determination of trace ammonium in seawater with a long-path liquid waveguide capillary cell. Mar. Chem. 96, 73–85. doi: 10.1016/j.marchem.2004.12.001
Liddicoat, M. I., Tibbits, S., and Bulter, E. I. (1975). Determination of ammonia in seawater. Limnol. Oceanogr. 20, 131–132. doi: 10.1021/ac00071a013
Liss, P. S., and Galloway, J. N. (1993). “Air-sea exchange of sulphur and nitrogen and their interaction in the marine atmosphere,” in Interactions of C, N, P and S Biogeochemical Cycles and Global Change, eds R. Wollast, F. T. Mackenzie, and L. Chou (Berlin: Springer), 259–281. doi: 10.1007/978-3-642-76064-8_11
Ma, J., Adornato, L., Byrne, R. H., and Yuan, D. (2014). Determination of nanomolar levels of nutrients in seawater. Trends in Anal. Chem. 60, 1–15. doi: 10.1016/j.trac.2014.04.013
Ota, H., Mitsuda, H., Kimura, M., and Kitao, T. (2010). “Reference materials for nutrients in seawater: their development and present homogeneity and stability,” in Comparability of Nutrients in the world’s Ocean, eds E. M. S. Aoyama, M. Dickson, A. G. Hydes, D. J. Murata, A. Oh, J. R. Roose, et al. (Tsukuba, J.P: Mother Tank), 1–10.
Owens, N. J. P., Priddle, J., and Whitehouse, M. J. (1991). Variations in phytoplanktonic nitrogen assimilation around South Georgia and in the Bransfield Strait (Southern Ocean). Mar. Chem. 35, 287–304. doi: 10.1016/S0304-4203(09)90023-8
Rees, C., Pender, L., Sherrin, K., Schwanger, C., Hughes, P., Tibben, S., et al. (2019). Methods for reproducible shipboard SFA nutrient measurement using RMNS and automated data processing. Limnol. Oceanogr. Methods 17, 25–41. doi: 10.1002/lom3.10294
Šraj, L. O. ’C., Almeida, M. I. G. S., Swearer, S. E., Kolev, S. D., and McKelvie, I. D. (2014). Analytical challenges and advantages of using flow-based methodologies for ammonia determination in estuarine and marine waters. Trends Anal. Chem. 59, 83–92. doi: 10.1016/j.trac.2014.03.012
Van Oostende, N., Fawcett, S. E., Marconi, D., Lueders-Dumont, J., Sabadel, A. J. M., Woodward, E. M. S., et al. (2017). Variation of summer phytoplankton community composition and its relationship to nitrate and regenerated nitrogen assimilation across the North Atlantic Ocean. Deep Sea Res. I 121, 79–94. doi: 10.1016/j.dsr.2016.12.012
Voss, M., Bange, H. W., Dippner, J. W., Middelburg, J. J., Montoya, J. P., and Ward, B. (2013). The marine nitrogen cycle: recent discoveries, uncertaintiesand the potential relevance of climate change. Philos. Trans. R. Soc. B Biol. Sci. 368, 1–11. doi: 10.1098/rstb.2013.0121
Wan, X. S., Sheng, H. X., Dai, M., Zhang, Y., Shi, D., Trull, T. W., et al. (2018). Ambient nitrate switches the ammonium consumption pathway in the euphotic ocean. Nat. Commun. 9, 1–9. doi: 10.1038/s41467-018-03363-0
Wheeler, P. A., and Kokkinakis, S. A. (1990). Ammonium recycling limits nitrate use in the oceanic subarctic Pacific. Limnol. Oceanogr. 35, 1267–1278. doi: 10.4319/lo.1990.35.6.1267
Zakem, E. J., Al-Haj, A., Church, M. J., Van Dijken, G. L., Dutkiewicz, S., Foster, S. Q., et al. (2018). Ecological control of nitrite in the upper ocean. Nat. Commun. 9:206. doi: 10.1038/s41467-018-03553-w
Zehr, J. P., and Ward, B. B. (2002). Nitrogen cycling in the ocean: new perspectives on processes and paradigms. Appl. Environ. Microbiol. 68, 1015–1024. doi: 10.1128/AEM.68.3.1015
Zhu, Y., Chen, J., Shi, X., Yuan, D., Feng, S., Zhou, T., et al. (2018). Development and application of a portable fluorescence detector for shipboard analysis of ammonium in estuarine and coastal waters. Anal. Methods 10, 1781–1787. doi: 10.1039/c8ay00438b
Keywords: ammonium, nutrients, chemistry, quality control, shipboard analysis, seawater
Citation: Rees C, Janssens J, Sherrin K, Hughes P, Tibben S, McMahon M, McDonald J, Camac A, Schwanger C and Marouchos A (2021) Method for Reproducible Shipboard Segmented Flow Analysis Ammonium Measurement Using an In-House Reference Material for Quality Control. Front. Mar. Sci. 8:581901. doi: 10.3389/fmars.2021.581901
Received: 10 July 2020; Accepted: 11 March 2021;
Published: 01 April 2021.
Edited by:
Johannes Karstensen, GEOMAR Helmholtz Centre for Ocean Research Kiel, GermanyReviewed by:
Carmen Molins Legua, University of Valencia, SpainYong Zhu, Second Institute of Oceanography, Ministry of Natural Resources, China
Copyright © 2021 Rees, Janssens, Sherrin, Hughes, Tibben, McMahon, McDonald, Camac, Schwanger and Marouchos. This is an open-access article distributed under the terms of the Creative Commons Attribution License (CC BY). The use, distribution or reproduction in other forums is permitted, provided the original author(s) and the copyright owner(s) are credited and that the original publication in this journal is cited, in accordance with accepted academic practice. No use, distribution or reproduction is permitted which does not comply with these terms.
*Correspondence: Julie Janssens, anVsaWUuamFuc3NlbnNAY3Npcm8uYXU=