
94% of researchers rate our articles as excellent or good
Learn more about the work of our research integrity team to safeguard the quality of each article we publish.
Find out more
ORIGINAL RESEARCH article
Front. Mar. Sci. , 03 February 2021
Sec. Deep-Sea Environments and Ecology
Volume 8 - 2021 | https://doi.org/10.3389/fmars.2021.574780
 Ariadna Mecho1*
 Boris Dewitte1,2,3
 Javier Sellanes1
 Simon van Gennip1,4
 Erin E. Easton1,5
 Joao B. Gusmao1
Mesophotic ecosystems (50–400 m depth) of the southeastern Pacific have rarely been studied because of the logistical challenges in sampling across this remote zone. This study assessed how oxygen concentrations and other environmental predictors explain variation in echinoderm assemblages at these mesophotic systems, where this group is among the predominant fauna. We compiled data on echinoderm taxa at 91 sampling stations, from historical and recent surveys (between 1950 and 2019), covering a longitudinal gradient of approximately 3,700 km along with the Nazca, Salas y Gómez, and Juan Fernández ridges. Uni- and multivariate model-based tools were applied to analyze the patterns of benthic fauna in relation to environmental factors. Our results indicate a significant positive relationship between echinoderm species richness and depth, oxygen, and salinity. Changes in echinoderm community composition were significantly explained by oxygen, longitude, and chlorophyll-a. We observed notable species turnovers at ∼101 and ∼86°W, where assemblages tend to be more variable across stations. This turnover possibly reflects the effects of physical barriers to dispersion (e.g., currents) and habitat changes. Echinoderm assemblages observed around Easter and Desventuradas Islands presented a high occurrence of potentially endemic taxa and distinct species assemblages. This study is the first to assess the structure of mesophotic echinoderm assemblages of the southeastern Pacific Ocean along a large spatial scale. The information reported here could help design appropriate management tools for the vast, recently created, marine protected areas in the southeastern Pacific.
The study of vulnerable marine ecosystems, such as seamounts and oceanic islands, is critical for the conservation and management of the marine ecosystem (Kvile et al., 2014; Watling and Auster, 2017). Seamounts are topographic structures that rise more than 1,000 m above the surrounding seafloor. Their topography affects marine currents, producing local and mesoscale circulation patterns, such as Taylor columns that usually reinforce vertical mixing (Vic et al., 2019), increase nutrient concentrations in the euphotic zone (Rowden et al., 2010), and promote the growth of primary producers that sustain benthic and pelagic animals (Morato et al., 2010). This increased productivity and the availability of hard substrate on seamounts and oceanic islands allow the establishment of diverse marine communities (Morato et al., 2013). Such communities frequently have high endemism and potentially low resilience levels because their populations are usually restricted to relatively few individuals with limited distributions compared with their continental counterparts (Clark and Rowden, 2009; Clark et al., 2010). According to the International Guidelines for the Management of Deep-sea Fisheries in the High Seas (FAO, 2009), “a marine ecosystem should be classified as vulnerable based on the characteristics that it possesses” and those ecosystem characteristics could be, for example, their uniqueness, rarity, structural complexity or fragility (Paragraph 42, FAO DSF Guidelines). Hence, many seamounts and oceanic islands could be classified as vulnerable marine ecosystems because of their potentially fragile communities and habitat-forming species they support (Watling and Auster, 2017). Besides, the scattered distribution of islands and seamounts along oceanic ridges makes them important “stepping stones” for the distribution of species across ocean basins and, therefore, contributes to shaping biogeographical patterns of oceanic biodiversity (Miller and Gunasekera, 2017).
Echinoderms usually constitute an important group of motile invertebrate grazers, carnivores, and deposit feeders in benthic habitats (Furman and Heck, 2009) and provide essential ecosystem services. Most asteroids are carnivores, and some species have an important role in benthic ecosystems since they can control populations of dominant fouling organisms (Paine, 1966). The impact of these asteroids on the benthic community structure favors the local biodiversity, making them true keystone species (Paine, 1966). Some echinoderms are important ecosystem engineers in many marine systems since they provide shelter and refuge for juvenile fish recruits (Fonseca et al., 2014) and affect substrate characteristics through sediment bioturbation (Uthicke, 2001; Shiell and Knott, 2010) and accumulation of carbonate spines and skeletons after their death (Ogden, 1977). Their ecological importance and high abundance in benthic ecosystems make them good indicators of the marine ecosystem health (Gonzalez-Irusta et al., 2012; Mironov et al., 2014); however, little information on their diversity and ecological role in mesophotic ecosystems is available (Mecho et al., 2019; Pyle and Copus, 2019). This lack of information arises, in part, because the communities inhabiting seamounts and oceanic islands at mesophotic depths are largely understudied compared with shallower and deeper communities. The mesophotic zone is characterized by low-light conditions that, in general, extend from depths of ∼30 m to the limits of photosynthetically dependent biota at ∼150 m (Pyle and Copus, 2019) or even deeper at some ultraoligotrophic places, e.g., to ∼300 m (Hinderstein et al., 2010; Easton et al., 2019). This lack of information is particularly evident for the seamounts and oceanic islands scattered within the southeastern Pacific Ocean (SEP). Although the benthic systems of a few oceanic islands in this region have been studied since the late 1950s, most surveys were conducted at depths between 0 and 50 m (Ziesenhenne, 1963; Fell, 1975) or below 150 m (Parin et al., 1997). Although these studies have expanded our knowledge of the biodiversity of echinoderms in the SEP, few attempts were made to explain benthic faunal patterns in relation to abiotic factors. Parin et al. (1997) described the presence of low oxygen conditions (bottom water dissolved oxygen: 0.15–0.20 mL/L) on shallow seamounts close to the junction of the Salas y Gómez and Nazca ridges, but they did not explore correlations between echinoderm communities and dissolved oxygen or other abiotic factors (e.g., depth and temperature) that can be major drivers of echinoderm community structure. For example, O’Hara and Tittensor (2010) observed that temperature was a stronger driver than depth for ophiuroids on southwest Pacific seamounts; and Iken et al. (2010) found that salinity, sea surface temperature, chlorophyll-a, and primary productivity were strongly correlated with echinoderm assemblages.
Since the easternmost islands and seamounts of the SEP extend to areas under the influence of oxygen minimum zones, especially near the South American continent (Silva and Neshyba, 1979), it is expected that oxygen concentration would be a key factor shaping echinoderm diversity patterns in mesophotic benthic ecosystems in the SEP. In this way, to assess the effects of oxygen and other potential drivers of echinoderm community structure in the SEP, we analyzed the variations in echinoderm species richness and assemblages between 50 and 400 m on seamounts and oceanic islands of the SEP and analyzed the relationship between these patterns and those of select environmental factors (i.e., latitude, longitude, depth, temperature, oxygen, salinity, and chlorophyll-a). To do so, we compiled a dataset that incorporates historical biological data from publications and online databases and data collected during recent oceanographic cruises (2016–2019).
We compiled data from the Desventuradas Islands, Easter Island, and seamounts from three ridges within the SEP: Salas y Gómez, Nazca, and Juan Fernández (Figure 1). These three ridges contain more than 144 seamounts (51 within the Chilean EEZ) with summits from 0 to 2,000 m depth representing 54% of the reported seamounts in the SEP (Gálvez-Larach, 2009). The Salas y Gómez Ridge was formed by the Easter-Salas hotspot and extends from ∼112 to ∼80°W, where it converges with the Nazca Ridge (Ray et al., 2012). Although it is relatively narrow (∼150 km of latitudinal extension), the Salas y Gómez Ridge spans more than 2,900 km along its longitudinal axis. The islands of Rapa Nui (Easter Island) and Motu Motiro Hiva (Salas y Gómez) are the only emerged structures along this ridge. No emerged structures are present along the Nazca Ridge, which also formed from the Easter-Salas hotspot. The Nazca Ridge extends latitudinally from ∼15 to ∼25°S (∼1,300 km) and longitudinally from ∼76 to ∼85°W (∼1,200 km). The Desventuradas Islands, which are small islands of volcanic origin, are located east of the junction of the Salas y Gómez and Nazca ridges (Gálvez-Larach, 2009). The Juan Fernández Ridge lies on a ∼800 km (longitudinally) ridge named after the Juan Fernández Archipelago and extends latitudinally at ∼33°S and longitudinally from ∼76 to ∼81°W. The Archipelago is composed by three small islands (Robinson Crusoe and Alejandro Selkirk Islands and Santa Clara Islet) located ∼840 km south of the Desventuradas Islands and ∼670 km west of the continental coast of Chile.
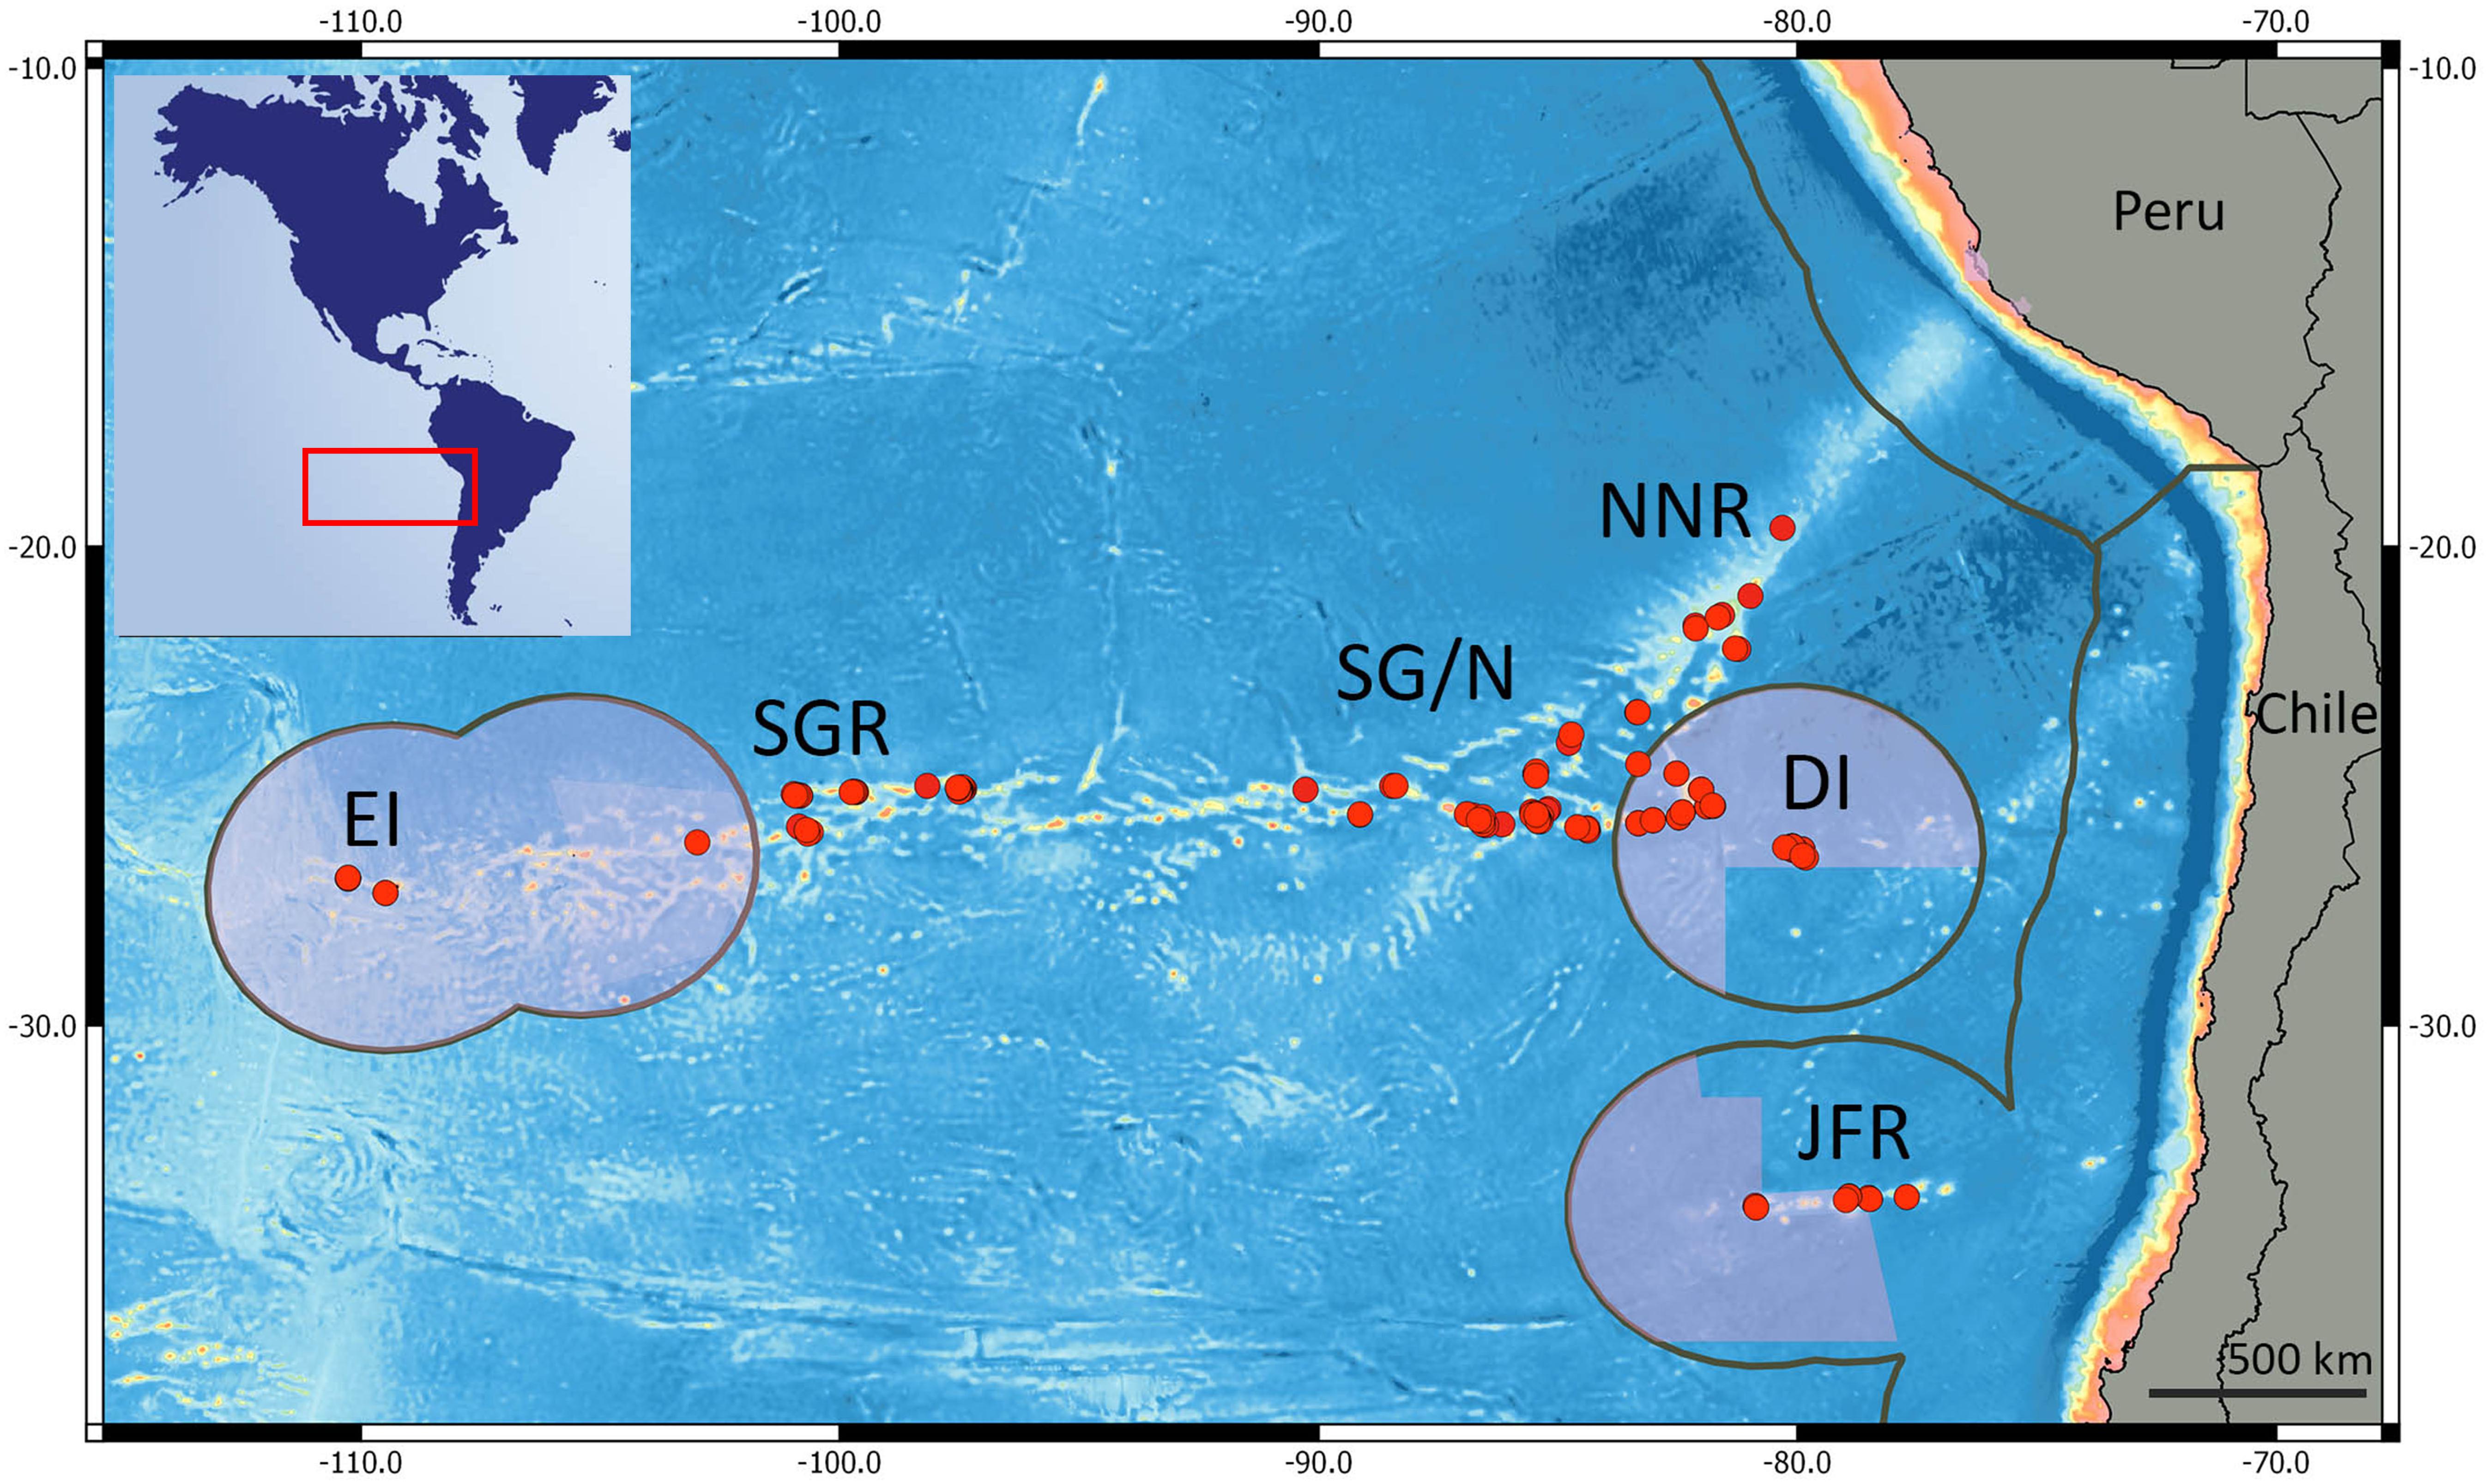
Figure 1. Red dots represent the sampled stations on the southeast Pacific. EI, Easter Island; SGR, central Salas y Gómez Ridge; SG/N, Salas y Gómez and Nazca Ridge junction; DI, Desventuradas Islands; NNR, north Nazca Ridge, and JFR, Juan Fernández Ridge. Pink areas represent marine protected areas; Gray lines indicate the extent of the EEZ.
We assigned the islands and seamounts according to geographic latitude and longitude to one of six regions (Figure 1): (i) Easter Island, (ii) Salas y Gómez Ridge, (iii) Salas y Gómez Ridge/Nazca Ridge junction, (iv) North Nazca Ridge, (v) Desventuradas Islands, and (vi) Juan Fernández Ridge.
The extreme oligotrophy of the waters in the westernmost areas explains the presence of light-dependent biota (i.e., crustose coralline algae) to depths of ∼280 m at Easter Island (Easton et al., 2019) and depths > 300 m (potentially to almost 400 m, unpublished data) on a shallow seamount of the Salas y Gómez Ridge. To include these deep mesophotic communities, we expanded the target depth range of this study to 400 m.
Echinoderm data from 91 stations (50–400 m depth) sampled between 1957 and 2019 (data provided in the Supplementary Material) was compiled, of which 36 stations were sampled during recent expeditions: CIMAR22 (Crucero de Investigación Científico–Marina en Áreas Remotas 22), EPIC (East/Central Pacific International Campaign) and Easter Island expeditions (2014–2016). During the CIMAR 22 cruise, which is part of a multidisciplinary research project funded by the Chilean government, 25 stations were sampled by Agassiz trawl or ROV within the Chilean EEZ around the archipelagos of Desventuradas and Juan Fernández (Figure 1). The cruise was carried out on the oceanographic vessel AGS 61 Cabo de Hornos (Chilean Navy) during October and November 2016. During the multidisciplinary oceanographic EPIC cruise onboard the RV Mirai (JAMSTEC, Japan), four stations along the Salas y Gómez Ridge were sampled with Agassiz trawl in January and February of 2019. Data from seven stations sampled between 2014 and 2016 at 160–280 m around Easter Island were collected by ROV (Mecho et al., 2019). These stations include a subsurface peak, located 13 km SW of the island, locally known as Apolo, and a seamount known as Pukao, located 98 km west of the island. Data from the remaining 58 stations were compiled from existing publications (Allison et al., 1967; Parin et al., 1997) and online databases such as the Ocean Biogeographic Information System (OBIS1) and Seamounts Online2.
Physical (i.e., temperature, salinity) and chemical (i.e., oxygen) data were obtained from the global three-dimensional CSIRO Atlas of Regional Seas (CARS) climatology (2009 version) and EPIC cruise. CARS climatology combines all the available oceanographic data from the World Ocean Database over the last 50 years, along with the Array for Real-time Geostrophic Oceanography (ARGO) buoy profiles. CARS is based on an adaptive-length-scale loess mapper to maximize resolution in data-rich regions and the presence of steep topography (Ridgway et al., 2002). This procedure results in a better definition of oceanic structures (e.g., coastal upwelling off Chile) and accuracy of point values than other global ocean climatologies (e.g., NODC’s World Ocean Atlas). The horizontal resolution is 0.5°. As data availability has significantly increased in recent years, the CARS mean values are inevitably biased toward the current ocean state. Data were selected from the closest location (longitude, latitude) to the 91 stations of the cruise data and vertically interpolated on a 1-meter vertical grid using a cubic spline function to match their depth. The CARS data, therefore, provide 12 monthly mean values for each variable corresponding to the calendar months. The results presented in the paper used the annually averaged values; however, we also use monthly mean calendar data (12 mo) to test the robustness of some of our analyses (cf. Supplementary Figure S1B) by performing them using the minimum and maximum values as environmental predictors. Preliminary analysis showed that minimum and maximum CARS data values were highly colinear with the annual averages (Pearson correlation coefficient > 0.99) and, therefore, were not included as predictors in most analyses. The sensitivity to monthly variation in CARS predictors within and across sampling stations was assessed by performing a principal component analysis (PCA, Supplementary Figure S1). A convex hull represented intra-annual variation within each station and the mean value for each station as a point (Supplementary Figure S1A). The oceanographic data (oxygen, depth, salinity, and sea surface temperature) collected during the EPIC cruise were also included in this PCA. The data was scaled and centered prior to the PCA, which was performed using the R package vegan (Oksanen et al., 2018).
Data on the superficial concentrations of chlorophyll-a (mg m–3) was also considered in our analyses. This data was obtained from the Bio-Oracle online database (Tyberghein et al., 2012; Assis et al., 2018), which provides data on different oceanographic variables for applications in studies on marine biogeography. These global maps represent an average of 2000–2014 and were generated from local observations, satellite images, and modeled estimates (Tyberghein et al., 2012; Assis et al., 2018). The data on superficial chlorophyll-a concentrations were extracted from a global raster with a spatial resolution of 5 arcmins (c. 9.2 km) and a uniform landmask. The chlorophyll-a values at each sampling station were extracted considering a spatial buffer of 30 km (i.e., the average of all values within a 30 km radius around the sampling station). This values extraction was made by using tools in the R package raster (Hijmans, 2019).
All analyses and graphs were performed using the software R and associated packages (R Core Team, 2019) and maps made with QGIS 3.6.2 Version.
We used taxa richness (S) as a proxy of echinoderm diversity (Tecchio et al., 2011). Given the differences in sampling effort and techniques across stations, we applied a data standardization protocol before analyzing taxa richness. To apply a rarefaction-based standardization, we grouped multiple stations within sites when they were distributed on and around the same seamount or oceanic island. Thus, sampling stations were considered as subsamples of sites in a particular area. Sparsely distributed stations were included within the nearest site when the distance to it was smaller than 50 km. Stations of North Nazca were included in the same site since these three isolated stations were ∼50 km apart from each other. Single stations that were more than 50 km apart from any site or station were not considered in the taxa richness analysis. We used tools of the R package iNEXT (Hsieh et al., 2016) to standardize the estimations of taxa richness for each site via seamless rarefaction and extrapolation sampling curves. We also used the iNEXT package to assess sample completeness (sample coverage) across multiple sites. We applied asymptotic diversity estimates for each site to extrapolate taxa richness. Estimates of sites with low sample completeness (<0.3) were not included in the further analyses. This process resulted in the estimates of taxa richness of a total of fifteen sampling sites.
The relationship between taxa richness (number of species) and the environmental variables was assessed by applying generalized linear models (GLMs). We used routines for model selection and averaging in the R package MuMIn (Barton, 2009) to generate a final model containing the best predictor estimates to model echinoderm taxa richness. First, we constructed a global GLM based on Poisson distribution and log-link function that considered latitude, longitude, depth, salinity, dissolved oxygen, superficial chlorophyll-a, sea surface temperature, and water temperature at 300 m depth as predictors. We applied a model selection routine to classify different subsets of the global model based on their performance (based on the corrected Akaike Information Criterion, AICc). The best model fits (i.e., AICc weight > 0.5) were then used to calculate the full average of the model estimates. This process generated a final averaged model with the predictor estimates that better explain taxa richness variation. The general effect of each predictor was tested by using an analysis of deviance and assessed by plotting the partial residuals against each predictor.
We visualized the general trends in the variation of echinoderm assemblages across stations by fitting pure latent variable models. Pure latent variable models offer a model-based approach to unconstrained ordination for visualizing sites and the indicator species characterizing them on a low-dimensional plot (Hui, 2016). The ordinations produced by such models use latent variables as axes representing missing (latent) predictors and the main axes of covariation across species (Hui et al., 2015; Warton et al., 2015). This model-based ordination technique incorporates the statistical properties of the data at hand. It provides an advantage over distance-based methods that only describe the data’s multivariate geometry (Warton et al., 2012). The R package boral has different routines to fit pure latent variable models and extensions of multivariate generalized linear models (Hui, 2016). We fitted a pure-latent variable model based on binomial (Bernoulli) error distribution to produce a biplot based on the posterior median estimates of the latent variables. The model fit was restricted to two latent variables, and the derived ordination only showed the centroids of species with three or more occurrences.
We used the routine manyglm of the R package mvabund (Wang et al., 2012) to apply multivariate GLMs to analyze how environmental variables explain changes in species composition across seamounts and oceanic islands. This analysis uses multiple GLMs to model the variation of individual species and then generates a global model depicting environmental variables’ effects on the assemblage. First, we fitted a multivariate GLM based on binomial distribution considering all environmental variables used in the global model of the univariate variables (i.e., longitude, latitude, depth, temperature, salinity, and dissolved oxygen and chlorophyll-a). Then we perform a manual model reduction by dropping predictors that did not improve model performance (expressed by AICc) using the function drop1. The significance of each predictor was tested by performing an analysis of deviance on the final multivariate GLM. We visually validated the results of the multivariate GLM by fitting a correlated response model to produce a partial ordination of residuals (residual ordination). This analysis consists of fitting GLMs to each species and including latent variables to account for residual correlation between species, for example, due to unmeasured covariates (Hui, 2016). By comparing the residual ordination with the unconstrained ordination, one can visualize how much of the variation in assemblage structure is explained by the predictors. Thus, the more the residual ordination reflects the patterns in the unconstrained ordination (i.e., based on pure latent variable modeling), the less the predictors used in modeling explain the variation in assemblage structure.
A marked longitudinal gradient in water mass properties is observed, with the mean thermocline (see 15°C isotherm in Figure 2 and Supplementary Figure S2) sloping upward from west to east and outcropping near the continental coast and the minimum dissolved oxygen concentration occurring at ∼250–300 m and decreasing below 2 mL/L eastward from ∼87°W at 26°S to ∼81°W at 33.5°S. The lowest levels of dissolved oxygen (0.90 ± 0.03 mL/L) occur at stations within the North Nazca Ridge, which comprise the closest stations to the western limit of the OMZ. The average oxygen concentrations of the other zones (3.9 ± 1.2 mL/L) were more than four times higher than at the North Nazca Ridge. The highest oxygen concentrations (4.86 ± 0.16 mL/L) were at stations in the Easter Island region. The summary of the environmental conditions at each sampled area is shown in Table 1.
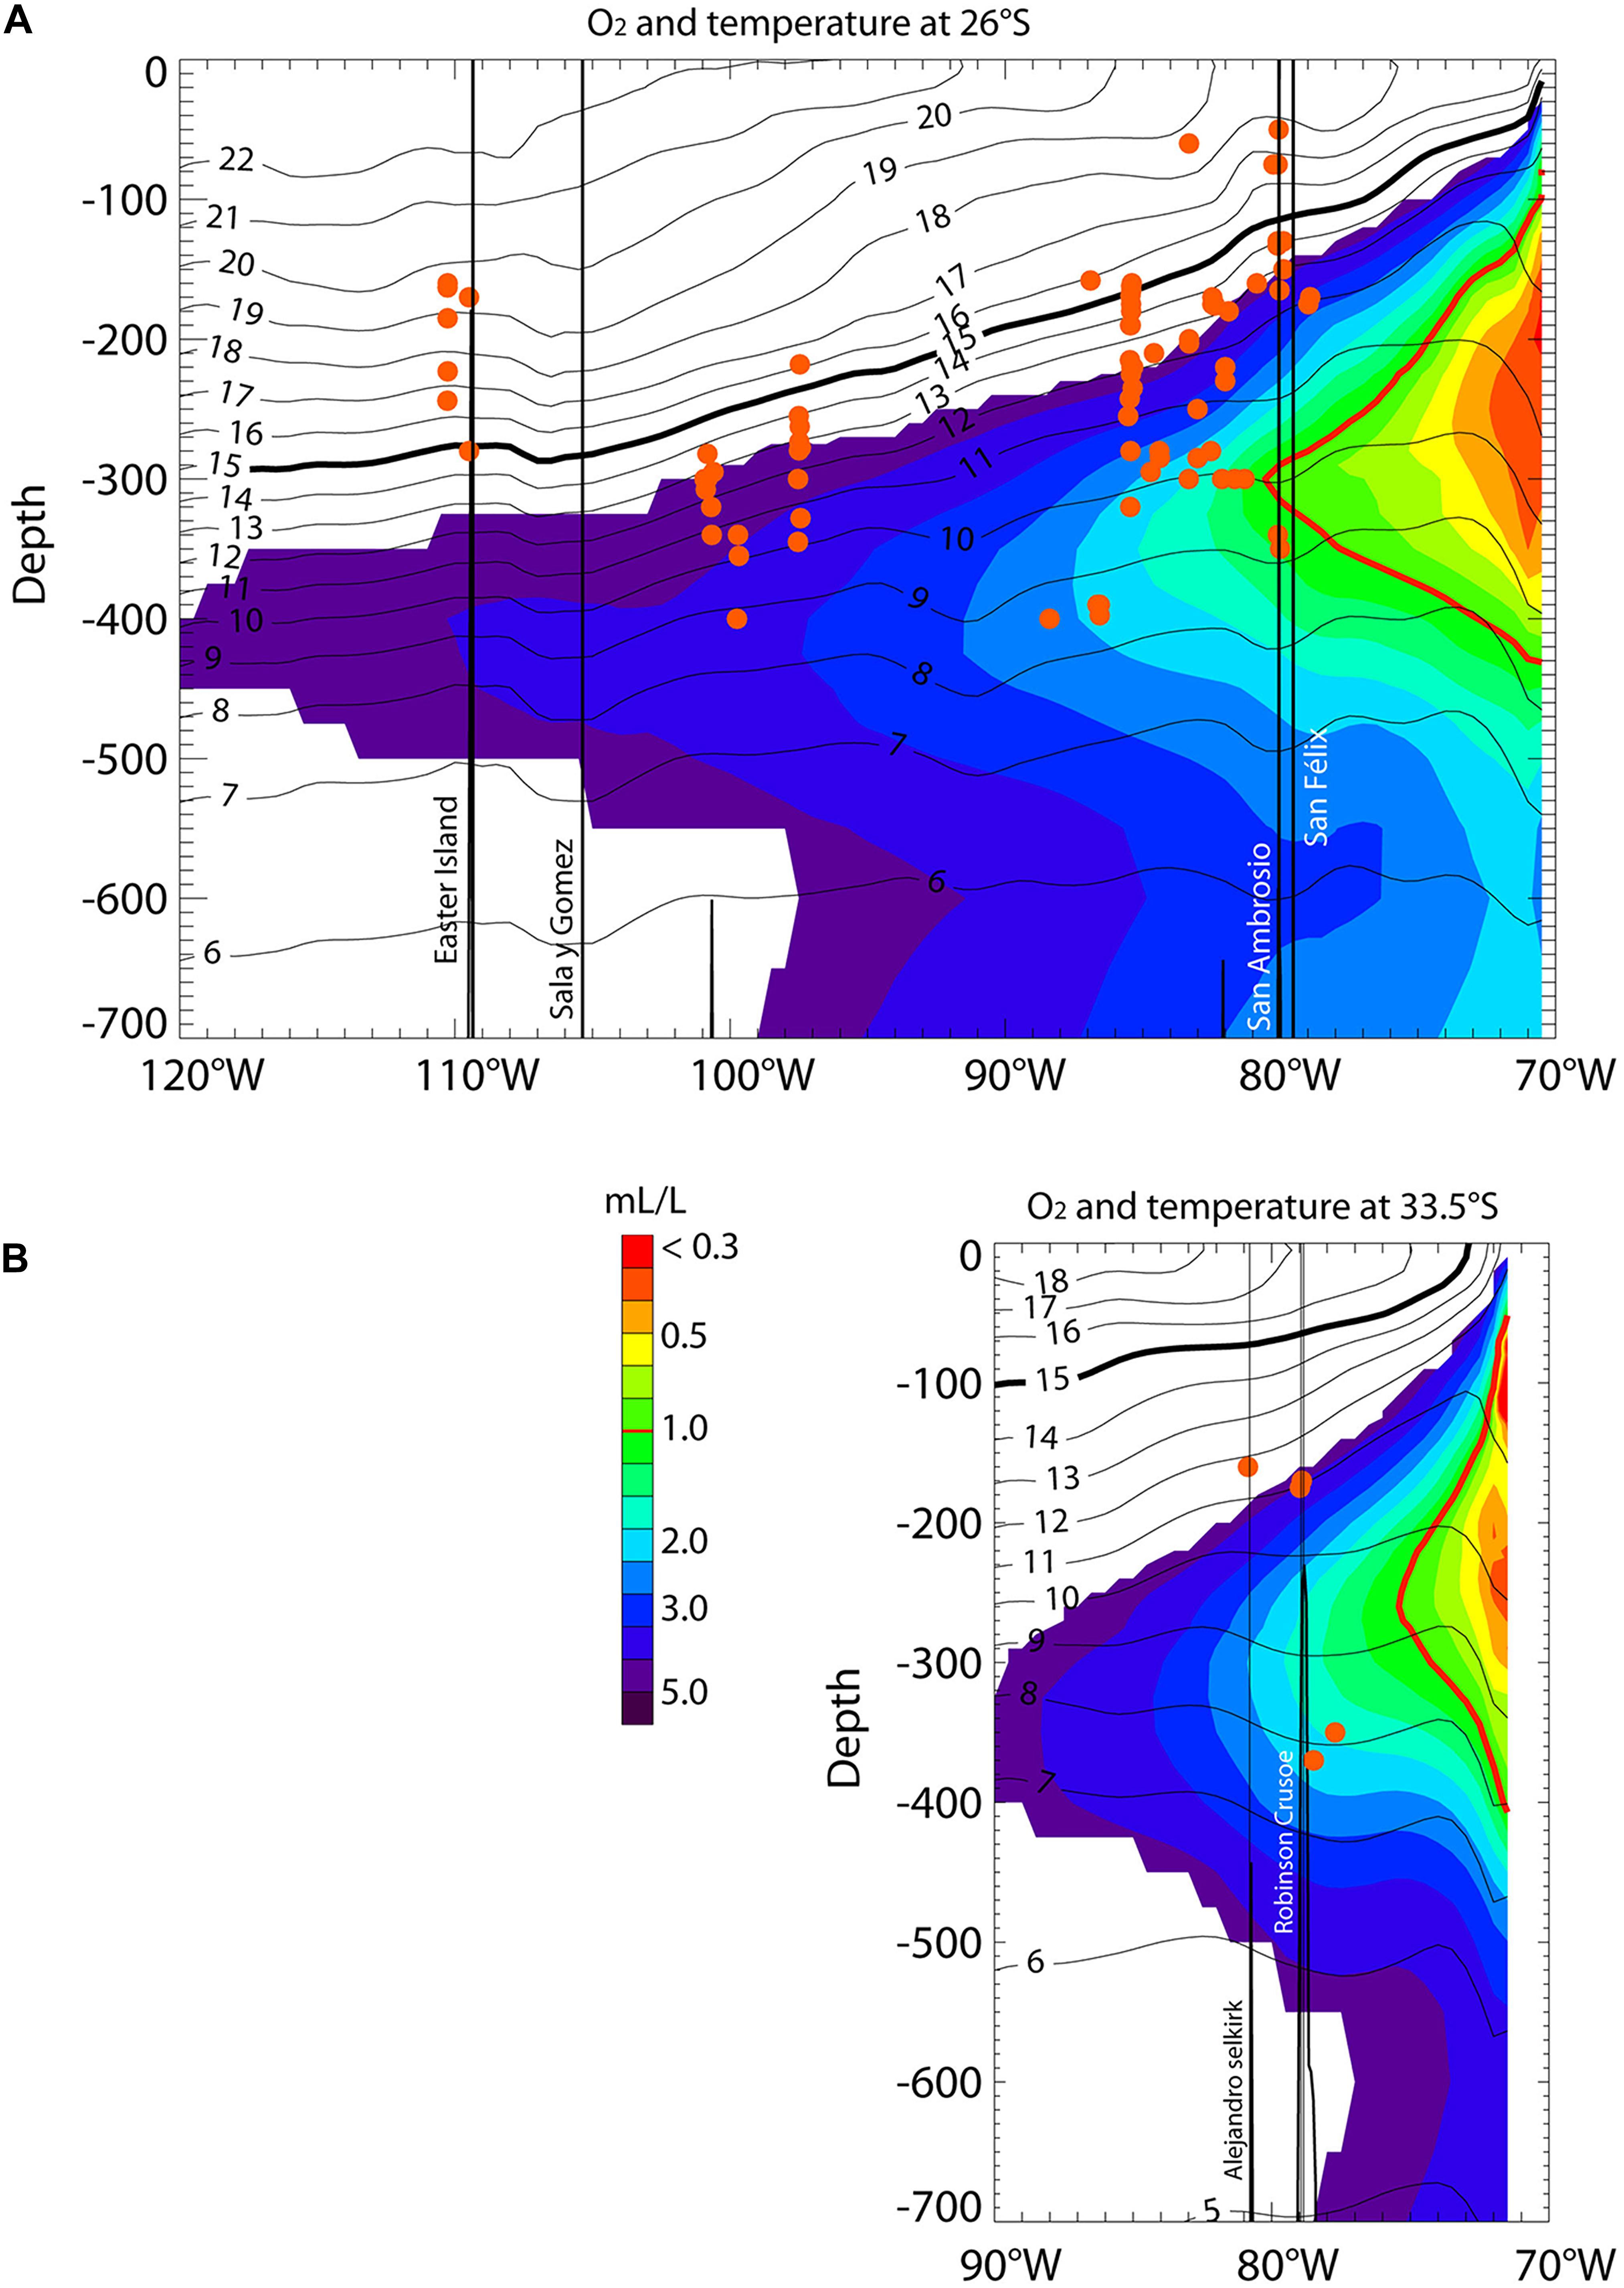
Figure 2. Longitudinal sections at 26°S (A) and 33.5°S (B) of mean dissolved oxygen (color) and temperature (contours) between 0 and 700 m. Data are from CARS (see section “Environmental Data”). The thick black line represents the 15°C isotherm, which is a proxy for thermocline depth. The thick red line corresponds to the 1 mL/L isopleths and can be considered the limit of the Oxygen Minimum Zone. The red dots indicate the depth of all the stations. The labeled vertical black lines indicate islands. San Ambrosio and San Felix islands belong to the Desventuradas archipelago (B), while the Alejandro and Robinson islands indicate the area of the Juan Fernandez Ridge.
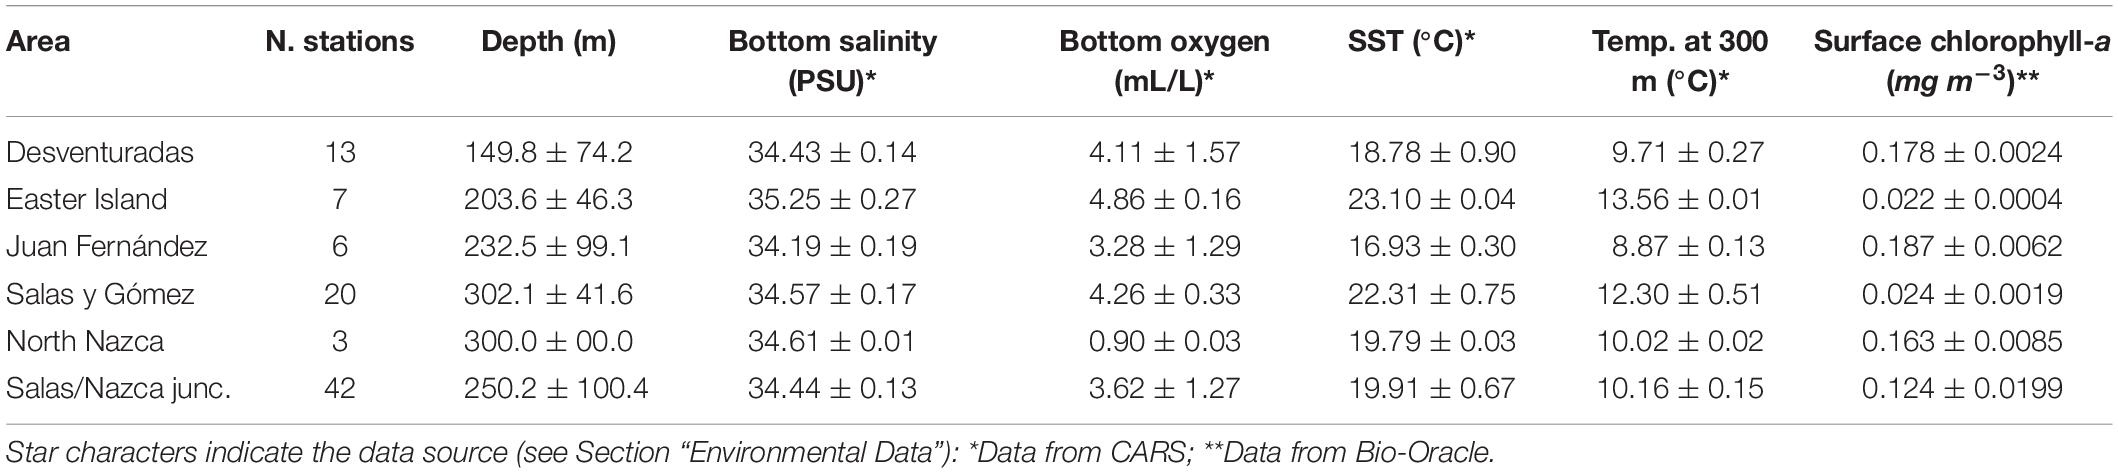
Table 1. Averaged values (± standard deviation) of environmental variables at each sampled area.
For the target depth range of 50–400 m depth, our dataset included a total of 68 OTUs (operational taxonomic units) of echinoderms belonging to 35 families (Table 2) and four classes. The classes Echinoidea and Asteroidea were represented by the highest number of species, accounting respectively for 47% (32) and 40% (27) of the 68 OTUs. Ophiuroidea accounted for 9% (6), and Holothuroidea for 4% (3) of the OTUs. No species of the class Crinoidea were observed. The classes Echinoidea and Asteroidea were predominant in the number of OTUs in all analyzed areas (Table 2).
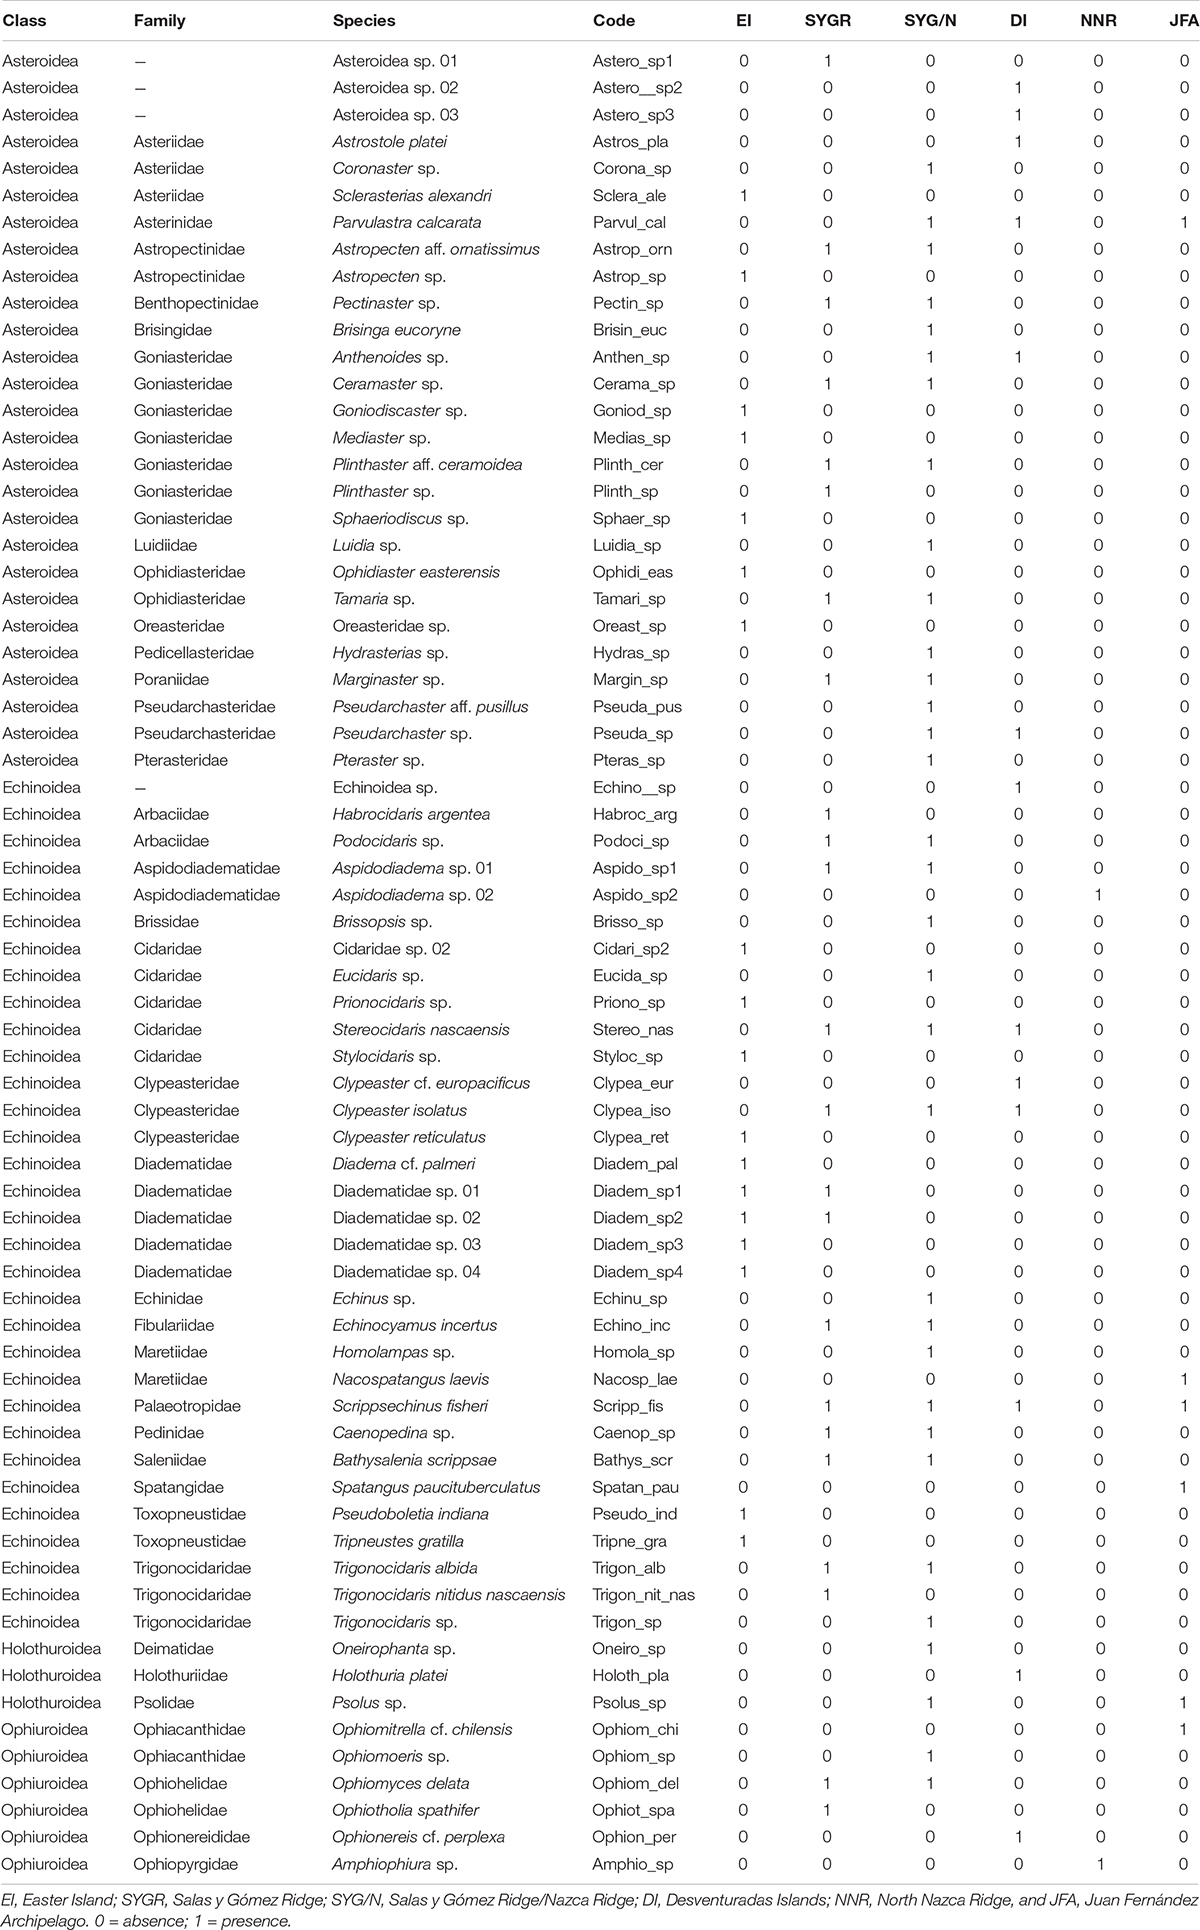
Table 2. Faunistic groups of echinoderms considered in the present study.
No species common to all the studied areas were found (Table 2 and Figure 3). The irregular urchin Scrippsechinus fisheri was the most widely distributed, occurring in four of the six studied areas (central Salas y Gómez Ridge, Salas y Gómez and Nazca Ridges junction, Desventuradas Islands, and Juan Fernández Ridge). Since most of the OTUs observed in the North Nazca area were poorly classified, we had to remove them from the analyses, resulting in the total separation of this area regarding the others (Table 2 and Figure 3). Easter Island only shared OTUs with the adjacent central Salas y Gómez Ridge area (Table 2 and Figure 3). The junction of the Salas y Gómez and Nazca Ridges contained the highest number of OTUs (Table 2) and shared 16 OTUs the central Salas y Gómez Ridge.
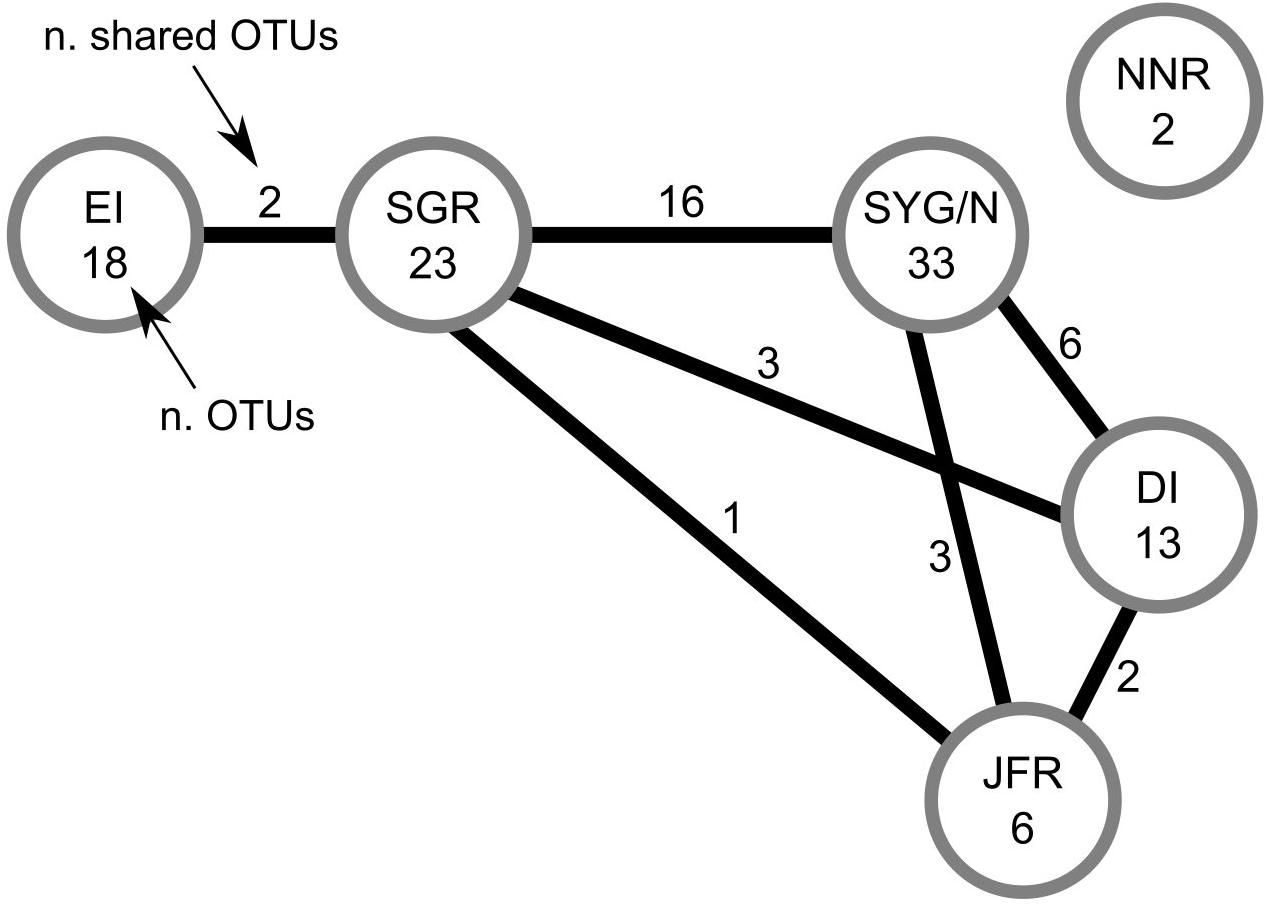
Figure 3. Number of OTUs (operational taxonomic units; mostly species and genera, Table 2) observed in each area (number within the circles), and number of OTUs shared between areas (numbers on the lines).
We did not identify any well-defined geographical pattern in the distribution of the taxa richness of echinoderm assemblages across the SEP (Figure 4A). The estimated values of taxa richness on sites ranged between 2 and 47, with the maximum observed at a station in the Salas y Gómez and Nazca Ridges junction. The GLM model results indicated that dissolved oxygen together with depth and salinity (Figures 4B–D) had a significant positive effect on echinoderm species richness (Table 3).
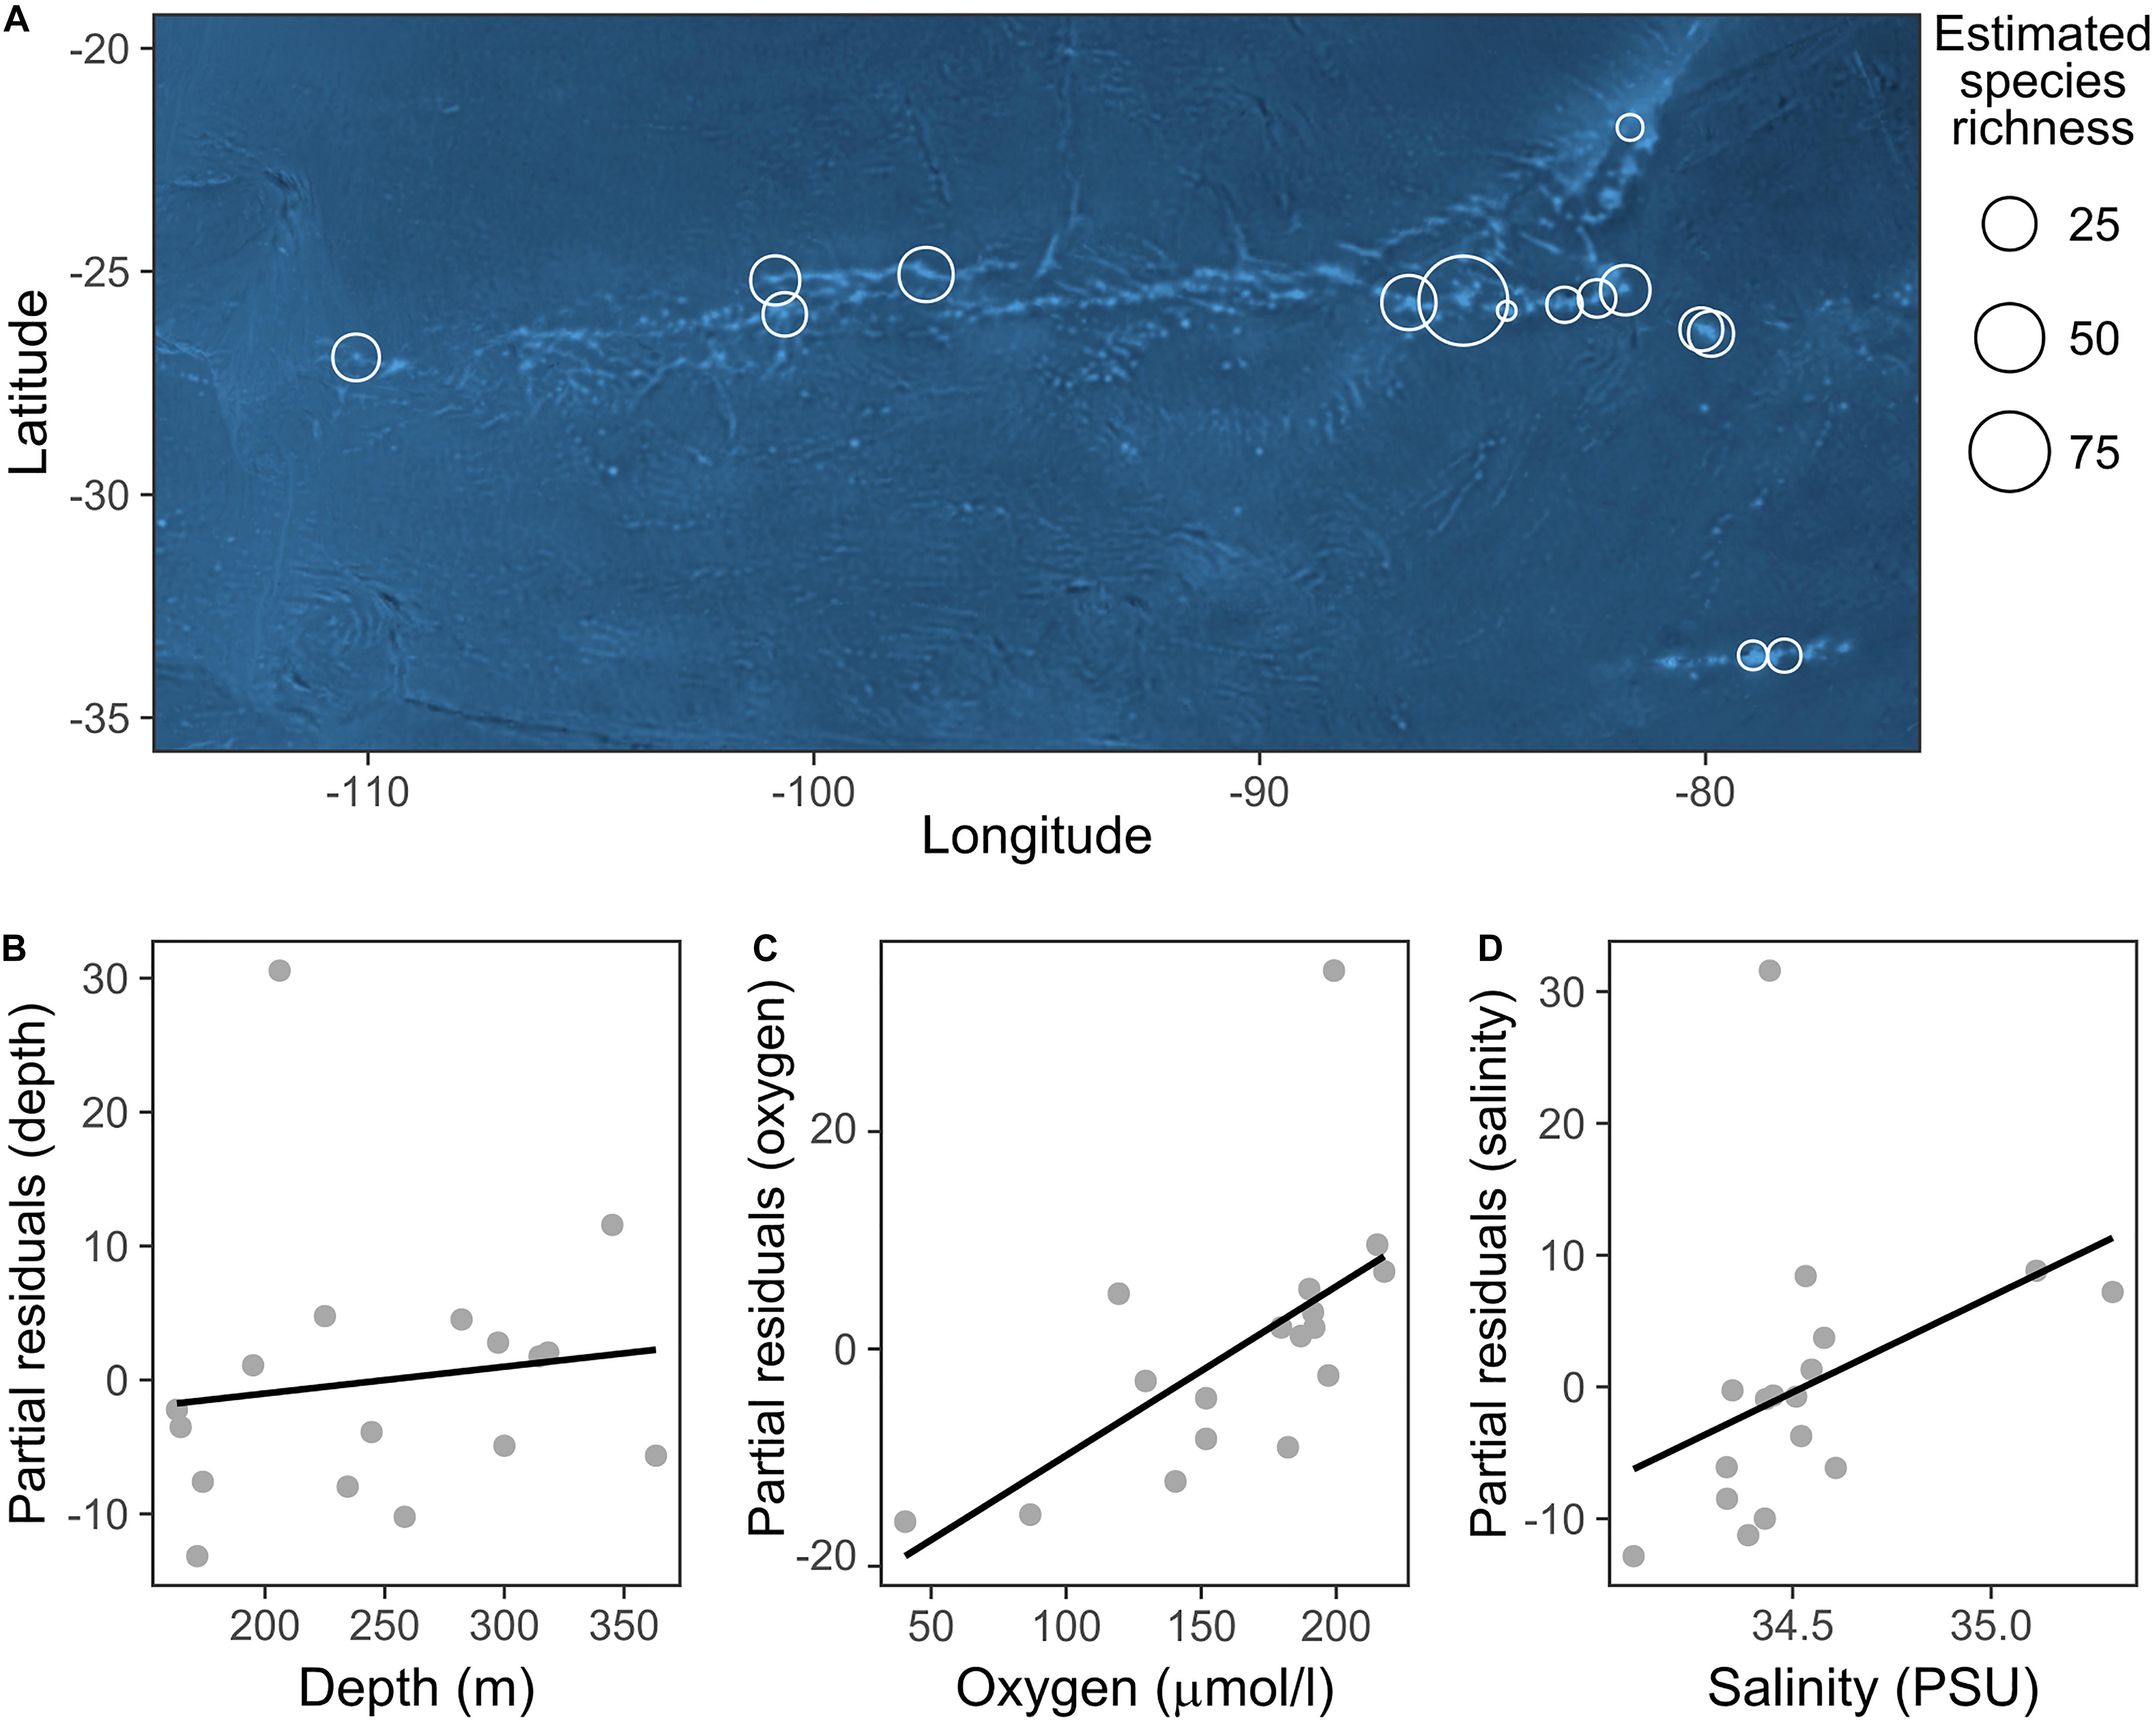
Figure 4. (A) Distribution of echinoderm OTUs richness across sites. Taxa richness at each site was extrapolated by applying asymptotic diversity estimates of sampling curves (see section “Data Analysis”). Bubble size is proportional to the OTUs richness at each station. (B–D) Partial residual plots depicting the results of the generalized linear model (GLM) analyzing the relationship between environmental variables and echinoderm OTUs richness. This plot illustrates the positive effect of each predictor while controlling the effects of others.
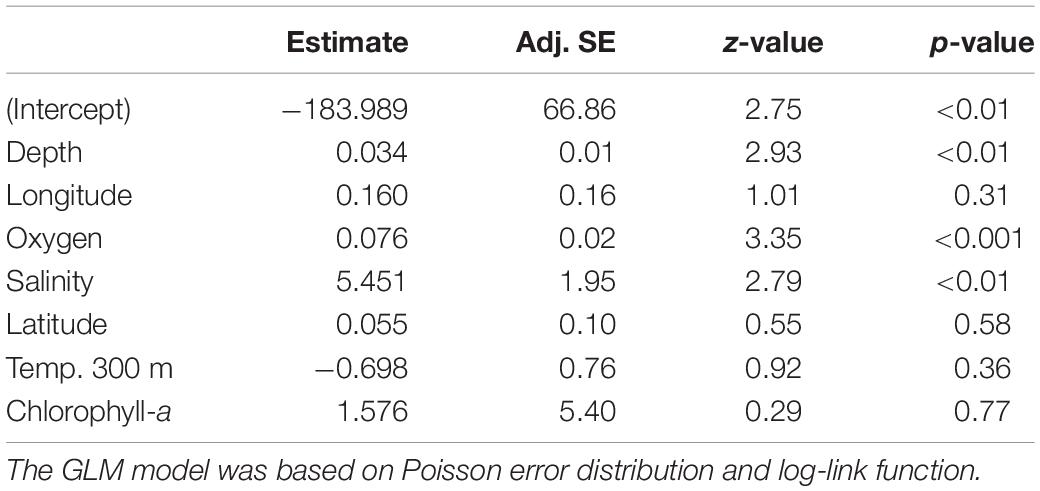
Table 3. Results of the final GLM fit generated from the full average of the best model subsets to explain changes in echinoderm taxa richness.
The general patterns in the variation of the echinoderm assemblage structure across sampling stations are depicted in the pure latent variable ordination (Figure 5). The most notable pattern is the clear separation of Easter Island stations from the other areas, indicating distinct echinoderm assemblages (Figures 5A,B). The differences among the remaining stations were obscured by the high variation in assemblages observed in the Salas y Gómez and Nazca ridges’ junction. Stations from the North Nazca Ridge tended to differ from the Desventuradas Islands and Juan Fernández Ridge. Still, they all shared some similarities with the Salas y Gómez and Nazca ridges’ junction zone (Figures 5A,B). The results of the multivariate GLM indicate that oxygen, longitude, chlorophyll-a explained changes in echinoderm assemblages across stations (Table 4). The residual ordination derived from the correlated response model still showed some of the structure depicted in the unconstrained ordination (Supplementary Figure S3), suggesting that other unmeasured factors might also be driving the echinoderm assemblage structure.
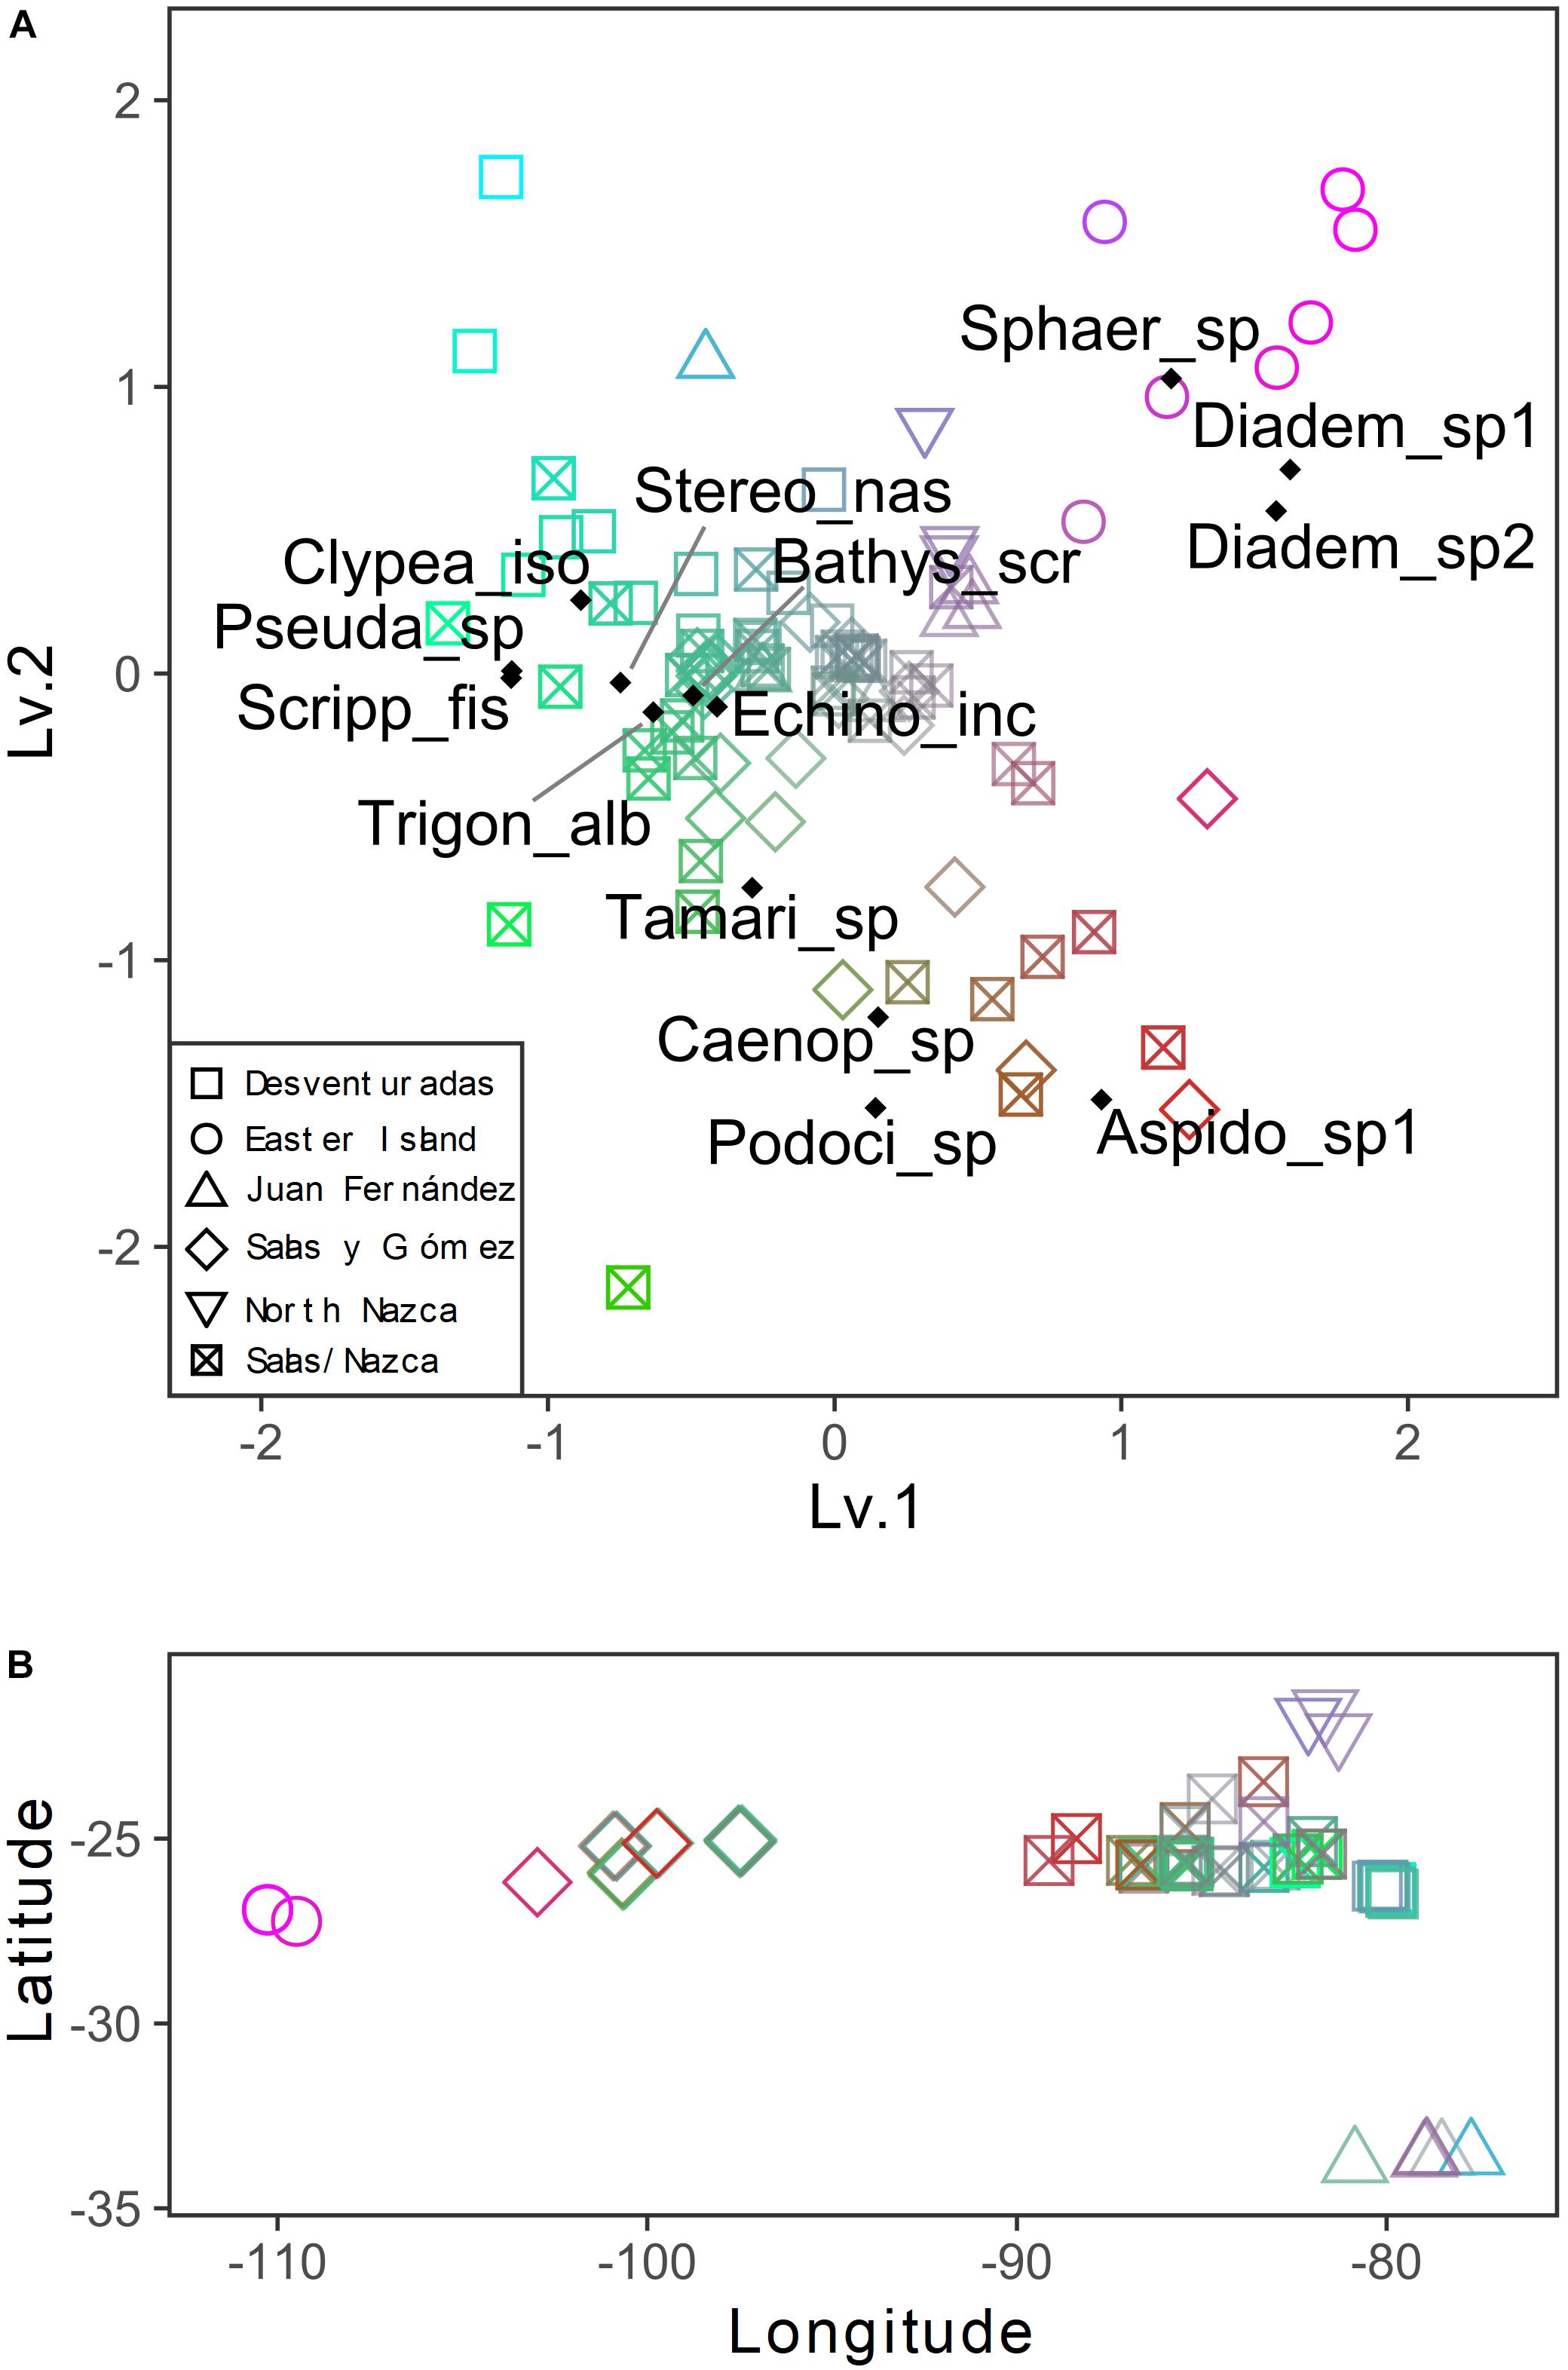
Figure 5. (A) Unconstrained ordination derived from a pure latent variable modeling describing the variation patterns among stations of echinoderm assemblage structure across the southeastern Pacific. The color gradient represents the similarities in the axis scores: color indicates stations with similar assemblages. Colors are assigned from a 2D color space delimited by the two latent variables (axes). Species scores are shown. (B) Spatial changes in species composition are expressed by the color gradient of panel A (similar colors indicate similar assemblages).
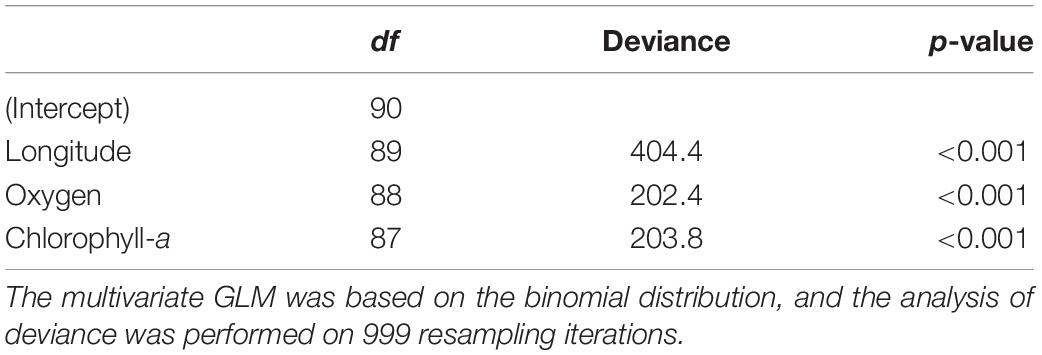
Table 4. Analysis of deviance testing the effect of each predictor considered in the multivariate GLM to model echinoderm assemblage composition.
Our results indicate that echinoderm species richness and community composition observed on mesophotic benthic ecosystems distributed across the SEP are shaped by gradients in oxygen, which is in line with our main prediction. Besides, echinoderm assemblages were also significantly affected by other environmental parameters, such as depth, salinity, longitude, and chlorophyll-a. Even though species richness did not present a notable spatial pattern, we detected a clear longitudinal gradient in community composition, explained by gradients in dissolved oxygen and chlorophyll-a. These changes in assemblage structure possibly reflect the sensitivity of echinoderm assemblages to the low oxygen zones located in the easternmost areas of our study area and the presence of potential barriers to dispersion for the westernmost assemblages. Considering that the available information on echinoderms of the SEP is extremely limited, the information reported in our results represents a significant addition to the understanding and management of this region of the Pacific Ocean.
Although we did not detect a clear gradient in echinoderm species richness across the seamounts and islands of the southeast Pacific, we observed that species richness had significant positive relationships with depth. Variables such as oxygen and salinity also affected taxa richness significantly, suggesting that these variables, or a combination of them, could act as environmental constraints for the establishment of diverse echinoderm assemblages in mesophotic ecosystems. A study assessing ophiuroid assemblages on seamounts of the southwest Pacific (O’Hara and Tittensor, 2010) found that environmental variables highly correlated with depth, such as water temperature range, significantly affected ophiuroid species richness across a much wider bathymetric range (i.e., 100–3,000 m depth). They found that dissolved oxygen was a significant covariate to explain ophiuroid species richness, although their results indicated a negative relationship (O’Hara and Tittensor, 2010). This finding might suggest that the observed trends in relation to dissolved oxygen in our system might be restricted to euphotic and mesophotic zones, the zones in which the major clines in oceanographic conditions are observed (i.e., light incidence, temperature, density, and pelagic productivity).
The positive effect of dissolved oxygen on taxa richness reflects a well-known response of the megafauna to this variable in deep-sea ecosystems (Levin et al., 2001). Dissolved oxygen can be a significant constraint for benthic organisms in marine ecosystems, especially within the OMZ (Levin and Gage, 1998; Breitburg et al., 2018). It can dictate zonation patterns in benthic communities, as reported by Sellanes et al. (2010) for the Chilean continental margin. Furthermore, the OMZ depth and geographic range experiences fluctuations on scales from intraseasonal to centennial that can be reflected in animal abundance and diversity (Sellanes et al., 2010). Apart from the physiological constraints on megafauna within the OMZs, certain groups of echinoderms can thrive on the edges of OMZs because of associated increases in food supply and decreased competition (Steckbauer et al., 2015).
In the SEP, the core of the OMZ is usually associated with the Equatorial Subsurface Water, which is characterized by low oxygen levels and high salinity (Silva and Neshyba, 1979). The southeast Pacific OMZ, as the result of the combined effect of a sluggish subsurface circulation (i.e., low ventilation) and a high export of organic matter from the productive coastal zone (Paulmier and Ruiz-Pino, 2009), is characterized by low dissolved oxygen concentrations (<1 mL/L) at intermediate depths (∼50–1,000 m). Its presence and western boundary are clear in the two main longitudinal sections of our study along which biological data were examined (Figure 2): at 26°S (i.e., Salas y Gómez and Nazca Ridges), reaching 80°W at 300 m depth; and at 33.5°S (i.e., Juan Fernández Ridge), reaching 75°W at 260 m depth. These tongues of low-oxygen waters are associated with high salinity; their southward extents are restricted by mixing with the low-salinity and well-ventilated Antarctic Intermediate Waters and Sub-Antarctic Waters (Silva and Neshyba, 1979; Llanillo, 2012). Although it is known that some echinoderms on the Chilean continental shelf present adaptations to hypoxic events (Steckbauer et al., 2015), insufficient information is available for the species observed in our study area. Besides, because of the scarcity of oxygen data in the region, the degree to which the OMZ influences echinoderm richness in the North Nazca Ridge, Desventuradas Islands, and junction of the Salas y Gómez and Nazca ridges is still uncertain. Thus, further studies are needed to provide insights into how hypoxia events limit echinoderm species richness in this region.
Considering that many deep marine systems are energetically dependent on the productivity in the euphotic zones, the spatial variation of pelagic productivity might significantly affect the productivity and diversity of deep benthic systems (Levin and Gage, 1998). Because our study area is characterized by a major gradient in pelagic productivity along the longitudinal gradient, some of the variation observed in echinoderm taxa richness might also be reflecting a response to increased food supply derived from primary production (Hobson et al., 1995; Lauerman and Kaufmann, 1998). Indeed, our dataset covers a longitudinal gradient in nutrient concentrations from the eutrophic waters associated with the Humboldt Current (Desventuradas Islands, Juan Fernández Ridge, and north Nazca Ridge) westward to the oligotrophic waters of the southern Pacific gyre (Easter Island and Salas y Gómez Ridge) (Thiel et al., 2007; Fernández and Hormazábal, 2014). Variation in productivity within the epipelagic zone driven by nutrient variability would affect deep-sea communities that depend on this allochthonous food source (Billett et al., 2001, 2010). As the food supply for deep communities decreases, the system’s capacity to support viable populations of multiple species also decreases, leading to communities with low species richness (Levin et al., 2001). The fact we failed to detect a significant effect of chlorophyll-a suggests that water masses, traceable by salinity and oxygen, could play a role in moderating the longitudinal effect of reduced surface productivity in overlying waters.
Although we observed that echinoderm species richness is relatively similar across areas, the number of reported species has been steadily increasing as new studies are published. For example, 14 new echinoderms records have been reported for Easter Island within the last 3 years (Mecho et al., 2019), and five new species were observed during the two previous cruises (i.e., CIMAR 22 and EPIC) in the area of the Salas y Gómez Ridge and the Nazca Ridge junction (Mecho, personal obs.). Thus, we expect that the trends observed for species richness in the present study might be altered as new information is obtained.
We observed a notable longitudinal change in the echinoderm assemblage composition westward of ∼86°W, previously suggested by Parin et al. (1997) as a biogeographic break, and an abrupt change observed between stations at ∼101°W and those near Easter Island at ∼107°W. Echinoderm community composition was significantly affected by longitude, oxygen, and chlorophyll-a (Table 4). Considering these findings, we suggest that a combination of environmental and external factors, such as barriers to dispersion (i.e., currents and the distance across shallow seamounts) and changes in habitat types (i.e., from sandy to rocky bottoms), might be driving species turnover. Potential barriers to dispersion within the Easter Island region have been suggested based on studies finding extremely low levels of connectivity of metapopulations of commercially important species (e.g., the cowry Monetaria caputdraconis, the spiny lobster Panulirus pascuensis and the sea chub Kyphosus elegans) between Easter Island and the Salas y Gómez Islet (located ∼389 km east of Easter Island) that support the presence of a potential hydrological barrier east of Easter Island (Meerhoff et al., 2018a,b). Seamount summit depths may also result in potential barriers between the Easter Island and the Central Salas y Gómez Ridge and Salas y Gómez and Nazca Ridges junction because the seamounts between these studied regions are deeper and thus have few summits with mesophotic benthic systems (i.e., depth < 300 m) that could act as stepping stones for some megafaunal species (Kim and Wessel, 2011).
Apart from geographic isolation, oceanographic processes associated with the South Pacific gyre area, which is characterized by higher temperatures and lower nutrient concentrations compared to zones near the Humboldt Current, may act as a barrier between Easter Island and the easternmost regions of the Salas y Gómez Ridge (Fell, 1974; Boyko, 2003). Thus, the contrasting echinoderm assemblages and high level of potentially endemic taxa observed along the Salas y Gómez Ridge (Mecho et al., 2019) supports the hypothesis that Easter Island represents an independent ecoregion (the so-called Rapanuiian Province), at least at mesophotic depths (Schilder, 1965; Rehder, 1980; Parin et al., 1997; Boyko, 2003). Additional surveys and sample collections are necessary to determine the transition zones between these ecoregions and the geographic ranges and taxonomic identities of potentially endemic echinoderm taxa.
Species on Desventuradas Islands and Juan Fernández also present high levels of endemism (e.g., 77% of fish in the area are endemic; Friedlander et al., 2016), which is potentially reflected in our echinoderm samples. The species of these areas are probably adapted to colder water conditions and lower oxygen levels or specific hypoxic events (when the OMZ expands or when a westward propagating eddy with low-oxygen in its core passes by) (i.e., Scrippsechinus fisheri). They probably are also physically isolated from communities of South American coastal waters, given the relatively limited off-shore connectivity and short dispersal distances (Garavelli et al., 2014), which explains the differences observed between the communities on the oceanic islands compared to the fauna on the continental shelf (Friedlander et al., 2016). On the other hand, the net equatorward flux of the Humboldt Current System could be driving the connectivity between Juan Fernández Archipelago and Desventuradas Islands, as supported by three shared species of echinoderms (e.g., Parvulastra calcarata, Scrippsechinus fisheri, Brissopsis sp.). However, this number is lower than shared species between the other areas with a similar distance (i.e., Desventuradas Islands and Salas y Gómez/Nazca ridges, eight shared species).
Our analyses also depicted patterns in echinoderm assemblages that were coincident with gradients in oxygen, temperature, and depth (see Supplementary Figure S1) for Salas y Gómez Ridge and Desventuradas Islands. The latter was associated with shallower depths and higher temperature and oxygen (higher oxygen, but closer to the oxycline) so that small variation in depth can produce strong variations in oxygen. Stations from the Salas y Gómez Ridge and the westernmost part of the Salas y Gómez/Nazca ridges had deeper depths and lower oxygen levels than the Desventuradas Islands (see Supplementary Figure S1). For shallow-water communities, Desventuradas Islands have been considered part of the Juan Fernandez Ecoregion (Spalding et al., 2007). However, our data identified only 3 echinoderm species that are shared between both areas at similar depths and oxygen concentrations (Figure 2), suggesting that a reconsideration of these assignments could be done, at least for mesophotic communities.
Our dataset comprises data from 12 different oceanographic expeditions that encompass a temporal window of 55 years. These expeditions rarely sampled the same zones of the SEP and used different sampling technologies. Given that different benthic habitats (e.g., rocky, pebble, gravel, sandy, and muddy bottoms) were unequally sampled, we admit that a considerable proportion of the observed variation in echinoderm community structure (especially within areas) might reflect this unaccounted habitat heterogeneity. Unfortunately, we could not incorporate bottom characteristics as a predictor in our analyses since this data was not available for a large proportion of our dataset (i.e., for those stations sampled with trawls; see Supplementary Table S1). The unbalanced nature of our dataset also can introduce some bias in our results given the natural temporal variability that some ecological systems can present. Mesophotic assemblages can change markedly with local environmental conditions over decadal time scales (Smith et al., 2019). For instance, oceanic circulation changes associated with the El Niño–Southern Oscillation can affect pelagic productivity and marine food webs (Thiel et al., 2007). These changes can affect mesophotic assemblages both by thermal stress (Smith et al., 2019) and by altering the survivor rates of the meroplanktonic larvae as well as their post-settlement survivorship (Meerhoff et al., 2018a). Although the caveats mentioned above suggest precaution when interpreting our results, we highlight that this pioneering study aims to present general variation trends of this rarely studied ecosystem as a first approach to elucidate the drivers of echinoderm communities. Thus, we expect that the patterns described here might motivate the development of standardized sampling efforts to assess how mesophotic echinoderms respond to gradients in oxygen and other variables in the SEP.
Considering the potential sensitivity of echinoderm assemblage structure to dissolved oxygen suggested by our findings, we can hypothesize that climate alterations may influence benthic biota in the SEP’s seamounts and islands system. Recent studies predict a significant decrease in dissolved oxygen under global warming conditions (Oschlies et al., 2018), and the current trend of ocean deoxygenation may lead to expansion of the geographic extent of OMZs and eventually lead to more extensive and persistent anoxic areas within OMZs (Stramma et al., 2008; Schmidtko et al., 2017). This extreme form of hypoxia or “low oxygen” can form dead zones on marine bottoms (Breitburg et al., 2018). Given the oxygen profiles described here, we would expect that stations near the Desventuradas Islands, North Nazca Ridge, the junction of the Salas y Gomez and Nazca ridges, and the Juan Fernandez Ridge could be further influenced by OMZ waters if it expands westward. Because some stations of the North Nazca Ridge are located only a few hundred kilometers westward from the current average location of the OMZ (Figure 2), it is expected that their assemblages would be affected in the short term (e.g., years to decades) by a reduction in the number of species or by changes in their component species as they experience increasingly more deoxygenated conditions. However, such a scenario does not consider the effects associated with changes in connectivity patterns due to changes in the circulation. For instance, the predicted increase in meridional winds off central Chile (Goubanova et al., 2011; Rykaczewski et al., 2015) is expected to intensify the net equatorward transport of the Humboldt Current System, potentially favoring the connectivity between Juan Fernandez and Desventuradas. Both factors (ocean deoxygenation and change in connectivity) may have compensating or cumulative effects on echinoderm assemblage structure.
Our study provides science-based information necessary for assessing the effectiveness of recently established marine protected areas within the Chilean EEZ, including the Motu Motiro Hiva Marine Park (∼150,000 km2) created in 2010, the Nazca-Desventuradas Marine Park (∼300,000 km2) created in 2016, the Rapa Nui Multiple Use Marine and Coastal Protected Area (∼740,000 km2) created in 2018, and the Mar de Juan Fernández Marine Park (∼262,000 km2) created in 2018. For example, our data reveal the extent of connections between areas, the environmental factors that affect these benthic communities, and therefore provide data for inferring the potential impacts on echinoderm communities associated with predicted environmental changes in those areas. Our data also suggest a potential revision of the Juan Fernandez Ecoregion mesophotic communities.
The original contributions presented in the study are included in the article/Supplementary Material, further inquiries can be directed to the corresponding author/s.
AM, EE, and JS secured funding for participation in CIMAR22, EPIC, and Easter Island cruises and conducted fieldwork. AM developed the manuscript proposal and processed and identified specimens, and compiled the bibliographical data. BD and SG processed oceanographic data and edited environmental models. JG and AM processed biological data and conducted the statistical analysis. All authors contributed to the concept, writing, and editing of the manuscript.
The authors declare that the research was conducted in the absence of any commercial or financial relationships that could be construed as a potential conflict of interest.
This study was funded by the Chilean Millennium Initiative ESMOI, the National Geographic Society, OCEANA, EPIC (East/Central Pacific International Campaign–MR18-06), FONDECYT 1181153 to JS, AM, and EE, FONDECYT 1190276 to BD, FONDEQUIP EQM 150109 to JS and FONDEQUIP EQM 160085 to AM, CONA C22 16-09 to JS, AM, and EE, and the Pure Ocean Fund (managed by the King Baudouin Foundation) to AM. Sample collection was performed under permissions Res. Ext N° 3685/2016 and N° 4508/2018 from SUBPESCA (Chile) to Universidad Católicadel Norte.
We would like to thank the Chilean Navy and the crew of the AGS Cabo de Hornos as well as the crew of the RV Mirai from JAMSTEC. We also thank Enrique Hey, Enrique Pate, Ricardo Hito, and Poky Tane Haoa from Rapa Nui for providing infrastructure and assistance during surveys around the island. Special thanks to Sergio Rapu and the Rapa Nui Heritage Foundation for providing the facilities for our on-island laboratory. We would also like to thank Dr. Tim O’Hara for his help with the ophiuroid classification. We would like to thank science teams and crew of the Cabo de Hornos and Mirai.
The Supplementary Material for this article can be found online at: https://www.frontiersin.org/articles/10.3389/fmars.2021.574780/full#supplementary-material
Supplementary Figure 1 | A Principal Components Analysis (PCA) representing the variation of all abiotic environmental variables together with longitude and latitude across sampling stations. (a) Position of each sampling station along the first two axes of the PCA ordination. Colored convex hulls represent the seasonal variation in the estimates for each station. (b) vector of each variable considered in the PCA ordination. (c) The geographical position of each sampling station. The colors represented in panels (a) and (b) reflect the geographical position of each station (similar colors indicate geographical proximity).
Supplementary Figure 2 | Longitudinal sections at 26°S (A) and 33.5°S (B) of mean dissolved oxygen (color) and salinity (contours) between 0 and 700m. The thick red line corresponds to the 1 mL/L isopleths and can be considered the limit of the Oxygen Minimum Zone. The red dots indicate the depth of all the stations. The labeled vertical black lines indicate islands.
Supplementary Figure 3 | Model-based ordinations derived from generalized linear latent variable models describing changes in echinoderms’ assemblage structure across sampling stations. (a) Unconstrained ordination describing the general variation of echinoderm assemblage data. (b) Residual ordination describing the variation in echinoderm assemblage data after controlling the effect of the environmental predictors (oxygen, salinity, depth, temperature, chlorophyll-a, latitude, and longitude). The more the patterns of (a) and (b) differ, the more the variation in echinoderm assemblages are explained by the environmental predictors.
Supplementary Table 1 | Detailed species occurrence data, including poorly classified OTUs that were excluded from the analyses.
Supplementary Table 2 | “echino”: simplified species occurrence used in the analyses.
Supplementary Table 3 | “enviro”: averages of each environmental variable (salinity, chlorophyll-a, sea surface temperature, and temperature at 300 m depth) for each station. This data was used as predictors in the analyses.
Supplementary Table 4 | “dat_pca”: CARS data including seasonal variation at each sampling station. This data was used to construct the PCA in Supplementary Figure 1.
Allison, E. C., Durham, J. W., and Mintz, L. W. (1967). New Southeast Pacific echinoids. Occas. Pap. Calif. Acad. Sci. 62, 1–23.
Assis, J., Tyberghein, L., Bosch, S., Verbruggen, H., Serrão, E. A., and De Clerck, O. (2018). Bio-ORACLE v2.0: extending marine data layers for bioclimatic modelling. Glob. Ecol. Biogeogr. 27, 277–284. doi: 10.1111/geb.12693
Barton, K. (2009). MuMIn: Multi-Model Inference, R Package Version 0.12. 0. Available online at: http://r-forge.r-project.org/projects/mumin/ (accessed November 23, 2020).
Billett, D. S. M., Bett, B. J., Reid, W. D. K., Boorman, B., and Priede, I. G. (2010). Long-term change in the abyssal NE Atlantic: the ‘Amperima Event’ revisited. Deep Sea Res. II Top. Stud. Oceanogr. 57, 1406–1417. doi: 10.1016/j.dsr2.2009.02.001
Billett, D. S. M., Bett, B. J., Rice, A. L., Thurston, M. H., Galéron, J., Sibuet, M., et al. (2001). Long-term change in the megabenthos of the Porcupine Abyssal Plain (NE Atlantic). Prog. Oceanogr. 50, 325–348. doi: 10.1016/s0079-6611(01)00060-x
Boyko, C. B. (2003). “The endemic marine invertebrates of Easter Island: how many species and for how long?,” in Easter Island, eds J. Loret, and J. T. Tanacredi, (Boston, MA: Springer), 155–175. doi: 10.1007/978-1-4615-0183-1_10
Breitburg, D., Levin, L. A., Oschlies, A., Grégoire, M., Chavez, F. P., Conley, D. J., et al. (2018). Declining oxygen in the global ocean and coastal waters. Science 359:eaam7240. doi: 10.1126/science.aam7240
Clark, M. R., and Rowden, A. A. (2009). Effect of deep water trawling on the macro-invertebrate assemblages of seamounts on the Chatham Rise, New Zealand. Deep Sea Res. I Oceanogr. Res. Pap. 56, 1540–1554. doi: 10.1016/j.dsr.2009.04.015
Clark, M. R., Rowden, A. A., Schlacher, T., Williams, A., Consalvey, M., Stocks, K. I., et al. (2010). The ecology of seamounts: structure, function, and human impacts. Ann. Rev. Mar. Sci. 2, 253–278. doi: 10.1146/annurev-marine-120308-081109
Easton, E. E., Gorny, M., Mecho, A., Sellanes, J., Gaymer, C., Spalding, H. L., et al. (2019). “Chile and the Salas y Gómez Ridge,” in Mesophotic Coral Ecosystems, eds Y. Loya, K. A. Puglise, and T. Bridge, (New York, NY: Springer), 477–489. doi: 10.1007/978-3-319-92735-0
FAO (2009). International Guidelines for the Management of Deep-sea Fisheries in the High Seas. Rome, 73.
Fell, F. J. (1975). The echinoid genus Centrostephanus in the Southe Pacific Ocean with a description of a new species. J. R. Soc. New Zeal. 5, 179–193. doi: 10.1080/03036758.1975.10419371
Fernández, M., and Hormazábal, S. (2014). Oceanography and marine resources of oceanic Islands of the Southeastern Pacific. Lat. Am. J. Aquat. Res. 42, 666–672. doi: 10.3856/vol42-issue4-fulltext-1
Fonseca, P., Abrantes, F., Aguilar, R., Campos, A., Cunha, M., Ferreira, D., et al. (2014). A deep-water crinoid Leptometra celtica bed off the Portuguese south coast. Mar. Biodivers. 44, 223–228. doi: 10.1007/s12526-013-0191-2
Friedlander, A. M., Ballesteros, E., Caselle, J. E., Gaymer, C. F., Palma, A. T., Petit, I., et al. (2016). Marine biodiversity in Juan Fernández and Desventuradas Islands, Chile: global endemism hotspots. PLoS One 11:e0145059. doi: 10.1371/journal.pone.0145059
Furman, B., and Heck, K. L. (2009). Differential impacts of echinoid grazers on coral recruitment. Bull. Mar. Sci. 85, 121–132.
Gálvez-Larach, M. (2009). Montes submarinos de Nazca y Salas y Gómez: una revisión para el manejo y conservación. Lat. Am. J. Aquat. Res. 37, 479–500. doi: 10.3856/vol37-issue3-fulltext-16
Garavelli, L., Kaplan, D. M., Colas, F., Stotz, W., Yannicelli, B., and Lett, C. (2014). Identifying appropriate spatial scales for marine conservation and management using a larval dispersal model: the case of Concholepas concholepas (loco) in Chile. Prog. Oceanogr. 124, 42–53. doi: 10.1016/j.pocean.2014.03.011
Gonzalez-Irusta, J. M., Punzon, A., and Serrano, A. (2012). Environmental and fisheries effects on Gracilechinus acutus (Echinodermata: Echinoidea) distribution: is it a suitable bioindicator of trawling disturbance? ICES J. Mar. Sci. 69, 1457–1465. doi: 10.1093/icesjms/fss102
Goubanova, K., Echevin, V., Dewitte, B., Codron, F., Takahashi, K., Terray, P., et al. (2011). Statistical downscaling of sea-surface wind over the Peru-Chile upwelling region: diagnosing the impact of climate change from the IPSL-CM4 model. Clim. Dyn. 36, 1365–1378. doi: 10.1007/s00382-010-0824-0
Hijmans, R. J. (2019). Raster: Geographic Data Analysis and Modeling. Available online at: https://cran.r-project.org/package=raster (accessed November 23, 2020).
Hinderstein, L. M., Marr, J. C. A., Martinez, F. A., Dowgiallo, M. J., Puglise, K. A., Pyle, R. L., et al. (2010). Theme section on “Mesophotic coral ecosystems: characterization, ecology, and management”. Coral Reefs 29, 247–251. doi: 10.1007/s00338-010-0614-5
Hobson, K. A., Ambrose, W. G., and Renaud, P. E. (1995). Sources of primary production, benthic-pelagic coupling, and trophic relationships within the Northeast Water Polynya: insights from δ13C and δ15N analysis. Mar. Ecol. Prog. Ser. 128, 1–10. doi: 10.3354/meps128001
Hsieh, T. C., Ma, K. H., and Chao, A. (2016). iNEXT: an R package for rarefaction and extrapolation of species diversity (Hill numbers). Methods Ecol. Evol. 7, 1451–1456. doi: 10.1111/2041-210X.12613
Hui, F. K. C. (2016). boral – Bayesian ordination and regression analysis of multivariate abundance data in r. Methods Ecol. Evol. 7, 744–750. doi: 10.1111/2041-210X.12514
Hui, F. K. C., Taskinen, S., Pledger, S., Foster, S. D., and Warton, D. I. (2015). Model-based approaches to unconstrained ordination. Methods Ecol. Evol. 6, 399–411. doi: 10.1111/2041-210X.12236
Iken, K., Konar, B., Benedetti-Cecchi, L., Cruz-Motta, J. J., Knowlton, A., Pohle, G., et al. (2010). Large-scale spatial distribution patterns of echinoderms in nearshore rocky habitats. PLoS One 5:e13845. doi: 10.1371/journal.pone.0013845
Kim, S. S., and Wessel, P. (2011). New global seamount census from altimetry-derived gravity data. Geophys. J. Int. 186, 615–631. doi: 10.1111/j.1365-246X.2011.05076.x
Kvile, K. Ø, Taranto, G. H., Pitcher, T. J., and Morato, T. (2014). A global assessment of seamount ecosystems knowledge using an ecosystem evaluation framework. Biol. Conserv. 173, 108–120. doi: 10.1016/j.biocon.2013.10.002
Lauerman, L. M. L., and Kaufmann, R. S. (1998). Deep-sea epibenthic echinoderms and a temporally varying food supply: results from a one year time series in the N.E. Pacific. Deep Sea Res. II Top. Stud. Oceanogr. 45, 817–842. doi: 10.1016/S0967-0645(98)00004-6
Levin, L., Etter, R. J., Rex, M. A., Gooday, A., Smith, C. R., Pineda, J., et al. (2001). Environmental influences on regional deep-sea species diversity. Annu. Rev. Ecol. Syst. 32, 51–93. doi: 10.1146/annurev.ecolsys.32.081501.114002
Levin, L., and Gage, J. (1998). Relationship between oxygen, organic matter and diversity of macrofauna. Deep Sea Res. II Top. Stud. 45, 129–163. doi: 10.1016/s0967-0645(97)00085-4
Llanillo, P. (2012). Meridional and zonal changes in water properties along the continental slope off central and northern Chile. Ciencias Mar. 38, 307–332. doi: 10.7773/cm.v38i1b.1814
Mecho, A., Easton, E. E., Sellanes, J., Gorny, M., and Mah, C. (2019). Unexplored diversity of the mesophotic echinoderm fauna of the Easter Island ecoregion. Mar. Biol. 166:91. doi: 10.1007/s00227-019-3537-x
Meerhoff, E., Ramos, M., Yannicelli, B., Bravo, L., Zambra, D., and Varela, C. (2018a). Meroplankton distribution in South Pacific islands, implications for larval connectivity. J. Plankton Res. 40, 77–90. doi: 10.1093/plankt/fbx053
Meerhoff, E., Yannicelli, B., Dewitte, B., Díaz-Cabrera, E., Vega-Retter, C., Ramos, M., et al. (2018b). Asymmetric connectivity of the lobster Panulirus pascuensis in remote islands of the southern Pacific: importance for its management and conservation. Bull. Mar. Sci. 94, 753–774. doi: 10.5343/bms.2017.1114
Miller, K. J., and Gunasekera, R. M. (2017). A comparison of genetic connectivity in two deep sea corals to examine whether seamounts are isolated islands or stepping stones for dispersal. Sci. Rep. 7:46103. doi: 10.1038/srep46103
Mironov, A. N., Minin, K. V., and Dilman, A. B. (2014). Abyssal echinoid and asteroid fauna of the North Pacific. Deep Sea Res. II Top. Stud. Oceanogr. 111, 357–375. doi: 10.1016/j.dsr2.2014.08.006
Morato, T., Hoyle, S., Allain, V., and Nicol, S. J. (2010). Seamounts are hotspots of pelagic biodiversity in the open ocean. Proc. Natl. Acad. Sci. U.S.A. 107, 9707–9711. doi: 10.1073/pnas.0910290107
Morato, T., Kvile, K. Ø, Taranto, G. H., Tempera, F., Narayanaswamy, B. E., Hebbeln, D., et al. (2013). Seamount physiography and biology in the north-east Atlantic and Mediterranean Sea. Biogeosciences 10, 3039–3054. doi: 10.5194/bg-10-3039-2013
Ogden, J. C. (1977). Carbonate-sediment production by parrot fish and sea urchins on Caribbean reefs. Reefs Relat. Carbonates Ecol. Sedimentol. 45, 281–288. doi: 10.1306/st4393c21
O’Hara, T. D., and Tittensor, D. P. (2010). Environmental drivers of ophiuroid species richness on seamounts. Mar. Ecol. 31, 26–38. doi: 10.1111/j.1439-0485.2010.00373.x
Oksanen, J., Blanchet, F. G., Friendly, M., Kindt, R., Legendre, P., McGlinn, D., et al. (2018). vegan: Community Ecology Package. R Package.
Oschlies, A., Brandt, P., Stramma, L., and Schmidtko, S. (2018). Drivers and mechanisms of ocean deoxygenation. Nat. Geosci. 11, 467–473. doi: 10.1038/s41561-018-0152-2
Paine, R. T. (1966). Food web complexity and species diversity. Am. Nat. 100, 65–75. doi: 10.1086/282400
Parin, N., Mironov, A. N., and Nesis, K. N. (1997). Biology of the Nazca and Sala y Gomez submarine ridges, an outpost of the Indo- West Pacific Fauna in the Eastern Pacific Ocean: composition and distribution of the Fauna, its communities and history. Adv. Mar. Biol. 32, 145–242. doi: 10.1016/S0065-2881(08)60017-6
Paulmier, A., and Ruiz-Pino, D. (2009). Oxygen minimum zones (OMZs) in the modern ocean. Prog. Oceanogr. 80, 113–128. doi: 10.1016/j.pocean.2008.08.001
Pyle, R. L., and Copus, J. M. (2019). “Mesophotic coral ecosystems: introduction and overview,” in Mesophotic Coral Ecosystems, eds Y. Loya, K. A. Puglise, and T. C. L. Bridge, (Cham: Springer), 3–27. doi: 10.1007/978-3-319-92735-0_1
Ray, J. S., Mahoney, J. J., Duncan, R. A., Ray, J., Wessel, P., and Naar, D. F. (2012). Chronology and geochemistry of lavas from the Nazca Ridge and Easter Seamount Chain: an ~30 myr hotspot record. J. Petrol. 53, 1417–1448. doi: 10.1093/petrology/egs021
R Core Team (2019). R: A Language and Environment for Statistical Computing. R Foundation for Statistical Computing, Vienna. Available online at: https://www.R-project.org/
Rehder, H. A. (1980). The marine mollusks of Easter Island (Isla de Pascua) and Sala y Gómez. Smithson. Contrib. Zool. 289, 1–167. doi: 10.5479/si.00810282.289
Ridgway, K. R., Dunn, J. R., and Wilkin, J. L. (2002). Ocean interpolation by four-dimensional weighted least squares – application to the waters around Australasia. J. Atmos. Ocean. Technol. 19, 1357–1375. doi: 10.1175/1520-04262002019<1357:OIBFDW<2.0.CO;2
Rowden, A. A., Dower, J. F., Schlacher, T. A., Consalvey, M., and Clark, M. R. (2010). Paradigms in seamount ecology: fact, fiction and future. Mar. Ecol. 31, 226–241. doi: 10.1111/j.1439-0485.2010.00400.x
Rykaczewski, R. R., Dunne, J. P., Sydeman, W. J., García-Reyes, M., Black, B. A., and Bograd, S. J. (2015). Poleward displacement of coastal upwelling-favorable winds in the ocean’s eastern boundary currents through the 21st century. Geophys. Res. Lett. 42, 6424–6431. doi: 10.1002/2015gl064694
Schilder, F. A. (1965). The geographical distribution of cowries (Mollusca: Gastropoda). Veliger 7, 171–183.
Schmidtko, S., Stramma, L., and Visbeck, M. (2017). Decline in global oceanic oxygen content during the past five decades. Nature 542, 335–339. doi: 10.1038/nature21399
Sellanes, J., Neira, C., Quiroga, E., and Teixido, N. (2010). Diversity patterns along and across the Chilean margin: a continental slope encompassing oxygen gradients and methane seep benthic habitats. Mar. Ecol. 31, 111–124. doi: 10.1111/j.1439-0485.2009.00332.x
Shiell, G., and Knott, B. (2010). Aggregations and temporal changes in the activity and bioturbation contribution of the sea cucumber Holothuria whitmaei (Echinodermata: Holothuroidea). Mar. Ecol. Prog. Ser. 415, 127–139. doi: 10.3354/meps08685
Silva, N., and Neshyba, S. (1979). On the southernmost extension of the Peru-Chile undercurrent. Deep Sea Res. A Oceanogr. Res. Pap. 26, 1387–1393. doi: 10.1016/0198-0149(79)90006-2
Smith, T. B., Holstein, D. M., and Ennis, R. S. (2019). “Disturbance in mesophotic coral ecosystems and linkages to conservation and management,” in Mesophotic Coral Ecosystems, eds Y. Loya, K. Puglise, and T. Bridge, (Cham: Springer), 911–929. doi: 10.1007/978-3-319-92735-0_47
Spalding, M. D., Fox, H. E., Allen, G. R., Davidson, N., Ferdaña, Z. A., Finlayson, M. A. X., et al. (2007). Marine ecoregions of the world: a bioregionalization of coastal and shelf areas. Bioscience 57, 573–583. doi: 10.1641/b570707
Steckbauer, A., Ramajo, L., Hendriks, I. E., Fernandez, M., Lagos, N. A., Prado, L., et al. (2015). Synergistic effects of hypoxia and increasing CO2 on benthic invertebrates of the central Chilean coast. Front. Mar. Sci. 2:49. doi: 10.3389/fmars.2015.00049
Stramma, L., Johnson, G. C., Sprintall, J., and Mohrholz, V. (2008). Expanding oxygen-minimum zones in the tropical oceans. Science 320, 655–658. doi: 10.1126/science.1153847
Tecchio, S., Ramirez-Llodra, E., Sardà, F., and Company, J. B. (2011). Biodiversity of deep-sea demersal megafauna in Western and Central Mediterranean basins. Sci. Mar. 75, 341–350. doi: 10.3989/scimar.201175n2341
Thiel, M., Macaya, E., Acuña, E., Arntz, W., Bastias, H., Brokordt, K., et al. (2007). The humboldt current system of northern and central Chile. Oceanogr. Mar. Biol. 45, 195–344. doi: 10.1201/9781420050943.ch6
Tyberghein, L., Verbruggen, H., Pauly, K., Troupin, C., Mineur, F., and De Clerck, O. (2012). Bio-ORACLE: a global environmental dataset for marine species distribution modelling. Glob. Ecol. Biogeogr. 21, 272–281. doi: 10.1111/j.1466-8238.2011.00656.x
Uthicke, S. (2001). Interactions between sediment-feeders and microalgae on coral reefs: grazing losses versus production enhancement. Mar. Ecol. Prog. Ser. 210, 125–138. doi: 10.3354/meps210125
Vic, C., Naveira Garabato, A. C., Green, J. A. M., Waterhouse, A. F., Zhao, Z., Melet, A., et al. (2019). Deep-ocean mixing driven by small-scale internal tides. Nat. Commun. 10:2099. doi: 10.1038/s41467-019-10149-5
Wang, Y., Naumann, U., Wright, S. T., and Warton, D. I. (2012). Mvabund- an R package for model-based analysis of multivariate abundance data. Methods Ecol. Evol. 3, 471–474. doi: 10.1111/j.2041-210X.2012.00190.x
Warton, D. I., Blanchet, F. G., O’Hara, R. B., Ovaskainen, O., Taskinen, S., Walker, S. C., et al. (2015). So many variables: joint modeling in community ecology. Trends Ecol. Evol. 30, 766–779. doi: 10.1016/j.tree.2015.09.007
Warton, D. I., Wright, S. T., and Wang, Y. (2012). Distance-based multivariate analyses confound location and dispersion effects. Methods Ecol. Evol. 3, 89–101. doi: 10.1111/j.2041-210X.2011.00127.x
Watling, L., and Auster, P. J. (2017). Seamounts on the high seas should be managed as vulnerable marine ecosystems. Front. Mar. Sci. 4:14. doi: 10.3389/fmars.2017.00014
Keywords: species turnover, seamounts, oceanic islands, conservation, essential marine habitats, Nazca and Salas y Gómez Ridges, OMZ
Citation: Mecho A, Dewitte B, Sellanes J, van Gennip S, Easton EE and Gusmao JB (2021) Environmental Drivers of Mesophotic Echinoderm Assemblages of the Southeastern Pacific Ocean. Front. Mar. Sci. 8:574780. doi: 10.3389/fmars.2021.574780
Received: 21 June 2020; Accepted: 12 January 2021;
Published: 03 February 2021.
Edited by:
Eva Ramirez-Llodra, REV Ocean, NorwayReviewed by:
Akkur Vasudevan Raman, Andhra University, IndiaCopyright © 2021 Mecho, Dewitte, Sellanes, van Gennip, Easton and Gusmao. This is an open-access article distributed under the terms of the Creative Commons Attribution License (CC BY). The use, distribution or reproduction in other forums is permitted, provided the original author(s) and the copyright owner(s) are credited and that the original publication in this journal is cited, in accordance with accepted academic practice. No use, distribution or reproduction is permitted which does not comply with these terms.
*Correspondence: Ariadna Mecho, YXJpYWRuYS5tZWNob0B1Y24uY2w=; YXJpYWRuYS5tZWNob0Bsc2NlLmlwc2wuZnI=
Disclaimer: All claims expressed in this article are solely those of the authors and do not necessarily represent those of their affiliated organizations, or those of the publisher, the editors and the reviewers. Any product that may be evaluated in this article or claim that may be made by its manufacturer is not guaranteed or endorsed by the publisher.
Research integrity at Frontiers
Learn more about the work of our research integrity team to safeguard the quality of each article we publish.