
94% of researchers rate our articles as excellent or good
Learn more about the work of our research integrity team to safeguard the quality of each article we publish.
Find out more
ORIGINAL RESEARCH article
Front. Mar. Sci., 08 January 2021
Sec. Marine Biogeochemistry
Volume 7 - 2020 | https://doi.org/10.3389/fmars.2020.609748
 Ho-Jung Kim1,2
 Hyung Jeek Kim3
 Eun-Jin Yang4
 Kyoung-Ho Cho4
 Jinyoung Jung4
 Sung-Ho Kang4
 Kyung-Eun Lee2
 Sosul Cho1
 Dongseon Kim1,2* on behalf of the Collaborative Working Group
Time-series sediment traps were deployed on the Chukchi Sea and East Siberian Sea slopes from August 2017 to August 2018 with the aim of elucidating the temporal and spatial variations in particle fluxes and identifying the main processes affecting those variations. Particle fluxes showed a typical seasonal pattern, with high values in summer and low values in other seasons, and a large inter-annual variation was observed only on the East Siberian Sea slope, where particle fluxes were one order of magnitude higher in early August 2018 than in late August 2017. This large inter-annual variation in particle flux resulted from the episodic intrusion of nutrient-enriched shelf water in the East Siberian Sea, which enhanced biological production at the surface and particle fluxes. The Chukchi Sea slope was influenced by the inflow of Anadyr Water, with high salinity and high nutrient concentrations, which had little annual variability. Therefore, particle flux showed little inter-annual variation on the Chukchi Sea slope. Under-ice phytoplankton blooms were observed in both the Chukchi Sea and East Siberian Sea slopes, and increases in particulate organic carbon (POC) flux and the C:N ratio under the sea ice were related to transparent exopolymer (TEP) production by ice algae. On the East Siberian Sea slope, particle fluxes increased slightly from 115 to 335 m, indicating lateral transport of suspended particulate matter; POC and lithogenic particles may be laterally transported to the slope as nutrient-rich shelf waters flowed from the East Siberian Sea to the Makarov Basin. Annual POC fluxes were 2.3 and 2.0 g C m–2 year–1 at 115 and 335 m, respectively, on the East Siberian Sea slope and was 2.1 g C m–2 year–1 at 325 m on the Chukchi Sea slope. Annual POC fluxes were higher on the Chukchi Sea and East Siberian Sea slopes than in Arctic basins, lower than on Arctic shelves, and generally similar to those on western Arctic slopes.
In the Arctic Ocean, the extent of sea ice continues to decrease due to global warming, and it is predicted that ice-free conditions will occur during summer by 2040 (Rigor and Wallace, 2004; Müller-Karger et al., 2005; Serreze et al., 2007; Liu et al., 2013). The rapid decrease in sea-ice cover has lengthened the growing season in the Arctic Ocean, resulting in a marked increase in primary production (Sakshaug, 2004; Arrigo et al., 2008; Pabi et al., 2008; Brown and Arrigo, 2012). However, the accumulation of freshwater released from melting sea ice enhances stratification, hindering vertical supply of nutrients to the surface; as a result, primary production decreases due to nutrient depletion (Yamamoto-Kawai et al., 2009; Yun et al., 2014, 2016). Therefore, a rapid decrease in sea-ice cover has both positive and negative effects on primary production in the Arctic Ocean. Organic matter produced near the surface is transferred to the pelagic food web or deep ocean, which leads to sequestration of atmospheric CO2 in the deep Arctic basin (Müller-Karger et al., 2005; Forest et al., 2008; Miquel et al., 2015). Changes in primary production in the Arctic Ocean ultimately lead to variations in the biological pump, which is regarded as a long-term regulatory mechanism for climate change through control of atmospheric CO2 (Falkowski et al., 1998). Therefore, long-term monitoring of POC fluxes in the Arctic Ocean is essential to elucidating changes in the biological pump due to the decline in sea-ice cover.
Long-term sediment traps have been deployed to monitor POC fluxes in areas of the western Arctic Ocean, such as the Laptev Sea, Beaufort Sea, Chukchi Sea, and Canada Basin (O’Brien et al., 2006; Fahl and Nöthig, 2007; Forest et al., 2007; Hwang et al., 2008; Lalande et al., 2009a, b, 2020; Honjo et al., 2010; Watanabe et al., 2014; Miquel et al., 2015; Bai et al., 2019). In the Laptev Sea, where sea ice has decreased by 40% over 20 years, the continuous decrease in sea ice has enhanced POC export, potentially altering the structure of the marine ecosystem (Lalande et al., 2009b). In the Amundsen Gulf (Beaufort Sea), in contrast, POC fluxes decreased over three consecutive years as reduced sea-ice cover led to increased resuspension, which constrained primary production in that region (Lalande et al., 2009b). The effect of sea-ice decline on POC export is expected to vary on a regional scale.
Substantial reductions in sea-ice extent have been observed recently in the Chukchi Sea and East Siberian Sea (Rigor and Wallace, 2004; Rodrigues, 2008; Kwok and Rothrock, 2009). Rodrigues (2008) reported that from 1979 to 2006 the sea-ice extent during summer declined by 61% in the Chukchi Sea and by 46% in the East Siberian Sea. Despite the substantial reductions in the extent of sea ice in the Chukchi Sea and the East Siberian Sea, long-term sediment traps for monitoring POC fluxes have rarely been deployed in these areas (Watanabe et al., 2014; Bai et al., 2019; Lalande et al., 2020). In this study, a sediment trap was deployed on the continental slope (510 m water depth), in the transition area between the Chukchi Sea and Chukchi Abyssal Plain (Figure 1), referred to hereafter as the Chukchi Sea slope. In addition, two sediment traps were deployed on the continental slope (532 m water depth), in the transition area between the East Siberian Sea and Makarov Basin (Figure 1), hereafter designated the East Siberian Sea slope. In this study, we aimed to elucidate spatial and temporal variations in particle fluxes on the Chukchi Sea and East Siberian Sea slopes for the first time and to identify the main processes affecting those variations. Ultimately, the particle fluxes measured under seasonally ice-covered conditions should provide a baseline for understanding POC export and its response to climate change in the Pacific Arctic Ocean.
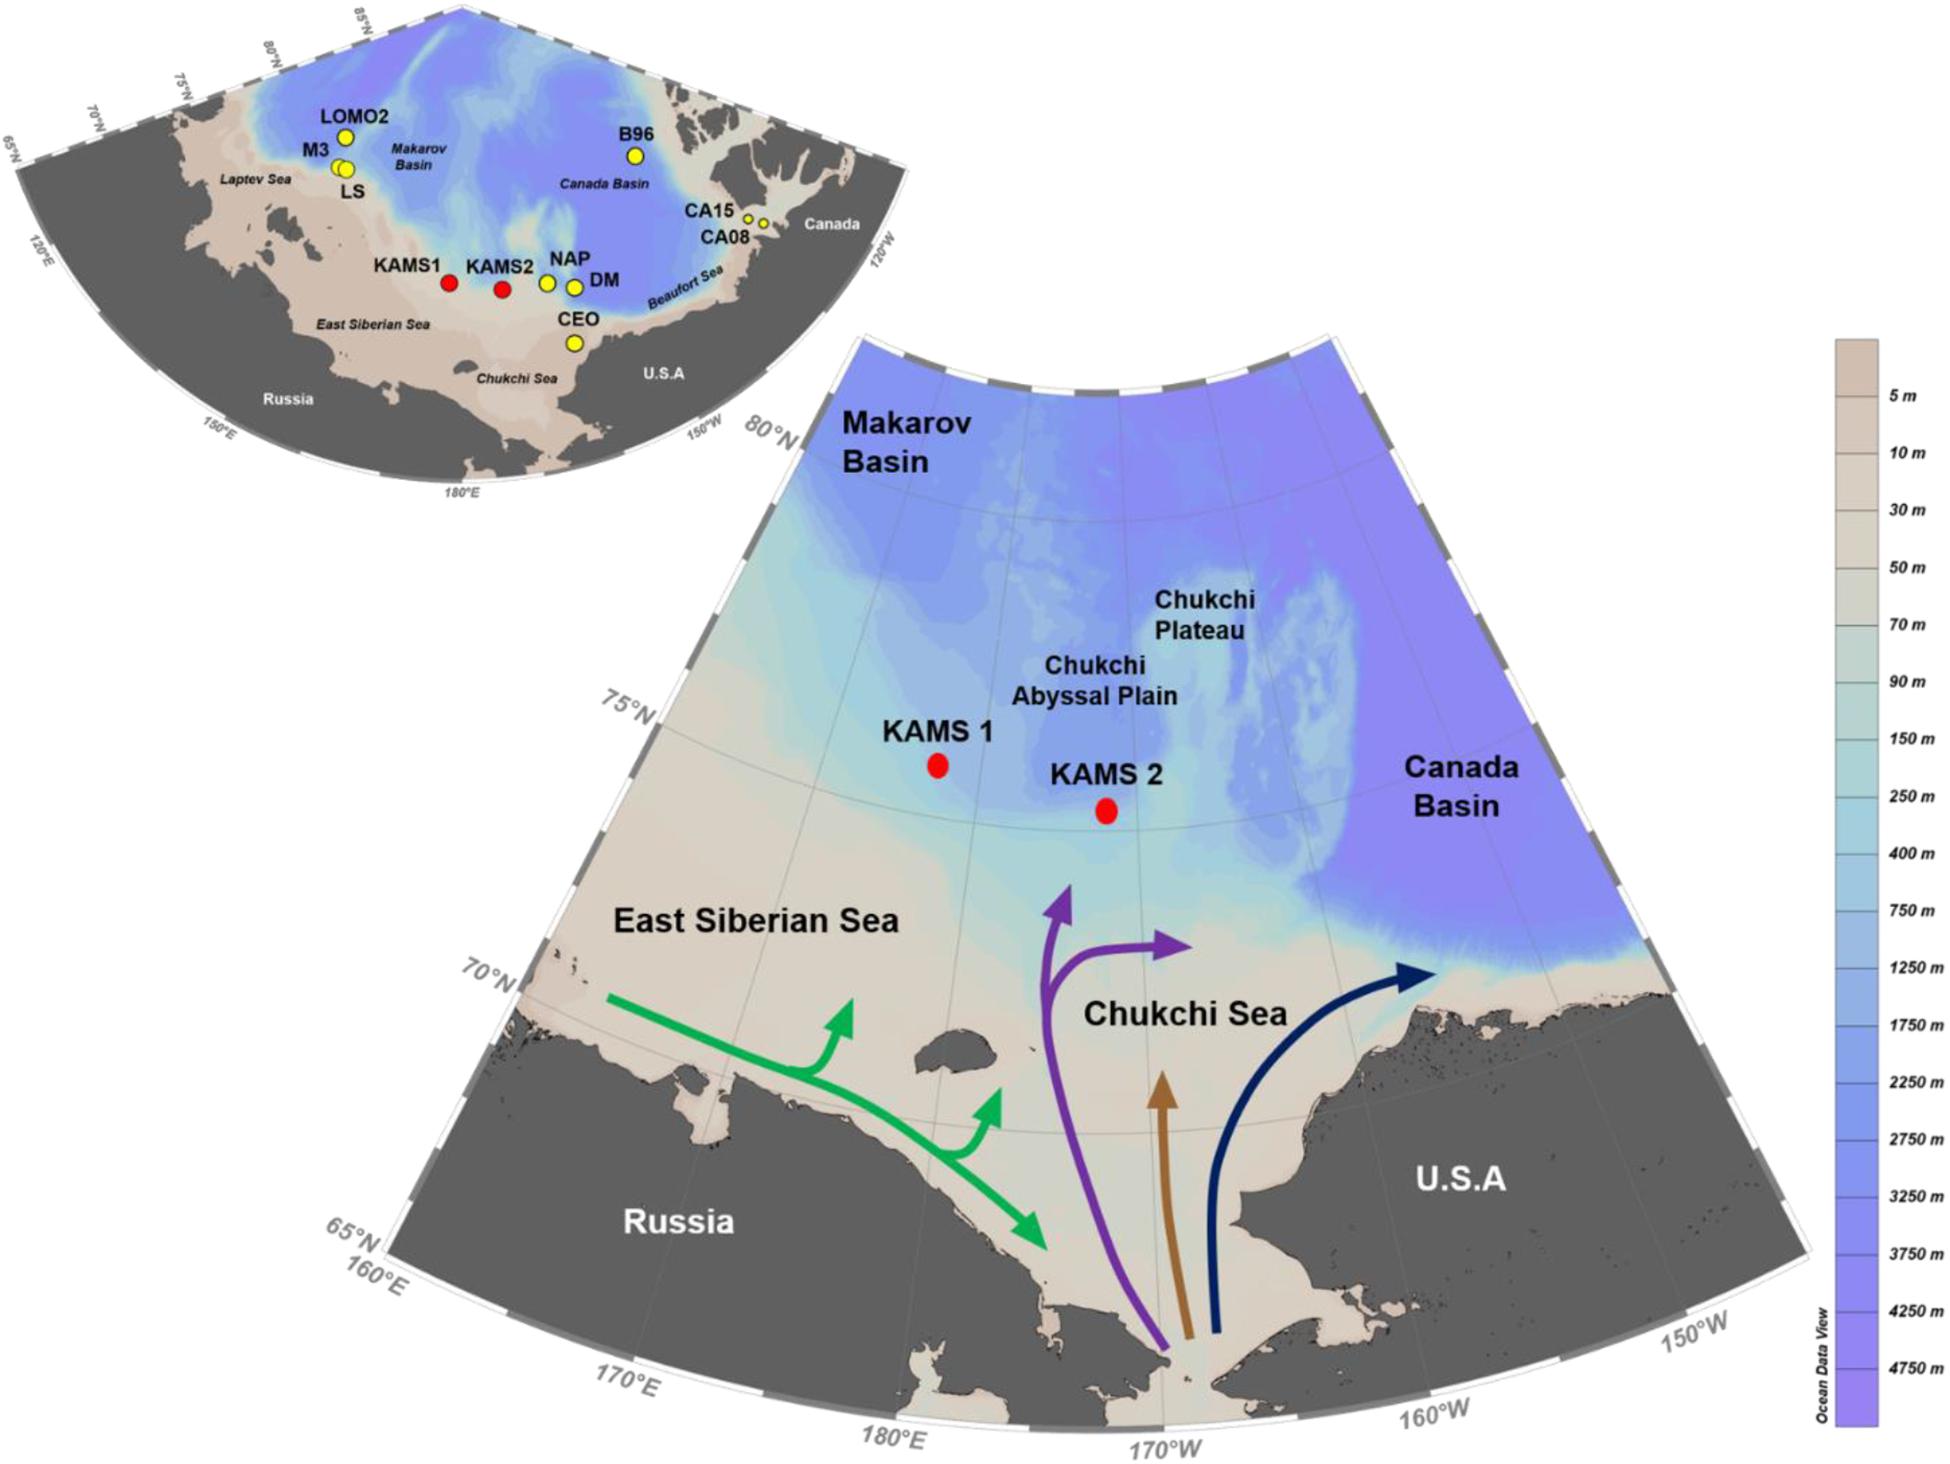
Figure 1. Map showing sediment-trap mooring sites (KAMS 1 and 2) and surface ocean circulation patterns. The blue line indicates Alaska Coastal water, the brown line indicates Bering Sea Shelf water, the purple line indicates Anadyr Water, and the green line indicates the Siberian Coastal Current (after Bai et al., 2019). The inset figure indicates the sediment trap mooring sites presented in Table 2.
Time-series sediment traps (McLane PARFLUX model) with sampling areas of 0.5 m2 and 21 collection cups were deployed over the East Siberian Sea slope (KAMS 1, 75° 79.9′ N, 177° 05.6′ E) from 18 August 2017 to 13 August 2018 and the Chukchi Sea slope (KAMS 2, 75° 24.0′ N, 171° 97.2 W) from 12 August 2017 to 14 August 2018 on board the R/V Araon of the Korea Polar Research Institute (Figure 1). The water depth of the East Siberian Sea slope site was 532 m; two sediment traps were deployed at depths of 115 and 335 m. A sediment trap was also deployed at 325 m on the Chukchi Sea slope, where the water depth was 510 m. Samples were collected at 15-day intervals from April to November and at 1-month intervals during other months. The sample-receiving cup was filled with filtered seawater containing a 10% formalin solution buffered with sodium borate to prevent microbial remineralization of organic matter. Acoustic Doppler current profilers (Teledyne Marine, Workhorse 150 kHz ADCP) for the measurement of current speed and direction were deployed at depths of 110 and 307 m on the East Siberian Sea slope and 297 m on the Chukchi Sea slope. Sea-ice concentration data were obtained from the sea ice data archive1 provided by the University of Bremen. These data had a 3.125-km resolution for the Arctic Ocean and were linearly interpolated into the exact sediment-trap mooring sites.
After recovery, samples were stored at 4°C in a refrigerator until analysis in the laboratory. Recognizable swimmers were removed with forceps prior to dividing each sample into five equal aliquots for analysis using a McLane Wet Sample Divider-10. Three aliquots were combined and rinsed three times with distilled water to eliminate residual formalin solution. The weight of each sample was measured to determine total mass flux after freeze-drying and pulverizing to homogeneity. Total carbon and nitrogen contents were measured using a Carlo-Erba 1110 CNS elemental analyzer with an analytical uncertainty of approximately 3%. Inorganic carbon contents were analyzed using a UIC coulometric carbon analyzer, with analytical error maintained at less than 2%. The POC content was calculated as the difference between the total carbon and inorganic carbon contents. The biogenic silica content was determined through the sequential dissolution method, using 0.5 N NaOH solution at 85°C, which has uncertainty of about 5% (DeMaster, 1981). CaCO3 and biogenic opal contents were estimated by multiplying the inorganic carbon level by 8.33 and that of biogenic silica by 2.4, respectively (Mortlock and Froelich, 1989). Lithogenic flux was determined through subtraction of biogenic flux (biogenic opal, CaCO3, organic matter; POC×2.5) from total mass flux (Fischer and Wefer, 1996; Palanques et al., 2005). Temperature and salinity were measured with a SeaBird conductivity-temperature-depth sensor (CTD; SBE 9/11 plus, SeaBird Inc., Bellevue, WA, United States). Seawater samples were collected for nitrate and chlorophyll-a analyses using a rosette sampler with 10-L Niskin bottles mounted on a CTD assembly just after the sediment trap deployment. Water samples for nitrate analysis were collected from the Niskin bottles into 50-mL conical tubes and immediately stored in a refrigerator at 4°C prior to chemical analysis. Nitrate concentrations were measured shipboard using a four-channel continuous auto-analyzer (QuAAtro, Seal Analytical, Germany). Reference materials for nutrients in seawater provided by “KANSO Technos” (Lot. No. “BV”) were measured together with standards in every batch analyzed. The analytical error for nitrate was ± 0.14 μmol kg–1. Water samples for chlorophyll-a analysis were filtered through GF/F filters (47 mm, Whatman). Chlorophyll-a concentrations in extracted filtrate mixed with 90% acetone for 24 h were determined shipboard using a fluorometer (Trilogy; Turner Designs, United States) that had been previously calibrated against pure chlorophyll-a (Sigma, United States) following the method of Parsons et al. (1984).
On the East Siberian Sea slope, the sea-ice concentration was about 75% at the time of sediment trap deployment, and remained above 50% during the period August to September 2017, except in mid-September, when it dropped below 50% (Figure 2). Sea-ice concentrations over 90% were then maintained from October 2017 to July 2018, followed by melting in late July until reaching 0% in early August. On the East Siberian Sea slope, the current generally flowed southward from August to December 2017 and then shifted to northward flow from January to August 2018 at 110 m, with an average velocity of 2.98 cm s–1; in contrast, at 307 m, flow was steadily southward, with an average velocity of 2.78 cm s–1 (Figure 2).
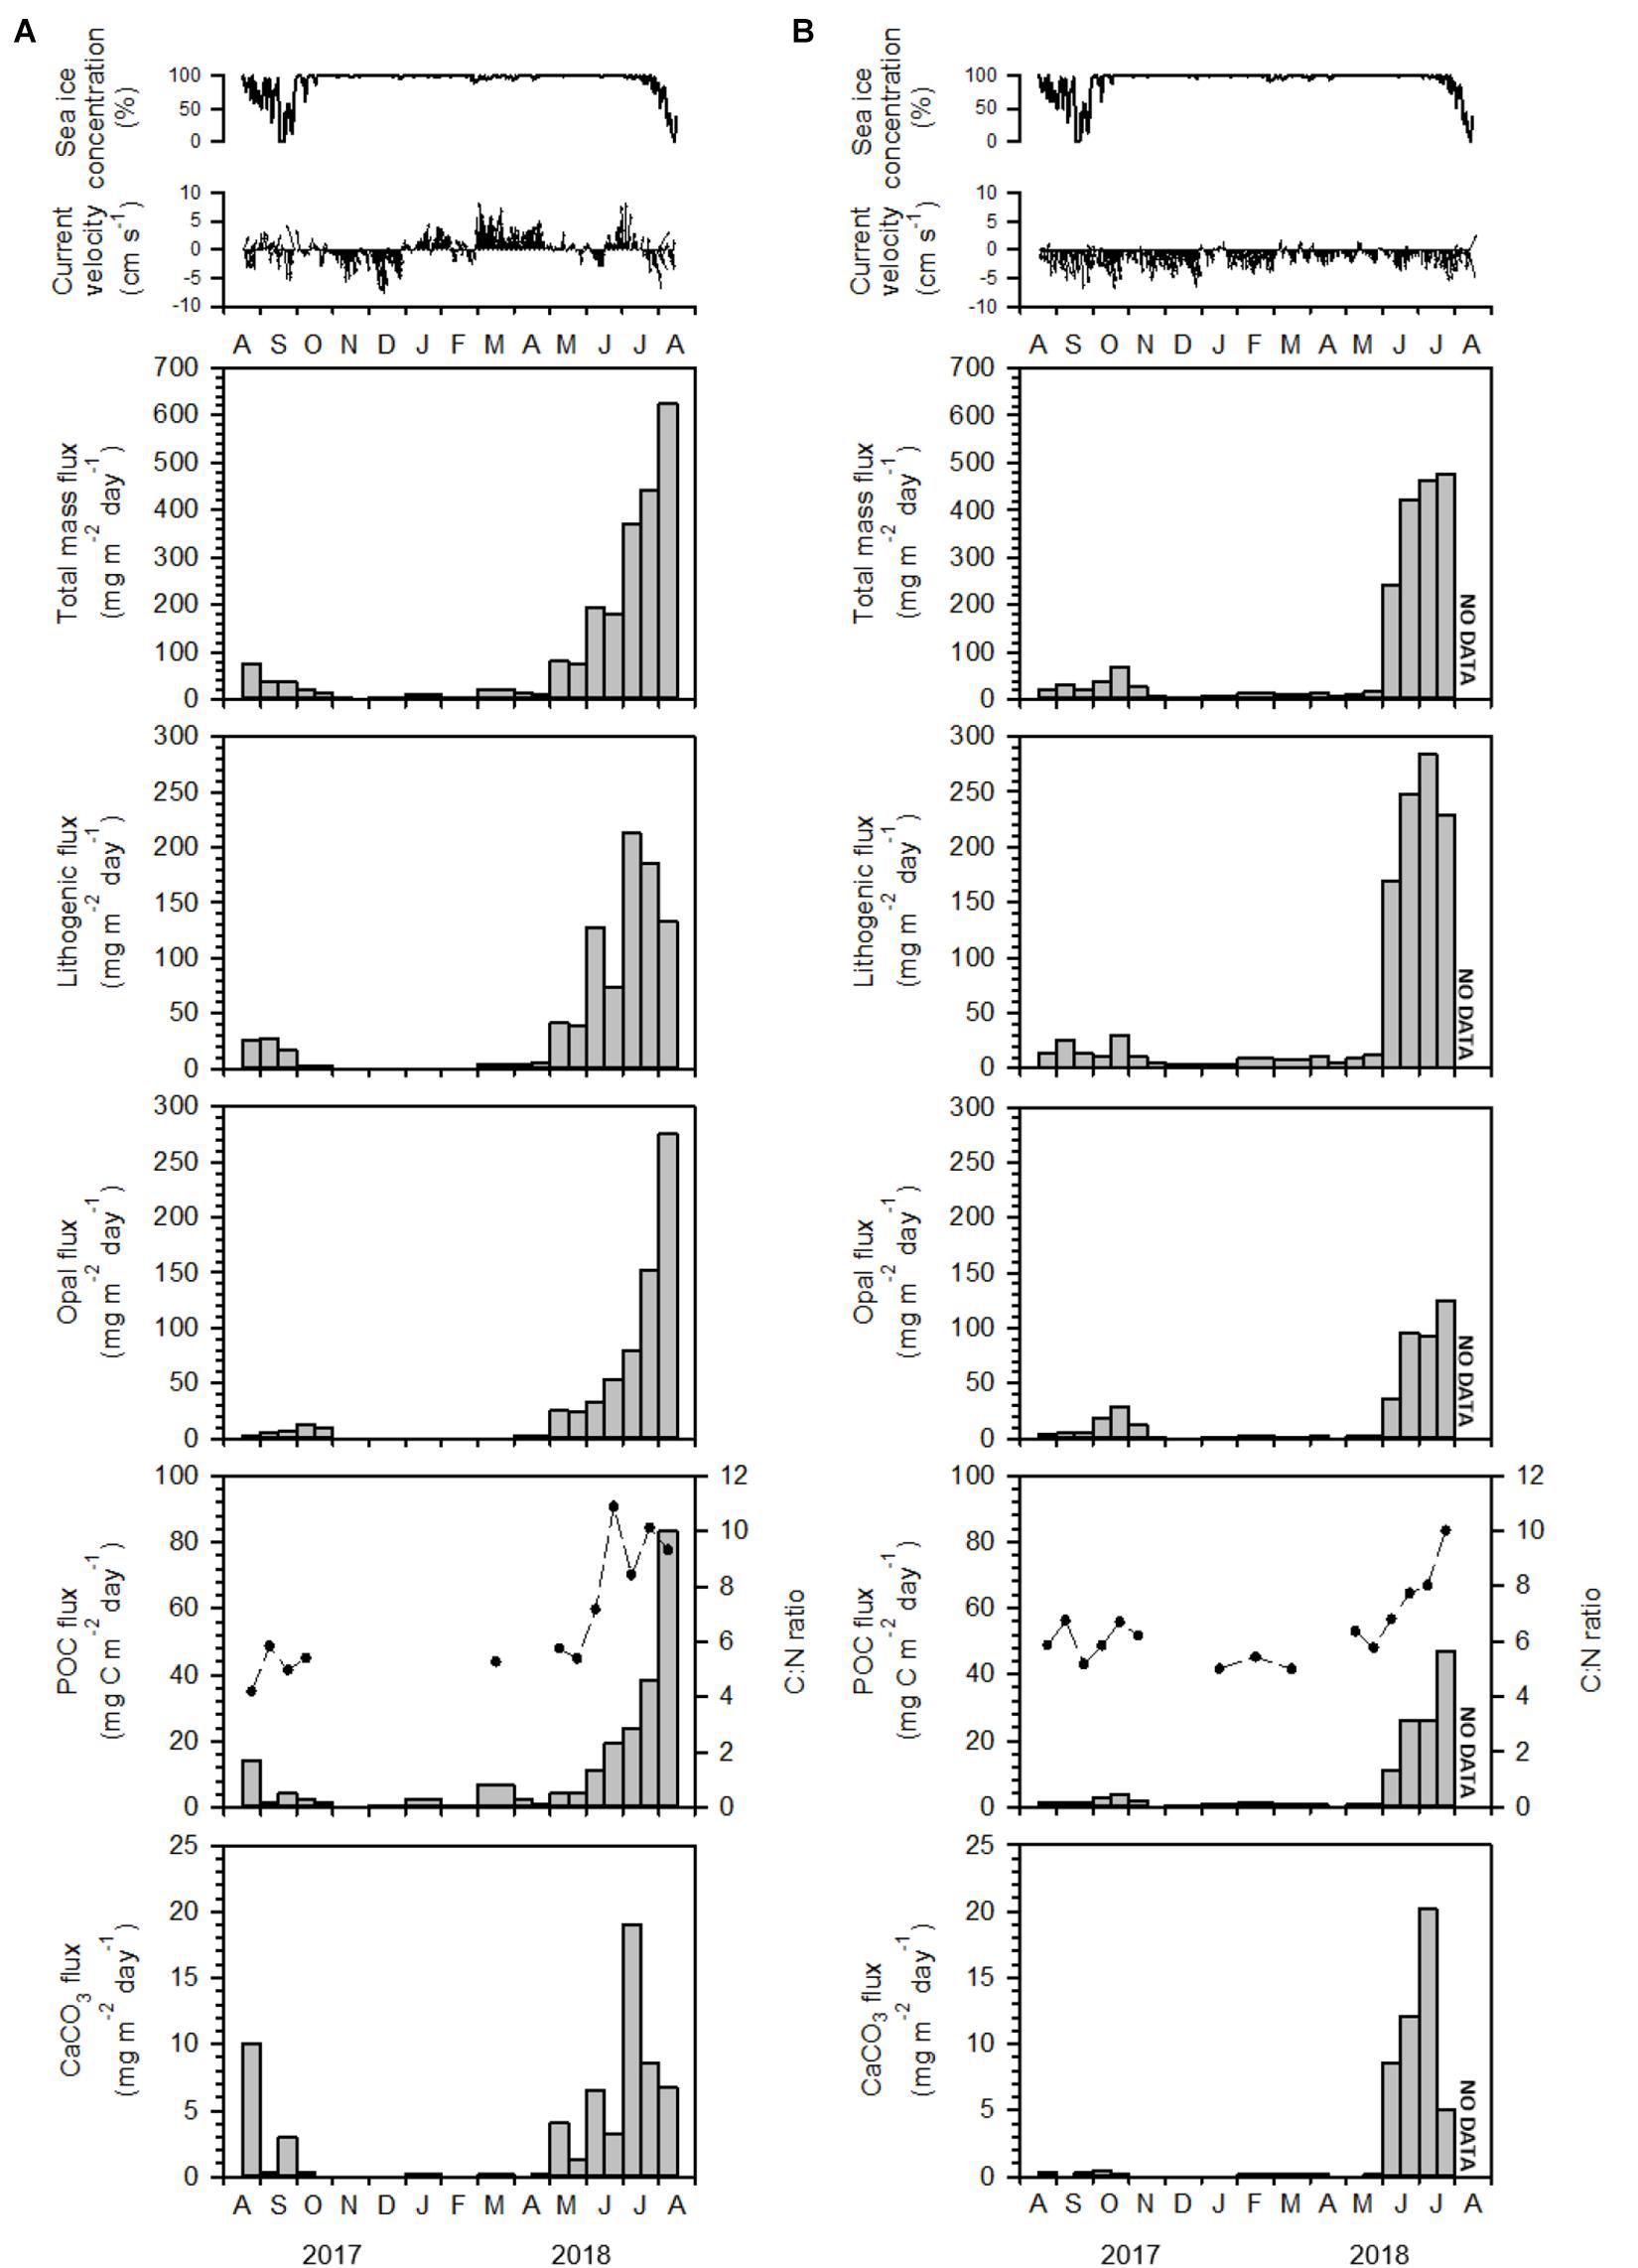
Figure 2. Sea-ice concentration, current velocity, total mass flux, POC flux (vertical bar), C:N ratio (dashed line), biogenic opal flux, CaCO3 flux, and lithogenic flux at water depths of 115 m (A) and 335 m (B) on the East Siberian Sea slope (KAMS 1) from August 2017 to August 2018.
Particle fluxes at water depths of 115 and 335 m on the East Siberian Sea slope showed clear seasonal variations, with high values in summer and low values in other seasons (Figure 2). Notably high particle fluxes were observed at 115 m in August 2018 and at 325 m in July 2018, but no such high flux was recorded at both depths in August 2017. Total mass flux at 115 m varied between 1.67 and 624 mg m–2 day–1, with the lowest value in late November 2017 and the highest value in early August 2018 (Figure 2A). Lithogenic flux was the main component, comprising 49% of the total mass flux, and ranging from not determined (n.d.) to 213 mg m–2 day–1, with the highest value in early July 2018 (Figure 2A). The contributions of biogenic flux decreased in the order of biogenic opal, POC, and CaCO3, comprising 26, 8.8, and 3.6% of the total mass flux, respectively (Figure 2A). Biogenic opal flux varied between n.d. and 276 mg m–2 day–1, with the highest value in early August 2018. POC flux ranged from n.d. to 83.3 mg m–2 day–1, and CaCO3 flux varied between n.d. and 19.0 mg m–2 day–1. Organic carbon:total nitrogen (C:N) ratios ranged from n.d. to 10.9, with the highest value in late June 2018 (Figure 2A).
Temporal variations in particle flux at a water depth of 335 m were generally similar to those at 115 m (Figure 2B). The last sampling bottle was lost during the sediment trap recovery. Total mass flux at 335 m ranged from 4.96 to 475 mg m–2 day–1, with the lowest value in December 2017 and the highest value in late July 2018 (Figure 2B). The contribution of each component to total mass flux decreased in the order lithogenic material, biogenic opal, POC, and CaCO3, with contributions of 58, 23, 6.7, and 2.5%, respectively (Figure 2B). Lithogenic flux ranged from 2.93 to 289 mg m–2 day–1, with the lowest value in December 2017 and the highest value in early July 2018 (Figure 2B). Biogenic opal flux varied from 1.01 to 124 mg m–2 day–1, with the lowest value in December 2017 and the highest value in late July 2018. POC flux ranged from 0.29 to 46.4 mg m–2 day–1 and CaCO3 flux varied from 0.02 to 20.2 mg m–2 day–1. C:N ratios ranged from 5.0 to 10.0, with the lowest value in March 2018 and the highest value in late July 2018 and (Figure 2B).
On the Chukchi Sea slope, the sediment trap was deployed under ice-free conditions, which were maintained until mid-October 2017 (Figure 3). Sea ice completely covered the area from December 2017 to June 2018, began to melt in mid-July and dropped to 0% in late August. On the Chukchi Sea slope, current direction shifted repeatedly between southward and northward, with an average velocity of 4.17 cm s–1 (Figure 3), which was somewhat higher than those of the East Siberian Sea slope. Current velocities rarely exceeded 10 cm s–1 at the sediment-trap mooring sites.
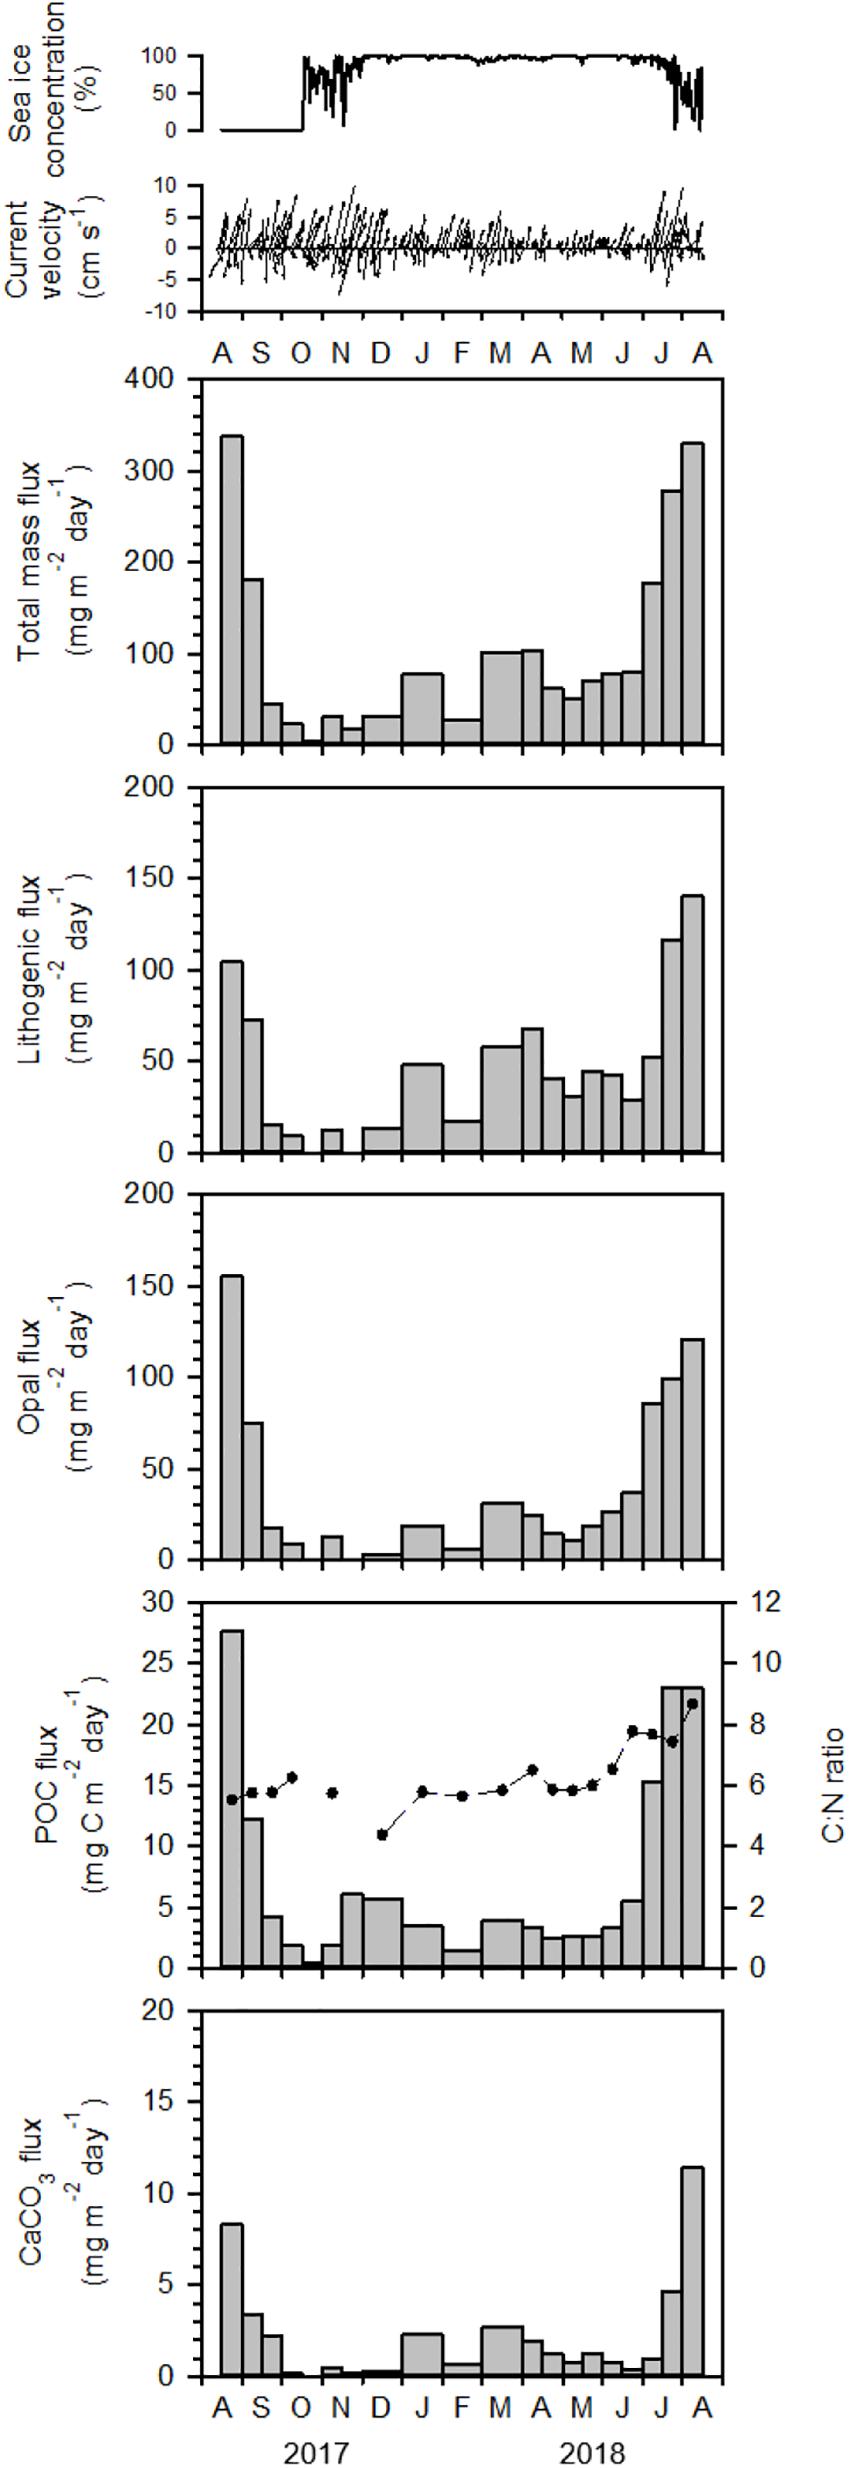
Figure 3. Sea-ice concentration, current velocity, total mass flux, POC flux (vertical bar), C:N ratio (dashed line), biogenic opal flux, CaCO3 flux, and lithogenic flux at 325 m water depth in the Chukchi Sea (KAMS 2) from August 2017 to August 2018.
On the Chukchi Sea slope, particle fluxes at a water depth of 325 m also showed clear seasonal variations, with high values in summer and low values in other seasons (Figure 3). In contrast to the East Siberian Sea slope, particle fluxes in this area were relatively high in the summers of both 2017 and 2018 (Figure 3). Total mass flux ranged from 4.09 to 337 mg m–2 day–1, with the lowest value in late October 2017 and the highest value in late August 2017 (Figure 3). Lithogenic flux was the main component, comprising 43% of the total mass flux, and varied from n.d. to 140 mg m–2 day–1, with the highest value in early August 2018 (Figure 3). The contributions to biogenic flux decreased in the order biogenic opal, POC, and CaCO3, which accounted for 37, 7.1, and 2.1% of the total mass flux, respectively (Figure 3). Biogenic opal flux varied between n.d. and 155 mg m–2 day–1, with the highest value in early August 2017. POC flux ranged from 0.42 to 27.7 mg m–2 day–1, and CaCO3 flux varied between 0.20 and 11.4 mg m–2 day–1. C:N ratios ranged from n.d. to 8.66, with the highest value in early August 2018 (Figure 3).
On the East Siberian Sea slope, particle flux showed a unique pattern of temporal variation; total mass flux at 115 m water depth in early August 2018 was more than eight times higher than that in late August 2017 (Figure 2). The particle composition also exhibited large differences; POC flux was six times higher in early August 2018 than in late August 2017, and biogenic opal flux was two orders of magnitude higher, whereas CaCO3 flux did not differ significantly between years (Figure 2). The total mass flux in September 2017 was not significantly different from that observed during winter (December–February). Therefore, particle flux in September 2017 was similar to the winter value, whereas particle flux in August 2018 was an order of magnitude greater than the winter value. We investigated the causes of this large difference in particle flux between August 2017 and August 2018. The chlorophyll-a concentration observed at the sediment trap mooring site showed a large difference between August 2017 and 2018 (Figure 4). Depth-integrated chlorophyll-a was 140 mg m–2 in August 2018, which was an order of magnitude higher than that (11.4 mg m–2) in August 2017. This large difference in chlorophyll-a concentrations may reflect differing biological production at the surface. A high nitrate concentration (7.3 μmol L–1) was observed within the upper 25 m in August 2018 (Figure 4), which would have provided sufficient nutrients for biological production at the surface. This high nitrate concentration was probably associated with inflow of nutrient-enriched shelf waters from the East Siberian Sea (Nishino et al., 2013; Anderson et al., 2017). Nishino et al. (2013) reported that shelf waters formed through winter cooling and advection in the East Siberian Sea flowed into the Makarov Basin, producing a temperature minimum zone with high nutrients and causing shoaling of the nutricline. Anderson et al. (2017) suggested that nutrient-rich water was exported from the East Siberian Sea into the Makarov Basin with a salinity of around 33. Thus, the high nitrate concentration at the surface in August 2018 was due to intrusion of cold and nutrient-enriched shelf water. Nishino et al. (2013) also found that export of large volumes of shelf water occurred episodically in the East Siberian Sea; this phenomenon was observed in 2008, but not in 2002. In the East Siberian Sea, episodic intrusion of nutrient-enriched shelf water is the primary mechanism driving large inter-annual variations in biological production and associated particle flux.
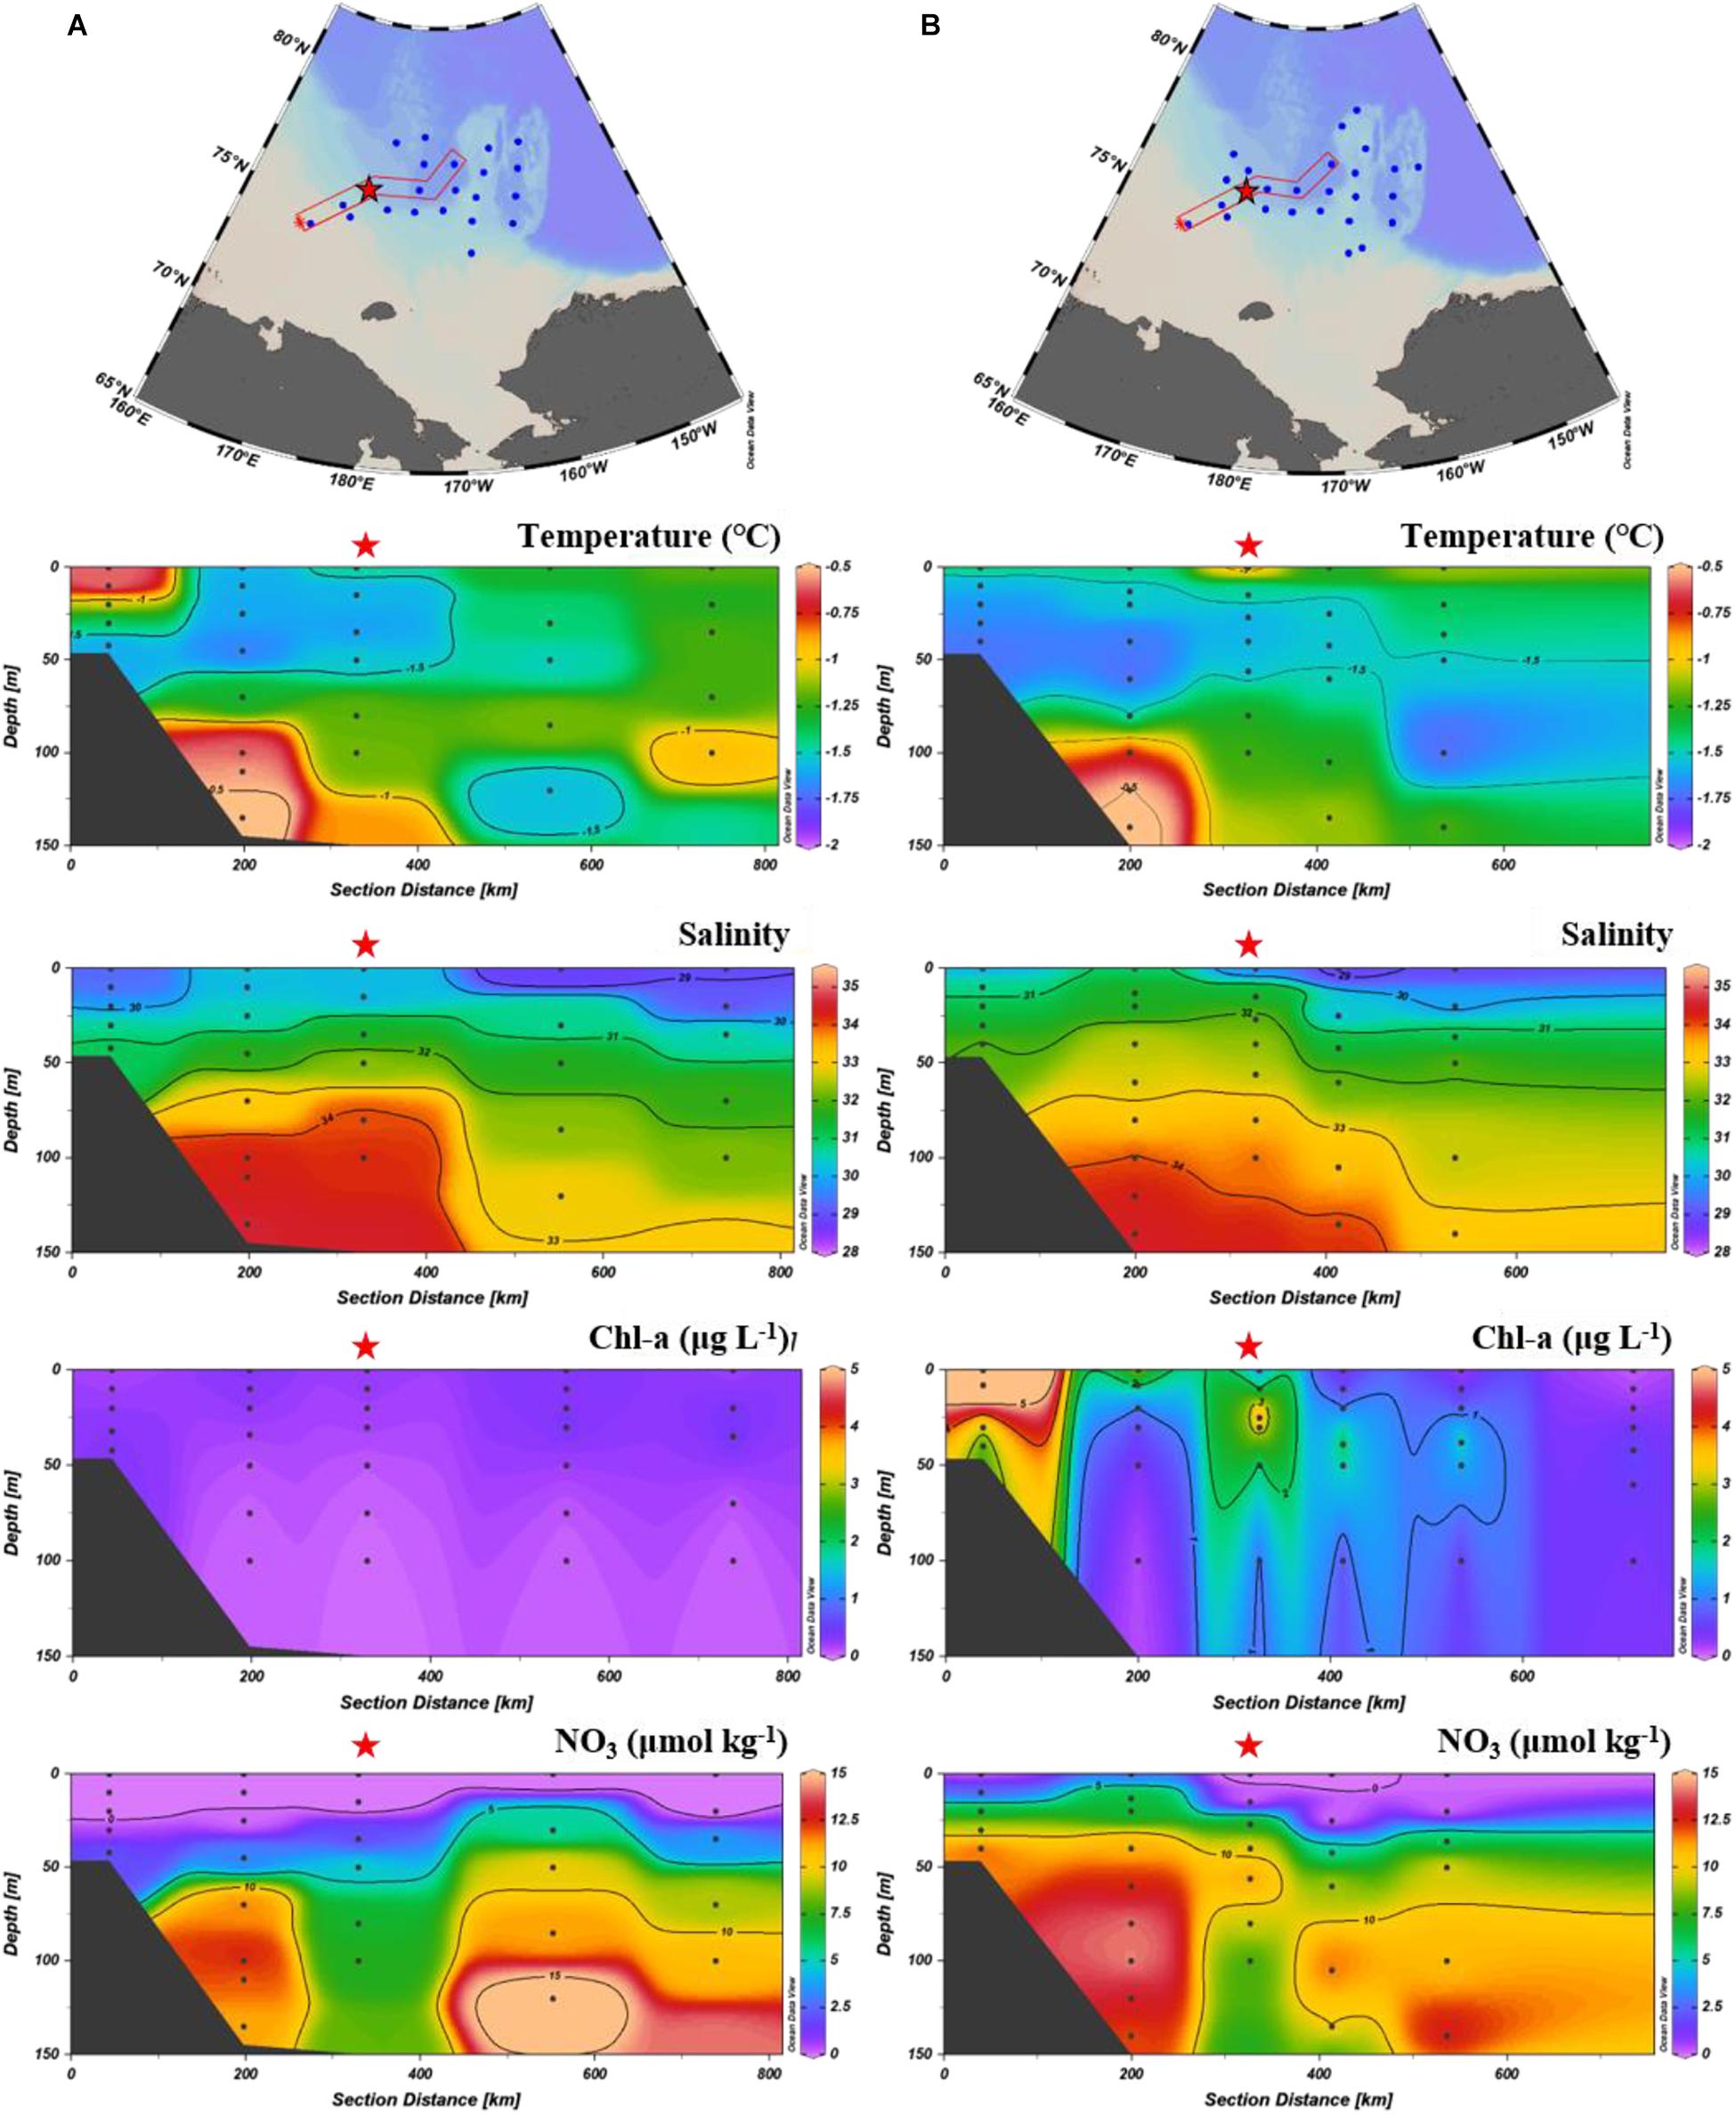
Figure 4. Vertical distribution of temperature, salinity, chlorophyll-a, and nitrate along the transect on the East Siberian Sea slope (KAMS 1) in August 2017 (A) and August 2018 (B). Red star indicates a sediment trap mooring site.
Temporal variations in particle fluxes on the Chukchi Sea slope differed markedly from those on the East Siberian Sea slope, showing similar total mass fluxes in early August 2017 and late August 2018 (Figure 3). Particle composition also indicated similar fluxes in the summers of 2017 and 2018 (Figure 3). On the Chukchi Sea slope, particle flux had a seasonal pattern typical of the Arctic Ocean, with high values in summer and low values in other seasons (Fahl and Nöthig, 2007; Lalande et al., 2009b; Forest et al., 2010). Unlike the East Siberian Sea slope, the Chukchi Sea slope displayed little inter-annual particle flux variation, which was based on the similar total mass fluxes in in early August 2017 and late August 2018 (Figure 3). The vertical nitrate profile observed at the sediment-trap mooring site in August 2017 was generally similar to that in August 2018 (Figure 5). In addition, the chlorophyll-a vertical profile from August 2017 did not significantly differ from that in August 2018 (Figure 5). The Chukchi Sea slope is influenced by the inflow of Anadyr Water, which is characterized by high salinity and high nutrient concentrations (Nishino et al., 2016; Bai et al., 2019). Some of the Anadyr Water turns eastward and flows toward the Beaufort Sea on the shelf break (Weingartner et al., 2005), while the rest flows poleward beyond the shelf break and may have affected the mooring site. The poleward flow of Anadyr Water may show little annual variation, as the vertical nitrate profiles measured in the summers of 2017 and 2018 were similar (Figure 5). On the Chukchi Sea slope region, the temporal evolution of POC flux reflected the seasonal dynamics of biological production at the surface. As sea ice began to melt in July, POC flux increased, reaching a peak in August. In September, when the surface was still ice free, POC flux decreased rapidly and reached its minimum value, likely due to exhaustion of the nutrients in surface waters through biological uptake and the rapidly declining sunlight. The summer POC flux comprised about 75% of the annual POC flux, which was a typical pattern of POC export in the Arctic Ocean (Fahl and Nöthig, 2007; Lalande et al., 2009b; Forest et al., 2010).
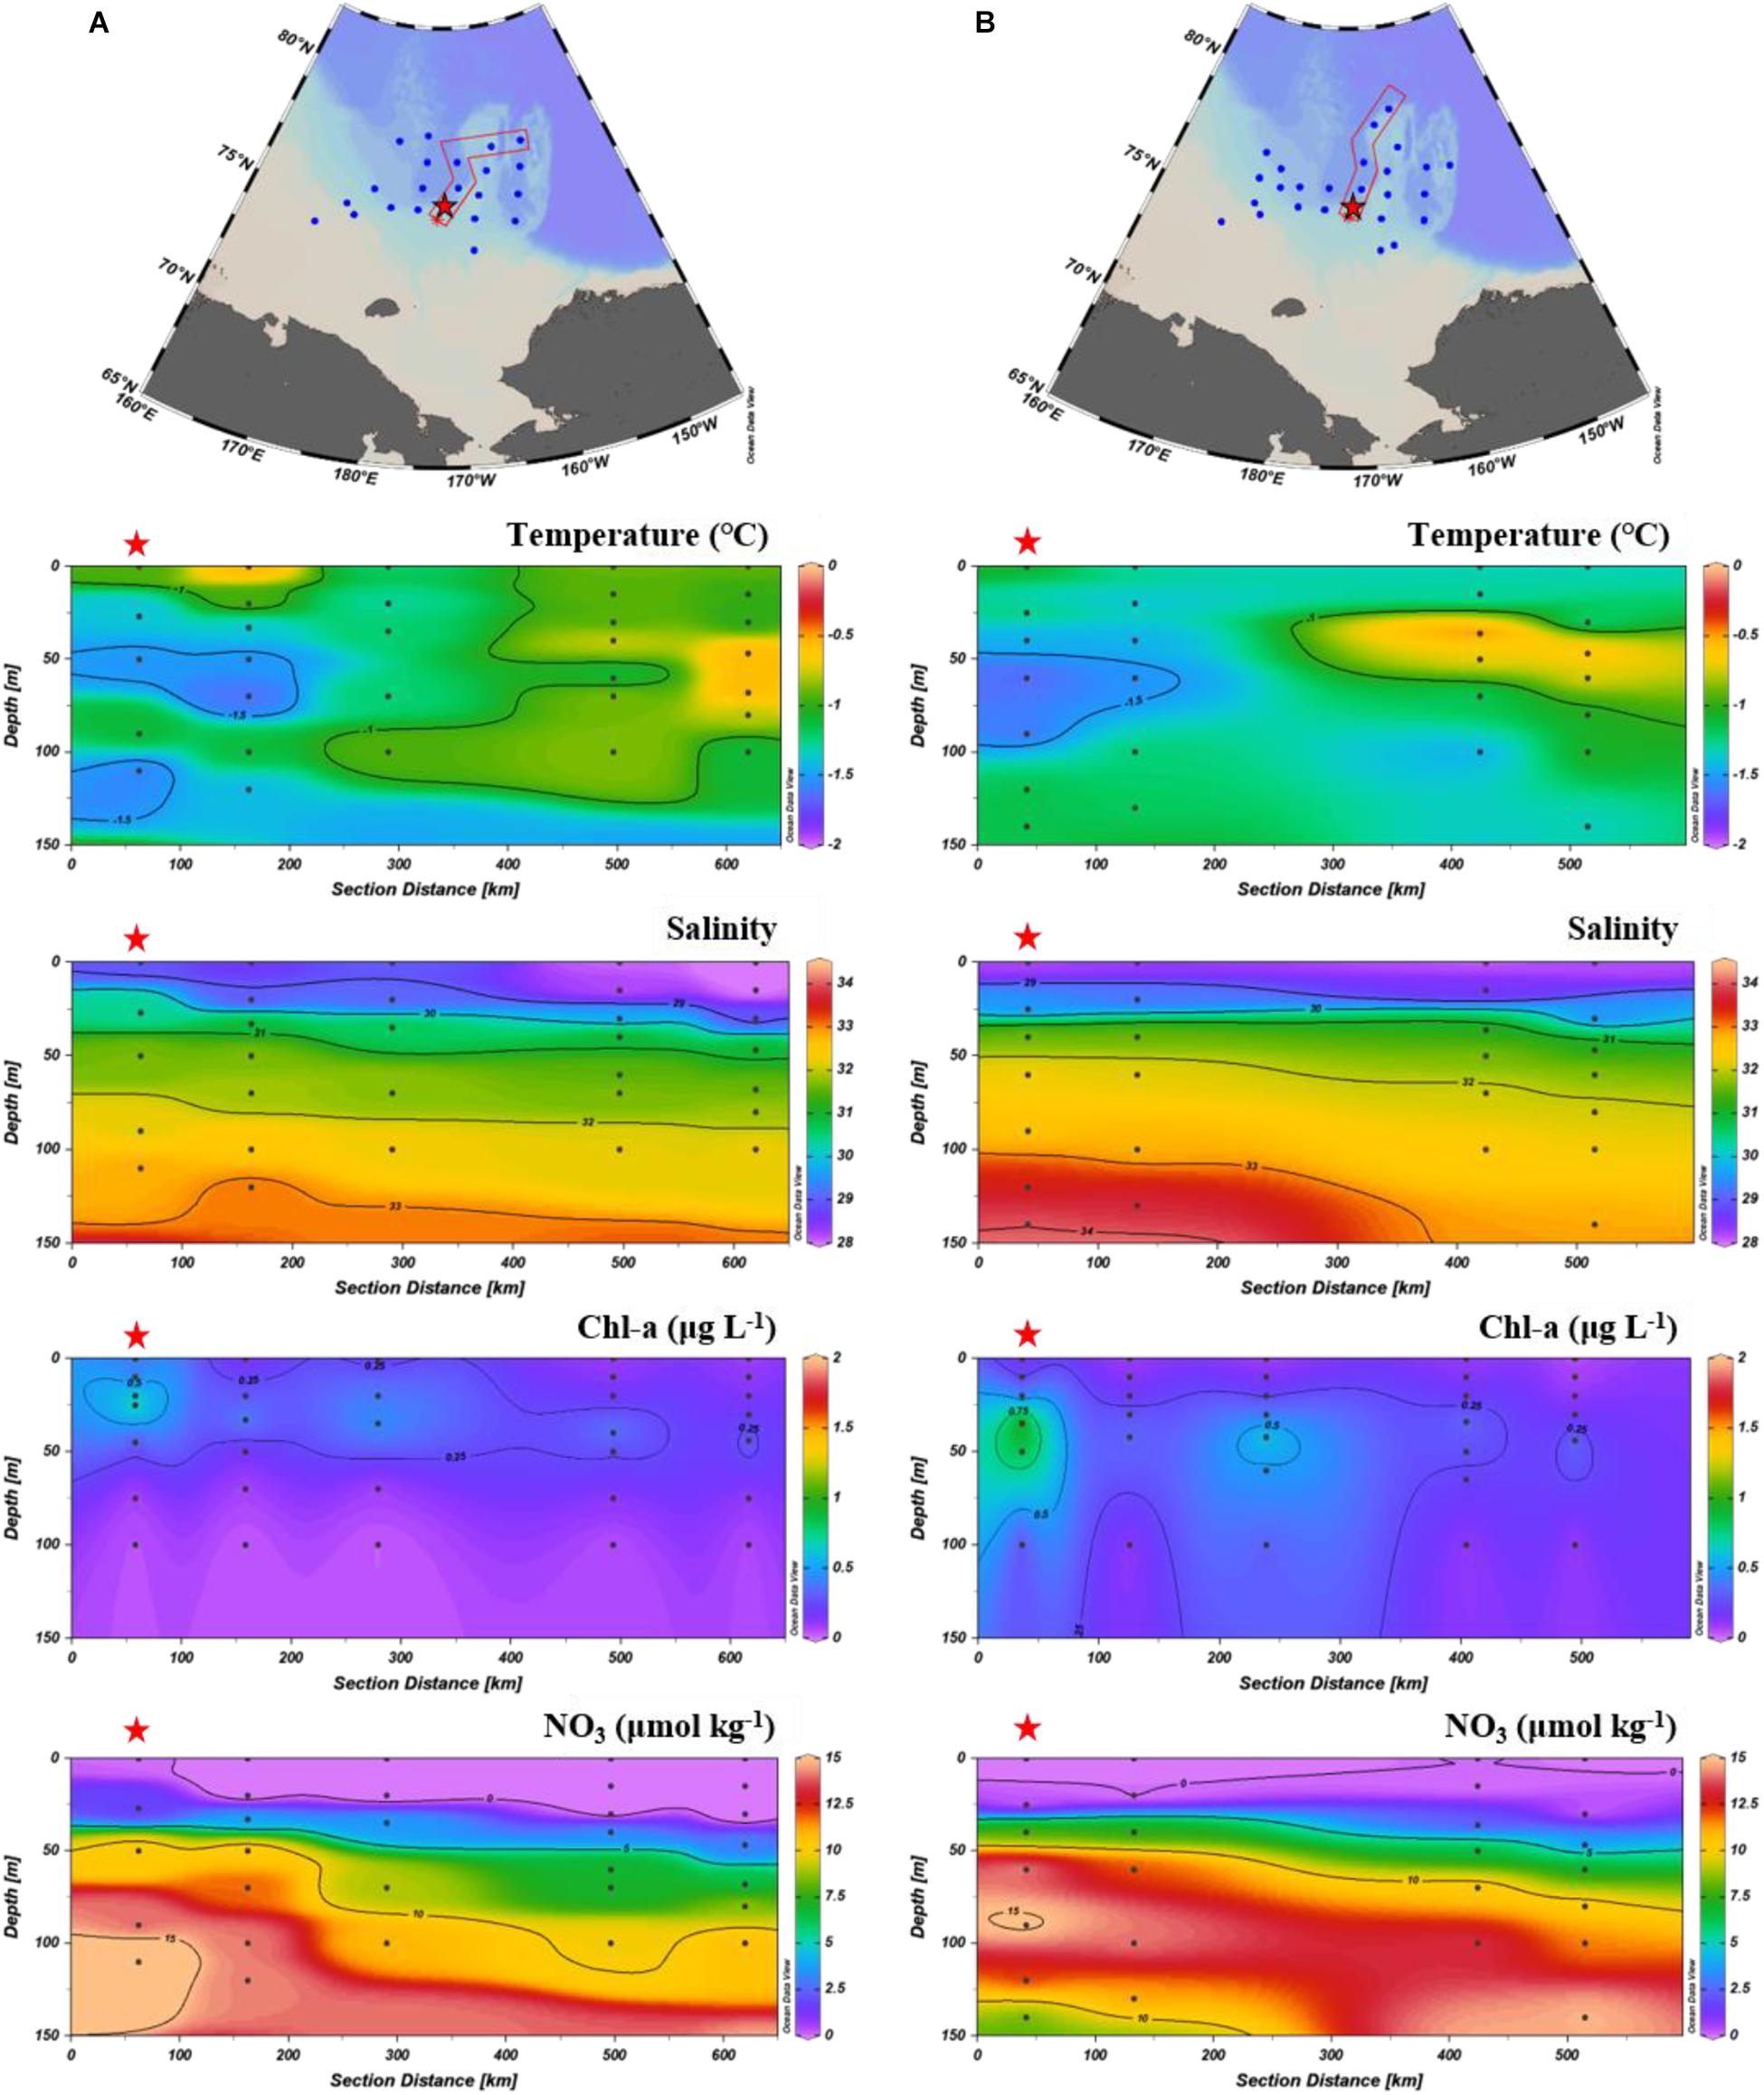
Figure 5. Vertical distribution of temperature, salinity, chlorophyll-a, and nitrate along the transect on the Chukchi Sea slope (KAMS 2) in August 2017 (A) and August 2018 (B). Red star indicates a sediment trap mooring site.
On the East Siberian Sea slope, POC flux increased rapidly from June to August 2018 at both 115 and 335 m water depths (Figure 2). In particular, when the surface was completely covered with sea ice during June and July 2018, POC fluxes showed a marked increase compared to those in winter and spring. In addition, biogenic opal fluxes also exhibited a large increase during June and July 2018, having almost same temporal variation with POC fluxes (Figure 2), which indicates that siliceous phytoplankton is a main contributor for the POC increase. This increase in POC export prior to sea-ice melting may have been associated with an under-ice phytoplankton bloom; such blooms have been observed frequently in the Arctic Ocean (Fortier et al., 2002; Sakshaug, 2004; Lalande et al., 2007, 2009b; Arrigo et al., 2012). The increase of POC flux during June and July 2018 occurred simultaneously at both 115 and 335 m, indicating that it was directly related with an under-ice phytoplankton bloom.
The under-ice phytoplankton bloom was probably initiated by the snowmelt on top of sea-ice, which enhanced the incident light and, thereby, encouraged under-ice phytoplankton production (Dezutter et al., 2019; Lalande et al., 2019, 2020). Notably, the C:N ratio of organic matter increased rapidly from 5.8 to 10.9 at 115 m during the summer of 2018 (Figure 2). As the transparent exopolymer (TEP) produced by ice algae has a very high C:N ratio greater than 20 (Engel and Passow, 2001; Forest et al., 2007), the increases in POC flux and C:N ratio under the sea ice were likely related to TEP production by ice algae. Lalande et al. (2009b) observed that the C:N ratio increased concurrently with POC flux in the Laptev Sea and Beaufort Sea, and suggested that the increase in POC flux was due to TEP produced by ice algae. Increases in POC fluxes and C:N ratio under sea ice have also been observed in the Amundsen Gulf (Forest et al., 2010). C:N ratio can be affected by the change in phytoplankton community structure and grazing habits and, thereby, data on phytoplankton and zooplankton composition are required to confirm that the increase of C:N ratio is directly related with the TEP production.
On the Chukchi Sea slope, POC fluxes began to increase in July 2018, when the sea ice began to decline (Figure 3). The increase in POC flux coincided with the retreat of sea ice, and thus sea-ice melting may have led to release of ice algae resulting in an under-ice phytoplankton bloom (Lalande et al., 2009b). The C:N ratio of organic matter increased concurrently with POC flux in the summer of 2018 (Figure 3), which probably resulted from TEP production by ice algae. POC flux showed a marked increase in the summers of both 2017 and 2018 compared to levels in winter and spring (Figure 3). However, the C:N ratio of organic matter showed a clear increase only in summer 2018 (Figure 3), indicating that the increase in POC flux in summer 2017 was not associated with TEP production by ice algae. TEP production probably occurred prior to the sediment trap sampling, which was done in late August 2017.
On the East Siberian Sea slope, annual mass fluxes were 25.2 and 29.6 g m–2 year–1 at water depths of 115 and 335 m, respectively (Table 1), indicating that particle fluxes increased slightly with increasing water depth. Lithogenic and biogenic opal fluxes also increased by 43 and 4.0%, respectively, from 115 to 335 m (Table 1). However, POC and CaCO3 fluxes decreased by 12 and 16%, respectively, over the same depth interval (Table 1). The annual POC flux was 2.03 g m–2 year–1 at 335 m (Table 1), but the inferred vertical POC flux at 335 m based on Martin’s curve (Martin et al., 1987) was about half of the observed POC flux at 335 m, indicating additional POC input through lateral transport between 115 and 335 m. High POC fluxes were observed during June and July 2018 (Figure 2), mainly due to enhanced biological production driven by the intrusion of nutrient-rich shelf waters (Nishino et al., 2013; Anderson et al., 2017). Thus, POC may be laterally transported to the slope when nutrient-rich shelf waters flowed from the East Siberian Sea to the Makarov Basin.
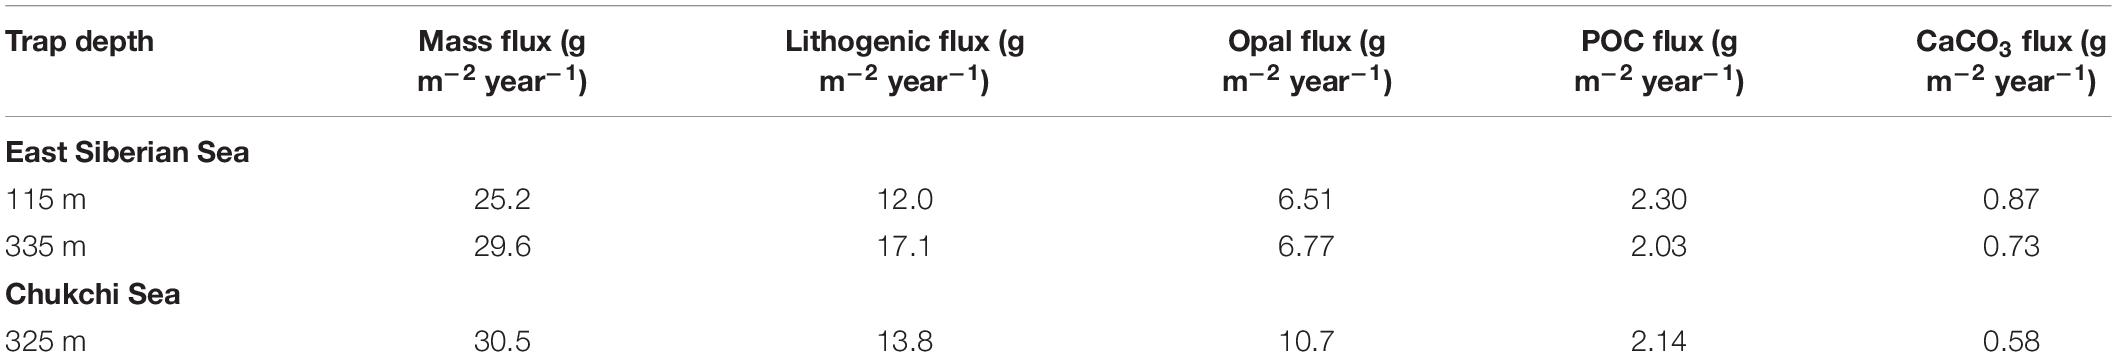
Table 1. Annual fluxes of total mass flux, lithogenic flux, biogenic opal flux, POC flux, and CaCO3 flux on the East Siberian Sea slope (KAMS 1) and the Chukchi Sea slope (KAMS 2) from August 2017 to July 2018 (348 days).
Lithogenic flux increased by 43% from 115 to 335 m, likely as a result of the lateral transport of small lithogenic particles from the shallow shelf when shelf waters flowed to the Makarov Basin, as observed for POC. Bauerfeind et al. (2005) reported that clay minerals (<4 μm) dominated the lithogenic particle pool of the Greenland continental shelf. Biogenic opal fluxes increased by 4.0% between 115 and 335 m, and this small increase appeared to result from reduced lateral transport of diatoms away from the shelf due to their relatively large size (2–500 μm) compared to lithogenic particles. Unlike biogenic opal and lithogenic fluxes, CaCO3 flux decreased by 16% between 115- and 335-m water depths. CaCO3-undersaturated waters were found at depths of 50–250 m in the East Siberian Sea slope region (Mo et al., in preparation), leading to dissolution of CaCO3 shells during sinking from 115 to 335 m. For this reason, the CaCO3 flux decreased from 115 to 335 m, despite additional CaCO3 inputs through lateral transport.
The annual POC fluxes on the East Siberian Sea slope from August 2017 to August 2018 were 2.3 g C m–2 year–1 at 115 m and 2.0 g C m–2 year–1 at 335 m (Table 2). The annual POC flux at 325 m on the Chukchi Sea slope was 2.1 g C m–2 year–1, rather similar to that in the East Siberian Sea slope area (Table 2). On the Chukchi Rise, where the water is deeper than 1500 m, annual POC fluxes were 0.31 and 1.9 g C m–2 year–1, which were somewhat lower than those measured on the Chukchi Sea slope (Table 2). On the Chukchi shelf, where the water depth is 45 m, annual POC flux was 145 g C m–2 year–1 (Table 2), which is two orders of magnitude higher than values for the Chukchi and East Siberian Sea slopes. Lalande et al. (2020) attributed the substantial export flux in the Chukchi shelf area to the combined effects of substantial primary production driven by high nutrient loads, ice-released materials, and resuspension from the shallow Arctic shelf.
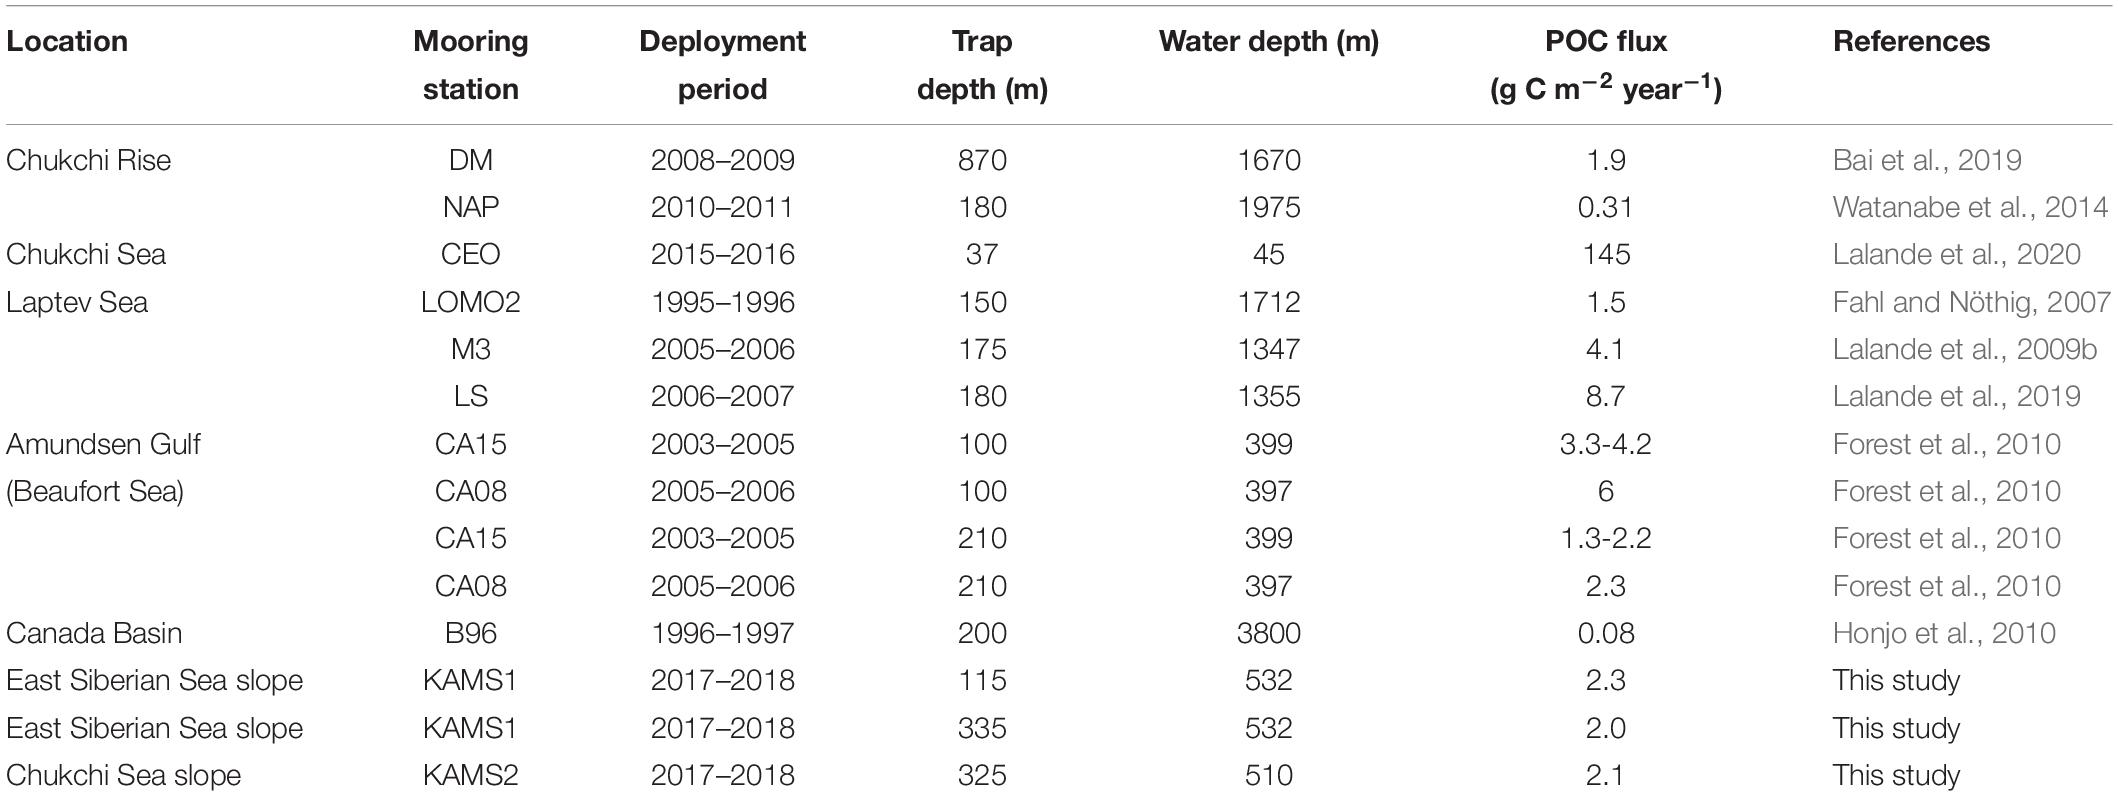
Table 2. Annual POC fluxes in the western Arctic Ocean.
Annual POC fluxes on the Laptev Sea slope region were 1.5 g C m–2 year–1 in 1995–1996 and 4.1 g C m–2 year–1 in 2005–2006, a threefold increase over a decade (Table 2). Lalande et al. (2009a) reported that reduction of ice cover increased primary production and subsequently increased POC flux over the continental slope of the Laptev Sea. In 2006–2007, annual POC flux increased to 8.7 g C m–2 year–1, of which increase was attributed to a large release of ice-rafted particulate matter during ice melt due to a complete melt in July 2007 (Lalande et al., 2019). On the Amundsen Gulf (Beaufort Sea), annual POC fluxes in 2004, 2005, and 2006 were 3.3, 4.2, and 6.0 g C m–2 year–1 at 100-m depth, respectively, and 1.3, 2.2, and 3.3 g C m–2 year–1 at 210 m (Table 2). Forest et al. (2010) suggested that the inter-annual variations in POC fluxes resulted from the timing of sea-ice melting. In the Canada Basin, annual POC flux was found to be 0.08 g C m–2 year–1 at 200 m (Table 2), which was two orders of magnitude lower than those observed on the Chukchi and East Siberian Sea slopes. Honjo et al. (2010) reported that the biological pump was currently ineffective in the Canada Basin, causing POC from primary production to be remineralized or converted to dissolved organic carbon within the surface layer. On the Chukchi Sea and East Siberian Sea slopes, annual POC fluxes were higher than those on Arctic basins, lower than those on Arctic shelves, and generally similar to those on the western Arctic slopes (Table 2).
The original contributions presented in the study are included in the article/Supplementary Material. Further inquiries can be directed to the corresponding author/s.
H-JK and DSK were responsible for data analysis and writing the manuscript. HK, K-EL, and S-HK contributed with discussions and data analysis. E-JY, K-HC, JYJ, and SC performed field survey and analyzed the dataset. All authors contributed to the article and approved the submitted version.
This work was supported by the project PE99812 of the Korea Institute of Ocean Science and Technology, and in part by the project entitled “Korea-Arctic Ocean Observing System (K-AOOS, KOPRI, 20160245),” funded by the Ministry of Oceans and Fisheries, South Korea.
The authors declare that the research was conducted in the absence of any commercial or financial relationships that could be construed as a potential conflict of interest.
The Supplementary Material for this article can be found online at: https://www.frontiersin.org/articles/10.3389/fmars.2020.609748/full#supplementary-material
Anderson, L. G., Björk, G., Holby, O., Jutterström, S., Morth, C. M., O’Regan, M., et al. (2017). Shelf-Basin interaction along the East Siberian Sea. Ocean Sci. 13, 349–363. doi: 10.5194/os-13-349-2017
Arrigo, K. R., Perovich, D. K., Pickart, R. S., Brown, Z. W., Van Dijken, G. L., Lowry, K. E., et al. (2012). Massive phytoplankton blooms under Arctic Sea Ice. Science 336:1408. doi: 10.1126/science.1215065
Arrigo, K. R., Van Dijken, G., and Pabi, S. (2008). Impact of a shrinking Arctic ice cover on marine primary production. Geophys. Res. Lett. 35:28. doi: 10.1029/2008gl035028
Bai, Y., Sicre, M.-A., Chen, J., Klein, V., Jin, H., Ren, J., et al. (2019). Seasonal and spatial variability of sea ice and phytoplankton biomarker flux in the Chukchi sea (western Arctic Ocean). Progr. Oceanogr. 171, 22–37. doi: 10.1016/j.pocean.2018.12.002
Bauerfeind, E., Leipe, T., and Ramseier, R. O. (2005). Sedimentation at the permanently ice-covered Greenland continental shelf (74 degrees 57.7 ′ N/12 degrees 58.7 ′ W): significance of biogenic and lithogenic particles in particulate matter flux. J. Mar. Syst. 56, 151–166. doi: 10.1016/j.jmarsys.2004.09.007
Brown, Z. W., and Arrigo, K. R. (2012). Contrasting trends in sea ice and primary production in the Bering Sea and Arctic Ocean. ICES J. Mar. Sci. 69, 1180–1193. doi: 10.1093/icesjms/fss113
DeMaster, D. J. (1981). The supply and accumulation of silica in the marine environment. Geochim. Cosmochim. Acta 45, 1715–1732.
Dezutter, T., Lalande, C., Dufresne, C., Darnis, G., and Fortier, L. (2019). Mismatch between microalgae and herbivorous copepods due to the record sea ice minimum extent of 2012 and the late sea ice break-up of 2013 in the Beaufort Sea. Progr. Oceanogr. 173, 66–77. doi: 10.1016/j.pocean.2019.02.008
Engel, A., and Passow, U. (2001). Carbon and nitrogen content of transparent exopolymer particles (TEP) in relation to their Alcian Blue adsorption. Mar. Ecol. Progr. Ser. 219, 1–10. doi: 10.3354/meps219001
Fahl, K., and Nöthig, E.-M. (2007). Lithogenic and biogenic particle fluxes on the lomonosov ridge (central Arctic Ocean) and their relevance for sediment accumulation: vertical vs. lateral transport. Deep Sea Res. Part I Oceanogr. Res. Pap. 54, 1256–1272. doi: 10.1016/j.dsr.2007.04.014
Falkowski, P. G., Barber, R. T., and Smetacek, V. (1998). Biogeochemical controls and feedbacks on ocean primary production. Science 281, 200–206. doi: 10.1126/science.281.5374.200
Fischer, G., and Wefer, G. (1996). “Long-term observation of particle fluxes in the eastern Atlantic: seasonality, changes of flux with depth and comparison with the sediment record,” in The South Atlantic, eds G. Wefer, W. H. Berger, G. Siedler, and D. J. Webb (Berlin: Springer), 325–344.
Forest, A., Belanger, S., Sampei, M., Sasaki, H., Lalande, C., and Fortier, L. (2010). Three-year assessment of particulate organic carbon fluxes in Amundsen Gulf (Beaufort Sea): satellite observations and sediment trap measurements. Deep Sea Res. Part I Oceanogr. Res. Pap. 57, 125–142. doi: 10.1016/j.dsr.2009.10.002
Forest, A., Sampei, M., Hattori, H., Makabe, R., Sasaki, H., Fukuchi, M., et al. (2007). Particulate organic carbon fluxes on the slope of the Mackenzie Shelf (Beaufort Sea): physical and biological forcing of shelf-basin exchanges. J. Mar. Syst. 68, 39–54. doi: 10.1016/j.jmarsys.2006.10.008
Forest, A., Sampei, M., Makabe, R., Sasaki, H., Barber, D. G., Gratton, Y., et al. (2008). The annual cycle of particulate organic carbon export in Franklin Bay (Canadian Arctic): environmental control and food web implications. J. Geophys. Res. Oceans 113:4262. doi: 10.1029/2007jc004262
Fortier, M., Fortier, L., Michel, C., and Legendre, L. (2002). Climatic and biological forcing of the vertical flux of biogenic particles under seasonal Arctic sea ice. Mar. Ecol. Progr. Ser. 225, 1–16. doi: 10.3354/meps225001
Honjo, S., Krishfield, R. A., Eglinton, T. I., Manganini, S. J., Kemp, J. N., Doherty, K., et al. (2010). Biological pump processes in the cryopelagic and hemipelagic Arctic Ocean: canada Basin and Chukchi Rise. Progr. Oceanogr. 85, 137–170. doi: 10.1016/j.pocean.2010.02.009
Hwang, J., Eglinton, T. I., Krishfield, R. A., Manganini, S. J., and Honjo, S. (2008). Lateral organic carbon supply to the deep Canada Basin. Geophys. Res. Lett. 35:L11607. doi: 10.1029/2008gl034271
Kwok, R., and Rothrock, D. A. (2009). Decline in Arctic sea ice thickness from submarine and ICESat records: 1958-2008. Geophys. Res. Lett. 36:L039035. doi: 10.1029/2009gl039035
Lalande, C., Belanger, S., and Fortier, L. (2009a). Impact of a decreasing sea ice cover on the vertical export of particulate organic carbon in the northern Laptev Sea, Siberian Arctic Ocean. Geophys. Res. Lett. 36:570. doi: 10.1029/2009gl040570
Lalande, C., Forest, A., Barber, D. G., Gratton, Y., and Fortier, L. (2009b). Variability in the annual cycle of vertical particulate organic carbon export on Arctic shelves: contrasting the Laptev Sea, Northern Baffin Bay and the Beaufort Sea. Continent. Shelf Res. 29, 2157–2165. doi: 10.1016/j.csr.2009.08.009
Lalande, C., Grebmeier, J. M., Hopcroft, R. R., and Danielson, S. L. (2020). Annual cycle of export fluxes of biogenic matter near Hanna Shoal in the northeast Chukchi Sea. Deep Sea Res. Part II Oceanogr. Res. Pap. 177:104730.
Lalande, C., Grebmeier, J. M., Wassmann, P., Cooper, L. W., Flint, M. V., and Sergeeva, V. M. (2007). Export fluxes of biogenic matter in the presence and absence of seasonal sea ice cover in the Chukchi Sea. Continent. Shelf Res. 27, 2051–2065. doi: 10.1016/j.csr.2007.05.005
Lalande, C., Nöthig, E.-M., and Fortier, L. (2019). Algae export in the Arctic ocean in times of global warming. Geophys. Res. Lett. 46, 5959–5967. doi: 10.1029/2019GL083167
Liu, J., Song, M., Horton, R. M., and Hu, Y. (2013). Reducing spread in climate model projections of a September ice-free Arctic. Proc. Natl. Acad. Sci. U.S.A. 110, 12571–12576. doi: 10.1073/pnas.1219716110
Martin, J. H., Knauer, G. A., Karl, D. M., and Broenkow, W. W. (1987). Vertex - carbon cycling in the northeast pacific. Deep Sea Res. Part A Oceanogr. Res. Pap. 34, 267–285. doi: 10.1016/0198-0149(87)90086-90080
Miquel, J. C., Gasser, B., Martin, J., Marec, C., Babin, M., Fortier, L., et al. (2015). Downward particle flux and carbon export in the Beaufort Sea, Arctic Ocean; the role of zooplankton. Biogeosciences 12, 5103–5117. doi: 10.5194/bg-12-5103-2015
Mortlock, R. A., and Froelich, P. N. (1989). A simple method for the rapid determination of biogenic opal in pelagic marine sediments. Deep Sea Res. Part A 36, 1415–1426. doi: 10.1016/0198-0149(89)90092-90097
Müller-Karger, F. E., Varela, R., Thunell, R., Luerssen, R., Hu, C. M., and Walsh, J. J. (2005). The importance of continental margins in the global carbon cycle. Geophys. Res. Lett. 32. doi: 10.1029/2004gl021346
Nishino, S., Itoh, M., Williams, W. J., and Semiletov, I. (2013). Shoaling of the nutricline with an increase in near-freezing temperature water in the Makarov Basin. J. Geophys. Res. Oceans 118, 635–649. doi: 10.1029/2012jc008234
Nishino, S., Kikuchi, T., Fujiwara, A., Hirawake, T., and Aoyama, M. (2016). Water mass characteristics and their temporal changes in a biological hotspot in the southern Chukchi Sea. Biogeosciences 13, 2563–2578. doi: 10.5194/bg-13-2563-2016
O’Brien, M. C., Macdonald, R. W., Melling, H., and Iseki, K. (2006). Particle fluxes and geochemistry on the Canadian beaufort shelf: implications for sediment transport and deposition. Continent. Shelf Res. 26, 41–81. doi: 10.1016/j.csr.2005.09.007
Pabi, S., Van Dijken, G. L., and Arrigo, K. R. (2008). Primary production in the Arctic Ocean, 1998-2006. J. Geophys. Res. Oceans 113. doi: 10.1029/2007jc004578
Palanques, A., Garcia-Ladona, E., Gomis, D., Martin, J., Marcos, M., Pascual, A., et al. (2005). General patterns of circulation, sediment fluxes and ecology of the Palamo’s (La Fonera) submarine canyon, northwestern Mediterranean. Progr. Oceanogr. 66, 89–119. doi: 10.1016/j.pocean.2004.07.016
Parsons, T., Maita, Y., and Lalli, C. (1984). A Manual of Chemical and Biological Methods for Seawater Analysis. New York, NY: Pergamon Press.
Rigor, I. G., and Wallace, J. M. (2004). Variations in the age of Arctic sea-ice and summer sea-ice extent. Geophys. Res. Lett. 31. doi: 10.1029/2004gl019492
Rodrigues, J. (2008). The rapid decline of the sea ice in the Russian Arctic. Cold Reg. Sci. Technol. 54, 124–142. doi: 10.1016/j.coldregions.2008.03.008
Sakshaug, E. (2004). “Primary and secondary production in the Arctic Seas,” in The Organic Carbon Cycle in the Arctic Ocean, eds R. Stein and R. W. MacDonald (Berlin: Springer), 57–81.
Serreze, M. C., Holland, M. M., and Stroeve, J. (2007). Perspectives on the Arctic’s shrinking sea-ice cover. Science 315, 1533–1536. doi: 10.1126/science.1139426
Watanabe, E., Onodera, J., Harada, N., Honda, M. C., Kimoto, K., Kikuchi, T., et al. (2014). Enhanced role of eddies in the Arctic marine biological pump. Nat. Commun. 5:4950. doi: 10.1038/ncomms4950
Weingartner, T., Aagaard, K., Woodgate, R., Danielson, S., Sasaki, Y., and Cavalieri, D. (2005). Circulation on the north central Chukchi Sea shelf. Deep Sea Res. Part II Oceanogr. Res. Pap. 52, 3150–3174. doi: 10.1016/j.dsr2.2005.10.015
Yamamoto-Kawai, M., Mclaughlin, F. A., Carmack, E. C., Nishino, S., and Shimada, K. (2009). Aragonite undersaturation in the Arctic ocean: effects of ocean acidification and sea ice melt. Science 326, 1098–1100. doi: 10.1126/science.1174190
Yun, M. S., Whitledge, T. E., Kong, M., and Lee, S. H. (2014). Low primary production in the Chukchi Sea shelf, 2009. Continent. Shelf Res. 76, 1–11. doi: 10.1016/j.csr.2014.01.001
Keywords: particle flux, biological pump, time-series sediment trap, seasonal variation, western Arctic Ocean
Citation: Kim H-J, Kim HJ, Yang E-J, Cho K-H, Jung JY, Kang S-H, Lee K-E, Cho S and Kim DS (2021) Temporal and Spatial Variations in Particle Fluxes on the Chukchi Sea and East Siberian Sea Slopes From 2017 to 2018. Front. Mar. Sci. 7:609748. doi: 10.3389/fmars.2020.609748
Received: 24 September 2020; Accepted: 01 December 2020;
Published: 08 January 2021.
Edited by:
Johan Schijf, University of Maryland Center for Environmental Science (UMCES), United StatesReviewed by:
Catherine Lalande, Amundsen Science, CanadaCopyright © 2021 Kim, Kim, Yang, Cho, Jung, Kang, Lee, Cho and Kim. This is an open-access article distributed under the terms of the Creative Commons Attribution License (CC BY). The use, distribution or reproduction in other forums is permitted, provided the original author(s) and the copyright owner(s) are credited and that the original publication in this journal is cited, in accordance with accepted academic practice. No use, distribution or reproduction is permitted which does not comply with these terms.
*Correspondence: Dongseon Kim, ZGtpbUBraW9zdC5hYy5rcg==
Disclaimer: All claims expressed in this article are solely those of the authors and do not necessarily represent those of their affiliated organizations, or those of the publisher, the editors and the reviewers. Any product that may be evaluated in this article or claim that may be made by its manufacturer is not guaranteed or endorsed by the publisher.
Research integrity at Frontiers
Learn more about the work of our research integrity team to safeguard the quality of each article we publish.