 Agnieszka Zdun
 Joanna Stoń-Egiert
 Dariusz Ficek
 Mirosława Ostrowska1
94% of researchers rate our articles as excellent or good
Learn more about the work of our research integrity team to safeguard the quality of each article we publish.
Find out more
ORIGINAL RESEARCH article
Front. Mar. Sci., 22 January 2021
Sec. Marine Ecosystem Ecology
Volume 7 - 2020 | https://doi.org/10.3389/fmars.2020.604532
The seasonal and spatial variability of primary production (PP) measured using 14C method in two regions: open waters of the Baltic Sea and the Gulf of Gdansk were discussed. The statistical analyses of 26-years dataset (from 1993 to 2018) allow to confirm some regularities of productivity and find some features resulting mainly from changing environmental conditions like solar insolation, temperature, and chlorophyll a concentration. In the dataset, production values varied from 0.005 to 7.8 g C m–2 day–1 in open waters and from 0.07 to 12.9 g C m–2 day–1 in the Gulf of Gdansk. Analysis showed that PP in open waters were 6–17% lower than in Gulf of Gdansk in most of the cases. In both regions, the periods of intense productivity in spring and autumn were observed, but vegetation begins a month earlier in the Gulf of Gdansk than in open waters. Probably the accumulation of nutrients after the winter causes the spring bloom (April–May) in both regions to be more intense (even two times higher) than the autumn bloom (September–October) associated with favorable hydrological conditions resulting from summer insolation. The presented results showed slight downward trends in productivity in both regions, the most visible in the spring in the Bay of Gdansk. This confirms the recent reports on a possible improvement in the eutrophication state of the Baltic Sea.
The primary production (PP) in the world ocean as well as global carbon fluxes in the ecosystem have been the subjects of the scientific interest for more than 50 years. The knowledge of the mentioned phenomenon plays a fundamental role in understanding of the marine ecosystems functioning as well as in explaining the changes of ocean productivity and the availability of marine plankton, which is the base of the trophic pyramid in the ocean.
The energy transformation occurring in photosynthesis, depends on a number of environmental factors such as surface irradiance and its transmission in the depths, the presence of organic/inorganic matter suspended in the water and nutrient availability. Apart from temperature and nutrients availability the solar radiation is the most important factor forcing photosynthesis (Sathyendranath et al., 2019). This radiation mostly depends on geographical location but its instantaneous values that reach sea surface vary dynamically with time in accordance with clouds cover. The transmission of light in water body in various regions directly depends on the absorption and scattering properties (attenuation) of sea water constituents. In the case of eutrophic waters, shelf and semi-closed seas such as the Baltic Sea, characterized by a relatively high content of organic and inorganic as well as suspended and dissolved matter the underwater light field and its spectral distribution differ. In the Baltic more than 80% of the irradiance is absorbed in a layer about 3 m thick as a consequence of the high trophicity of such type of waters (Dera and Wozniak, 2010).
Seasonal variability of irradiance and temperature in the Baltic waters together with strong fluctuation in concentration of inorganic nutrients dissolved in its waters influence the changes in species composition of phytoplankton and the amount of total carbon PP. The phytoplankton species in the Baltic cover a wide range of both marine and freshwater algal taxa. Their size ranges from picoplankton (like for example in case of cyanobacteria spherical cells of Merismopedia tenuissima with diameter 0.5 μm) to microplankton (like in case of Gyrodynium spirale (dinophytes) with size range 100–150 × 42–27 μm). The respective group size can contribute significantly to biomass of autotrophic organisms present in the Baltic ecosystems (Schernewski and Neumann, 2002; Wasmund and Uhlig, 2003; Lysiak-Pastuszak et al., 2004; Ronnberg and Bonsdorff, 2004; Olenina et al., 2006; HELCOM, 2009; Gustafsson et al., 2013).
Several different regions can be identified in the Baltic Sea ecosystem. One of them is the ecosystem of the Gulf of Gdansk separated from the open sea with a thin and 30 km long Hel Peninsula. This basin has a special importance for the functioning of the whole marine ecosystem of the Baltic Sea. It is heavily influenced by the human activities and strongly fed with huge amount of inorganic nutrients by a large Vistula river. High load of biogenic substances leads, among others, to higher water turbidity and increases phytoplankton biomass. It is visible during spring, summer, and autumn when various phytoplankton species bloom. The high ones occurred in 1994, 2001, 2003 and 2004 and reveal high concentration of chlorophyll a as a phytoplankton biomass indicator and also the main photosynthetic pigment (Wasmund et al., 2000; Mazur-Marzec et al., 2006). Phytoplankton taxa forming blooms have different specific of both photosynthesis and growth rates. The highest ones was observed for nanoplankton (2–20 μm) (Maranon et al., 2013; Piwosz, 2019).
Besides the 14C trace method the phytoplankton production rates can be measured by the O2 light-dark bottle method or by the fluorescence techniques (Bender et al., 1987; Falkowski and Raven, 2013; Regaudie-de-Gioux et al., 2014). The oxygen method was a principal method for measuring marine PP until it was supplanted by a much more sensitive 14C method first outlined by Steemann Nielsen in 1952 (Stemmann Nielsen, 1952). It is known that estimates derived from different methods are not directly comparable (Marra, 2009; Regaudie-de-Gioux et al., 2014). But even if we compare the results obtained using the same method we need to know the measurement details. As it was pointed out in many publications 14C method and relatively short incubation time (4 h) generate PP values that are close to gross PP (Witek et al., 1997; Moigis and Gocke, 2003; Ask et al., 2016; Purina et al., 2018). It is the most reliable method and was recommended as standard for PP studies in the Baltic Sea (Dybern et al., 1976). Heretofore the articles dedicated to photosynthetic PP and 14C method in the Baltic Sea present short-term measurement campaigns within 2005 and 2002, 2009, 1994, and 1993 and 1983 (Renk, 1990; Ochocki et al., 1995; Witek et al., 1997; Andreasson et al., 2009; Wielgart-Rychert et al., 2017). In the review paper by Wasmund et al. (2000) it has been revealed that from 1993 to 1997 the annual PP in the Gulf of Gdansk equalled 225 g C m–2. It was about 20% higher than the average value for the period 1966–1995 (Renk et al., 2000). The results of long-term measurement of PPs in the Baltic Sea have been described by Kaczmarek et al. (1997). The authors concluded the annual PP increased between 5.2 and 10 g C m–2 in consecutive years 1968–1991 depending on the area. These studies are extremely important in terms of observing the long-term trends of changes occurring in the marine environments as a result of human activity and the climate changes.
The unique data collected within 26 years by the research team from Marine Optics Department of the Institute of Oceanology of Polish Academy of Sciences (IO PAS) enabled the analysis of the surface PP, the vertical distribution of PP in water column and the total PP in the euphotic zone of the Baltic Sea. The purpose of the current work was to analyze and describe the seasonal and spatial variability of PP in two regions of the Baltic Sea: open water (OW) and the Gulf of Gdansk (GG) based on dataset collected from 1993 to 2018. What is more, we assume the trends of PP in both region are possible to estimate.
The presented analyses are substantial for understanding of the marine environment functioning, verification of biogeochemical or ecohydrodynamical models, and mathematical formulas which describe the dependence of photosynthesis in the sea on the environmental factors (Schernewski and Neumann, 2002; Kowalewski, 2005; Wozniak et al., 2011; Murray et al., 2019; Kratzer et al., 2020). The results can also be used to validate the satellite algorithms dedicated to the monitoring of the Baltic Sea state as well as to validate many environment characteristics using remote sensing techniques (Darecki et al., 2008; Siegel and Gerth, 2008; Zheng et al., 2020).
The data set presented in the paper includes the results of 244 experiments on the pelagic PP. The measurements were carried out in the Baltic Sea, from the deck of r/v Oceania (ship’s owner: IO PAS) in the years 1993–2018 and conducted mainly on Polish, but also on German and Swedish waters. The locations of the stations are shown at the maps in Figure 1. The collected data set was divided into two regions: the Baltic Proper, signed as OW (latitude and longitude range 54°50–59°00 N and 13°05–21°20 E) and the Gulf of Gdansk, signed as GG. The amount of data collected in OW and GG equaled 158 and 86, respectively. The distribution of the data in each year and month during the period of 1993–2018 in OW and GG are presented in Figure 2. Within 26 years of the measurements, the amount of the gathered data changed from 1 to 40 profiles in consecutive months and years. Only one experiment was conducted in January, June, and December, while the highest number of data was collected in May and September (Figure 2A). The lack of data is observed in 1996, 2002 in both regions as well as in 1997 and 2016 in the Gulf of Gdansk (Figure 2B).
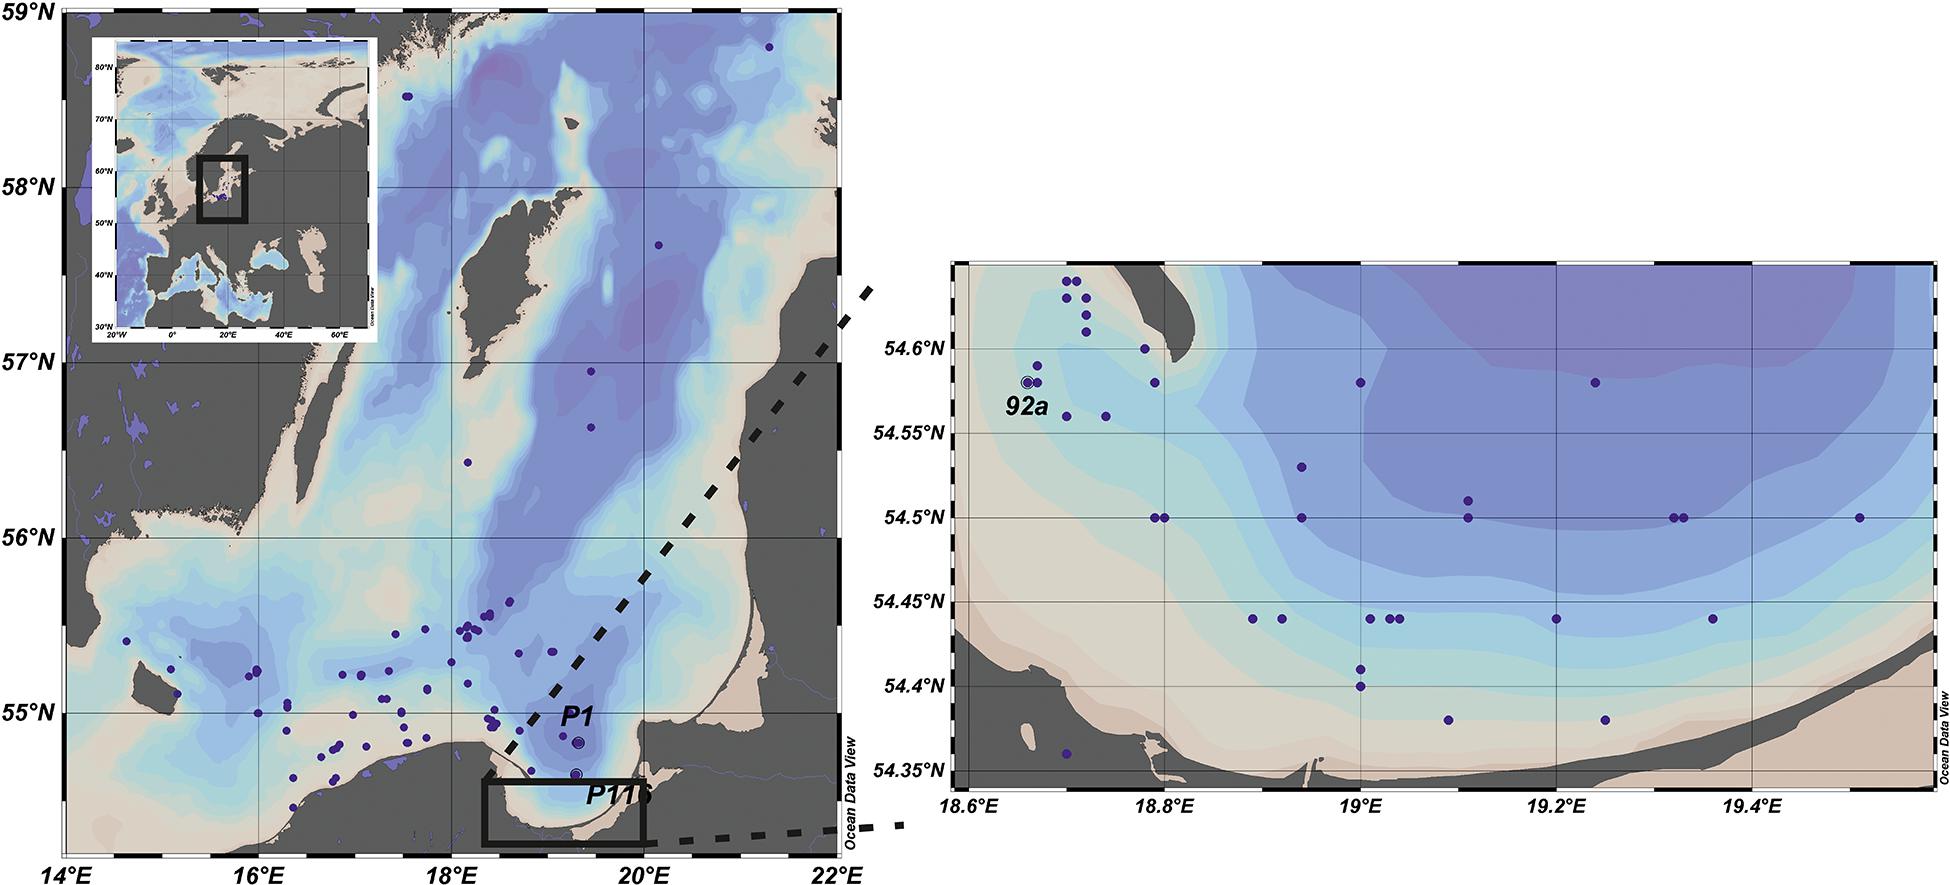
Figure 1. Location of stations where primary production (PP) in situ measurements were conducted within period 1993–2018 in the Baltic Proper (left panel) and the Gulf of Gdansk (right panel). Adapted from Schlitzer (2020).
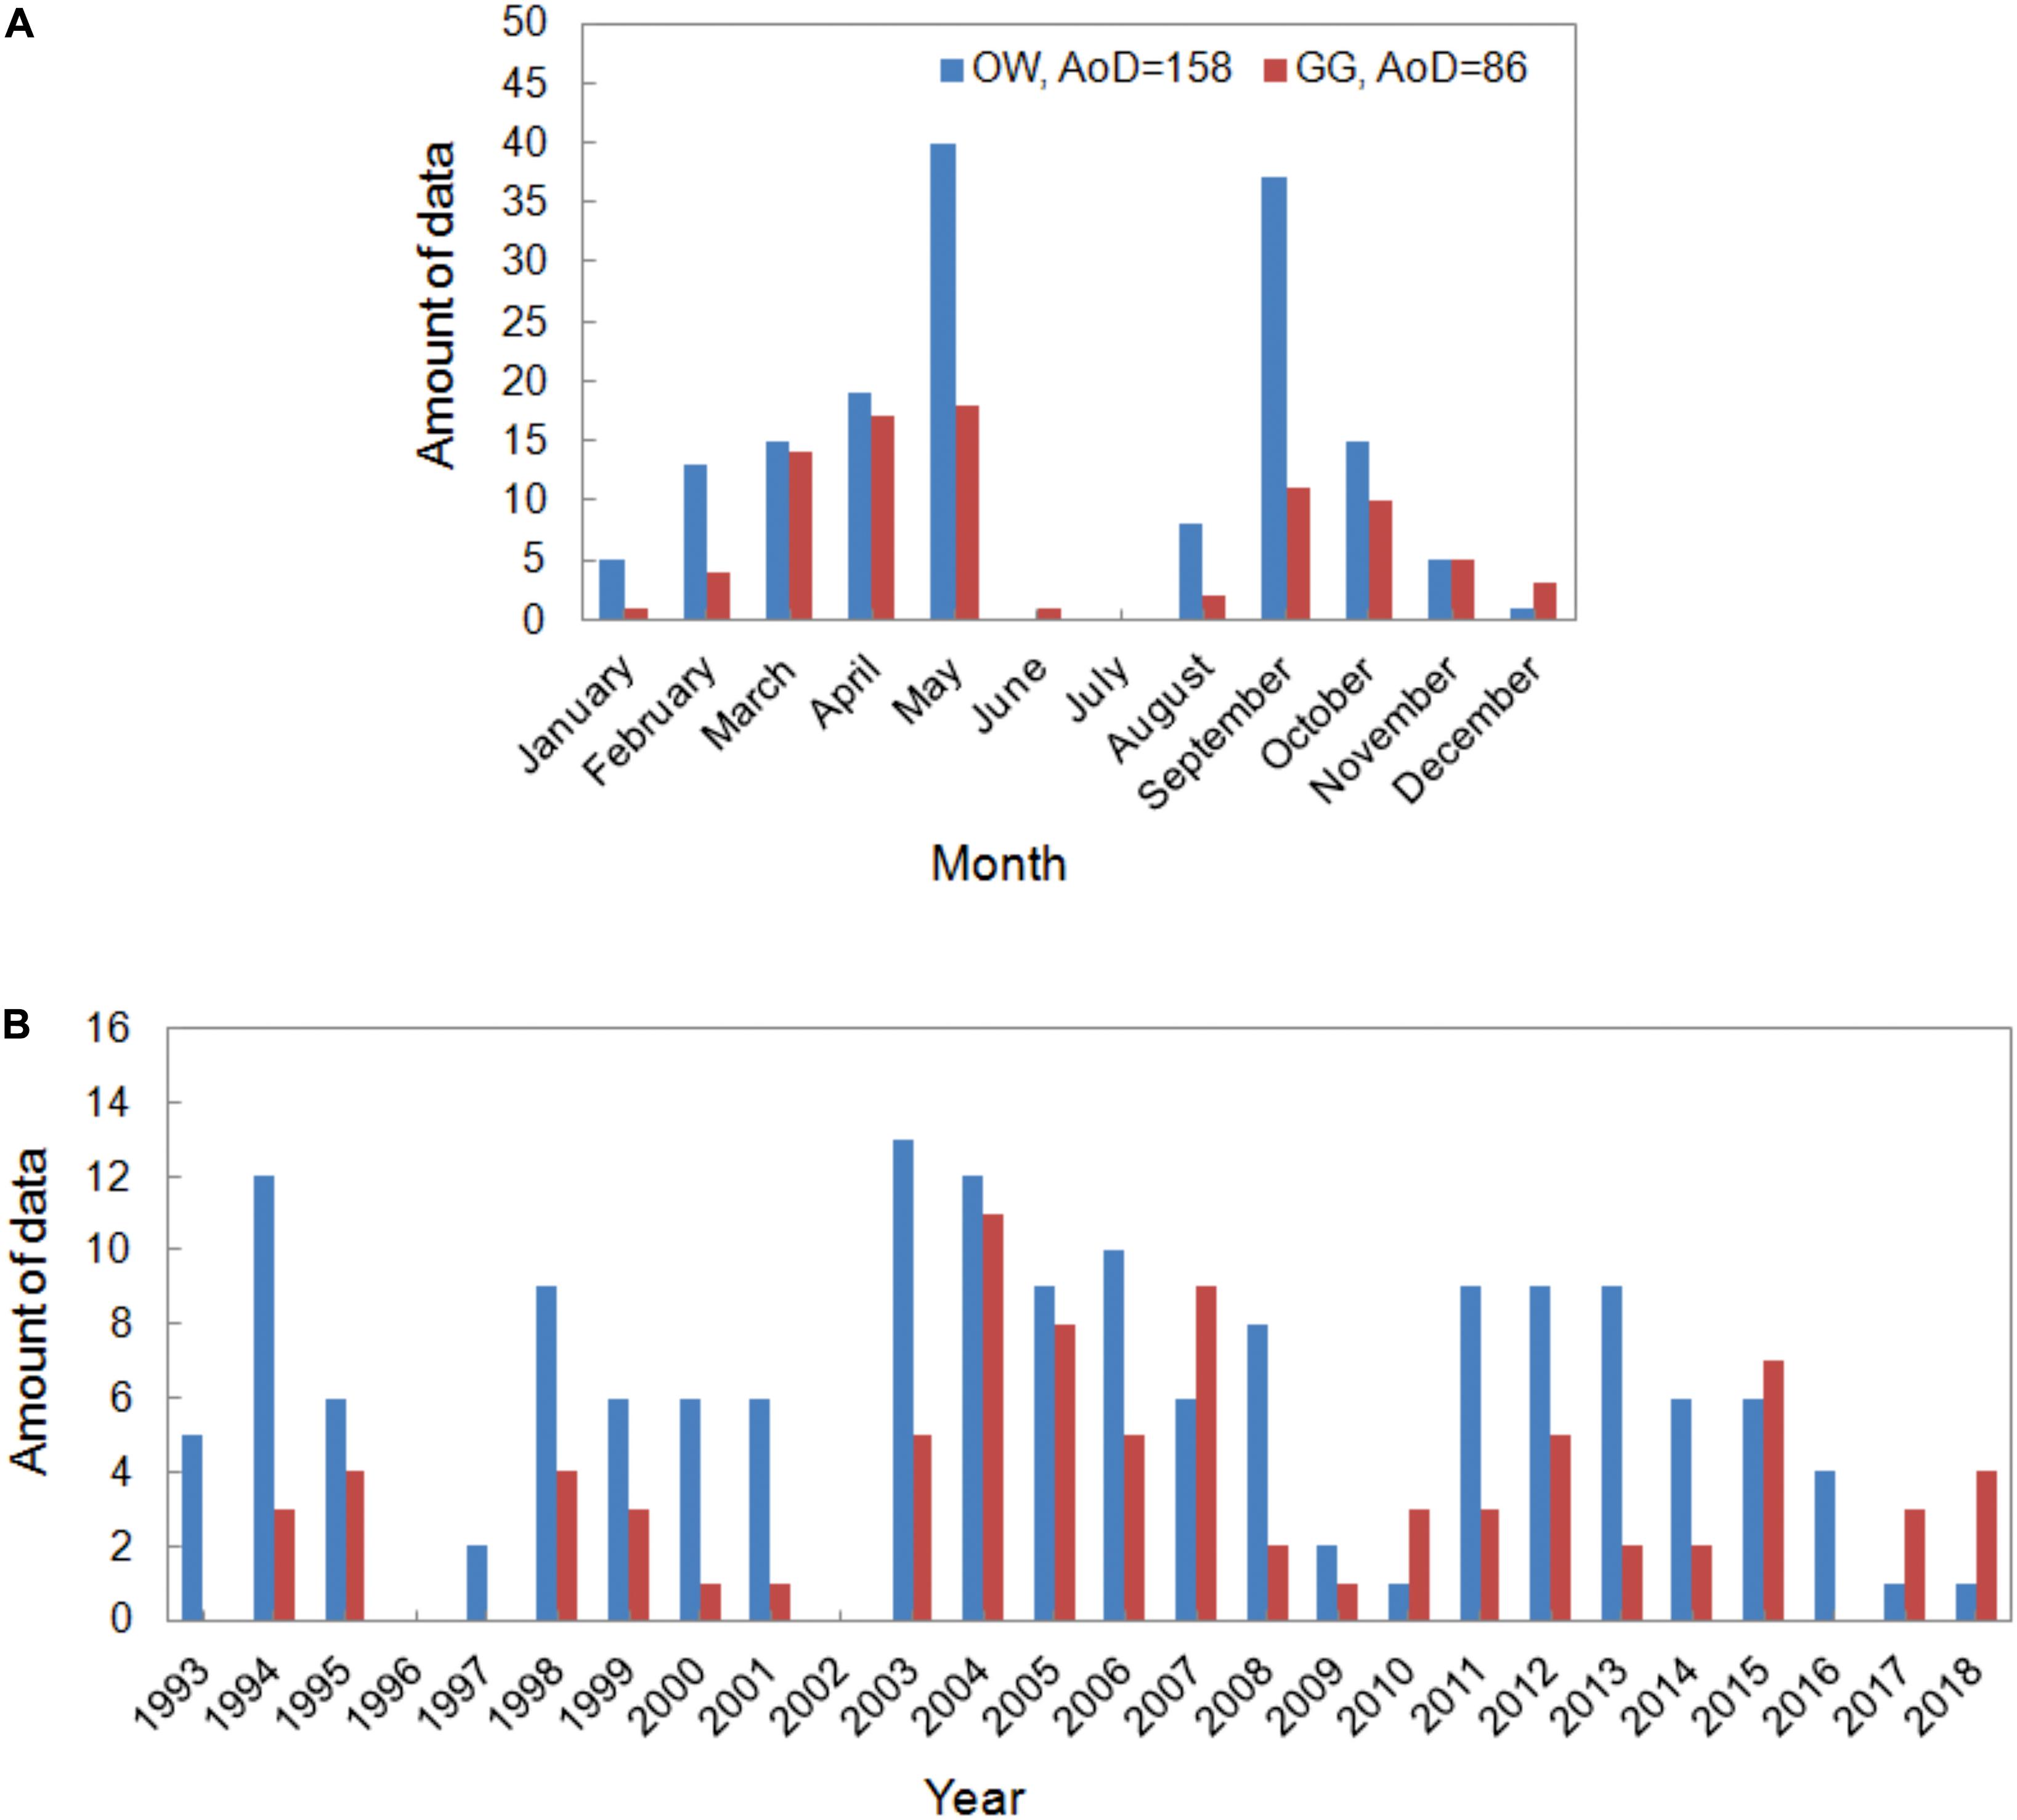
Figure 2. The amount of data (AoD) collected in consecutive months (A) and years (B) within period 1993–2018.
In parallel to the above mentioned PP measurements also the hydrological conditions at the stations, the data on solar radiation and the chlorophyll a concentration were collected. According to the gathered data the hydrological conditions at P116 station (54°39 N 19°18 E) located close to the border of the Gulf of Gdansk were similar to OW’s region. That’s why in further analysis the data collected at this station were included in OW dataset. The data presented in the article has been stored in the repository of IO PAS and they are available online at: https://odis.iopan.pl/PP.
The primary production measurements were done with the use of radioisotope method in light and dark bottles according to Stemmann Nielsen (1952); Strickland and Parsons (1972), Nielsen and Bresta (1984). The principle of the 14C technique is the addition of 14CO2 in the form of labeled sodium bicarbonate NaH14CO3 to the water sample, where during photosynthesis the algae incorporate the tracer into organic matter. It allows to calculate the rate of the PP based on the known total content of CO2 in water and known amount of added 14CO2.
The procedure of our measurements was the same during the whole period of 26 years. The activity of the used isotope was different in the selective years of measurements. Its values changed in range 8409160–78557480 dpm (0.14–1.31 MBq) and resulted from various sources of the used isotope origin. In the period from 1993 to 2007 isotope solution was prepared in IO PAS’s laboratory according to Dybern et al. (1976). Since 2008 the isotope from Danish Hydrological Institute with activity 3.7 MBq (100 μCi) per ml has been used. Values of PP at the surface regardless of trophicity represented by chlorophyll a concentration is presented in Figure 3. The One-way ANOVA test conducted for PP during exposition normalized to chlorophyll a concentration showed that the differences between the groups of isotope are not statistically significant at the 0.05 level. A similar lack of effect also occurs in the water column.
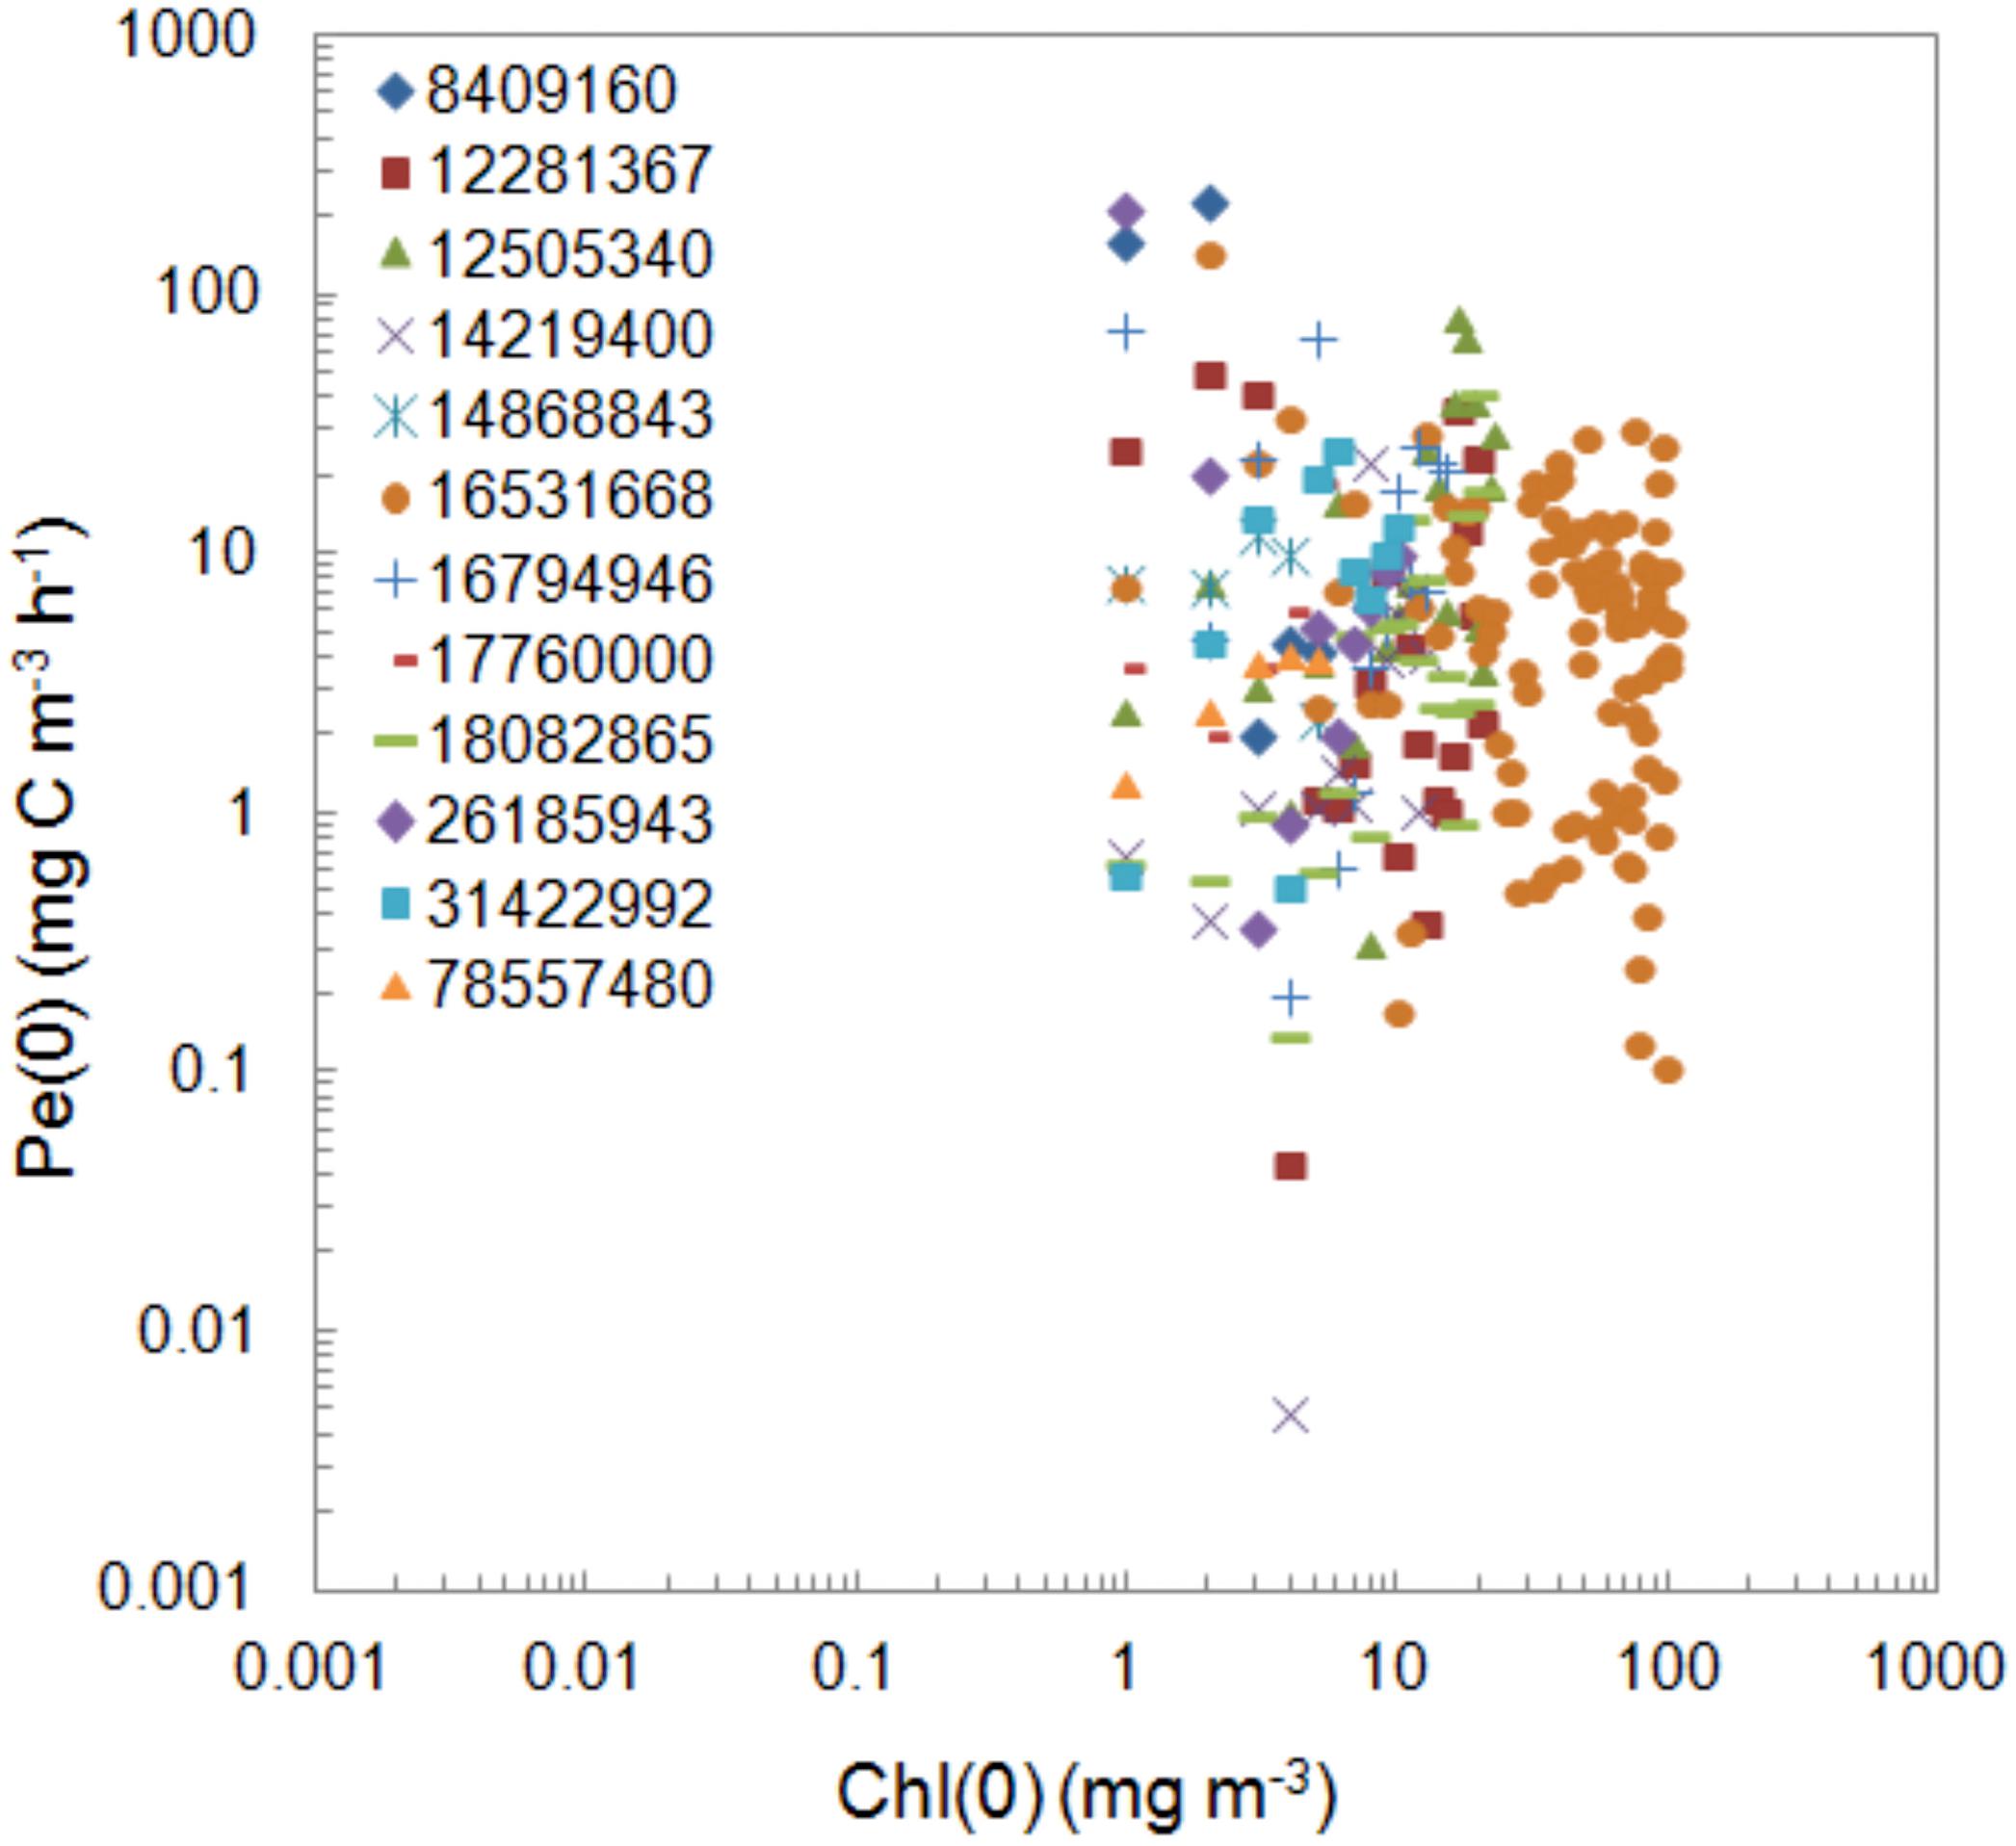
Figure 3. Comparison of the values of the surface PP, Pe(0) determined within 1993–2018 period using isotope with different activity with respect to chlorophyll a concentration, Chl(0). The isotope activities expressed in dpm were shown as numbers and colored icons in legend.
The water samples were taken at the selected depths (0, 1, 2, 3, 5, 7, 10, 15, 20, and 30 m) which enabled a better observation of the maximum of photosynthesis in the deep water profiles of PP as well as the photo-inhibition processes occurring in the Baltic phytoplankton cells near the surface. Most often the water samples were taken between 08 and 10 a.m. UTC. Two or three identical glass bottles (volume 100 ml) were immediately filled with the water samples and then the isotope with a known activity was added to each sample to obtain the final radioactivity of 37–296 kBq (1–8 μCi) per sample. The mentioned methodology involved the use of light and dark bottles and their incubation at individual depths to measure dark fixation of carbon.
The water samples were incubated in water column during the 4 h long exposition at midday. To avoid the potential shading the samples were attached to a drifting buoy about 50 m from the ship. After the incubation in the environment under the natural light conditions the radioactive contents of the bottles were filtrated through 25 mm diameter cellulose acetate filter with a pore size of 0.45 μm (Sartorius). Subsequently, the samples gathered on filters were placed in fumes of concentrated hydrochloric acid (HCI) for 5 min and put into scintillation vials. The vials were kept at room temperature in the dark until the measurements on scintillation counter were taken (Beckman LS 6000 IC).
14CO2 fixation was measured by the uptake of 14C radioisotope by phytoplankton during the exposure time. The amount of 14C appearing in the particulate matter was measured as the β ray activity of the algae by counting their scintillations in presence of appropriate scintillation solution (Strickland and Parsons, 1972).
The values of the PP refer to the exposition time of the samples at 10 depths in water column, Pe(z) expressed in mg C m–3 h–1 and calculated according to the algorithm (Nielsen and Bresta, 1984):
where:
<dpma(z)> – the mean of differences between the activities of light and dark bottles at depth z [dpm].
dpmb – the activity of isotope 14C [dpm].
total CO2 – the total carbon concentration in the water sample [mM dm–3].
13.356 – the results from multiplication of the following parameters:.
12 – the atomic weight of carbon.
1.05 – a correction of the effect of 14C; the uptake of the 14C isotope is 5% slower than that of the 12C isotope found in nature.
1.06 – a correction of the respiration of organic matter produced during the experiment, equals 6% at optimal photosynthesis.
k1 – a correction of subsampling factor.
k2 – a time factor, e.g., used to convert production per 2 h to production per hour, then k2 = 0.5
k3 – a dimension factor, e.g., used to convert mg C dm–3 to mg C m–3, k3 = 103.
To estimate the total dissolved inorganic carbon in the water sample the below formula is recommended (Nielsen and Bresta, 1984):
where:
At – titration alkalinity including correction to the content of other seawater components (e.g., carbonates, borates, silicates, phosphates, and fluorides) disturbing the measurement of alkalinity (Glowinska et al., 1975).
F – the factor fixed for pHs and salinity (Nielsen and Bresta, 1984); pHs value calculated based on in situ pH, T and salinity as well as pH and T measured when hydrochloric acid (HCl) was added to the water sample (Glowinska et al., 1975).
Although releasing of dissolved organic carbon by different size classes of phytoplankton is a significant fraction of carbon fixation (Malinsky-Rushansky and Legrand, 1996; HELCOM, 2014; Thornton, 2014) no correction for algal excretion is foreseen in the methodology (Stemmann Nielsen and Jensen, 1957).
The daily PP per unit volume at 10 depths, Pd(z) expressed in mg C m–3 day–1 was determined by multiplying the value of the PP during the exposition by dimensionless light factor (LF) i.e., a ratio of the light dose during the incubation period to a full day’s dose of light:
where:
ηe(z) – the solar energy dose within the visible light band reaching depth z during the exposition of the samples [J m–3 nm–1].
ηd(z) – the daily solar energy dose within the visible light band reaching depth z [J m–3 nm–1].
The values of daily PP in water column (layer from 0 to 30 m) under a square meter of surface per day, signed as Pi(0–30) expressed in mg C m–2 day–1 were calculated using the trapezoidal integration with depths z:
The analysis of the above mentioned value of PP will be further presented in the context of their temporal and spatial distribution in the two regions of the Baltic Sea.
The salinity and temperature profiles were conducted using a Guideline conductivity-temperature-depth (CTD) probe at the beginning, at the end and in the middle of each PPs exposition. The mean values were used for the Pe(z) calculations.
The distributions of underwater light fields were determined based on the measurements of the vertical profiles of spectral downward irradiance. The measurements were performed with a spectroradiometer MER2040 (Biospherical Instruments, Inc.) in years 1993–2009 and a high-performance free-fall aquatic profiler C-OPS (Compact Optical Profiling Systems, Biospherical Instruments, Inc.) in years 2009–2018. Both instruments were equipped with above-water reference irradiance sensors to measure incident irradiance.
The radiometric measurements in the water column were accompanied by continuous measurements of downwelling irradiance in the whole spectra and in the PAR range made with the use of Kipp&Zonen: CMP21 and CMP22 (pyranometers) and PQS1 (PAR) sensors. The continuous measurements allowed to calculate the daily doses of those irradiances used for light factor calculation (Equation 3).
The water samples used for the determination of chlorophyll a concentration at the 10 mentioned depths were taken at the same time as PP samples and filtered immediately under the low vacuum conditions through 47 mm Whatman GF/F filters with a 0.7 μm nominal particle retention. Then the filters were instantly frozen in liquid nitrogen and kept in deep freezing conditions until laboratory analysis could be carried out. The pigments were extracted at room temperature in 96% ethanol for 24 h. The determination of chlorophyll a concentration has been performed with two spectrophotometers from 1993 till 2009 UV4-100 (Unicam, Ltd) was used and since 2010 Perkin Elmer Lambda 650 has been in use. The absorbance (A) of pigments’ extracts was measured at 665 nm. The background signal was corrected with the use of absorbance value in the near-infrared region of the electromagnetic spectrum (750 nm). Subsequently, the conversion of absorbance to chlorophyll a (Chl expressed in mg m–3) was carried out according to the following equation (Strickland and Parsons, 1972; Stramska et al., 2003):
where:
ΔA – the difference of absorbance [dimensionless]; ΔA = A(665 nm)−A(750 nm).
VE – the volume of ethanol extract [dm3].
83 – the chlorophyll a specific absorption coefficient in 96% ethanol [dm3 g–1 cm–1].
Vw – the volume of filtered water [dm3].
l – the path length of the cuvette [cm].
For further analysis, based on the collected dataset in the analyzed period of time, the PP values described below were determined:
(1) The monthly mean values in a consecutive year from 1993 to 2018 calculated for months with amount of data more than 1: <Pe(z)>, <Pd(z)>, <Pi(0–30)>, <Ca(z)>, <T(z)>, and <LF(z)>.
(2) The 26-years’ monthly mean values based on sets of consecutive monthly mean values with amount of data more than 1: <Pe(z)>26, <Pd(z)>26, and <Pi(0–30)>26.
(3) The 26-years’ monthly median values Pd(z)med,26 calculated based on the sets of consecutive monthly median value Pd(z)med.
In the case of parameters changing over a broad range of variations, such as primary production − Pe(z), Pd(z), Pi(0–30), and chlorophyll a concentration – Chl(z) statistical analyses were carried out using the below mentioned logarithmic transformation:
where:
Xmean – the mean value of parameter in the data set.
Xm – m-value of parameter in the data set.
m – the index of elements in the data set; m = 1,…, 12.
Y – the number of elements in the data set, Y = 1,…, 26.
The yearly distribution of the surface values of primary production – Pe(0), water temperature – T(0), chlorophyll a concentration – Chl(0), and light factor – LF(0) obtained during the period of 26 years are presented in Figure 4. In the collected datasets there is a lack of chlorophyll a concentrations data, 17% in OW and 19% in GG. Minimal and maximal values of those parameters in respective months for the Baltic Proper and the Gulf of Gdansk are presented in Table 1 and in Supplementary Material (Supplementary Appendix Tables A1, A2). The lowest values of Pe(0) were observed within the period January–February in both regions (from 0.005 in 2003 to 2.55 mg C m–3 h–1 in 2016 OW and from 0.39 in 2003 to 3.10 mg C m–3 h–1 in 1998 GG). In March, Pe(0) values remain as low as in winter in OW while increased more than 7 times in GG (within the range from 1.01 in 1998 to 23.82 mg C m–3 h–1 in 2010). The highest values and range of changes of Pe(0) were recorded within April–May, but in OW lower than in GG. Table 1 includes extremely high values which appeared occasionally in individual years. In April the extreme Pe(0) values appeared, respectively, in 2011 OW and in 2004 GG (67.12 and 142.48 mg C m–3 h–1). In turn in May, the extreme Pe(0) values were almost equal in both regions and achieved 227.17 in 2009 OW and 214.28 mg C m–3 h–1 in 1994 GG. In the period of September–November organic matter production were still high, but lower than within April–May. Next extreme values of Pe(0), exceeding 40 mg C m–3 h–1 were noticed in October 1999 in OW. In the next months the values of Pe(0) systematically decreased in these regions with one exception in November in GG region when the value of Pe(0) increased to 18.94 mg C m–3 h–1 in 2018.
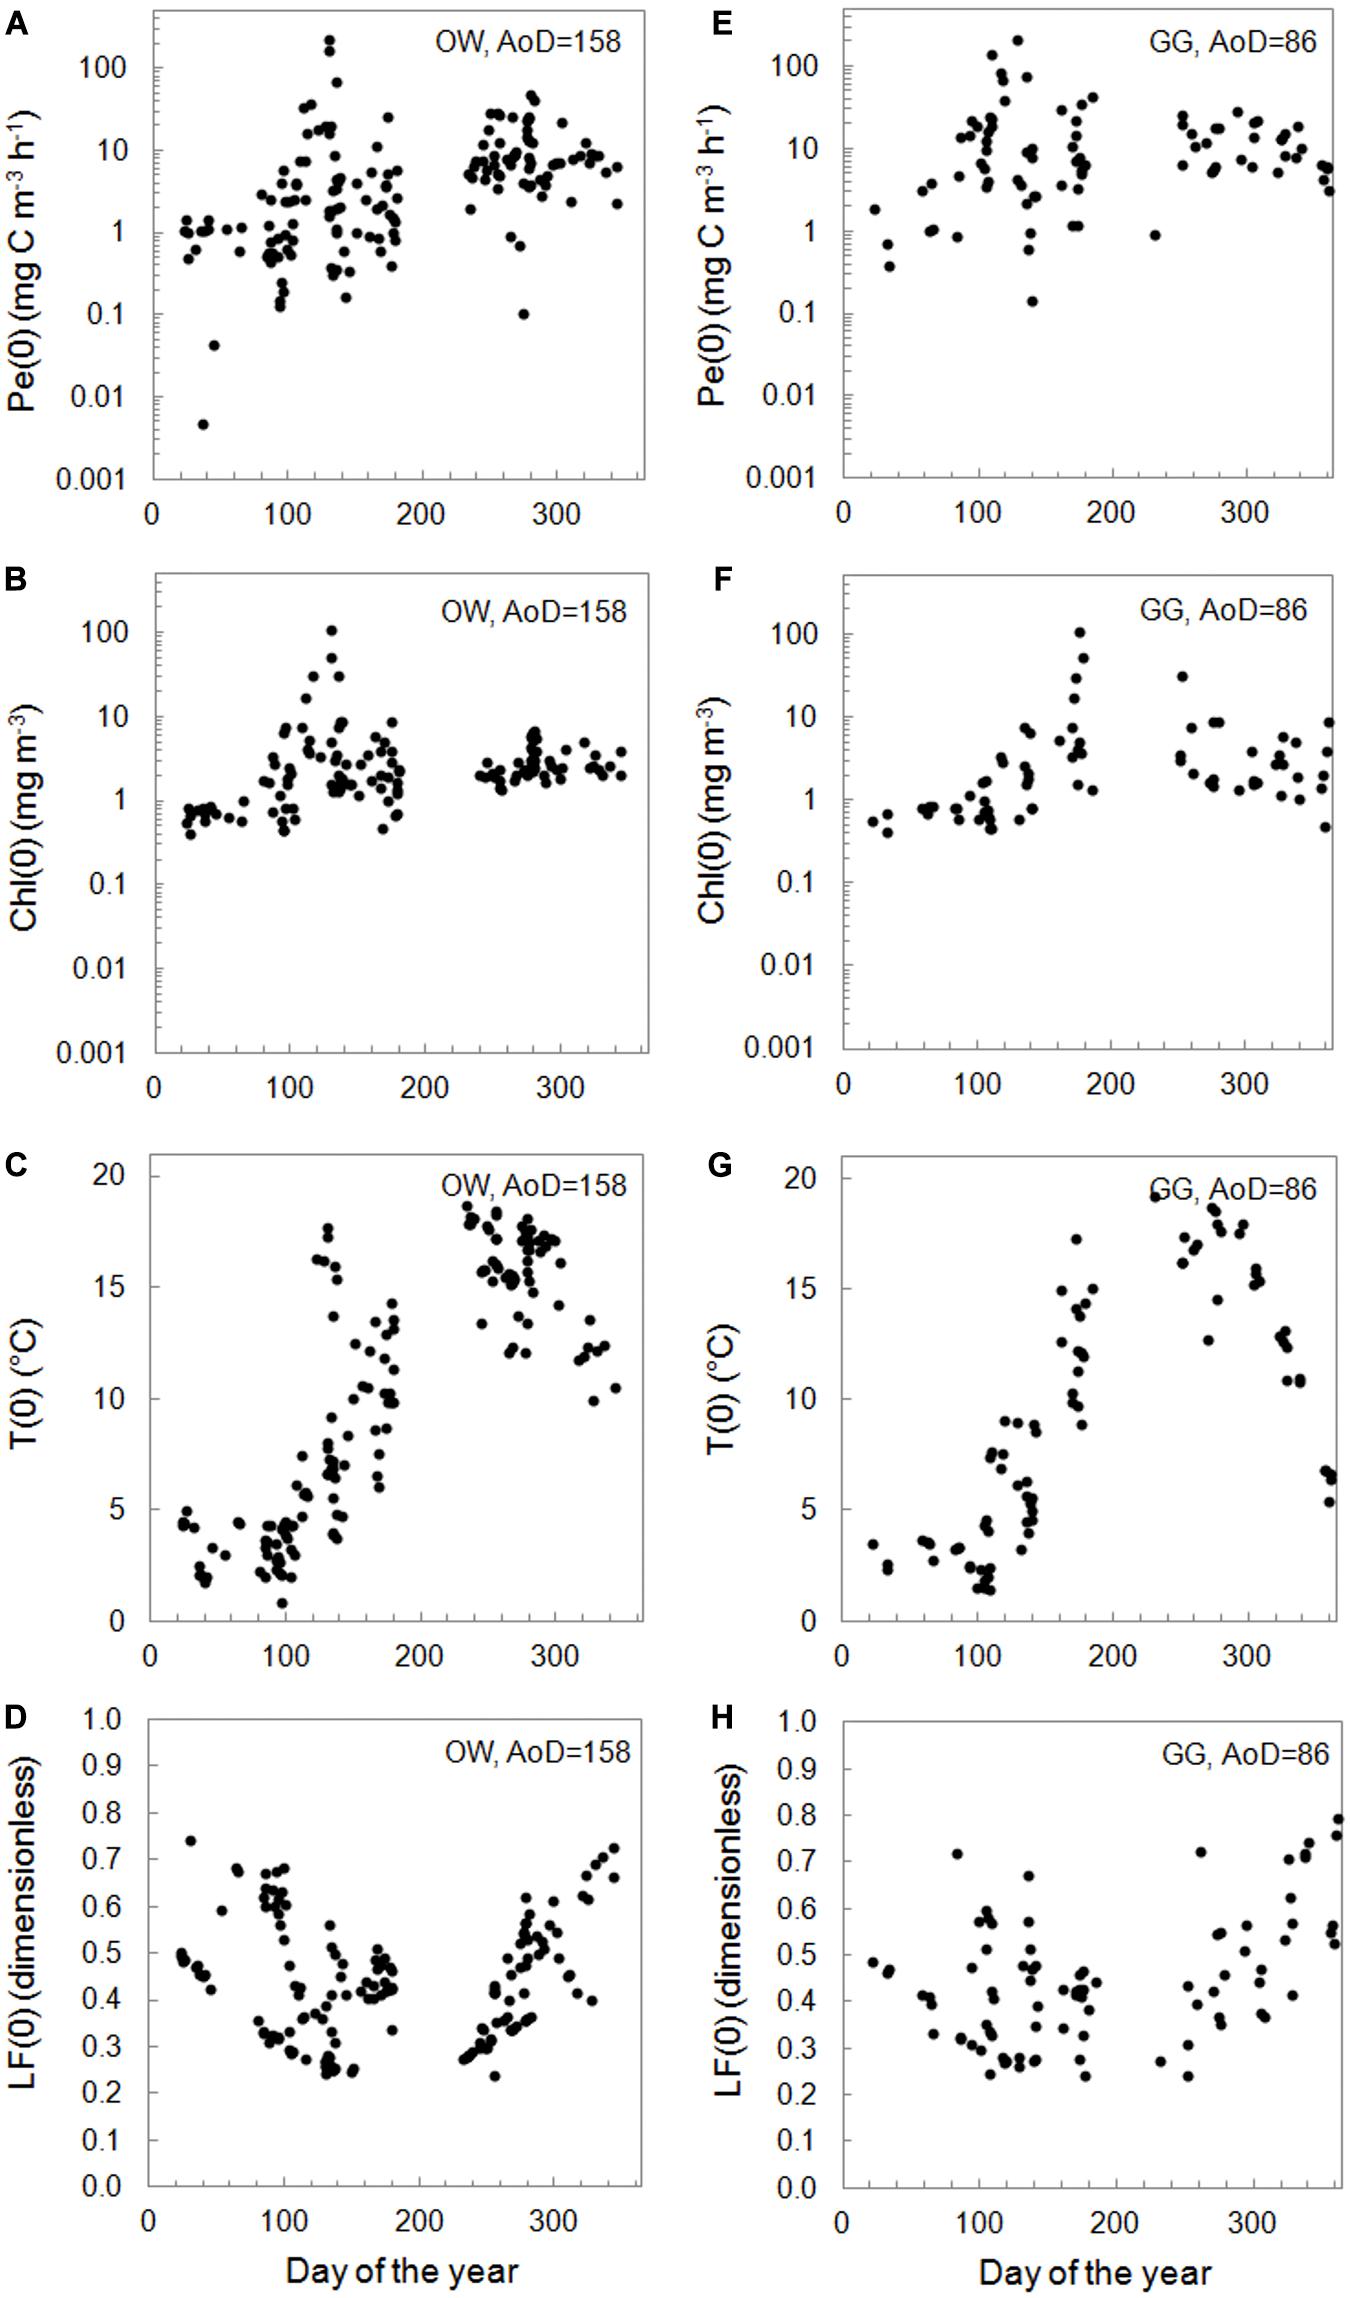
Figure 4. The surface PP, Pe(0) (A,E), chlorophyll a concentration – Chl(0) (B,F), temperature − T(0) (C,G), and light factor − LF(0) (D,H) versus number of the day in year within 1993–2018 in the Baltic Proper (OW, left column) and the Gulf of Gdansk (GG, right column).
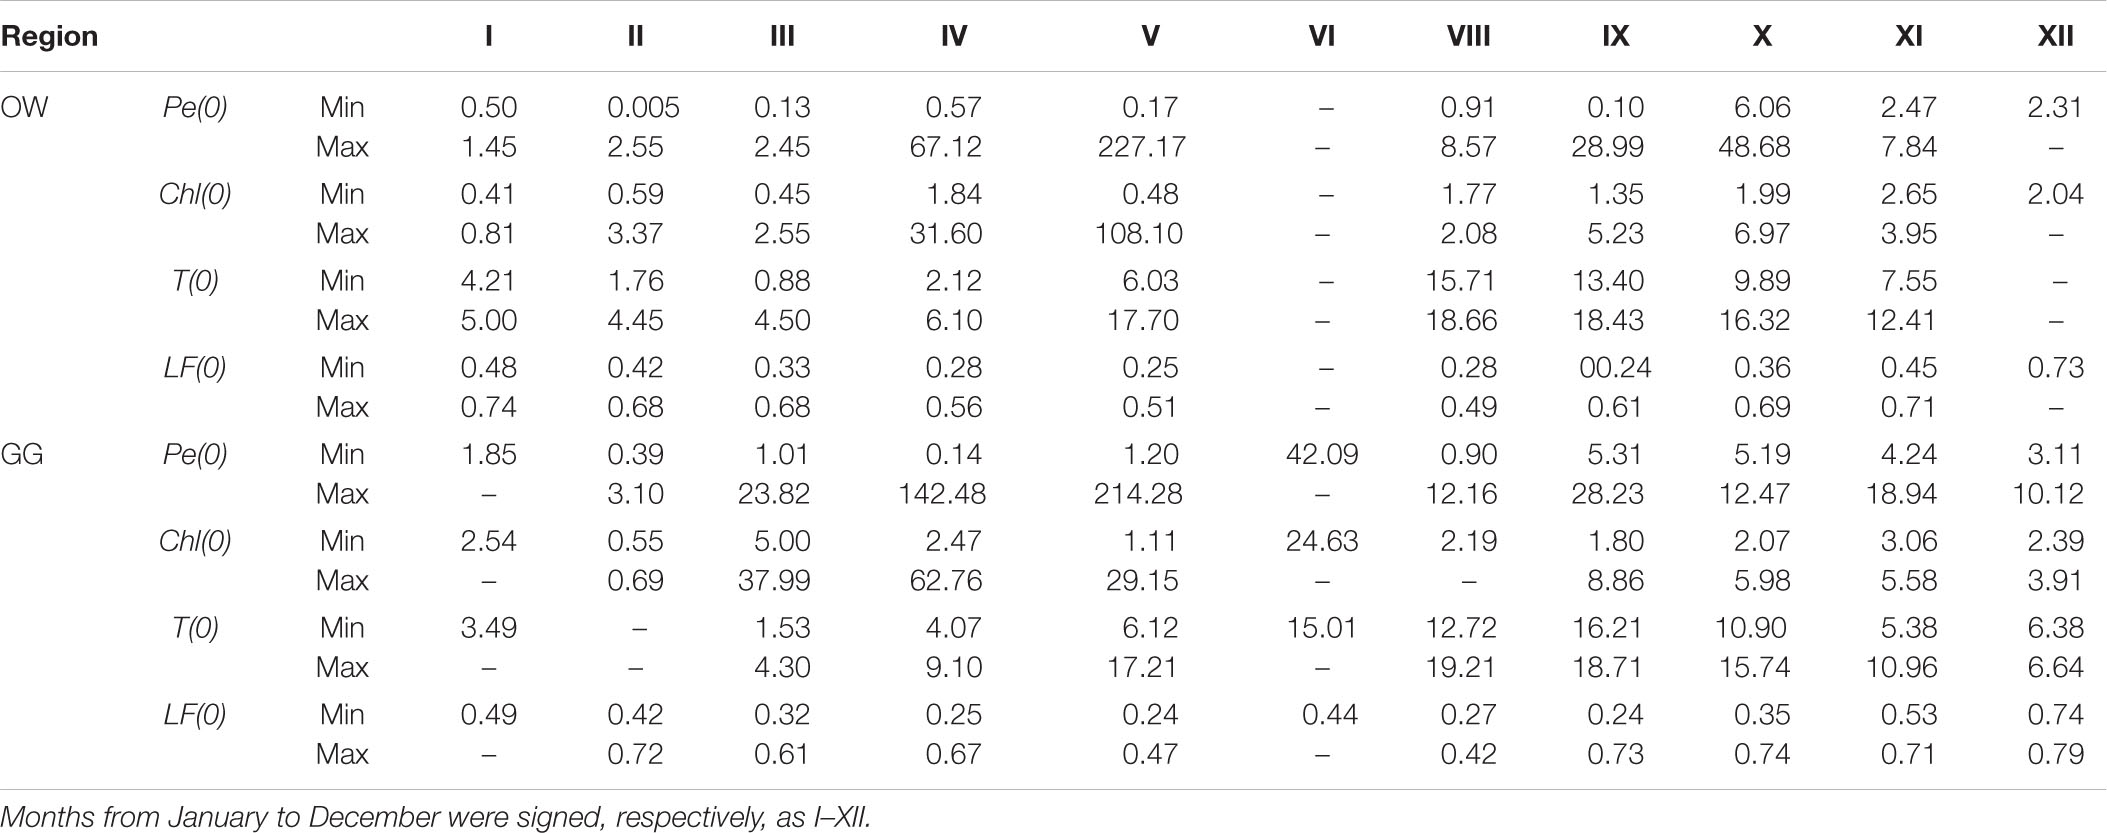
Table 1. Monthly changes (Min–Max) of surface values of the hourly primary production − Pe(0) (mg C m–3 h–1), chlorophyll a concentration − Ca(0) (mg m–3), temperature − T(0) (°C), and light factor − LF(0) (dimensionless) within 1993–2018 in the Baltic Proper (OW) and the Gulf of Gdansk (GG).
Most of the gathered data is in the range of two orders of magnitude (77% in OW and 90% in GG). The mentioned data were mainly collected in the trophic type of waters from E1 to E3 in both regions, which corresponds to the surface concentration of chlorophyll a in the range 1–10 mg m–3 (Wozniak and Pelevin, 1991). Only 5% of OW and 15% of GG data comes from waters with much higher trophicity. PP lower than 1 mg C m–3 h–1 appeared in 22 and 8% of cases in OW and GG, respectively, and corresponded with lower surface chlorophyll a concentrations (<0.46 in OW and 2.15 mg m–3 in GG). In both regions the lowest values of Chl(0) appeared in the period of January–March and they usually were less than 0.86 mg m–3 with a few exceptions: in February 2016 and in March 2005, 2007, and 2015 when they exceeded 1.64 mg m–3. In April, Chl(0)s changed in a range of 1.84–31.60 and 4.07–9.10 mg m−3 respectively in OW and GG. Then concentrations higher than 7 mg m−3 were recorded in 60 and 64% of cases in OW and GG.
The temperature values at the surface, T(0) changed in a range of 0.88–18.66 and 1.41–19.21°C, respectively, in OW and GG. In the current analysis, the influence of temperature on the PP was not examined and the temperature information was given as a measurements background. However, it is worth noting that he lowest temperatures were measured in March (from 0.88 in 2011 to 4.45°C in 2007 OW and from 1.41 in 2005 to 4.60°C in 2007 GG), while the highest values of T(0) were observed in 50% of cases in September.
The use of light factor LF parameter to calculate daily PP allows to consider the light conditions prevailing on the day of measurement. The LF values at the surface changed in range 0.24–0.79 within 26 measuring years in both Baltic Sea areas. The values lower than about 0.50 appeared in cases of such days when the solar day lasted 14–17 h (April–August). Higher values were observed in winter time when the solar day lasted about 8 h and then about 70–80% of daily solar radiation falls on the PP exposition time.
The monthly mean of daily PP at 0 m determined for 26 year period, <Pd(0)>26 expressed in mg C m–3 day–1 and their standard deviation (±SD) are presented in Table 2. The seasonal distribution of the means of a daily PP at 0 m was not significantly different from the distribution of Pe(0) in both Baltic regions. The winter values Pd(0) were the lowest in both investigated areas, but the values in OW were almost two times lower than the ones in GG, respectively <9 mg C m–3 day–1 and <16 mg C m–3 day–1. In March OW values were still as low as the winter ones while they rised up about 10 times in GG. In April GG values remained two times higher than in September.

Table 2. Monthly mean of daily primary production at 0 m, <Pd(0)>26 and standard deviation (±SD) expressed in mg C m–3 day–1 calculated based on data collected within 1993–2018 in the Baltic Proper (OW) and the Gulf of Gdansk (GG).
The mean values of daily PP are sensitive to extremely high values in the analyzed dataset. Such extreme values occasionally appeared within 1993–2018 also at various depths like in February 2016 in OW. Then the values of Pd were extremaly high in comparison to other years and maximum Pd at 5 m equalled 81 mg C m–3 day–1. Vertical distribution of Pd changed strongly in every month in both regions. From March to November stratification in water column was observed in OW and GG. In May, maximum daily PP changed from 49 in 1998 to 3507 mg C m–3 day–1 in 1993 at 3 m and 0 m in OW and from 85 in 2012 to 8531 mg C m–3 day–1 in 1994 at 3 m and 1 m in GG. The noticeable high value Pd = 422 mg C m–3 day–1 at the surface in June 2017 GG was the only one obtained at that time within 26 years of mesurements in the Baltic Sea.
Therefore, the characteristic features of vertical profiles (values and differences in the location of maximum) that change between months are presented using median, Pd(z)med,26 of individual months calculated on the basis of the number of data collected in each month within 1993–2018 (Figure 5). As we can see the most stable water column and at the same time the lowest Pdmed,26 values appeared in winter, for example in most cases in February they changed from values near 0 at almost each depth to 20 and to 40 mg C m–3 day–1 at the surface, respectively, in OW and GG. In other seasons within 1993–2018 a strong interregional variability of the daily PP in water column was observed. Vegetation season started earlier in GG than in OW. In March in GG Pdmed,26 = 211 mg C m–3 day–1 at 1 m, while in OW they were as low as winter values and equalled 22 mg C m–3 day–1 at 2 m. Until November median values of PP remained significantly higher in both regions, even taking into account the lack of data in July and low number of data in August (8 and 2 in respective regions). The maximum values of Pdmed,26 observed in both regions in April were much higher than in the other months. In both regions the location of Pd(z)med,26 maximum appeared at the same depths: at 2 m in April and 1 m in September. From November to February maximum Pd appeared in layer 0−1 m. In the period from April to September clear differences are visible below the maximum, almost every month Pdmed,26 at the 10 m depth were 2 times higher in OW than in GG. Probably due to variability of Pd(z) in individual years, two-modal profil with maximum at 3 and 7 m appearred in May in OW.
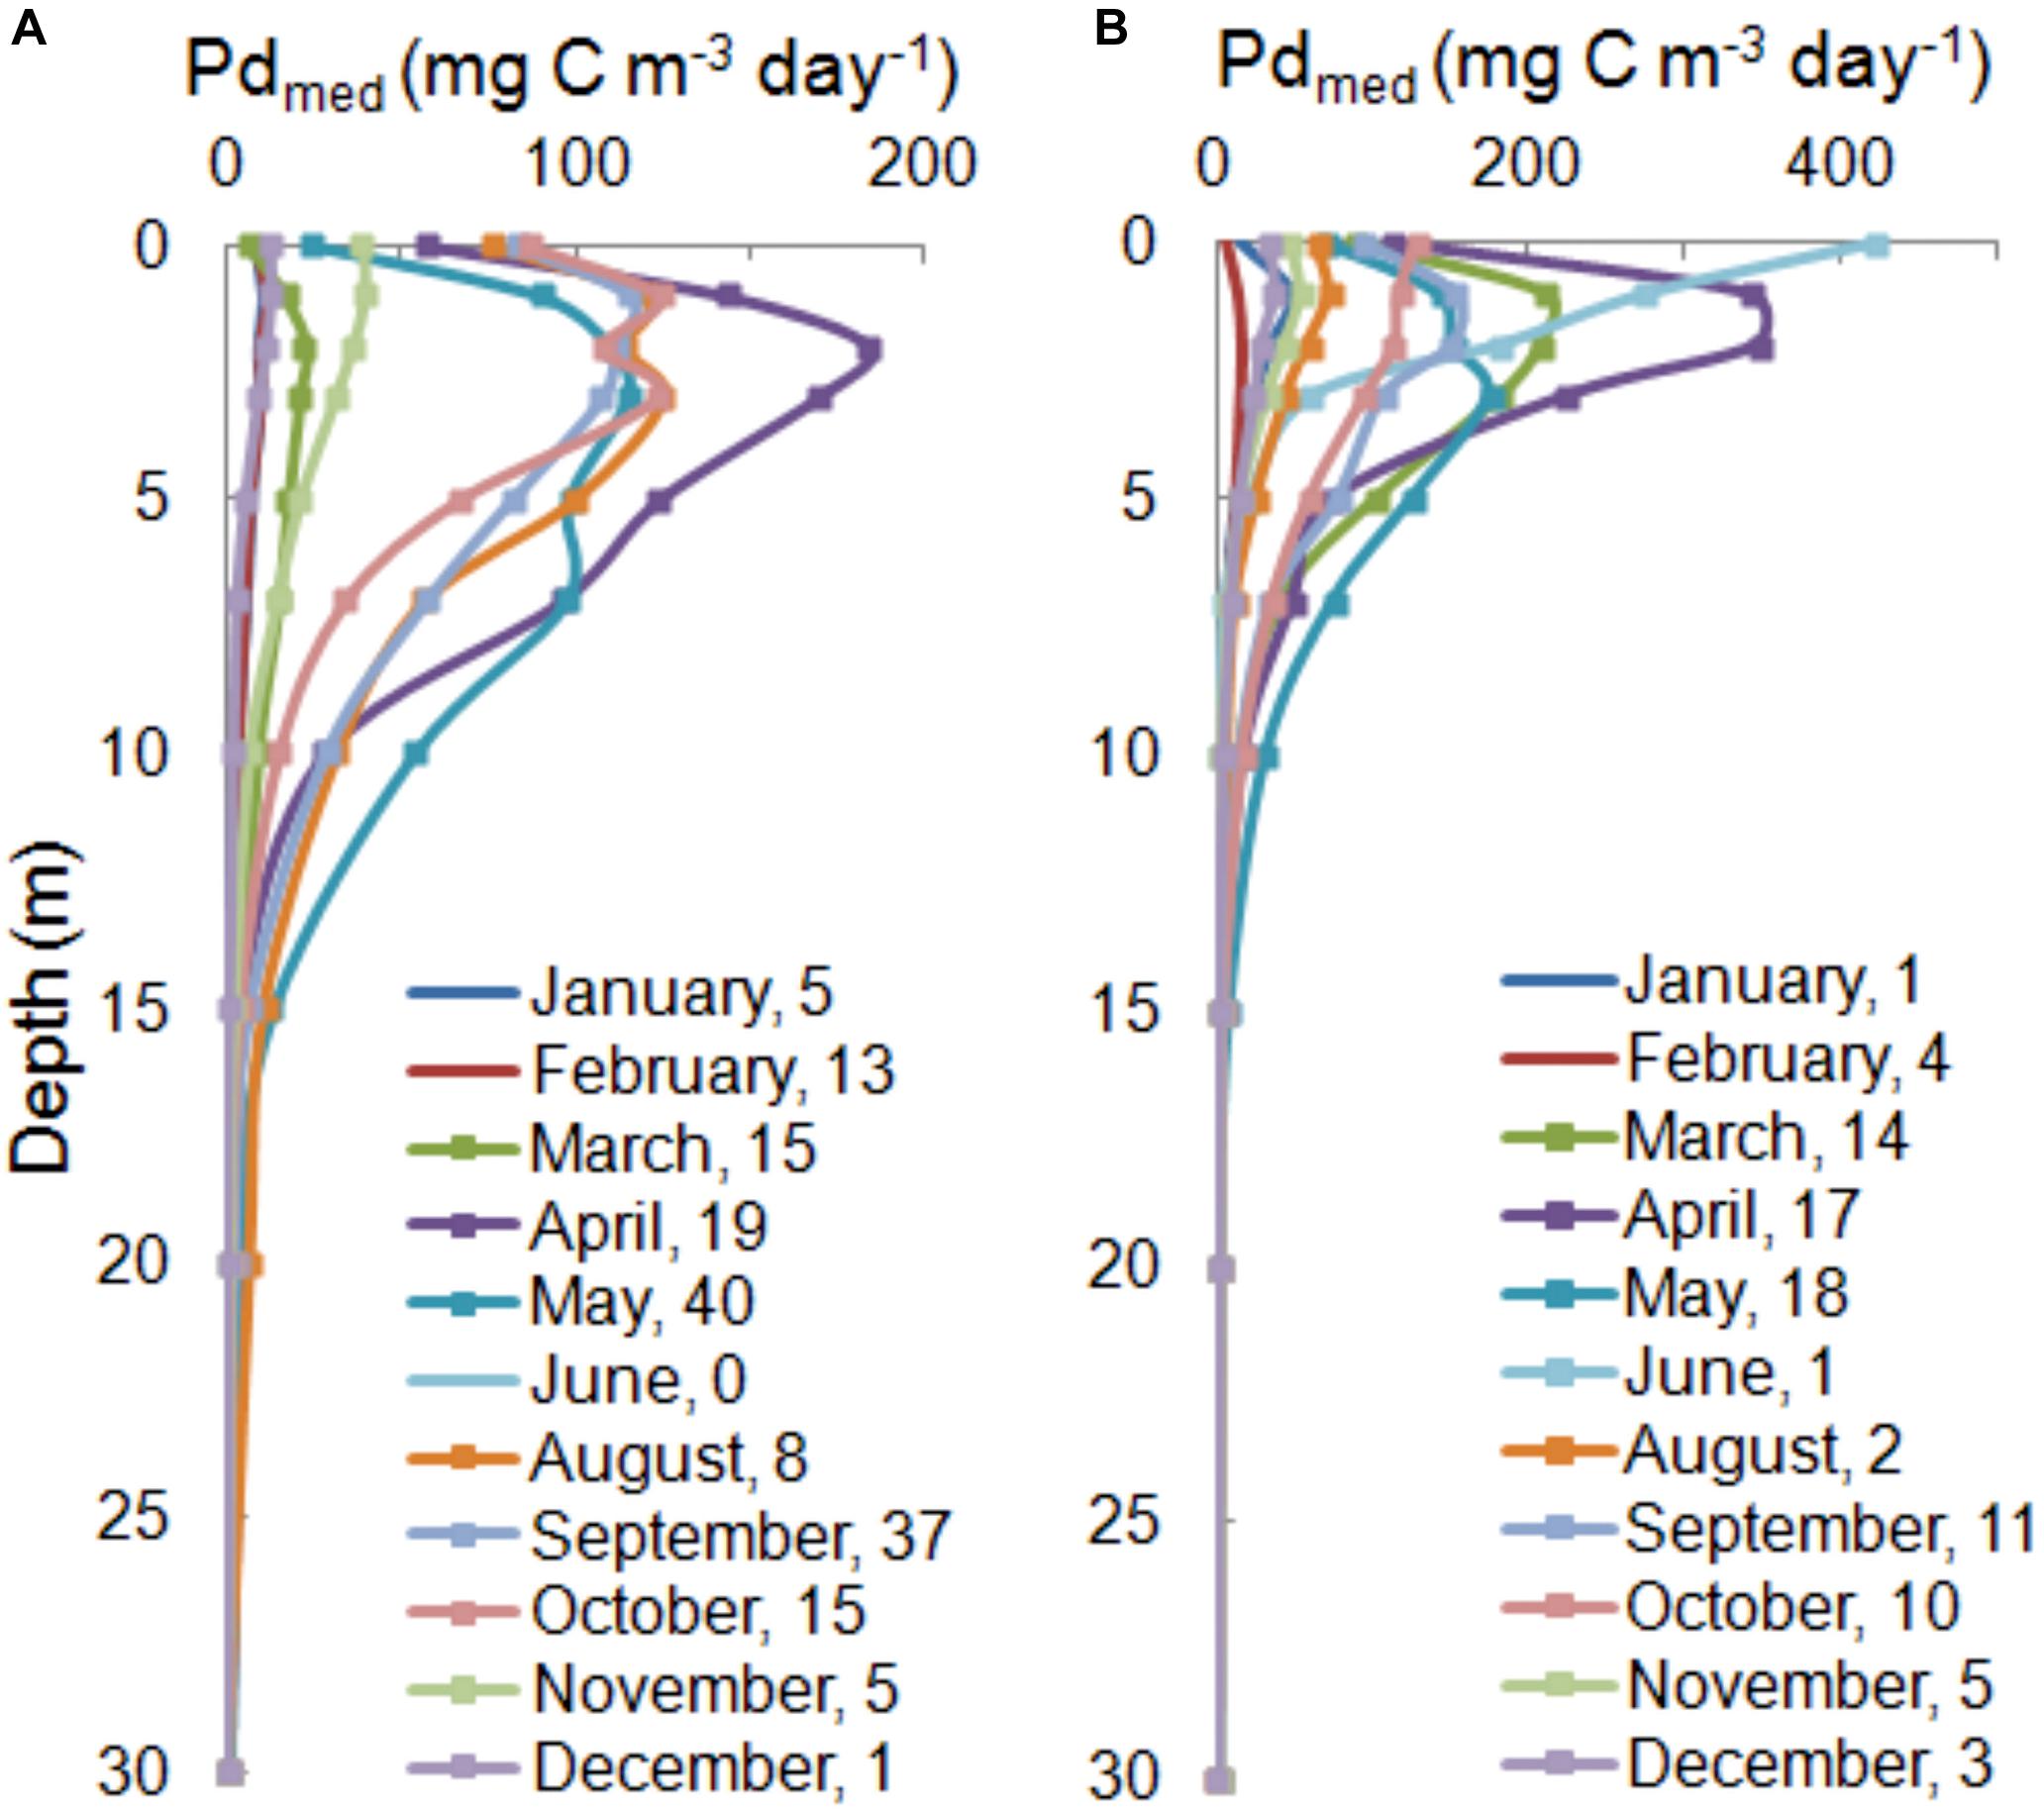
Figure 5. The median of PPs in water column, Pd(z)med,26 for the Baltic Proper (A) and the Gulf of Gdansk (B) calculated based on individual amount of data in each month from period 1993–2018 shown as number in legends.
The monthly mean <Pi(0–30)>26 determined for 26 year period were listed in Table 3 and presented in Figure 6. The seasonal distributions of <Pi(0–30)>26 in OW and GG were similar to each other. The lowest values (<0.21 g C m–2 day–1) appeared in winter in the months from December to February, while the highest ones in Aprils and Mays (>2 g C m–2 day–1). Spring values were two times higher than in September and October and the values of <Pi(0–30)>26 in OW were 6–17% lower than in GG in most of the cases. As in the analysis of the hourly and daily values of PP at the surface particularly high values of <Pi(0–30)> were also recorded in individual years. For example in OW the value of <Pi(0–30)>= 0.87 g C m–2 day–1 in February 2016 was noticeably higher than in other years (less than 0.20 g C m–2 day–1) or in October while the value in 2005 was almost 4 times higher (about 2.50 g C m–2 day–1) than within the period of 2004–2013. Stratification in water column has been noticed for instance in GG in May 1994 when the value of <Pi(0–30)>= 12.93 g C m–2 day–1 was about 10 times higher than the mean and median values within the period 1993–2018.
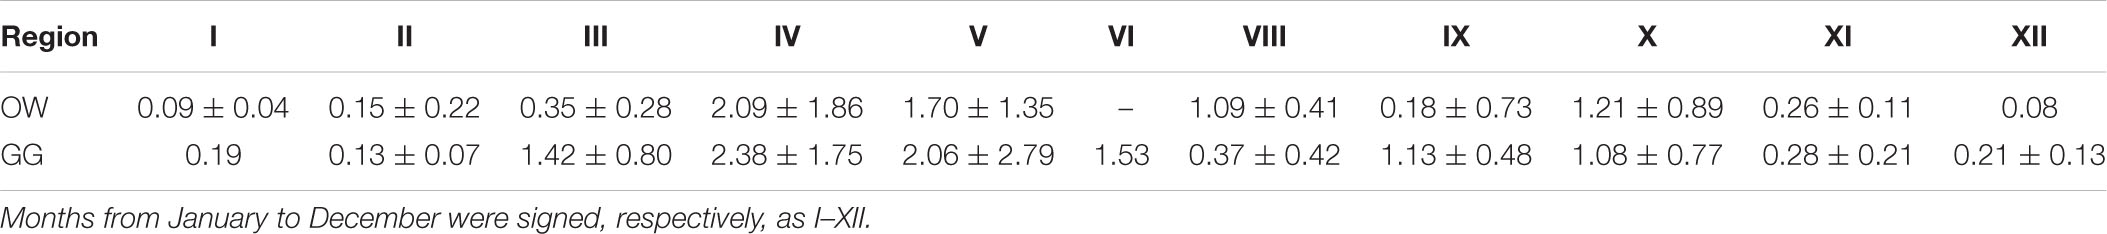
Table 3. Monthly mean of daily primary production integrated in layer 0–30 m, <Pi(0–30)>26 and standard deviation (±SD) expressed in g C m–2 day–1 calculated based on data collected within 1993–2018 in the Baltic Proper (OW) and the Gulf of Gdansk (GG).
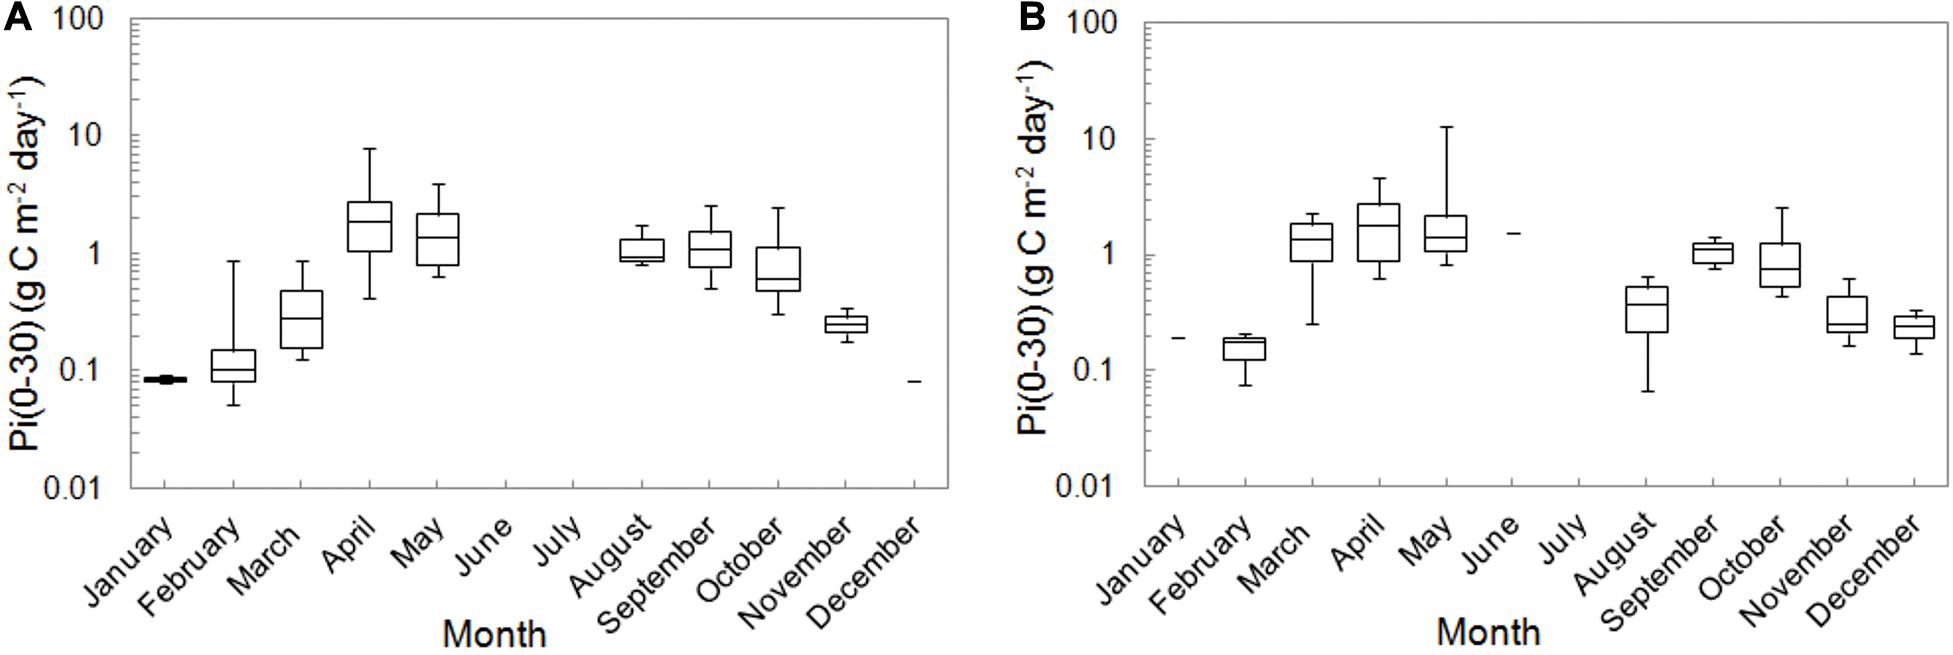
Figure 6. The monthly distributions of integrated PPs, Pi(0–30) in the Baltic Proper (A) and the Gulf of Gdansk (B) within 1993–2018. The line indicates median values, 25th and 75th percentile of data as well as their minimal and maximal values.
Although the data gathered in both regions are irregularly distributed over the period of 26 years of measurements they still allow to point out differences and similarities within 1993–2018. The monthly pattern in the Baltic region was reported by other authors. Wasmund and coauthors (Wasmund et al., 2000) established the lowest biomass in the Baltic Sea in winter (January–February). In the Baltic Proper (eastern part of Gotland) the winter conditions last until even the beginning of April, while in the Gulf of Gdansk the spring bloom can start earlier, even in Fabruary or March. In the paper by Witek et al. (1997) the minimal PP in the Gulf of Gdansk was shown in February whereas the highest values in April. Analogous observations can be found in Renk (1990), Ochocki et al. (1995), Andreasson et al. (2009), Wielgart-Rychert et al. (2017), and Kudryavtseva et al. (2019). It is worth noting that the absolute values of PP obtained by the other authors are lower than those discussed in this paper. Larger differences appeared in bloom seasons (spring and summer) with higher biomass concentrations than during winter conditions. The PP Pi(0–30) in water body of GG in 1993, obtained by Witek et al. (1997) in February changed in the range 0.01–0.05 g C m–2 day–1, in April ranged 0.44–0.98, in May 0.82–3.82, and in October 0.20–0.84 g C m–2 day–1.
The differences between results of measurements fits the range of PP variability in various regions and seasons in the Baltic Sea which exceeds three orders of magnitude. Significant spatial differences in productivity are observed even at short distances - especially during the bloom periods. Sensitivity of the photosynthesis process to external environmental conditions was usually recognized as the main reason of the differences in the absolute values of PP determined in situ. In our case, however, the discrepancies are not only due to natural causes. The main reasons of the discrepancies are the measurement details, in particular the used filters. According to HELCOM, Whatman GF/F filters with a 0.7 μm nominal particle retention are recommended for PP determination using 14C method (HELCOM, 2014). The use of filters with smaller pores (cellulose acetate filter with a pore size 0.45 μm) in our measurements makes it possible to take into account smaller phytoplankton fractions (Nielsen and Bresta, 1984), which can significantly increase the value of determined PP. The study of plankton diversity in the Baltic waters reveal that pico- and nanoplankton can dominate from 5 to even 98% of the total phytoplankton biomass and those algae taxa have higher specific photosynthesis and growth rates than the larger cells (Wasmund and Uhlig, 2003; Jakubowska and Szeląg-Wasielewska, 2015; Hu et al., 2016; Vanharanda et al., 2020). Biomass of picocyanobacteria like Synechococcus spp. or Synechocystis spp. can pose up to 80% of total bloom biomass, and they can be responsible for even 50% of PP in the bloom (Stal et al., 2003; Mazur-Marzec et al., 2013). Results of our comparative analyzes of chlorophyll fluorescence intensity measured in situ and in filtered water (GF/F) confirmed that small organisms can contribute from 0.13 to 81.5% of total chlorophyll a content in water column (unpublished data).
The seasonal surface and vertical distributions of daily PP mainly depend on insolation and water transparency (Renk, 1990; Ochocki et al., 1995). In the Baltic Sea, the photysyntetic maximum occurred at the surface or at 1 m and monotonical decrease with depth in late autumn and winter (Figure 5). Due to rising insolation from springtime the maximum of PP appeared at different depths, usually 1–3 m and even at 5 m in the case of extremally solar conditions, which may indicated an photo-inhibition of production in the layer above this depth, but also nutrients limitation at the surface (Hakanson and Bryhn, 2008; HELCOM, 2018; Savchuk, 2018). The statistical analyses carried out on a 26-years data set allow to find some regularities in values of productivity resulting from different hydrological and biological conditions (temperature and chlorophyll a concentration at surface − T(0) and Chl(0), respectively) in subsequent months and years. Surface chlorophyll a can be used as a proxy of phytoplankton biomass. At the same time, its higher values indirectly indicate the availability of nutrients in the water. Just like in February 2016 in OWs: when Chl(0) was almost 3 times higher and simultaneously values of Pi(0–30) more than 5 times higher than in other years. Perhaps it is due to the high availability of nutrients after the winter season. Based on our observations, we can also speculate that due to used different filters type, the low chlorophyll a concentration and high PP correspond to high amount of pico- and nanoplankton cells, but this requires further research and analysis.
The largest number of measurements in the open sea region (OW) were collected at station P1 and in the gulf region (GG) at station 92a. The amount of data was 19 in both cases. Tables 4, 5 present the individual values of surface daily PP for both of these locations against the appropriate monthly means, <Pd(0)>26 calculated based on all data within 1993–2018, respectively, for OW and GG. The results of our studies at the P1 station were compared with those received in 1983 by Renk (1990). The data presented in tables indicate significant, even 10-fold differences in the value of PP occurring in subsequent measuring years at the same location and month. At both stations singular PP values deviate significant from respective monthly means obtained in OW and GG. The highest diversity appeared especially in months with spring bloom (April–May) and they were always higher than those calculated for September. One exception was observed in 2015 at 92a. Then the opposite situation took place: in April Pd(0) values were much lower than those in September, 1.18 and 49.85 mg C m–3 day–1, respectively. Similar features i.e., higher values in May than in September were also observed at the P1 station by (Renk, 1990).
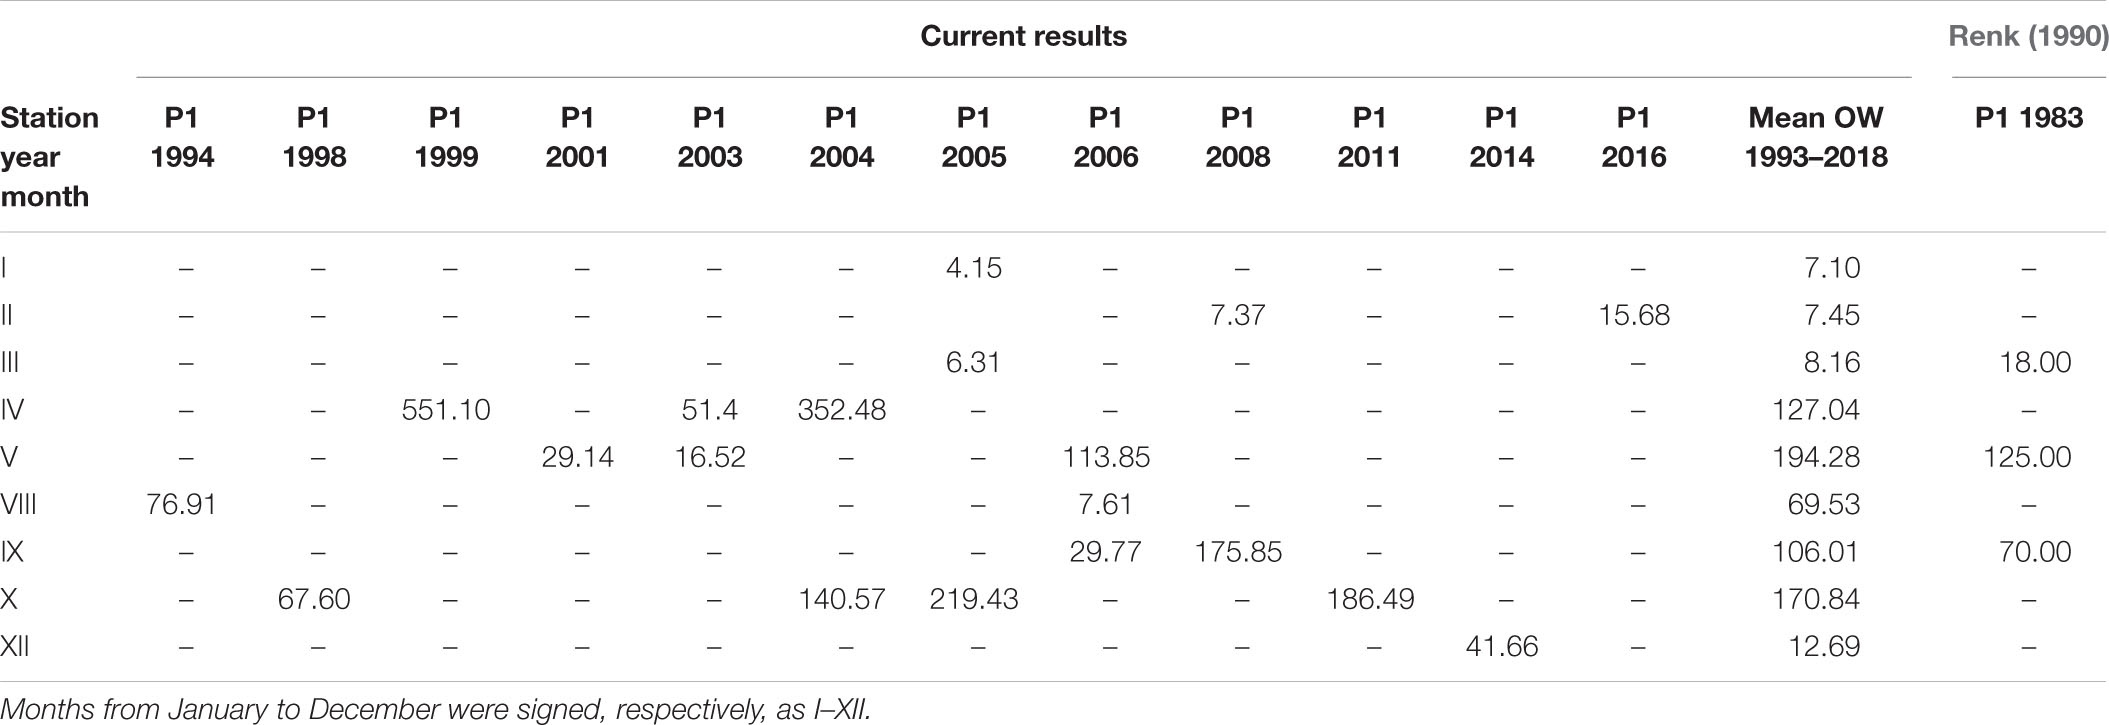
Table 4. The daily primary production, Pd(0) (mg C m–3 day–1) determined for P1 station (54°50N 19°20E) in consecutive years and the mean monthly values for the Baltic Proper (OW) within 1993–2018 together with data for station P1 from 1983 given by Renk (1990).
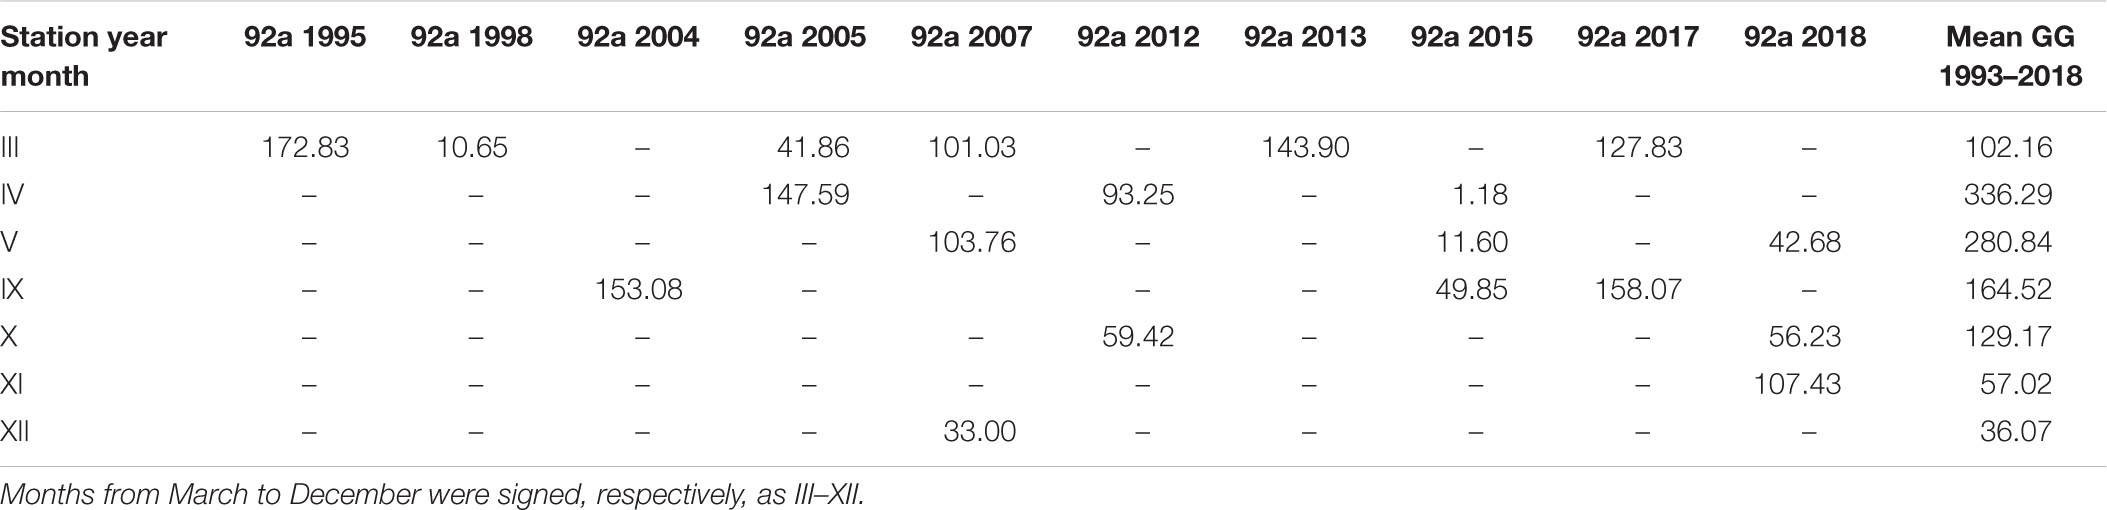
Table 5. The daily primary production, Pd(0) (mg C m–3 day–1) determined for 92a station (54°35N 18°40E) in consecutive years and the mean monthly values for the Gulf of Gdansk (GG) within 1993–2018.
The Baltic Sea eutrophication mainly due to the past and present excessive inputs of the total nitrogen and phosphorus is observed by the international community and reported for many years (HELCOM, 2009, 2014; Gustafsson et al., 2013). Following the result of eutrophication is increasing production of the primary organic matter. As it can be seen in Kaczmarek et al. (1997), an increase of productivity was observed in the years 1968–1991 in the Baltic Proper and the Gulf of Gdansk (Figure 7A). The largest increase was observed in Bornholm region and narrow region above the Gulf of Gdansk especially in spring. The Baltic countries undertake a number of joint actions to improve the condition of the ecosystem of this sea, but 97% of the Baltic Sea area still suffers from eutrophication (HELCOM, 2018). However, the recent HELCOM report found a decrease in eutrophication factors in some regions of the Baltic Sea in 2011–2016, including in the Gulf of Gdansk (HELCOM, 2018). The confirmation of these observations can also be found in our investigation. The analyses were carried out for the spring (March–May) and summer-autumn (June–October) periods for both regions and decreasing trends were founded (Figure 7B). The Pearson’s correlation coefficient (r) does not exceed 0.5, nevertheless it can be assumed that the trend can be visible and probably will be observed in the next years. It requires further observations.
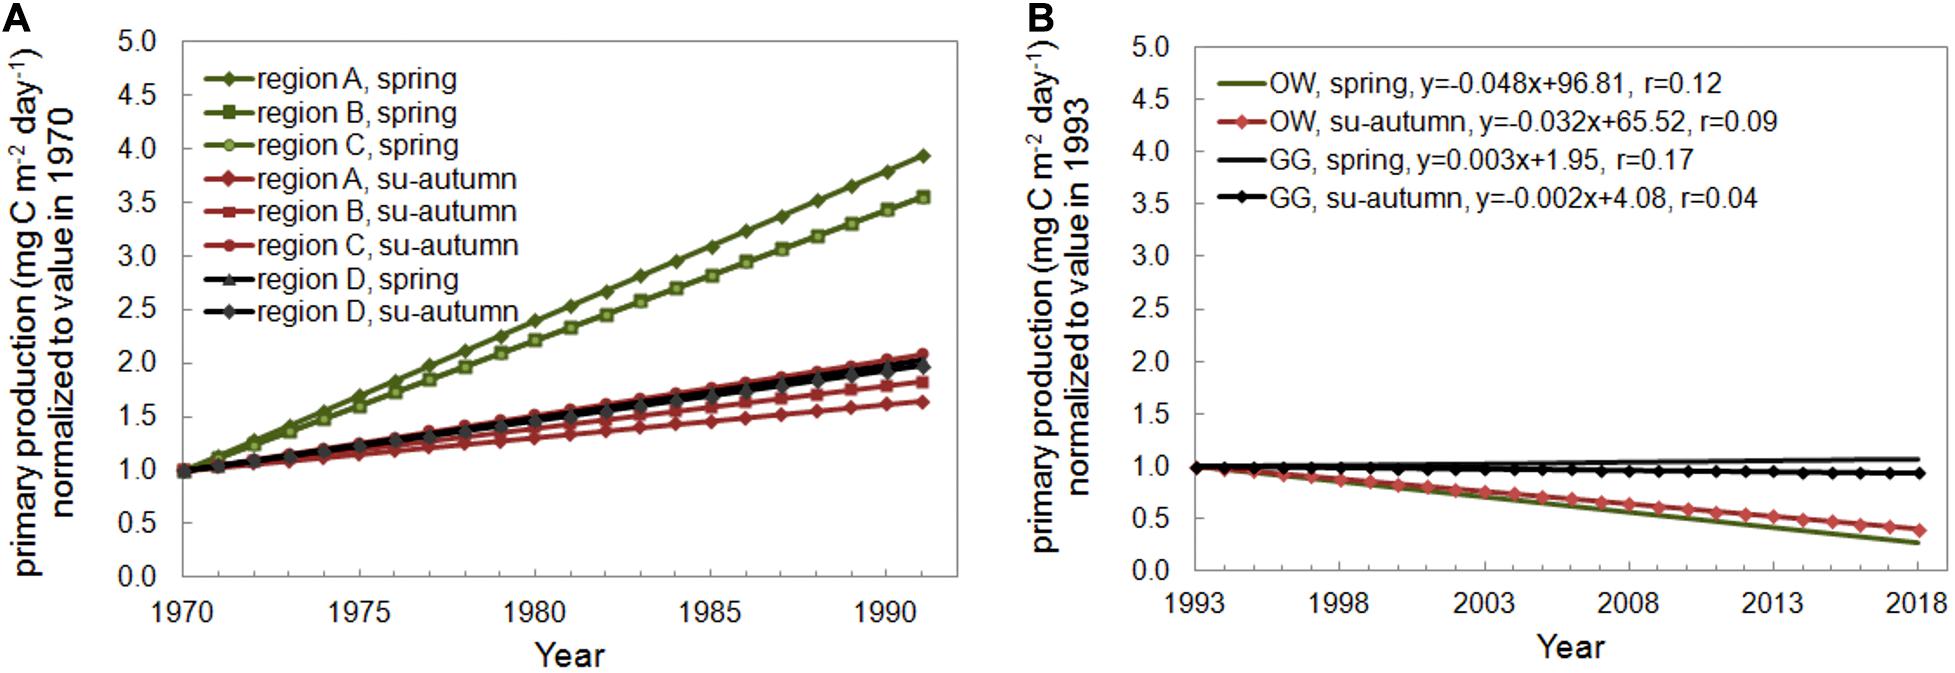
Figure 7. Seasonal trends of (A) the primary production determined by Kaczmarek et al. (1997) for the open Baltic waters (region A, B, C) and the Gulf of Gdansk (region D) and (B) the primary production in water column − Pi(0–30) determined in the Baltic Proper (OW) and in the Gulf of Gdansk (GG) within 1993–2018.
Primary production at the stations located in the Baltic Sea region were discussed using the data set collected within 1993–2018. It contains 244 vertical profiles with 4h incubations of the PP – Pe(z) (mg C m–3 h–1) and the daily PP – Pd(z) (mg C m–3 day–1) as well as the integrated PP in layer 0–30 m – Pi(0–30) (g C m–2 day–1) values calculated on their basis. For two regions of the Baltic Sea: Baltic’s open water and the Gulf of Gdansk the regularities and characteristic features of productivity were determined and analyzed.
Within 26-years’ data base a large natural variability of productivity in the Baltic Sea was revealed showing almost 4-order differences in subsequent months and years. Capturing measurement repeatability even when limited to a single location, as it was done for P1 and 92a station, is not possible due to the complexity of the problem. However, a slight upward trend of PP within 1993–2018 can be observed in the Gulf of Gdansk in spring, while in summer-autumn period as well in the Baltic Proper the trend is clearly decreasing. The obtained results confirmed observations conducted by HELCOM (2018) and showed a slow decreased of eutrophication in the Baltic Sea within 1993–2018.
The obtained PP values are higher than those reported in the literature which may be caused by use of 0.45 μm pore size filters instead of 0.7 μm applied in most of the research centers. In the future it is planned to conduct fractionating experiment of PP to validated that the filter choice causes a systematic difference.
Despite the quantitative differences in productivity, the results of the analysis of 1993–2018 confirm the seasonal characteristics of the Baltic Sea. The lowest productivity was observed in winter (<9 mg C m–3 day–1 and <0.87 g C m–2 day–1 in gulf waters and <16 mg C m–3 day–1 and <0.34 g C m–2 day–1 in the open Baltic) when phytoplankton biomass was also low (Chl(0) <1 mg m–3) in both Baltic locations. In March PP in gulf waters increased 10-fold due to the high load of nutrients after winter period while in the OWs production in March was still low and began to grow in April. Primary production both on the surface and in water column increased significantly two times per year: in the Gulf of Gdańsk in April (0.346 ± 0.44 g C m–3 day–1 and 2.38 ± 1.75 g C m–2 day–1) and September (0.13 ± 0.10 g C m–3 day–1 and 1.13 ± 0.48 g C m–2 day–1) and also in water body in the Baltic Proper (2.09 ± 1.86 and 1.18 ± 0.73 g C m–2 day–1), but the maximum at the surface OWs were shifted to May and October (0.19 ± 0.67 and 0.17 ± 0.15 g C m–3 day–1). In months with the highest productivity the surface chlorophyll a concentrations reached 62.96 in 1999 GG and even 108.10 mg m–3 in 1993 OW while the higest temperature at the surface (>17°C) were observed in September.
The original contributions presented in the study are included in the article/Supplementary Material, further inquiries can be directed to the corresponding author. The raw data has been stored in the repository of IO PAS and they are available online at: https://odis.iopan.pl/PP.
AZ, JS-E, and MO conceived the manuscript. AZ did the calculations, visualized the data, and wrote a preliminary version of the manuscript. JS-E and MO did a deep review. All authors discussed and reworked the manuscript.
This research was carried out within the resources for the Statutory Research Projects (The Institute of Oceanology, Polish Academy of Sciences in Sopot and Institute of Physics, Pomeranian University in Słupsk) and the framework of the SatBaltyk (POIG01.01.02-22-011/09) and eCUDO.pl (POPC.02.03.01-IP.01-00-0062/18) projects funded by the European Union through the European Regional Development Fund.
The authors declare that the research was conducted in the absence of any commercial or financial relationships that could be construed as a potential conflict of interest.
We would like to thank the colleagues from IO PAS and the ship crew for their help with water samples collection, as well as Mirek Darecki and Ania Rozwadowska for processing the radiometrical measurements. We are very grateful to Maciek Sokolski, who was in chargé of the measuring equipment and made sure they were working properly and efficiently. We would also like to thank especially Ryszard Hapter who took the primary production measurements till 2015.
The Supplementary Material for this article can be found online at: https://www.frontiersin.org/articles/10.3389/fmars.2020.604532/full#supplementary-material
Andreasson, K. I. M., Wikner, J., Abrahamsson, B., Melrose, C., and Nyberg, S. (2009). Primary Production Measurements - an Intercalibration During a Cruise in the Kattegat and the Baltic Sea. SMHI Report Oceanografi 100/2009. Norrköping: SMHI.
Ask, J., Rowe, O., Brugel, S., Stromgren, M., Bystrom, P., and Andersson, A. (2016). Importance of coastal primary production in the northern Baltic Sea. Ambio 45, 635–648. doi: 10.1007/s13280-016-0778-5
Bender, M., Grande, K., Johnson, K., Marra, J., Williams, P., Le, J. B., et al. (1987). A comparison of four methods for determining planktonic community production. Limnol. Oceanogr. 32, 1085–1098. doi: 10.4319/lo.1987.32.5.1085
Darecki, M., Ficek, D., Krezel, A., Ostrowska, M., Majchrowski, R., Wozniak, S. B., et al. (2008). Algorithms for the remote sensing of the Baltic ecosystem (DESAMBEM). Part 2: empirical validation. Oceanologia 50, 509–538.
Dera, J., and Wozniak, B. (2010). Solar radiation in the Baltic Sea. Oceanologia 52, 533–582. doi: 10.5697/oc.52-4.533
Dybern, B. I., Ackefors, H., and Elmgren, R. (1976). Recommendation on methods for marine biological studies in the Baltic Sea. Baltic Mar. Biol. 1:98.
Glowinska, A., Ochocki, S., Popowska, B., Renk, H., and Torbicki, H. (1975). Comparative studies on methods of inorganic carbon determination in research works on primary production. Stud. Mater. MIR 15, 1–52.
Gustafsson, O., Gelting, J., Andersson, P., Larsson, U., and Roos, P. (2013). An assessment of upper ocean carbon and nitrogen export fluxes on the boreal continental shelf: a 3-year study in the open Baltic Sea comparing sediment traps, 234Th proxy, nutrient, and oxygen budgets. Limnol. Oceanogr. Met. 11, 495–510. doi: 10.4319/lom.2013.11.495
Hakanson, L., and Bryhn, A. C. (2008). Eutrophication in the Baltic Sea: Present Situation, Nutrients Transport Processes, Remedial Strategies. Berlin: Springer.
HELCOM (2009). “Eutrophication in the Baltic Sea - An integrated thematic assessment of the effects of nutrient enrichment and eutrophication in the Baltic Sea region,” in Proceedings of the Baltic Sea Environment Proceedings 115B, New York, NY.
HELCOM (2014). Manual for Marine Monitoring in the COMBINE Programme of HELCOM. Part C. Annex C-5. Phytoplankton Primary Production. Available online at: https://helcom.fi/media/publications/Manual-for-Marine-Monitoring-in-the-COMBINE-Programme-of-HELCOM.pdf
HELCOM (2018). “State of the Baltic Sea – Second HELCOM holistic assessment 2011–2016,” in Baltic Sea Environment Proceedings 155. Available online at: https://helcom.fi/media/publications/BSEP155.pdf
Hu, Y. O. O., Karlson, B., Charvet, S., and Andersson, A. F. (2016). Diversity of Pico- to mesoplankton along the 2000 km salinity gradient of the Baltic Sea. Front. Microbiol. 7:679. doi: 10.3389/fmicb.2016.00679
Jakubowska, N., and Szeląg-Wasielewska, E. (2015). Toxic Planctonic cyanobacteria - review. Mar. Drugs 13, 1497–1518. doi: 10.3390/md13031497
Kaczmarek, S., Koblentz-Mishke, O. J., Ochocki, S., Nakonieczny, J., and Renk, H. (1997). Primary production in the eastern and southern Baltic Sea. Oceanologia 39, 117–135.
Kowalewski, M. (2005). The influence of the Hel upwelling (Baltic Sea) on nutrient concentrations and primary production - the results of an ecohydrodynamic model. Oceanologia 47, 567–590.
Kratzer, S., Kyryliuk, D., and Brockmann, C. (2020). Inorganic suspended matter as an indicator of terrestrial influence in Baltic Sea coastal areas - Algorithm development and validation, and ecological relevance. Remote Sens. Environ. 237:111609. doi: 10.1016/j.rse.2019.111609
Kudryavtseva, E., Aleksandrov, S., Bukanova, T., Dmitrieva, O., and Rusanov, I. (2019). Relationship between seasonal variations of primary production, abiotic factors and phytoplankton composition in the coastal zone of the south-eastern part of the Baltic Sea. Reg. Stud. Mar. Sci. 32:100862. doi: 10.1016/j.rsma.2019.100862
Lysiak-Pastuszak, E., Drgas, N., and Piatkowska, Z. (2004). Eutrophication in the polish coastal zone: the past, present status and future scenarios. Mar. Pollut. Bull. 49, 186–195. doi: 10.1016/j.marpolbul.2004.02.007
Malinsky-Rushansky, N. Z., and Legrand, C. (1996). Excretion of dissolved organic carbon by phytoplankton of different sizes and subsequent bacterial uptake. Mar. Ecol. Prog. Ser. 132, 249–255. doi: 10.3354/meps132249
Maranon, E., Cermeno, P., Lopez-Sandoval, D. C., Rodriguez-Ramos, T., Sobrino, C., Huete-Ortega, M., et al. (2013). Unimodal size scaling of phytoplankton growth and the size dependence of nutrient uptake and use. Ecol. Lett. 16, 371–379. doi: 10.1111/ele.12052
Marra, J. (2009). Net and gross productivity: weighing in with 14C. Aquat. Microb. Ecol. 56, 123–131. doi: 10.3354/ame01306
Mazur-Marzec, H., Krezel, A., Kobos, J., and Plinski, M. (2006). Toxic Nodularia spumigena blooms in the coastal waters of the Gulf of Gdańsk: a ten-year survey. Oceanologia 48, 255–273.
Mazur-Marzec, H., Sutryk, K., Kobos, J., Hebel, A., Hohlfeld, N., Blaszczyk, A., et al. (2013). Occurrence of cyanobacteria and cyanotoxin in the Southern Baltic Proper. Filamentous cyanobacteria versus single-celled picocyanobacteria. Hydrobiologia 701, 235–252. doi: 10.1007/s10750-012-1278-7
Moigis, A. G., and Gocke, K. (2003). Primary production of phytoplankton estimated by means of the dilution method in coastal waters. J. Plankton Res. 25, 1291–1300. doi: 10.1093/plankt/fbg089
Murray, C. J., Muller-Karulis, B., Carstensen, J., Conley, D. J., Gustaffson, B. G., and Andersen, J. H. (2019). Past, present and future eutrophication status of the Baltic Sea. Front. Mar. Sci. 6:2. doi: 10.3389/fmars.2019.00002
Nielsen, G., and Bresta, A. (1984). Guidelines for the Measurement of Phytoplankton Primary Production, 2nd Edn, Stockholm: The Baltic Marine Biologists.
Ochocki, S., Nakonieczny, J., Chmielowski, H., and Zalewski, M. (1995). The hydrochemical and biological impact of the river Vistula on the pelagic system of the Gulf of Gdansk in 1994. Part 2. Primary production and chlorophyll A. Oceanologia 37, 207–220.
Olenina, I., Hajdu, S., Edler, L., Andersson, A., Wasmund, N., Busch, S., et al. (2006). Biovolumes and size-classes of phytoplankton in the Baltic Sea. HELCOM Baltic Sea Environ. Proc. 106:144.
Piwosz, K. (2019). Weekly dynamics of abundance and size structure of specific nanophytoplankton lineages in coastal waters (Baltic Sea). Limnol. Oceanogr. 64, 2172–2186. doi: 10.1002/lno.11177
Purina, I., Labucis, A., Barda, I., Jurgensone, I., and Aigars, J. (2018). Primary productivity in the Gulf of Riga (Baltic Sea) in relation to phytoplankton species and nutrient variability. Oceanologia 60, 544–552. doi: 10.1016/j.oceano.2018.04.005
Regaudie-de-Gioux, A., Lasternas, S., Agustí, S., and Duarte, C. M. (2014). Comparing marine primary production estimates through different methods and development of conversion equations. Front. Mar. Sci. 1:19. doi: 10.3389/fmars.2014.00019
Renk, H., Ochocki, S., and Kurzyk, S. (2000). In situ and simulated in situ primary production in the Gulf of Gdańsk. Oceanologia 42, 263–282.
Ronnberg, C., and Bonsdorff, E. (2004). Baltic Sea eutrophication: area-specific ecological consequences. Hydrobiologia 514, 227–241. doi: 10.1007/978-94-017-0920-0_21
Sathyendranath, S., Platt, T., Brewin, R. J. W., and Jackson, T. (2019). “Primary production distribution,” in Encyclopedia of Ocean Sciences, eds J. K. Cochran, H. J. Bokuniewicz, and P. I. Yager (Cambridge, MA: Academic Press).
Savchuk, O. P. (2018). Large-scale nutrient dynamics in the Baltic Sea 1970-2016. Front. Mar. Sci. 5:95. doi: 10.3389/fmars.2018.00095
Schernewski, G., and Neumann, T. (2002). “Perspectives on eutrophication abatement in the Baltic Sea,” in Littoral 2002: The Changing Coast, Vol. 2, ed. EUROCOAST/EUCC (Portugal: EUROCAST), 503–511.
Schlitzer, R. (2020). Ocean Data View. Available online at: odv.awi.de
Siegel, H., and Gerth, M. (2008). “Optical remote sensing applications in the enclosed Baltic Sea,” in Remote Sensing of European Seas, Chap. 7, eds V. Barale and M. Gade (Cham: Springer).
Stal, L. J., Albertano, P., Bergman, B., von Brockel, K., Gallon, R. J., Haes, P. K., et al. (2003). BASIC: baltic sea cyanobacteria. An investigation of the structure and dynamics of water blooms of cyanobacteria in the Baltic Sea - responses to a changing environment. Con. Shelf Res. 23, 1695–1714. doi: 10.1016/j.csr.2003.06.001
Stemmann Nielsen, E. (1952). The use of radio-active carbon (14C) for measuring organic production in the sea. J. Cons. Intern. Pour l’Explorat. Mer. 18, 117–140. doi: 10.1093/icesjms/18.2.117
Stemmann Nielsen, E., and Jensen, E. A. (1957). Primary oceanic production. The autotrophic production of organic matter in the Ocean. Galathea Rep. 1, 49–136.
Stramska, M., Stramski, D., Hapter, R., Kaczmarek, S., and Ston, J. (2003). Bio-optical relationships and ocean colour algorithms for the north polar region of the Atlantic. J. Geophys. Res. 108:3143. doi: 10.1029/2001JC001195
Strickland, J. D. H., and Parsons, T. R. (1972). A Practical Handbook of Seawater Analysis, 2nd Edn, Ottawa: Fisheries Research Board of Canada.
Thornton, D. C. O. (2014). Dissolved organic matter (DOM) release by phytoplankton in the contemporary and future ocean. Eur. J. Phycol. 49, 20–46. doi: 10.1080/09670262.2013.875596
Vanharanda, M., Elovaara, S., Franklin, D. J., Spilling, K., and Tamelander, T. (2020). Viability of pico- and nanophytoplankton in the Baltic Sea during spring. Aquat. Ecol. 54, 119–135. doi: 10.1007/s10452-019-09730-3
Wasmund, N., Nausch, G., Postei, L., Witek, Z., Zalewski, M., Gromisz, S., et al. (2000). Trophic status of coastal and open areas of the south-eastern Baltic Sea based on nutrients and phytoplankton data from 1993-1997. J. Mar. Sys. Rep. 38, 849–864. doi: 10.1006/ecss.2001.0828
Wasmund, N., and Uhlig, S. (2003). Phytoplankton trends in the Baltic Sea. ICES J. Mar. Sci. 60, 177–186. doi: 10.1016/S1054-3139(02)00280-1
Wielgart-Rychert, M., Rychert, K., Witek, Z., and Zalewski, M. (2017). Calculation of the photosynthetic quotient (PQ) in the Gulf of Gdansk (Southern Baltic). J. Ecol. Protec. Coast. 21, 51–60. doi: 10.3750/aip2005.35.1.07
Witek, Z., Ochocki, S., Maciejowska, M., Pastuszak, M., Nakonieczny, J., and Podgorska, B. (1997). Phytoplankton primary production and its utilization by the pelagic community in the coastal zone of the Gulf of Gdansk (southern Baltic). Mar. Ecol. Prog. Ser. 148, 169–186. doi: 10.3354/meps148169
Wozniak, B., Bradtke, K., Darecki, M., Dera, J., Dudzińska-Nowak, J., and Dzierzbicka-Glowacka, L. (2011). SatBaltyk - a Baltic environmental satellite remote sensing system - an ongoing project in Poland. Part 1: assumptions, scope and operating range. Oceanologia 53, 897–924. doi: 10.5697/oc.53-4.897
Wozniak, B., and Pelevin, V. N. (1991). Optical classifications of the seas in relation to phytoplankton characteristics. Oceanologia 31, 25–55.
Keywords: primary production, 14C isotope light-dark method, Baltic Sea, trend, eutrophication
Citation: Zdun A, Stoń-Egiert J, Ficek D and Ostrowska M (2021) Seasonal and Spatial Changes of Primary Production in the Baltic Sea (Europe) Based on in situ Measurements in the Period of 1993–2018. Front. Mar. Sci. 7:604532. doi: 10.3389/fmars.2020.604532
Received: 09 September 2020; Accepted: 23 December 2020;
Published: 22 January 2021.
Edited by:
Dongyan Liu, East China Normal University, ChinaReviewed by:
Kalle Olli, University of Tartu, EstoniaCopyright © 2021 Zdun, Stoń-Egiert, Ficek and Ostrowska. This is an open-access article distributed under the terms of the Creative Commons Attribution License (CC BY). The use, distribution or reproduction in other forums is permitted, provided the original author(s) and the copyright owner(s) are credited and that the original publication in this journal is cited, in accordance with accepted academic practice. No use, distribution or reproduction is permitted which does not comply with these terms.
*Correspondence: Agnieszka Zdun, emR1bkBpb3Bhbi5wbA==
Disclaimer: All claims expressed in this article are solely those of the authors and do not necessarily represent those of their affiliated organizations, or those of the publisher, the editors and the reviewers. Any product that may be evaluated in this article or claim that may be made by its manufacturer is not guaranteed or endorsed by the publisher.
Research integrity at Frontiers
Learn more about the work of our research integrity team to safeguard the quality of each article we publish.