
95% of researchers rate our articles as excellent or good
Learn more about the work of our research integrity team to safeguard the quality of each article we publish.
Find out more
ORIGINAL RESEARCH article
Front. Mar. Sci. , 21 December 2020
Sec. Coastal Ocean Processes
Volume 7 - 2020 | https://doi.org/10.3389/fmars.2020.596388
Tidal currents belong to the main driving forces shaping the bathymetry of marginal seas. A globally unique radial sand ridge field exists in the South Yellow Sea off the central Jiangsu coast, China. Its formation is related to the distinctive “radial tidal current” pattern at that location. A generally accepted hypothesis is that the “radial tidal current” is a consequence of the interference between the northern amphidromic tidal wave system and the southern incoming tidal wave. In this study, a schematized numerical tidal model was designed to investigate the tidal current system and the factors of influence in the South Yellow Sea. Concepts of the tidal current amphidromic point (CAP) and the tidal current inclination angle are utilized to analyze the inherent structure of the tidal current system. By conducting a series of numerical experiments, it is found that the Poincaré modes are necessary for the existence of “radial tidal current,” and the e-folding decay length should be smaller than the basin length. In the Yellow Sea, cross-basin phase differences due to lateral depth differences as well as open boundary conditions favor the emergence of the “radial tidal current.” Further analyses indicate that the CAP system (i.e., the co-inclination lines, the CAPs, and the tidal ellipticity) deepens the understanding on the dynamic structure of a tidal current system, and therefore, it deserves more attention in future studies.
Tidal current ridges were first introduced by Off (1963) to describe the significant features of series of rhythmic linear sand bodies on the tidal-dominated continental shelves, such as the North Sea and the east China marginal seas (i.e., the Yellow Sea and the East China Sea). Strong tidal currents are considered to play a main role in the development of these ridge patterns (Off, 1963; Liu et al., 1998; Dyer and Huntley, 1999; Zhou et al., 2016). The development of these tidal ridges requires tidal currents ranging between 0.5 and 2.5 m/s in an environment with sufficient sediment supply (Off, 1963). These tidal ridges are commonly observed in a parallel pattern, e.g., the North Sea (Dyer and Huntley, 1999). A unique example is observed in the South-Western region of the Yellow Sea (see Figure 3 in the following section). ~70 individual ridges of various sizes spread seaward in a radial pattern with the apex zone connected to the shore-face of the central Jiangsu coast (Ren et al., 1986; Liu et al., 1989; Dyer and Huntley, 1999; Wang, 2003). The flood/ebb currents flow landward/seaward in the same direction as the ridge orientation according to both field observations and numerical simulations (Wang, 2003). Such a tidal current pattern is commonly referred to as “radial tidal current” in previous studies (e.g., Zhu and Chang, 2001; Uehara et al., 2002).
The “radial tidal current” is considered to be independent from the local geomorphology, which has been demonstrated by Zhu and Chang (2001) through several numerical experiments (e.g., using a flat and a linear sloped topography replacing the “radial sand ridges,” respectively). Recently, Tao et al. (2019) has demonstrated that a series of radial-pattern ridges can be shaped by the “radial tidal current” starting from a linear topography by using morphodynamic modeling. Besides, simulation of the Paleo-tidal current field reveals that this special tidal current pattern existed since 7,000 years ago and therefore is expected to play a crucial role in the formation and development of the “radial sand ridges” (Uehara et al., 2002; Uehara and Saito, 2003; Zhu and Chen, 2005). Zhang et al. (1999) suggested that the tidal current is the major force controlling the dynamics of the “radial sand ridges” on morphological time scales, while the effect of waves (including large waves such as due to typhoons) is secondary. Even though it is possible that the sand ridges are deformed or destroyed by typhoons, the shape of the sand ridge system will gradually recover by tidal action after the storm event. Since the dynamics of the sand ridge system are closely linked to the tidal current, it is important to understand the tidal current dynamics in the adjacent seas first.
Zhang et al. (1999) proposed a generally accepted hypothesis regarding the emergence of the “radial tidal current”: the local tidal current is controlled by the interference of the amphidromic tidal wave system in the South Yellow Sea and the tidal wave from the East China Sea. Su et al. (2015) confirmed this hypothesis even in the case of the absence of the Shandong Peninsula and proposed that the pattern of the tidal current is determined by the local tidal wave system, whereas the intensity of the tidal current is controlled by the local bathymetry. Uehara et al. (2002) recommended that the “radial tidal current” pattern depends on the overall basin geometry. Previous exploratory work suggested that the aspects of the basin shape, topography, and open boundary conditions play major roles on the emergence of the “radial tidal current” (Yao et al., 2013a,b). Qian et al. (2014, 2015) examined the contribution of lateral water depth difference, which is a typical bathymetric feature of the South Yellow Sea, and proposed that the tidal wave refraction due to the lateral water depth difference is a controlling factor for the special tidal current pattern. Besides the southern Yellow Sea, Phan et al. (2019) discovered “radial tidal currents” along the southern Mekong estuarine coast and proposed that basin geometry as well as sloping topography were important for developing such tidal current pattern.
These existing studies have advanced our knowledge on tidal wave propagation as well as tidal current patterns in the South Yellow Sea using numerical modeling approaches. Different factors of influence, such as basin shape (geometry), underwater topography, etc., have been studied regarding the tidal wave propagation pattern, but how the tidal current system responds to these factors of influence has been less investigated. The tidal current ellipse field can visually illustrate the tidal current variations in space and time, which was commonly used in previous studies (e.g., Qian et al., 2014, 2015), but several quantitative metrics of a tidal current system, such as tidal current amphidromic point, convergent point, asymmetry pattern, etc., cannot be captured by visually distinguishing tidal ellipse field, introducing difficulties to investigate the response of the tidal current system to different factors of influence. Thus, multiperspective analyses on the tidal current system, such as tidal current ellipses, tidal current amphidromic points and tidal ellipse inclination angles, etc., should be considered to get a full view on the tidal current system. Furthermore, since the Holocene, tidal wave propagation pattern in the Yellow Sea has been changed due to sea level variations (Zhou et al., 2016). During 1128–1855, the Yellow River shifted to discharge into the southern Yellow Sea, supplying a huge amount of sediment to the Jiangsu coast. Correspondingly, the Jiangsu coast has been modified from sandy to muddy with a gentle slope. The shoreline has advanced seaward about 70 km on averaged in this period (Su et al., 2017). Thus, the basin geometry was changed during the past thousands of years. Therefore, knowledge on the tidal current system variations due to changes in basin geometry (i.e., position of shoreline, depth slope, etc.) can favor the morphological evolution in this region.
With respect to the tidal dynamics in a basin, both analytical models and numerical models are commonly applied. Analytical models solve the simplified tidal wave equations analytically based on several assumptions [viz., Taylor's problem (Taylor, 1922)]. Numerous extensions of Taylor's problem have been developed to deepen insight in shelf sea tidal dynamics (Kang, 1984; Brown, 1987; Carbajal, 1997; Jung et al., 2005; De Boer et al., 2011; Roos and Schuttelaars, 2011; Roos et al., 2011). Alternatively, numerical models have been employed in a schematized manner (e.g., schematization for either geometry or underwater bathymetry). These schematized numerical models were designed to investigate the physical processes in a basin instead of aiming at accurate tide simulations. They have been applied to study the tidal amphidromic system shift in a cross-basin direction (Ye and Chen, 1987), the tidal current system in the North Sea (Xia et al., 1995), and the morphology in the North Sea (Carbajal et al., 2005). With the help of these tidal models, the tidal dynamics and the relevant factors of influence over different geological timescales can be investigated in detail (Ward et al., 2020).
The aim of the present study is to unravel the inherent structure of the tidal current system in the South Yellow Sea. To this end, visualization of the CAP system is proposed combing co-tidal chart, co-tidal current chart, tidal ellipse field, as well as co-inclination chart to get a full view of a tidal structure in a tidal basin. Subsequently, different factors of influence, such as the geometry and the underwater topography, on the tidal current structure are explored using a schematized numerical tidal model. The contribution of the basin geometry, basin topography, and open boundary conditions on the tidal current system are analyzed and discussed. Finally, the occurrence of the “radial tidal current” is discussed in a generic manner.
The geometry of the Chinese Marginal Seas, i.e., the Bohai Sea, Yellow Sea, and East China Sea (hereafter referred to as BYECS) is complicated by the presence of several bays, peninsulas, estuaries, and other natural geophysical settings (Figure 1a). For clarity, the region is divided into four parts: the Bohai Sea, North Yellow Sea, South Yellow Sea, and East China Sea. In this study, the boundaries between each two adjacent seas are represented by several arbitrary lines, respectively, connecting the Shandong Peninsula, the Liaodong Peninsula, and the Korean Peninsula (green dotted lines in Figure 1a).
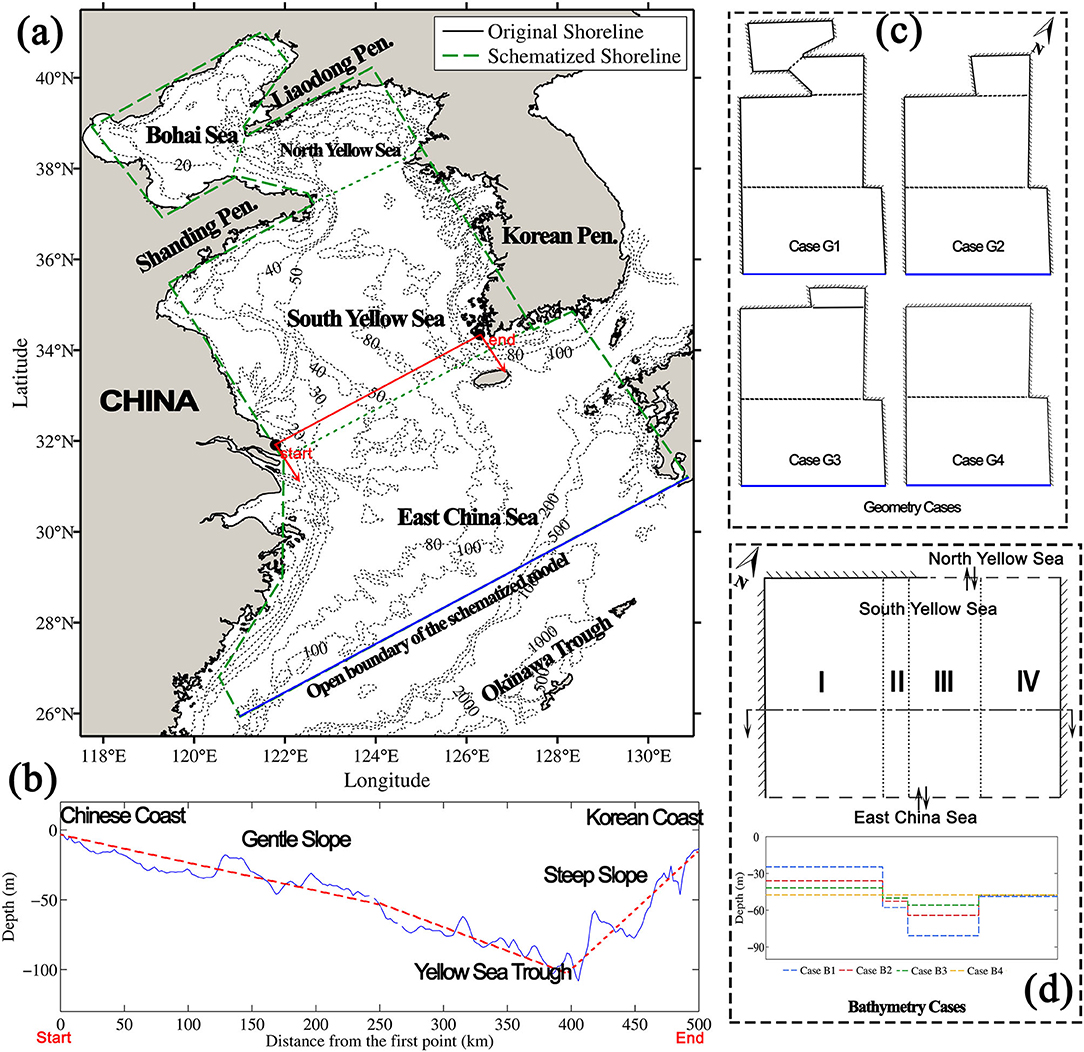
Figure 1. Geometry and bathymetry of the Bohai Sea, Yellow Sea, and East China Sea (BYECS) and schematized model configurations. (a) Overall geometry and bathymetry of the BYECS; the green dotted lines show the boundaries between the adjacent seas in this study; the green dashed lines show the schematized geometry of the BYECS used in the model; (b) water depth of a typical trans-section in the South Yellow Sea; (c) experimental configurations of the schematized model on the basin geometries; (d) experimental configurations of the schematized model on the bathymetries of the South Yellow Sea [shoreline schematizations are based on (a)].
The underwater topography of the BYECS shows significant variations as well. The water depth changes from ~2,000 m in the south (Okinawa Trough) to <50 m in the north, with a step-like characteristic in the longitudinal direction. In the South Yellow Sea, a north–south trough is situated in the center with a depth of 60–80 m (Figure 1a). Separating by the trough, the water depth is slowly decreasing with a gentle slope toward the Chinese coast, but more rapidly decreasing toward the Korean Peninsula (Figure 1b).
The Yellow Sea is dominated by a semi-diurnal tide, with the M2 tide being the predominant tidal constituent (Choi, 1980; Fang, 1986; Lee and Beardsley, 1999). The “radial sand ridges” are located on the inner-shelf of the South-Western Yellow Sea with a mean tidal range of 4–6 m (Ren et al., 1986) and can be thus classified as a macro-tidal area (Davies, 1964). The largest observed tidal range can be up to 9.28 m in the Huangshayang tidal channel (Wang et al., 2012). The average spring tidal current can be as strong as 2 m/s in the “radial sand ridges.”
Figure 2a shows the co-tidal elevation chart of the M2 tide. There are two amphidromic points in the Yellow Sea. One is located under the Liaodong Peninsula in the North Yellow Sea; another is located under the Shandong Peninsula in the South Yellow Sea. Off the central Jiangsu coast, several arc-shaped co-phase lines (e.g., 100, 120° co-phase lines) denote the interference between the anti-clockwise amphidromic system in the South Yellow Sea and the tidal wave from the East China Sea. The arc-shaped tidal wave is hypothesized to be the main reason for the occurrence of the “radial tidal current” in previous studies (e.g., Zhang et al., 1999).
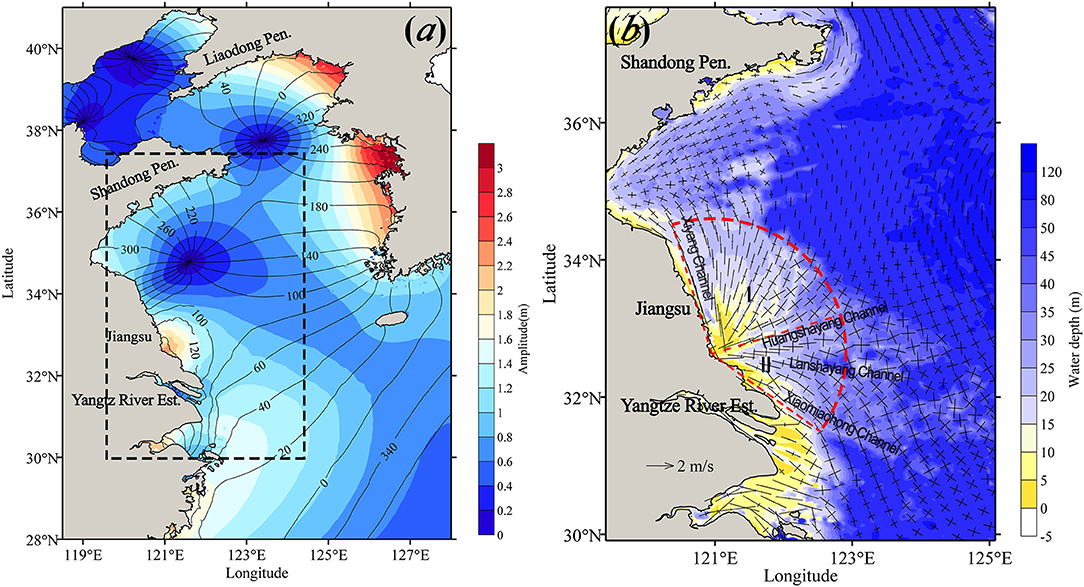
Figure 2. Co-tidal chart (a) and the tidal current ellipse field (b) of the BYECS (after Su et al., 2013). Note that the phases (in degree) of the co-tidal chart refers to the coordinated universal time (UTC).
The tidal current pattern in the “radial sand ridges” can be artificially divided into two categories by taking the Huangshayang Channel as boundary, shown in Figure 2b (denoted by the two Roman numbers). In the northern part (region I), the major axis of the tidal current ellipses spreads radially in a fan shape with an angle of ~90° and smaller ellipticities (the ratio of semi-minor axis over the semi-major axis). In the southern part (region II), the main direction of the tidal current ellipses is SE-NW with larger ellipticities.
In this study, the more generic features and physical mechanisms of the tidal current in the Yellow Sea are explored, using a schematized numerical model. The model is designed based on an open source modeling system Delft3D. Delft3D fully integrates the effects of the tide, waves, and sediment in coastal, river, and estuarine regions [more details on the Delft3D in Lesser et al. (2004), and the Delft3D user's manual Deltares, 2014]. The Delft3D-FLOW module solves the Navier–Stokes equations for an incompressible fluid under the shallow water and the Boussinesq assumptions. The present study uses the depth-averaged mode (i.e., two dimensional) of Delft3D-Flow focusing on tides only.
The study area covers the area of the Bohai Sea, the Yellow Sea, and part of the East China Sea (Figure 1a). The irregular shoreline and seafloor bathymetry are two main aspects influencing tidal elevation and tidal current pattern. A schematization of the model is made for both geometry and underwater topography to investigate to what extent these two features influence tidal current structure. For the geometry, we changed the original curved shorelines into a number of interconnected straight lines following the trend of the coast and keeping its main features (see green lines in Figure 1a). Through this simplification, the Bohai Sea and the Yellow Sea are reduced to a semi-closed rectangular basin with two peninsulas (i.e., Shandong Peninsula and Liaodong Peninsula) in the north. For the underwater topography, we reconstructed it based on the GEBCO bathymetry dataset (IOC et al., 2003) and using the volume conservation smoothing method. Then, a pronounced smooth seafloor is obtained instead of the original complex ridge and trough topography (see Supplementary Figure 1).
An orthogonal curvilinear grid is constructed under spherical coordinates with a grid size of ~3′ × 3′. Only one open boundary is chosen on the shelf edge of the East China Sea (marked as blue line in Figure 1a). The tidal wave from the Korea Strait is neglected in this model because the incoming tidal energy is relatively small compared to the tidal energy from the Pacific Ocean in the south (Zhao et al., 1994; Song et al., 2013). The preliminary model tests also suggest that including the open boundary of the Korea Strait has less influence on the overall tide regimes in the region. Along the open boundary, only the M2 tidal constituent, derived from a large Chinese sea model (Su et al., 2015), is used to prescribe time series water levels. The bottom friction is prescribed by a constant Manning coefficient (i.e., 0.02 s/m1/3) in most areas, except the deep region near the eastern part of the open boundary. In this region, where the depth varies from ~200 to ~1,000 m (Figure 1b), the corresponding Manning coefficient has a value of 0.04 s/m1/3 (based on previous modeling experience; Su et al., 2015). Sensitivity tests showed that a time step of 3 min is small enough for stability and accuracy of the simulations. The model starts with zero elevation initial conditions and a simulation period of 37 days, with the first 7 days considered as the spin-up period.
It should be emphasized that the purpose of the schematized model is not intended to simulate the tides in the BYECS in accurate local detail. We examine the more generic features of the tidal elevation and tidal current pattern, and the physical mechanisms behind the “radial tidal current” off the central Jiangsu coast.
Two sets of numerical experiments are designed to examine the role of the basin geometry and underwater topography on the tidal wave and tidal current pattern in the South Yellow Sea. The original model with initially schematized geometry and underwater topography is run first and taken as the reference case. An overview of the cases is listed in Table 1. Preliminary sensitivity cases have been conducted, and the results have shown that different configurations did not influence the tides prescribed at open boundaries.
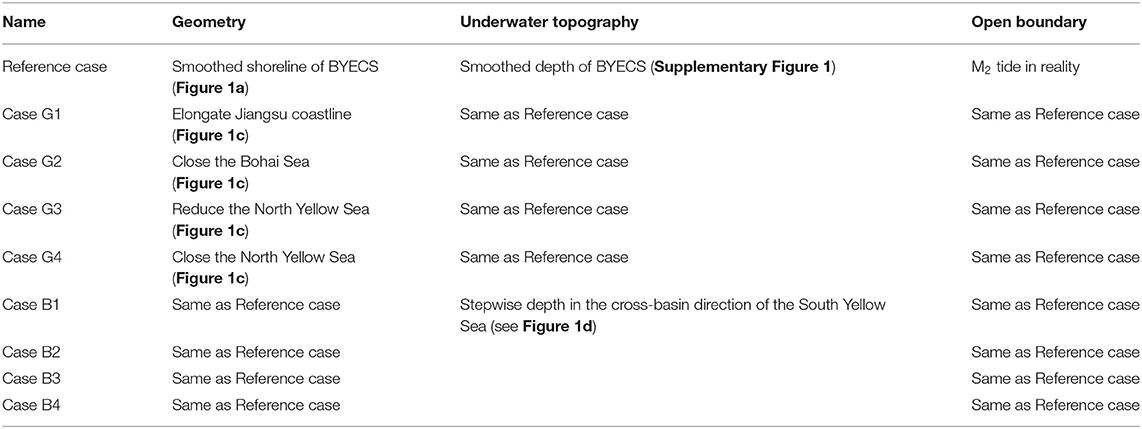
Table 1. Case description based on the schematized Bohai Sea, Yellow Sea, and East China Sea (BYECS) model.
The first set of experiments focuses on the positioning of shorelines (i.e., the geometry). The results of the Paleo-tide simulations (using different positions of the Jiangsu coastline, i.e., different cross-basin geometries) suggested that the overall basin geometry of the Yellow Sea is the main reason of the occurrence of the “radial tidal current” (Lin et al., 1999; Zhu and Chang, 2001; Uehara et al., 2002; Zhu and Chen, 2005). In this study, we explore the influence of the inclusion of different sub-basins on the tidal wave and tidal current. Four different basin geometries are designed, i.e., Case G1 to G4 (Figure 1c), to identify the shoreline changes. Case G1 uses similar shoreline schematizations as the reference run, except a straight shoreline starting from the Yangtze River Estuary toward the southern open boundary. Case G2 to G4 are based on the geometry of the Case G1 modifying the northern shorelines. Case G2 ignores the Bohai Sea, Case G3 reduces the area of the North Yellow Sea, and Case G4 closes the North Yellow Sea. The basin bathymetries of each case are set the same as the reference case.
The second set of numerical experiments considers the effect of the basin topography based on the reference case. Uehara et al. (2002) and Zhu and Chen (2005) found that the “radial tidal current” appeared using the linear sloped topography, whereas Ye (2012) found that the “radial tidal current” disappeared when assigning a uniform depth. These studies did not clarify why the “radial tidal current” emerge or not under certain topographic setting. To this end, a gradually changed stepwise topography is designed to combine features of both flat and sloped depth profile (Figure 1d). First, the South Yellow Sea is divided into four cross-basin regions. In each region, a flat bottom with uniform depth is applied. The average water depth of each region in Case B1 is kept the same with that of the initial depth. The depth difference in between each two adjacent regions is gradually reduced in Case B2–B4, while keeping the average water depth of the whole South Yellow Sea unchanged. In this set of experiments, the basin topography is only modified in the South Yellow Sea keeping the other seas in the model unchanged. In the conjunction area between the South Yellow Sea and the other seas, a smooth depth transition is used. The geometry and open boundary condition are the same as the reference case.
Different from a tidal elevation system, which can be described by a co-tidal chart (e.g., distribution of the tidal elevation amphidromic points, i.e., EAPs; see Appendix for definitions), a tidal current system can be identified by both a tidal ellipse field and a co-current tidal chart. The tidal current ellipse field is a commonly applied technique for the illustration of the tidal currents varying in space and time (e.g., see Figure 2b), whereas the co-current tidal chart, which provides information of the tidal current amphidromic points (CAPs; see Appendix for definitions) is less used. The CAPs and the tidal ellipse field are two major components to illustrate a tidal current system but in different aspects. Meanwhile, these two parameters are closely related to each other. For example, at CAPs, the tidal ellipse is a circle or, in some cases, shrinks to a point with a tidal current ellipticity (ratio of the semi-minor axis over the semi-major axis of the tidal current ellipse) toward either −1 or +1. Moreover, the positions of CAPs can also be provided by a series of co-inclination contour lines (see Figure 3c). The inclination is the angle between the major maxis of the tidal ellipse and the west–east direction. Since the tidal ellipse appears as a circle at CAPs, the major axis of the tidal ellipse can exist at all inclination angles. Therefore, all inclination angles are possible at CAPs, and the co-inclination lines connect there.
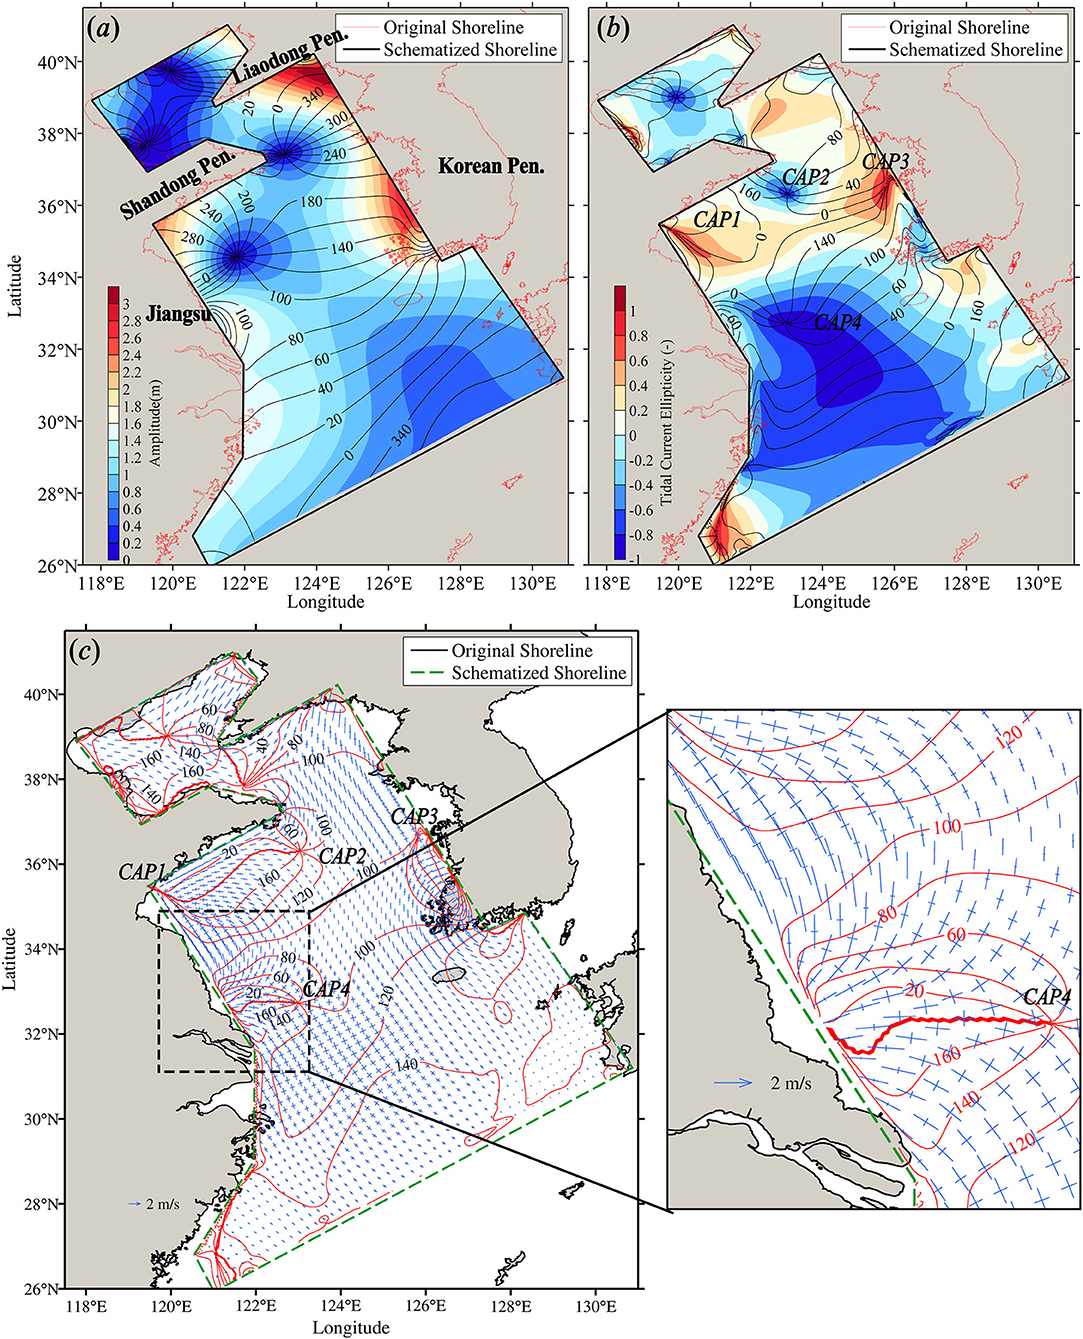
Figure 3. Simulation results of M2 tide in the schematized model. (a) Co-tidal elevation chart. Co-phase lines are in degree. (b) Co-tidal current chart. Co-current-phase lines are in degree. The background contour map denotes the tidal ellipticity. (c) Tidal ellipse field, with enlarged area in the radial sand ridges. The co-inclination contour lines are marked in red color. The inclination is with respect to the west–east direction and in the range of 0–180°. Note that there exists several sets of multiple (thick) lines, which is because of a numerical limitation (i.e., 0° and 180° are of the same angles).
In order to have a full view of a tidal current system, the relevant parameters (i.e., the CAPs and tidal ellipse) should be jointly illustrated and investigated. In this study, an online Fourier analysis is carried out in each grid point during model simulations to derive information of the M2 tide. Subsequently, we adopt the following approach for the illustration of a tidal current system. First, the co-current lines are plotted together with the tidal ellipticity, viz., co-current chart. Thus, the overall distribution of the flow rotation sense and the CAPs can be identified. Second, the co-inclination lines are drawn with the tidal ellipse field (viz., tidal ellipse chart), by which the overall tidal ellipse pattern as well as the CAPs can be recognized. According to the tidal ellipse field together with the co-inclination contour map, the “radial tidal current” pattern can be identified (examples are given in the Tidal Current System of the Reference Case section and the Idealized Model Setting section). Furthermore, it is worth noting that, for the region to qualify as a radial tidal current pattern, the ellipticity of the tidal ellipse should be small (rectilinear shape, see the region bounded by dashed red lines in Figure 2) because only a rectilinear-shaped ellipse can represent a convergent/divergent flow vector field in reality.
The initial, schematized model (reference case) results are illustrated by a co-tidal elevation chart, a co-tidal current chart, and a tidal ellipse chart of the M2 tidal constituent (Figure 3). For tidal elevation, the elevation amphidromic Points (EAPs) in the North Yellow Sea and the South Yellow Sea are reproduced in the schematized model. For tidal current, there are five current amphidromic points (CAPs) in the Yellow Sea, with one in the North Yellow Sea and the other four in the South Yellow Sea. For more background information on CAPs as well as the relation between CAPs and EAPs, see Xia et al. (1995) and Carbajal (1997). The results of the schematized model were comparable to the previous studies in terms of positions of EAP and CAPs in the South Yellow Sea (details refer to Supplementary Material). Thus, the overall patterns of the tidal wave and current are well simulated by this schematized model. Moreover, the agreements also indicate that the smoothness of the shoreline and underwater topography has less effect on the overall tidal dynamics.
The previous studies on the tidal current system in a semi-enclosed basin suggested that there are mainly three types of CAPs, viz., middle CAPs (formed in pair with different rotation sense), closed boundary CAP (formed individually), and open boundary CAP (formed individually) (Xia et al., 1995; Carbajal, 1997). The middle CAPs, which are located between adjacent EAPs, can be separated by a certain distance in a basin with complex geometries, bathymetries, etc., such as the South Yellow Sea. Therefore, the distribution of CAPs in the South Yellow Sea deviates from that in a rectangular semi-enclosed basin. Nevertheless, CAP1 and CAP2, which distribute in a cross-basin direction with opposite rotation sense (Figure 3b), can be assumed as a CAP pair (i.e., the middle CAPs). Note that the assumption would be verified in the following section (e.g., in the Influencing Factors on Tidal Current System and the “Radial Tidal Current” section). CAP3 appears in single, and it is probably formed due to local complex bathymetry. CAP4 appears as a single point off the Jiangsu coast, but according to its location, there should be another CAP (i.e., an accompanying CAP) to form a pair. Figure 3c depicts that all co-inclination lines seem to converge to the central Jiangsu coast. It implies that the accompanying CAP of CAP4 may exist but with its position shifted into the coast.
Figure 3c illustrates the overall pattern of the tidal current ellipse including the co-inclination contours. Regarding the CAP pair {CAP1, CAP2}, there is a 0/180° co-inclination line near the Shandong Peninsula (i.e., a set of multiple/thick lines in Figure 3c) connecting two CAPs. Along the line, the major axis of the tidal ellipse has no inclination following the west–east direction. The inclination angles increase southward away from the line, indicating that the tidal ellipse exhibits more or less a radial shape. However, positions of CAP1 and CAP2 are close to the land boundary (i.e., the Shandong Peninsula), where the flow direction can be influenced and restricted exhibiting radial pattern to some extent. Hence, the tidal current pattern cannot be identified to be the “radial tidal current.” Off the Jiangsu coast (i.e., the open coast with straight shoreline in the model), there is also a 0°/180° co-inclination line, starting from CAP4 toward the coast. Away from the line, the inclination angles increase/decrease from 0/180° in different sides, respectively. Moreover, the tidal ellipse depicts rectilinear shape (with small ellipticity). Hence, the tidal current field can be identified to have the radial pattern.
The results of the reference case show that a small-scale irregularity of the shoreline, e.g., on a scale of 10 km, has little effect on the overall tidal dynamics in the basin. However, to what extent the changes of the basin geometry influence the existence of the “radial tidal current” is unclear.
Figure 4 displays the tidal current amphidromic systems of four cases (i.e., Case G1–G4), under different configurations of the basin geometry. Herein, we mainly focus on CAP1, CAP2, and CAP4 in the South Yellow Sea. Compared with the reference case, both the number and the position of CAPs in the South Yellow Sea are approximately the same for Case G1 and Case G2. This indicates that elongating the Jiangsu shoreline to the open boundary and omitting the Bohai Sea hardly affect the tidal current system in the South Yellow Sea. For Case G3 and Case G4, in which the size of the North Yellow Sea is reduced, an additional CAP (CAP5 in Figures 4c,d) appears with the cyclonical rotation near the Jiangsu coast. In particular, the CAP4 and CAP5 appear to have the same rotation sense (cyclonically). Furthermore, the cyclonical rotation dominates the most part of the domain in Case G3 and Case G4.

Figure 4. Co-tidal current charts of four cases on basin geometry. Co-current-phase lines are in degree with the interval of 20°. (a) Case G1; (b) Case G2; (c) Case G3; (d) Case G4.
Figure 5 illustrates the tidal current ellipse fields including co-inclination lines of the four cases. For Case G1 and G2, the tidal current field off the central Jiangsu coast can be identified to have the radial shape (according to our definition). The tidal current ellipse in the Jiangsu coastal region shows a larger ellipticity in Case G3 and G4 (Figure 4), due to the appearance of CAP5. Although the co-inclination lines show that the major axis has a feature of radial shape more or less in these two cases (Figures 5c,d), the overall current pattern cannot be identified as the “radial tidal current” because of the large ellipticity. Therefore, the overall basin scale has a significant influence on the tidal current system through altering both the distribution pattern of CAPs and the occurrence of the “radial tidal current” in the South Yellow Sea.
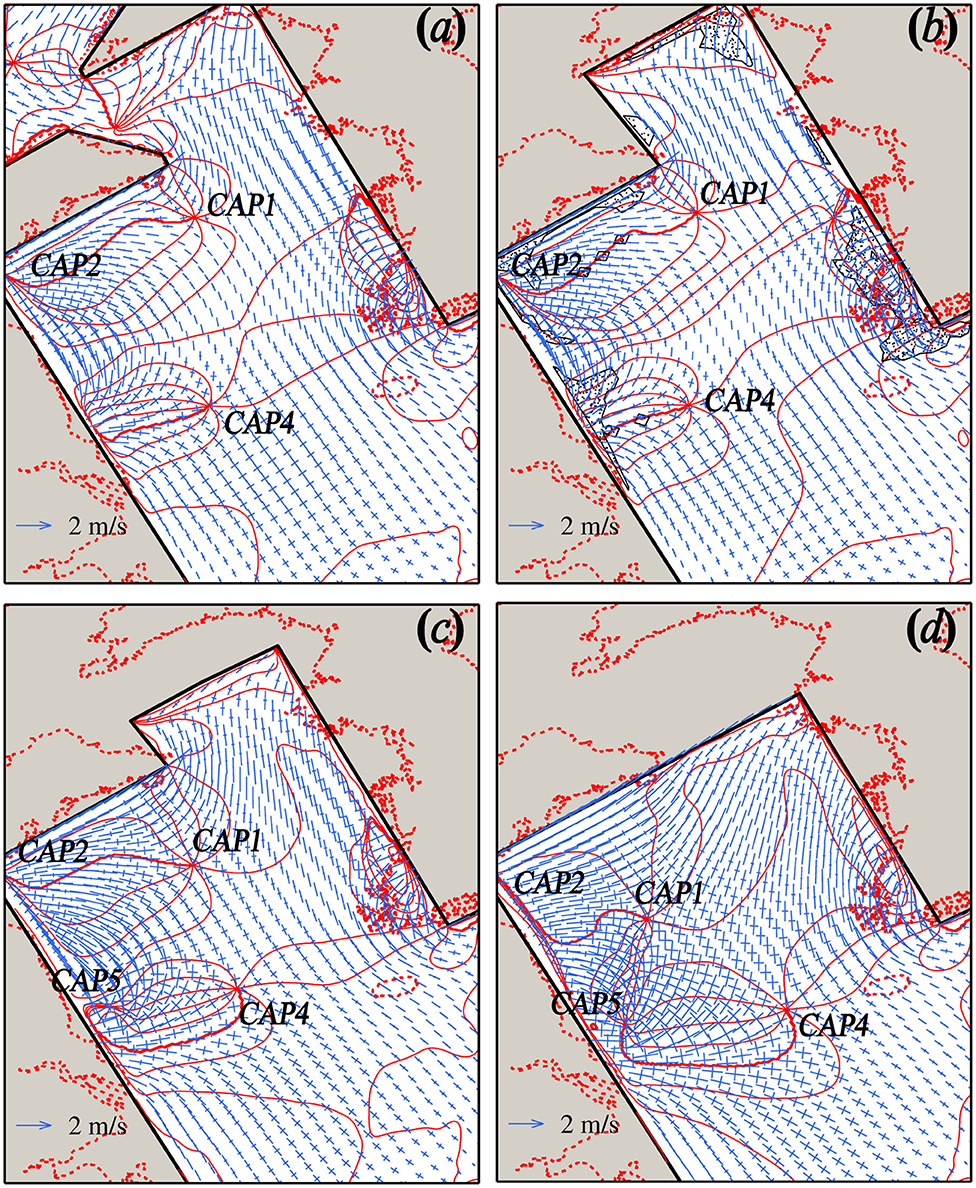
Figure 5. Tidal ellipse fields of four cases on basin geometry. (a) Case G1; (b) Case G2; (c) Case G3; (d) Case G4. The co-inclination contour lines are marked in red color. The inclination is with respect to the west–east direction and in the range of 0–180°.
Figure 6 shows the tidal current amphidromic systems of the four cases for different configurations of the underwater topography. Similar to the previous section, we focus on analyzing the current amphidromic system in the Yellow Sea by CAP1, CAP2, and CAP4. For Case B1, there are several small and deformed CAPs near CAP4. The appearances of these points are due to the abrupt changes in the depth between the cross-basin subregions in Case B1. The other three cases (i.e., Case B2 to B4) produce three CAPs with almost the same positions in the South Yellow Sea. Compared to the reference case (i.e., Figure 3), CAP1 and CAP2 have a little changed position in these three cases (i.e., Cases B2, B3, and B4), whereas the position of CAP4 shifts away from the northern land boundary and locates in the conjunction area between the South Yellow Sea and the East China Sea. The rotation sense of the CAPs in all cases remains the same with the reference case. Besides, CAP3 of the reference case (see Figure 3b) has disappeared when the uniform depth was assigned in region IV (see Figure 1d). This verifies our previous explanation on the appearance of CAP3, i.e., CAP3 is generated due to the local complex bathymetric effect.

Figure 6. Co-tidal current charts of four cases on underwater topography. Co-current-phase lines are in degrees with the interval of 20°. (a) Case B1; (b) Case B2; (c) Case B3; (d) Case B4. The white square inside each figure denotes the position of CAP4 in the reference run.
Figure 7 shows the tidal current ellipse field in the basin. Different from the reference case (Figure 3c), the “radial tidal current” occurs in the conjunction area between the South Yellow Sea and the East China Sea. Thus, in these cases, the position of the “radial tidal current” shifts southward. Especially, in Case B4, the main part of the “radial tidal current” appears at an area out of the Yellow Sea, where the underwater topography is not flat. The phenomena are consistent with the displacement of CAP4 in the South Yellow Sea (Figure 7). Additional experiments (not shown here) indicated that setting a relatively small water depth for the South Yellow Sea (e.g., 30 m) can shift both CAP4 and the “radial tidal current” back to the South Yellow Sea because of the decrease in the tidal wavelength. Therefore, the position of the “radial tidal current” (i.e., either in the conjunction area or the South Yellow Sea) is of minor importance. However, it is important to understand why the “radial tidal current” emerges even under flat bottom condition in the South Yellow Sea because the tidal current pattern simulated in an idealized semi-enclosed rectangular basin with uniform depth does not show the relevant radial shape (e.g., Uehara et al., 2002; Ye, 2012).
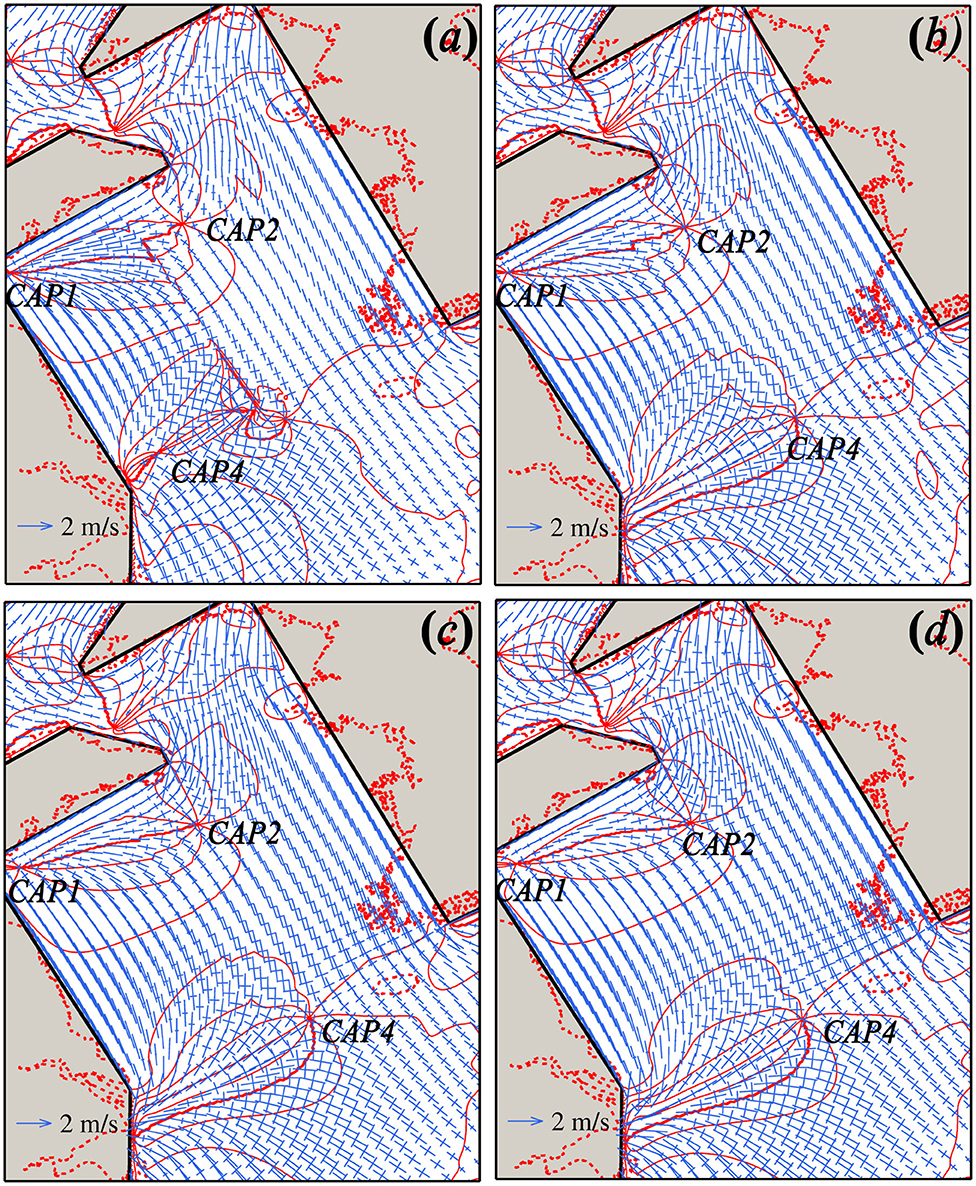
Figure 7. Tidal ellipse fields of four cases on underwater topography. (a) Case B1; (b) Case B2; (c) Case B3; (d) Case B4. The co-inclination contour lines are marked in red color. The inclination is with respect to the west—east direction and in the range of 0–180°.
In fact, according to the present experimental settings of the underwater topography, only the depth in the South Yellow Sea was changed. This schematization is, therefore, different from those of Uehara et al. (2002) and Ye (2012), who used a uniform depth in the entire basin. Meanwhile, the open boundary conditions in Case B-series are non-uniform, which is also different from the study of Uehara et al. (2002) and Ye (2012). It is known that tidal waves propagate faster in deeper water, implying a larger wavelength, and vice versa in shallower water. Thus, for the Kelvin waves that propagate in along-basin directions, the lateral water depth variation causes the wavelength difference in the west and east coast of the domain (i.e., the cross-basin direction). Subsequently, the cross-basin phase difference would be caused during along-basin propagation of the Kelvin wave. This implies that the lateral phase differences (induced by both the lateral depth difference in the East China Sea and the non-uniform open boundary conditions) not only cause the differences between models but also contribute to the existence of the “radial tidal current.” In order to verify this hypothesis regarding the lateral phase differences, we carry out further numerical experiments in a generic manner. The numerical experiments and the corresponding results are listed and discussed in the following section (i.e., the Further Explorations on the Influence of the Lateral Phase Difference section).
The above-mentioned numerical results have shown that the overall basin geometry and cross-basin phase difference are two aspects influencing the tidal current system and probably the occurrence of the “radial tidal current.” To get a better understanding of the influence of the cross-basin phase difference of the tidal wave, we carried out further experiments in a generic manner. Herein, the lateral direction is the cross-basin direction; the longitudinal direction is the along-basin direction.
First, an idealized model is set up using a semi-enclosed rectangular domain in the f-plane (i.e., constant Coriolis parameter in the domain, and the latitude is set to 32°N) with one open boundary in the south. The dimension of the basin is 500 km (width) × 1,200 km (length) using 5 km × 5 km rectangular grid cells. The first simulation (i.e., standard run) uses the flat bottom with a uniform water depth of 48.2 m (mean water depth of the South Yellow Sea). The model is forced by the M2 tide at the southern boundary with a uniform amplitude (1.5 m) and a uniform phase (0°) along the boundary. In this domain, the Kelvin wavelength is calculated to be 970 km, the critical basin width for free Poincaré wave is 580 km, and the e-folding decay length of the lowest bound Poincaré mode is 510 km.
Figure 8 displays the tidal elevation amphidromic system, the tidal current amphidromic system, and the tidal ellipse field of the standard run. We numbered the tidal elevation and current amphidromic points for further comparison. There are two tidal elevation amphidromic points (i.e., EAP 1 and EAP 2) and five tidal current amphidromic points (i.e., two middle CAP pairs: {CAP1, CAP2} and {CAP3, CAP4}, and basin head CAP in the upper corner) in the basin (Figures 8a,b). Specifically, the CAP pairs locate between two adjacent EAPs (or between the EAP and the open boundary). The positions of the CAPs are consistent with the analytical study of Xia et al. (1995) on the tidal current amphidromic system. Xia et al. (1995) showed that the two points of a CAP pair appear close to each other in a semi-enclosed rectangular basin without consideration of friction. Since the friction term was included in the present study, different degrees of separation of the CAP pairs were observed (Figure 8b). The separation of the CAP pair {CAP1, CAP2} is more pronounced than that of the pair {CAP3, CAP4}. This indicates that the friction effects were more evident in the basin closed end than the basin opening on tidal wave propagation. Note that there is no “radial tidal current” emerging in the domain (Figure 8c).
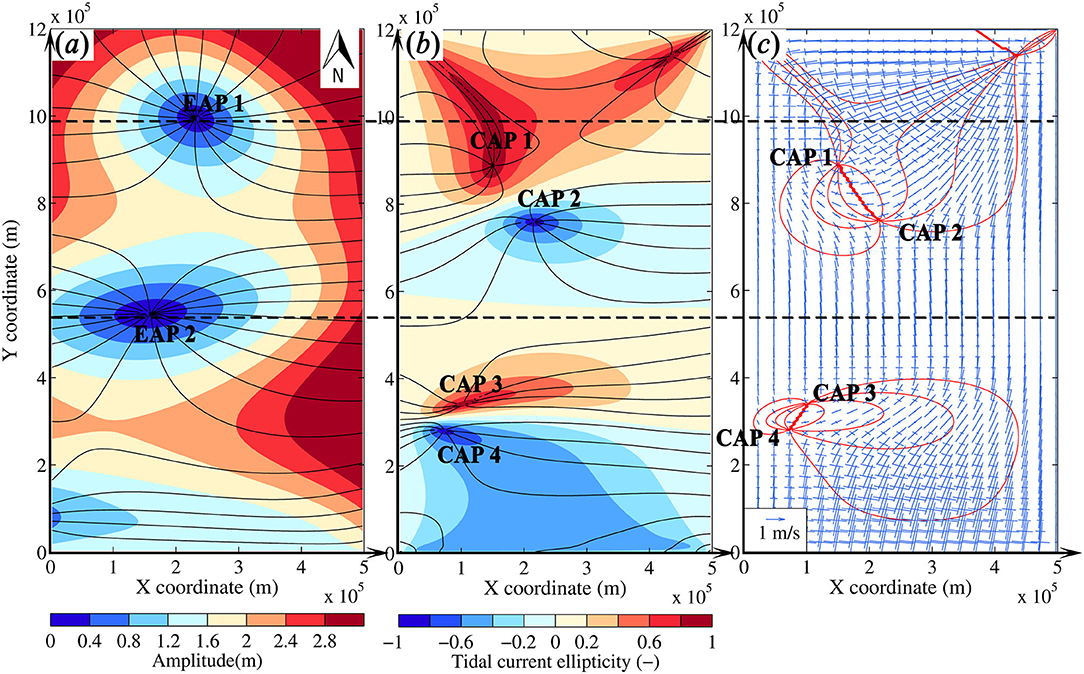
Figure 8. Simulation results of the idealized model (standard run). (a) Co-tidal elevation chart. Cophase lines are in degrees with the interval of 20°. (b) Co-tidal current chart. Co-current-phase lines are in degrees with the interval of 20°. (c) Tidal ellipse field. The co-inclination lines are marked in red color. The inclination is with respect to the west–east direction and in the range of 0–180°.
Next, two additional experimental groups are designed, namely, a “pre-allocating lateral phase difference” (group A) and a “self-generating lateral phase difference” (group B) (see Table 2 for an overview). For group A, we change the phase difference along the open boundary keeping the flat bottom of the basin unchanged. The phase at the end point of the open boundary (i.e., x = 500 km, y = 0 km) is set to a constant value of 0, while we adjust the value at the start point (i.e., x = 0 km, y = 0 km). The phases at the intermediate point between the start point and the end point of the open boundary are linearly interpolated (Figure 9a). For group B, we apply a linear slope representing the cross-basin depth (general bathymetric feature of the South Yellow Sea, see Figure 1) keeping other parameters unchanged. We adjust the sea bottom slope keeping the mean water depth of the basin unchanged (i.e., 48.2 m) in different simulations (Figure 9b).
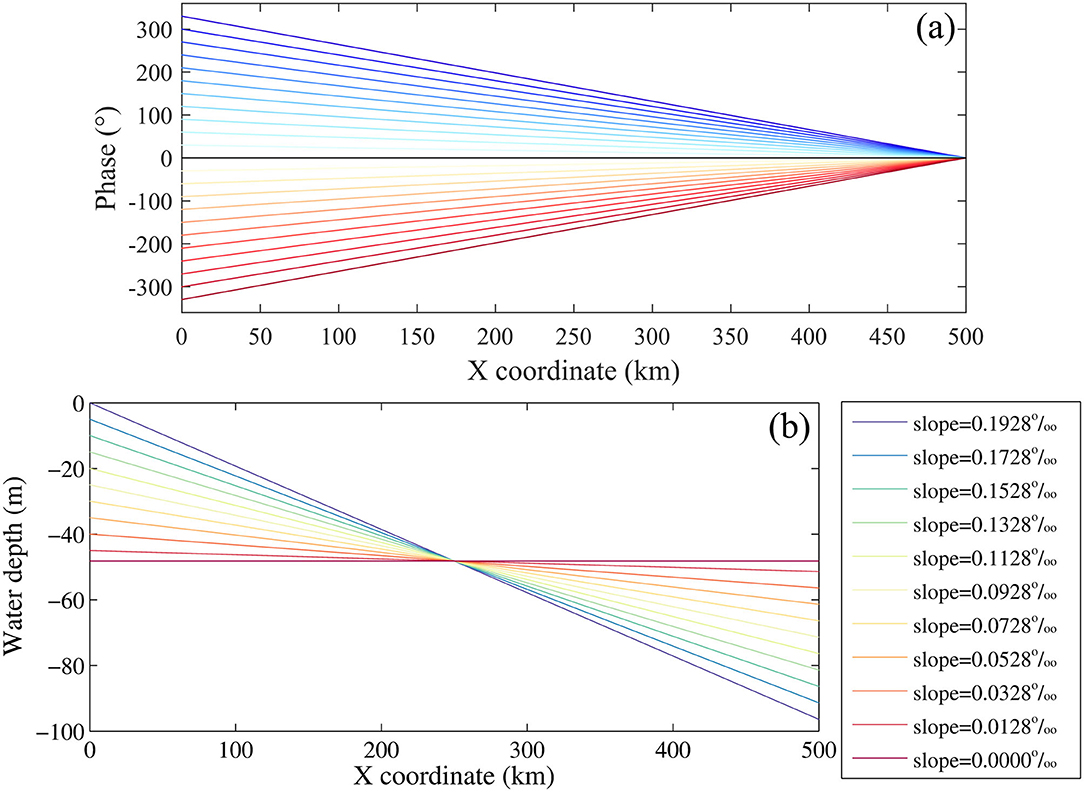
Figure 9. Configurations of experimental group A (a) cross-basin phase differences along open boundary and (b) experimental group B cross-basin seafloor slopes.
The pre-allocating lateral phase difference in each simulation varies from −330 to 330° with an interval of 30°. Figure 10 illustrates the position changes of the EAPs and the CAPs. It shows that the positions of the two EAPs (i.e., EAP1 and EAP2) and the first CAP pair {CAP1, CAP2} shift little under different phase differences along the open boundary (Figures 10a,b). However, the position changes of the second CAP pair {CAP3, CAP4} are more pronounced (Figure 10c). CAP3 shifts laterally from the eastern boundary to the western boundary, when the phase difference varies from −330 to 330°. The lateral trajectory of CAP4 can be divided into two categories. For the negative phase difference, CAP4 shifts laterally from the western boundary to the eastern boundary, whereas it shifts back to the western boundary for the positive phase difference. The longitudinal positions of CAP3 and CAP4 are less changed. Therefore, the functionality of the pre-allocating lateral phase difference seems to separate the CAP pair near the open boundary, and the larger the phase differences, the larger the distance of separation.
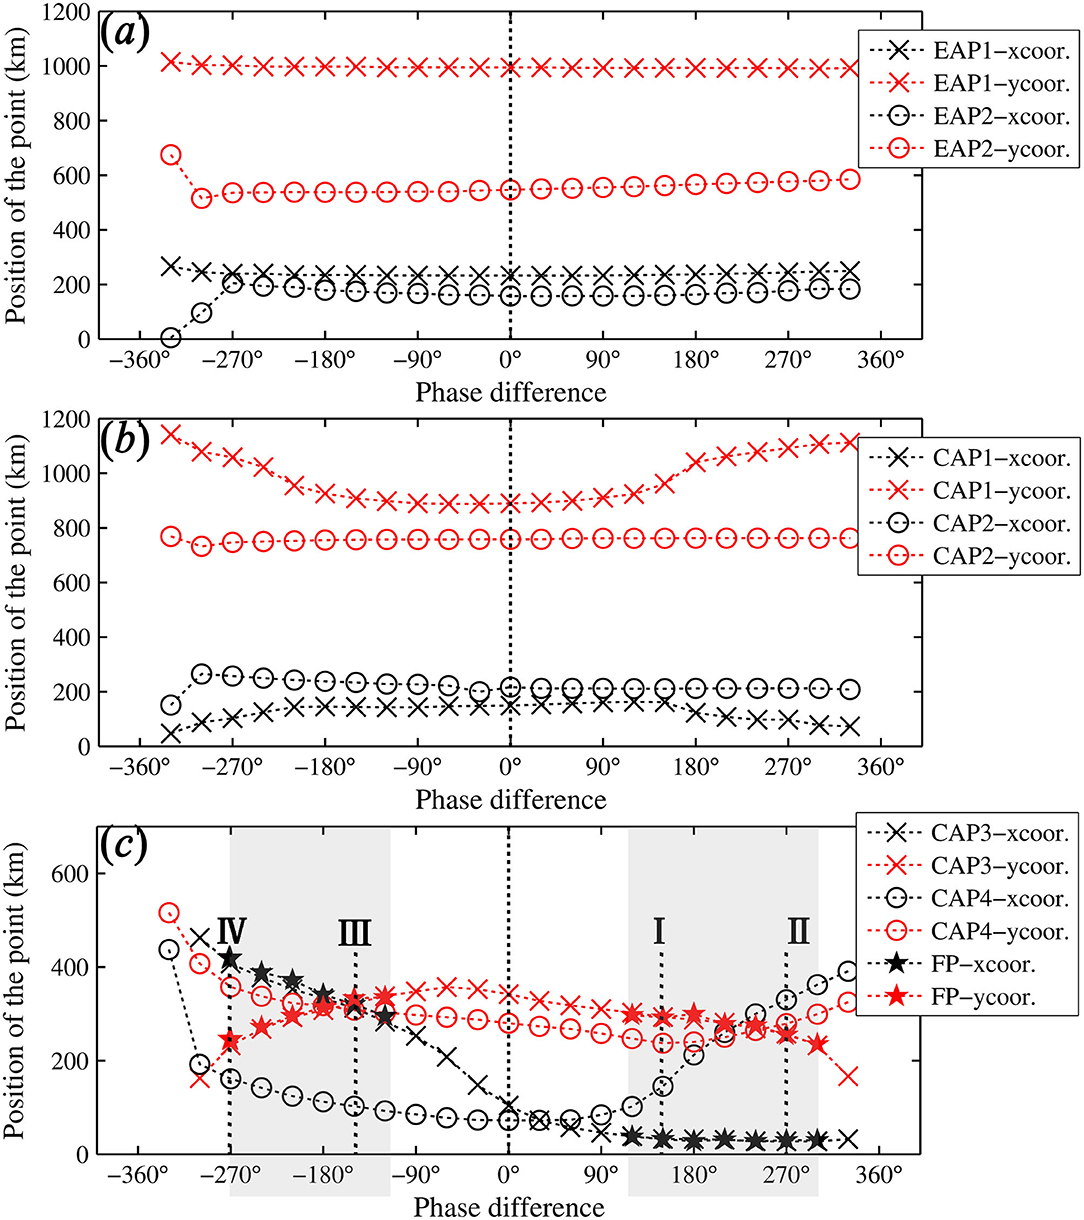
Figure 10. X- and Y-positions of elevation amphidromic points (EAPs, a) and current amphidromic points (CAPs b, c) on different phase differences along the open boundary. The shadowed area denotes the occurrence of the “radial tidal current.” The definition method of the “radial tidal current” refers to the Illustration of a Tidal Current System section and the Tidal Current System of the Reference Case section. The Roman numbers in (c) denote the examples in Figure 11.
The “radial tidal current” appears when the lateral phase difference along the open boundary is in the ranges of 120–300° and −270 to −120° (Figure 10c), corresponding to a certain separation distance between the CAP pair near the open boundary (i.e., CAP3 and CAP4). Under different conditions, the positions of the EAPs hardly change and appear less sensitive to the open boundary conditions. However, the occurrence of the “radial tidal current” is inconsistent with the EAPs because the “radial tidal current” only emerges in certain conditions. Therefore, the previous studies, which only focused on finding the relevant relationship between the tidal elevation system and the formation of the “radial tidal current,” is insufficient to explain the phenomena.
Figure 11 illustrates the tidal ellipse field of four simulations. Comparing all the simulation results, the “radial tidal current” emerges inside the vicinity area between the CAP pair near the open boundary (e.g., see CAP3 and CAP4 in Figure 11) and the position of its focal point seems to be CAP3 (ellipticity maxima with counterclockwise rotation direction). Figure 11(II), show that the 0/180° co-inclination lines linking CAP3 and CAP4 are parallel to the cross-basin direction (the Y-coordinates of CAPs are close but the X-coordinates are distant; see Figure 10c). Away from the line on both sides (i.e., upper and lower), the inclination increases/decreases forming a quasi-symmetric pattern. Correspondingly, due to the pattern of the inclination, the major axis of the tidal ellipse depicts a radial pattern. CAP3 locates near the west coast (left side) when the phase difference along the open boundary is positive, while it locates near the east coast (right side) under negative phase difference. If the 0/180° co-inclination lines do not perfectly parallel to the cross-basin direction but with a small angle [e.g., Figure 11(I)], the inclination pattern becomes asymmetric, causing the “radial tidal current” to be profound only on one side. Furthermore, if the 0/180° co-inclination lines have a large angle with respect to the cross-basin direction, no “radial tidal current” pattern can be found (see the thick lines between CAP1 and CAP2 in Figure 11).
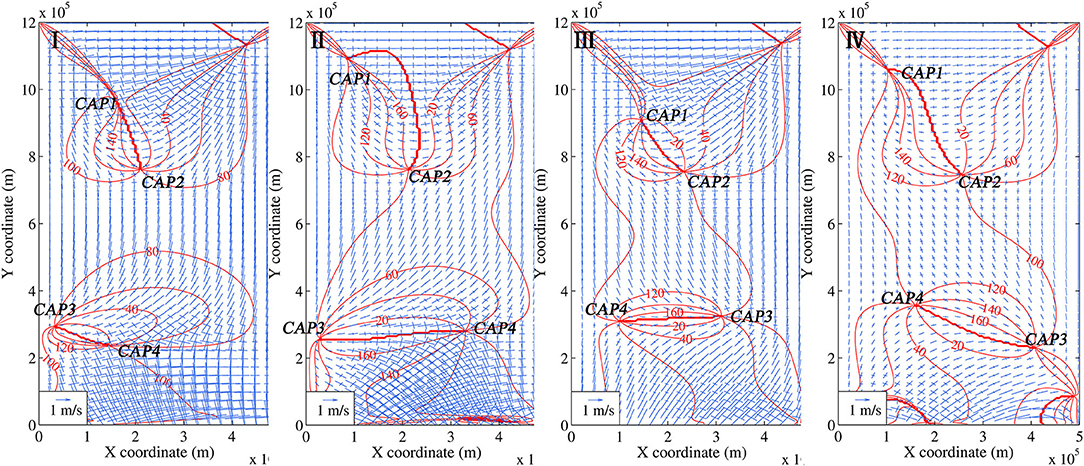
Figure 11. Tidal ellipse fields of four simulations. Different Roman numbers denote different simulations (see that in Figure 13c as well): I φ = 150°; II φ = 270°; III φ = −150°; IV φ = −270°. φ is the phase differences along the open boundary. The co-inclination lines are marked in red color. The inclination is with respect to the west–east direction and in the range of 0–180°.
Figure 12 displays the position changes of EAPs and CAPs of radial tidal current relating to the different lateral depth differences. For the tidal elevation, there are two EAPs in the basin under most conditions (i.e., the bottom slope <0.133‰). The position of EAP1 changes little under different lateral bottom slopes, while EAP2 shifts laterally to the western boundary, then disappears when the bottom slope is larger than 0.133‰ (Figure 12a).
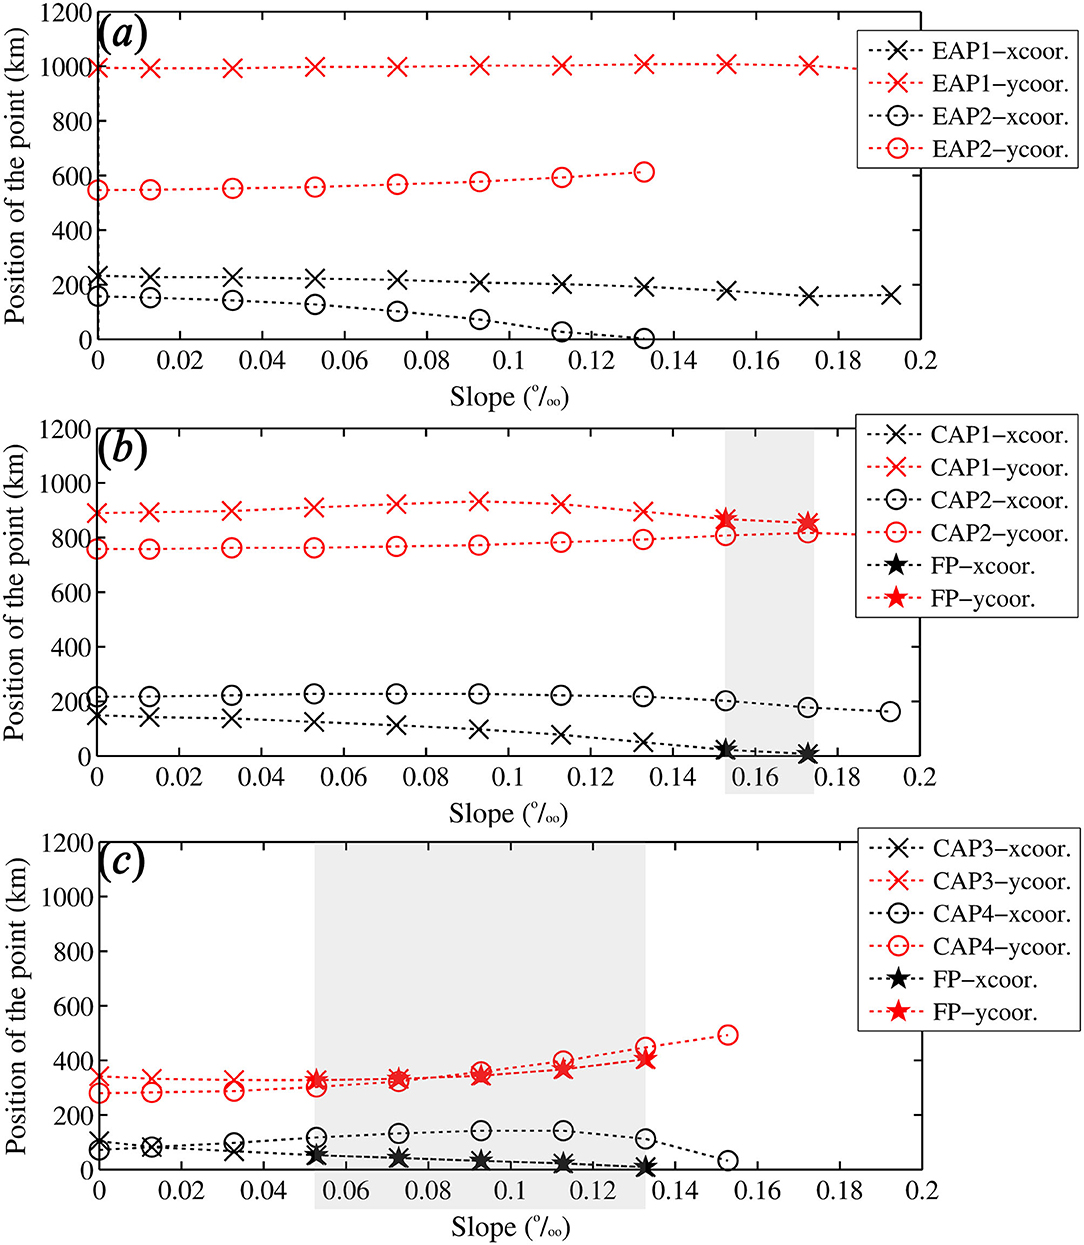
Figure 12. X- and Y-positions of EAPs (a) and CAPs (b, c) under different cross-basin bottom slopes. The shadowed area denotes the occurrence of the “radial tidal current.” The shadowed area denotes the occurrence of the “radial tidal current.” The definition method of the “radial tidal current” refers to the Illustration of a Tidal Current System section and the Tidal Current System of the Reference Case section.
The “radial tidal current” appears in the position of the second CAP pair {CAP3, CAP4} under smaller slopes, whereas it shifts to the position of the first CAP pair {CAP1, CAP2} for the larger slope (Figures 12b,c). The “radial tidal current” appears when the longitudinal distance between the two points of the CAP pair is small (i.e., smaller than 60 km), and the lateral distance is distant (i.e., larger than 90 km). It indicates that when the “radial tidal current” emerges, the two CAPs of a CAP pair distribute laterally. This finding is consistent with the simulations in the Pre-Allocating Lateral Phase Difference Along the Open Boundary section. However, it is found that the lateral depth difference can affect the CAP distributions in the entire domain, whereas the changes in the open boundary conditions influence the CAP distribution only in the vicinity area of the open boundary (as the influences in the interior area are not profound).
Numerical simulations of this study (e.g., Figures 10, 11 in the Further Explorations on the Influence of the Lateral Phase Difference section) show that the CAP distribution pattern and the co-inclination lines are highly dynamic when various basin configurations are assigned, while the changes of the tidal ellipse field and the tidal elevation system are less recognizable. Thus, the changes of the CAPs under different configurations can be more easily and quantitatively investigated than the tidal ellipse field. It is possible to address the tidal current system through a tidal ellipse field; however, the CAP system can provide information on the tidal current system. To this end, we suggest to elaborate a tidal current system by a CAP system (including the co-inclination lines, the CAPs, and the tidal ellipticity), in combination with EAPs and tidal ellipse field.
Different basin shapes, underwater topography (depth), and open boundary conditions are various aspects of influence on both the tidal elevation amphidromic system and the tidal current amphidromic system. The simulations in the Further Explorations on the Influence of the Lateral Phase Difference section (e.g., Figures 10, 12) reveal that the influences on the tidal current amphidromic system are more pronounced. Since both the tidal wave and tidal current structure in a basin are the results of the combination of the Kelvin wave and a set of Poincare modes, different factors of influence on tidal current system are discussed based on numerical results.
The critical basin width (Bcr), for the emergence of the free Poincare modes, is defined as (Marchuk and Kagan, 1989):
in which, g is the gravitational acceleration, H is the water depth, f = 2Ω sin θ is the Coriolis parameter with Ω ≈ 7.292 × 10⁻⁵ rad/s as the angular speed of rotation of the earth, θ is the latitude, and σ ≈ 1.405 × 10⁻⁴ rad/s is the angular frequency of the tidal component for M2 tide. In this case, Bcr is ~610 km, which is larger than the basin width (B) of the Yellow Sea (ca. 550 km). Hence, the purely free Poincare modes do not exist, and they (exponentially) decay from the closed boundary. The e-folding decay length scale can be calculated by:
In the Yellow Sea, the e-folding decay length of the first Poincaré mode is 530 km. The Kelvin wave length (λ) is 970 km. The effect of basin shape was studied by varying basin length (L, reducing from ~670 km in cases G1 and G2 to ~400 km in G4) while keeping basin width (~550 km) unchanged in the Influence of Basin Shape section. When the basin length is smaller than the decay length-scale of the first Poincaré mode (i.e., Cases G3 and G4), Poincaré wave would play a dominant role. Consequently, the tidal current system exhibits a substantial rotating feature, corresponding to clockwise rotation sense of tidal ellipses (i.e., negative ellipticity) dominating a major part of the domain (as shown in Figure 4). Under this condition, even though there are lateral depth difference and lateral phase difference in the open boundary, no “radial tidal current” is shown. When the basin length is larger than Ln (i.e., Cases G1 and G2), the Poincare wave is only effective in part of the domain. The “radial tidal current” emerged at the shallow side of the domain. Therefore, it can be inferred that one condition for the “radial tidal current” is the existence of the Poincare wave but with limited area of effect.
Regarding the cross-basin phase difference of the tidal wave, we have examined the effects of the lateral depth difference and the open boundary conditions in a semi-enclosed rectangular basin. The mean water depth of the basin and the overall basin scale refers to that of the Yellow Sea. Under a uniform open boundary conditions, the “radial tidal current” can emerge when the lateral bottom slope is larger than 0.01‰. The region with the “radial tidal current” can shift from the vicinity of the basin opening to the basin closed end with increases in the slope (Figure 12c). Thus, the lateral depth difference, which can generate the cross-basin phase difference during propagation of tidal wave, influences both the emergence and the position of the “radial tidal current.” On the other hand, in a basin with flat bottom, the pre-allocating phase difference along the open boundary can also result in an emergence of the “radial tidal current.” Our simulation results indicate that a “radial tidal current” emerges in the vicinity of the basin opening when the pre-allocating lateral phase difference along the open boundary in the ranges of 120–300°.
Since the abovementioned numerical experiments and discussions are made with respect to the mean water depth and overall basin aspect ratio of the Yellow Sea, more systematically analytical studies are needed in the future to verify this and gain more quantitative understandings of the influence of the basin geometric and bathymetric features on the tidal current system.
The Jiangsu coast experienced the large Holocene transgression (in ~6,000 years BP). The shoreline of Jiangsu was retreated as a result of the marine inundation due to sea-level rise (Uehara et al., 2002; Zhu and Chen, 2005). To examine the evolution of the “radial tidal current” since 6,000 years BP, we carried out one more experiment by changing the Jiangsu shoreline landward. The shoreline and bathymetry of the widened area (i.e., Jiangsu coast) are re-constructed based on that of Uehara et al. (2002) and Zhu and Chen (2005). The mean sea level at 6,000 years BP is assumed to be the same as the present as suggested by Uehara et al. (2002). The open boundary conditions are kept the same with the reference case (i.e., Figure 1a).
Figure 13 shows the results of the tidal current amphidromic system in 6,000 years BP. It is clear that a CAP (i.e., CAP5 in Figure 13a) emerges near the coast. The previous assumption on the existence of the accompanying CAP of CAP4 is verified. In this case, the distribution pattern of CAP4 and CAP5 follows the cross-basin direction approximately, together with the quasi-symmetric inclination in both sides. Meanwhile, the “radial tidal current” shows quasi-symmetric pattern in both sides of the 0/180° co-inclination line. Therefore, at 6,000 years BP, the “radial tidal current” was fully developed at both northern and southern parts. Since 6,000 years BP, the seaward progradation of the Jiangsu coastline gradually modifies the basin width, causing corresponding changes of the tidal current system. Thus, the initial symmetric “radial tidal current” (or the cross-basin CAP distribution pattern) is gradually changed to be asymmetric.
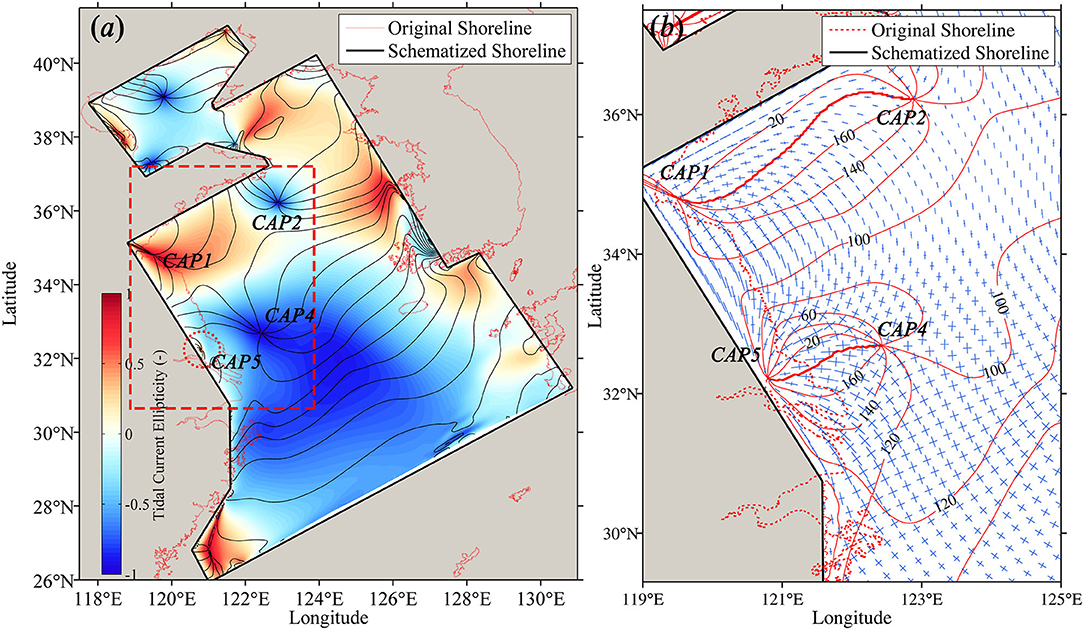
Figure 13. Tidal current system at 6,000 years BP. (a) Co-tidal current chart. Co-current-phase lines are in degree. The background contour map denotes the tidal ellipticity. (b) Tidal ellipse field (enlarged in the South Yellow Sea). The co-inclination contour lines are marked in red color. The inclination is with respect to the west–east direction and in the range of 0–180°.
To investigate the tidal current system and the related genesis of the “radial tidal current” pattern in the South Yellow Sea, a schematized numerical tidal model has been developed. A series of numerical experiments were designed to examine the contributions of basin geometry, underwater topography, and open boundary conditions on the tidal current system in the South Yellow Sea. The following conclusions can be drawn:
(1) The tidal current system can be represented well by the CAP system composed of CAPs, the co-inclination lines, and the tidal ellipticity;
(2) Poincare modes are necessary for the existence of the “radial tidal current,” but the e-folding decay length should be smaller than the basin length;
(3) In a basin of similar scale as the Yellow Sea, a “radial tidal current” can emerge on the shallower side when the lateral bottom slope is larger than 0.01‰. The “radial tidal current” can also emerge on a flat bottom if a lateral phase difference exists along the open boundaries;
(4) While the “Paleo-radial tidal current” showed a symmetric pattern 6,000 years BP, it became asymmetric due to the seaward progradation of the Jiangsu coastline since.
The raw data supporting the conclusions of this article will be made available by the authors, without undue reservation.
QZ, MS, and PY conceptualized, designed, and conducted the modeling study. QZ and PY performed data analysis. QZ and MS prepared figures and wrote the manuscript. QZ, MS, PY, YC, MJFS, and ZW contributed to the revision of the manuscript. All authors reviewed and agreed to the final manuscript.
This work was funded by the National Natural Science Foundation of China (Grant Nos. 51520105014), the Research Funds for the Central Universities (Grant Nos. 2019B04514 and 2019B05914), and the National Natural Science Foundation of China (Grant Nos. 51709288, and 51909073).
The authors declare that the research was conducted in the absence of any commercial or financial relationships that could be construed as a potential conflict of interest.
We thank Drs. Mariette van Tilburg for grammar checking on the manuscript. The content of this manuscript has been published as part of the Ph.D. Thesis of Yao (2016).
The Supplementary Material for this article can be found online at: https://www.frontiersin.org/articles/10.3389/fmars.2020.596388/full#supplementary-material
Brown, T. (1987). Kelvin wave reflection at an oscillating boundary with applications to the North Sea. Cont. Shelf Res. 7, 351–365. doi: 10.1016/0278-4343(87)90105-1
Carbajal, N. (1997). Two applications of Taylor's problem solution for finite rectangular semi-enclosed basins. Cont. Shelf Res. 17, 803–817. doi: 10.1016/S0278-4343(96)00058-1
Carbajal, N., Piney, S., and Rivera, J. G. (2005). A numerical study on the influence of geometry on the formation of sandbanks. Ocean Dynam. 55, 559–568. doi: 10.1007/s10236-005-0034-1
Choi, B. H. (1980). A Tidal Model of the Yellow Sea and the Eastern China Sea. Seoul: Korea Ocean Research and Development Institute.
Davies, J. L. (1964). A morphogenic approach to world shorelines. Z. Geomorphologie Coast. Processes Coastal Manag. 8, 127–142. doi: 10.1127/zfg/mortensen/8/1964/127
De Boer, W. P., Roos, P. C., Hulscher, S. J. M. H., and Stolk, A. (2011). Impact of mega-scale sand extraction on tidal dynamics in semi-enclosed basins: an idealized model study with application to the Southern North Sea. Coast. Eng. 58, 678–689. doi: 10.1016/j.coastaleng.2011.03.005
Dyer, K. R., and Huntley, D. A. (1999). The origin, classification and modelling of sand banks and ridges. Cont. Shelf Res. 19, 1285–1330. doi: 10.1016/S0278-4343(99)00028-X
Fang, G. (1986). Tide and tidal current charts for the marginal seas adjacent to China. Chin. J. Ocean. Limnol. 4, 1–16. doi: 10.1007/BF02850393
Hansen, W. (1952). Gezeiten und Gezeitenstroöme der halbtägigen Hauptmondtide M2 in der Nordsee. Deutsches Hydrographisches Institut.
IOC IHO, and BODC. (2003). Centenary Edition of the GEBCO Digital Atlas, Published on CD-ROM on Behalf of the Intergovernmental Oceanographic Commission and the International Hydrographic Organization As Part of the General Bathymetric Chart of the Oceans. Liverpool: British Oceanographic Data Centre.
Jung, K. T., Park, C. W., Oh, I. S., and So, J. K. (2005). An analytical model with three sub-regions for m2 tide in the yellow sea and the East China Sea. Ocean Sci. J. 40, 191–200. doi: 10.1007/BF03023518
Kang, Y. Q. (1984). An analytic model of tidal waves in the Yellow Sea. J. Mar. Res. 42, 473–485. doi: 10.1357/002224084788506004
Lee, S.-H., and Beardsley, R. C. (1999). Influence of stratification on residual tidal currents in the Yellow Sea. J. Geophys. Res. 104, 15679–15701. doi: 10.1029/1999JC900108
Lesser, G. R., Roelvink, J. A., van Kester, J. A. T. M., and Stelling, G. S. (2004). Development and validation of a three-dimensional morphological model. Coast. Eng. 51, 883–915. doi: 10.1016/j.coastaleng.2004.07.014
Lin, H., Lu, G., Song, Z., and Gong, J. (1999). Modeling the tide system of the East China Sea with GIS. Mar. Geod. 22, 115–128. doi: 10.1080/014904199273533
Liu, Z., Huang, Y., and Zhang, Q. (1989). Tidal current ridges in the southwestern Yellow Sea. J. Sediment. Res. 59, 432–437. doi: 10.1306/212F8FB7-2B24-11D7-8648000102C1865D
Liu, Z., Xia, D., Berne, S., Wang, K., Marsset, T., YuXiang, T., et al. (1998). Tidal deposition systems of China's continental shelf, with special reference to the eastern Bohai Sea. Mar. Geol. 145, 225–253. doi: 10.1016/S0025-3227(97)00116-3
Marchuk, G. I., and Kagan, B. A. (1989). Dynamics of Ocean Tides, Oceanographic Sciences Library. Dordrecht: Kluwer Academic Publishers. doi: 10.1007/978-94-009-2571-7
Off, T. (1963). Rhythmic linear sand bodies caused by tidal currents. Assoc. Petroleum Geol. Bull. 47, 324–341. doi: 10.1306/BC743989-16BE-11D7-8645000102C1865D
Phan, H. M., Ye, Q., Reniers, A. J. H. M., and Stive, M. J. F. (2019). Tidal wave propagation along The Mekong deltaic coast. Estuarine Coast. Shelf Sci. 220, 73–98. doi: 10.1016/j.ecss.2019.01.026
Qian, X. S., Chen, Y. P., and Zhang, C. K. (2014). Tidal wave and tidal current characteristics of the M2 constituent in a semi-enclosed rectangular basin with a coastal barrier. Acta Oceanol. Sin. 36, 37–44. (in Chinese with English abstract).
Qian, X. S., Chen, Y. P., Zhang, C. K., Pan, Y., and Das, H. (2015). Radial tidal current field in a semi-enclosed rectangular basin: formation and evolution. Chin. J. Ocean. Limnol. 33, 1085–1099. doi: 10.1007/s00343-015-4220-9
Ren, M., Xu, Y., and Zhu, J. (1986). The Comprehensive Investigative Report on the Resources of the Coastal Zone and Tidal Flats of Jiangsu Province (in Chinese). Beijing: Ocean Press.
Roos, P. C., and Schuttelaars, H. M. (2011). Influence of topography on tide propagation and amplification in semi-enclosed basins. Ocean Dyn. 61, 21–38. doi: 10.1007/s10236-010-0340-0
Roos, P. C., Velema, J. J., Hulscher, S. J. M. H., and Stolk, A. (2011). An idealized model of tidal dynamics in the North Sea: resonance properties and response to large-scale changes. Ocean Dyn. 61, 2019–2035. doi: 10.1007/s10236-011-0456-x
Song, D., Wang, X. H., Zhu, X., and Bao, X. (2013). Modeling studies of the far-field effects of tidal flat reclamation on tidal dynamics in the East China Seas. Estuar. Coast. Shelf Sci. 133, 147–160. doi: 10.1016/j.ecss.2013.08.023
Su, M., Stive, M. J. F., Zhang, C. K., Yao, P., Chen, Y. P., and Wang, Z. B. (2013). “The tidal wave system in the Chinese Marginal Seas,” in Proceedings of Coastal Dynamics 2013 (Arcachon: Bordeaux University), 1559–1570.
Su, M., Yao, P., Wang, Z. B., Zhang, C. K., and Stive, M. J. F. (2015). Tidal wave propagation in the Yellow Sea. Coast. Eng. J. 57, 1550008-1–155008-29. doi: 10.1142/S0578563415500084
Su, M., Yao, P., Wang, Z. B., Zhang, C. K., and Stive, M. J. F. (2017). Exploratory morphodynamic hindcast of the evolution of the abandoned Yellow River delta, 1578–1855 CE. Marine Geol. 383, 99–119. doi: 10.1016/j.margeo.2016.11.007
Tao, J., Wang, Z. B., Zhou, Z., Xu, F., Zhang, C., and Stive, M. J. F. (2019). A morphodynamic modeling study on the formation of the large-scale radial sand ridges in the Southern Yellow Sea. J. Geophys. Res. 124, 1742–1761. doi: 10.1029/2018JF004866
Taylor, G. I. (1922). Tidal oscillations in gulfs and rectangular basins. Proc. London Math. Soc. 2, 148–181. doi: 10.1112/plms/s2-20.1.148
Uehara, K., and Saito, Y. (2003). Late quaternary evolution of the Yellow/East China Sea tidal regime and its impacts on sediments dispersal and seafloor morphology. Sediment. Geol. 162, 25–38. doi: 10.1016/S0037-0738(03)00234-3
Uehara, K., Saito, Y., and Hori, K. (2002). Paleotidal regime in the Changjiang (Yangtze) Estuary, the East China Sea, and the Yellow Sea at 6 ka and 10 ka estimated from a numerical model. Mar. Geol. 183, 179–192. doi: 10.1016/S0025-3227(01)00255-9
Wang, Y. (2003). Radiative Sandy Ridge Field on Continental Shelf of the Yellow Sea (in Chinese). Beijing: China Environmental Science Press.
Wang, Y., Zhang, Y., Zou, X., Zhu, D., and Piper, D. (2012). The sand ridge field of the South Yellow Sea: origin by river–sea interaction. Mar. Geol. 291-294, 132–146. doi: 10.1016/j.margeo.2011.01.001
Ward, S. L., Scourse, J. D., Yokoyama, Y., and Neill, S. P. (2020). The challenges of constraining shelf sea tidal models using seabed sediment grain size as a proxy for tidal currents. Cont. Shelf Res. 205:104165. doi: 10.1016/j.csr.2020.104165
Xia, Z., Carbajal, N., and Südermann, J. (1995). Tidal current amphidromic system in semi-enclosed basins. Cont. Shelf Res. 15, 219–104240. doi: 10.1016/0278-4343(94)E0006-8
Yao, P. (2016). Tidal and sediment dynamics in the fine-grained coastal region–A case study of the Jiangsu coast, China (dissertation). Delft University of Technology, Delft, Netherlands.
Yao, P., Stive, M. J. F., Zhang, C., Su, M., and Wang, Z. (2013a). “On the formation of radial tidal current off the Central Jiangsu Coast,” in Proceedings of 2013 IAHR Congress (Chengdu: Tsinghua University Press), A10036, 1–11.
Yao, P., Wang, Z. B., Zhang, C. K., Su, M., Chen, Y. P., and Stive, M. J. F. (2013b). “The genesis of the radial tidal current off the Central Jiangsu Coast,” in Proceedings of Coastal Dynamics 2013 (Arcachon: Bordeaux University), 1947–1958.
Ye, A. L., and Chen, Z. Y. (1987). Effect of bottom topography on tidal amphydromic system in semi-enclosed rectangular waters. J. Shandong Coll. Oceanol. 17, 1–7 (in Chinese with English abstract).
Ye, Q. (2012). An approach towards generic coastal geomorphological moedelling with applications (Ph.D. Thesis). UNESCO-IHE, Institute for Water Education, Delft, Netherlands.
Zhang, C., Zhang, D., Zhang, J., and Wang, Z. (1999). Tidal current-induced formation - storm-induced change - tidal current-induced recovery. Sci. China Ser. D 42, 1–12. doi: 10.1007/BF02878492
Zhao, B. R., Fang, G. H., and Cao, D. M. (1994). Numerical simulation of the tide in the Bohai Sea, Yellow Sea and East China Sea. Acta Oceanol. Sin. 16, 1–10 (in Chinese with English abstrat).
Zhou, C., Zheng, J., Dong, P., Zhang, J., Zhu, Y., and Zhang, Z. (2016). Tidal Evolution in the Yellow and East China Sea during Holocene. J. Coast. Res. 75, 785–789. doi: 10.2112/SI75-158.1
Zhu, Y., and Chang, R. (2001). On the relationships between the radial tidal current field and the radial sand ridges in the southern Yellow Sea: a numerical simulation. Geo-Mar. Lett. 21, 59–65. doi: 10.1007/s003670100073
Zhu, Y., and Chen, Q. (2005). On the origin of the radial sand ridges in the Southern Yellow Sea: results from the modeling of the paleoradial tidal current fields off the Paleo-Yangtze River Estuary and Northern Jiangsu Coast. J. Coast. Res. 21, 1245–1256. doi: 10.2112/02-0054.1
To illustrate the results of the schematized model, many characteristic tidal parameters are used in the text. In this appendix, the definitions of the corresponding parameters are presented in detail.
Amphidromic Point. Or tidal Elevation Amphidromic Point (EAP), used for tidal elevation. The EAP is a point where the zero tidal amplitude occurs. The co-phase lines meet at EAP and the tides rotate around counterclockwise in northern hemisphere. The EAP is also named “no tide point.”
A co-phase line (or co-tidal line) links all points having the same phase. Co-amplitude line links places having the same tidal range (amplitude).
Current Amphidromic Point (CAP). Used for the tidal current. For a co-tidal current chart, the phase is defined as the time when velocity reaches its maximum (i.e., semi-major axis of a tidal ellipse). The CAP is a current nodal point where the co-current-phase lines meet. That is, at CAPs, circular motion all phases are possible, and the shape of the tidal current ellipses is reduced to a circle and sometimes degenerates to a point. Therefore, the CAP is also named “circular flow point” [mentioned in Hansen (1952); for more background information of CAP, see Xia et al. (1995)].
Co-current-phase lines link all points having the same phase (when the tidal currents reach their maximum speeds). Co-amplitude lines link places having same velocity (maximum).
Keywords: tidal current system, radial tidal current, lateral depth difference, basin geometry, tidal current amphidromic points (CAPs), south yellow sea
Citation: Zhang Q, Su M, Yao P, Chen Y, Stive MJF and Wang ZB (2020) Dynamics of a Tidal Current System in a Marginal Sea: A Case Study of the Yellow Sea, China. Front. Mar. Sci. 7:596388. doi: 10.3389/fmars.2020.596388
Received: 19 August 2020; Accepted: 16 November 2020;
Published: 21 December 2020.
Edited by:
Juan Jose Munoz-Perez, University of Cádiz, SpainReviewed by:
Pieter Roos, University of Twente, NetherlandsCopyright © 2020 Zhang, Su, Yao, Chen, Stive and Wang. This is an open-access article distributed under the terms of the Creative Commons Attribution License (CC BY). The use, distribution or reproduction in other forums is permitted, provided the original author(s) and the copyright owner(s) are credited and that the original publication in this journal is cited, in accordance with accepted academic practice. No use, distribution or reproduction is permitted which does not comply with these terms.
*Correspondence: Peng Yao, cC55YW9AaGh1LmVkdS5jbg==; Min Su, c3VtaW5AaGh1LmVkdS5jbg==
†These authors have contributed equally to this work
Disclaimer: All claims expressed in this article are solely those of the authors and do not necessarily represent those of their affiliated organizations, or those of the publisher, the editors and the reviewers. Any product that may be evaluated in this article or claim that may be made by its manufacturer is not guaranteed or endorsed by the publisher.
Research integrity at Frontiers

Learn more about the work of our research integrity team to safeguard the quality of each article we publish.