
95% of researchers rate our articles as excellent or good
Learn more about the work of our research integrity team to safeguard the quality of each article we publish.
Find out more
ORIGINAL RESEARCH article
Front. Mar. Sci. , 10 November 2020
Sec. Coral Reef Research
Volume 7 - 2020 | https://doi.org/10.3389/fmars.2020.596165
 Marc Tedetti1*
 Lionel Bigot2
 Jean Turquet3
 Catherine Guigue1Nicolas Ferretto1
 Madeleine Goutx1Pascale Cuet2
We investigated the influence of freshwater discharges on biogeochemistry and benthic communities of La Saline fringing reef, the largest coral reef system of La Réunion Island (France, Indian Ocean). Sampling was conducted in February–March 2012 along a land-ocean continuum, including rivers, groundwater, reef waters, and oceanic waters. Our results indicated the discharges of basalt groundwater (enriched in nitrates) in the southern part of the reef, and the discharges of sand groundwater and river waters (enriched in organic matter) in sites located northward. These discharges mainly impacted fore reef surface waters, while groundwater resurgences were more diffuse and not clearly detected in depth. We highlighted the relationship Si(OH)4/NO3– to identify basalt groundwater discharges. We also put forward the relationships humic-like fluorescence/NH4+ and tryptophan-like fluorescence/PO43– to identify sand groundwater discharges and wastewater pollutions, respectively. We observed the eutrophication of the southern part of the reef through higher phytoplankton biomasses, a massive presence of fleshy algal formations and a low coral coverage. The spatial homogeneity of the benthic community structures onto the entire slope contrasted with the spatial heterogeneity of chemical variables in water. This reflected the different spatial and temporal scales involved in biological and chemical processes in coral reef ecosystems.
Coral reefs are ecosystems of great biological productivity and diversity (Fisher et al., 2015) that are present mostly in shallow coastal waters of oligotrophic tropical and subtropical oceans (Kleypas et al., 1999; Hoegh-Guldberg et al., 2017). They are recognized as being particularly vulnerable to anthropogenic pressures that are exerted both through the direct exploitation of reef resources and the multiple human activities on land, which lead to impacts at the global and local levels (Dubinsky and Stambler, 1996; Pandolfi et al., 2011; Ban et al., 2014; Hughes et al., 2017). These disturbances have caused an extensive degradation of coral reefs, which, in many cases, have undergone a phase shift from coral to algal dominance (Hughes, 1994; McManus and Polsenberg, 2004; Norström et al., 2009; Bonaldo and Bellwood, 2011).
Land-based inputs of freshwater are substantial sources of nutrients, organic matter (OM) and pollutants to coastal reefs (Fabricius, 2005; Tanaka et al., 2013; Lubarsky et al., 2018). Among these freshwater inputs, submarine groundwater discharge (SGD) has an important contribution, especially in tropical islands, where it can supply large amounts of terrestrial-derived nutrients to reef waters (Lewis, 1987; Paytan et al., 2006; Kim et al., 2011; Moosdorf et al., 2015). Also, in some volcanic islands of the tropical Pacific and Indian Oceans, SGD may exceed river inputs and thus represent the largest–or the only–source of nutrients to coral reefs (Street et al., 2008; Cuet et al., 2011; Lee and Kim, 2015; Lubarsky et al., 2018). Groundwater is generally enriched in dissolved nitrogen (mainly nitrates) relative to phosphorus, displaying high N/P ratios (Slomp and Van Cappellen, 2004; Street et al., 2008; Santos et al., 2013; McMahon and Santos, 2017). Because reef waters are often oligotrophic and N-limited, SGD may lead to their eutrophication, which is characterized by the shift from corals to algal communities (Koop et al., 2001; Dailer et al., 2010; Zubia et al., 2018).
Besides nutrients and other inorganic species, SGD and rivers may also carry dissolved organic matter (DOM) to coral reefs. Recent works have shown significant inputs of groundwater-derived chromophoric and fluorescent DOM (CDOM and FDOM, respectively) in various coastal reef environments (Tedetti et al., 2011; Nelson et al., 2015; Kim and Kim, 2017; Webb et al., 2019). Humic-like fluorophores have been identified as major components of groundwater FDOM, and it has been proposed to use FDOM to differentiate groundwater types and to track their dispersal into reef waters (Tedetti et al., 2011; Nelson et al., 2015; Kim and Kim, 2017). In addition to direct allochthonous inputs, an autochthonous production of FDOM may occur in the reef waters due to the SGD-induced eutrophication or other processes (Blanco et al., 2008; Tedetti et al., 2011; Nelson et al., 2015). CDOM/FDOM in coral reef waters could influence the reef biota by supplying carbon, but also by modifying the seawater optical properties and subsequently the attenuation (and availability) of solar UV and visible radiations in the water column (Coble, 2007; Nelson and Siegel, 2013; Sempéré et al., 2015; Martias et al., 2018).
Even though numerous coral reefs of volcanic islands are strongly impacted by SGD, the effects of the latter on the reef water chemistry at a large spatial scale remain little known so far, particularly concerning DOM descriptors. Moreover, the potential link between the distribution of biogeochemical/chemical parameters of reef water and the distribution of benthic community structures has rarely been assessed (Blanco et al., 2008; Li et al., 2015; Naumann et al., 2015).
La Saline fringing reef is the most important coral reef complex of La Réunion Island (France, southwestern Indian Ocean). SGD from volcanic aquifer has been shown to be the main source of freshwater to La Saline reef (Join et al., 1988) and to enrich its waters with nitrates derived from anthropogenic sources (Cuet et al., 1988; Naïm, 1993; Mioche and Cuet, 1999). Several studies have been conducted so far on this ecosystem to determine the effects of SGD/eutrophication on C, N, P, and O fluxes (Clavier et al., 2008; Cuet et al., 2011; L’Helguen et al., 2014), the distribution of FDOM and hydrocarbons (Tedetti et al., 2011; Guigue et al., 2015), the rates of bioerosion (grazers/borers) and calcification (corals) (Chazottes et al., 2002; Chauvin et al., 2011), and the distribution of coral and algal communities (Tourrand et al., 2013; Zubia et al., 2018). Nevertheless, since most of these works have focused on quite limited geographical (back reef) areas of the reef, the distribution of chemical and biological parameters at a larger spatial scale (from back to fore reef waters, from north to south of the reef) has not been evaluated yet.
In this context, the objectives of the present work are (1) to assess the distribution of both nutrients and DOM/FDOM descriptors at the whole reef scale, i.e., from north to south, and along a continuum from land to ocean, including rivers, groundwater discharges, reef waters and oceanic waters. (2) To highlight relevant indicators of freshwater discharges into back reef and fore reef waters. (3) To attempt linking the distribution of chemical parameters with phytoplankton biomass and benthic community structure.
Extending over 9 km long, up to 500 m wide, and from 1 to 1.5 m deep, La Saline fringing reef is the largest coral complex of La Réunion Island (Cordier, 2007; L’Helguen et al., 2014). From land toward oceanic waters, it includes two principal water complexes: (1) the back reef area, located within the back reef zone and covered with sandy sediment (mean depth: 1.2 m) and the internal reef flat area characterized by transverse strips colonized by branched corals (mean depth: 0.5 m), and (2) the fore reef waters, located close to the outer reef slope dominated by corals and macroalgae. The fore reef compartment gently slopes from the reef flat environment, subjected to strong swells and waves, down to 20-m deep (Figure 1).
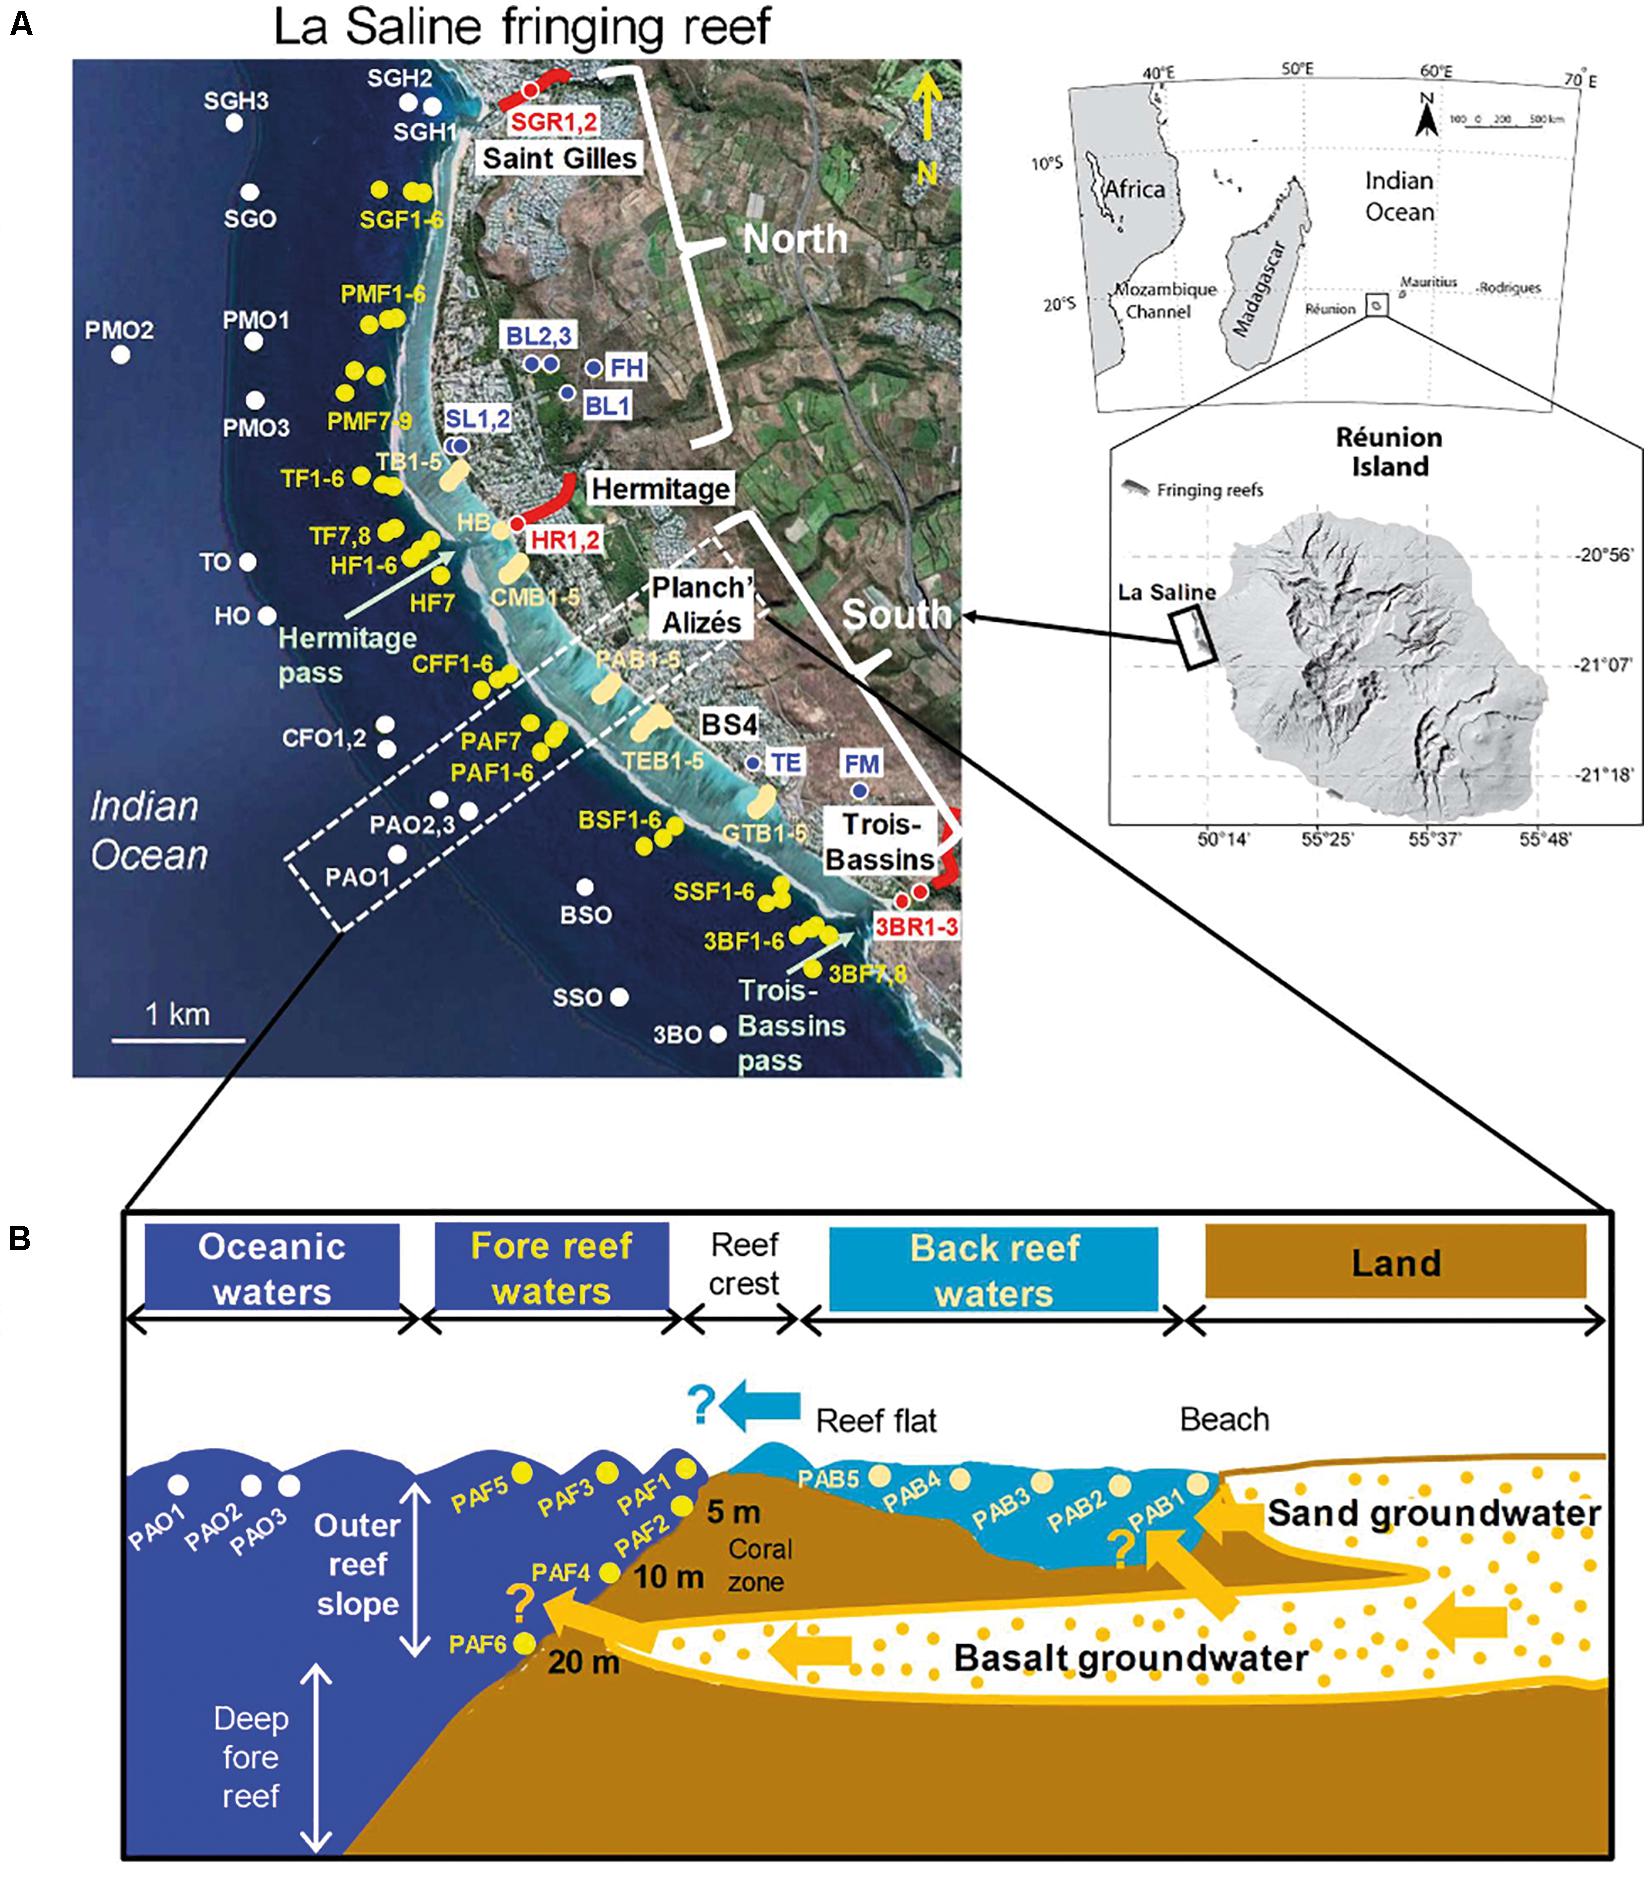
Figure 1. (A) Location of the study stations in La Saline fringing reef system (La Réunion Island, southwestern Indian Ocean), including rivers, groundwater (freshwaters), back reef waters, fore reef waters, and oceanic waters. “North” includes fore reef sites located north of the Hermitage river (i.e., SGF, PMF, TF, HF), while “South” gathers fore reef sites positioned south of the Hermitage river (i.e., CFF, PAF, BSF, SSF, 3BF). Station map made from Google Earth Pro V 7.3.0.3832 (August 18, 2017). The detailed characteristics of these stations are provided in Supplementary Table S1. (B) Cross (conceptual) section of one transect (example for Planch’Alizés transect, PA) showing the different water bodies sampled from back reef to oceanic waters, and the potential discharges of sand groundwater into back reef waters, basalt groundwater into back reef and fore reef waters, as well as the water transfer from back reef to fore reef.
Since the 1980s, it has been observed a degradation of La Saline ecosystem through a constant decrease in the living coral cover correlated with a raise in algal cover in the reef flat zone and on the outer reef slope (Ahamada et al., 2008; Naïm et al., 2013; Zubia et al., 2018; Nicet et al., 2019). Although varying spatially and seasonally (Cuet et al., 2011; Naïm et al., 2013), algal cover overall has displayed a substantial increase since the late 1990s in La Saline fringing reef (Tourrand et al., 2013). This eutrophication has been in part attributed to a chronic enrichment in nitrates derived from SGD (Cuet et al., 1988; Naïm, 1993; Naïm et al., 2013).
Groundwater regular discharges are noticeable along most of La Saline shoreline (Cuet et al., 1988; Naïm et al., 2000). These discharges vary from north to south of the reef depending on the thickness of the coral detrital-based sedimentary formations (sand layer groundwater, SL), which lie over the highly permeable volcanic aquifer (basalt layer groundwater, BL) (Join et al., 1988; Leze, 2012). In the central part of La Saline (Hermitage area), sand layer is the thickest, preventing the discharge of basalt groundwater in the back reef area, but allowing possibly its release beyond the reef front, i.e., in the fore reef waters. The thickness of the sand layer gradually decreases southward. Hence, in the southernmost part of La Saline (BS4-Trois-Bassins area) where sand layer has almost disappeared, basalt groundwater outcrops directly flows in the back reef area. In addition to groundwater, three rivers are freshwater sources for the reef: The Hermitage River (HR) (in the central part), receiving a treated wastewater effluent, the Saint Gilles River (SGR) (in the north part), whose mouth hosts a marina, and the Trois-Bassins River (3BR; in the south part) (Figure 1 and Supplementary Table S1). Besides, around 60% of habitations in this area have septic tank sewage systems. This water discharges directly into the unsaturated zone which then percolates into groundwater (Rogers et al., 2012).
Hydrodynamics in La Saline fringing reef is constrained by the reef geomorphology, the open ocean forcing (tide and waves), and wind (Cordier et al., 2013). Water circulation in the reef is structured in several individual cells (Cordier, 2007). In each of those cells, wave breaking near the reef crest drives a water flow across the reef flat up to the back reef area where water progresses along the shoreline either toward the north end of the reef (Saint Gilles area), the Hermitage pass (in the central part of the reef, north and south of the Hermitage River) or toward the Trois-Bassins pass (in the south) (Figure 1). The reef water flows back to open sea mainly through these two passes but also via narrow gaps in the reef crest. Water residence time in the back reef zone varies from ∼2 h 30 min to 10 h 30 min, and tides are semidiurnal ranging from 0.1 m (neap) to 0.9 m (spring) (Cordier, 2007).
Sampling was conducted in freshwaters, back reef waters, fore reef waters and oceanic waters from February 22, to March 13, 2012 in the morning during the summer season, which is generally characterized by high seawater temperatures and strong rainfalls (Figure 1 and Supplementary Table S1). Water sampling for measurements of salinity and biogeochemical parameters (nutrients, DOM and pigments) was carried out in all these water bodies, while sampling of benthic communities was performed only onto outer reef slopes (fore reef waters). All water samples were retrieved in 4-L Nalgene® polycarbonate bottles extensively washed with 1 M hydrochloric acid (HCl) and ultrapure water (i.e., Milli-Q water from Millipore system, final resistivity of 18.2 MΩ cm) before use. The bottles were rinsed three times with the respective sample before filling and placed in the cold and in the dark after collection until back to the laboratory. Also, in situ measurements of temperature, salinity and total chlorophyll a (TChl a) were undertaken in most of back reef, fore reef, and oceanic sites (Supplementary Table S1) using a 19plus conductivity-temperature-depth (CTD) probe (Sea-Bird Electronics, Inc.) equipped with a WETStar fluorometer (WETLabs, Inc.). The detailed sampling for the different water bodies is provided in Supplementary Text S1.
Back in the laboratory, water samples were immediately filtered under a low vacuum. Samples for dissolved organic carbon (DOC) and FDOM analyses were filtered through pre-combusted (500°C, 4 h) glass fiber filters (GF/F) (47-mm diameter, Whatman). The ∼0.7-μm filtered samples were stored at −18°C until analysis. Samples for the determination of salinity and nitrate (NO3–), nitrite (NO2–), ammonium (NH4+), phosphate (PO43–), dissolved organic nitrogen (DON), and urea concentrations were filtered through pre-combusted GF/F filters (47-mm diameter, Whatman), and those for the determination of silicate [Si(OH)4] concentration, through 0.45-μm mixed cellulose ester filters (25-mm diameter, HAWP Millipore). Filtered samples were stored in 125-mL Nalgene® polycarbonate bottles at −18°C until analyses, except those for NH4+ (stored in 100-mL Schott® glass bottles), Si(OH)4 (stored at 4°C) and salinity (stored in sealed cans in the dark at room temperature). Samples for the determination of TChl a and phaeopigment a (Pheo a) concentrations were filtered (from 50 to 400 mL for freshwater samples to 1000 mL for marine samples) through pre-combusted GF/F filters (25-mm diameter, Whatman). Filters were stored at −18°C until analyses.
In this work, TChl a and Pheo a concentrations were not determined in groundwater (i.e., SL1, 2, BL1-3, TE, FH, FM samples), while, NH4+, PO43–, DON, urea, TChl a, and Pheo a concentrations were not determined in back reef waters, except in HB (Supplementary Table S1). For back reef waters, TChl a concentrations derived from CTD measurements were used.
Salinity was determined on all discrete samples in the laboratory using a calibrated Yeo-Kal Mark IV salinometer. The accuracy of the salinity analysis was estimated ±0.003.
Concentrations in nutrients, DON and urea were determined by colorimetric methods. Si(OH)4, NO3–, NO2–, and PO43– were analyzed on an automatic analysis chain (Autoanalyzer III Seal) according to standard methods by Tréguer and LeCorre (1975) and modified by Aminot and Kerouel (2007) for PO43–. Precision of measurements was ±0.05 μM for Si(OH)4 and NO3–, and ±0.02 μM for NO2– and PO43–. NH4+ and urea were analyzed with a UVIKON 922 spectrophotometer equipped with 10-cm cuvettes according to methods by Aminot (1983) for NH4+, and Mulvenna and Savidge (1992) and Goeyens et al. (1998) for urea. Precision of measurements was ±0.05 and ±0.03 μM for NH4+ and urea, respectively. Total dissolved N was determined by the wet oxidation procedure described in Raimbault et al. (1999), and DON concentration was retrieved by subtracting NO3– + NO2– + NH4+ concentration to total dissolved N concentration. Precision of measurements was ±5%.
Total chlorophyll a and Pheo a concentrations were determined by fluorescence after methanol extraction according to Raimbault et al. (2004), by using a Turner Fluorometer 110 equipped with the Welschmeyer kit to avoid chlorophyll b interference (Welschmeyer, 1994). The detection limit of TChl a was ∼0.01 μg L–1. Calibrations were made using a pure Sigma Chl a standard. Pheo a concentration was obtained by difference between TChl a concentrations measured before and after acidification.
For DOC analysis, the samples were spiked with phosphoric acid and bubbled for 10 min with CO2-free air to purge inorganic carbon. DOC was measured on two replicates by high-temperature catalytic oxidation using a Shimadzu TOC 5000 Total Carbon Analyzer (Sohrin and Sempéré, 2005). The accuracy and system blank of the instrument were determined by the analysis of Deep Atlantic Water and low carbon water reference standards. The nominal precision of the analysis procedure was within 2%.
Fluorescent DOM analyses were carried out with a Hitachi F-7000 Fluorescence Spectrophotometer. The method is detailed in Tedetti et al. (2012, 2016) and Ferretto et al. (2017). In brief, excitation-emission matrices (EEMs) were produced for excitation wavelengths (λEx) between 200 and 500 nm and for emission wavelengths (λEm) between 280 and 550 nm. Two replicates were run for each sample. Inner filtering effects were corrected by applying the absorption method (Ohno, 2002). Absorbance measurements were performed between 200 to 800 nm with a Shimadzu UV-Visible 2450 Spectrophotometer.
The EEMs were then blank-corrected by subtracting the pure water EEM, and converted into quinine sulphate unit (QSU). EEMs were then processed using parallel factor analysis (PARAFAC), operated using the DOMFluor toolbox v1.6. running under MATLAB 7.10.0 (R2010a). The datasets of freshwaters (rivers, groundwater) and marine waters (back reef, fore reef, and oceanic waters) were processed separately due to their differences in salinity values and fluorescence intensities (Stedmon and Bro, 2008; Ferretto et al., 2017). Thirty samples (EEMs) were used for the freshwater PARAFAC model, while 91 samples were used for the marine water PARAFAC model.
In this study, we validated two PARAFAC components for each modeled dataset (freshwater and marine samples): one humic-like component (λEx1, λEx2/λEm of 230, 315/440 nm for freshwater samples, and λEx1, λEx2/λEm of 235, 315/436 nm for marine samples) and one tryptophan-like component (λEx1, λEx2/λEm of 230, 290/348 nm for freshwater samples, and λEx1, λEx2/λEm of 225, 280/340 nm for marine samples). These two components (humic- and tryptophan-like) are common and ubiquist FDOM fluorophores classically found in aquatic environment (Coble, 2007; Fellman et al., 2010).
For each site, samples for the analysis of benthic communities were taken by divers onto the outer reef slope at 10-m depth (samples n° 4 for all fore reef sites) (Supplementary Table S1). Line Intercept Transect (LIT) developed by English et al. (1994) was adapted for the monitoring of coral reef in the Indian Ocean (Conand et al., 1997, 2000). LIT was used to characterize the benthic community structure at an expert level for the coral species (hard and soft corals), the main algae assemblages (i.e., coralline algae, macroalgae, turf algae) and the abiotic substrates. Three replicates of 20-m long were recorded for each station.
In most cases non-parametric tests were preferred to parametric tests (Joliffe, 1986). Principal component analyses (PCA) were performed based on Spearman’s rank order correlation matrices. In some cases, Pearson correlations were applied when the slope and y-intercept of the linear regression were investigated. Hierarchical ascendant classification (HAC) was used to find homogenous groups of samples within the dataset, with respect to selected variables. The dissimilarity measurement between groups was based on Ward’s method, which uses squared Euclidean distance. Variable values were centered and reduced beforehand. Non-parametric tests of Mann–Whitney (U-test) and Kruskal–Wallis (H-test) were used to compare the distributions of two (U-test) or more than two (H-test) groups. Normality tests, PCA, HAC, correlations, box-and-whisker plots, U- and H-tests were carried out on salinity and all biogeochemical parameters (nutrients, DOC, DON, urea, FDOM, TChl a, and Pheo a) using XLSTAT 2013.5.01. Moreover, canonical correspondence analysis (CCA) was performed with PAST 3.25 software, following the eigen analysis algorithm given in Legendre and Legendre (1998) to investigate the potential influence of biogeochemical parameters on the distribution of benthic communities. CCA was applied on salinity, nutrients, FDOM, and benthic communities (abundances of mixed algal assemblages, coralline algae, Acropora corals, non-Acropora corals, soft corals, abiotic substratum).
Color maps of CTD data were carried out using Ocean Data View (ODV) software version 4.6.5 (Schlitzer, 2014). The spatial interpolation/gridding of data was conducted using Data-Interpolating Variational Analysis (DIVA) (Barth et al., 2010; Troupin et al., 2012).
Salinity and biogeochemical parameters in freshwater samples (rivers and groundwater) are presented Figure 2 and Supplementary Table S2. Basalt layer groundwater (BL) was enriched in Si(OH)4 (850–1250 μM) and NO3– (270–800 μM) compared to other freshwater bodies (Figures 2B,C), while displaying very low contents in reduced forms of dissolved inorganic nitrogen (0.03–0.08 μM for NO2– and 0.00–0.17 μM for NH4+) and DOM, including DOC (25–45 μM), DON (0.0–7.4 μM), urea (0.04–0.49 μM), humic- and tryptophan-like fluorophores (5–80 QSU) (Figures 2D,E,G–K).
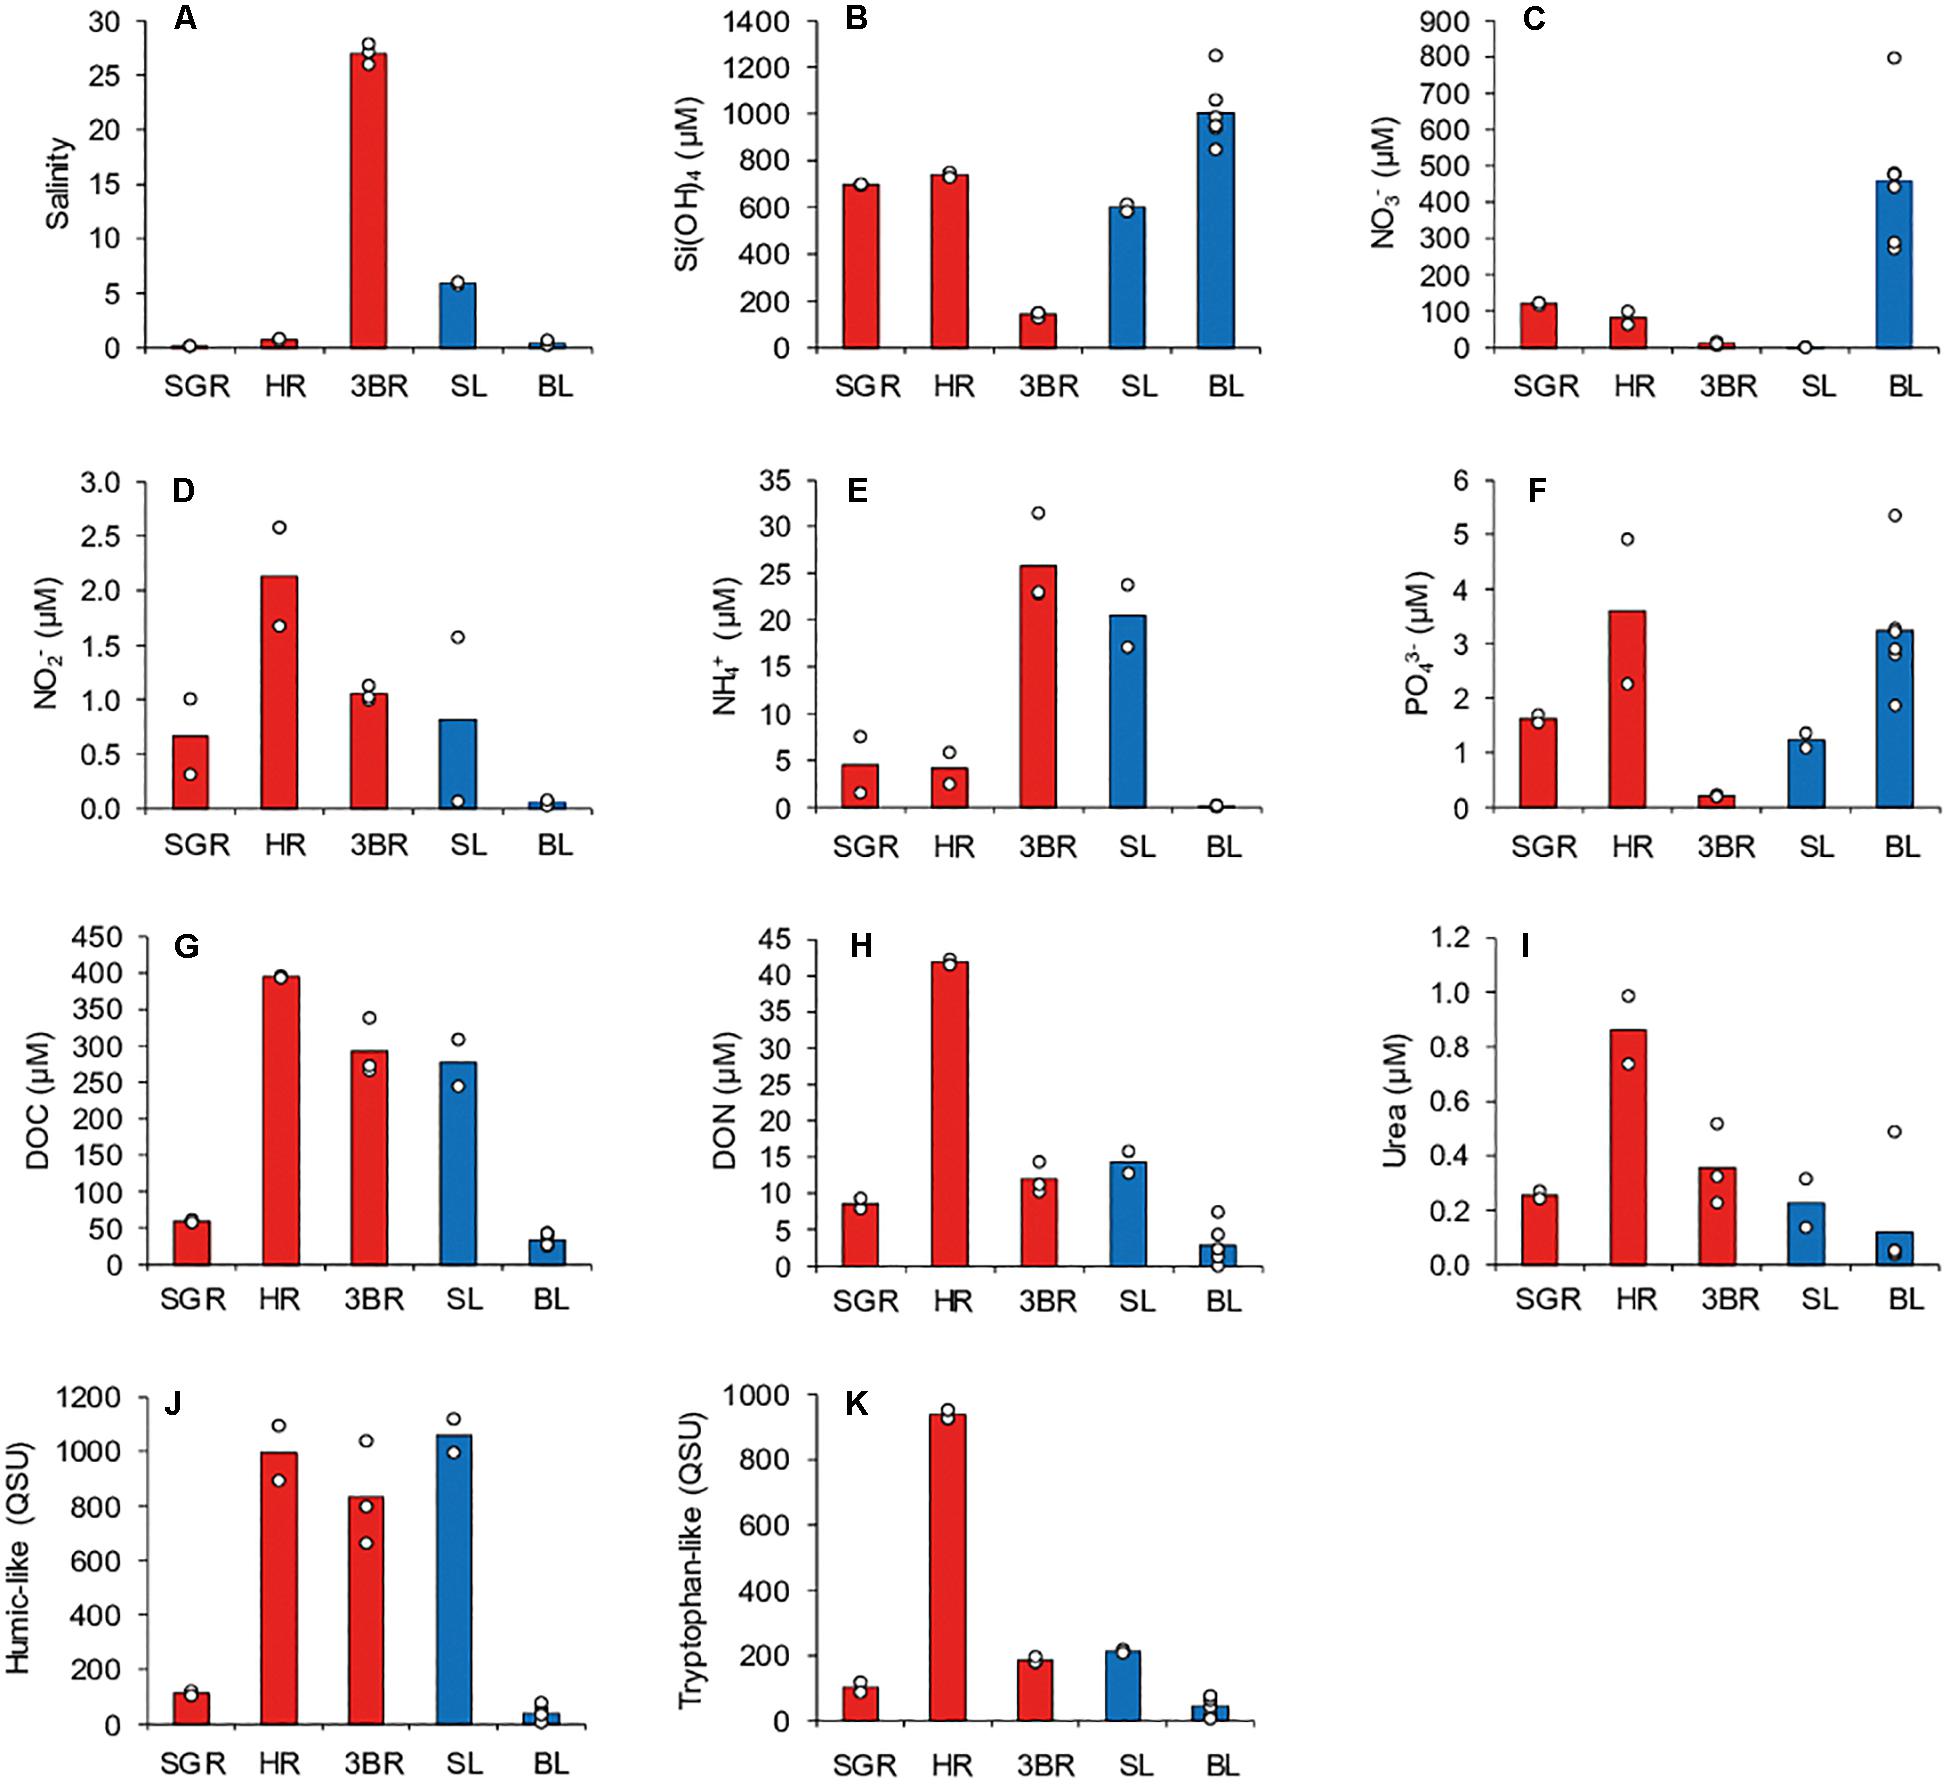
Figure 2. Salinity and biogeochemical parameters for freshwater samples (rivers, in red and groundwater, in blue) (A–K). Histograms represent mean values while dots represent individual sample values. SGR: Saint Gilles River, including SGR1, two samples; HR: Hermitage River, including HR1, two samples; 3BR: Trois-Bassins River, including 3BR1-three samples; SL: Sand layer groundwater, including SL1, two samples; BL: Basalt layer groundwater, including FH, FM, BL1-3, and TE samples.
Samples from Trois-Bassins River (3BR) were brackish with salinity ranging from 26.0 to 27.9, and exhibited low concentrations in Si(OH)4 (125–150 μM) and PO43– (0.19–0.22 μM) relative to other freshwater bodies, as well as low concentrations in NO3– (5.6–15.7 μM) (Figures 2A–C,F). On the other hand, 3BR was enriched in DOM (DOC: 270–340 μM; humic-like: 660–1040 QSU), and displayed higher concentrations in DON (10.2–14.4 μM), NO2– (∼1 μM), and NH4+ (22.8–31.5 μM) compared to BL (Figures 2D,E,G,H,J).
Sand layer groundwater (SL) presented salinities of 5.7–6.0, and contents in DOM, NO2–, and NH4+ of the same order of magnitude that those of 3BR. Also, concentrations in Si(OH)4 (580–620 μM) and PO43– (∼1.2 μM) were lower than in BL, while NO3– had almost disappeared (0.08–1.51 μM) (Figures 2A–K).
Hermitage River (HR) had high contents in DOC (∼390 μM) and humic-like material (890–1095 QSU) of the same order of magnitude than those of SL and 3BR. However, compared to these two water bodies, it showed a significant enrichment in DON (∼42 μM), tryptophan-like fluorophore (∼935 QSU), and in a lesser extent, urea (∼0.85 μM), PO43– (∼3.6 μM), and NO2– (∼2.2 μM). In contrast, NH4+ concentration in HR (2.4–5.8 μM) was much lower than in SL and 3BR (Figures 2D–K).
Saint Gilles River was distinguished from other rivers and SL due its lower content in DOM, particularly in DOC (∼60 μM) and humic-like material (∼100 QSU) (Figures 2G–K).
Spearman PCA applied on salinity and biogeochemical parameters for freshwater samples are shown Supplementary Figure S1. Correlation circle displayed strong positive (linear) correlations between Si(OH)4, NO3–, and PO43– (r = 0.78–0.91), between NO2–, DOC, DON, humic-, and tryptophan-like fluorophores (r = 0.80–0.94), between humic-like and NH4+ (r = 0.80), and between DOC and urea (r = 0.78) (n = 15, p < 0.05 for all r values).
The first principal component (PC1), which explained 72.9% of total variability within samples, allowed the discrimination between (1) BL and SGR, which were (especially BL) enriched in Si(OH)4, NO3–, and PO43– but depleted in DOM and reduced forms of dissolved inorganic nitrogen, and (2) SL, 3BR, HR, which presented higher contents in DOM and NO2–/NH4+ than BL, as well as lower concentrations of Si(OH)4 and NO3–. The second principal component (PC2) accounted for 12.5% of total variability, and allowed separating HR from SL and 3BR due to the enrichment of HR in DON, tryptophan-like material, urea, PO43– and NO2–. The three groups of samples highlighted by PCA (G1: SGR and BL, G2: 3BR and SL, G3: HR) were confirmed by the HAC (Supplementary Figure S1).
The distribution of salinity and biogeochemical parameters in back reef waters are shown Figure 3, Supplementary Table S2, and Supplementary Figure S2. For all sites, except the northmost one (TB), we observe gradients from the beach to the reef flat, with increasing salinity values (for instance from 33.49 to 35.62 for TEB) and decreasing Si(OH)4, NO3–, and NO2–concentrations (for example from 65 to 2 μM of Si(OH)4 for TEB). North-South differences also appeared with overall lower salinities and higher nutrient concentrations in the southern sites (PAB, TEB, GTB), especially in TEB, relative to the northern ones (TB, CMB). These North–South differences were particularly marked when considering the beach stations (Figures 3A–D). The distributions of Si(OH)4 and NO3– across sites were quasi superimposed. DOC concentrations, which did not present any beach-reef flat gradient, were maximal at PAB site (86–99 μM) (Figure 3E). The distribution of humic-like fluorophore was close to that of NO2–. Indeed, the humic-like content was minimal at TB (5.5–6.5 QSU) and maximal at GTB-beach (24 QSU), while displaying a progressive decrease from the beach to the reef flat at TEB (Figure 3F). Tryptophan-like material showed the highest values and variability in TEB and GTB sites (22–147 QSU) (Figure 3G). TChl a concentration was minimal at TB (0.17–0.19 μg L–1), and decreased from the beach to the reef flat at PAB, TEB, and GTB (for instance from 0.64 to 0.30 μg L–1 at PAB). In this sense, TChl a had a distribution similar to those of NO2– and humic-like (Figure 3H). Supplementary Figure S2 also illustrates these gradients for temperature, salinity and TChl a concentration from in situ CTD measurements.
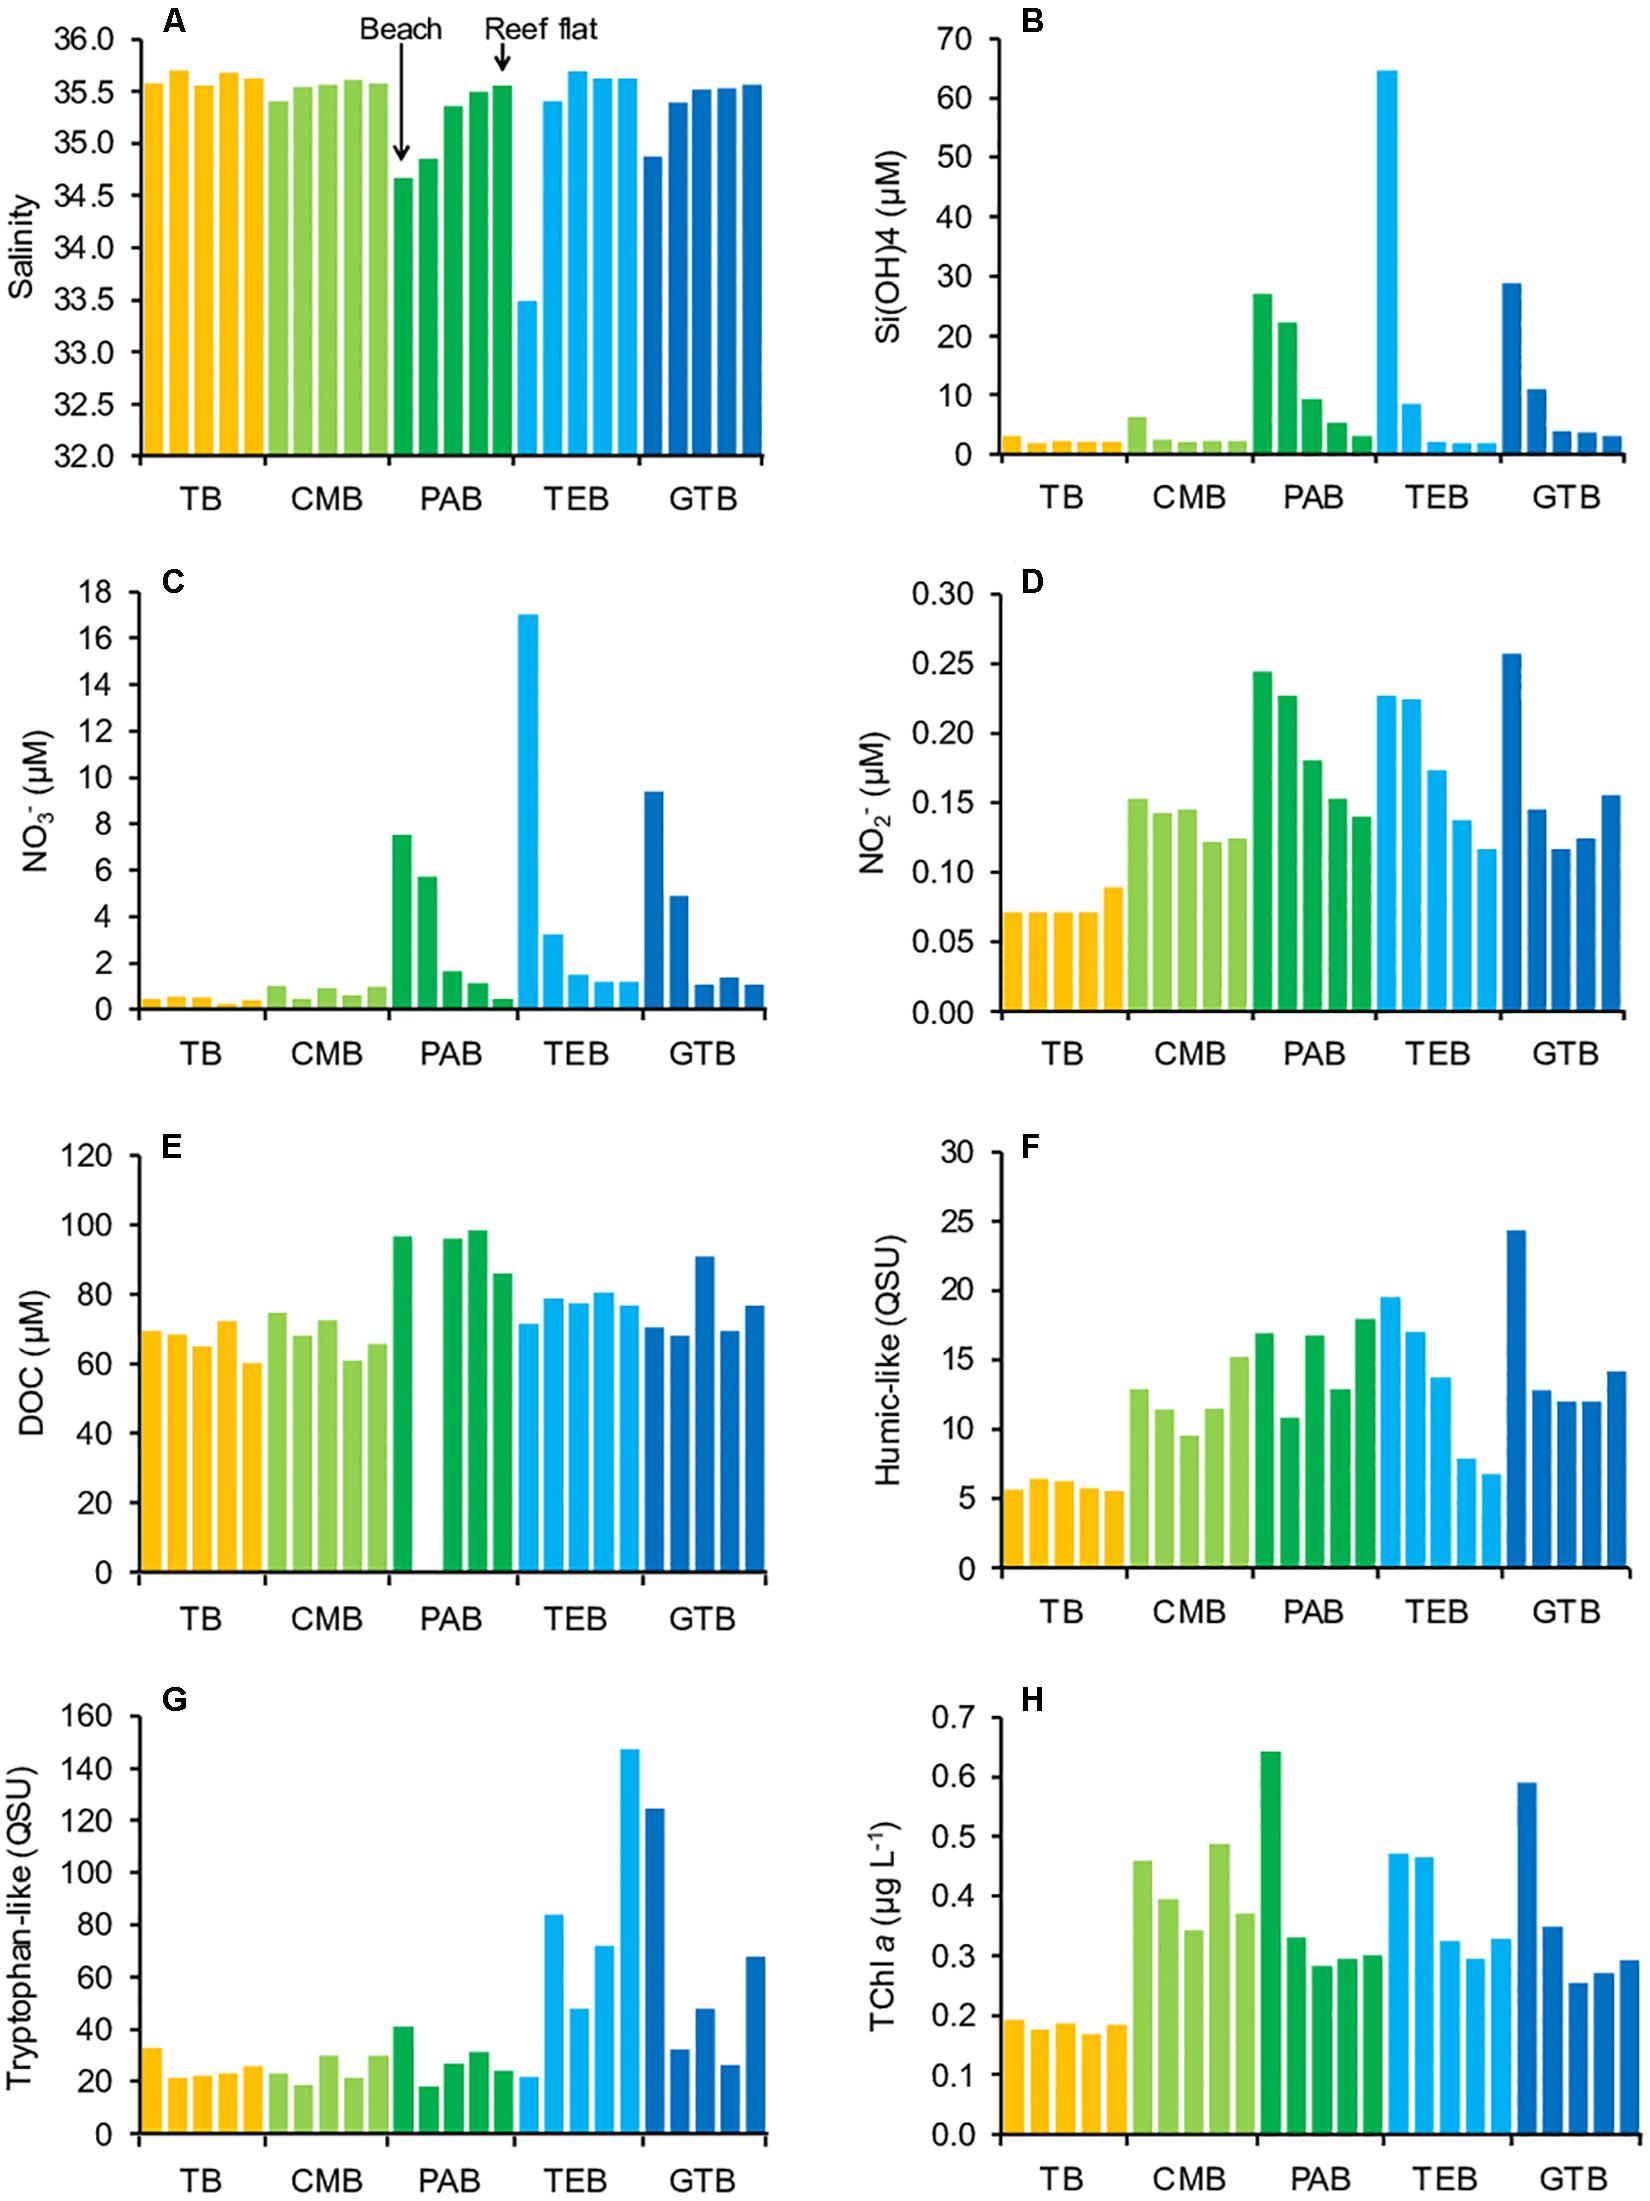
Figure 3. Distribution of salinity and biogeochemical parameters in back reef waters from north (TB) to south (GTB) (A–H). TB: Toboggan, including TB1-five samples (orange); CMB: Club Med, including CMB1-five samples (light green); PAB: Planch’Alizés, including PAB1-five samples (green); TEB: Trou d’Eau, including TEB1-five samples (light blue); GTB: Grand Trou d’Eau, including GTB1-five samples (blue); HB sample (Hermitage) is not included. For each site, from left to right: sample 1 (beach) to sample 5 (reef flat). PAB2 sample is missing for DOC. TChl a concentrations are derived from CTD measurements.
In an attempt to identify the type of freshwater impacting back reef waters, we examined more precisely the Pearson relationships between selected variables. The most significant linear correlations between salinity, Si(OH)4 and NO3– concentrations were observed for the southern sites (PAB, TEB, GTB), and when taking into account all sites together. Also, the highest correlations between salinity and NO2–, humic-, tryptophan-like or TChl a concentration were found for GTB site. In contrast, correlations for TB and CMB sites were low/not significant, except between salinity and Si(OH)4 (CMB) and between salinity and TChl a (TB) (Supplementary Table S3 and Supplementary Figures S3A,B).
Interestingly, at zero salinity, the (extrapolated) Si(OH)4 concentrations in PAB, TEB sites and for all sites together (941 ± 33, 1034 ± 25, and 1039 ± 38 μM, respectively) were not significantly different from the Si(OH)4 mean concentration measured in basalt groundwater (BL) (1006 ± 138 μM) (U-test, p > 0.05), while the extrapolated Si(OH)4 concentration in GTB was slightly above (1362 ± 89 μM) (U-test, p < 0.05). On the other side, the extrapolated Si(OH)4 concentration in CMB (779 ± 180 μM) was not significantly different from the Si(OH)4 mean concentration measured in HR (739 ± 15 μM) (U-test, p > 0.05). Also, the (extrapolated) NO3– concentrations in GTB at zero salinity (442 ± 62 μM) was similar to the mean NO3– concentration recorded in BL (460 ± 189 μM) (U-test, p > 0.05) (Supplementary Table S4).
In the same way, the Si(OH)4/NO3– concentration mean ratio in back reef waters (4.0 ± 1.9) was closer to those recorded in BL (2.4 ± 0.7) and SGR (5.8 ± 0.2) than those found in HR (9.5 ± 2.8), 3BR (15.3 ± 6.7), and SL (407–6948). Moreover, within back reef waters, differences occurred in this Si(OH)4/NO3– ratio: while TEB and GTB ratios (2.3 ± 0.9 and 3.0 ± 0.5) were not significantly different from that of BL (U-test, p > 0.05), TB, CMB, and PAB ratios (5.9 ± 2.1, 4.0 ± 1.8, and 5.0 ± 1.4) were noticeably higher (U-test, p < 0.05), being closer to those of SGR and HR (Supplementary Figure S4).
The distribution of salinity and biogeochemical parameters in fore reef and oceanic waters is presented Figure 4, Supplementary Table S2, and Supplementary Figures S5–S7. In addition, the detailed description for each parameter is provided in Supplementary Text S2. Salinity, PO43– concentration and fluorescence intensity of tryptophan-like fluorophore were significantly higher in the northern part (from SGF to HF) than in the southern part of the reef (from CFF to 3BF) (U-test, p < 0.05) (Figures 4A,F,K and Supplementary Figures S5D–F, S6C,R, S7O). On the contrary, Si(OH)4, DOC and TChl a concentrations were significantly higher in the south than in the north (U-test, p < 0.05) (Figures 4B,G,L and Supplementary Figures S5G–I, S6F, S7C,R). All the other parameters did not show any difference between the north and the south (U-test, p > 0.05). Salinity displayed significantly lower values in surface waters than in waters close to the slope (U-test, p < 0.05), while the inverse pattern (significantly higher values in surface waters) was found for Si(OH)4, NO3–, NO2– and NH4+ concentrations, as well as fluorescence intensity of humic-like fluorophore (U-test, p < 0.05) (Figures 4A–E,J and Supplementary Figures S6B,E,H,K,N, S7K). The other parameters did not present any difference between surface and slope (U-test, p > 0.05). For salinity and Si(OH)4 concentration, no particular gradient was observed as a function of the distance to the reef front (i.e., between samples collected over depths of 5, 10, or 20 m) (U-test, p > 0.05) (Supplementary Figures S6A,D), whereas NO3–, NO2–, NH4+ PO43–, and TChl a concentrations significantly decreased with distance to the reef front (U-test, p < 0.05) (Figures 4C–F,L and Supplementary Figures S5G–I, S6G,J,M,P, S7P). All the other parameters did not significantly vary with respect to the distance to the reef front, except DON, whose concentration increased from the front to the open sea (Figure 4H and Supplementary Figure S7D). It should be noticed that the spatial distribution of Pheo a, not shown in Figure 4, was analogous to that of TChl a.
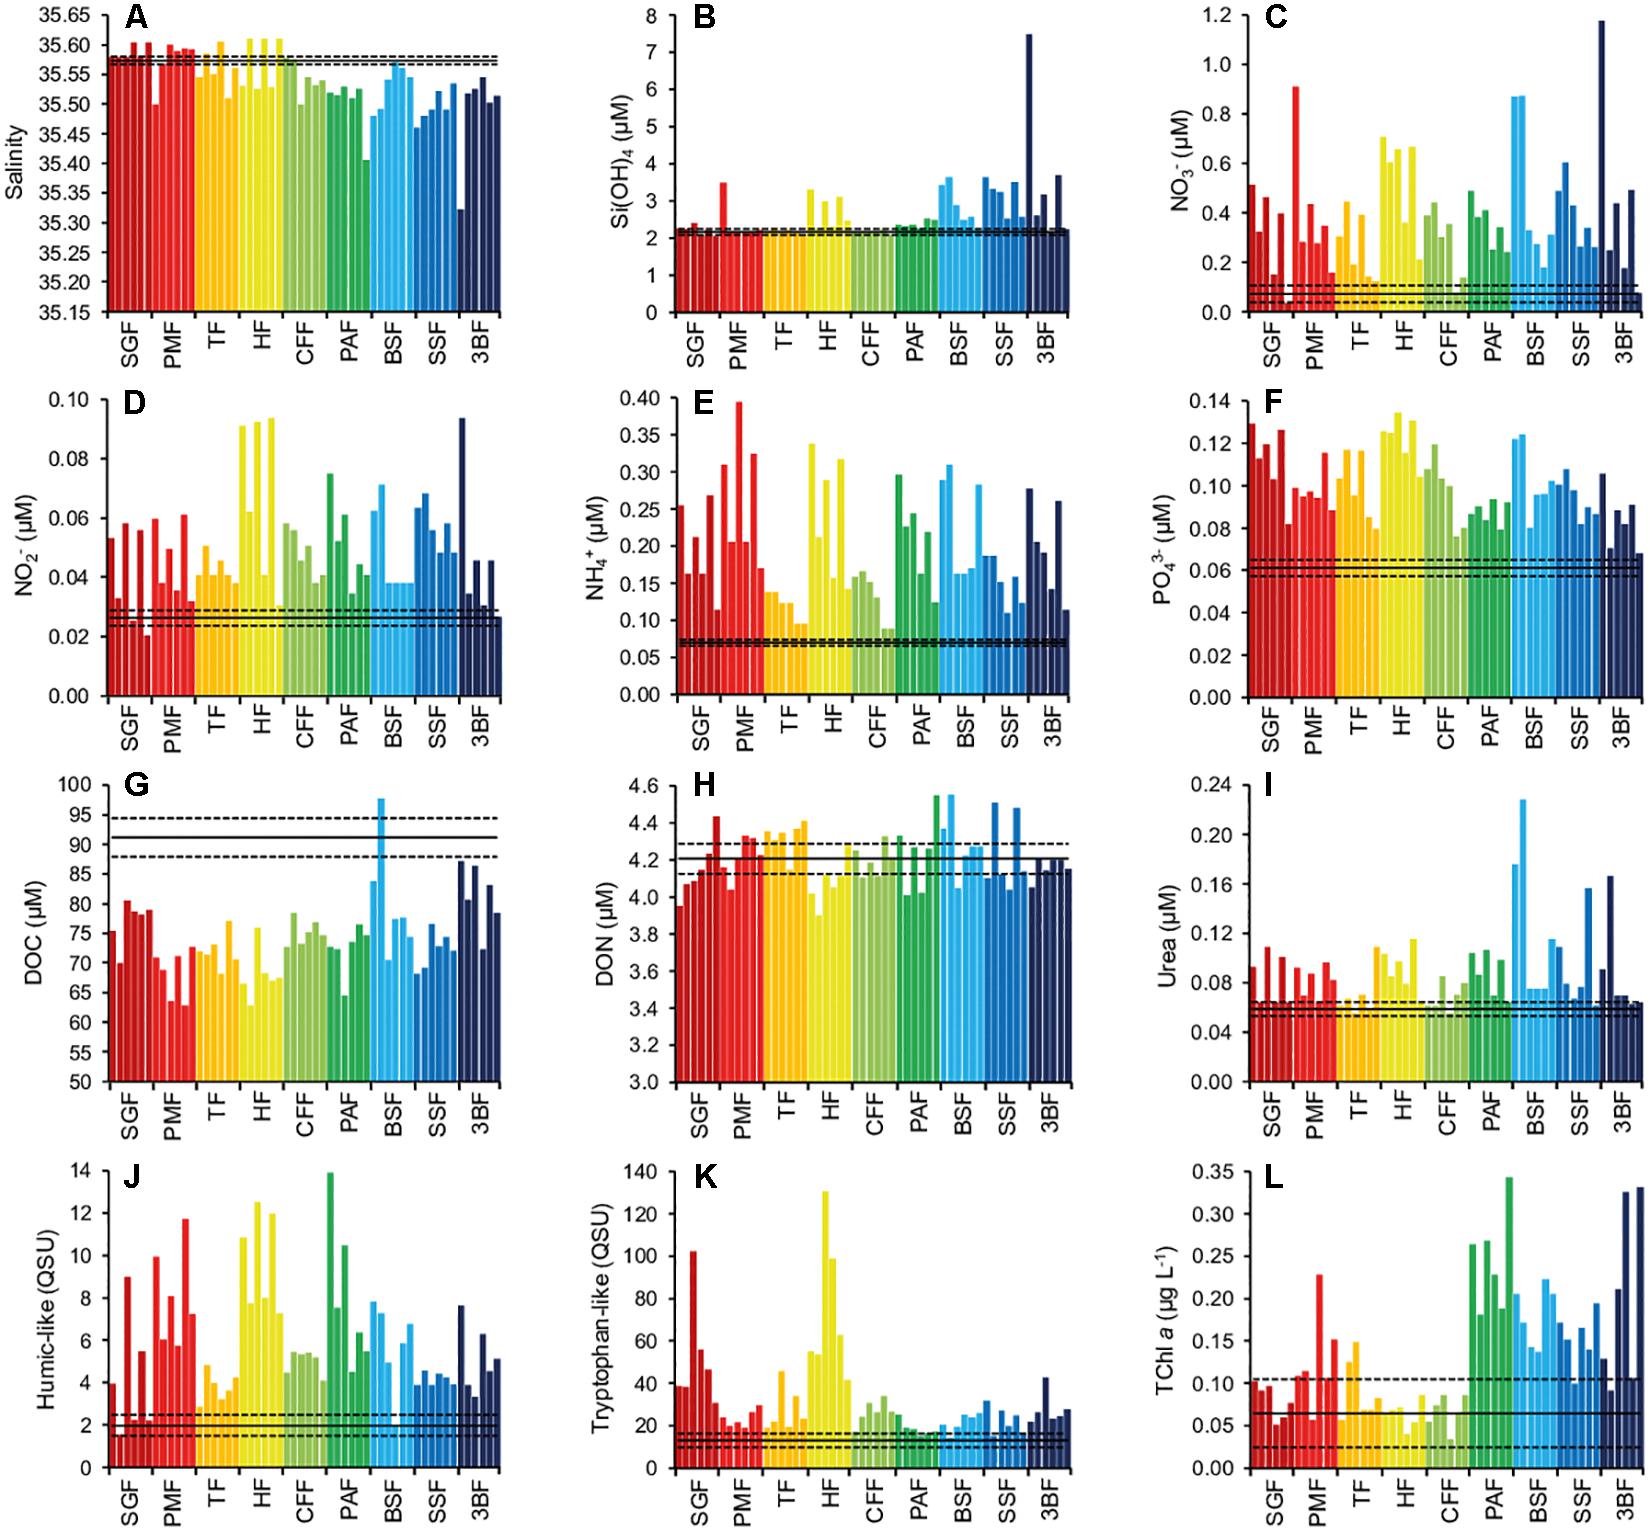
Figure 4. Distribution of salinity and biogeochemical parameters in fore reef waters from north (SGF) to south (3BF) (A–L). SGF: Saint Gilles River, including SGF1-six samples (dark red); PMF: Poste MNS, including PMF1-six samples (red); TF: Toboggan, including TF1-six samples (orange); HF: Hermitage, including HF1-six samples (yellow); CFF: Camp des Finances, including CFF1-six samples (light green); PAF: Planch’Alizés, including PAF1-six samples (green); BSF: BS4, including BSF1-six samples (light blue); SSF: Sud Sanctuaire, including SSF1-six samples (blue); 3BF: Trois-Bassins, including 3BF1-six samples (dark blue). For each site, from left to right: sample n° 1 to sample n° 6, with sample n° 1 = 5-m depth–surface; n° 2 = 5-m depth–slope; n° 3 = 10-m depth–surface; n° 4 = 10-m depth–slope; n° 5 = 20-m depth–surface; n° 6 = 20-m depth–slope. Black lines correspond to values (full line: mean, dotted lines: standard deviation) recorded in the oceanic water samples, including PMO2 (Poste MNS), PAO1 (Planch’Alizés), and 3BO (Trois-Bassins).
Spearman PCA applied on salinity and biogeochemical parameters for the fore reef and oceanic samples are shown Supplementary Figure S8. Correlation circle mainly revealed a significant negative correlation between salinity and Si(OH)4 (r = −0.62), and significant positive correlations between TChl a and Pheo a (r = 0.86), between Si(OH)4 and NO3– (r = 0.60), between NO3–, NO2–, NH4+, and PO43– (r = 0.55–0.88), and between NH4+, humic-like and urea (r = 0.54–0.69) (n = 57, p < 0.05).
First principal component accounted for 36.6% of total variability within samples. It was mostly driven by NO3–, NO2–, and NH4+, that were the only three parameters that both decreased when the distance to the reef front increased, and were higher at the surface than onto the slope. Therefore, from the left to the right side of PC1 (i.e., increasing concentrations in NO3–, NO2–, NH4+), samples present a distribution from oceanic waters and bottom/distant fore reef waters toward surface/closer fore reef waters. Humic-like and urea are significantly correlated with NH4+, hence also contributed to PC1, although more weakly (Supplementary Figure S8).
Second principal component explained 20.8% of total variability. It was principally associated (negatively) with salinity and tryptophan-like fluorophore, and (positively) with TChl a and Pheo a. It allowed the discrimination of samples mainly regarding the different sites and the north-south gradient. From the bottom to the top of PC2, i.e., increasing concentrations in TChl a and Pheo a, decreasing values of salinity and tryptophan-like, samples are roughly distributed from northern (HF, PMF, SGF, TF) to southern sites (CFF, PAF, BSF, SSF, 3BF) (Supplementary Figure S8).
We investigated the Pearson relationships between some selected parameters in each site independently to help identify the locations and the type of freshwater inputs, as well as to highlight markers of terrestrial/anthropogenic inputs (Supplementary Table S5 and Figure 5). Negative correlations between salinity and nutrients or humic-like were the highest in the southernmost sites (BSF, SSF, 3BF), which displayed particularly strong correlations between salinity and Si(OH)4, NO3–, or NO2– (r = −0.92–0.97, n = 9, p < 0.05) (Supplementary Table S5 and Figure 5A). Besides the southernmost part of the reef, PMF, HF, and PAF sites also showed significant negative correlations between salinity and Si(OH)4, while SGF, TF, and CFF did not exhibit any significant correlations between salinity and the other variables, except CFF for tryptophan-like (Supplementary Table S5). Likewise, the highest correlations between Si(OH)4 and NO3– concentrations were recorded for the southernmost sites (BSF, SSF, 3BF) (r = 0.90–0.98, n = 9, p < 0.05) (Supplementary Table S5 and Figure 5B). The linear regressions presented slope values (1.7–4.7) of the same order of magnitude than the Si(OH)4/NO3– ratio observed in BL (2.4 ± 0.7).
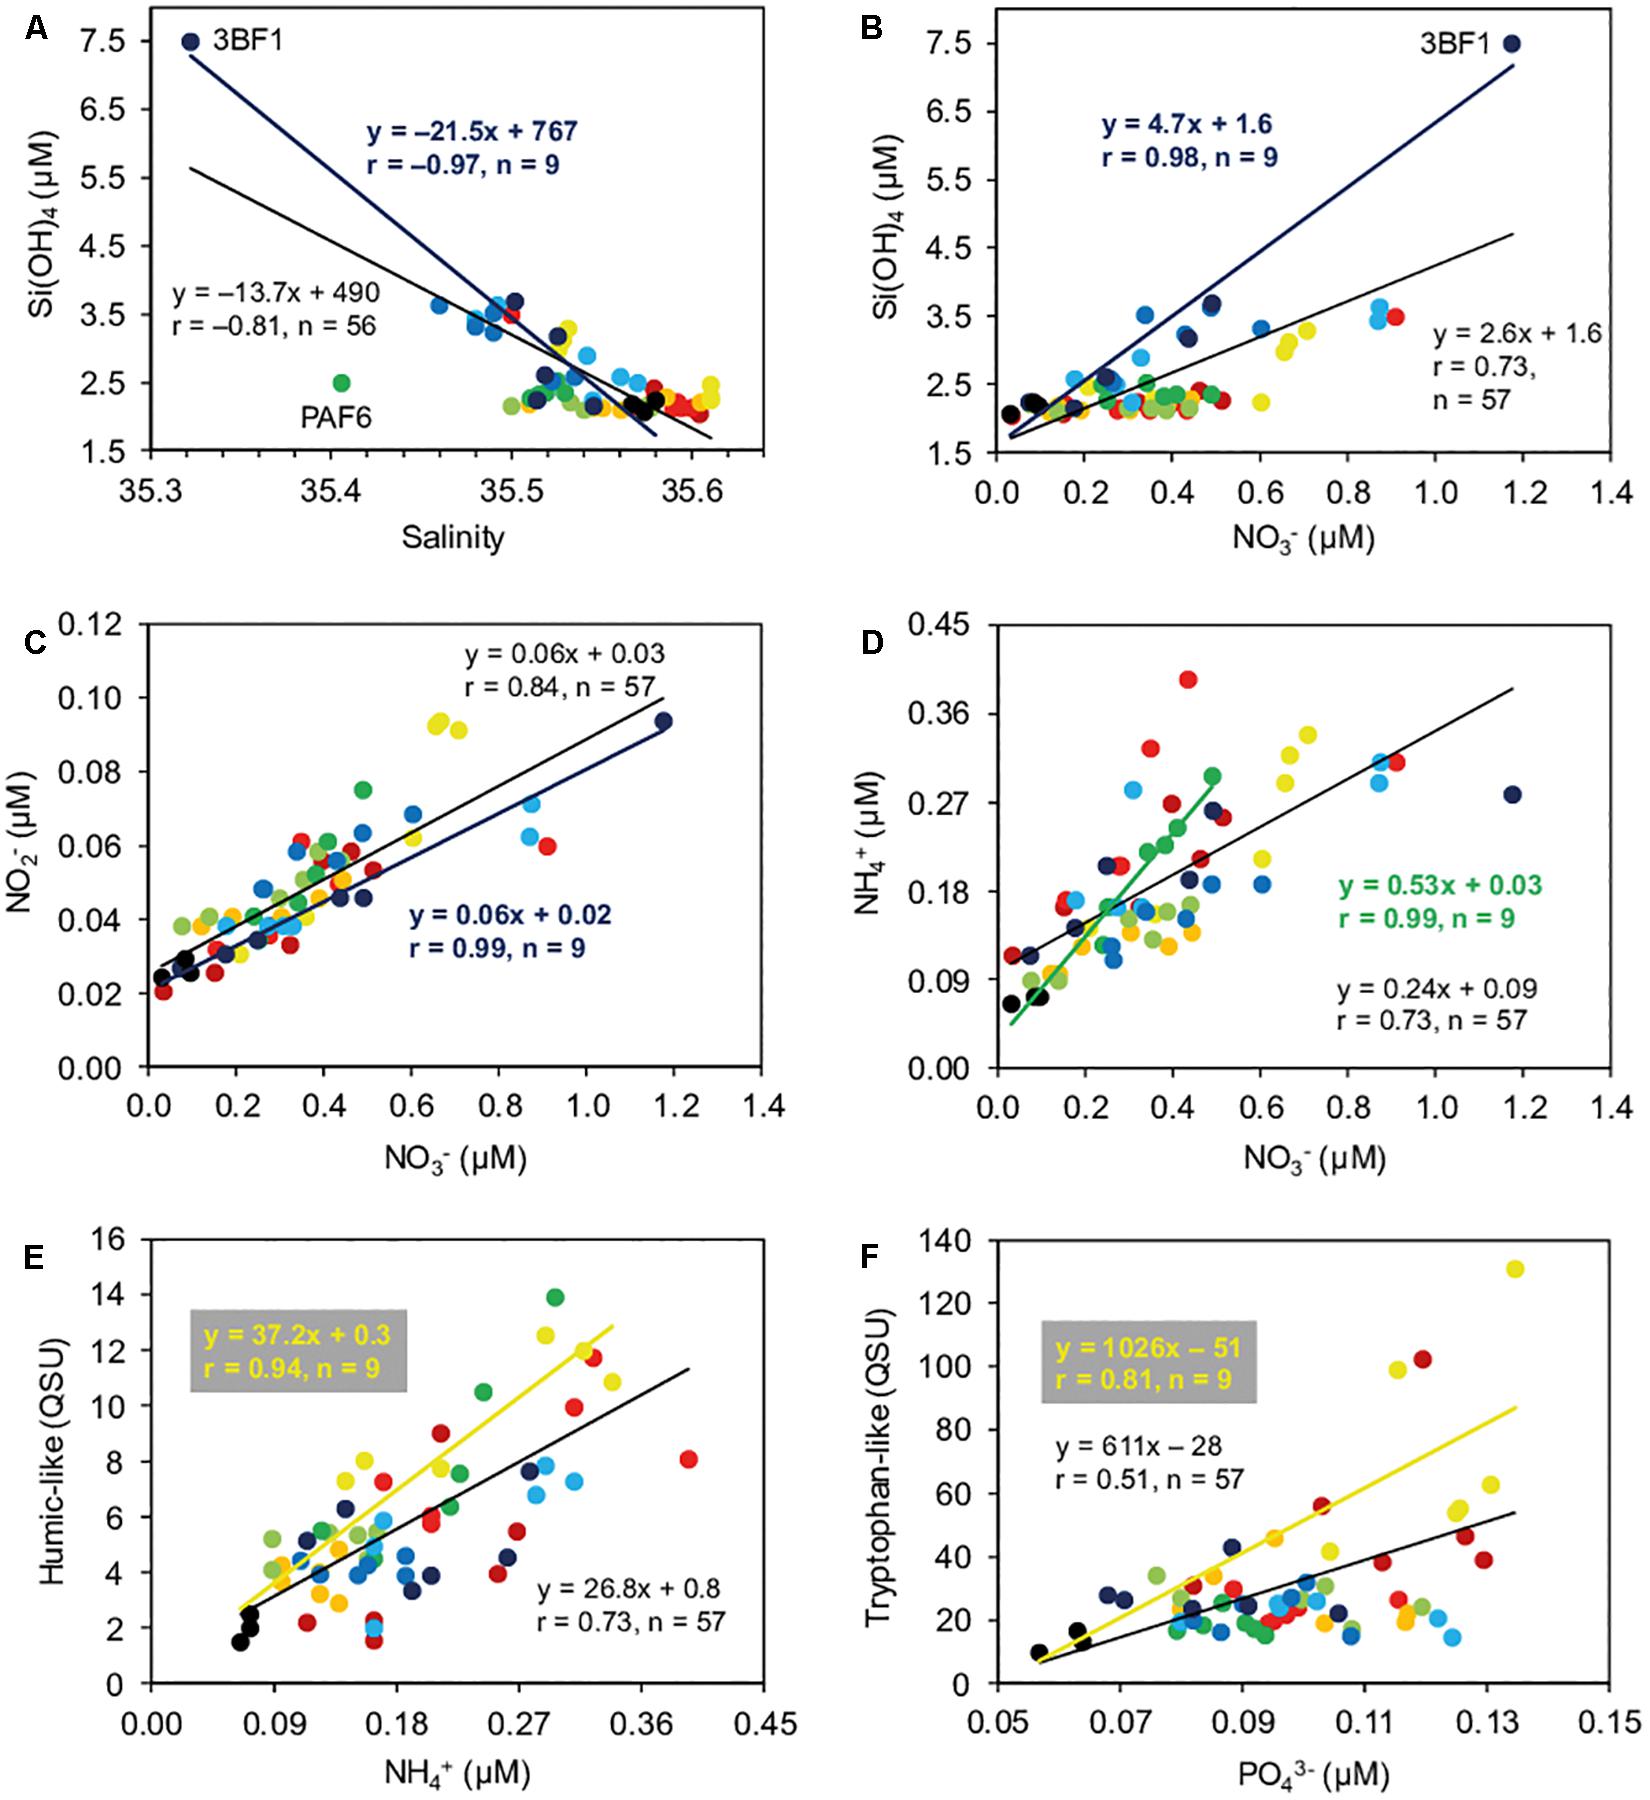
Figure 5. Relationships (Pearson correlations) between salinity and silicate [Si(OH)4] concentration (A), nitrate (NO3–) and Si(OH)4 concentrations (B), NO3– and nitrite (NO2–) concentrations (C), NO3– and ammonium (NH4+) concentrations (D), NH4+ concentration and fluorescence intensity of humic-like fluorophore (E), and phosphate (PO43–) concentration and the fluorescence intensity of tryptophan-like fluorophore (F) in fore reef and oceanic waters. Fore reef samples include SGF1-6 (dark red), PMF1-6 (red), TF1-6 (orange), HF1-6 (yellow), CFF1-6 (light green), PAF1-6 (green), BSF1-6 (light blue), SSF1-6 (blue), and 3BF1-6 (dark blue). Oceanic samples include PMO2, PAO1, and 3BO (black). Linear correlations involve all sites and samples [n = 56 or 57; black lines, for panels (A–F)], or only one site (the one displaying the highest correlation between variables of interest; see Supplementary Table S5) and the oceanic water samples: 3BF and oceanic water samples [dark blue lines, for panels (A–C)], PAF and oceanic water samples [dark green line, for panel (D)], or HF and oceanic water samples [yellow lines, for panels (E,F)].
The correlations between NO3–, NO2–, NH4+, and humic-like fluorescence were significant for all sites (r = 0.64–0.99, n = 9, p < 0.05) (Supplementary Table S5), with the highest correlations found for 3BF (NO3– vs. NO2–; Figure 5C), PAF (NO3– vs. NH4+; Figure 5D), or HF/PAF (NH4+ vs. humic-like; Figure 5E). Concerning the relationships between NH4+ and humic-like fluorescence, the regression slope values for sites HF and PAF (37 and 45, respectively) (Supplementary Table S5 and Figure 5E) were in the same range than the humic-like/NH4+ concentration ratio found in freshwaters containing significant amounts of humic matter, except the Hermitage River (i.e., SL, SGR, and 3BR; ratios: 16–69).
Regarding the relationships between PO43– concentration and tryptophan-like fluorophore, the highest correlations were observed for SGF, PMF, and HF sites, all located in the northern part of the reef (r = 0.70–0.81, n = 9, p < 0.05) (Supplementary Table S5 and Figure 5F).
The contributions of benthic communities to the coverage of the substratum onto the reef slope at 10-m depth (corresponding to fore reef samples n° 4) are displayed Figure 6. Benthic species were gathered into six categories: mixed algal assemblages, colonizing the limestone and dead corals, coralline algae, Acropora, non-Acropora corals, and soft corals, as well as abiotic substrate, which integrates sand and rubbles. Evaluation of coral categories gives information on structural and functional traits of communities.
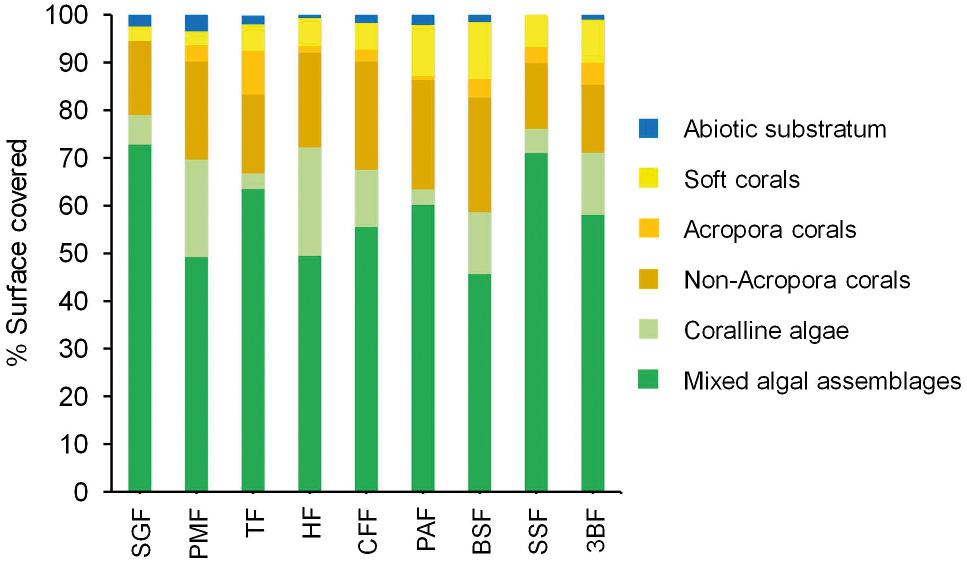
Figure 6. Contribution of benthic communities to the coverage of the substratum (expressed in % of total surface) onto the reef slope at 10-m depth (corresponding to fore reef samples n° 4) from north (SGF) to south (3BF).
Benthic communities were clearly dominated by algal formations that accounted for 59% (BSF) to 79% (SGF) of total community. Hard corals (Acropora and non-Acropora) represented only from 16% (SGF) to 28% (BSF) of total community (Figure 6). The communities thus appeared to be very homogeneous over the entire outer slope of La Saline reef, in agreement with other regular Global Coral Reef Monitoring Network survey (GCRMN) results. The highest algal coverages were observed south of the Saint Gilles harbour (SGF) and near the Hermitage (HF) and Trois-Bassins passes (SSF, 3BF). Although globally homogeneous from one site to another, the benthic communities differed in the respective composition of the algal formations. Indeed, SGF, TF, PAF, and SSF sites were characterized by a lower proportion of coralline algae (∼3–6%) compared to the other sites (12–23%). In addition, corals were essentially present at TF, PAF, and BSF with Acropora mainly found at TF (Figure 6). Non-Acropora, dominant at CFF, PAF, and BSF, were mostly represented by shifted coral species: Astreopora myriophtalma, Porites spp. and Pocillopora spp.
The compositions of basalt layer groundwater (BL) and sand layer groundwater (SL) observed here (Figure 2 and Supplementary Figure S1) are in accordance with those reported by Tedetti et al. (2011). They both displayed high Si(OH)4 concentrations as a result of the basaltic bedrock weathering, whereas only BL presented high concentrations of NO3– as well as a depletion in DOM and reduced nitrogen. The high NO3– content in BL has been proposed to be related to inputs via rainwaters during the transit of groundwater in an agriculture-dominated catchment area. Effectively, groundwater in La Réunion is mainly affected by domestic or livestock effluents (Rogers et al., 2012). On La Saline watershed, NO3– contamination was hypothesized to be of agricultural origin (livestock), because NO3– infiltration occurred at an altitude where dominant land use activity is livestock farming (Rogers et al., 2012). Fuelled at its base by BL, SL is also fed from the surface by rainwaters and runoffs, allowing the entrance of OM and thus its enrichment in DOM and humic-like material. Moreover, SL presented salinities of 5.7–6.0, suggesting a contamination by marine waters through the rise of the salt wedge during swell events. These marine intrusions in SL may contribute to the decrease in Si(OH)4 and PO43– with respect to BL, while the almost complete disappearance of NO3– may be presumably due to denitrification (Figure 2 and Supplementary Figure S1). The high content in humic-like material in SL, HR, and 3BR reflected the presence of terrestrial DOM, derived from soil or higher plants (Fellman et al., 2010; Ishii and Boyer, 2012; Tedetti et al., 2012).
Saint Gilles River presented a biogeochemical composition close to that of BL (Figure 2 and Supplementary Figure S1), from which it originates. Indeed, SGR, which is one of the numerous rivers that drain the western flank of the “Piton des Neiges” from 2390 m altitude to the sea, has four basins at different levels from upstream to downstream. These basins are resurgences of BL groundwater escaping from the rock, falling in cascade or going up by the bottom. Although Trois-Bassins River (3BR) is known to be fed by BL (Guigue et al., 2015), its biogeochemical characteristics were much closer to those of SL (Figure 2 and Supplementary Figure S1). 3BR presented low values of Si(OH)4, NO3–, and PO43– very likely due to mixing with marine waters, as shown by the high salinities occurring during swell events. On the other hand, 3BR was enriched in DON, NO2–, NH4+, and DOM of terrigenous origin (humic-like) compared to BL and SGR. Its high levels of NH4+ and NO2– are presumably related to the bacterial decomposition of OM.
Hermitage River (HR), which drains SL in the Hermitage sector, presented a high content in terrigenous DOM, as SL and 3BR, and was significantly enriched in DON, tryptophan-like fluorophore and urea compared to all other freshwater bodies, and was also enriched in PO43– compared to SL and the two other rivers (Figure 2 and Supplementary Figure S1). This enrichment was the sign of anthropogenic pollution through the discharge in the river of a treated wastewater effluent (Tedetti et al., 2011). Actually, the Hermitage wastewater treatment plant, which has a capacity of 25,000 equivalent inhabitants, treats wastewaters from Saint Gilles and Trois-Bassins areas, and releases in HR about 40% of its (tertiary) treated wastewaters1. It has been shown that treated and untreated wastewaters contain high amounts of tryptophan-like material (see review by Carstea et al., 2016). Various wastewater organic components could contribute to this tryptophan-like fluorescence signature, such as aromatic amino acids (tryptophan), degradation products of lignin, indoles and aromatic hydrocarbons (Carstea et al., 2016).
We identified BL groundwater as main source of freshwater, Si(OH)4 and NO3– in back reef waters, impacting extensively the southernmost part of the reef (GTB, TEB), and in a lesser extent PAB site, located further north. At these sites, the influence of BL substantially decreased from the beach to the reef flat (Figure 3, Supplementary Figures S2–S5, and Supplementary Tables S3, S4). This is in agreement with previous observations concerning resurgences of BL groundwater in the south of La Saline reef (Cuet et al., 1988; Join et al., 1988; Tedetti et al., 2011) or in other reef environments (Paytan et al., 2006; Bowen et al., 2007; Street et al., 2008). Due to the water circulation in the back reef zone, BL groundwater discharged in the southern part of the reef advects northward, parallel to the beach, in a buoyant plume of ∼ 20-m wide (Cuet et al., 2011). The average groundwater discharge along the coast is estimated to be 2.8 m3 d–1 m–1 of shoreline (Join et al., 1988). Humic-, and tryptophan-like fluorophores displayed a high spatial variability in the southern part of the reef (Figure 3), reflecting probably in situ biological production in back reef waters due to the NO3–-induced eutrophication, as previously pointed out (Para et al., 2010; Tedetti et al., 2011). Direct inputs from BL are unlikely, as DOM content of BL was low, especially compared to that of SL and HR.
While several works have also reported the evidence of freshwater inputs in the back reef zone (Cuet et al., 2011; Zubia et al., 2018), to our knowledge, the present study is the first one that shows the influence of freshwaters in the outer slope/fore reef waters of La Saline fringing area. Salinity and Si(OH)4 exhibited a significant inverse correlation for sites PMF, HF, PAF, BSF, SSF, and 3BF. This correlation was particularly high for southern sites BSF-3BF and surface waters (Figure 5A and Supplementary Table S5). The salinity-Si(OH)4 relationship thus represents a first marker of the freshwater discharge in the fore reef waters. These freshwater discharges were more pronounced in the southern stations and surface waters (Supplementary Figures S6B,E), while they were not clearly identified in sites SGF, TF and CFF, neither detected close to the slope at 5–20-m depth (Figure 4B and Supplementary Table S5), as we could have also expected. One possible reason would be that such inputs, if occurring in depth along the slope, would be of very low flowrates in absence of heavy rains (our case) and hence too difficult to catch, either with CTD measurements (Supplementary Figures S5D,E) or with sampling by divers. Although the passes serve as outlets for the waters that have passed through the back reef zone, the freshwater discharges observed here in surface waters at several sites were not only located in front of them. This suggests that additional physical processes were involved in the transfer of waters from the back reef to the fore reef zone, such as swell and the tidal currents (Cuet et al., 2011).
The highest correlations between NO3–, Si(OH)4 and salinity were observed in the southernmost sites (BSF, SSF, 3BF) (Figure 5B), suggesting a mixture of oceanic waters and nitrate-rich freshwaters. Moreover, the Si(OH)4/NO3– ratios in these southern sites were of the same order of magnitude than those recorded in BL (Figure 5B). This confirms that the southern part of the fore reef zone was mainly impacted by BL, which is in accordance with what we observed in the back reef zone (Supplementary Figure S4). Sedimentary formations are poorly developed in this area, and Trois-Bassins River did not contain NO3– in significant amounts (Figure 2C). Also, the content of humic-like material, which was the main signature of the most superficial freshwaters (SL and rivers, except SGR; Figure 2J), was not very high in the southern part of the reef (Figure 4J). We therefore propose to use the relationships between salinity, Si(OH)4 and NO3– to identify and track basalt groundwater discharges in back and fore reef waters (Figures 5A,B and Supplementary Figure S3).
Nevertheless, like NO2–, the spatial distribution of NO3– was not merely driven by freshwater discharges in surface waters. In fact, many samples with a Si(OH)4 content close to that of oceanic waters presented a clear enrichment in NO3– (for instance SGF, PMF, TF, CFF; Figures 4B,C). Regarding the correlations between NO3–, NO2–, and NH4+ (Figures 5C,D and Supplementary Table S5), this NO3– enrichment seemed to come from an incomplete nitrification of NH4+, derived from another source, or produced in situ by biological communities (Cuet et al., 2011). As a result, the sources of NO3– in fore reef waters appear multiple (BL groundwater, nitrification…) and may possibly be superimposed. This can contribute to the relative homogeneity of the NO3– content on the different radials.
The humic-like material reported here, i.e., peaks A + M/component 3 in the Ishii and Boyer (2012)’s classification, has been found in various aquatic environments (Coble, 2007; Fellman et al., 2010; Ishii and Boyer, 2012). It may be of terrestrial origin (derived from soil or higher plants OM) but also come from the transformation of OM formed on the reef, for example in sediments (Burdige et al., 2004; Blanco et al., 2008; Dang et al., 2014). This latter factor may contribute to the overall increase in humic-like concentrations in fore reef waters relative to the oceanic environment, but is unlikely to explain the significant variations observed between sites (Figure 4J). On the other hand, humic-like fluorophore presented the highest concentrations in the most superficial freshwater bodies, except SGR (i.e., SL, HR, and 3BR), while its concentrations in the basalt aquifer were very low (Figure 2J). Consequently, we may probably consider the humic-like material as a good tracer of sand groundwater (SL), and more generally of stagnant and/or superficial freshwaters, such as HR and 3BR. Interestingly, Kaushal et al. (2020) have shown that this (terrestrial) humic-like material was readily incorporated in coral skeletons, suggesting that coral cores may have the potential to reconstruct past variations in freshwater fluxes.
On the outer slope, humic matter was much more abundant at the surface than at the bottom (Supplementary Figure S7K), suggesting that the contributions occurred in the shallow back reef/reef flat area. Leze (2012) has shown that exchanges between SL and back reef waters occurred in particular due to the rise of the salt wedge during swell events. Indeed, after the rise event, the piezometric level of SL goes down slowly, carrying into the back reef zone waters loaded in compounds (such as humic-like material) present in sedimentary formations (Leze, 2012). Accordingly, the contents in humic-like material were particularly high in sites PMF, HF, and PAF (impacted by SL/HR) compared to the southernmost sites (impacted by BL) (Figure 4J).
Humic-like fluorophore was well correlated to NH4+ concentration. Since NH4+ concentrations were quite low in freshwaters, even in SL (∼20 μM) (Figure 2E), we may assume that NH4+ was probably not issued from direct SL or HR inputs. A contribution of NH4+ produced by reef flat communities (Cuet et al., 2011) is likely in sites where reef water flows back to open sea through passes and outlets. This contribution may be predominant in the southernmost sites (Figure 5E), and especially 3BF where the correlation between humic-like and NH4+ was relatively low, although significant (Supplementary Table S5). In contrast, high correlations were observed at PMF, HF, and PAF (Figure 5E) suggesting that NH4+ in fore reef waters may be produced from the photo-oxidation of DOM/humic-like material (Bushaw-Newton and Moran, 1999; Stedmon et al., 2007) or from its bacterial degradation followed by the subsequent excretion activity of grazer organisms (Carlsson et al., 1995). Overall, humic-like material, either issued from direct SL or HR inputs or of reef origin, appeared to be a source of nitrogen to the reef slope. SL or HR inputs of humic-like matter could be particularly significant in the northern part of the reef, where NO3–-enrichment through BL inputs was not recorded.
Phosphate concentration and tryptophan-like fluorescence exhibited high correlations and the highest values in SGF and HF sites (Figures 4F,K, 5F). This does not seem to be attributable to the biological activity of the reef communities. Although the southern part of the back reef zone was enriched in tryptophan-like (Figure 3G) due to the BL intrusions and subsequent in situ production of OM (Para et al., 2010; Tedetti et al., 2011), the resulting tryptophan export at the Trois-Bassins pass and in the southern fore reef waters was very weak (Figure 4K). In addition, low PO43– concentrations were observed at the Trois-Bassins pass (Figure 4F), presumably as a result of this OM production that was accompanied by a consumption of PO43– on the reef flat (Cuet et al., 2011).
Within freshwaters, it is only in HR that are found high concentrations of both PO43– and tryptophan (Figures 2F,K). As mentioned above, HR is impacted by a treated wastewater effluent and other domestic effluents, which accounts for its high amounts of tryptophan-like material (Carstea et al., 2016). It has been observed significant correlations between tryptophan-like and PO43– in river and marine waters affected by wastewater effluents (Baker and Inverarity, 2004; Tedetti et al., 2012). Hence, the correlations found here between tryptophan-like fluorescence and PO43– concentration in SGF and HF may be the sign of wastewater pollution, which was confirmed by the analysis of the isotopic composition of nitrate nitrogen in the Hermitage River (Andral et al., 2010). In SGF, this wastewater pollution was probably not issued from SGR, which displayed low contents of tryptophan-like and PO43– (Figures 2F,K), but rather from the Saint Gilles harbor or inputs from septic tanks. From these observations, we put forward the use of the relationships between tryptophan-like and PO43– to identify and track wastewater inputs in back and fore reef waters (Figure 5F).
Dissolved organic carbon, DON and urea spatial distribution was not influenced by freshwaters discharges in surface waters (Figures 4G–I and Supplementary Figures S7A–I). Urea concentration in freshwaters was much too low (Figure 2I). While DON concentrations in fore reef waters were in the same range that those in oceanic waters (Figure 4H), DOC concentrations in fore reef waters were even lower than those in oceanic waters, except for BSF2 sample (Figure 4G). Therefore, DOC, DON, and urea did not represent relevant tracers of freshwaters in the reef environment.
In back reef waters, phytoplankton total biomass was assessed through a proxy commonly used, CTD TChl a concentrations (Supplementary Figure S2), which showed lowest levels north of the Hermitage pass (Figure 3H) where freshwater inputs were not observed (Figure 3A). In fore reef waters, TChl a was opposed to salinity on the second axis of the PCA (Supplementary Figure S8), and the spatial distribution of TChl a (Figure 4L and Supplementary Figure S7R) was therefore roughly reflecting inputs of freshwaters (Figure 4A and Supplementary Figure S6C). These results underline some eutrophication of the southern part of the reef, both in the back reef area as already reported (Cuet et al., 2011; Tedetti et al., 2011; L’Helguen et al., 2014) and in fore reef waters. However, the TChl a distribution pattern did not follow faithfully the distribution pattern of NO3– or other nutrients (Figures 4C–F). High TChl a concentrations were not only recorded in the southernmost sites under the direct influence of the NO3–-rich BL, but also in CMB (back reef) and PAF (fore reef). Conversely, TChl a was very low in HF, while this site was clearly enriched in nutrients due to the influence of the Hermitage River. This discrepancy between the levels of nutrients and TChl a concentrations in HF could reflect an inhibition of photosynthesis by the presence of toxic compounds carried by the Hermitage River, as described through the Aquatic Ecosystem Sustainability Index of toxicity proposed by Barinova (2007). Thus, phytoplankton biomass was not only driven by nutrient inputs in reef waters. Interestingly, we found similar distributions of TChl a and Pheo a concentrations (data not shown for Pheo a), with a strong positive correlation between both (r = 0.92, n = 56, p < 0.05). This emphasizes the strong coupling between phytoplankton biomass and grazing or photo-oxidation processes in fore reef waters.
In the present work, benthic community structure was not determined in the back reef zone. Nonetheless, previous studies showed that all back reef sites, except TB (unaffected by freshwaters), exhibit a decrease in living coral cover, and specifically Acropora communities, to the benefit of fleshy algae communities (Mioche and Cuet, 1999; Chazottes et al., 2002; Bruggemann et al., 2008; Naïm et al., 2013; Tourrand et al., 2013; Bigot et al., 2016; Zubia et al., 2018; Nicet et al., 2019). In the same way, over the outer reef slope, a massive presence of algal formations was observed, in particular of mixed algal assemblages, together with a low coral coverage (Figure 6). This trend, i.e., algal formations colonizing bio-constructed substrate and dead corals at the expense of bio-builders (coral species and coralline algae), has been reported in various reef ecosystems (McManus and Polsenberg, 2004; McClanahan et al., 2007; Norström et al., 2009; Bonaldo and Bellwood, 2011). These observations highlight a profound imbalance of the reef environment whatever the outer slope zone considered. This spatio-temporal evolution of benthic communities has been shown for the both sentinel sites of TF and PAF during the 1998–2012 period in the context of the GCRMN survey (Bigot, 2008; data for 2012 from the present study) and confirmed during the last period 2012–2019 (Nicet et al., 2019). Results show that the current trend is part of a regression in the temporal dynamics of corals, explaining the relative homogeneity of benthic community’s health on the outer slope.
Freshwaters, enriched in nutrients and/or OM may reach the fore reef/outer slope environment in two ways. First, they may discharge into the back reef zone before being taken up by the passes (or outlets areas) and dispersed over the outer slope under the effect of tidal currents (the “surface pathway”). Secondly, they may discharge directly on the outer slope at 5–10 m depth through the basalt groundwater complex (the “ground pathway”). Our results indicate that freshwaters mainly reached the outer slope via the surface pathway, while the ground pathway was not really observed (Figure 1). These freshwaters coming from the back reef zone also carried dissolved and particulate OM synthesized on the reef flat, as well as dissolved inorganic nitrogen, in the form of NH4+, and then affected the benthic communities by diffusion or homogenisation of waters. This explains that high algal coverage rates were more particularly observed around passes, i.e., Hermitage pass (HF site, affected by HR and SL) and north of Trois-Bassins pass (SSF, 3BF sites, affected by BL) (Figure 6). A high algal coverage rate was also found in SGF albeit this site was one of those the less affected by freshwaters (BL and SL). Nonetheless, SGF, like HF, was enriched in tryptophan-like material and PO43– attributable to a wastewater pollution. TF and CFF sites, which were not under the influence of freshwaters, also presented significant rates of algal coverage (Figure 6). For several years, high levels of PO43– have been detected very regularly on TB reef flat (Cuet, 1989). These have been attributed to a regeneration of dissolved and/or particulate OM mainly issued from the Hermitage pass and secondly transported to TB reef flat by the north tidal current. Tryptophan-like fluorophore has never been measured in parallel, but these high PO43– concentrations could be a sign of a wastewater contamination north of the Hermitage pass. In addition, Guigue et al. (2015) have shown that the concentrations in dissolved PAHs were high in TF and CFF sites. Abundant in SSF as well, dissolved PAHs could reflect the presence of sporadic basalt groundwater discharges. The latter could thus affect TF, and to a lesser extent, CFF, in depth outer slope (20–30 m) according to the hypothesis exposed by Join et al. (1988).
It is clear that the freshwater signatures observed mainly in surface waters essentially masked the signal related to the resurgences on the outer slope itself. The resulting nutrient inputs were apparently diffuse, and could be largely assimilated by the algae benthic communities. The potential influence of selected environmental variables on benthic communities in fore reef waters/reef slope was investigated through a CCA (Figure 7). CCA did not reveal any clear influence of environmental parameters on the distribution of corals and mixed algal assemblages. This is not very surprising given the relatively spatial homogeneity of benthic community structure onto the entire slope (Figure 6). However, CCA pointed out an effect of NO3–, NH4+, and humic-like fluorophore on the distribution of coralline algae (Figure 7). In other word, the increase in coralline algae abundance may be explained by the increase in NO3– and NH4+ concentrations, and humic-like material. This is rather in accordance with the model of relative dominance proposed by Littler and Littler (1984) in which coralline algae are favored within reef benthic communities in conditions of moderate-to-high N-nutrient concentrations (while high levels of PO43– may on the contrary reduce their calcification and growth), coupled to conditions of moderate-to-intense grazing or heavy wave exposure.
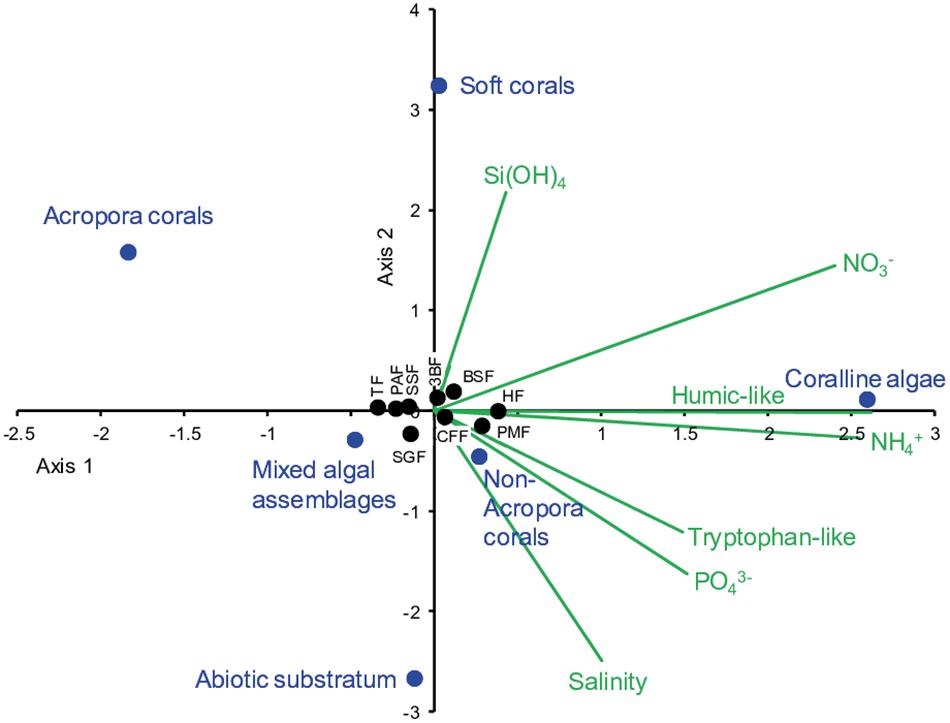
Figure 7. Canonical correspondence analysis applied on some selected environmental variables (salinity, Si(OH)4, NO3–, NH4+, PO43–, humic-like, tryptophan-like fluorophores) and benthic communities (mixed algal assemblages, coralline algae, Acropora corals, non-Acropora corals, soft corals, abiotic substratum) recorded in fore reef waters/reef slope. For salinity and biogeochemical parameters, the mean values of samples n° 1–6 were used.
This study highlights the discharges of basalt (volcanic) groundwater in the southern part, and in a lesser extent, the discharges of sand (sedimentary) groundwater and Hermitage River waters in sites located northward, in both back and fore reef areas of La Saline ecosystem. These discharges mostly impacted fore reef area in surface waters through water transfer from the back reef zone allowed by physical processes (swells, tidal currents) (“surface pathway”). On the other side, basalt groundwater resurgences at 5–20-m depth on the outer slope itself (“ground pathway”) were not clearly detected, due to the diffuse character of these discharges through the basaltic underground/reef transfer, and probably to masking by the freshwater signatures observed in surface waters. Here we propose to use the relationship Si(OH)4/NO3– to identify and track basalt groundwater discharges, but also the relationships humic-like fluorescence/NH4+ and tryptophan-like fluorescence/PO43– to identify and track sand groundwater discharges and wastewater pollutions, respectively, in reef waters. Besides freshwater discharges, the biogeochemistry of fore reef waters was very likely influenced by autochthonous processes occurring in back reef zone, enhanced or not by freshwater inputs, such as OM bacterial degradation, grazing, photo-oxidation and nitrification. Our results put forward the eutrophication of the southern part of the back and fore reef waters with higher phytoplankton biomasses, even though the latter were not only driven by nutrient inputs. Moreover, a massive presence of algal formations together with a low coral coverage was observed over the outer reef slope, emphasizing the degradation of the reef ecosystem. The spatial homogeneity of the benthic community structures onto the slope contrasted with the spatial heterogeneity of chemical variables in water. This reflects the different spatial and temporal scales involved in biological and chemical processes. In this work, we focused on a summer period for Réunion Island. Future studies taking into account the temporal (seasonal) dimension will undoubtedly help to understand the impact of freshwater discharges and hydrodynamics on the reef biogeochemistry and ecology.
The raw data supporting the conclusions of this article will be made available by the authors, without undue reservation.
All authors have participated to the design of the study and sampling/field work and contributed to data treatment. LB and JT were particularly involved in the sampling of water and observation and analysis of benthic communities along the reef slope/in fore reef waters. CG, MG, MT, NF, and PC performed sampling and in situ measurements in freshwaters, back reef and oceanic waters, as well as the analyses of biogeochemical parameters. MT wrote the original manuscript. LB, JT, CG, NF, MG, and PC participated to its writing, reviewing and/or editing.
This work was funded by the Ministère des Outre-Mer (MOM) – La Réunion and received the support of the Réserve Naturelle Marine de La Réunion (RNMR). It was also supported by the “IBISCUS” research project, which was funded by the Agence Nationale de la Recherche (ANR) – ECOTECH program (project ANR-09-ECOT-009–01), Aix-Marseille University (AMU) and CNRS.
The authors declare that the research was conducted in the absence of any commercial or financial relationships that could be construed as a potential conflict of interest.
We are grateful to P. Durville and its crew from the Aquarium de La Réunion for their help and assistance in the sampling aboard the R/V Explorer. We thank B. Charrière (MIO) for DOC analyses, C. Bachet (MIO) for FDOM analyses, as well as P. Raimbault and N. Garcia (the MIO-PAPB platform) for TChl a and Pheo a analyses. We acknowledge J. L. Join and J. Leze for their help in sampling groundwater. We are also grateful to two reviewers for their relevant comments and corrections.
The Supplementary Material for this article can be found online at: https://www.frontiersin.org/articles/10.3389/fmars.2020.596165/full#supplementary-material
Ahamada, S., Bijoux, J., Cauvin, B., Hagan, A., Harris, A., Koonjul, M., et al. (2008). “Status of coral reefs in the South–West Indian Ocean Island States: comoros, madagascar, mauritius, reunion, seychelles,” in Status of Coral Reefs of the World: 2008, ed. C. Wilkinson (Townsville: Global Coral Reef Monitoring Network and Reef and Rainforest Research Center), 73–86.
Aminot, A. (1983). “Eléments nutritifs minéraux dissous,” in Manuel des Analyses Chimiques en Milieu Marin, eds A. Aminot and M. Chaussepied (Brest: Centre national pour l’exploitation des océans (CNEXO)), 93–150.
Aminot, A., and Kerouel, R. (2007). “Dosage automatique des nutriments dans les eaux marines : méthodes en flux continu,” in Méthodes D’analyse En Milieu Marin, ed. Ifremer (Brest: CNEXO).
Andral, B., Gonzalez, J. L., Cuet, P., Bigot, L., Turquet, J., and Nicet, J. B. (2010). Caractérisation De L’état De Référence Biologique Des Masses D’eau Côtières Au Regard De La Directive Cadre Sur L’eau. Rapport IFREMER/ARVAM/ECOMAR/PARETO, RST.DOPLER/PAC/10-16. Available online at: https://archimer.ifremer.fr/doc/00028/13914/.
Baker, A., and Inverarity, R. (2004). Protein-like fluorescence intensity as a possible tool for determining river water quality. Hydrol. Process. 18, 2927–2945. doi: 10.1002/hyp.5597
Ban, S. S., Graham, N. A., and Connolly, S. R. (2014). Evidence for multiple stressor interactions and effects on coral reefs. Glob. Change Biol. 20, 681–697. doi: 10.1111/gcb.12453
Barinova, S. (2007). On the classification of water quality from an ecological point of view. Int. J. Environ. Sci. Nat. Resour. 2:555581. doi: 10.19080/IJESNR.2017.02.555581
Barth, A., Alvera Azcarate, A., Troupin, C., Ouberdous, M., and Beckers, J.-M. (2010). A web interface for griding arbitrarily distributed in situ data based on data-interpolating variational analysis (DIVA). Adv. Geosci. 28, 29–37. doi: 10.5194/adgeo-28-29-2010
Bigot, L. (2008). Evolution Spatio-Temporelle De La Biodiversité Et De La Structure Des Communautés Benthiques Entre 1998 Et 2008 Sur Les Stations Sentinelles Gcrmn De La Réunion. Paris: APMR.
Bigot, L., Bruggemann, H., Cadet, C., Cauvin, B., Chabanet, P., Durville, P., et al. (2016). Point 1 du suivi de ≪l’effet réserve≫ sur les communautés ichtyologiques et benthiques récifales - Secteurs de St Gilles / La Saline et de Saint-Leu - Etat des lieux à 7 ans après la création de la Réserve Naturelle Nationale Marine de La Réunion. Fujairah: ECOMAR.
Blanco, A. C., Nadaoka, K., and Yamamoto, T. (2008). Planktonic and benthic microalgal community composition as indicators of terrestrial influence on a fringing reef in Ishigaki Island, Southwest Japan. Mar. Environ. Res. 66, 520–535. doi: 10.1016/j.marenvres.2008.08.005
Bonaldo, R., and Bellwood, D. (2011). Spatial variation in the effects of grazing on epilithic algal turfs on the Great Barrier Reef, Australia. Coral Reefs 30, 381–390. doi: 10.1007/s00338-010-0704-4
Bowen, J. L., Kroeger, K. D., Tomasky, G., Pabich, W. J., Cole, M. L., Carmichael, R. H., et al. (2007). A review of land–sea coupling by groundwater discharge of nitrogen to New England estuaries: mechanisms and effects. Appl. Geochem. 22, 175–191. doi: 10.1016/j.apgeochem.2006.09.002
Bruggemann, H., Guillaume, M., Bigot, L., Chabanet, P., Denis, V., Durville, P., et al. (2008). Mise En Oeuvre Du Suivi De L’effet Réserve : Développement Des Protocoles Et Établissement De L’état Initial De La Réserve Naturelle Nationale Marine De La Réunion (Secteurs De La Saline - Souris Blanche Et De Saint-Leu). Paris: UR/MNHN/AR/APMR.
Burdige, D. J., Kline, S. W., and Chen, W. (2004). Fluorescent dissolved organic matter in marine sediment pore waters. Mar. Chem. 89, 289–311. doi: 10.1016/j.marchem.2004.02.015
Bushaw-Newton, K. L., and Moran, M. A. (1999). Photochemical formation of biologically available nitrogen from dissolved humic substances in coastal marine systems. Aquat. Microb. Ecol. 18, 285–292. doi: 10.3354/ame018285
Carlsson, P., Graneli, E., Tester, P., and Boni, L. (1995). Influences of riverine humic substances on bacteria, protozoa, phytoplankton, and copepods in a coastal plankton community. Mar. Ecol. Prog. Ser. 127, 213–221. doi: 10.3354/meps127213
Carstea, E. M., Bridgeman, J., Baker, A., and Reynolds, D. M. (2016). Fluorescence spectroscopy for wastewater monitoring: a review. Water Res. 95, 205–219. doi: 10.1016/j.watres.2016.03.021
Chauvin, A., Denis, V., and Cuet, P. (2011). Is the response of coral calcification to seawater acidification related to nutrient loading? Coral Reefs 30, 911–923. doi: 10.1007/s00338-011-0786-7
Chazottes, V., Le Campion-Alsumard, T., Peyrot-Clausade, M., and Cuet, P. (2002). The effects of eutrophication-related alterations to coral reef communities on agents and rates of bioerosion (Reunion Island, Indian Ocean). Coral Reefs 21, 375–390. doi: 10.1007/s00338-002-0259-0
Clavier, J., Chauvaud, L., Cuet, P., Esbelin, C., Frouin, P., Taddei, D., et al. (2008). Diel variation of benthic respiration in a coral reef sediment (Reunion Island, Indian Ocean). Estua. Coast. Shelf Sci. 76, 369–377. doi: 10.1016/j.ecss.2007.07.028
Coble, P. G. (2007). Marine optical biogeochemistry: the chemistry of ocean color. Chem. Rev. 107, 402–418. doi: 10.1021/cr050350
Conand, C., Chabanet, P., Cuet, P., and Letourneur, Y. (1997). “The carbonate budget of a fringing reef in La Reunion Island (Indian Ocean): sea urchin and fish bioerosion and net calcification,” in Proceedings of the 8th International Coral Reef Symposium, eds H. A. Lessios and I. G. Macintyre (Panama: Smithsonian Tropical Research Institute), 953–958.
Conand, C., Lame, M., Quod, I.-P., Conand, F., and Turquet, J. (2000). “Bleaching in a Western Indian Ocean Island, La Réunion: a multi-scale approach,” in Proceedings of the 9th International Coral Reef Symposium, eds M. K. Moosa, S. Soemodihardjo, A. Soegiarto, K. Romimohtarto, A. Nontji, and S. Suharsono (Bali: Indonesian Institute of Sciences, International Society for Reef Studies), 1155–1160.
Cordier, E. (2007). Processus Physiques et Sédimentaires En Milieu Récifal : Application aux Récifs Frangeants de l’Hermitage/La Saline, Ile de La Réunion. Ph.D. thesis, Université de la Réunion, Saint-Denis.
Cordier, E., Lézé, J., and Join, J.-L. (2013). Natural tidal processes modified by the existence of fringing reef on La Reunion Island (Western Indian Ocean): impact on the relative sea level variations. Continent. Shelf Res. 55, 119–128. doi: 10.1016/j.csr.2013.01.016
Cuet, P. (1989). Influence Des Résurgences D’eaux Douces Sur Les Caractéristiques Physico-Chimiques Et Métaboliques De L’écosystème Récifal À La Réunion (Océan Indien). Ph.D. thesis, Université d’Aix Marseille III, Marseille.
Cuet, P., Atkinson, M. J., Blanchot, J., Casareto, B. E., Cordier, E., Falter, J., et al. (2011). CNP budgets of a coral dominated fringing reef at La Réunion, France: coupling of oceanic phosphate and groundwater nitrate. Coral Reefs 30, 45–55. doi: 10.1007/s00338-011-0744-4
Cuet, P., Naïm, O., Faure, G., and Conan, J. Y. (1988). “Nutrient-rich groundwater impact on benthic communities of La Saline fringing reef (Reunion Island, Indian Ocean): preliminary results,” in Proceedings of the 6th International Coral Reef Symposium, Townsville, 207–212.
Dailer, M. L., Knox, R. S., Smith, J. E., Napier, M., and Smith, C. M. (2010). Using δ15N values in algal tissue to map locations and potential sources of anthropogenic nutrient inputs on the island of Maui, Hawai?i, USA. Mar. Pollut. Bull. 60, 655–671. doi: 10.1016/j.marpolbul.2009.12.021
Dang, D. H., Lenoble, V., Durrieu, G., Mullot, J.-U., Mounier, S., and Garnier, C. (2014). Sedimentary dynamics of coastal organic matter: an assessment of the porewater size/reactivity model by spectroscopic techniques. Estua. Coast. Shelf Sci. 151, 100–111. doi: 10.1016/j.ecss.2014.10.002
Dubinsky, Z., and Stambler, N. (1996). Marine pollution and coral reefs. Glob. Change Biol. 2, 511–526. doi: 10.1111/j.1365-2486.1996.tb00064.x
English, S., Wilkinson, C., and Baker, V. (1994). Survey Manual for Tropical Marine Resources. Townsville: Australian Institute of Marine Science.
Fabricius, K. E. (2005). Effects of terrestrial runoff on the ecology of corals and coral reefs: review and synthesis. Mar. Pollut. Bull. 50, 125–146. doi: 10.1016/j.marpolbul.2004.11.02
Fellman, J. B., Hood, E., and Spencer, R. G. M. (2010). Fluorescence spectroscopy opens new windows into dissolved organic matter dynamics in freshwater ecosystems: a review. Limnol. Oceanogr. 55, 2452–2462. doi: 10.4319/lo.2010.55.6.2452
Ferretto, N., Tedetti, M., Guigue, C., Mounier, S., Raimbault, P., and Goutx, M. (2017). Spatio-temporal variability of fluorescent dissolved organic matter in the Rhône River delta and the Fos-Marseille marine area (France, NW Mediterranean Sea). Environ. Sci. Pollut. Res. 24, 4973–4989. doi: 10.1007/s11356-016-8255-z
Fisher, R., O’Leary, R. A., Low-Choy, S., Mengersen, K., Knowlton, N., Brainard, R. E., et al. (2015). Species richness on coral reefs and the pursuit of convergent global estimates. Curr. Biol. 25, 500–505. doi: 10.1016/j.cub.2014.12.022
Goeyens, L., Kindermans, N., Abu Yusuf, M., and Elskens, M. (1998). A room temperature procedure for the manual determination of urea in seawater. Estua. Coast. Shelf Sci. 47, 415–418. doi: 10.1006/ecss.1998.0357
Guigue, C., Bigot, L., Turquet, J., Tedetti, M., Ferretto, N., Goutx, M., et al. (2015). Hydrocarbons in a coral reef ecosystem subjected to anthropogenic pressures (La Réunion Island, Indian Ocean). Environ. Chem. 12, 350–365. doi: 10.1071/EN14194
Hoegh-Guldberg, O., Poloczanska, E. S., Skirving, W., and Dove, S. (2017). Coral reef ecosystems under climate change and ocean acidification. Front. Mar. Sci. 4:158. doi: 10.3389/fmars.2017.00158
Hughes, T. P. (1994). Catastrophes, phase shifts and large-scale degradation of a Caribbean coral reef. Science 265, 1547–1551. doi: 10.1126/science.265.5178.1547
Hughes, T. P., Barnes, M. L., Bellwood, D. R., Cinner, J. E., Cumming, G. S., Jackson, J. B. C., et al. (2017). Coral reefs in the Anthropocene. Nature 546, 82–90. doi: 10.1038/nature22901
Ishii, S. K. L., and Boyer, T. H. (2012). Behavior of reoccurring PARAFAC components in fluorescent dissolved organic matter in natural and engineered systems: a critical review. Environ. Sci. Technol. 46, 2006–2017. doi: 10.1021/es2043504
Join, J.-L., Pommé, J.-B., Coudray, J., and Daesslé, M. (1988). Caractérisation des aquifères basaltiques en domaine littoral. Impact d’un récif corallien. Hydrogéologie 2, 107–115.
Kaushal, N., Yang, L., Tanzil, J. T. I., Lee, J. N., Goodkin, N. F., and Martin, P. (2020). Sub-annual fluorescence measurements of coral skeleton: relationship between skeletal luminescence and terrestrial humic-like substances. Coral Reefs 39, 1257–1272. doi: 10.1007/s00338-020-01959-x
Kim, G., Kim, J.-S., and Hwang, D.-W. (2011). Submarine groundwater discharge from oceanic islands standing in oligotrophic oceans: implications for global biological production and organic carbon fluxes. Limnol. Oceanogr. 56, 673–682. doi: 10.4319/lo.2011.56.2.0673
Kim, J., and Kim, G. (2017). Inputs of humic fluorescent dissolved organic matter via submarine groundwater discharge to coastal waters off a volcanic island (Jeju, Korea). Sci. Rep. 7:7921. doi: 10.1038/s41598-017-08518-5
Kleypas, J. A., McManus, J. W., and Menez, L. A. B. (1999). Environmental limits to coral reef development: where do we draw the line? Am. Zool. 39, 146–159. doi: 10.1093/icb/39.1.146
Koop, K., Booth, D., Broadbent, A., Brodie, J., Bucher, D., Capone, D., et al. (2001). ENCORE: the effect of nutrient enrichment on coral reefs. synthesis of results and conclusions. Mar. Pollut. Bull. 42, 91–120. doi: 10.1016/s0025-326x(00)00181-8
Lee, J., and Kim, G. (2015). Dependence of coastal water pH increases on submarine groundwater discharge off a volcanic island. Estua. Coast. Shelf Sci. 163, 15–21. doi: 10.1016/j.ecss.2015.05.037
Legendre, P., and Legendre, L. (1998). Numerical Ecology, 2nd Edn, Vol. 24. Amsterdam: Elsevier Science.
Lewis, J. B. (1987). Measurements of groundwater seepage flux onto a coral reef: spatial and temporal variations. Limnol. Oceanogry 32, 1165–1169. doi: 10.4319/lo.1987.32.5.1165
Leze, J. (2012). Modélisation De L’impact Des Forçages Océaniques Sur Les Nappes Côtières. Étude De L’ermitage (Île De La Réunion). Ph.D. thesis, Université de la Réunion, Saint-Denis.
L’Helguen, S., Chauvaud, L., Cuet, P., Frouin, P., Maguer, J. F., and Clavier, J. (2014). A novel approach using the 15N tracer technique and benthic chambers to determine ammonium fluxes at the sediment–water interface and its application in a back-reef zone on reunion Island (Indian Ocean). J. Exp. Mar. Biol. Ecol. 452, 143–151. doi: 10.1016/j.jembe.2013.12.001
Li, X., Wang, D., Huang, H., Zhang, J., Lian, J., Yuan, X., et al. (2015). Linking benthic community structure to terrestrial runoff and upwelling in the coral reefs of northeastern Hainan Island. Estua. Coast. Shelf Sci. 156, 92–102. doi: 10.1016/j.ecss.2014.09.021
Littler, M. M., and Littler, D. S. (1984). Models of tropical reef biogenesis: the contribution of algae. Prog. Phycol. Res. 3, 323–363.
Lubarsky, K. A., Silbiger, N. J., and Donahue, M. J. (2018). Effects of submarine groundwater discharge on coral accretion and bioerosion on two shallow reef flats. Limnol. Oceanogr. 63, 1660–1676. doi: 10.1002/lno.10799
Martias, C., Tedetti, M., Lantoine, F., Jamet, L., and Dupouy, C. (2018). Characterization and sources of colored dissolved organic matter in a coral reef ecosystem subject to ultramafic erosion pressure (New Caledonia, Southwest Pacific). Sci. Total Environ. 616–617, 438–452. doi: 10.1016/j.scitotenv.2017.10.261
McClanahan, T. R., Ateweberhan, M., Graham, N. A. J., Wilson, S. K., Sebastián, C. R., Guillaume, M. M. M., et al. (2007). Western Indian Ocean coral communities: bleaching responses, and susceptibility to extinction. Mar. Ecol. Prog. Ser. 337, 1–13. doi: 10.3354/meps337001
McMahon, A., and Santos, I. R. (2017). Nitrogen enrichment and speciation in a coral reef lagoon driven by groundwater inputs of bird guano. J. Geophys. Res. Oceans 122, 7218–7236. doi: 10.1002/2017JC012929
McManus, J. W., and Polsenberg, J. F. (2004). Coral–algal phase shifts on coral reefs: ecological and environmental aspects. Prog. Oceanogr. 60, 263–279. doi: 10.1016/j.pocean.2004.02.014
Mioche, D., and Cuet, P. (1999). Métabolisme du carbone, des carbonates et des sels nutritifs en saison chaude, sur un récif frangeant soumis à une pression anthropique (île de La Réunion, Océan Indien). Comptes Rendus de l’Académie des Sciences 329, 53–59. doi: 10.1016/S1251-8050(99)80227-4
Moosdorf, N., Stieglitz, T., Waska, H., Dürr, H. H., and Hartmann, J. (2015). Submarine groundwater discharge from tropical islands: a review. Grundwasser 20, 53–67. doi: 10.1007/s00767-014-0275-3
Mulvenna, P. F., and Savidge, G. (1992). A modified manual method for the determination of urea in seawater using diacetylmonoxime reagent. Estua. Coast. Shelf Sci. 34, 429–438. doi: 10.1016/S0272-7714(05)80115-5
Naïm, O. (1993). Seasonal responses of a fringing reef community to eutrophication (Reunion Island, Western Indian Ocean). Mar. Ecol. Prog. Ser. 99, 137–151.
Naïm, O., Chabanet, P., Done, T., Tourrand, C., and Letourneur, Y. (2000). “Regeneration of a reef flat ten years after the impact of the cyclone Firinga (Reunion, SW Indian ocean),” in Proceedings of the 9th International Coral Reef Symposium, eds M. K. Moosa, S. Soemodihardjo, A. Soegiarto, K. Romimohtarto, A. Nontji, and S. Suharsono (Bali: Indonesian Institute of Sciences, International Society for Reef Studies), 547–554.
Naïm, O., Tourrand, C., Ballesteros, E., Semple, S., Bigot, L., Cauvin, B., et al. (2013). Fringing reefs of Reunion Island and eutrophication effects. Part 2. Long-term monitoring of primary producers. Atoll Res. Bull. 598, 1–132. doi: 10.5479/si.00775630.596
Naumann, M. S., Bednarz, V. N., Ferse, S. C. A., Niggl, W., and Wild, C. (2015). Monitoring of coastal coral reefs near Dahab (Gulf of Aqaba, Red Sea) indicates local eutrophication as potential cause for change in benthic communities. Environ. Monit. Assess 187:44. doi: 10.1007/s10661-014-4257-9
Nelson, C. E., Donahue, M. J., Dulaiova, H., Goldberg, S. J., La Valle, F. F., Lubarsky, K., et al. (2015). Fluorescent dissolved organic matter as a multivariate biogeochemical tracer of submarine groundwater discharge in coral reef ecosystems. Mar. Chem. 177, 232–243. doi: 10.1016/j.marchem.2015.06.026
Nelson, N. B., and Siegel, D. A. (2013). The global distribution and dynamics of chromophoric dissolved organic matter. Annu. Rev. Mar. Sci. 5, 447–476. doi: 10.1146/annurev-marine-120710-100751
Nicet, J. B., Wickel, J., Masse, L., and Rungassamy, T. (2019). Évaluation de l’état du benthos et des peuplements ichtyologiques des récifs réunionnais - Suivi 2018 des 14 stations GCRMN/DCE de la pente externe. Saint-Denis: Office de l’eau Réunion.
Norström, A. V., Nyström, M., Lokrantz, J., and Folke, C. (2009). Alternative states on coral reefs: beyond coral-macroalgal phase shifts. Mar. Ecol. Prog. Ser. 376, 295–306. doi: 10.3354/meps07815
Ohno, T. (2002). Fluorescence inner-filtering correction for determining the humification index of dissolved organic matter. Environ. Sci. Technol. 36, 742–746. doi: 10.1021/es0155276
Pandolfi, J. M., Connolly, S. R., Marshall, D. J., and Cohen, A. L. (2011). Projecting coral reef futures under global warming and ocean acidification. Science 333, 418–422. doi: 10.1126/science.1204794
Para, J., Coble, P. G., Charrière, B., Tedetti, M., Fontana, C., and Sempéré, R. (2010). Fluorescence and absorption properties of chromophoric dissolved organic matter (CDOM) in coastal surface waters of the northwestern Mediterranean Sea, influence of the Rhône River. Biogeosciences 7, 4083–4103. doi: 10.5194/bg-7-4083-2010
Paytan, A., Shellenbarger, G. G., Street, H. J., Gonneea, E. M., Davis, K. A., Young, B. M., et al. (2006). Submarine groundwater discharge: an important source of new inorganic nitrogen to coral reef ecosystems. Limnol. Oceanogr. 51, 343–348. doi: 10.4319/lo.2006.51.1.0343
Raimbault, P., Lantoine, F., and Neveux, J. (2004). Dosage rapide de la chlorophylle a et des phéopigments a par fluorimétrie après extraction au méthanol. Comparaison avec la méthode classique d’extraction à l’acétone. Océanis 30, 189–205.
Raimbault, P., Pouvesle, W., Diaz, F., Garcia, N., and Sempéré, R. (1999). Wet-oxidation and automated colorimetry for simultaneous determination of organic carbon, nitrogen and phosphorus dissolved in seawater. Mar. Chem. 66, 161–169. doi: 10.1016/S0304-4203(99)00038-9
Rogers, K. M., Nicolini, E., and Gauthier, V. (2012). Identifying source and formation altitudes of nitrates in drinking water from Réunion Island, France, using a multi-isotopic approach. J. Contam. Hydrol. 138, 93–103. doi: 10.1016/j.jconhyd.2012.07.002
Santos, I. R., de Weys, J., Tait, D. R., and Eyre, B. D. (2013). The contribution of groundwater discharge to nutrient exports from a coastal catchment: post-flood seepage increases estuarine N/P ratios. Estua. Coasts 36, 56–73. doi: 10.1007/s12237-012-9561-4
Schlitzer, R. (2014). Ocean Data View. Available online at: http://odv.awi.de
Sempéré, R., Para, J., Tedetti, M., Charrière, B., and Mallet, M. (2015). Variability of solar radiation and CDOM in surface coastal waters of the northwestern Mediterranean Sea. Photochem. Photobiol. 91, 851–861. doi: 10.1111/php.12434
Slomp, C. P., and Van Cappellen, P. (2004). Nutrient inputs to the coastal ocean through submarine groundwater discharge: controls and potential impact. J. Hydrol. 295, 64–86. doi: 10.1016/j.jhydrol.2004.02.018
Sohrin, R., and Sempéré, R. (2005). Seasonal variation in total organic carbon in the Northeast Atlantic in 2000-2001. J. Geophys. Res. Oceans 110:C10S90. doi: 10.1029/2004JC002731
Stedmon, C. A., and Bro, R. (2008). Characterizing dissolved organic matter fluorescence with parallel factor analysis: a tutorial. Limnol. Oceanogr. Methods 6, 572–579. doi: 10.4319/lom.2008.6.572
Stedmon, C. A., Markager, S., Tranvik, L., Kronberg, L., Slatis, T., and Martinsen, W. (2007). Photochemical production of ammonium and transformation of dissolved organic matter in the Baltic Sea. Mar. Chem. 104, 227–240. doi: 10.1016/j.marchem.2006.11.005
Street, J. H., Knee, K. L., Grossman, E. E., and Paytan, A. (2008). Submarine groundwater discharge and nutrient addition to the coastal zone and coral reefs of leeward Hawai’i. Mar. Chem. 109, 355–376. doi: 10.1016/j.marchem.2007.08.009
Tanaka, K., Ohde, S., Cohen, M. D., Snidvongs, A., Ganmanee, M., and McLeod, C. W. (2013). Metal contents of Porites corals from Khang Khao Island, Gulf of Thailand: anthropogenic input of river runoff into a coral reef from urbanized areas, Bangkok. Appl. Geochem. 37, 79–86. doi: 10.1016/j.apgeochem.2013.07.005
Tedetti, M., Cuet, P., Guigue, C., and Goutx, M. (2011). Characterization of dissolved organic matter in a coral reef ecosystem subjected to anthropogenic pressures (La Réunion Island, Indian Ocean) using multi-dimensional fluorescence spectroscopy. Sci. Total Environ. 409, 2198–2210. doi: 10.1016/j.scitotenv.2011.01.058
Tedetti, M., Longhitano, R., Garcia, N., Guigue, C., Ferretto, N., and Goutx, M. (2012). Fluorescence properties of dissolved organic matter in coastal Mediterranean waters influenced by a municipal sewage effluent (Bay of Marseilles, France). Environ. Chem. 9, 438–449. doi: 10.1071/EN12081
Tedetti, M., Marie, L., Röttgers, R., Rodier, M., Van Wambeke, F., Helias, S., et al. (2016). Evolution of dissolved and particulate chromophoric materials during the VAHINE mesocosm experiment in the New Caledonian coral lagoon (south-west Pacific). Biogeosciences 13, 3283–3303.
Tourrand, C., Naïm, O., Bigot, L., Cadet, C., Cauvin, B., Semple, S., et al. (2013). Fringing reefs of Reunion Island and eutrophication effects. Atoll Res. Bull. 596, 1–35.
Tréguer, P., and LeCorre, P. (1975). Manuel D’analyses Des Sels Nutritifs Dans L’eau De Mer: Utilisation de l’Autoanalyser II Technicon, 2nd Edn. Brest: Université de Bretagne Occidentale, Laboratoire de Chimie marine.
Troupin, C., Barth, A., Sirjacobs, D., Ouberdous, M., Brankart, J.-M., Brasseur, P., et al. (2012). Generation of analysis and consistent error fields using the data interpolating variational analysis (Diva). Ocean Model. 52–53, 90–101. doi: 10.1016/j.ocemod.2012.05.002
Webb, J. R., Santos, I. R., Maher, D. T., Tait, D. R., Cyronak, T., Sadat-Noori, M., et al. (2019). Groundwater as a source of dissolved organic matter to coastal waters: insights from radon and CDOM observations in 12 shallow coastal systems. Limnol. Oceanogr. 64, 182–196. doi: 10.1002/lno.11028
Welschmeyer, N. A. (1994). Fluorometric analysis of chlorophyll a in the presence of chlorophyll b and pheopigments. Limnol. Oceanogr. 39, 1985–1992. doi: 10.4319/lo.1994.39.8.1985
Zubia, M., Depetris, M., Flores, O., Turquet, J., and Cuet, P. (2018). Macroalgae as a tool for assessing the ecological status of coral reefs under the Water framework directive: a case study on the reef flats of La Réunion (Indian Ocean). Mar. Pollut. Bull. 137, 339–351. doi: 10.1016/j.marpolbul.2018.10.029
Keywords: coral reefs, La Réunion, Indian Ocean, eutrophication, groundwater, nutrients, organic matter, fluorescence
Citation: Tedetti M, Bigot L, Turquet J, Guigue C, Ferretto N, Goutx M and Cuet P (2020) Influence of Freshwater Discharges on Biogeochemistry and Benthic Communities of a Coral Reef Ecosystem (La Réunion Island, Indian Ocean). Front. Mar. Sci. 7:596165. doi: 10.3389/fmars.2020.596165
Received: 18 August 2020; Accepted: 20 October 2020;
Published: 10 November 2020.
Edited by:
Cynthia B. Silveira, San Diego State University, United StatesReviewed by:
Sophia Barinova, University of Haifa, IsraelCopyright © 2020 Tedetti, Bigot, Turquet, Guigue, Ferretto, Goutx and Cuet. This is an open-access article distributed under the terms of the Creative Commons Attribution License (CC BY). The use, distribution or reproduction in other forums is permitted, provided the original author(s) and the copyright owner(s) are credited and that the original publication in this journal is cited, in accordance with accepted academic practice. No use, distribution or reproduction is permitted which does not comply with these terms.
*Correspondence: Marc Tedetti, bWFyYy50ZWRldHRpQG1pby5vc3VweXRoZWFzLmZy
Disclaimer: All claims expressed in this article are solely those of the authors and do not necessarily represent those of their affiliated organizations, or those of the publisher, the editors and the reviewers. Any product that may be evaluated in this article or claim that may be made by its manufacturer is not guaranteed or endorsed by the publisher.
Research integrity at Frontiers
Learn more about the work of our research integrity team to safeguard the quality of each article we publish.