 Ross M. Reid
 Andrea L. Reid2,3
 David A. Lovejoy
 Peggy R. Biga
- 1Department of Biology, University of Alabama at Birmingham, Birmingham, AL, United States
- 2Department of Pediatrics, University of Alabama at Birmingham, Birmingham, AL, United States
- 3Department of Cell and Systems Biology, University of Toronto, Toronto, ON, Canada
Teneurin C-terminal associated peptides (TCAP), bioactive peptides located on the C-terminal end of teneurin proteins, have been shown to regulate stress axis functions due to the high conservation between TCAP and corticotropin releasing factor (CRF). Additionally, recent work demonstrated that TCAP can increase metabolism in rats via glucose metabolism. These metabolic actions are not well described in other organisms, including teleosts. Here we investigated the expression of a tcap isoform, tcap-3, and the potential role of TCAP-3 as a regulator of metabolism across zebrafish life-stages. Using pcr-based analyses, tcap-3 appears to be independently transcribed, in relation to teneurin-3, in muscle tissue of adult zebrafish. Resazurin, respirometry chambers, and mitochondrial metabolism analyses were used to study the metabolic effects of synthetic rainbow trout TCAP-3 (rtTCAP-3) in larval and adult zebrafish. Overall, metabolic activity was enhanced by 48 h of rtTCAP-3 treatment in larvae (bath immersion) and adults (intraperitoneal injections). This metabolic activity increase was due to mitochondrial uncoupling, as mitochondrial respiration increase by rtTCAP-3 was due to proton leak. Additionally, rtTCAP-3 protected larval fish from reduced metabolic activity induced by low temperatures. Subsequently, rtTCAP-3 increased metabolic output in adult zebrafish subjected to accelerated swimming speeds, demonstrating the potent role of rtTCAP-3 in zebrafish metabolism regulation during metabolic challenges. Collectively, these results demonstrate the conserved roles for rtTCAP-3 as a metabolic activator in zebrafish.
Introduction
Teneurins are a family of type II transmembrane proteins that are structurally and functionally conserved across a broad spectrum of organisms. Teneurins are essential signaling molecules that moderate neurological developmental processes like cell migration and axon pathfinding (Topf and Chiquet-Ehrismann, 2011; Beckmann et al., 2013). There are four teneurin homologs that have been identified in vertebrates and one additional homologue has been identified in zebrafish (Danio rerio) as they contain 5 known teneurins-1, 2a, 2b, 3, and 4 (Mieda et al., 1999; Tucker et al., 2012). The identification of teneurin sequences in several teleost species was recently reviewed (Reid et al., 2019). All teneurin proteins include a conserved peptide sequence at the extracellular distal terminus, called teneurin C-terminal associated peptide (TCAP), first identified in rainbow trout (Oncorhynchus mykiss) (Qian et al., 2004; Wang et al., 2005). It is hypothesized that this fragment had been cleaved from the C-terminus of the teneurin-3 protein and could function independently (Qian et al., 2004; Tucker et al., 2007; Chand et al., 2013).
Since the discovery of TCAP, studies have shown that TCAPs are an evolutionary conserved family of four bioactive peptides (TCAP1-4) that predate insulin (Nordstrom et al., 2009; Chand et al., 2013; Hogg et al., 2018). Additionally, several members of the TCAP family have been further identified in a multitude of species: mouse, rat, vase tunicate, and rainbow trout (Qian et al., 2004; Wang et al., 2005; Lovejoy et al., 2006; Tan et al., 2011; Chand et al., 2013; Colacci et al., 2015; D’Aquila et al., 2017). However, many of the novel understandings for the general functions of TCAPs have centered around TCAP-1 studies in rodents. Interestingly, only TCAP-1 and TCAP-3 have been shown to be independently transcribed without teneurin transcription, implying that the functions of TCAP-1 or TCAP-3 are independent from teneurin proteins (Chand et al., 2013). Additionally, studies have demonstrated that TCAP-1 primarily localizes in the cytosol, whereas the teneurin protein is localized on the membrane (Chand et al., 2013). Several studies have demonstrated stress-related behaviors and metabolic regulation by TCAP-1 in mammals (Al Chawaf et al., 2007; Tan et al., 2008; Tan et al., 2011; Hogg et al., 2018). For example, TCAP-1 reduced blood glucose and insulin levels in Wistar and type-II diabetic insulin-insensitive (Goto-Kakizaki) rats and interestingly, this TCAP-mediated glucose uptake was found to be insulin-independent (Hogg et al., 2018).
A recent study demonstrated metabolic actions of TCAP in the protochordate C. intestinalis, where treatment with synthesized ciona TCAP, the homologous paralog to TCAP-1, increased their contractile behaviors. This is a high energy-dependent behavior, suggesting that TCAPs may have conserved roles in metabolism (D’Aquila et al., 2017). However, the actions of other TCAPs in other species are unclear. Although, TCAP-3 was originally described and synthesized from hypothalamic cDNA of rainbow trout (rtTCAP-3), there since has been little research focused on its functions in fish. The bioactivity of TCAP observed in C. intestinalis suggests that the TCAP family may be functional in teleost as well. Thus, as TCAP-3 was originally discovered rainbow trout, we focused this study on TCAP-3 presence and activity in teleosts, with a specific focus on a potential role in metabolism.
As previously mentioned, teleosts contain multiple copies of teneurins, suggesting that TCAPs could be present and active in fish (Mieda et al., 1999; Tucker et al., 2012). The synthetic version of rtTCAP-3 used in the mammalian studies was functional in vitro and regulated the expression of the teneurin gene, as well as stimulated the production of cAMP in Gn11 neuronal cells while increasing their proliferation (Qian et al., 2004). Although these studies used synthetic rtTCAP-3 to elucidate its bioactive functions in mammalian neuronal cells, rtTCAP-3 shares 73% amino acid identity to mouse TCAP-1 protein, highlighting the possibility of conserved functions between these peptides (Qian et al., 2004). Additionally, the rainbow trout teneurin-3 sequence used to synthesize rtTCAP-3 is 92% identical to the zebrafish teneurin-3 and 83% identical to mouse and human teneurin-3 sequences (Qian et al., 2004; Nordstrom et al., 2009; Chand et al., 2013). This data suggests that the TCAP family has a high-level of conservation and may function in similar metabolic pathways as well.
For this study, we investigated the expression and role of TCAP-3 in a teleost model, the zebrafish (Danio rerio) to elucidate conserved functionality of TCAP peptides related to metabolic regulation. Zebrafish are great models for evaluating metabolic regulation across life stages as they are small, develop rapidly, and share 90% genetic identity with humans (Barbazuk et al., 2000; Howe et al., 2013). Therefore, the work in this study focused first on verifying the expression of both teneurin-3 (tenm-3) and tcap-3 across life stages in zebrafish to analyze potential transcription of tcap- 3 independent of teneurin-3 expression. Additionally, this study analyzed the potential roles of TCAP-3 in regulating metabolic activities in zebrafish across different life stages by utilizing various metabolic assays (resazurin, respirometry chambers, and mitochondrial flux). This work demonstrates that tcap-3 appears to be independently transcribed in skeletal muscle of adult zebrafish and that TCAP-3 elicits a potent metabolic role in zebrafish as seen by increases in respiration and mitochondrial dynamics.
Materials and Methods
Ethical Procedures
All animal experimentation was approved by the Institutional Animal Care and Use Committee (IACUC-20455 and IACUC-20487) of the University of Alabama at Birmingham and is consistent with the guidelines established by the Office of Laboratory Animal Welfare, National Institutes of Health of the U.S. Department of Health and Human Services.
Animals
Adult zebrafish (> 1 year of age, Danio rerio, AB strain) were obtained from the Aquatic Animal Aquatic Animal Research Core (AARC) at the University of Alabama at Birmingham (UAB). Fish were maintained in a recirculating aquatic system (dechlorinated city water) at 25°C under a 14 h light-10 h dark photoperiod. Fish were fed once daily ad libitum with otohime (Pentair Aquatic Eco-System, Inc., Apopka, FL). Adult zebrafish (90–360 days of age) were bred following previously described procedures (Westerfield, 1995; Smith et al., 2013). Once eggs were collected, they were pipetted into a 10 cm petri dish with a stocking density of 100 embryos. For the following days 1–5, embryos were maintained in a 28°C housing chamber with a 14 h light-10 h dark photoperiod. Any embryos that had died or were unfertilized were removed with a disposable pipette and water changes were performed daily with 4 mL of fresh tank water; ensuring not to disturb or pipette out the healthy embryos. Embryos were maintained in filtered tank water media that was collected from the aquatic system. Tank water was prepared by running municipal water first through an AquaFX RO filter, then through a microUV, charcoal, and mechanical sterile filter (Pentair Aquatic Eco-System, Inc., Apopka, FL). The filtered H2O was then brought to a conductivity range of 800–1,200 μS with instant ocean sea salt (Instant Ocean, Cincinnati, OH) and had a pH of 7.1–7.5. The fertilized embryos were monitored and received water changes daily throughout the duration of the larval experiments. Larvae were maintained in a 28°C housing chamber with a 14 h light-10 h dark photoperiod and have an average day 5 survival rate of 90%. Embryos were monitored daily for 5 days post fertilization (dpf) during all larvae experiments. On 5 dpf larvae were transferred to 1.8 L tanks and fed rotifers (Branchionus plicatilis) enriched with Nannochloropsis (RotiGrow Omega, Reed Mariculture) ad libitum until 28 dpf. Larvae developmental stages were determined according to previous studies, using a dissecting microscope, which further ensured sample populations tested were homogenous (Kimmel et al., 1995; Parichy et al., 2009). Larval and adult life stages were utilized in experiments in this study to evaluate tcap-3 across zebrafish life stages (outlined in Figure 1).
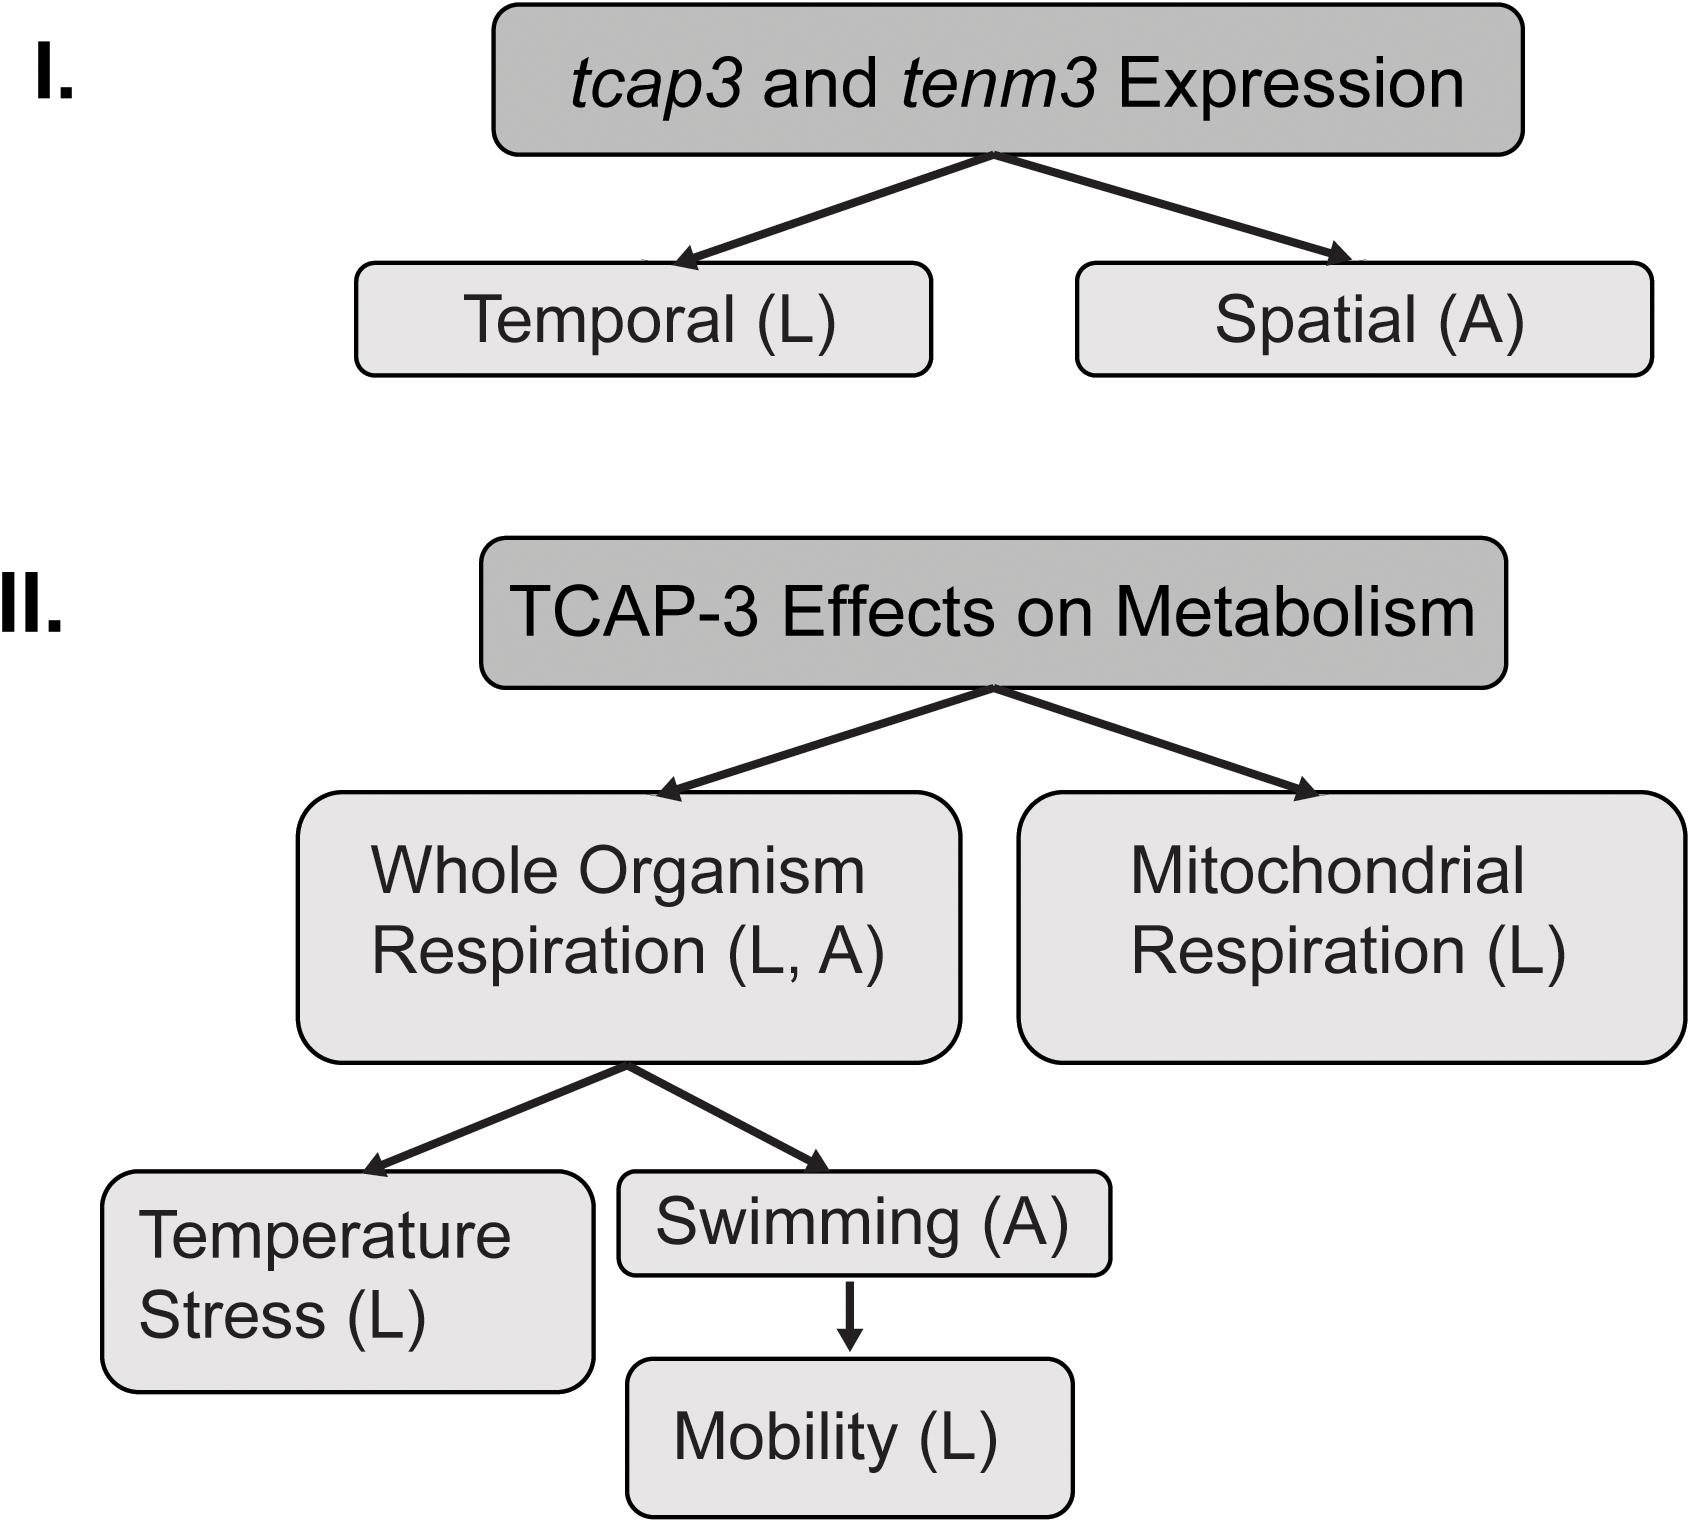
Figure 1. Experimental flowchart. This schematic outlines the two main sections of experiments. (I) mRNA expression of both teneurin (tenm3) and teneurin C-terminal associated peptide (tcap-3) during early developmental stages (temporally) in zebrafish and in muscle and brain tissue (spatially) from adult zebrafish. (II) Effects of TCAP-3 on metabolism at the level of the whole organism and the mitochondria. The effects of TCAP-3 on whole organism respiration were also evaluated under various condition: temperature stress and swimming exertion. L = larval zebrafish; A = adult zebrafish.
Expression of Teneurin-3 (tenm3) and Teneurin C-Terminal Associated Peptide-3 (tcap3) in Zebrafish
To determine tenm3 and tcap3 expression across developing larvae, specific developmental stages were selected, as previously described (Kimmel et al., 1995) and outlined in Table 1. Following embryo collections as described above, 20 embryos at the designated stage were collected in 1 mL Trizol (Thermo Scientific, Waltham, MA, United States) and immediately frozen on liquid nitrogen and transferred to a −80°C for long-term storage until further processing. To determine if tenm3 and tcap3 are expressed in brain and muscle tissue, adult zebrafish were obtained from the Aquatic Animal Research Core (AARC) at the University of Alabama at Birmingham (UAB) and were euthanized using methanesulfonate (MS222, > 300 mg/mL; AVMA, Pittsburgh, PA). Then, epaxial skeletal muscle and full brain tissues were carefully dissected and placed into Trizol (Thermo Scientific, Waltham, MA, United States) and immediately frozen with liquid nitrogen. Later, samples were transferred to a −80°C for long-term storage until further processing.
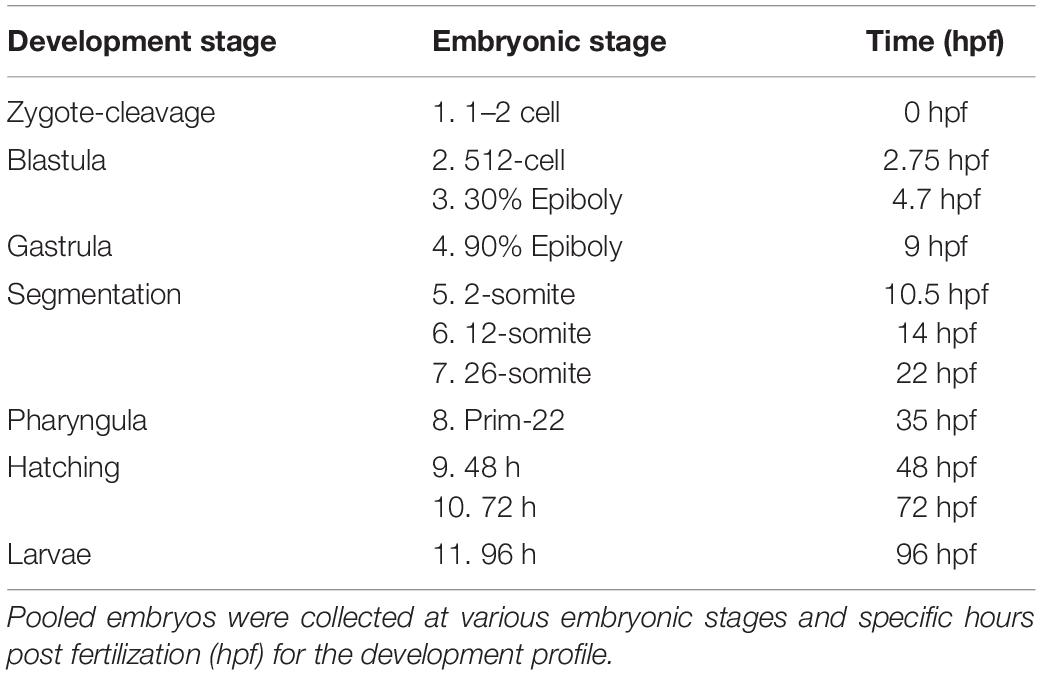
Table 1. Stages collected during zebrafish developmental.
Total RNA of larvae and adult zebrafish tissue was isolated using Trizol (Thermo Fisher Scientific, Waltham, MA, United States) following the manufacturer’s instructions. Total RNA concentration and purity (260/280 > 1.85) were assessed using NanoDrop 1000 spectrophotometer (Thermo Fisher Scientific). For reverse transcription (RT) reactions, total RNA (400 ng larvae RNA or 1,000 ng adult tissue RNA) was mixed with Oligo (dT)15 (0.5 μg/reaction, Bio-Rad) and nuclease-free water. Samples were incubated in a Bio-Rad T100 Thermocycler for 5 min at 70°C and then chilled at 4°C. Then, RT-prepped samples were mixed with RT reagents using the Promega ImProm-II Reverse Transcription Kit (Promega, Madison, WI, United States) as follows: Oligo (dT)/RNA mix, MgCl2 (6.0 mM), ImProm-II 5X Reaction Buffer, dNTP (0.5 mM), Recombinant RNasin Ribonuclease Inhibitor and ImProm-II Reverse Transcriptase. Following equilibration at 25°C for 5 min, reaction mixes were incubated at 42°C for 1 h, followed by inactivated at 70°C for 15 min, and then held at 4°C.
For mRNA expression analyses, primers were designed for tenm3 and tcap3 from the zebrafish teneurin-3 mRNA sequence (AB026979.1). To detect a teneurin-specific PCR product (tenm3), primers were designed to overlap exons 20 and 21, generating a 255 bp tenm3 PCR product (Figure 2). To detect a tcap-3 specific PCR product (tcap3), primers were designed within exon 31 of the teneurin-3 gene, which corresponds to the coding sequence for the predicted TCAP-3 amino acid sequence (Qian et al., 2004), to generate a 78 bp tcap3 PCR product (Figure 2). The tenm3 and tcap3 PCR products were validated by TOPO vector cloning and sequenced. To assess the quality and efficacy of semi-quantitative PCR for adult tissue expression levels of tenm3 and tcap3, β-actin mRNA levels were analyzed, while mRNA expression was analyzed for corticotropin-releasing hormone (crh) and myc associated factor x (max) as internal brain and muscle tissue controls, respectively. Table 2 outlines primer sequence information for all mRNA targets analyzed.
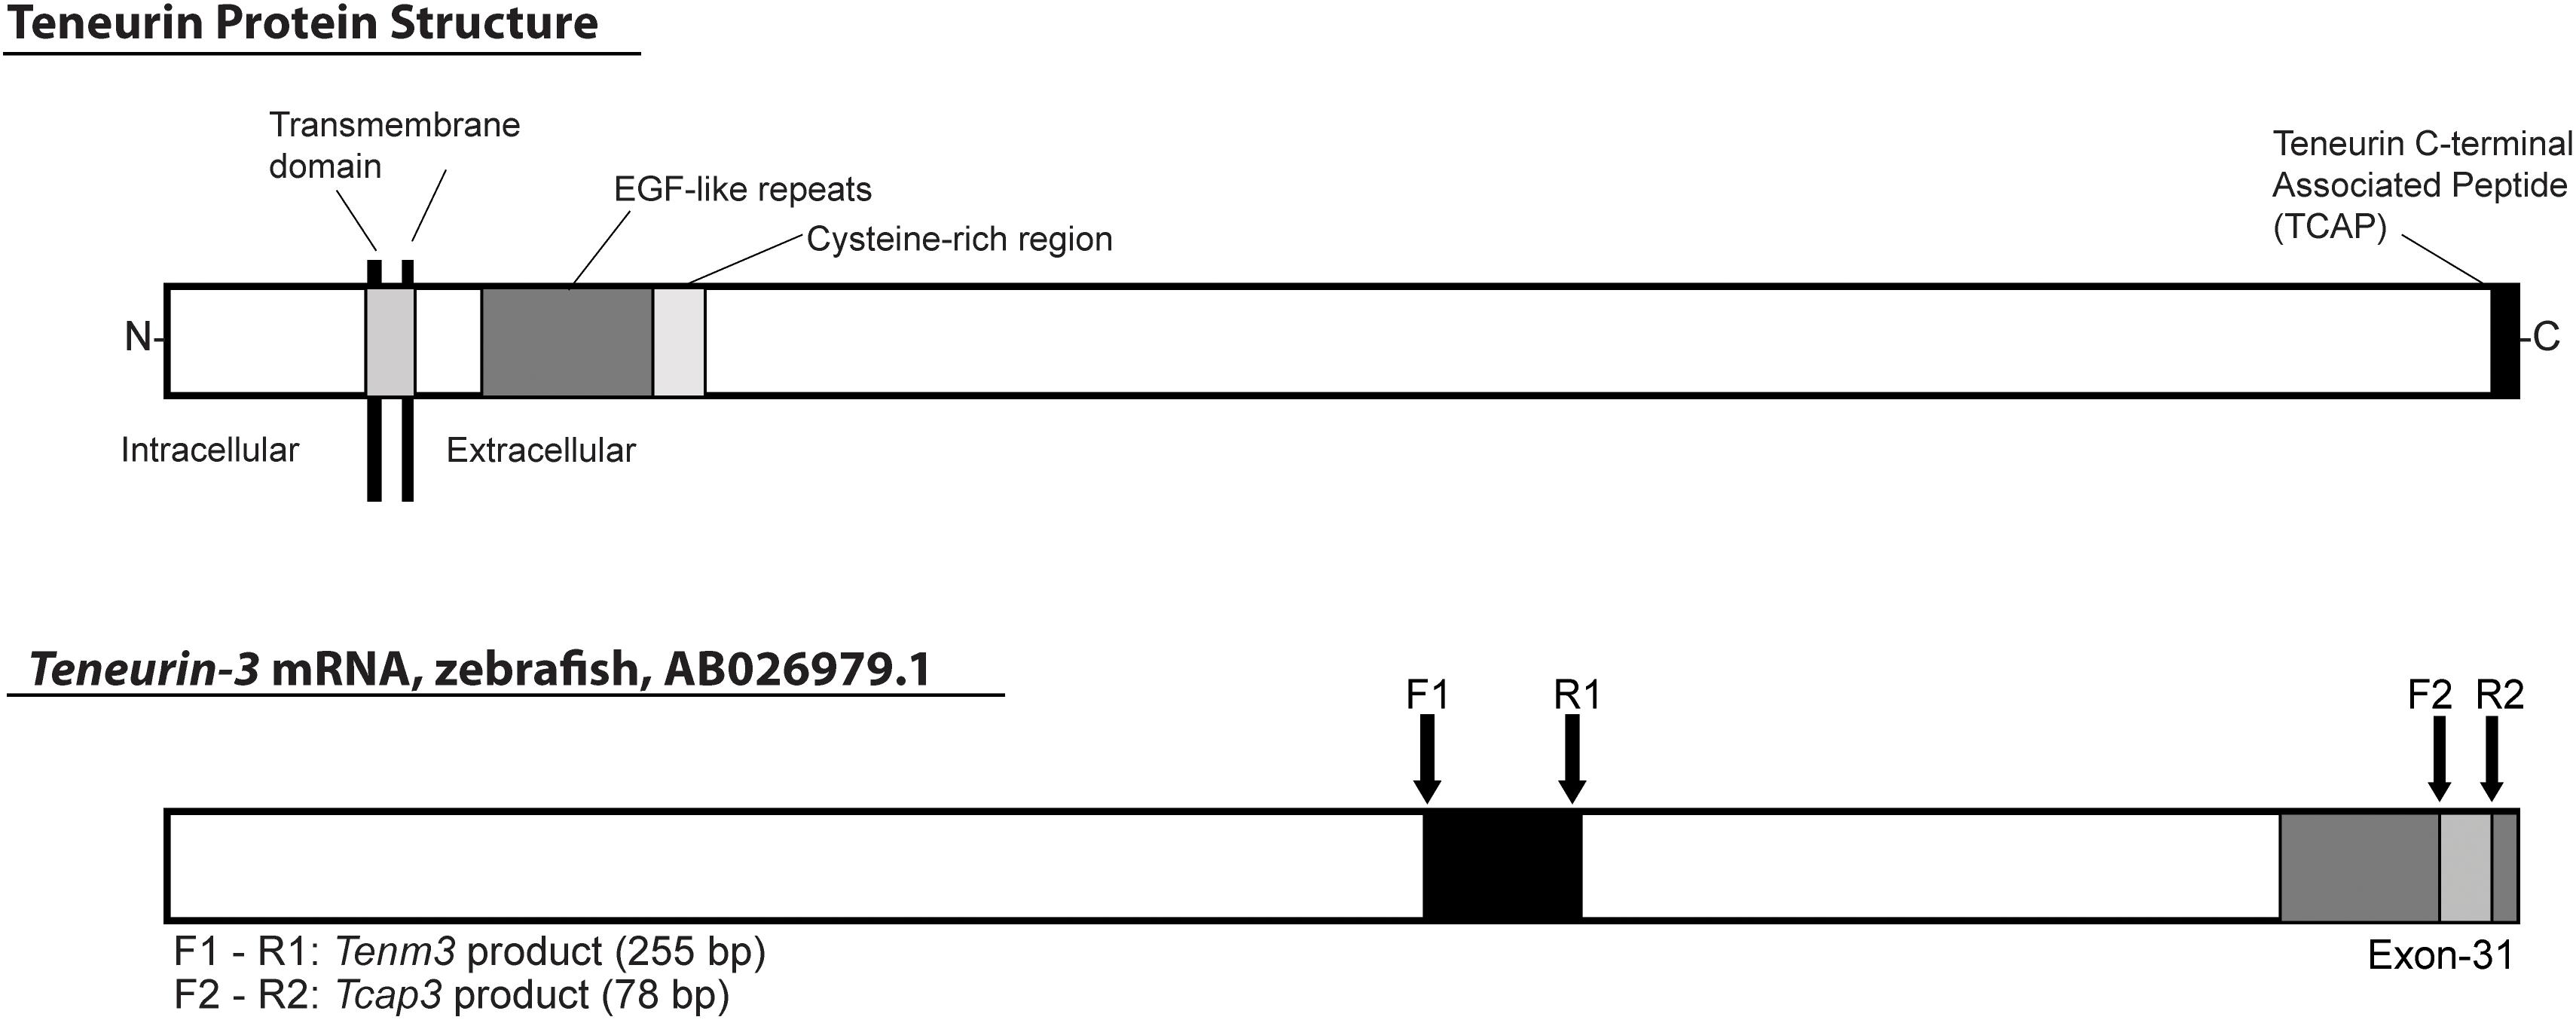
Figure 2. Schematic depicting the location of tcap3 on the teneurin protein and teneurin (tenm3) gene. The predicted teneurin protein structure includes intracellular and extracellular domains, separated by the transmembrane domain. The extracellular domain includes EGF-like repeats, a cysteine-rich region, and a bioactive teneurin c-terminal associated peptide (tcap) (adapted from Qian et al., 2004). TCAP makes up ∼40–41 C-terminal residues and is encoded within exon 31 of the teneurin gene. The teneurin mRNA sequence is 7,773 base pairs. PCR primers for a teneurin-specific product were designed overlapping exons 20 and 21 (F1, R1), 5′-upstream of the presumed tcap sequence. PCR primers for a tcap-specific product were designed within exon 31 within the putative coding sequence for tcap (F2, R2). Primers were designed using the zebrafish teneurin-3 mRNA sequence (AB026979.1): F1 and R1: teneurin (tenm3, 255 bp product); F2 and R2: tcap-3 (tcap3, 78 bp product).
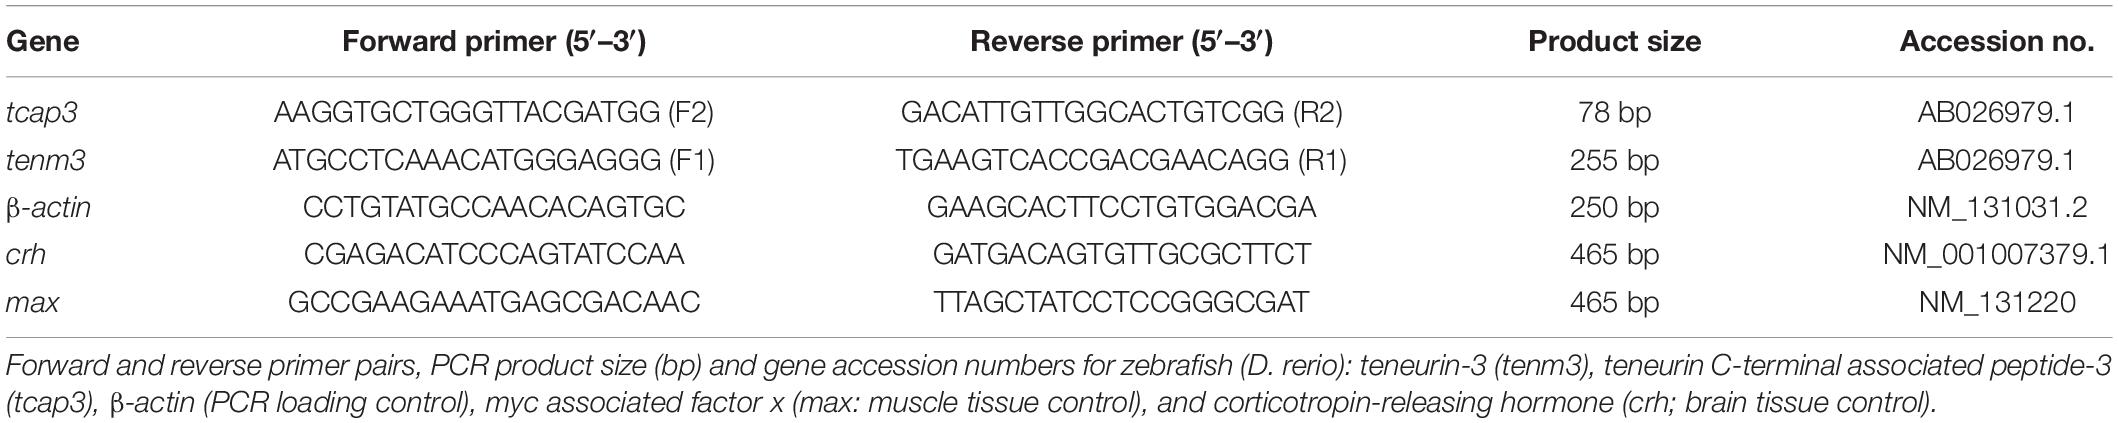
Table 2. Primers used for RT-PCR analyzes.
Quantitative real-time PCR (qPCR) was utilized to compare tenm3 and tcap3 expression across developmental stages. Primer efficiencies and standard curves were generated using serial dilutions of pooled cDNA from samples and resulting concentrations were diluted 1:4 to 1:1,024 the stock pool sample. Then the individual cDNA samples were diluted 1:10 (5 μL stock sample cDNA + 45 μL nuclease-free water) and added to a qPCR reaction by mixing GoTaq qPCR Master Mix, 2X (Promega) 4 μL of 1:10 samples, forward primer (10 mM), reverse primer (10 mM), and nuclease-free water. Reactions were run using the Bio-Rad CFX platform and the cycling parameters were as follows: 95°C (2 min) followed by 35 cycles at 95°C for 15 s, primer specific annealing temperature 60°C for 30 s, and 68°C for 10 s. All quantitative PCR assays utilized a comparative baseline strategy using the ΔCq method that standardized to starting input cDNA quantity (Bustin et al., 2009; De Santis et al., 2011; Meyer et al., 2013). Primer PCR efficiencies were calculated for each primer:tissue pair using log10 dilution series of input cDNA as well as generated standards. Efficiency (E) was determined by the equation [E = 10(–1/slope)] and ranged from 90.6 to 95.4%. Reproducibility was represented by the R2 value of the standard curve and was always greater than 0.98. Quantification was conducted using standard curves generated from cDNA serial dilutions (log10 dilutions) as previously reported (Meyer et al., 2013). The coefficient of variation (CV, %) of Cq values was calculated (CV < 0.48). Relative starting mRNA amount (ng) was calculated for each triplicate sample using the generated standard curves.
Semi-quantitative PCR was utilized to visualize the presence or absence of tenm3 and tcap3 expression in adult zebrafish muscle and brain tissues to test whether tcap3 is expressed in the absence of tenm3 expression in adult tissues. Reactions were conducted at a cDNA dilution of 2:25. For each reaction, 2 μL of cDNA (from RT reaction starting with 1,000 ng RNA) was combined with GoTaq Green Master Mix, 2× (400 μM: dATP, dGTP, dCTP, dTTP; 3 mM MgCl2; Promega, Madison, WI, United States), Forward Primer (10 μM), Reverse Primer (10 μM), and nuclease-free water. Each reaction was incubated in the Bio-Rad T100 Thermocycler for 5 min at 95°C; followed by 35 cycles of 30 s at 95°C, 30 s at 60°C, and 30 s at 72°C; and held at 4°C. PCR cycling protocols, primers, dNTPs, Taq polymerase, and Mg2+ concentrations were optimized for the tenm3 and tcap3 ensuring accurate and efficient amplification. For visualization, tenm3 and tcap3 cDNA products were separated and visualized by electrophoresis (2% agarose gel and ran at 100 V for 1.5 h) and visualized using a Benchtop 2UV Transilluminator. PCR product sizes (bp) (tenm3: 255 bp; tcap3: 78 bp; β-actin: 250 bp; crh: 456 bp; max: 465 bp) were verified using a 100–1,000 bp or 50–1,000 bp DNA ladder (Thermo Fisher Scientific).
Effects of rtTCAP-3 on Larvae and Adult Zebrafish
To evaluate the role of TCAP-3 on zebrafish metabolism, a synthetic rainbow trout TCAP-3 (rtTCAP-3) peptide was used. Part II of the study design (Figure 1) focuses on testing how TCAP-3 treatment affects metabolic activity by evaluating respiration rate using several assays and under several physiological conditions, using both larvae and adult zebrafish. First, the effects of rtTCAP-3 on whole organism respiration were evaluated in both larval and adult zebrafish using an assay that measures NADH oxidization (resazurin is reduced to fluorescent resorufin when NADH is oxidized to NAD+) (Reid et al., 2018). Following analyses on baseline respiration rate using the resazurin assay, the effects of rtTCAP-3 on temperature-induced changes in respiration rate were evaluated in both larval and adult zebrafish using the resazurin assay. Second, the effects of rtTCAP-3 on whole organism respiration rates were evaluated in adult zebrafish in relation to standard/maintenance and exertion swimming using respirometry chambers (Loligo Systems, Viborg, Denmark). Third, the effects of rtTCAP-3 on larval zebrafish swimming mobility were evaluated using mobility tracking software and DanioVision Observation chambers (Noldus, Netherlands). Lastly, the effects of rtTCAP-3 on mitochondrial respiration were evaluated in larval zebrafish using the Mito Stress Assay protocol measured on a XFE24 Extracellular Flux Analyzer (Seahorse Bioscience, Agilent Technologies).
rtTCAP-3 Treatments in Larval and Adult Zebrafish
Synthetic rtTCAP-3 was previously synthesized on an automated peptide synthesizer, Model Novayn Crystal (Novabiochem, Nottingham, United Kingdom) on PEG-PS resin using continuous flow Fmoc chemistry (Calbiochem-Novabiochem Group, San Diego, CA) (Qian et al., 2004; Wang et al., 2005). Solubilization of synthetic rtTCAP-3 used in the experiments was performed, with modification, according to the methods previously described (Qian et al., 2004). Rather than using acetic acid and cyclodextrin, 1,000 μg of rtTCAP-3 was solubilized in 1 mL 1× PBS. At the final concentration of 1.0 μg/μL, the solution was separated into 20 μl aliquots and stored at −20°C.
For respiration rate analyses, rtTCAP-3 was administered to larval zebrafish using an immersion bath technique and to adult zebrafish using intraperitoneal injections. Briefly, 4 days post-fertilization (dpf) larvae were pooled in 6-well plate wells (10 larvae/well) into either a control group (1× PBS) or into treatment group, at random. Control wells were treated with corresponding volume amounts of PBS, as compared to the treatment group (i.e., if 5 μL of rtTCAP-3 was treated to the water in a well, 5 μL of PBS was administered to the well of the corresponding control group). For adult zebrafish, control (PBS) or rtTCAP-3 (120 ng/g) was injected intraperitoneally after anesthetizing the fish with buffered MS-222 (100 mg/L) for 1 min. This dose of rtTCAP-3 was selected based on rodent studies that demonstrated this dose was effective in regulating glucose (Hogg et al., 2018). Following the methods previously described (Reid et al., 2018), while the fish were anesthetized, weights were obtained and the fish were placed in a temporary housing chamber to ensure they fully recovered the anesthesia and injection, before continuing the experiment.
Whole Organism Respiration Rate: Resazurin Assay
To evaluate whole organism respiration rate, larval and adult zebrafish, treated with rtTCAP-3 or PBS, were housed in a resazurin working solution as previously described (Reid et al., 2018) and the conversion of resazurin to resorufin was measured using fluorometry. To being, a resazurin stock and working solution was prepared for the in vivo metabolic assays (Reid et al., 2018). Briefly, 0.5 g of resazurin sodium salt was mixed with 10 mL of distilled water and 10 μL of dimethyl sulfoxide (DMSO) bringing the stock solution to a total concentration of 50 mg/mL. The stock solution was diluted to a final concentration of 0.02 mg/mL with room temperature tank water prior to testing.
Larvae (4 dpf) were placed into wells containing 2 mL of 0.02 mg/mL of resazurin and treated with varying amounts of rtTCAP-3 doses (0.5, 1.0, 5.0, 10.0 μM) for 48 h and housed at 23°C. Solution (resazurin, fish/no fish, and rtTCAP-3/PBS) samples (180 μL) were collected from each well at time points 0, 3, 6, 12, 24, and 48 h post initial T0 collection. Once all the samples for the time points were collected, samples were stored in a cool, dark environment until further analysis. In addition, the larvae were kept in a 14 h light-10 h dark photoperiod, which limited any circadian effects. To test the effects of rtTCAP-3 and temperature, larvae were pooled (10 larvae/well), treated with either control (PBS) or rtTCAP-3 (5 μM) and were either placed into a chilled incubator (17°C) or kept at RT (23°C).
Following rtTCAP-3 injection in adult zebrafish, control or treated fish were placed into 50 mL conical tubes containing 25 mL of diluted resazurin (0.02 mg/mL) (Reid et al., 2018). For metabolic analysis, fish were fasted, and solution (resazurin, fish/no fish, and rtTCAP-3/PBS) (300 μL) samples were collected from each tube at 0, 3, 6, 9, 12, 24, 30, and 48 h post-initial T0. All the samples were stored in a cool, dark environment until further analysis. In addition, the fish were kept in a 14 h light-10 h dark photoperiod, which limited any circadian effects and were kept at RT (23°C) during the duration of the experiment.
All collected solution samples were pipetted into a 96-well plate and wrapped with aluminum foil, to prevent any light-sensitivity effects. Plates were analyzed using a BioTek Gen 5 Microplate Reader and Imager Software (BioTek Synergy 2, BioTek Instruments Inc., Winooski, VT). 96-well plates were read with an excitation wavelength at 530 nm, followed by an emission wavelength at 590 nm to read the resorufin fluorescence intensity (FI).
Total resorufin FI was calculated using the methods previously outlined (Reid et al., 2018). In summary, for the larvae assays the average total resorufin FI values of the wells for the samples were subtracted from the averaged total resorufin FI of the blank wells, which was then reported as arbitrary fluorescence units (AFU). For adult zebrafish, the total resorufin values were normalized to the weight of the individual adult zebrafish and were reported as arbitrary fluorescence units per grams (AFU/g). Conceptually, the samples at time point 0 and the blank were equivalent and total resorufin FI resulted in extremely close values for the AFU, resulting in time point 0 being set to 0 AFU/g for all the samples.
Whole Organism Respiration Rate: Respirometry Chamber Assay
Metabolic respirometers were utilized in collaboration with Aquatic Animal Research Core (AARC) at the University of Alabama at Birmingham (UAB). The chambers were setup following the instructions provided by Loligo Systems: AutoResp (Loligo Systems, Viborg, Denmark). Adult zebrafish were injected with either control (PBS) or rtTCAP-3 (120 ng/g) and tested in respirometer chambers 24 h after injection. Fish were housed in their home tanks between injections and respirometry placement. Within the respirometry chambers, water was continuously recirculated and oxygen sensors recorded O2 levels during the acclimation, basal, and stressed testing periods. Experimental protocols were modified from manufacture instructions and previous studies (Lucas et al., 2016). Each experiment consisted of testing 3 fish in parallel, chosen at random. Individual fish were submitted to a 10 min acclimation period (0.5 body lengths, BLs–1), which allowed them to acclimate to the respirometry chamber. After this, basal measurements were recorded for a 7 min period (∼1.0–1.5 BLs–1). In between the acclimation and basal period, there was a short 20 second flush (∼1.5 BLs–1) of fresh oxygenated water that restored the oxygen levels in each chamber (8.47 ± 0.08 mg O2/L). To initiate the start of the swimming stress, each chamber experienced flush that was longer (40 s) and more forceful than the previous basal flush, which forced the fish to swim faster against the current (5.0 BLs–1). After this, measurements were recorded for a 6 min period (∼2.5–3.0 BLs–1) to assess swimming stress respiration rates. Whole animal metabolic rates were calculated by measuring oxygen consumption (VO2).
Whole Organism Response: Motility Tracking Assay
To evaluate the effects of rtTCAP-3 on zebrafish swimming, larval mobility was tracked using DanioVision Observation chambers (Noldus, Netherlands) and Ethovision mobility tracking software. On day 3, larvae were treated with PBS or rtTCAP-3 (5 μM) by immersion until day 5. Then larvae were placed individually per well in a 48-well plate with 300 μL of filtered tank water. After overnight acclimation, they were placed in DanioVision Observation chamber and their movements were recorded for 5 min. Total distance travelled and average velocity were calculated by the Ethovision software.
Mitochondrial Respiration Rate: XFE24 Extracellular Flux Analyzer Assay
To determine the effects of rtTCAP-3 on the bioenergetics of larval zebrafish, their mitochondrial respiration was measured using the XFE24 Extracellular Flux Analyzer (Seahorse Bioscience, Agilent Technologies) in collaboration with the Comparative Mitochondrial Health Assessment Core at UAB using a modified procedure previously described (Stackley et al., 2011; Raftery et al., 2017; Zhang et al., 2017). Following 24 h of exposure to either treatment (rtTCAP-3; n = 20) or control (1X-PBS; n = 20), 48 hpf embryos were randomly selected and loaded into 20 wells of a calibrated XFE24 Islet Plate loaded with 700 μL of filtered system water per well. Four wells containing filtered system water only served as control wells on each plate and were used for background correction. The experiment was replicated once. To reduce well variation and error due to larval movements, MS-222 was injected into each well (final well concentration 125 mg/mL) as previously described (Raftery et al., 2017).
The mitochondrial stress test protocol utilized with the XFE24 Flux Analyzer is outlined in Figure 3A, as well as the oxygen consumption rate (OCR) measurements that were calculated from each well from four levels of mitochondrial respiration modification: (1) with no additions, and after adding (2) oligomycin (20 μM), (3) trifluoromethoxyphenylhydrazone (FCCP; 3 μM), and (4) sodium azide (20 mM). Figure 3B demonstrates where each mitochondrial respiration effector acts on mitochondrial respiration: oligomycin inhibits ATP synthase (complex V), FCCP collapses the proton gradient by disrupting the mitochondrial membrane potential, and sodium azide blocks complex IV to shut down mitochondrial respiration. Given these mitochondrial respiration interventions and OCR measurements over time, we can calculate various contributions of respiration mechanisms. Basal respiration rates were calculated as the average OCR before oligomycin addition, while mitochondrial respiration was calculated by subtracting the non-mitochondrial respiration from the basal respiration (Stackley et al., 2011). Non-mitochondrial respiration was calculated as the average OCR following sodium azide addition. ATP-linked respiration was calculated by subtracting the average OCR after oligomycin from the average basal OCR (Zhang et al., 2017). Maximal respiration was calculated as the highest OCR reached following FCCP addition. Respiratory reserve respiration values were determined by subtracting basal respiration from maximal respiration (Lee et al., 2019). Respiration due to proton leak into the mitochondrial matrix was determined by subtracting the non-mitochondrial respiration values from the respiration values after inhibition oligomycin (Stackley et al., 2011).
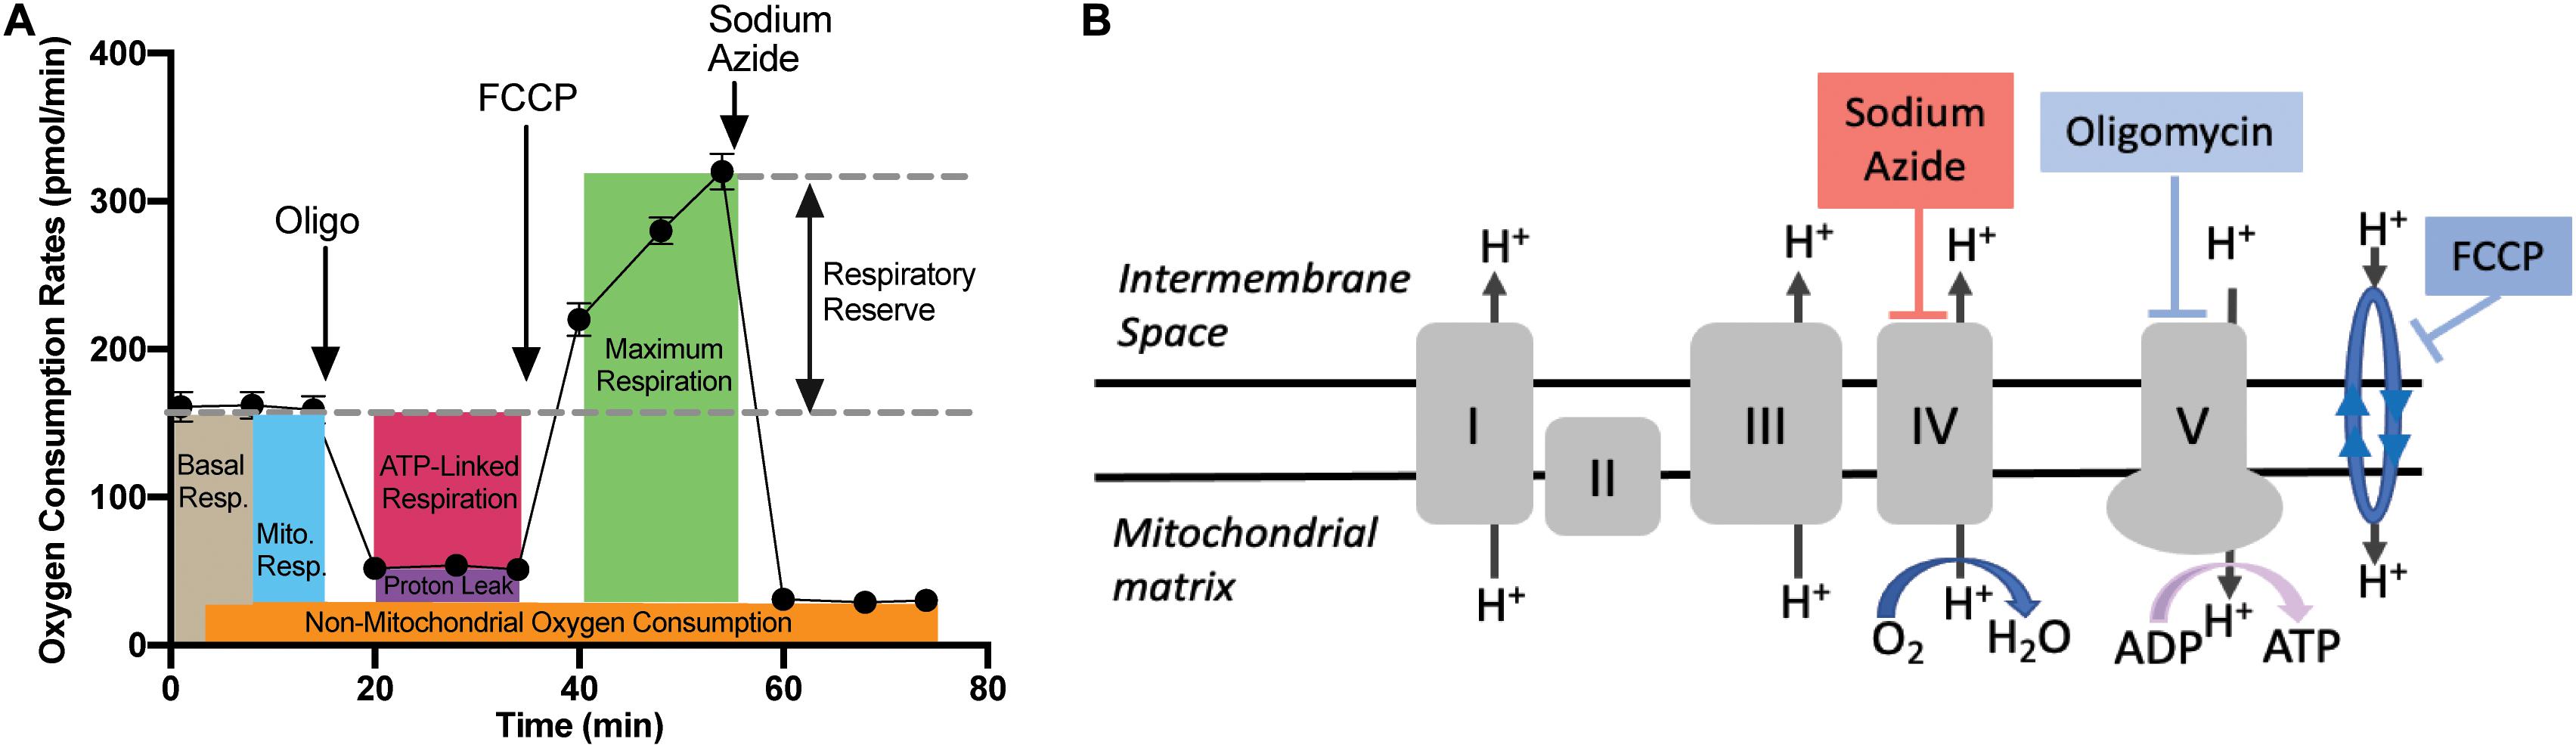
Figure 3. Mitochondrial Stress Test Assay Schematic. (A) Generalized schematic demonstrating that oxygen consumption rates (OCR) were measured during four respiration levels from each well containing larval zebrafish (n = 1/well) or filtered tank water (control). The four respiration levels include: (1) basal respiration prior to any additions; (2) following oligomycin addition; (3) following FCCP addition; and (4) following sodium azide addition. Basal respiration (light brown box) was calculated as the average OCR prior to oligomycin addition. Non-mitochondrial respiration (orange box) was calculated as the average OCR after sodium azide addition. Mitochondrial respiration (blue box) was calculated by subtracting the non-mitochondrial respiration from basal respiration. Proton leak (purple box) was calculated by subtracting non-mitochondrial respiration from the average OCR after oligomycin addition. ATP-linked respiration (pink box) was calculated by subtracting average OCR after oligomycin addition from basal respiration. The maximum respiration (green box) was measured following FCCP addition, and the respiratory reserve capacity was calculated by subtracting maximum respiration from basal respiration. (B) Graphic depicting where each mitochondrial effector affects mitochondrial respiration. Oligomycin blocks ATP-synthase (complex V), thereby blocking the synthase proton channel and thus movement of H+ ions into the mitochondrial matrix. FCCP disrupts the mitochondrial membrane potential and thus the proton gradient, which increases uncoupling in the mitochondrial membrane leading to a surplus of oxygen consumption. Finally, sodium azide blocks cytochrome c oxidase (complex IV), which leaves only a fraction of basal respiration that is non-mitochondrial respiration.
Statistical Analysis
GraphPad Prism 9 was used for all statistical analyses. Differences were considered significant at p < 0.05, and all data are represented as mean ± SEM unless otherwise noted. For all ANOVA analyses, normality and homoscedasticity (equal variance) were tested using QQ Plot and plotting residuals vs. predicted Y values, respectively. Log transformation was conducted if either normality of equal variance failed. For quantitative PCR analysis of tcap-3 and tenm3 larval expression over developmental stages, two-way ANOVA was used to evaluate main effects of time and gene isoform. Data obtained from resazurin assays were analyzed by two-way repeated measures (RM) ANOVA (rtTCAP-3, time) and three-way ANOVA (rtTCAP-3, time, and temperature). Respirometry data were analyzed by two-way RM ANOVA. Mitochondrial stress test data were analyzed by paired t-tests. Post-hoc pairwise comparisons were conducted using Tukey’s or Sidak’s post-hoc tests as appropriate. Significance was considered at p < 0.05.
Results
Expression of tenm3 and tcap3 in Zebrafish
During zebrafish development, qPCR analysis revealed that tenm3 and tcap3 expression are similar across embryonic stages (Figure 4). Gene expression amount (ng), as calculated from the generated standard curves. Only a main effect of life stage (p < 0.0001) was detected, but no effect of gene (p = 0.3416) or interaction (p = 0.6115) between gene and life stage detected. Levels of both tenm3 and tcap3 expression increased at 96 hpf compared to earlier time points, but no differences were detected between the two genes at any developmental stage. In adult zebrafish, RT-PCR revealed the presence of both tcap3 and tenm3 expression in adult skeletal muscle and brain tissues (Figure 5). Figure 5A demonstrates clear tcap3 expression in muscle and brain tissue, alongside the expression myc associated factor (max) and corticotropin-releasing hormone (crh), as positive tissue-specific control genes for muscle and brain tissue, respectively. Figure 5B demonstrates tenm3 and tcap3 expression in brain tissue, while only tcap3 is present in muscle tissue. β-actin expression is used as an internal standard to assess the quality and efficacy of expression analyses (Figure 5B).
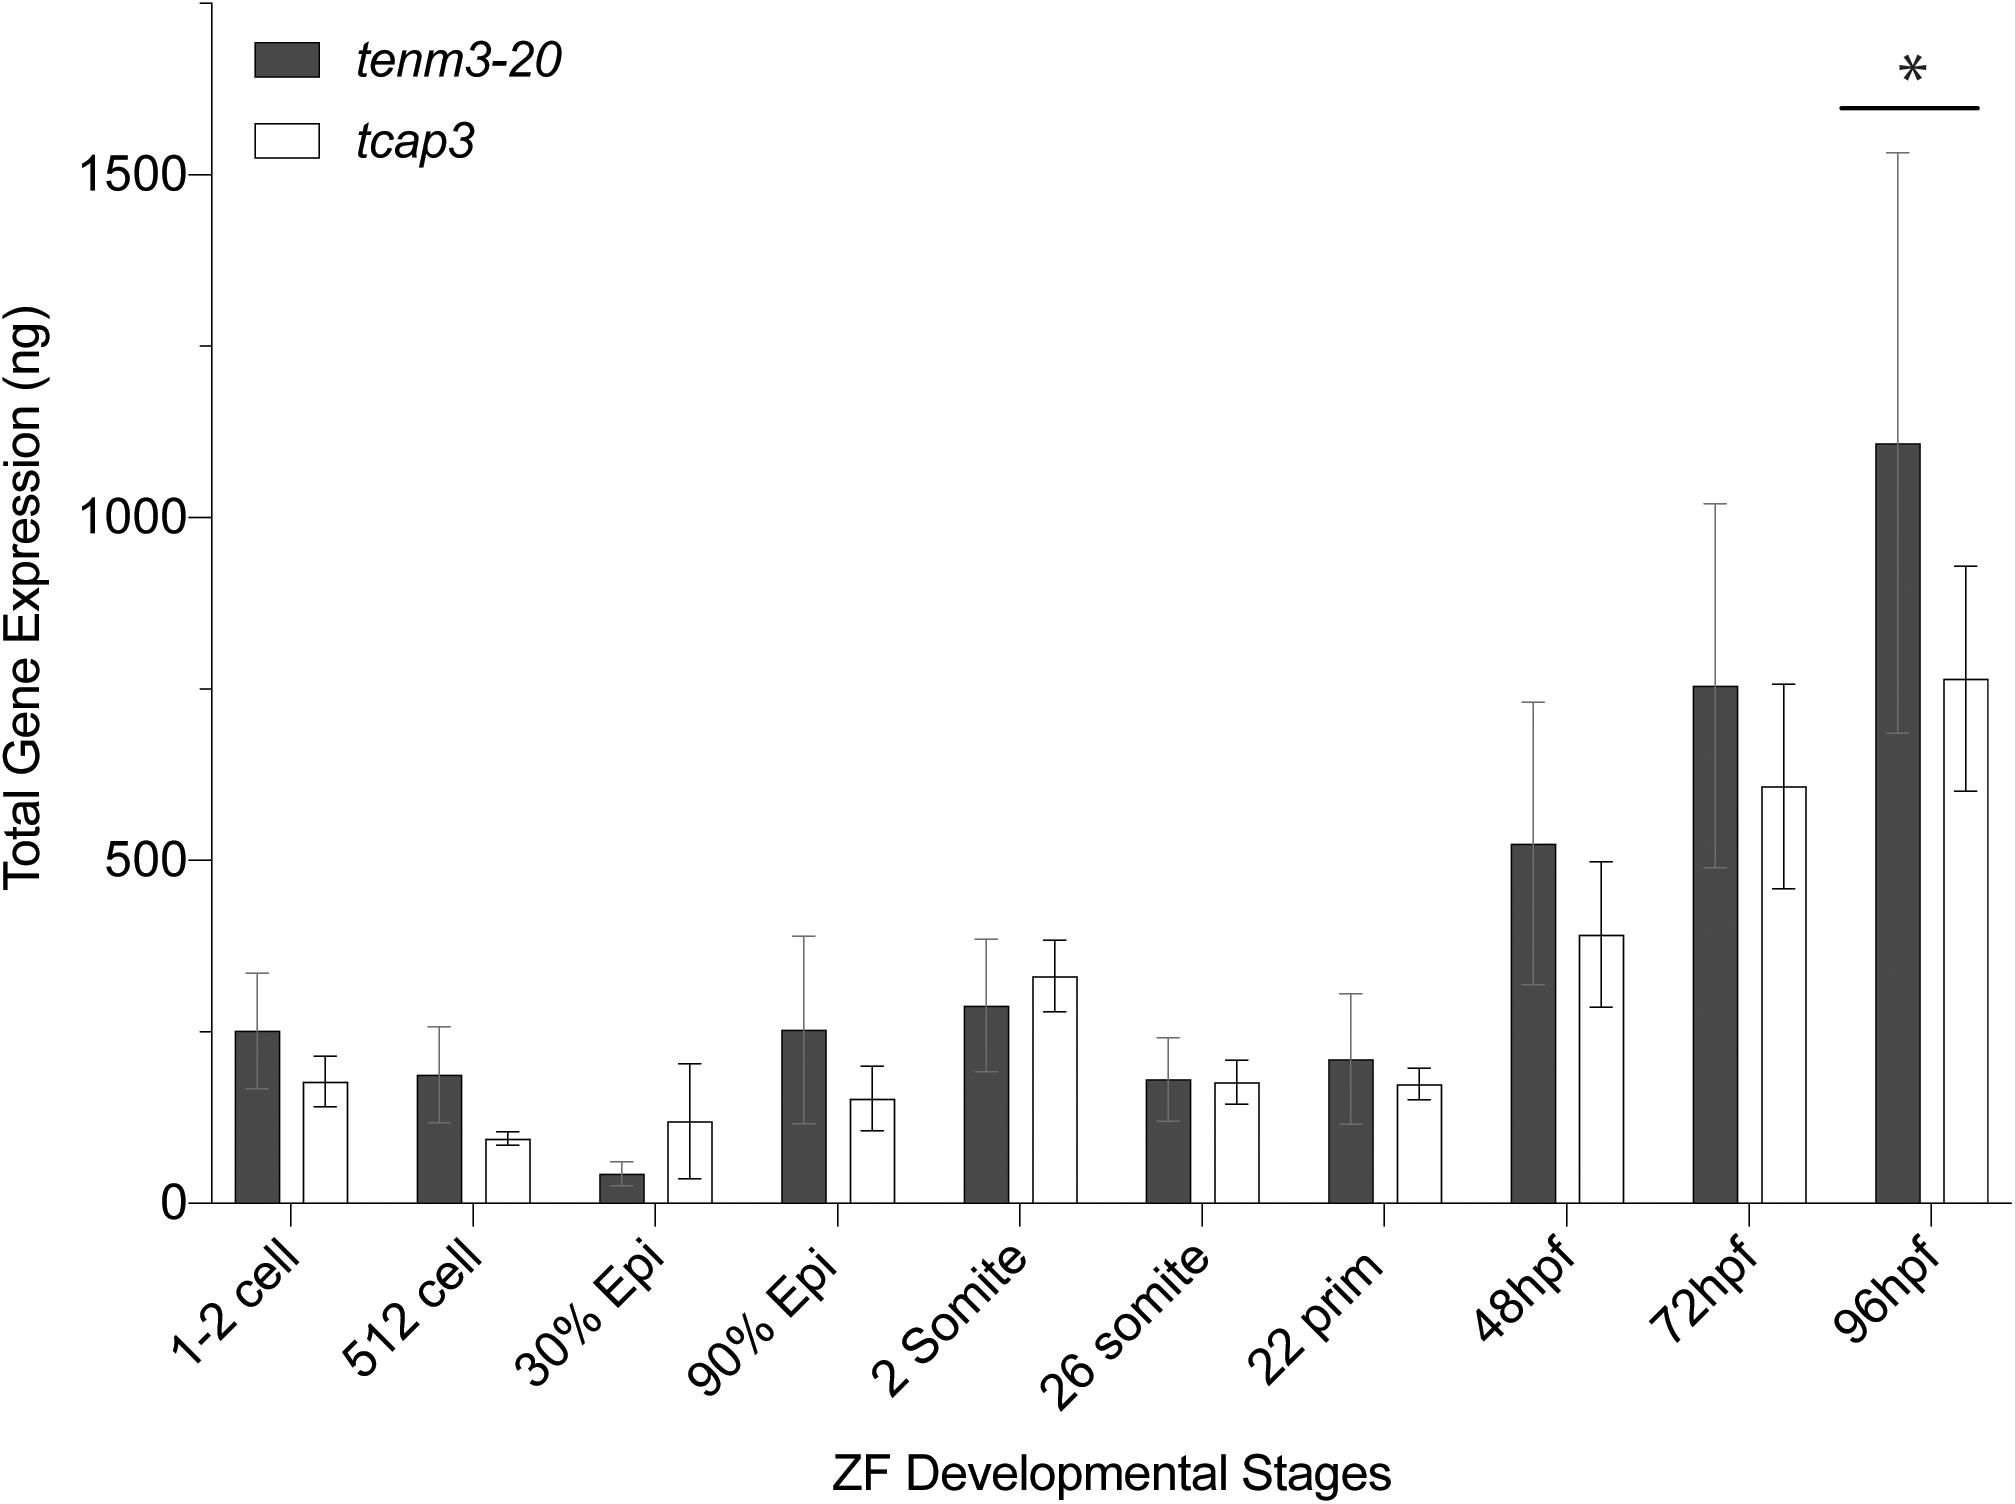
Figure 4. Developing zebrafish larvae express tenm3 and tcap3. Expression profiles for tenm3 and tcap3 during development. Total gene expression was normalized to starting cDNA concentration. Relative starting mRNA amount (ng) was calculated for each triplicate sample using the generated standard curves. Values are expressed as Mean ± SEM (n = 5 pools; pools of 20 larvae at each developmental stage). Two-way repeated measures mixed-model ANOVA analysis revealed a main effect of life stage (p < 0.0001), but no main effect of gene product (p = 0.3416). Expression of tenm3 and tcap3 increased at 96 hpf compared to earlier time points (*p < 0.005).
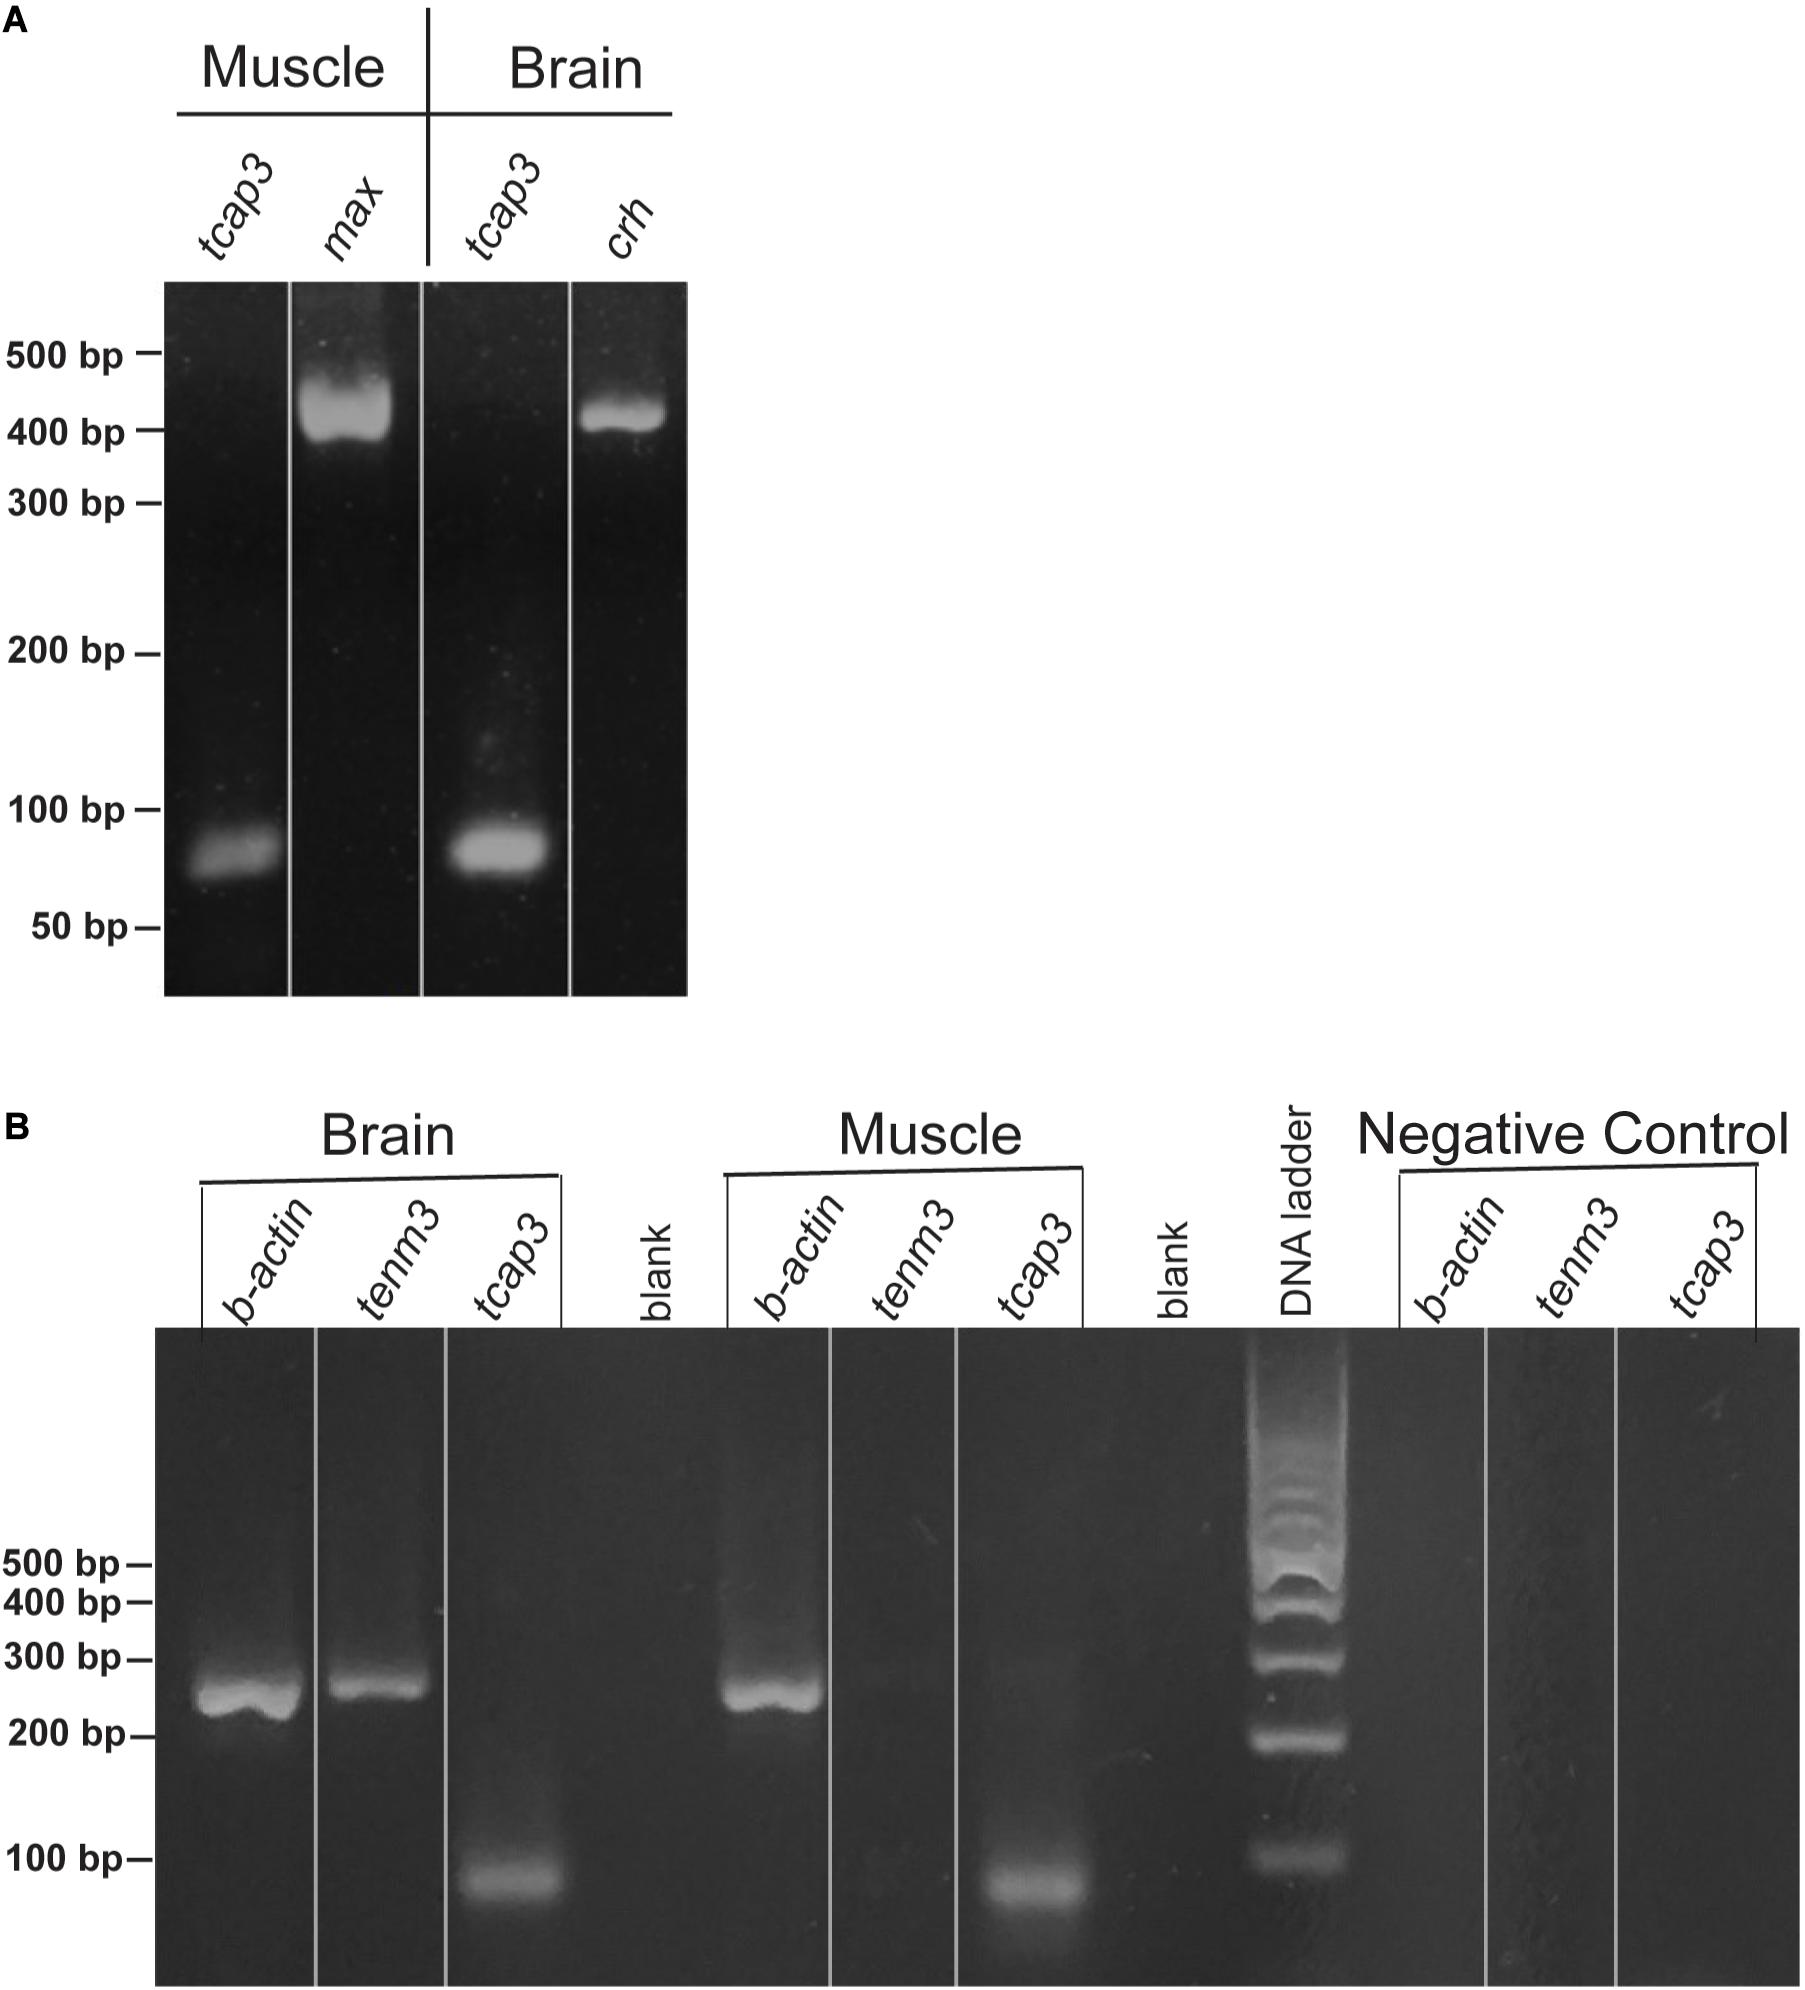
Figure 5. Zebrafish skeletal muscle and brain expresses tenm3 and tcap3. Validation for the expression of tenm3 and tcap3 in the muscle and brain of adult zebrafish tissues, visualized using a 2% agarose gel (lines on gels only indicate lane markers, not image splicing). (A) Adult zebrafish tissues were validated using tissue-specific gene controls, max (muscle) and corticotropin-releasing hormone, crh (brain), as the tissue specific gene expression was confirmed along with tcap3 expression. (B) Sample loading and PCR efficiency were validated for tenm3 and tcap3 by the loading control: β. actin and negative control. All band sizes were consistent with expected band sizes. (tcap3, 78 bp; max, 465 bp; crh, 465 bp; β. actin, 250 bp).
TCAP-3 Increases Metabolic Activity, but Not Motility, in Larval Zebrafish
Zebrafish larvae were pooled in 6-well plate well (10 larvae/well) containing resazurin solution and were treated with either control (PBS) or various doses of rtTCAP-3 (0.5, 1.0, 5.0, 10.0 μM) for 48 h (n = 4 wells). Overall, both time (p < 0.0001) and treatment (p < 0.0001) affected metabolic activity. Additionally, a time by temperature (p < 0.0001) effect was also detected. More specifically, the high doses of rtTCAP-3 treatment increased metabolic activity in larval zebrafish (Figure 6A). After 24 h, 5.0 μM and 10 μM rtTCAP-3 treatment increased metabolic activity (6,003.50 ± 554.4 AFU and 4,953.50 ± 554.4 AFU, respectively), compared to other treatments (∼2,200 AFU). Also, at 48 h, 5.0 μM and 10 μM rtTCAP-3 treated larvae had increased metabolic activities (9,256.50 ± 554.4 and 10,854.83 ± 554.4 AFU, respectively), compared to the other groups (∼4,200 AFU). Additionally, at 48 h, metabolic activity for 10 μM rtTCAP-3 treated larvae was greater than the metabolic activity of the 5.0 μM rtTCAP-3 treated larvae (Figure 6A).
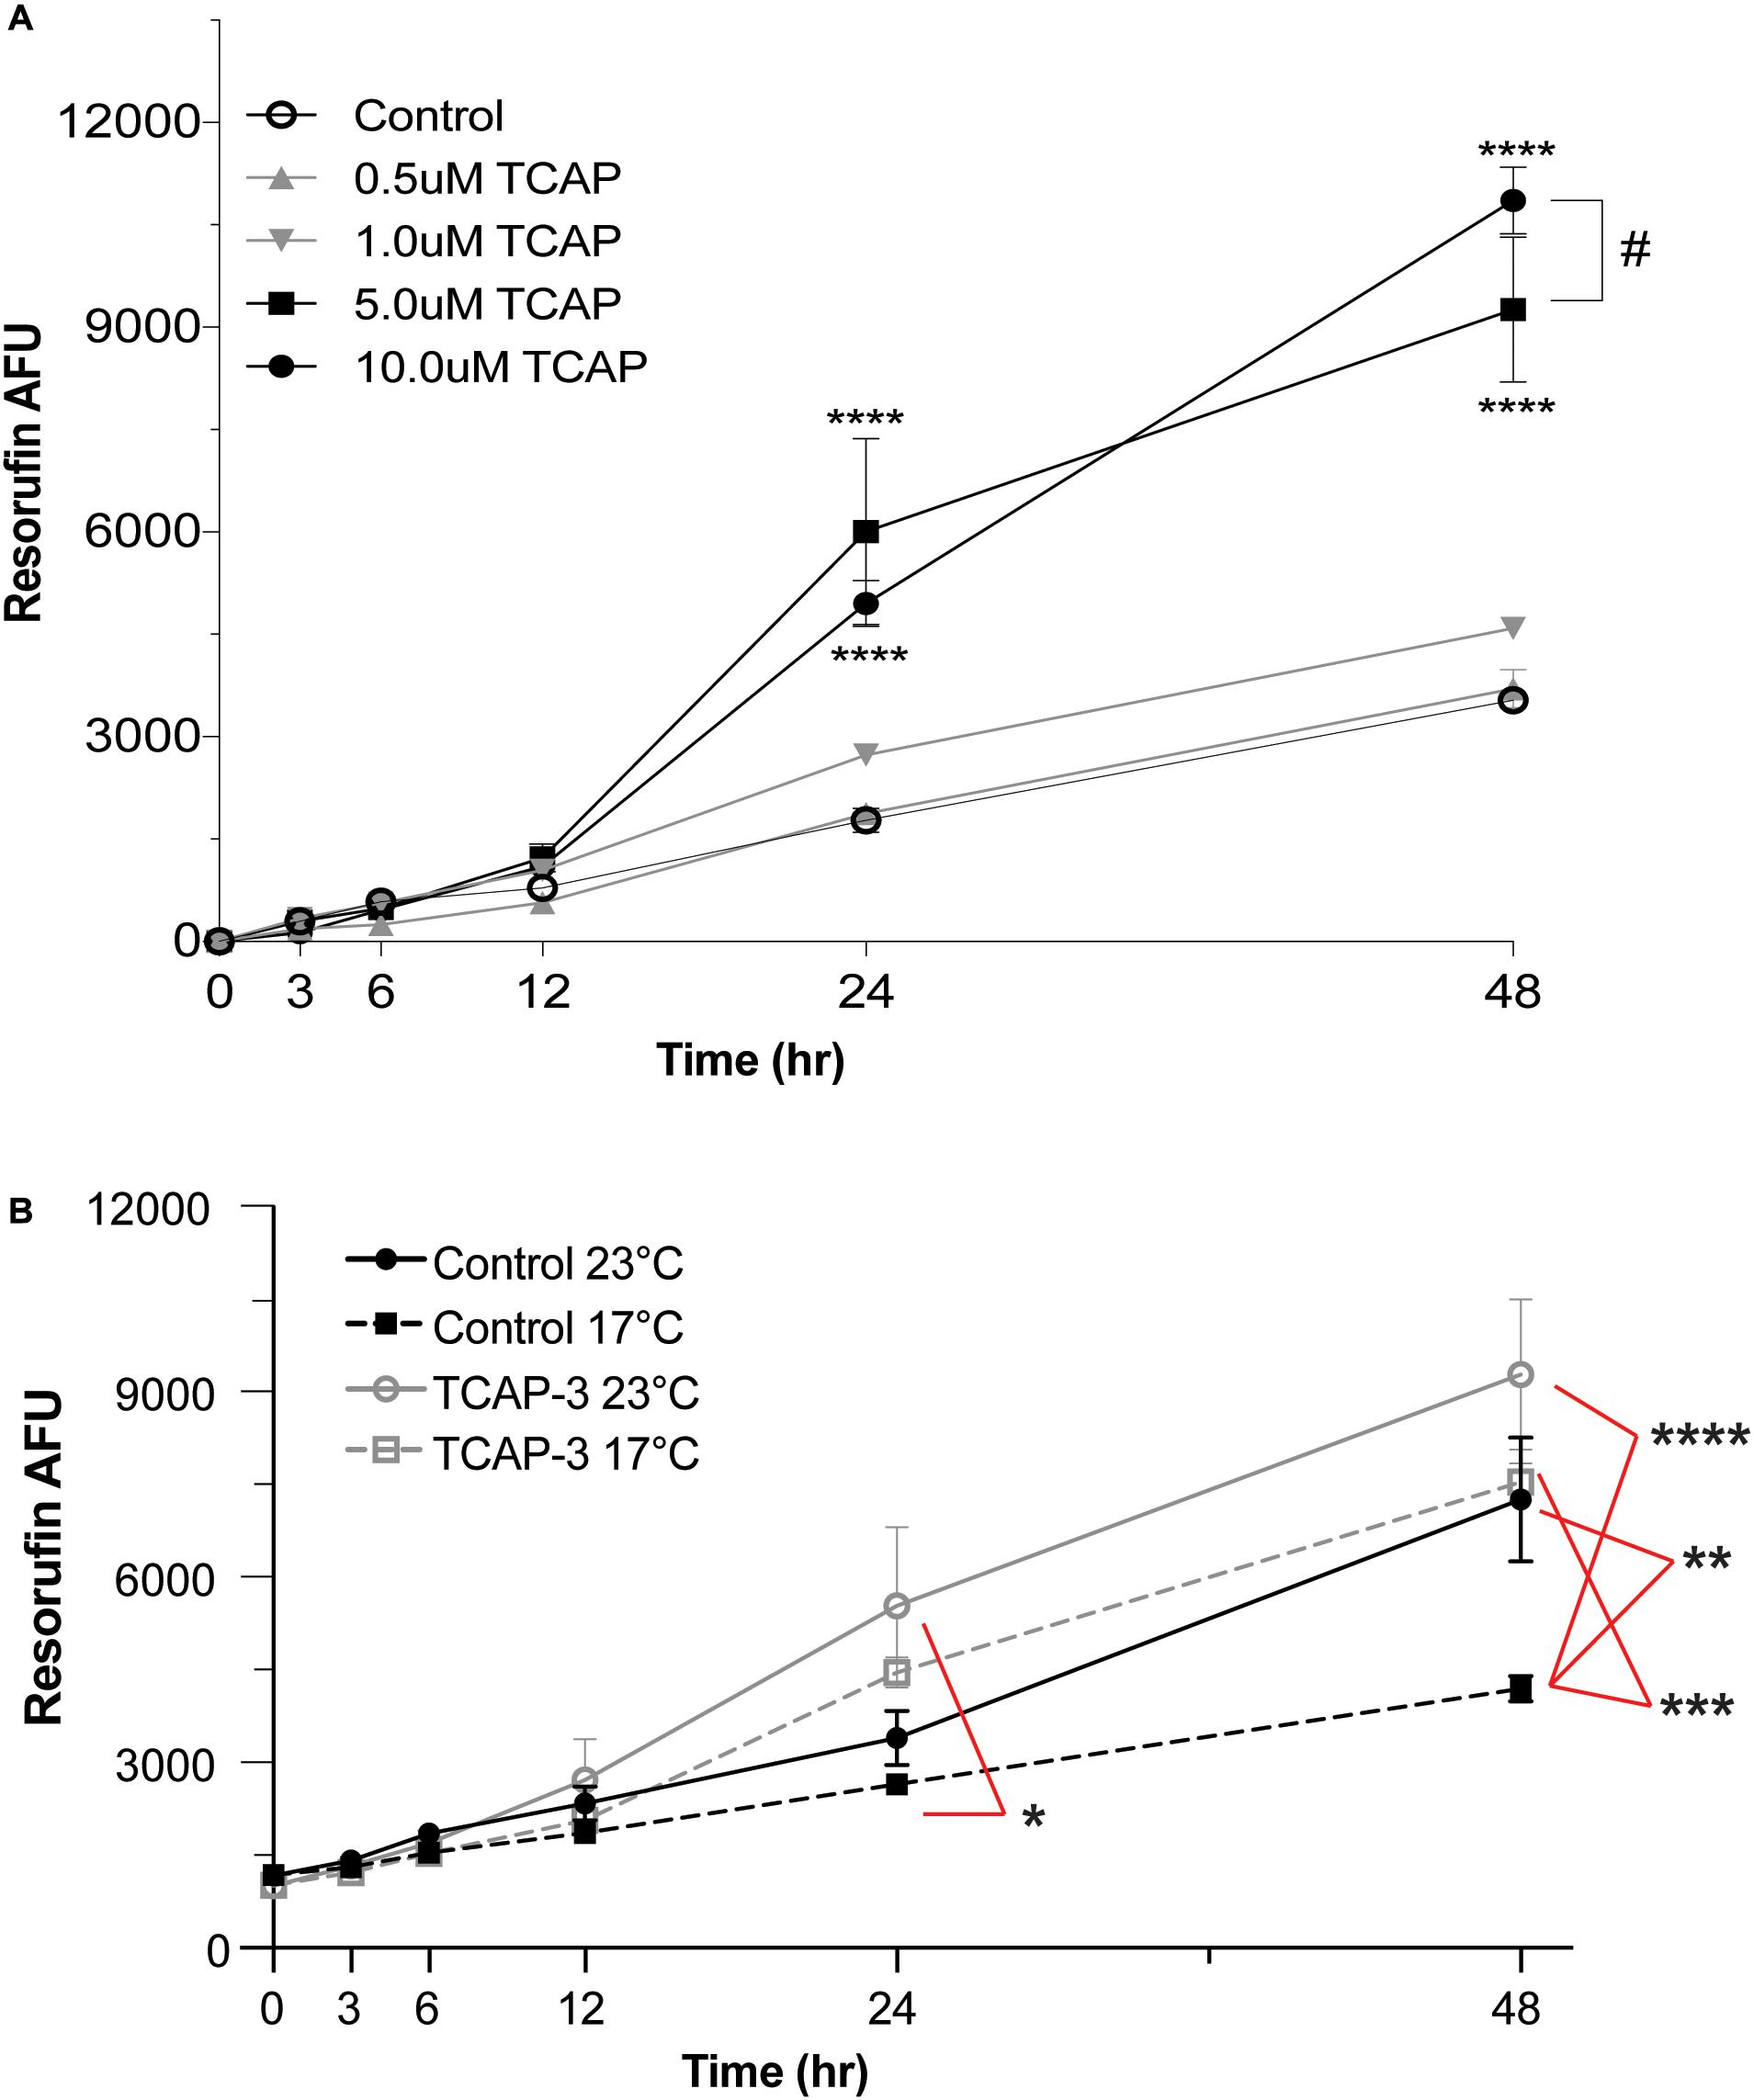
Figure 6. rtTCAP-3 treatment enhances metabolic activity in zebrafish larvae. Zebrafish larvae were pooled in 6-well plate well (10 larvae/well) containing resazurin solution and were treated with either control (PBS) or various doses of rtTCAP-3 (0.5, 1.0, 5.0, 10.0 μM) for 48 h (n = 4 wells). (A) Total resorufin AFU was measured at different timepoints from pooled larvae groups treated with either control (PBS, 0 μM; ∘) or various doses of rtTCAP-3 [(0.5 μM; ▲), (1.0 μM; ▼), 5.0 μM; ■), and (10 μM; ∙)] for 48 h. 5 μM and 10 μM rtTCAP-3 doses increased total resorufin AFU at 24 and 48 h compared to all other treatments (****p < 0.0001). 10 μM resorufin AFU was greater than 5.0 μM at 48 h (#, p = 0.03). (Mean ± SEM; Two-way RM ANOVA, Tukey’s post-hoc test; n = 4 (10 larvae/well, four total wells). (B) Total resorufin AFU was measured over 48 h for PBS-control groups or 5.0 μM rtTCAP-3 groups exposed to either 23 or 17°C temperatures. At 24 h, the low temperature stress control (17°C; dashed gray line, □) total resorufin AFU was decreased, compared to room temperature rtTCAP-3 treated (23°C; solid black line, ∙; *p = 0.0192). At 48 h, the low temperature stress control group (17°C; dashed gray line, □) total resorufin AFU was decreased, compared to both low and room temperature rtTCAP-3 group (dashed black line, ∙, **p = 0.0022; solid black line, ■, ***p < 0.0001, respectively). (Mean ± pSEM; Three-way ANOVA, Tukey’s post-hoc test; n = 4 (10 larvae/well, four total wells); α < 0.05).
To further assess the effects of rtTCAP-3 on larval zebrafish metabolic activity, larvae were subjected to a low temperature stress. Zebrafish larvae were treated with either control (PBS) or rtTCAP-3 (5 μM) and subsequently placed in either 23 or 17°C water temperature conditions. Main effects of time (p < 0.0001) and treatment (p = 0.0344), with no effect of temperature (p = 0.0752) were detected. When evaluating interactions, only time by treatment (p < 0.0001) and time by temperature (p = 0.0029) effects were detected. More specifically, in control treated zebrafish larvae after 48 h of exposure, total metabolic activity was decreased in low temperature water (4,188 ± 654.4 AFU at 17°C) compared to warmer water temperature (7,255 ± 703.2 AFU at 23°C) (Figure 6B). At 24 h, the only detected difference in metabolic activity was between control treated larvae at 17°C (2,645 ± 654.4 AFU) and rtTCAP-3 treated larvae at 23°C (5,530 ± 654.4 AFU). At 48 h, control treated larvae at 17°C (4,188 ± 654.4 AFU) had lower metabolic activity than rtTCAP-3 treated at 17°C and 23°C (7,531 ± 654.4 and 9,277 ± 654.4 AFU, respectively).
Basal locomotor function of larval zebrafish treated with either control (1× PBS) or rtTCAP-3 (5 μM) was assessed using DanioVision observation chambers. No changes were observed between the two cohorts after 5 min of recording. Neither average swimming velocity (Figure 7A) nor overall distance travelled (Figure 7B) were affected by rtTCAP-3 treatment.
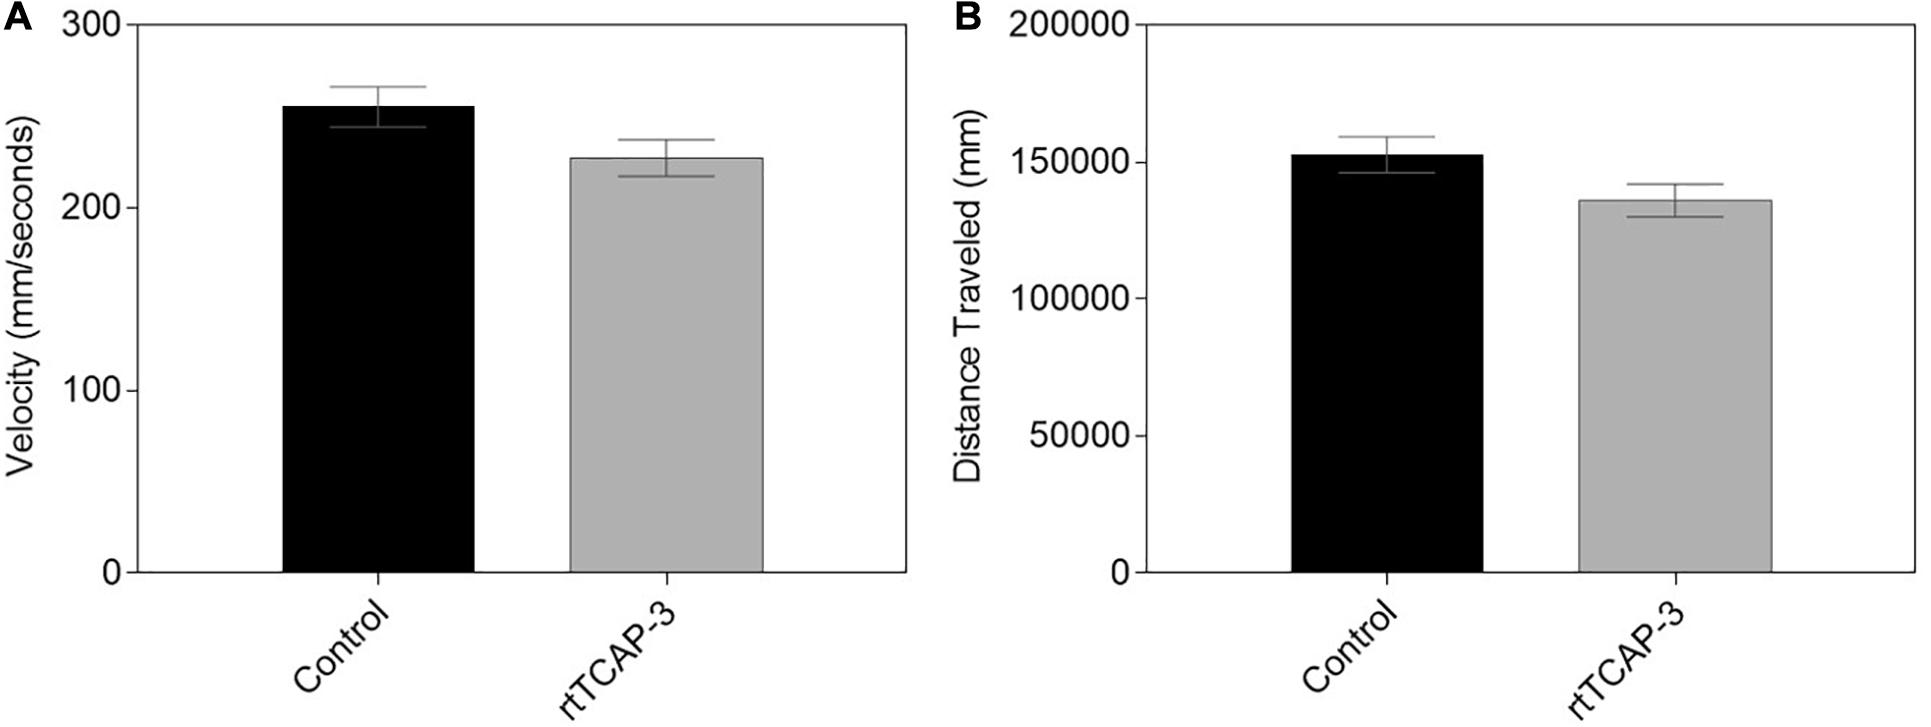
Figure 7. rtTCAP-3 treatment did not affect the motility of 5 dpf zebrafish larvae. (A,B) 5 dpf larvae treated with control (PBS) or rtTCAP-3 (5 μM) had similar total distances traveled (mm) and velocities (mm/s). (Mean ± SEM; control n = 80, rtTCAP-3 n = 80; t-test; α < 0.05).
TCAP-3 Increases Oxygen Consumption in Adult Zebrafish
To further evaluate the role of TCAP-3 in metabolic activity regulation, adult zebrafish were intraperitoneally injected with either control (PBS) or rtTCAP-3 (120 ng/g). Total metabolic activity, as measured by resorufin AFU/g levels, increased from time zero to 48 h of the assay. After 48 h, rtTCAP-3-treated adults had increased metabolic activity as total resorufin AFU/g (28,823.65 ± 2,265 AFU/g) increased compared to control levels (18,957.72 ± 2,265 AFU/g) (Figure 8).
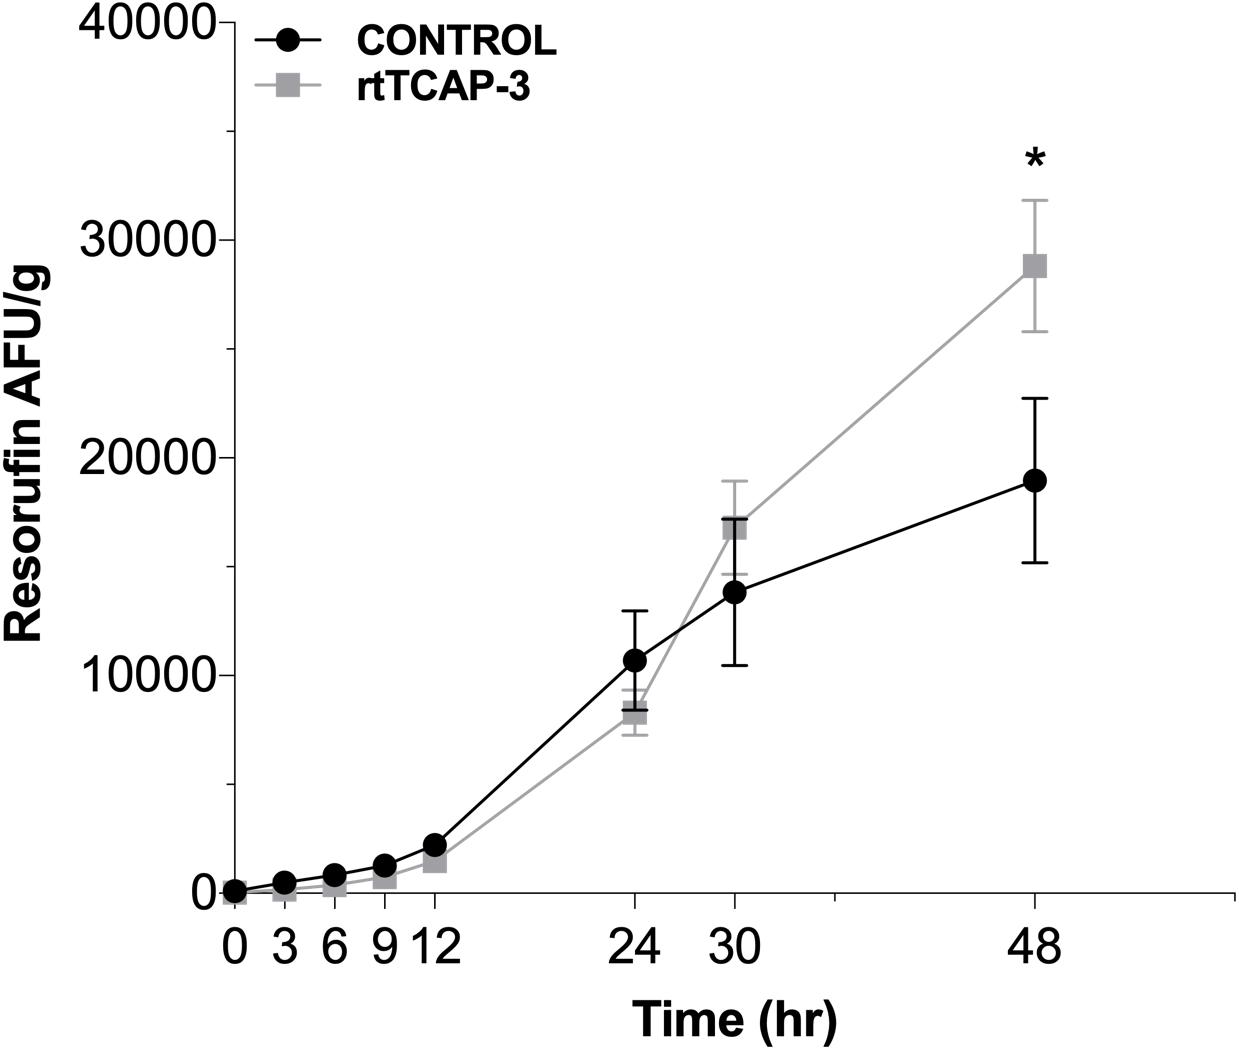
Figure 8. rtTCAP-3 enhances metabolic activity in adult zebrafish. Total resorufin FI (AFU/g) were measured at different times for adult zebrafish intraperitoneally injected with either PBS-control (0 ng/g; ∙) or rtTCAP-3 (120 ng/g; ■) using resazurin. At 48 h, the AFU/g of the rtTCAP-3 treatment was greater than the control (*p = 0.0022). (Mean ± SEM; Two-way RM Mixed Model ANOVA, Sidak’s post-hoc test; n = 6; α < 0.05; Asterisks (*) indicate significantly different values).
Additionally, oxygen consumption, as measured in metabolic swim chambers, was also affected by rtTCAP-3 treatment in adult zebrafish. Oxygen levels within the swim chambers were measured every 10 s for 6 min generating oxygen traces (Figures 9B,C), which were used to calculate VO2 (mgO2/kg/h) (Figure 9A). Overall, main effects of swimming speed (p = 0.0014) and treatment (p = 0.0030) were detected. More specifically, rtTCAP-3-treated zebrafish had increased basal oxygen consumption rate (VO2) compared to control zebrafish (3.15 × 10⁻⁸ ± 4.22 × 10⁻⁹ vs. 1.71 × 10⁻⁸ ± 4.22 × 10⁻⁹ mgO2/L). At basal swimming speed, VO2 levels were increased by rtTCAP-3 treatment (1.44 × 10⁻⁸ ± 2.34 × 10⁻⁹ vs. 2.61 × 10⁻⁸ ± 3.05 × 10⁻⁹ mgO2/kg/h, respectively). When swimming speed was accelerated, rtTCAP-3 increased VO2 levels compared to vehicle control (3.69 × 10⁻⁸ ± 4.04 × 10⁻⁹ vs. 2.06 × 10⁻⁸ ± 3.56 × 10⁻⁹ mgO2/kg/h, respectively). Additionally, rtTCAP-3 treated fish exhibited increased VO2 when swimming speed was accelerated (3.69 × 10⁻⁸ ± 4.04 × 10⁻⁹ vs. 2.61 × 10⁻⁸ ± 3.05 × 10⁻⁹ mgO2/L), and no change in VO2 was detected in vehicle treated zebrafish when swimming speed was increased (Figure 9A).
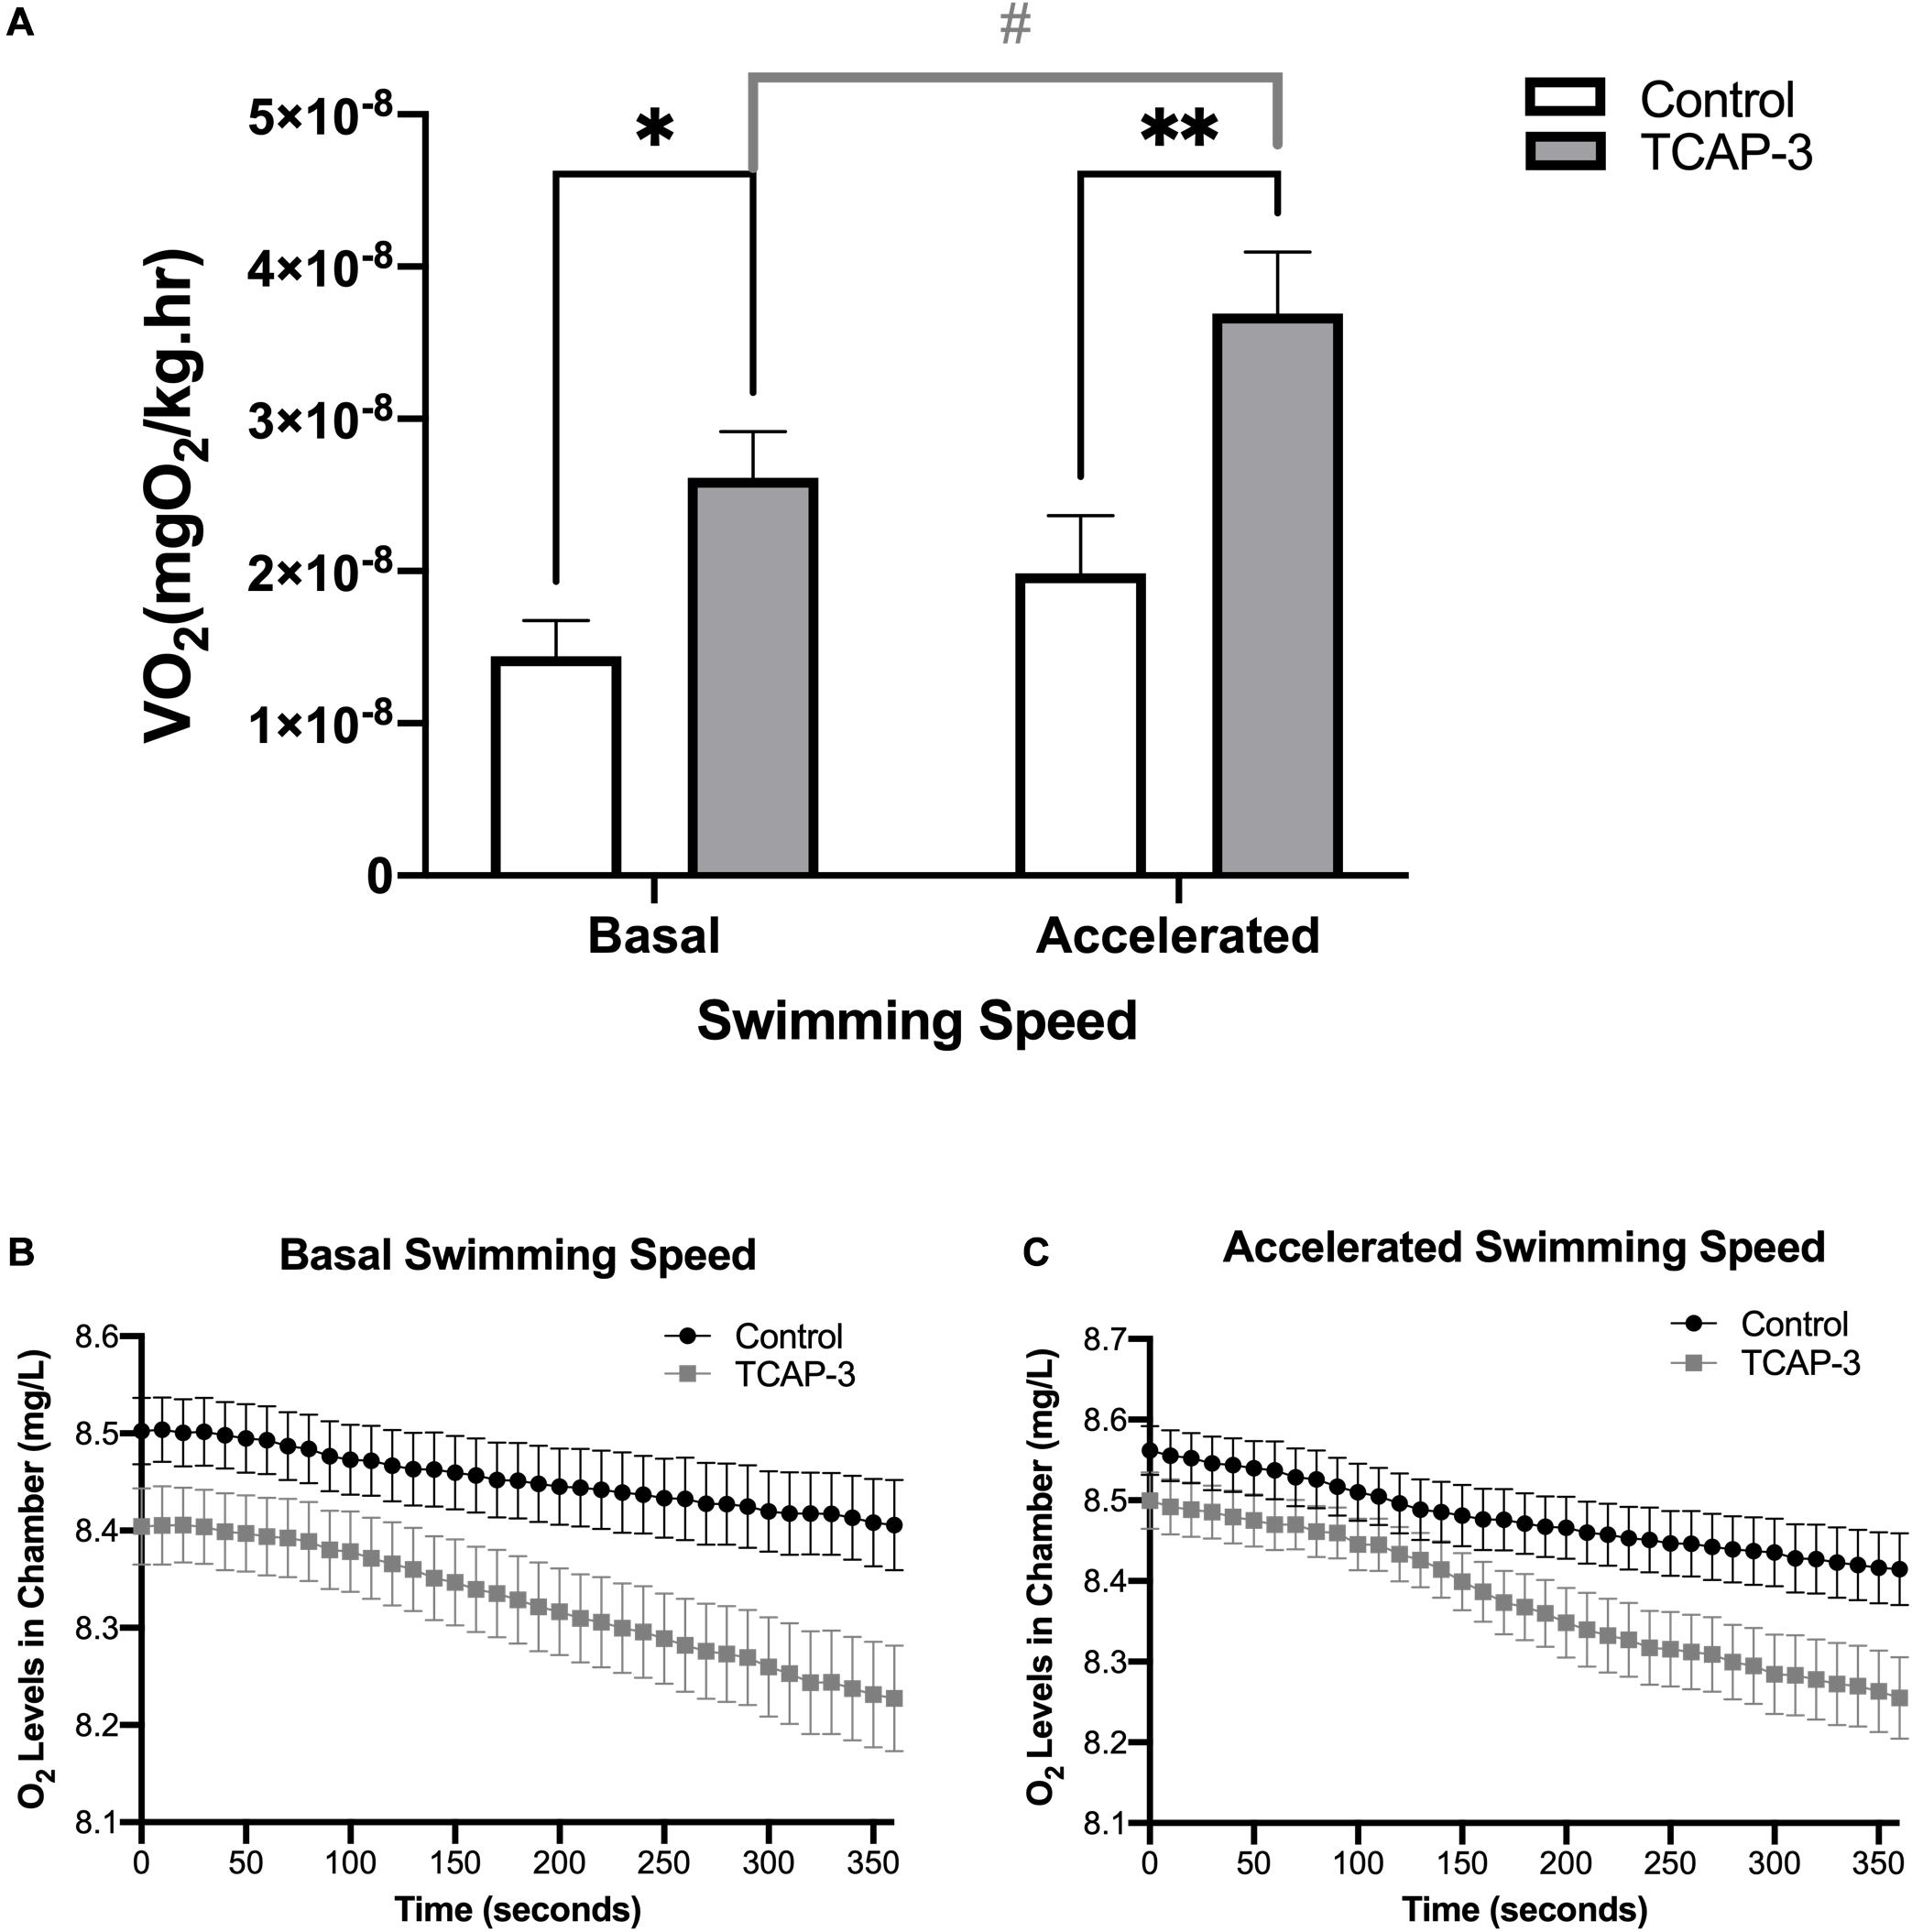
Figure 9. rtTCAP-3 increases oxygen consumption in adult zebrafish. Oxygen consumption (O2) was measured in adult zebrafish 24 after intraperitoneal injection with either PBS-Control (0 ng/g) or rtTCAP-3 120 ng/g). Oxygen levels inside the swimming chamber were measured every 10 s for 360 s during (B) basal and (C) accelerated swimming conditions. Oxygen consumption rates (VO2) were calculated from oxygen level traces (B,C) for comparison. (A) VO2 levels were increased in treated zebrafish (rtTCAP-3; ∙) compared to the control (PBS-control; ■) during basal swimming conditions (*p = 0.0363) and accelerated swimming conditions (**p = 0.0018). VO2 levels were increased in rtTCAP-3 treated zebrafish when swimming speed was increased (#p = 0.0056) (Mean ± SEM; Two-way RM Mixed Model ANOVA, Sidak’s post-hoc test, n = 10; α < 0.05.).
Larval Zebrafish Have Increased Mitochondrial Bioenergetics Following rtTCAP-3 Treatment
To understand if rtTCAP-3 effects metabolism at the level of the mitochondria, zebrafish bioenergetics were measured in larvae treated with PBS-control or rtTCAP-3 using XFE24 Extracellular Flux Analyzer: mitochondrial stress test (outlined in Figure 3). Real-time oxygen consumption rates (OCR) were measured throughout the duration of the protocol (Figure 10A), which included the addition of oligomycin, FCCP, and sodium azide (Figures 10A,B). Average OCR values were calculated for the pre-oligo, oligo, FCCP, and post-azide panels, as denoted by horizontal lines in Figure 10A. Figure 10B outlines the respiration calculations made for basal, mitochondrial, non-mitochondrial, ATP-linked, and maximum respiration, as well as proton leak and respiratory reserve capacity. This schematic also includes the average OCR values at the four levels for both control and TCAP-3 treated larval zebrafish in relationship to calculations used for comparisons (Figure 10B). Overall, rtTCAP-3 treatment increased basal OCR by an average of ∼50 pmol/min or 25% (Figure 10C), mitochondrial respiration 33% (Figure 10E), mitochondrial proton leak 26% (Figure 10G), and respiratory reserve capacity (Figure 10I). Neither non-mitochondrial respiration (Figure 10D), ATP-linked respiration (Figure 10F), nor maximum respiration (Figure 10H) were affected by rtTCAP-3 treatment.
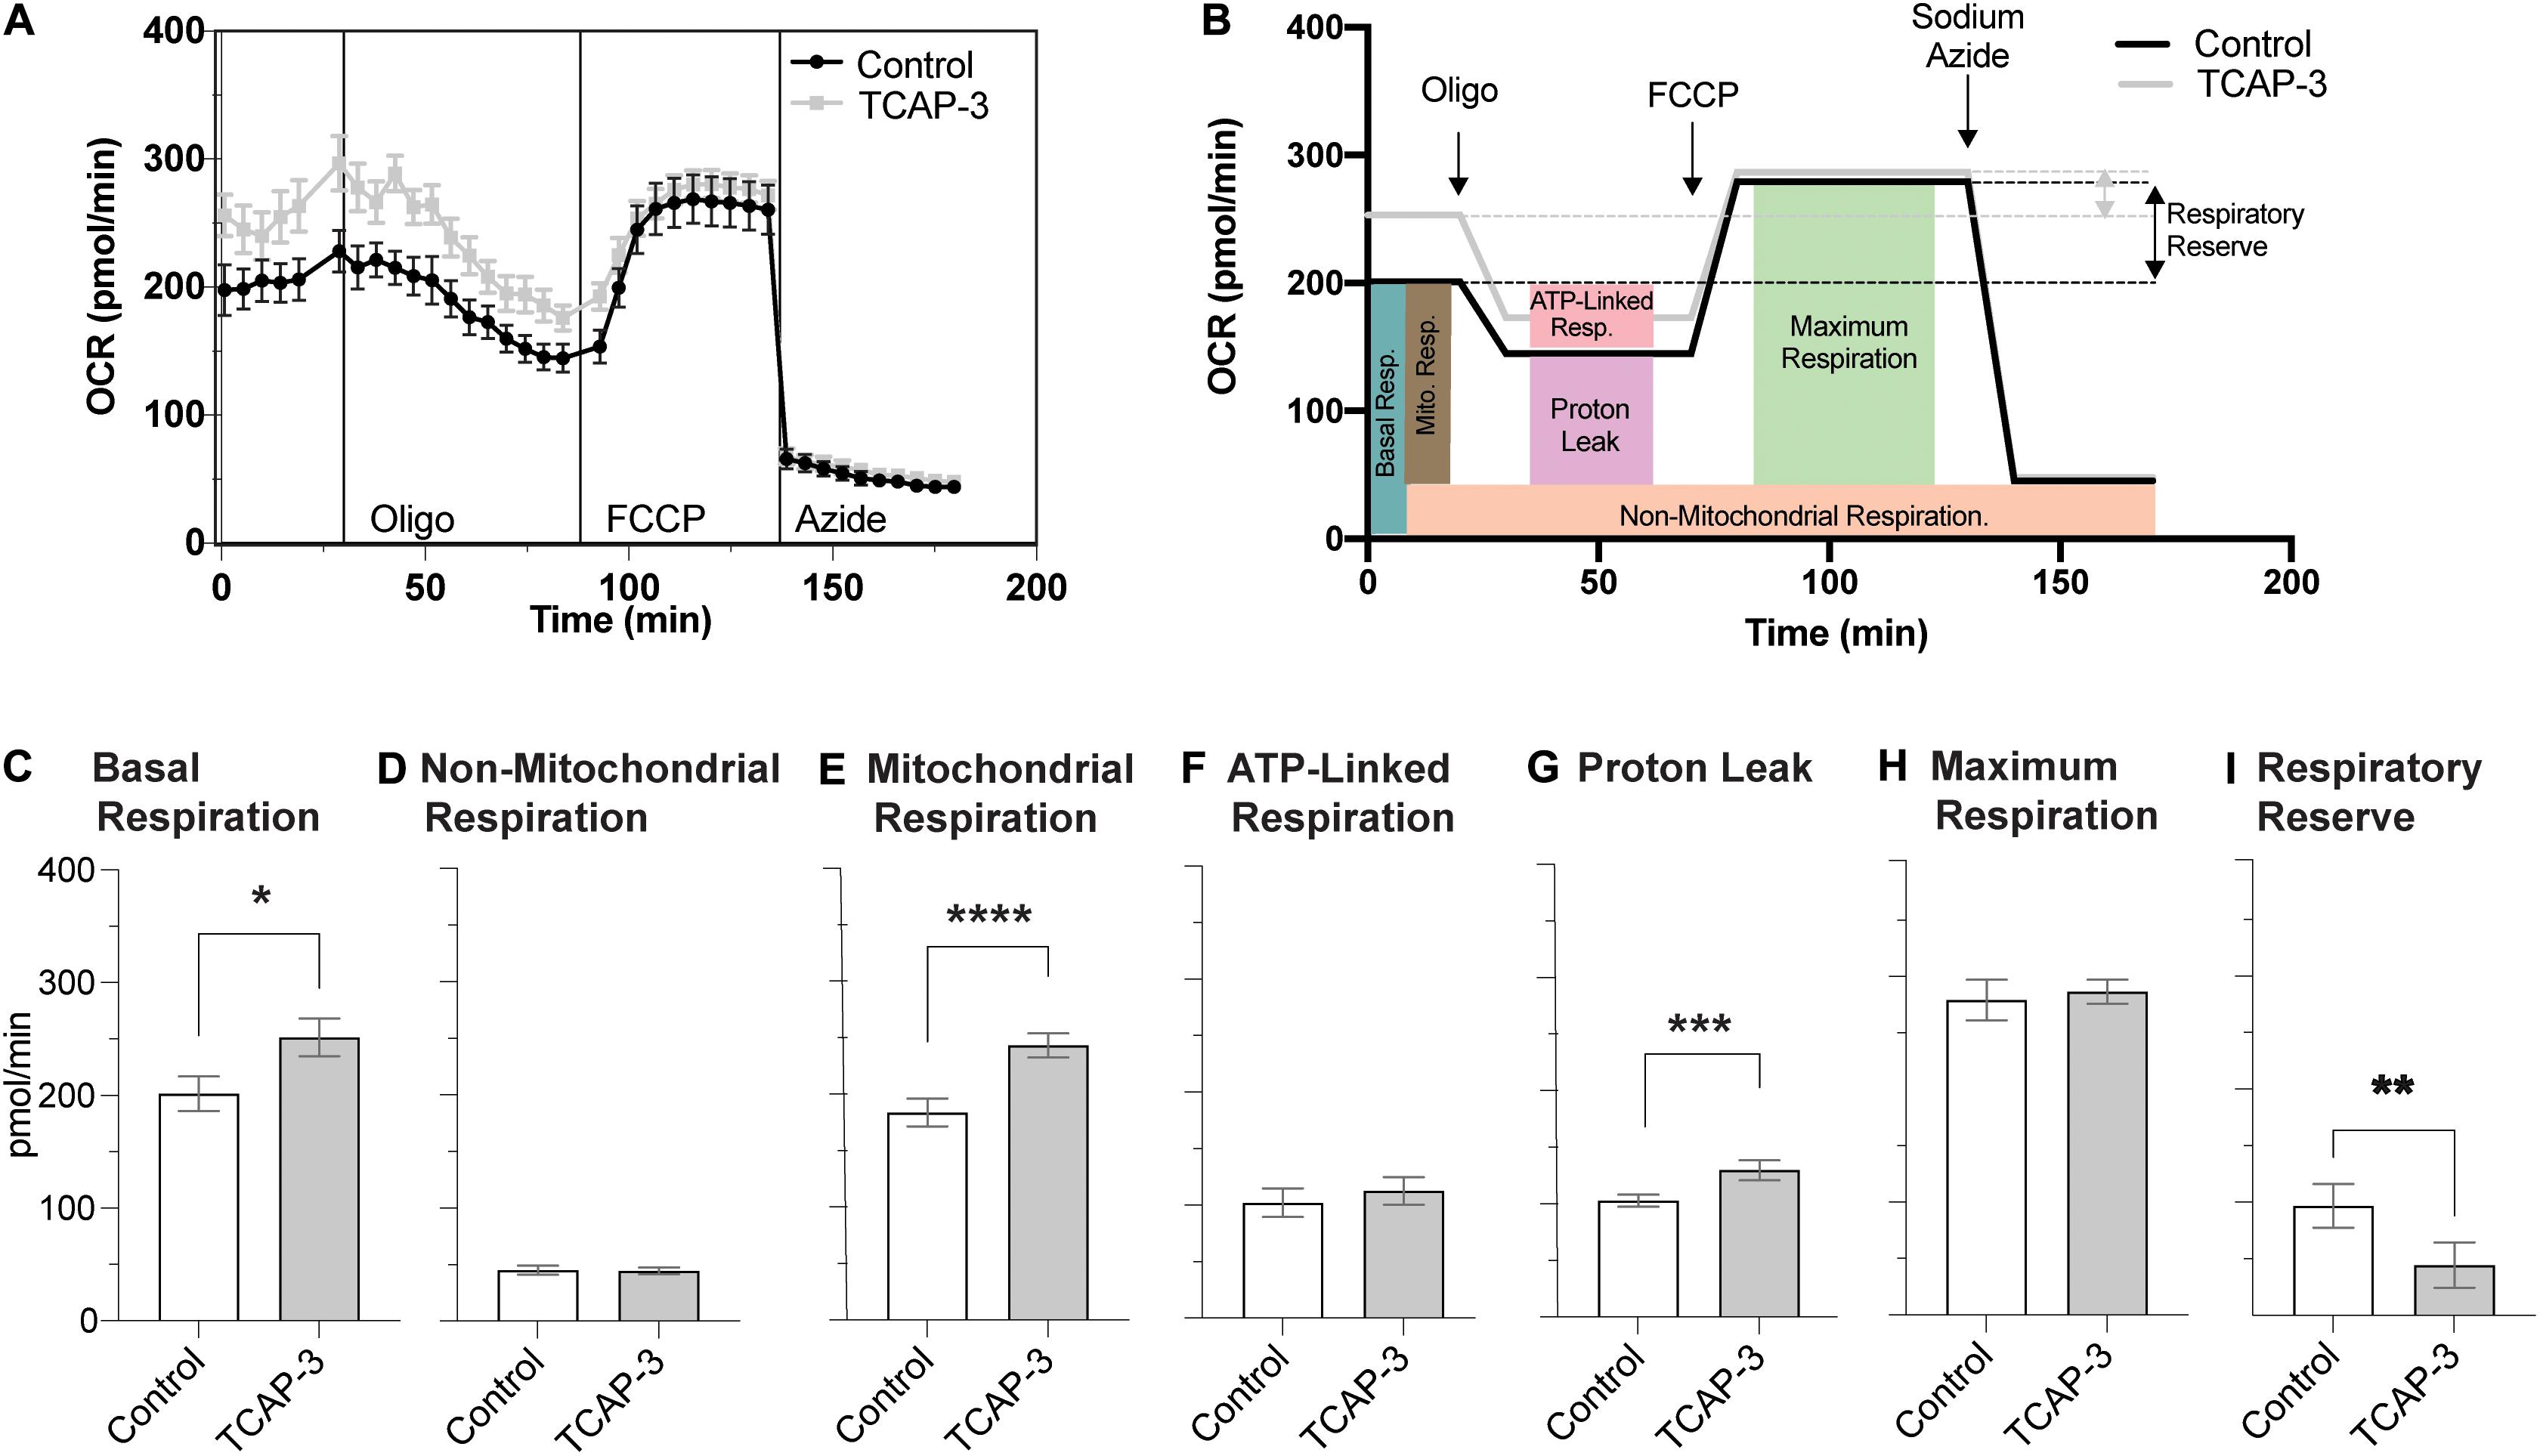
Figure 10. rtTCAP-3 treatment increased OCR and mitochondrial function in 2 dpf zebrafish larvae. (A) A diagram showing oxygen consumption rates (OCR) for control (PBS, black line) and rtTCAP-3 treated (gray line) zebrafish larvae following the addition of oligomycin, FCCP, and sodium azide. (B) Average OCR values for basal, oligo, FCCP, and sodium azide panels of the mitochondrial stress protocol. Colored boxes depict respective measurements of various aspects of mitochondrial respiration: (C) basal respiration (*p = 0.0548); (D) non-mitochondrial respiration; (E) mitochondrial respiration (****p = 0.0010); (F) ATP-linked respiration; (G) proton leak (***p = 0.0191); (H) maximum respiration; (I) respiratory reserve capacity (**p = 0.0401) (Mean ± SEM; n = 20 per group; Paired t-test; α < 0.05.).
Discussion
Herein, the effects of rtTCAP-3 were investigated across fish life-stages using multiple in vivo approaches and metabolic assays. Considering TCAP-3 had not yet been studied in zebrafish, it was unknown if TCAP-3 or any TCAP associated metabolic functions were conserved in fish. TCAP peptides are located on the C-terminal portion of the highly conserved teneurin proteins. The TCAP region can be cleaved from teneurin as a bioactive peptide (Qian et al., 2004), and some evidence suggests that TCAP can be independently transcribed, suggesting functional independence from its teneurin (Qian et al., 2004; Chand et al., 2013). Previous reports have verified the expression of tenm3 in zebrafish larvae (Mieda et al., 1999; Antinucci et al., 2013; Antinucci et al., 2016) and adults (Tucker and Chiquet-Ehrismann, 2006) but the expression pattern of tenm3 and tcap3 during development or across tissues was not clear. Here, the expression of tcap3 and teneurin-3 (tenm3) was evaluated in developing zebrafish and in adult zebrafish muscle and brain tissue. Real-time qPCR analysis demonstrated that tcap3 and tenm3 expression profiles do not differ from each other during development. However, the expression profiles of both tcap3 and tenm3 change across developmental stages, with increased expression of both products observed well after the maternal to zygotic transition of transcriptional control (between 512-cell and 90% epiboly) as levels increase after hatching (96 hpf). In addition, RT-PCR demonstrated the expression of tenm3 and tcap3 in adult zebrafish tissues. Interestingly, the presence of tcap3 expression was detected in both muscle and brain tissue, while tenm3 expression was only detected in adult brain tissue. This expression profile in adult muscle tissue, tcap3 expression in the absence of tenm3 expression, suggests the transcription of tcap3 independent from tenm3. This is consistent with previous reports of independent transcript of tcap in rodents (Chand et al., 2013) and suggests that tcap3 may have local metabolic regulatory activity in adult skeletal muscle as demonstrated in rodents and C. intestinalis (D’Aquila et al., 2017; D’Aquila, 2018; Hogg et al., 2018).
To test if TCAP-3 elicits metabolic activity regulation, a low-cost and non-invasive assay that uses resazurin reduction to resorufin, which is fluorescent, was utilized to observe the effects of rtTCAP-3 treatment across zebrafish life stages. Resazurin, a blue, non-fluorescent dye, is reduced by dehydrogenase enzymes, while NAD+ is oxidized to NADH, producing the red fluorescent dye resorufin as part of the redox reactions. The resazurin assay is an established method for evaluating metabolic activity in fish (Renquist et al., 2013; Williams and Renquist, 2016; Reid et al., 2018), as it measures total resorufin accumulation via fluorescence intensity, which is proportional to the amount of NADH oxidized, thus providing accurate changes in metabolism within the organism. In this study, metabolic activity was increased in both larvae and adult zebrafish treated with rtTCAP-3, indicating increased NADH production in treated organisms and overall increased metabolic activity. Additionally, this study demonstrates that rtTCAP-3 can effectively elicit an effect on metabolic activity when taken up from the water. At the two highest doses, 5 and 10 μM, metabolic activity is nearly double that of non-exposed and low doses of rtTCAP-3 starting 24 h after exposure initiation, indicating a non-invasive method for rtTCAP-3 treatment in larval fish. In adult zebrafish, an increase in metabolic activity was not detected until 48 h after treatment, indicating that larval fish might be more susceptible to rtTCAP-3 activity or that the resazurin assay is more sensitive in detecting metabolic activity in larval fish. However, these data indicate that rtTCAP-3 enhances metabolic activity, as measured by NADH reduction in both larvae and adult zebrafish.
To evaluate broader physiological effects of rtTCAP-3 on larvae metabolism, metabolic activity was evaluated in the context of temperature change. It is well established that low temperature reduces metabolic activity in ectothermic poikilothermic vertebrates, including zebrafish (Uliano et al., 2010; Vergauwen et al., 2010). As predicted, low temperature (17°C) reduced metabolic activity within 48 h of exposure in larval zebrafish. While treatment with rtTCAP-3 increased metabolic activity in larvae compared to control larvae at normal temperature (23°C, Figure 6A), no difference was observed between rtTCAP-3 treated larvae at normal temperature in the temperature experiment (Figure 6B). However, at low temperature, rtTCAP-3 treatment did increase metabolic activity significantly, indicating that the response is amplified at lower temperatures. This could suggest that TCAP-3 might protect against metabolic stress that can accompany cold temperatures. Fish that live at low temperatures typically have increased lipid polyunsaturation of mitochondrial membranes, which can lead to increased rates of mitochondrial respiration (Guderley, 2007). Interestingly, this increase in mitochondrial respiration is thought to be due to increased proton leak, which can also enhance the production of reactive oxygen species (ROS), a consequence of metabolic stress (Guderley, 2007). Since zebrafish don’t live at low temperatures, the sudden move to low temperature is not likely to modulate respiration through mitochondrial membrane lipid saturation in the short term, so metabolic activity is reduced, as was observed. However, even at low temperature TCAP-3 treatment was able to increase metabolic activity to control levels at normal temperature.
We tested the effects of TCAP-3 on mitochondrial respiration, specifically, and found that both basal and mitochondrial respiration and respiratory reserve capacity were increased in response to rtTCAP-3 treatment. Total mitochondrial respiration is primarily linked to proton leak and ATP-linked respiration (Rolfe et al., 1997). No TCAP-3-mediated effect on ATP-linked respiration was detected, but rtTCAP-3 treatment did increase proton leak. Increases in proton leak are generally attributed to increased whole organism metabolic rate and is a form of oxidative phosphorylation not coupled to ATP-synthase (Chance and Williams, 1955). Additionally, increases in proton leak are associated with increased mitochondrial uncoupling and mitochondrial inefficiency (Shim et al., 2016). Interestingly, proton leak has roles in uncoupling oxidized substrates from ADP phosphorylation, which is known to protect cells from conditions that favor reactive oxygen species production (Mookerjee et al., 2010). Previous studies with the paralog of rtTCAP-3, TCAP-1, demonstrated that TCAP-1 lowered ROS levels and increased cell viability, which further supports the changes observed in proton leak (Trubiani et al., 2007). In addition, one study that investigated mitochondrial uncoupling, a process by which the electron transport chain is not used to drive ATP synthesis (Mookerjee et al., 2010), found that proton leak was increased. This increased proton leak was associated with higher resting oxygen consumption rates, particularly in skeletal muscle (Speakman et al., 2004). Taken together, these data suggest that the TCAP family, including TCAP-3, increases mitochondrial uncoupling via increased proton leak leading to enhanced basal OCR, irrespective of temperature. Future studies will aim at elucidating the underlying mechanisms of action of rtTCAP-3 in relation to energy metabolism. Specifically, the increased proton leak detected in this study is likely not due to changes in basal mechanisms (membrane unsaturation) that are not acutely regulated (Busiello et al., 2015). Instead, TCAP-3 likely induced proton leak via mitochondrial anion carrier proteins (like uncoupling proteins, UCPs) which is acutely regulated (Nedergaard and Cannon, 2003; Divakaruni and Brand, 2011).
Although these data provide strong evidence of the role of rtTCAP-3 with respect to energy metabolism in fish, differences in mitochondrial energetics and metabolism, resulted in numerous questions about downstream effects TCAP-3 may have in fish. As metabolism and function are intrinsically linked, we investigated if rtTCAP-3 treatment could affect the basal locomotor function of zebrafish larvae. Interestingly, after 24 h of exposure to rtTCAP-3 treatment, there were no significant changes in total distance travelled or velocities between the control and treatment groups. This is consistent with previous reports that show while TCAP-1 treatment increased the metabolism of rats, it did not affect basal locomotor behavior (D’Aquila, 2018). However, when further interrogated, TCAP-1 treatment enhanced overall muscle function as seen by improved contractile kinetics in exercise-induced rats (D’Aquila, 2018). Thus, this demonstrates that the enhanced metabolic phenotype mediated by TCAP treatment influences muscle function and overall organismal energetics, which is not observed in basal locomotor behavior in larval zebrafish. However, as predicted by the resazurin assay data, basal oxygen consumption rates (VO2) were increased in response to rtTCAP-3-treatment in adult zebrafish at basal and accelerated swimming speeds. The metabolic output increase observed in rtTCAP-3 treated zebrafish was nearly double the output measured in control zebrafish when exposed to increased water flow, while the difference between treated and control VO2 levels at lower water flow was not as high. Additionally, increased VO2 levels weren’t detected in response to the accelerated swimming speed alone, suggesting that the speed alone in the context of this experiment was not likely a stressful swimming speed. However, TCAP-3 increased VO2 levels when swimming speed was accelerated suggesting a potential enhancement of metabolic efficiency.
This work supports the conservation of TCAP in fish, opening a new avenue of investigation to better understand energy metabolism in aquatic species. TCAP exhibits structural similarity to corticotropin-releasing factor and calcitonin families of peptides (Lovejoy et al., 2006) and has been shown to reduce stress behaviors and neurogenic responses (Hogg et al., 2019). Data presented herein establish the presence and roles for TCAP-3 in metabolism in the whole organism and the mitochondria of fish. Overall, the data show that TCAP-3 increases metabolic rate in fish irrespective of temperature, by uncoupling mitochondria oxidative phosphorylation via proton leak. Interestingly, zebrafish larvae appear to be more sensitive to TCAP-3 induced increases in metabolic output, but TCAP-3 likely improves metabolic efficiency in adult zebrafish where energy reserves are likely higher. Taken together, this work provides the first insight into the roles of rtTCAP-3 in metabolism in a teleost model, the zebrafish, however future work should focus on TCAP mechanisms of action as well as endogenous regulation and action of TCAP in fish.
Data Availability Statement
Datasets available upon request. The names of the accession number(s) can be found in the article/supplementary material.
Ethics Statement
The animal study was reviewed and approved by UAB IACUC.
Author Contributions
PB and DL conceptualized and designed the initial experiments, as well as contributed to the writing, reviewing, and editing. RR and AR performed and analyzed all experiments, as well as conceptualized additional experiments and contributed to the writing, reviewing, and editing. All authors provided final editing and approval for the manuscript.
Funding
Research reported was supported by the National Institute on Aging of the National Institutes of Health under award number P30 AG050886 provided to PB. The content is solely the responsibility of the authors and does not necessarily represent the official views of the National Institutes of Health.
Conflict of Interest
The authors declare that the research was conducted in the absence of any commercial or financial relationships that could be construed as a potential conflict of interest.
Acknowledgments
We would like to thank our funding source the Nutritional Obesity Research Center (NORC) at the University of Alabama at Birmingham and the Natural Sciences and Engineering Research Council of Canada (NSERC) for funding for Andrea (D’Aquila) Reid. UAB graduate students, Khalid Freij and Amber Requena contributions were greatly appreciated. Lastly, we would like to thank Gloria Benavides and the Comparative Mitochondrial Health Assessment Core at UAB for their collaboration and technical assistance.
References
Al Chawaf, A., Xu, K., Tan, L., Vaccarino, F. J., Lovejoy, D. A., and Rotzinger, S. (2007). Corticotropin-releasing factor (CRF)-induced behaviors are modulated by intravenous administration of teneurin C-terminal associated peptide-1 (TCAP-1). Peptides 28, 1406–1415. doi: 10.1016/j.peptides.2007.05.014
Antinucci, P., Nikolaou, N., Meyer, M. P., and Hindges, R. (2013). Teneurin-3 specifies morphological and functional connectivity of retinal ganglion cells in the vertebrate visual system. Cell Rep. 5, 582–592. doi: 10.1016/j.celrep.2013.09.045
Antinucci, P., Suleyman, O., Monfries, C., and Hindges, R. (2016). Neural Mechanisms Generating Orientation Selectivity in the Retina. Curr. Biol. 26, 1802–1815. doi: 10.1016/j.cub.2016.05.035
Barbazuk, W. B., Korf, I., Kadavi, C., Heyen, J., Tate, S., Wun, E., et al. (2000). The syntenic relationship of the zebrafish and human genomes. Genome Res. 10, 1351–1358. doi: 10.1101/gr.144700
Beckmann, J., Schubert, R., Chiquet-Ehrismann, R., and Muller, D. J. (2013). Deciphering teneurin domains that facilitate cellular recognition, cell-cell adhesion, and neurite outgrowth using atomic force microscopy-based single-cell force spectroscopy. Nano Lett. 13, 2937–2946. doi: 10.1021/nl4013248
Busiello, R. A., Savarese, S., and Lombardi, A. (2015). Mitochondrial uncoupling proteins and energy metabolism. Front. Physiol. 6:36. doi: 10.3389/fphys.2015.00036
Bustin, S. A., Benes, V., Garson, J. A., Hellemans, J., Huggett, J., Kubista, M., et al. (2009). The MIQE guidelines: minimum information for publication of quantitative real-time PCR experiments. Clin. Chem. 55, 611–622. doi: 10.1373/clinchem.2008.112797
Chance, B., and Williams, G. R. (1955). Respiratory enzymes in oxidative phosphorylation. III. The steady state. J Biol Chem 217, 409–427.
Chand, D., Casatti, C. A., de Lannoy, L., Song, L., Kollara, A., Barsyte-Lovejoy, D., et al. (2013). C-terminal processing of the teneurin proteins: independent actions of a teneurin C-terminal associated peptide in hippocampal cells. Mol. Cell. Neurosci. 52, 38–50. doi: 10.1016/j.mcn.2012.09.006
Colacci, M., De Almeida, R., Chand, D., Lovejoy, S. R., Sephton, D., Vercaemer, B., et al. (2015). Characterization of the teneurin C-terminal associated peptide (TCAP) in the vase tunicate. Ciona intestinalis: a novel peptide system associated with energy metabolism and reproduction. Gen. Comp. Endocrinol. 216, 161–170. doi: 10.1016/j.ygcen.2015.01.021
D’Aquila, A. L. (2018). The Role of the Teneurin C-Terminal Associated Peptide (TCAP) Family in Energy Metabolism and Skeletal Muscle Physiology in Protochordates and Chordates. Ph. D Thesis. Toronto, ON: University of Toronto.
D’Aquila, A. L., Hsieh, A. H., Hsieh, A. H., De Almeida, R., Lovejoy, S. R., and Lovejoy, D. A. (2017). Expression and actions of corticotropin-releasing factor/diuretic hormone-like peptide (CDLP) and teneurin C-terminal associated peptide (TCAP) in the vase tunicate, Ciona intestinalis: antagonism of the feeding response. Gen. Comp. Endocrinol. 246, 105–115. doi: 10.1016/j.ygcen.2016.06.015
De Santis, C., Smith-Keune, C., and Jerry, D. R. (2011). Normalizing RT-qPCR data: are we getting the right answers? An appraisal of normalization approaches and internal reference genes from a case study in the finfish Lates calcarifer. Mar. Biotechnol. 13, 170–180. doi: 10.1007/s10126-010-9277-z
Divakaruni, A. S., and Brand, M. D. (2011). The regulation and physiology of mitochondrial proton leak. Physiology 26, 192–205. doi: 10.1152/physiol.00046.2010
Guderley, H. (2007). Metabolic responses to low temperature in fish muscle. Biol. Rev. 79, 409–427. doi: 10.1017/s1464793103006328
Hogg, D., Chen, Y., D’Aquila, A., Xu, M., Husić, M., Tan, L., et al. (2018). A novel role of the corticotrophin-releasing hormone regulating peptide, teneurin C-terminal associated peptide 1, on glucose uptake into the brain. J. Neuroendocrinol. 30:e12579. doi: 10.1111/jne.12579
Hogg, D. W., Husic, M., Wosnick, D., Dodsworth, T., D’Aquila, A. L., and Lovejoy, D. A. (2019). Activity of the Carboxy-Terminal Peptide Region of the Teneurins and Its Role in Neuronal Function and Behavior in Mammals. Front. Neurosci. 13:581. doi: 10.3389/fnins.2019.00581
Howe, K., Clark, M. D., Torroja, C. F., Torrance, J., Berthelot, C., Muffato, M., et al. (2013). The zebrafish reference genome sequence and its relationship to the human genome. Nature 496, 498–503.
Kimmel, C. B., Ballard, W. W., Kimmel, S. R., Ullmann, B., and Schilling, T. F. (1995). Stages of embryonic development of the zebrafish. Dev. Dyn. 203, 253–310. doi: 10.1002/aja.1002030302
Lee, S., Lee, H., and Kim, K.-T. (2019). Optimization of experimental conditions and measurement of oxygen consumption rate (OCR) in zebrafish embryos exposed to organophosphate flame retardants (OPFRs). Ecotoxicol. Environ. Saf 182:109377. doi: 10.1016/j.ecoenv.2019.109377
Lovejoy, D. A., Al Chawaf, A., and Cadinouche, M. Z. (2006). Teneurin C-terminal associated peptides: an enigmatic family of neuropeptides with structural similarity to the corticotropin-releasing factor and calcitonin families of peptides. Gen. Comp. Endocrinol. 148, 299–305. doi: 10.1016/j.ygcen.2006.01.012
Lucas, J., Percelay, I., Larcher, T., and Lefrancois, C. (2016). Effects of pyrolytic and petrogenic polycyclic aromatic hydrocarbons on swimming and metabolic performance of zebrafish contaminated by ingestion. Ecotoxicol. Environ. Saf. 132, 145–152. doi: 10.1016/j.ecoenv.2016.05.035
Meyer, B. M., Froehlich, J. M., Galt, N. J., and Biga, P. R. (2013). Inbred strains of zebrafish exhibit variation in growth performance and myostatin expression following fasting. Comp. Biochem. Physiol. A. Mol. Integr. Physiol 164, 1–9. doi: 10.1016/j.cbpa.2012.10.004
Mieda, M., Kikuchi, Y., Hirate, Y., Aoki, M., and Okamoto, H. (1999). Compartmentalized expression of zebrafish ten-m3 and ten-m4, homologues of the Drosophila ten(m)/odd Oz gene, in the central nervous system. Mech. Dev. 87, 223–227. doi: 10.1016/s0925-4773(99)00155-0
Mookerjee, S. A., Divakaruni, A. S., Jastroch, M., and Brand, M. D. (2010). Mitochondrial uncoupling and lifespan. Mech. Ageing Dev. 131, 463–472. doi: 10.1016/j.mad.2010.03.010
Nedergaard, J., and Cannon, B. (2003). The ‘novel’ ‘uncoupling’ proteins UCP2 and UCP3: what do they really do? Pros and cons for suggested functions. Exp. Physiol. 88, 65–84. doi: 10.1113/eph8802502
Nordstrom, K. J., Lagerstrom, M. C., Waller, L. M., Fredriksson, R., and Schioth, H. B. (2009). The Secretin GPCRs descended from the family of Adhesion GPCRs. Mol. Biol. Evol. 26, 71–84. doi: 10.1093/molbev/msn228
Parichy, D. M., Elizondo, M. R., Mills, M. G., Gordon, T. N., and Engeszer, R. E. (2009). Normal table of postembryonic zebrafish development: staging by externally visible anatomy of the living fish. Dev. Dyn. 238, 2975–3015. doi: 10.1002/dvdy.22113
Qian, X., Barsyte-Lovejoy, D., Wang, L., Chewpoy, B., Gautam, N., Al Chawaf, A., et al. (2004). Cloning and characterization of teneurin C-terminus associated peptide (TCAP)-3 from the hypothalamus of an adult rainbow trout (Oncorhynchus mykiss). Gen. Comp. Endocrinol. 137, 205–216. doi: 10.1016/j.ygcen.2004.02.007
Raftery, T. D., Jayasundara, N., and Di Giulio, R. T. (2017). A bioenergetics assay for studying the effects of environmental stressors on mitochondrial function in vivo in zebrafish larvae. Comp. Biochem. Physiol. Part C Toxicol. Pharmacol. 192, 23–32. doi: 10.1016/j.cbpc.2016.12.001
Reid, R. M., D’Aquila, A. L., and Biga, P. R. (2018). The validation of a sensitive, non-toxic in vivo metabolic assay applicable across zebrafish life stages. Comp. Biochem. Physiol. C. Toxicol. Pharmacol. 208, 29–37. doi: 10.1016/j.cbpc.2017.11.004
Reid, R. M., Freij, K. W., Maples, J. C., and Biga, P. R. (2019). Teneurins and Teneurin C-Terminal Associated Peptide (TCAP) in Metabolism: what’s Known in Fish? Front. Neurosci. 13:177. doi: 10.3389/fnins.2019.00177
Renquist, B. J., Zhang, C., Williams, S. Y., and Cone, R. D. (2013). Development of an assay for high-throughput energy expenditure monitoring in the zebrafish. Zebrafish 10, 343–352. doi: 10.1089/zeb.2012.0841
Rolfe, V., Brand, M., Heales, S., Lindley, K., and Milla, P. (1997). Tetrahydrobiopterin regulates cyclic GMP-dependent electrogenic Cl-secretion in mouse ileum in vitro. J. Physiol. 503:347. doi: 10.1111/j.1469-7793.1997.347bh.x
Shim, J., Weatherly, L. M., Luc, R. H., Dorman, M. T., Neilson, A., Ng, R., et al. (2016). Triclosan is a mitochondrial uncoupler in live zebrafish. J. Appl. Toxicol. 36, 1662–1667. doi: 10.1002/jat.3311
Smith, D. L. Jr., Barry, R. J., Powell, M. L., Nagy, T. R., D’Abramo, L. R., Watts, S. A., et al. (2013). Dietary protein source influence on body size and composition in growing zebrafish. Zebrafish 10, 439–446. doi: 10.1089/zeb.2012.0864
Speakman, J. R., Talbot, D. A., Selman, C., Snart, S., McLaren, J. S., Redman, P., et al. (2004). Uncoupled and surviving: individual mice with high metabolism have greater mitochondrial uncoupling and live longer. Aging Cell 3, 87–95. doi: 10.1111/j.1474-9728.2004.00097.x
Stackley, K. D., Beeson, C. C., Rahn, J. J., and Chan, S. S. (2011). Bioenergetic profiling of zebrafish embryonic development. PLoS One 6:e25652. doi: 10.1371/journal.pone.0025652
Tan, L. A., Al Chawaf, A., Vaccarino, F. J., Boutros, P. C., and Lovejoy, D. A. (2011). Teneurin C-terminal associated peptide (TCAP)-1 modulates dendritic morphology in hippocampal neurons and decreases anxiety-like behaviors in rats. Physiol. Behav. 104, 199–204. doi: 10.1016/j.physbeh.2011.03.015
Tan, L. A., Xu, K., Vaccarino, F. J., Lovejoy, D. A., and Rotzinger, S. (2008). Repeated intracerebral teneurin C-terminal associated peptide (TCAP)-1 injections produce enduring changes in behavioral responses to corticotropin-releasing factor (CRF) in rat models of anxiety. Behav. Brain Res. 188, 195–200. doi: 10.1016/j.bbr.2007.10.032
Topf, U., and Chiquet-Ehrismann, R. (2011). Genetic interaction between Caenorhabditis elegans teneurin ten-1 and prolyl 4-hydroxylase phy-1 and their function in collagen IV-mediated basement membrane integrity during late elongation of the embryo. Mol. Biol. Cell 22, 3331–3343. doi: 10.1091/mbc.e10-10-0853
Trubiani, G., Al Chawaf, A., Belsham, D. D., Barsyte-Lovejoy, D., and Lovejoy, D. A. (2007). Teneurin carboxy (C)-terminal associated peptide-1 inhibits alkalosis-associated necrotic neuronal death by stimulating superoxide dismutase and catalase activity in immortalized mouse hypothalamic cells. Brain Res. 1176, 27–36. doi: 10.1016/j.brainres.2007.07.087
Tucker, R. P., Beckmann, J., Leachman, N. T., Scholer, J., and Chiquet-Ehrismann, R. (2012). Phylogenetic analysis of the teneurins: conserved features and premetazoan ancestry. Mol. Biol. Evol. 29, 1019–1029. doi: 10.1093/molbev/msr271
Tucker, R. P., and Chiquet-Ehrismann, R. (2006). Teneurins: a conserved family of transmembrane proteins involved in intercellular signaling during development. Dev. Biol. 290, 237–245. doi: 10.1016/j.ydbio.2005.11.038
Tucker, R. P., Kenzelmann, D., Trzebiatowska, A., and Chiquet-Ehrismann, R. (2007). Teneurins: transmembrane proteins with fundamental roles in development. Int. J. Biochem. Cell Biol. 39, 292–297. doi: 10.1016/j.biocel.2006.09.012
Uliano, E., Cataldi, M., Carella, F., Migliaccio, O., Iaccarino, D., and Agnisola, C. (2010). Effects of acute changes in salinity and temperature on routine metabolism and nitrogen excretion in gambusia (Gambusia affinis) and zebrafish (Danio rerio). Comp. Biochem. Physiol.A Mol. Integr. Physiol. 157, 283–290. doi: 10.1016/j.cbpa.2010.07.019
Vergauwen, L., Benoot, D., Blust, R., and Knapen, D. (2010). Long-term warm or cold acclimation elicits a specific transcriptional response and affects energy metabolism in zebrafish. Comp. Biochem. Physiol. A Mol. Integr. Physiol. 157, 149–157. doi: 10.1016/j.cbpa.2010.06.160
Wang, L., Rotzinger, S., Al Chawaf, A., Elias, C. F., Barsyte-Lovejoy, D., Qian, X., et al. (2005). Teneurin proteins possess a carboxy terminal sequence with neuromodulatory activity. Brain Res. Mol. Brain Res. 133, 253–265. doi: 10.1016/j.molbrainres.2004.10.019
Westerfield, M. (1995). The Zebrafish Book: A Guide for the Laboratory Use of Zebrafish (Brachydanio rerio). Oregon: University of Oregon press.
Williams, S. Y., and Renquist, B. J. (2016). High throughput danio rerio energy expenditure assay. J. Vis. Exp. 107:e53297.
Keywords: TCAP, mitochondria, resazurin, metabolism, teleost
Citation: Reid RM, Reid AL, Lovejoy DA and Biga PR (2021) Teneurin C-Terminal Associated Peptide (TCAP)-3 Increases Metabolic Activity in Zebrafish. Front. Mar. Sci. 7:591160. doi: 10.3389/fmars.2020.591160
Received: 03 August 2020; Accepted: 11 December 2020;
Published: 11 January 2021.
Edited by:
Carlo C. Lazado, Norwegian Institute of Food, Fisheries and Aquaculture Research (Nofima), NorwayReviewed by:
Stefani Altenhofen, Pontifical Catholic University of Rio Grande do Sul, BrazilOana Birceanu, McMaster University, Canada
Copyright © 2021 Reid, Reid, Lovejoy and Biga. This is an open-access article distributed under the terms of the Creative Commons Attribution License (CC BY). The use, distribution or reproduction in other forums is permitted, provided the original author(s) and the copyright owner(s) are credited and that the original publication in this journal is cited, in accordance with accepted academic practice. No use, distribution or reproduction is permitted which does not comply with these terms.
*Correspondence: Peggy R. Biga, cGVnYmlnYUB1YWIuZWR1