 Andre F. Bucci
 Andrew C. Thomas
 Ivona Cetinić
95% of researchers rate our articles as excellent or good
Learn more about the work of our research integrity team to safeguard the quality of each article we publish.
Find out more
ORIGINAL RESEARCH article
Front. Mar. Sci. , 07 December 2020
Sec. Global Change and the Future Ocean
Volume 7 - 2020 | https://doi.org/10.3389/fmars.2020.587990
This article is part of the Research Topic Harmful Algal Blooms in Marine Environments: From Biologically Active Compounds to Species Diversity View all 6 articles
Globally, harmful algal blooms (HABs) are an increasing problem. In the Gulf of Maine and Bay of Fundy, blooms of the toxic dinoflagellate Alexandrium catenella are annually recurrent phenomena. As this region is one of the most rapidly warming areas of the global ocean, an improved understanding of the mechanisms driving the initiation of local A. catenella blooms, their interannual variability and the implications of future climate change is critical to local monitoring strategies and marine resources management. A 27-year (1988–2014) time series of weekly A. catenella cell counts from the Bay of Fundy and concurrent satellite-measured sea surface temperature, freshwater discharge from the St. John River and wind-driven turbulence are compared to assess their relationship to variability in bloom phenology metrics. The mean thermal habitat associated with early detection of A. catenella is 6.5 ± 1.6°C, whereas that of bloom initiation averages 9.2 ± 1.5°C. Both thermal habitats for A. catenella are trending earlier over the study period. Bloom initiations that precede the arrival of the thermal habitat mean (occur in colder water) are associated with higher spring freshwater discharge and are generally weaker blooms. Increased spring freshwater discharge is also associated with earlier bloom initiation and earlier maximum concentration dates. No significant relationship was observed with the strength of wind-driven mixing. Removal of the mean thermal seasonal cycle shows that surface temperature anomalies have a strong negative relationship to the bloom phenology metrics and arrival of thermal habitat: warmer years are linked to earlier arrival of thermal habitats (∼12 days °C–1) and earlier detection and bloom initiation dates (∼33 days °C–1). Using these relationships and present trends in Bay of Fundy surface temperature warming over the period 1982–2019, we project the arrival dates of bloom thermal habitat and bloom phenology metrics out to the middle of this century. Based on current rates of sea surface temperature change, bloom phenology metrics (e.g., bloom initiation, early detection), can be expected to shift 1–2 months earlier in the season by mid-century. Such changes in the phenology of A. catenella blooms will need to be incorporated into both monitoring strategies and forecasting models for the region.
Harmful algal blooms (HABs) are events of increased growth and accumulation of a phytoplankton species that can produce toxins or cause deleterious effects to the environment. HABs occur naturally worldwide due to variations in the local phytoplankton assemblage, water conditions, or trophic interactions. Over the last several decades, the number of reported cases of HABs has increased worldwide, as a result of enhanced conditions for phytoplankton growth and eutrophication (Anderson et al., 2002), as well as an increase in awareness and the capacity to identify and monitor such events. The health risks posed by some HABs species and associated economic losses due to resource harvesting closures and restricted beach access, make them a focus of intensive research and monitoring efforts (e.g., Babin et al., 2005; Anderson, 2009). For these reasons, major goals of HAB research are to identify the mechanisms controlling the formation of these events and quantify their links to habitat variability (Gobler, 2020).
Among the HAB-forming dinoflagellate species, the saxitoxin producer Alexandrium catenella is responsible for Paralytic Shellfish Poisoning (PSP) events around the globe, including coastal regions of the United States such as Alaska, California, and the Gulf of Maine (Lilly et al., 2007). This organism possesses a life cycle that includes an overwinter resting stage as a cyst that often sinks to the surface sediment. Encystment at the end of the seasonal bloom is connected to degradation of environmental conditions for cell growth (Brosnahan et al., 2017). Germination of the cysts relies on environmental cues and endogenous regulation, which play a more significant role in shallow or deeper regions, respectively (Anderson and Keafer, 1987). The importance of benthic cysts beds and their respective germination to inoculate the surface waters have been explored globally (Anderson et al., 2005; Mardones et al., 2016; Tobin et al., 2019). Variability in the time interval from germination to bloom initiation and mismatches between benthic cyst abundance and subsequent bloom magnitude, however, are commonly observed (Díaz et al., 2014; Martin et al., 2014b). These mismatches have been attributed to bloom formation in adjacent regions and transported locally (e.g., Mardones et al., 2016), rapid depletion of cysts in the sediment (Díaz et al., 2014) or variability in germination rates (Matrai et al., 2005).
Several studies have assessed the conditions associated with the formation and development of A. catenella blooms after initial inoculation. Advection, temperature, and nutrient conditions are viewed as key drivers for A. catenella population growth and bloom development (Stock et al., 2005; Hattenrath et al., 2010; McGillicuddy et al., 2011). Stratification and local hydrography have also been identified as bloom regulating factors (Blasco et al., 2003; Moore et al., 2009). In the Gulf of Maine, interannual variability in distribution and intensity of coastal toxicity events (e.g., Thomas et al., 2010) presents challenges to the identification of mechanisms regulating A. catenella blooms in the region (McGillicuddy et al., 2005). The formation of stratified conditions in the Eastern Maine Coastal Current has been shown to enhance the development of A. catenella blooms (Townsend et al., 2001). In the Gulf of Maine, Anderson et al. (2014) identified a statistically significant correlation between the overwintering abundance of cysts in the sediment and the magnitude of bloom events in the Gulf of Maine the following year. This correlation, however, does not occur with blooms of A. catenella in the Bay of Fundy (Martin et al., 2014b).
The Bay of Fundy is a partially enclosed bay in the northeast section of the Gulf of Maine (Figure 1) famous for extreme tidal amplitudes. The central portion of the Bay ranges from 75 to 150 m deep, and its counterclockwise residual circulation over this deeper, central portion is strongly dependent on the tides and buoyancy promoted by river discharge in the region (Aretxabaleta et al., 2008). The major contribution in freshwater input is from the St. John River, located at the northwestern end of the central gyre. The local oceanography allows the formation of a self-seeding and perpetuating bed of A. catenella cysts in the bottom sediments (Martin et al., 2014b). Persistent blooms of A. catenella (e.g., Martin et al., 2006a, 2014b) and local shellfish harvesting activities have prompted the Canadian Department of Fisheries and Oceans to maintain a weekly cell count monitoring program at Wolves Islands, between the 50 and 75 m isobaths.
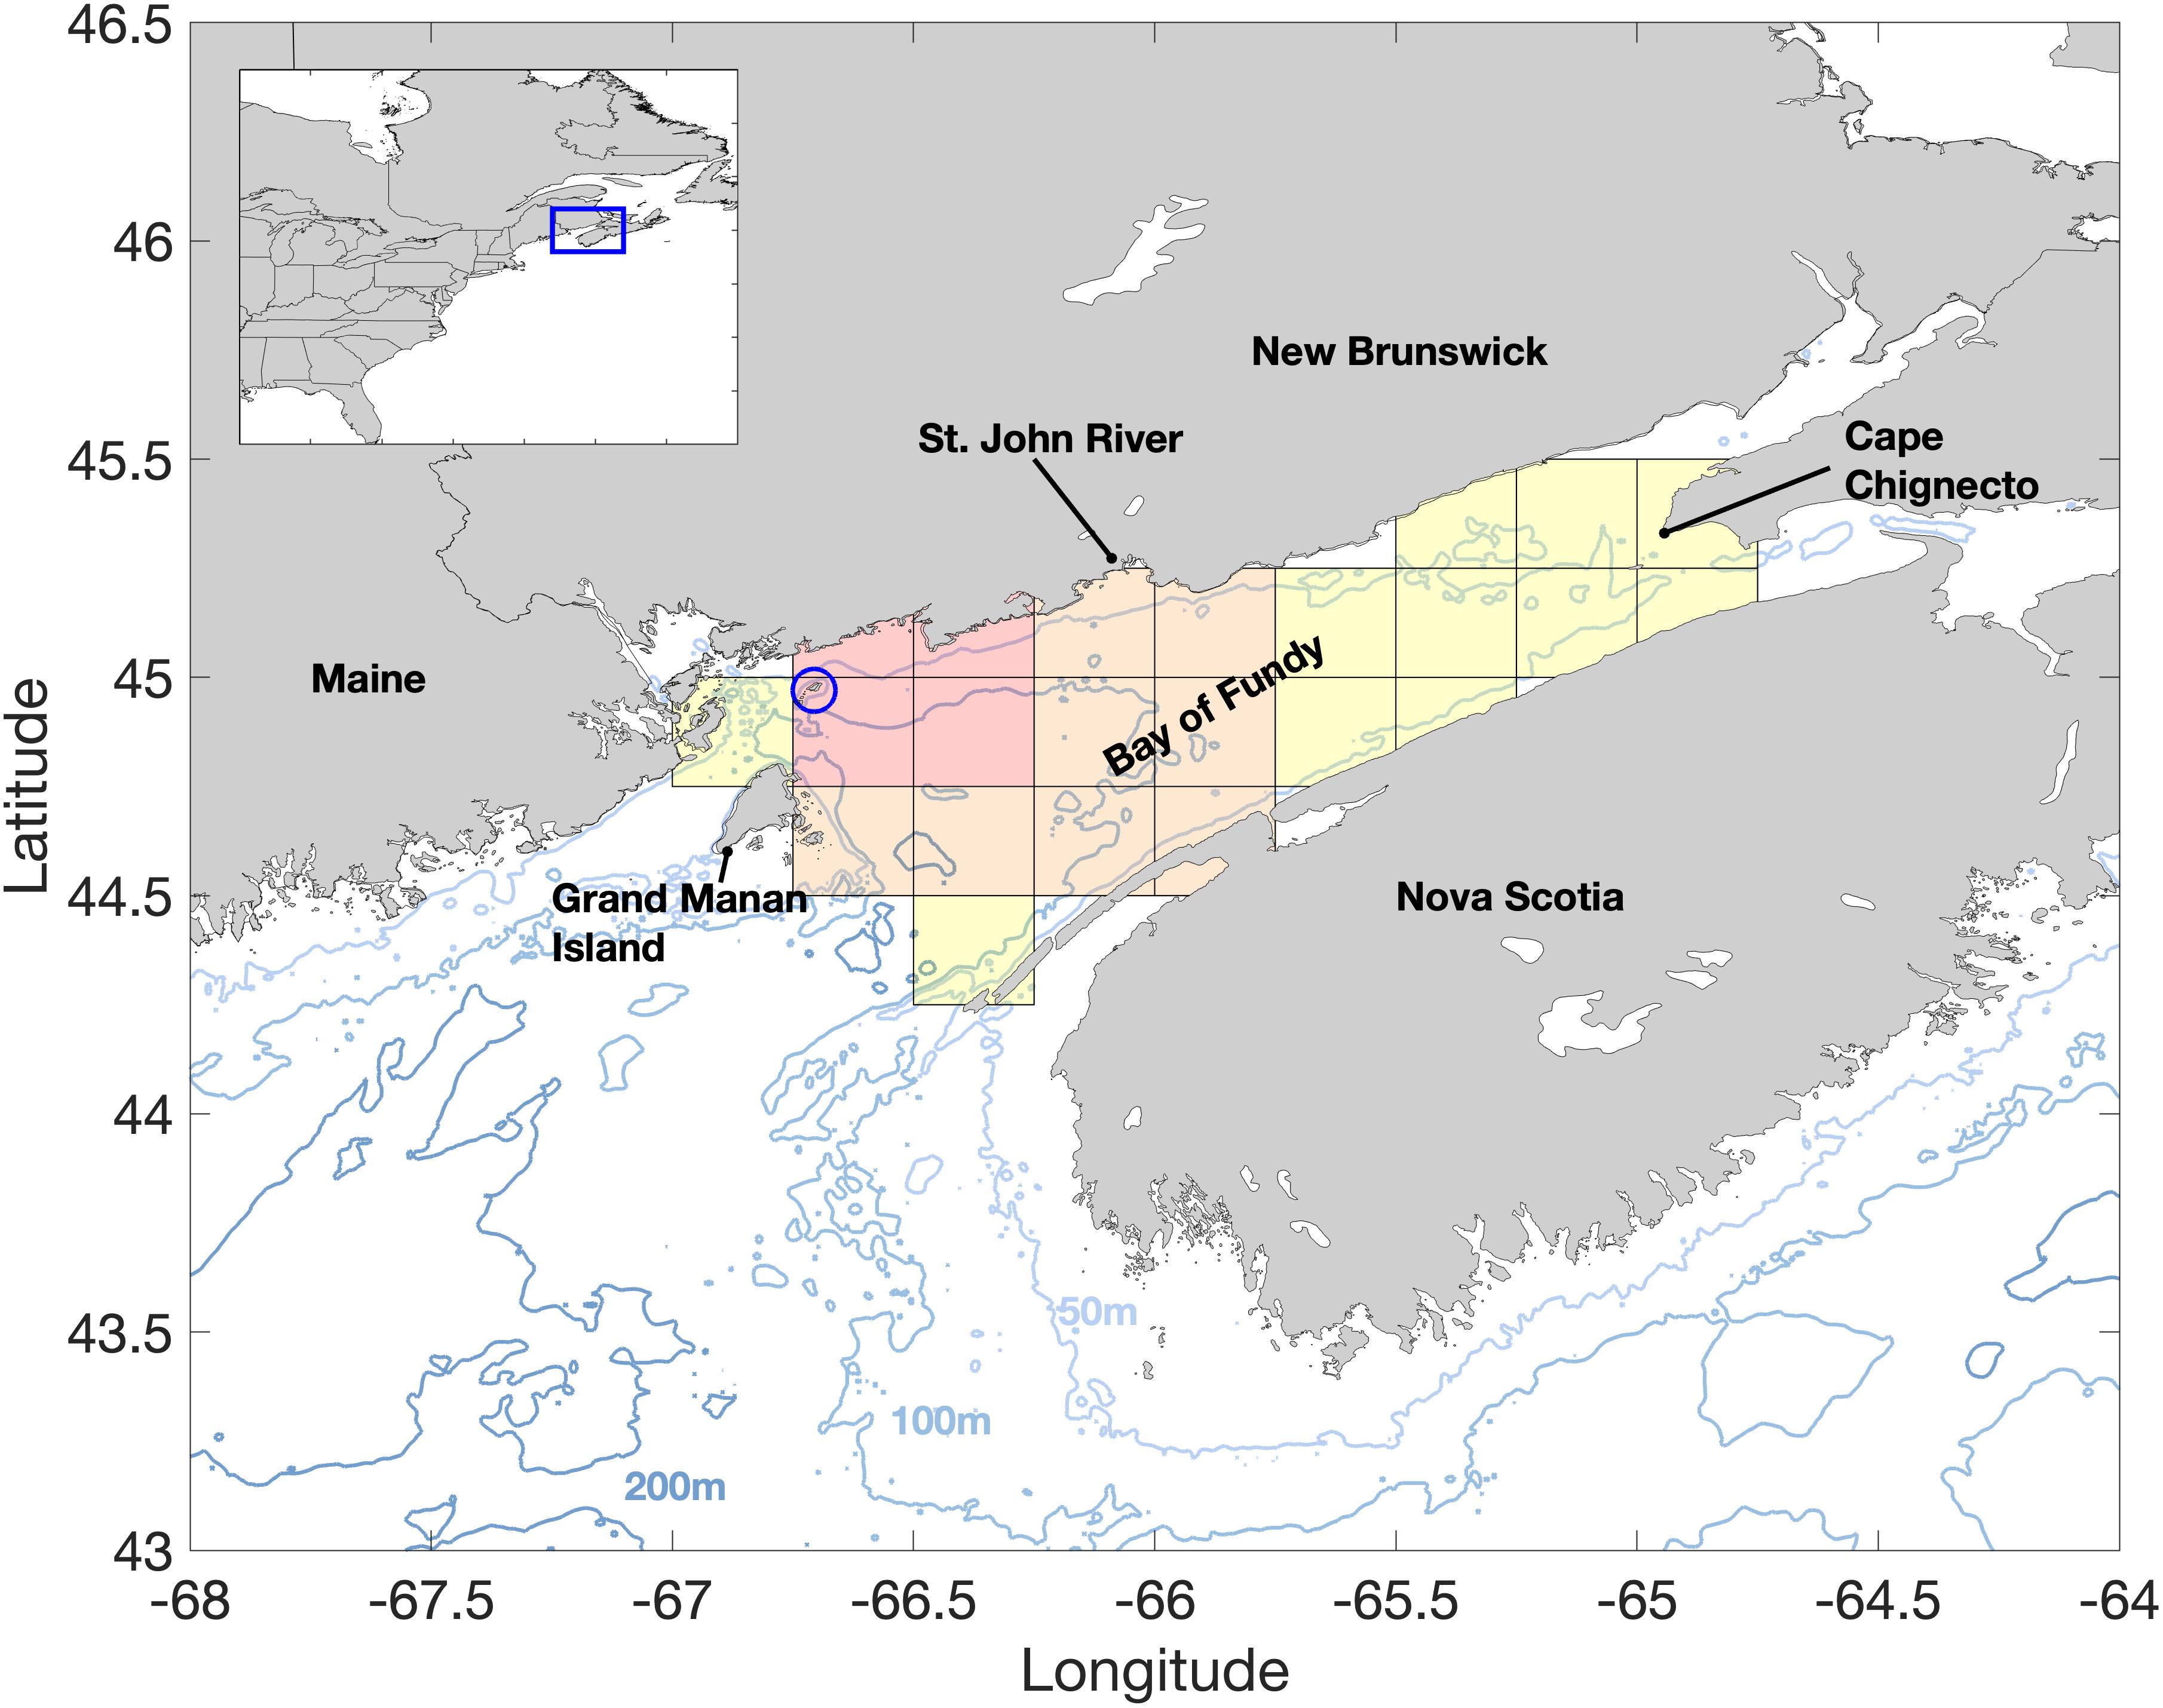
Figure 1. The study area showing major geographic locations and bathymetry (m). The sampling site for Alexandrium catenella cell counts in the Bay of Fundy at Wolves Islands is denoted by the blue circle. The OISST domain is denoted by the gridded area with shades representing the different areas used in our analysis. The four red grid points near Wolves Islands in the OISST data define the thermal habitats for A. catenella. The area we term the central basin of the Bay of Fundy, and used to calculate the onset dates of the thermal habitats, is represented by the orange and red grid points. Finally, OISST data used for climate and long-term trends analysis are derived from all grid points (red, orange and yellow shades) and extend from Grand Manan Island (United States) to Cape Chignecto (Canada). Wind data was averaged over the entire Bay of Fundy.
The northeast North American continental shelf, including the Gulf of Maine is among the most rapidly warming pieces of ocean on the planet (e.g., Forsyth et al., 2015; Pershing et al., 2015; Kavanaugh et al., 2017; Thomas et al., 2017). Associated with this warming is a shift in thermal phenology, with spring arriving earlier, fall later, and summer lasting longer (Thomas et al., 2017). These findings suggest that summer water column conditions such as stratification might also have temporal shifts. Superimposed on these long-term trends in sea surface temperature are episodic heat waves, which have become more frequent, with strong impacts on fisheries and ecosystem functionality (Mills et al., 2013; Pershing et al., 2019).
Warming oceans have received increased attention with respect to the occurrence and intensification of HABs. In several locations, water temperature is already reaching values that support maximum growth rates of HABs-forming species (Gobler et al., 2017) and this is expected to occur in several other places in the future (Glibert et al., 2014). The response of HABs to climate change, however, extends beyond just growth rates and thermal response curves. Changes in other aspects of their physical environment (e.g., increased stratification, changes in the phenology and amount of precipitation and freshwater discharge) are also expected to affect HABs species (Hallegraeff, 2010) as well as their life cycle and cysts dynamics (Brosnahan et al., 2020). Understanding the present thermal habitat of HAB species and its trends, and how the physical structure of the environment impacts the development of blooms is a crucial aspect of predicting future scenarios.
Our goal is to investigate the environmental links to A. catenella bloom development beyond the local inoculation of cells from cysts present in the sediment. Ultimately contributing to the understanding of environmental forcing on the dynamics of A. catenella blooms in the Bay of Fundy and building an assessment of the potential impacts of ocean climate change into this understanding. Here we focus on the vegetative cells of A. catenella and the phenology aspects associated with their seasonal blooms. We assess the thermal habitats associated with early detection of A. catenella vegetative cells in the water and bloom formation, and investigate their links to interannual variability in sea surface temperature, freshwater discharge, and wind mixing. We then present simple projections of the observed thermal habitats and bloom phenology metrics into the middle of the 21st century.
Vegetative cell counts of A. catenella from the Wolves Islands station (Figure 1) were obtained from the Department of Fisheries and Oceans Canada technical reports (Martin et al., 1995, 1999, 2001, 2006b, 2014a,c; Martin and LeGresley, 2014). Weekly surface samples, from 1988 to 2014, were collected, preserved and enumerated for concentrations of A. catenella (details in Martin et al., 2014b). Daily cell count values for each year were linearly interpolated from the weekly data during the bloom season. This monitoring station is the only one in the Bay of Fundy with such an extensive and continuous time series of A. catenella cell counts and we make the assumption that these data are representative of trends and bloom dynamics in the highly adjective southwest and central Bay of Fundy.
Metrics characterizing the phenology of A. catenella blooms were determined following the Threshold Method proposed by Siegel et al. (2002), with modifications for application to our dataset (Figure 2). In essence, this method determines annual periods of elevated concentrations based on the date in which A. catenella surpasses and remains above a given threshold for a consecutive period. In each year, the threshold was set at 10% above the annual median. Testing of different values for this percentage (5–25%) had no significant impact on bloom initiation and termination dates. A concentration of 200 cells L–1 normally corresponds to the minimum detection levels of saxitoxin in samples (Keafer et al., 2004) and is a common threshold for monitoring purposes. For years in which the 10% threshold was less than 200 cells L–1, a minimum value of 200 cells L–1 was stipulated as the threshold.
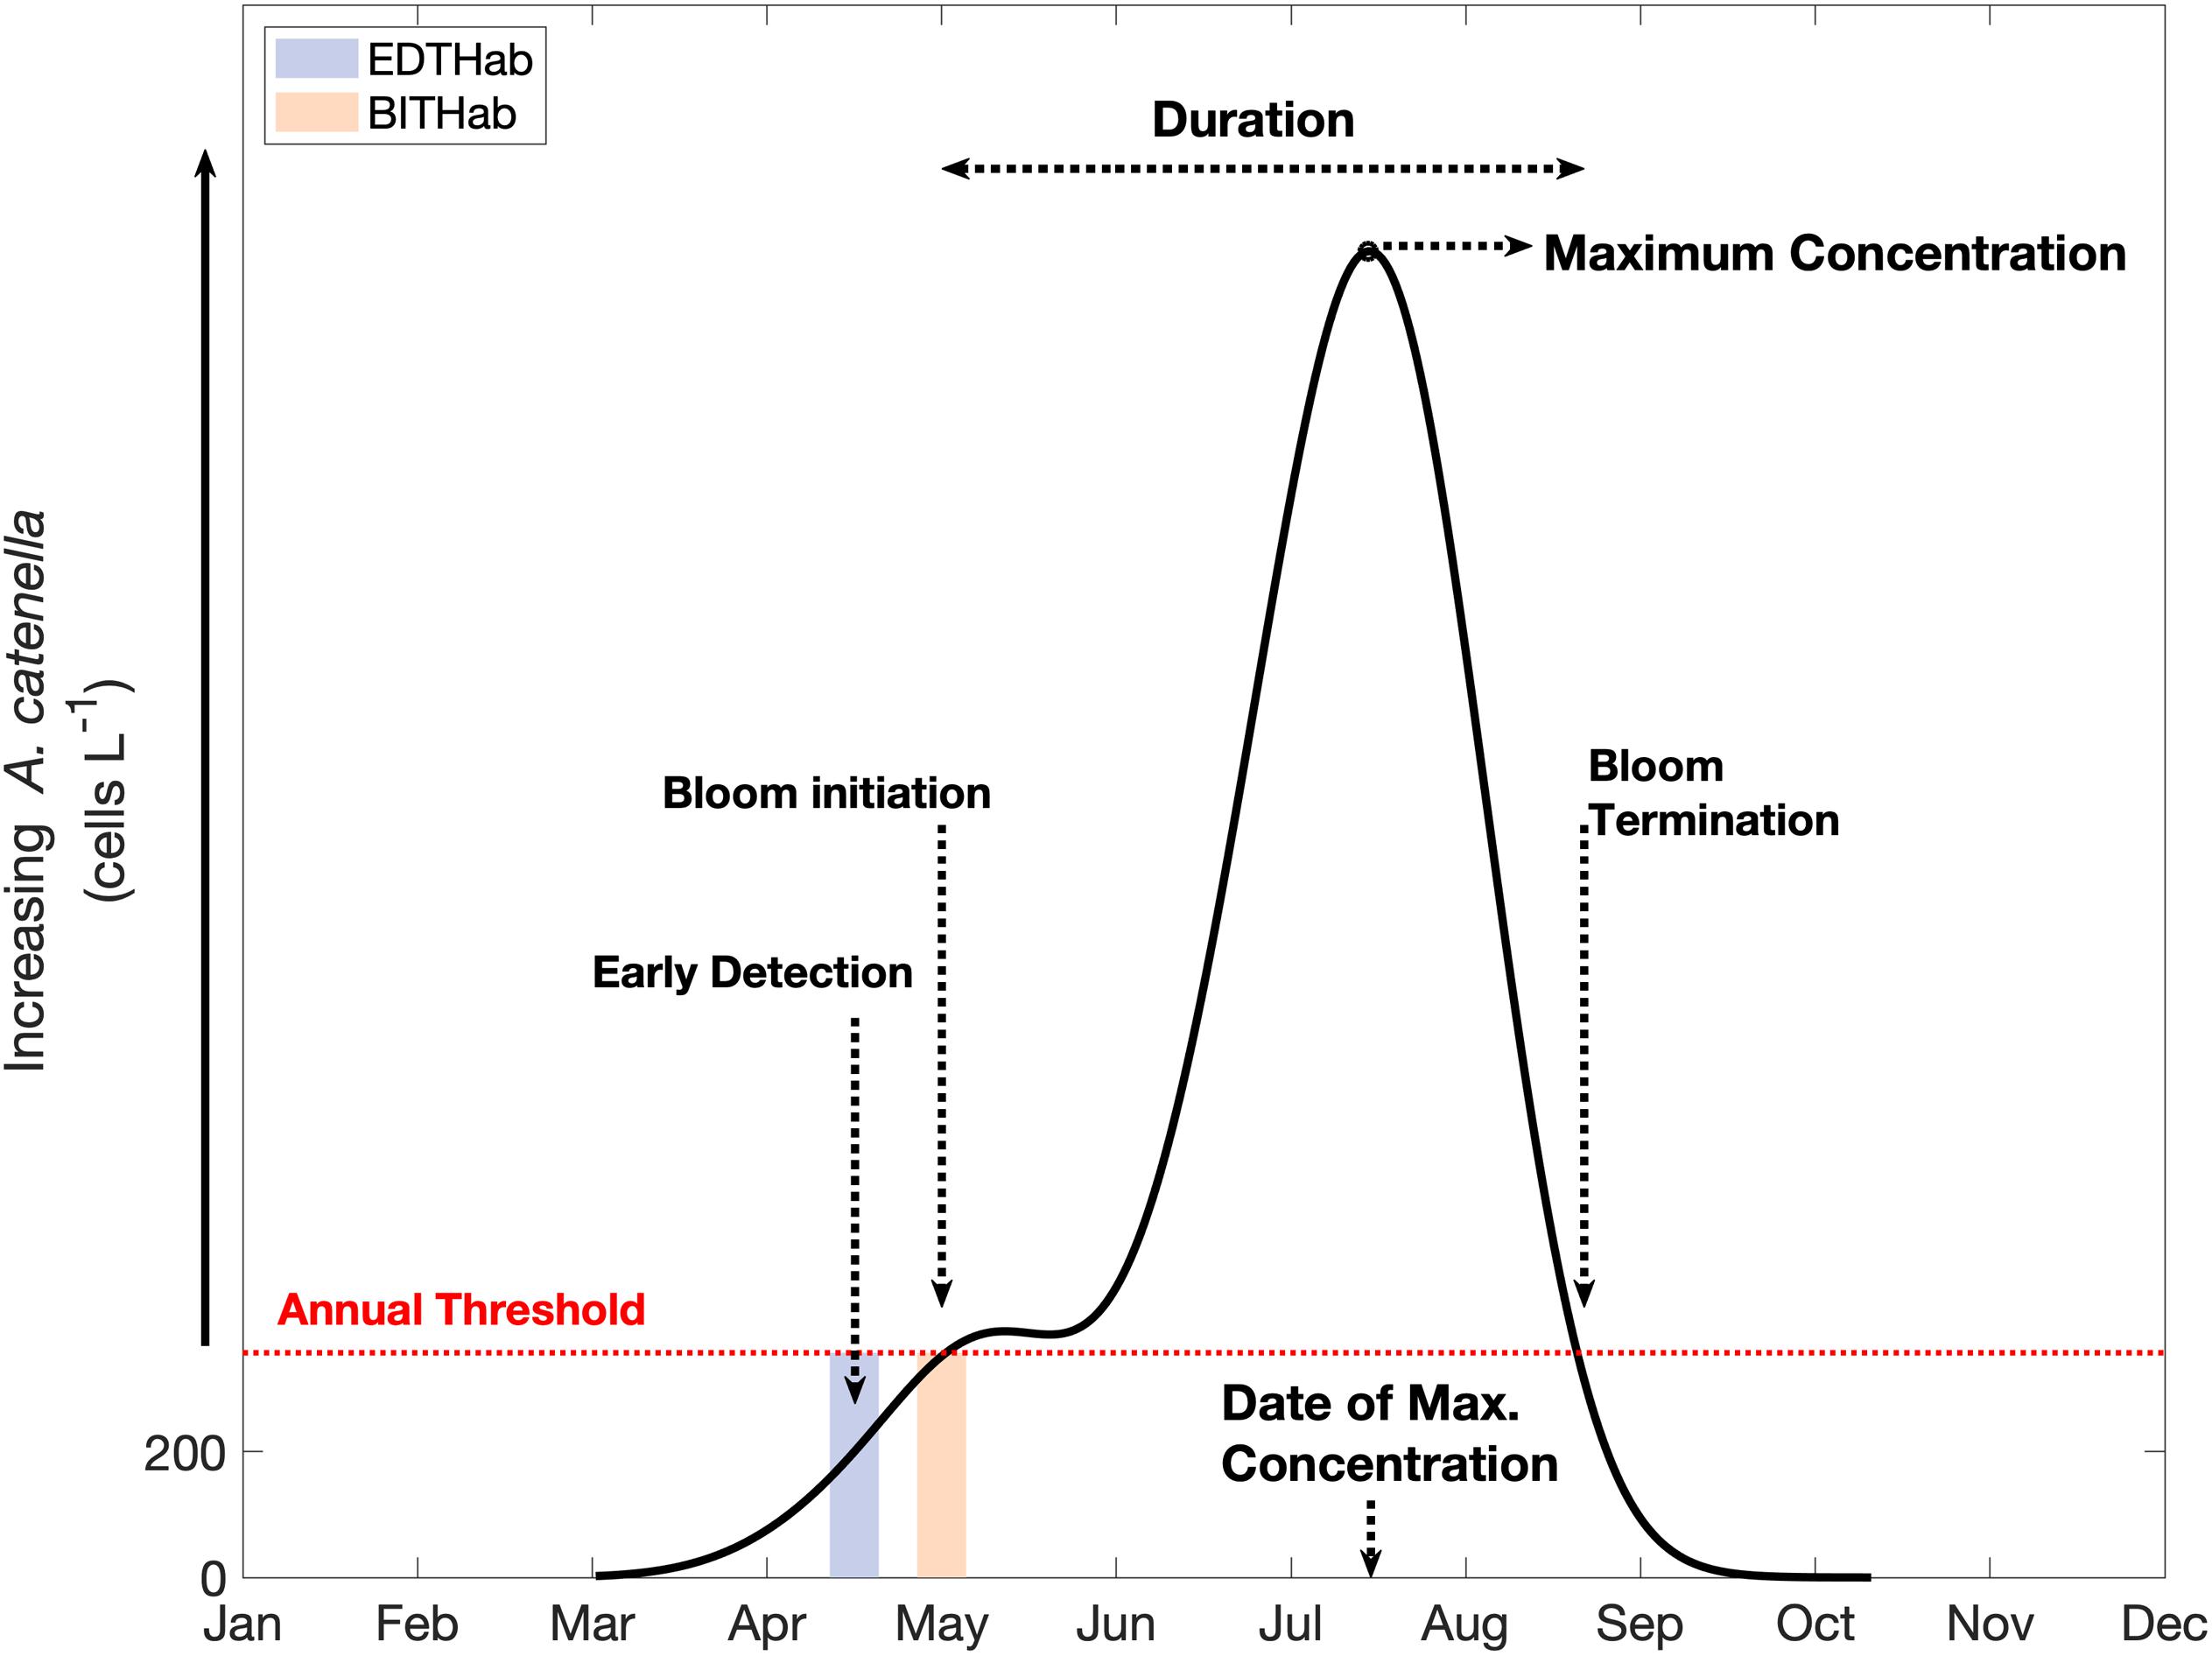
Figure 2. Conceptual example for bloom metrics and thermal habitat determination for A. catenella. The continuous black line represents the hypothetical distribution of A. catenella concentrations over time; the red dashed line corresponds to the annually specific threshold (year median + 10%) and the colored boxes highlight the time window within which we gathered temperature data to characterize the thermal habitats (EDTHab and BITHab). Dashed arrows indicate different metrics of A. catenella blooms determined by the Threshold Method.
Before applying the method, each year of data was examined to determine whether a bloom actually occurred by stipulating a minimum concentration of 500 cells L–1 to characterize a bloom event, the usual concentration causing PSP events in the region (e.g., Martin et al., 2010). In our time series, every year easily surpassed this minimum concentration. We addressed the possibility of multiple blooms in a single year by flagging all the days in which A. catenella concentrations surpassed the threshold and then searching for a gap of at least 14 consecutive days. If a gap existed, a multiple bloom event was characterized, and the phenology metrics were applied to each bloom individually. By using an interval longer than the sampling frequency of 7 days, the variability in the detection of the metrics using the threshold method is reduced (e.g., Brody et al., 2013). Horizontal transport, for example, can accumulate or dilute particles in an area over short time periods without necessarily characterizing a persistent bloom. Use of 14 days to characterize a persistent bloom and reduce high frequency variability is supported by the strong advection that is common in our sampling region (Aretxabaleta et al., 2008).
We determined the year day of the first occurrence of 200 cells L–1 of A. catenella, hereafter denoted the “Early Detection Date”. Bloom initiation date was defined as the first of 14 consecutive days above the annual cell concentration threshold and bloom termination was defined as the first of 14 consecutive days below the threshold. The date of maximum concentration is defined as the year day of maximum cell concentration, while bloom duration was defined as the number of days from initiation to termination. These provide six annual bloom metrics (Figure 2): i) Early Detection Date, ii) Bloom Initiation Date, iii) Date of Maximum Concentration, iv) Bloom Termination Date, v) Duration, and vi) Maximum Concentration (Magnitude). Multiple blooms in a single year occurred in six of the 27 years of data available (1989, 1996, 1997, 1998, 2000, and 2009). Among the years with multiple blooms, only 1989 and 1996 had second blooms of greater magnitude than the first bloom, while the other four years had much smaller second blooms. As the focus of this article is on the environmental conditions associated with initial seasonal onset of A. catenella blooms in the region and early detection dates, in years of multiple blooms, analysis is focused on the first bloom within that year. Moreover, the environmental and ecological conditions present during the second bloom are not necessarily the same as those from the first bloom in the year and discouraging their aggregation in the same dataset.
Daily, quarter degree spatial resolution Optimum Interpolated Sea Surface Temperature (OISST) data were obtained from NOAA National Center for Environmental Information1 for the 38-year period of 1982 to 2019 and subset to the study area. Daily sea surface temperature (SST) data were averaged to monthly means, and from these a 30-year (1982–2011) monthly climatology was calculated. Monthly sea surface temperature anomalies (SSTa) were calculated by subtracting the climatological months from their associated monthly SST values. A time series of mean SSTa representative of the main seasonal vegetative cell growth period was calculated by averaging the SSTa from March to July (SSTa, Mar–Jul) within each year over the 23 grid points covering the entire Bay of Fundy. Daily SST values from the four grid locations closest to the Wolves Islands (Figure 1, red shaded areas) sampling station were used to determine the temperature range for A. catenella thermal habitats. The 12 grid locations that cover the central basin of the Bay of Fundy (Figure 1, orange and red shaded areas) were used to estimate the onset time of A. catenella thermal habitats and their spatial and temporal variability. A larger region encompassing 23 valid grid points over the entire Bay of Fundy, from Grand Manan Island to Cape Chignecto (Figure 1, full gridded area), was used to estimate long-term spatial variability and calculate regional trends in SSTa. This use of different grid sampling regions reflects i) a small area, most directly related to the sampling site of A. catenella to define thermal habitat as accurately as possible (four grid points at Wolves Islands); ii) the central basin area is the most common area where blooms of A. catenella occur in the Bay of Fundy (see surveys examples in Martin et al., 2014b); iii) the entire Bay of Fundy, as climate and long-term changes are expected to impact at a regional level.
We characterize the thermal habitat of A. catanella during two specific moments in time associated with the initial development of the annual bloom (Figure 2). Early Detection Thermal Habitat (EDTHab) is the SST when the early detection value of 200 cells L–1 is crossed, and Bloom Initiation Thermal Habitat (BITHab) is the SST when the bloom initiation cell concentration threshold is reached. A. catenella takes a varying length of time to reach high concentrations after the 200 cells L–1 threshold date. For monitoring purposes, both the early detection and the bloom initiation thresholds are important.
The temperature envelope for each habitat was determined by sampling the SST from the four OISST grid locations closest to the Wolves Islands station in an 11-day window centered on each of the two bloom metrics dates each year (Figure 2). For each habitat, the mean and their standard deviation were calculated over the 27 years of A. catenella cell concentration data, using the four grid points and 11 days of data (1,188 data entries). The 11-day time window was a compromise between maximizing OISST values for meaningful statistics, but remaining less than the local integral time scale of variability (∼13 days) in the OISST data, to minimize sampling across event-scale variability.
Using the temperature interval (mean ± standard deviation) described above, we assessed the occurrence of temperatures above these values in the central basin of the Bay of Fundy (12 grid points) in each year from 1982 to 2019. The onset of a thermal habitat was defined as the first of 10 consecutive days above each temperature threshold at each grid location in the central basin. This procedure was repeated three times for each thermal habitat (EDTHab and BITHab), one using the mean temperature that defines the habitat and then using the upper (mean + standard deviation) and lower (mean − standard deviation) temperature envelopes. To avoid influence from the previous year’s seasonal cycle, we initialized the analysis after the winter minimum in each year, commonly observed in February. Finally, for each of these procedures, we use the standard deviation within the 12 grid points as a measure of local spatial variability in the onset time of the thermal habitats.
Daily Cross-Calibrated Multi-Platform 10m wind zonal and meridional components, at quarter degree spatial resolution, from 1988 to 2014, were obtained from Remote Sensing Systems2. The time period was selected to match the available A. catenella vegetative cell concentration data. Grid locations in the center of the Bay of Fundy were used to minimize the influence of land and then averaged together to provide single daily wind vectors representing the study area. From the zonal and meridional components, we calculated wind speed (U, m s–1) and the turbulent momentum (U*3, in m3 s–3) as a proxy for wind-forced vertical mixing in the region (Eq. 1):
where ρair and ρwater are air and seawater densities, taken as 1.225 and 1023.6 kg m–3, respectively, Cd is a drag coefficient (dimensionless) of 0.0013 (Smith, 1988; Klinger et al., 2006). An annual value of wind-forced mixing was calculated in each year as total integrated U*3 from March to May, the period important in the seasonal onset of stratification and bloom initiation.
Freshwater influence on the study area was estimated from hourly water level data from the St. John River, obtained from the Environment Canada3 using the closest station to the river mouth (station 01AP005), for the period from 1988 to 2014. The St. John River has the largest discharge of any river in the Gulf of Maine region (Townsend et al., 2010) and directly affects the circulation and water column stability in the Bay of Fundy (Aretxabaleta et al., 2008). Similar to the wind data, an annual value for freshwater influence was obtained by integrating the daily water height from March to May.
Interannual variability differs in each of the metrics of bloom phenology and magnitude over the study period (Figure 3). The early detection dates of A. catenella are relatively constant through most of the time series with a mean of day 140 (Figure 3A). The early detection date occurrence ranged from day 95 (in 2010) to day 181 (in 1988), with a persistent period of relatively earlier observations from 2008 to 2013. Bloom initiation dates (Figure 3B) range from day 126, (early May, 2012) to day 216 (early August, 2003), with an average date of day 167 (mid-June). The highest concentrations of A. catenella are observed, on average, at day 195, with the earliest and latest dates of maximum concentration also occurring in 2012 (day 157) and 2003 (day 252), respectively (Figure 3B). The termination of the bloom occurred between late June (day 176) and late September (day 272) with the average on day 211, late July (Figure 3B). The average bloom duration is 44 days, ranging from 23 days (2014) to 95 days (2012), and maxima are evident in 1999, 2005, and 2012, with blooms lasting 80 days or more (Figure 3C). Maximum cell concentration in the bloom is highly variable between years (Figure 3D) with lowest concentrations in the period from 1996 to 2000 (mean of 3 × 10³ cells L–1) and highest concentrations in 2004 (3.2 × 10⁵ cells L–1). Early detection, bloom initiation, and maximum concentration dates all have decreasing trends (occurring earlier) of ∼ 0.75 days year–1, but none are significant at the 95% confidence level (t-test, n = 27).
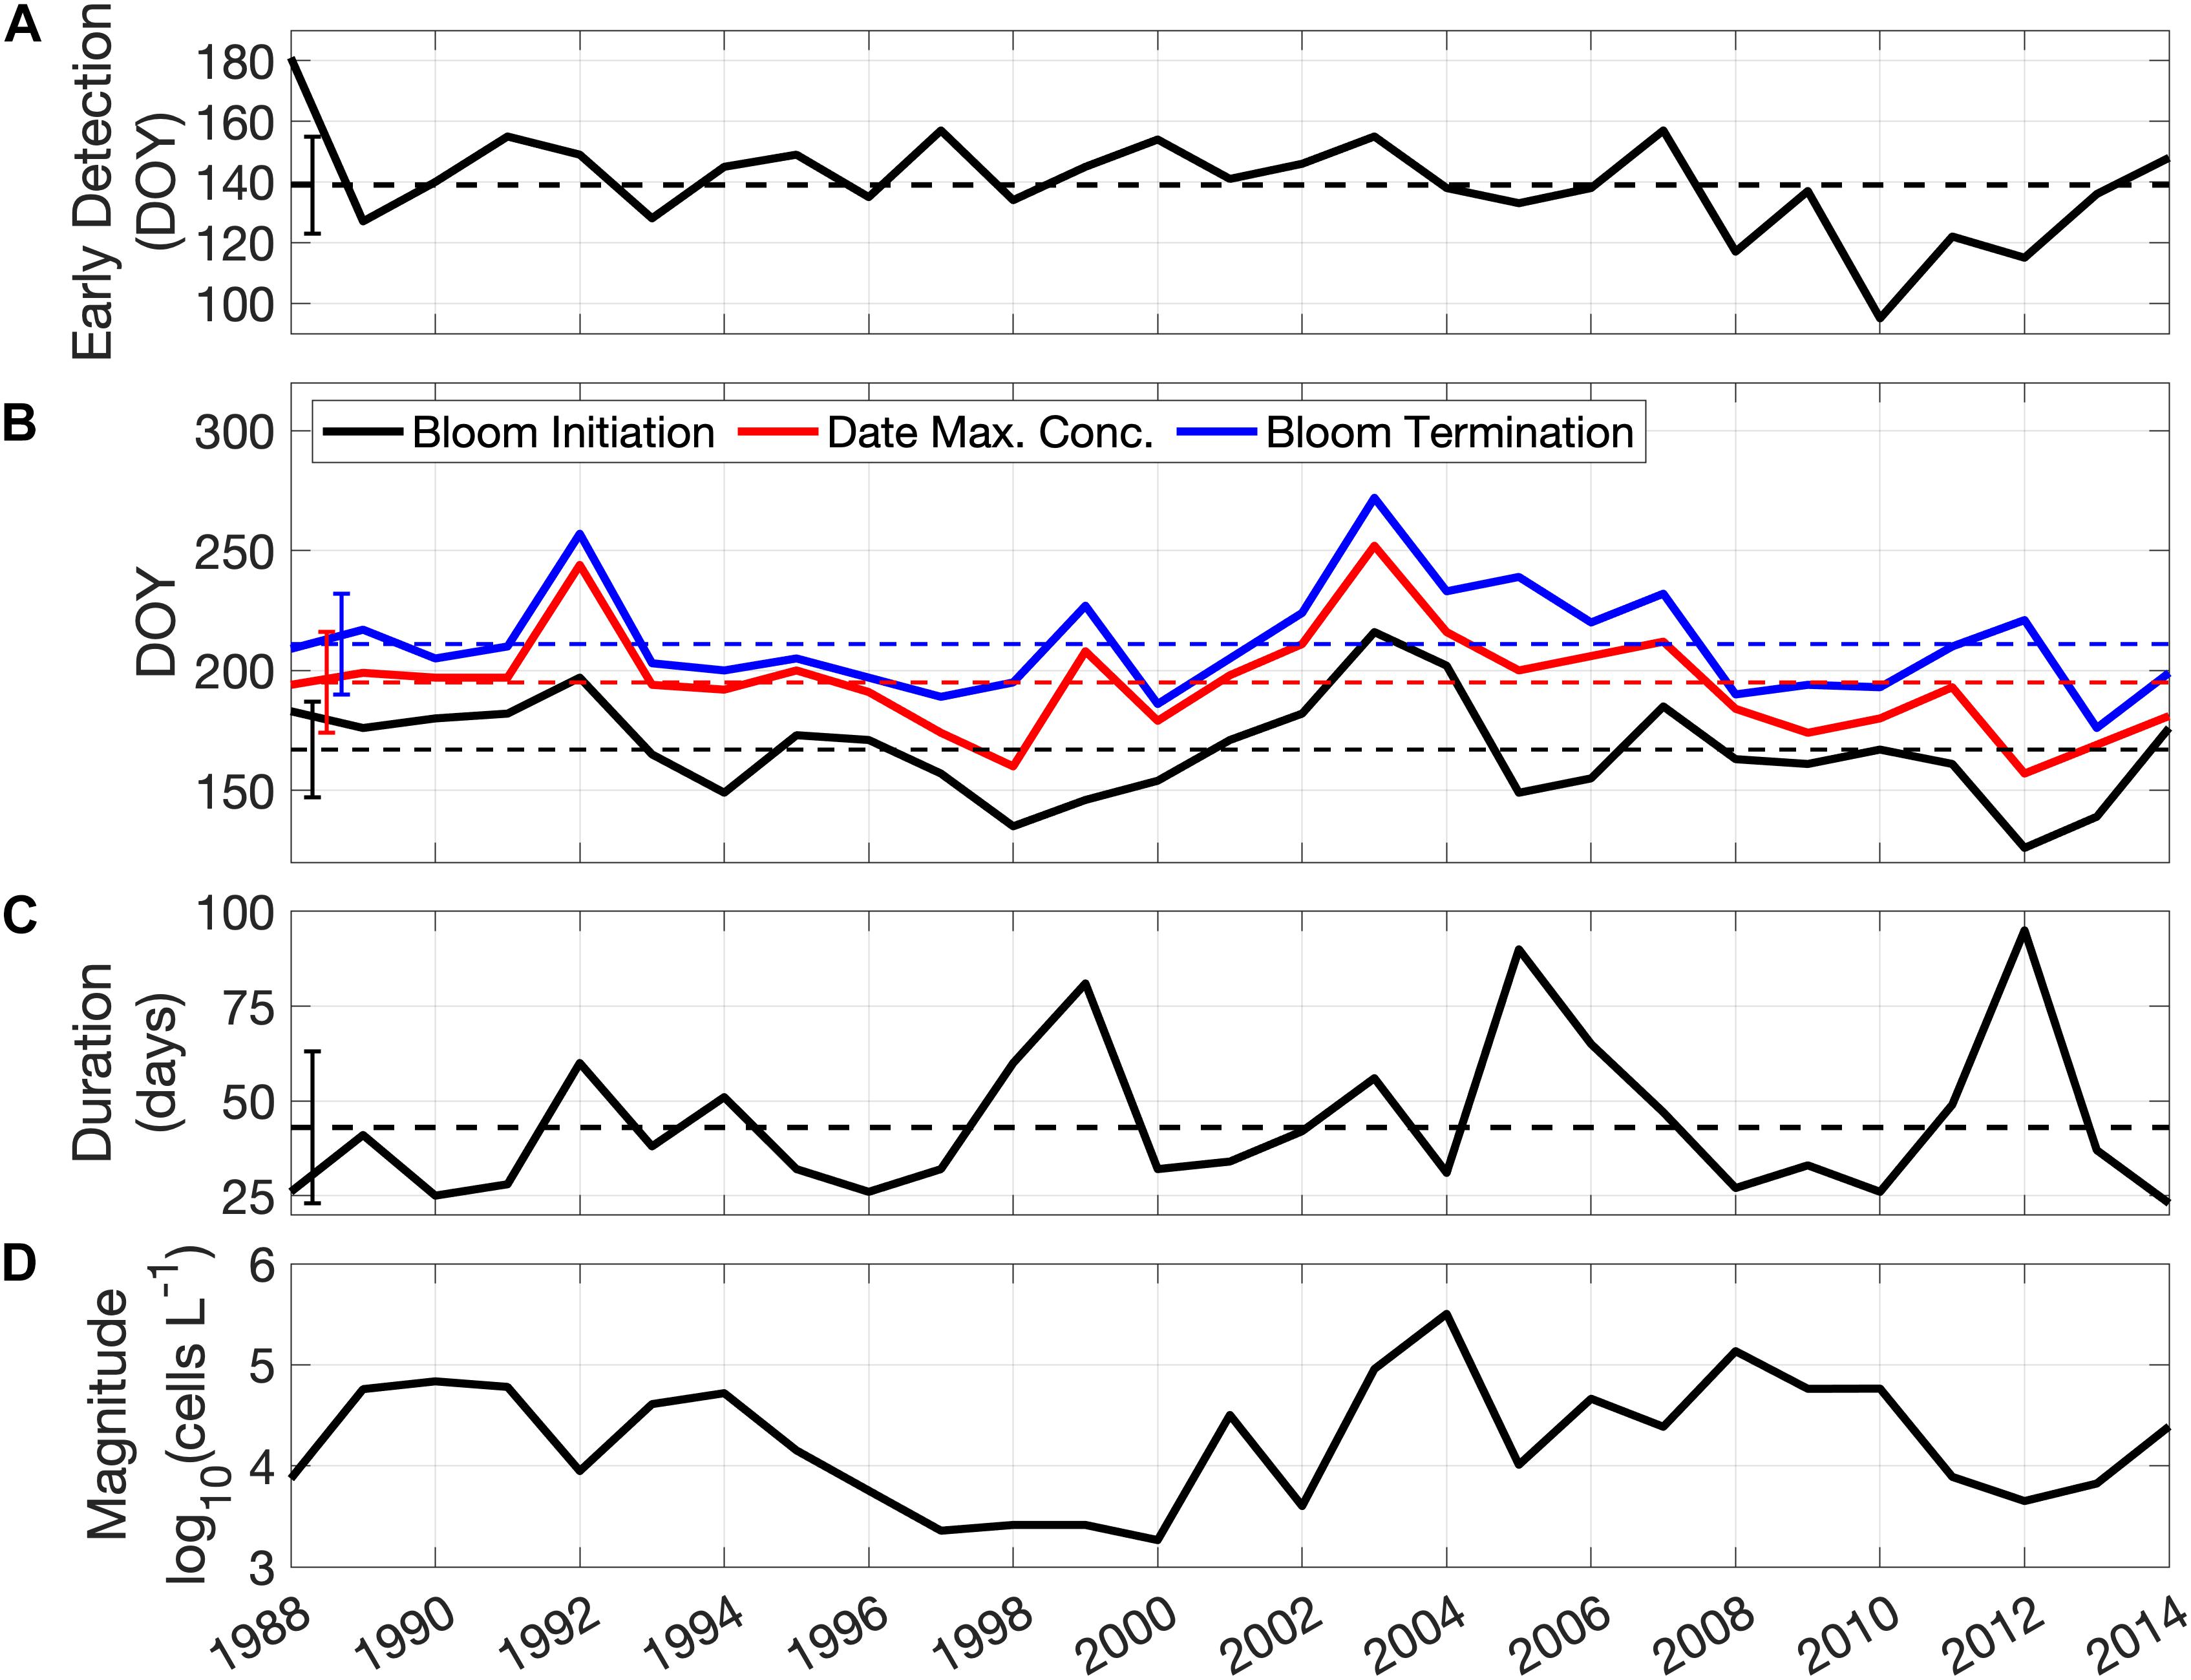
Figure 3. Time series of A. catenella bloom metrics from 1988 to 2014. (A) Early detection dates; (B) bloom initiation dates (black), date of maximum concentration (red), and bloom termination dates (blue); (C) duration (in days); (D) annual maximum concentration of A. catenella (note log10 scale). Dashed lines in (A–C) represent the mean and the vertical bars on the left are the standard deviation of each metric over the study period.
The thermal habitats in which the seasonal bloom metrics take place are shown in Figure 4. The EDTHab for A. catenella in the Bay of Fundy ranges from 2.1 to 10.5°C with a mean of 6.5°C and standard deviation of 1.6°C (Figure 4A). Most observations (∼47%), however, are in the interval of 5 to 7°C. The BITHab ranges from 4.7 to 12.5°C with an average value of 9.2°C and a standard deviation of 1.7°C (Figure 4B). The temperature values for BITHab shows a bimodal distribution, with an increase in frequency between 7 and 8°C and then between 9 and 11°C, where most of the observations (∼46%) for this habitat occur. Kernel density estimation showed that the temperature values for each mode of BITHab were centered in 7.5 and 9.9°C. Further investigation showed that 53% of the OISST temperature values composing the first (colder) mode were originally from just four years (1994, 1998, 1999, and 2005). Although we recognize that it misses some detail, for simplicity, we opted to use the overall mean (9.2°C) and standard deviation (1.7°C) for this habitat, as these values approximate those of the second mode, in which most of the observations occur, while still encompassing both modes peaks.
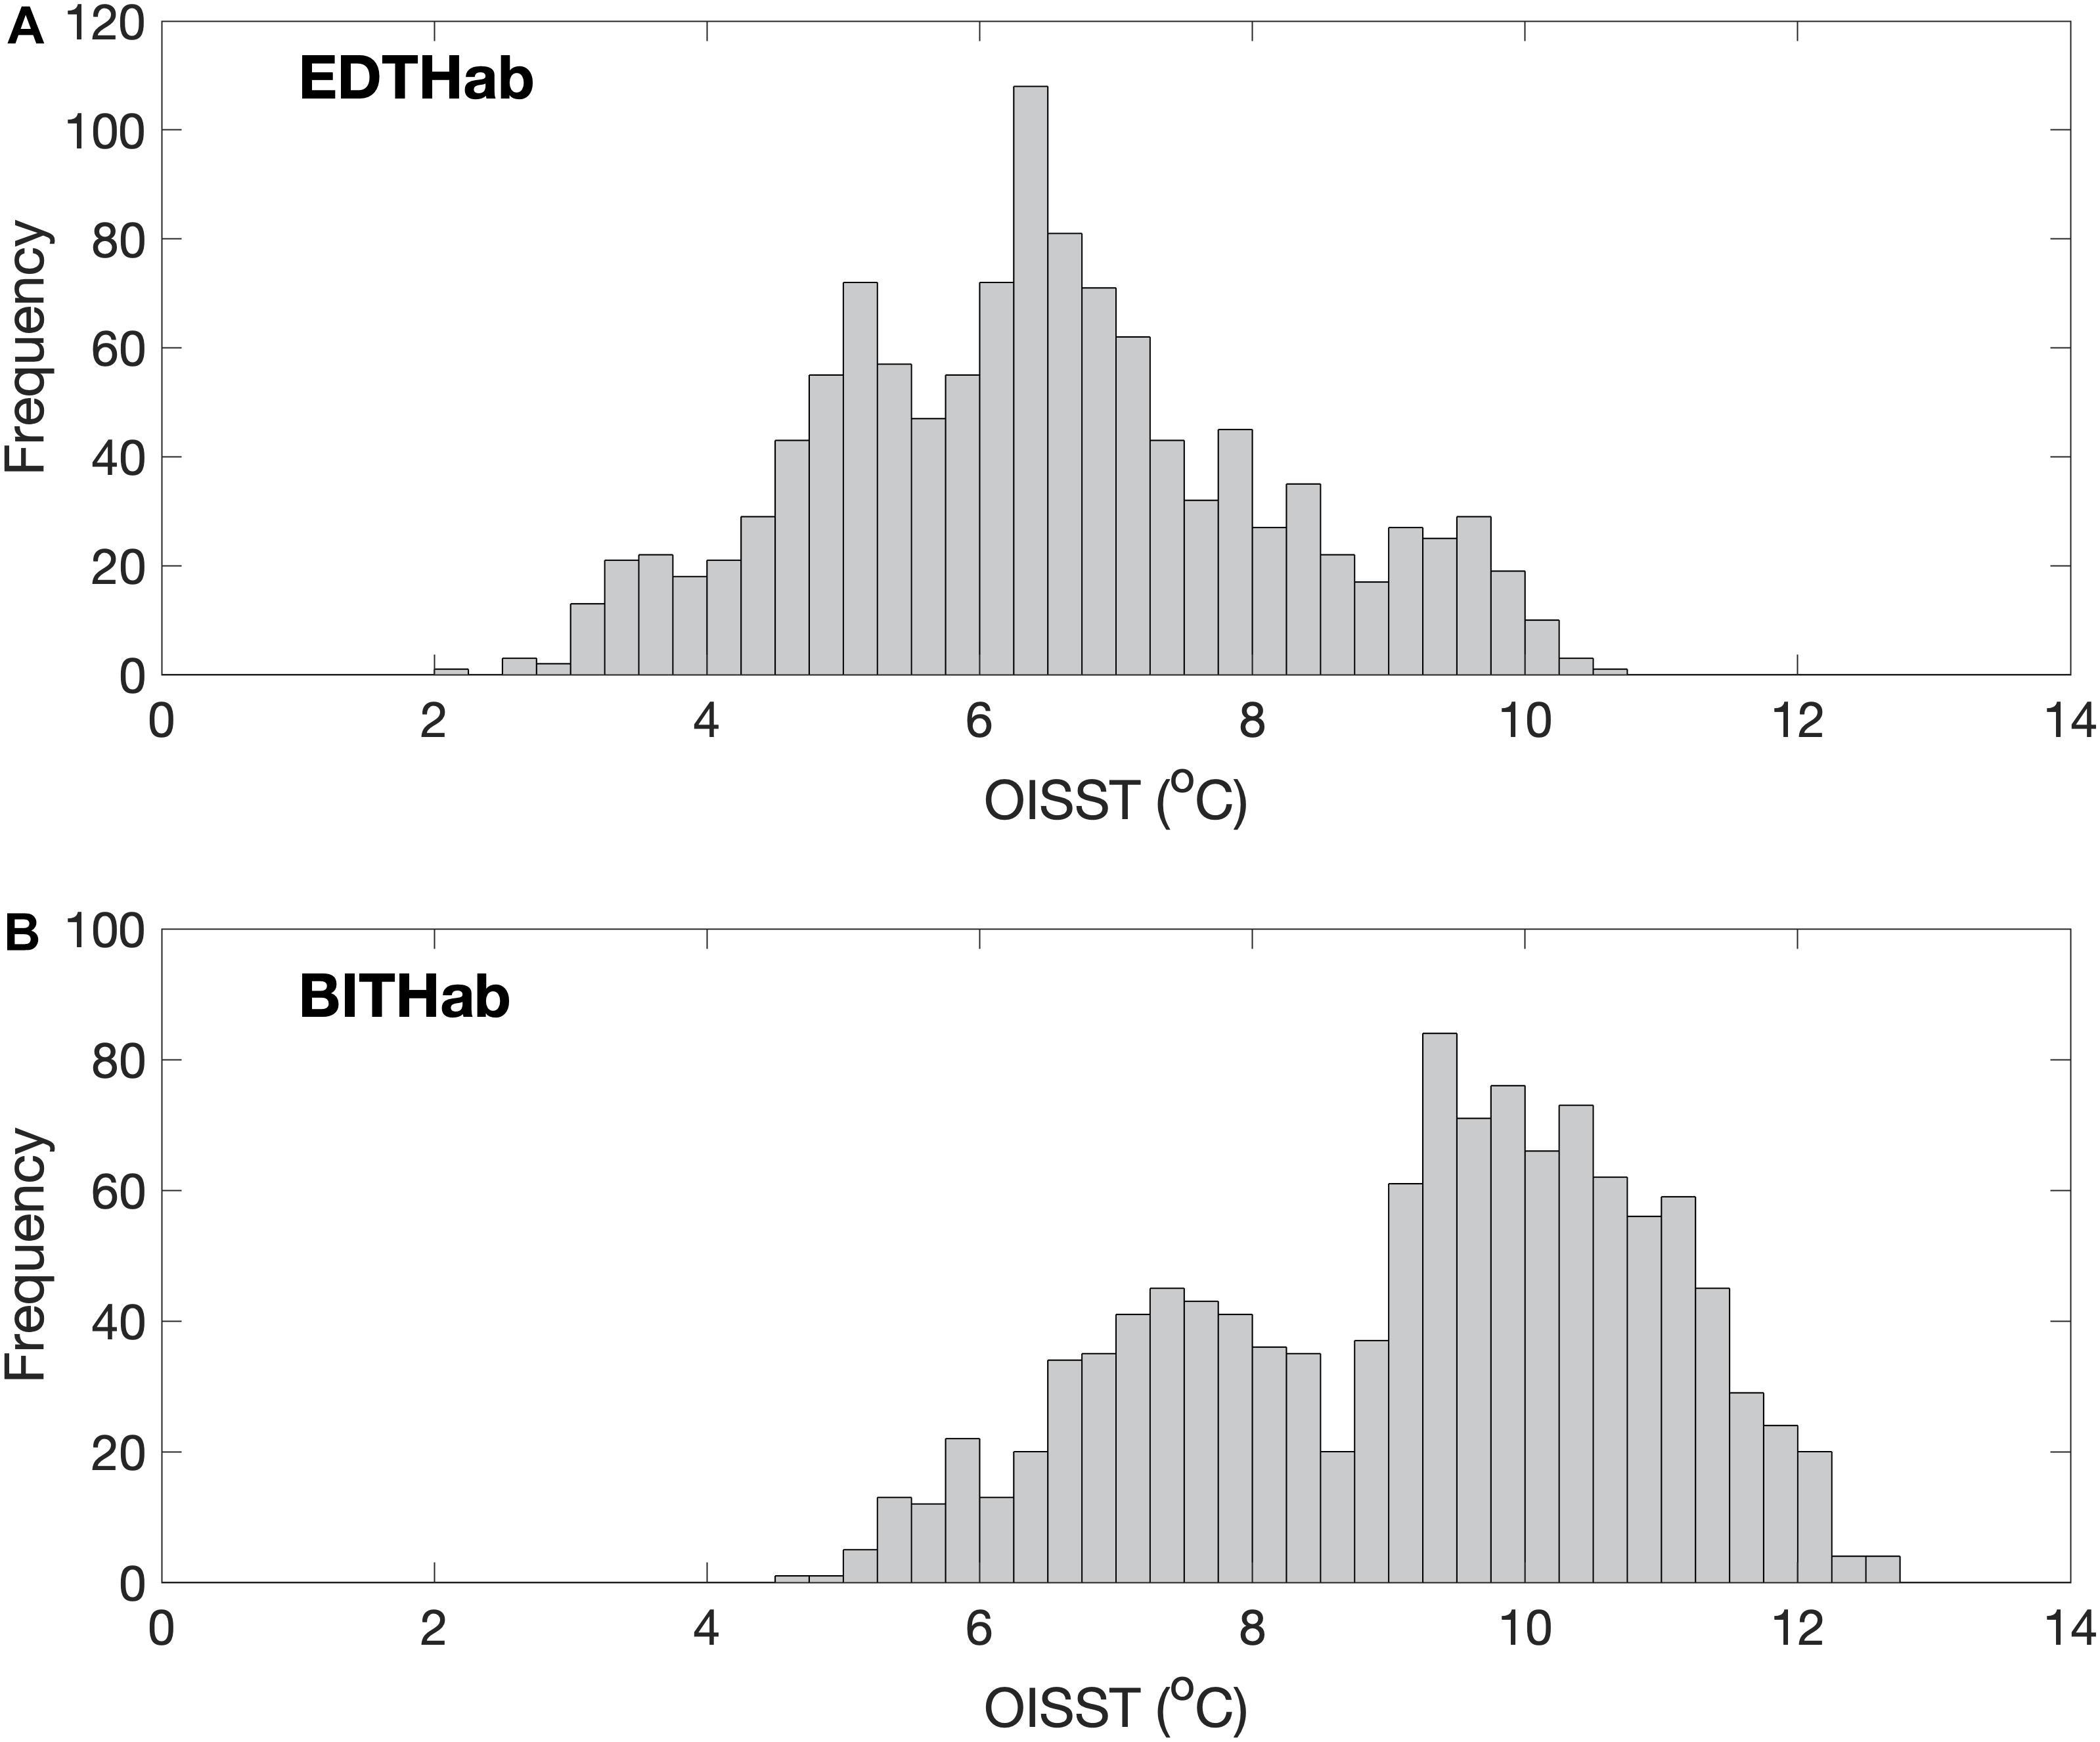
Figure 4. Frequency distribution of temperature from the four OISST grid points near Wolves Islands, from where A. catenella was sampled. SST in each of the four grid points were obtained during a 11 day window centered at the respective bloom dates, over the 27-years sampling period (1988–2014). (A) Early Detection Thermal Habitat (EDTHab) using the Early Detection Dates; (B) Bloom Initiation Thermal Habitat (BITHab) using the Bloom Initiation dates. The total number of valid pixels for each habitat is 1,188.
The OISST data allow an estimate of the annual date of onset of the EDTHab and BITHab over the main basin of the Bay of Fundy as mean values and associated uncertainty. Both habitats show a strong interannual variability (Figure 5). The mean date of onset of EDTHab is day 146, and ranges from day 116 (2012) to day 163 (1992) (Figure 5A). The onset dates of the colder values of EDTHab (minus 1 standard deviation) display stronger interannual variability than the mean or warmer values. The upper and lower limits of EDTHab occurrences are, on average, on day 160 ± 11 and 130 ± 16, respectively. The average onset date of BITHab is day 172, with the latest date of this habitat in 2004 (day 191) and the earliest in 2012 (day 144) (Figure 5B). Variabilities of the mean and plus and minus one standard deviation are very similar. The lower and upper limit of BITHab occurrences are, on average, on day 155 ± 11 and 188 ± 11, respectively. Both EDTHab and BITHab have similar, significant trends toward earlier dates. EDTHab decreases 0.54 days year–1 (± 0.12, p < 0.001, n = 38), while BITHab decreases 0.59 days year–1 (± 0.13, p < 0.001, n = 38). The fastest rate of decrease (1.02 ± 0.16 days year–1) was observed for the lower temperature bound of EDTHab.
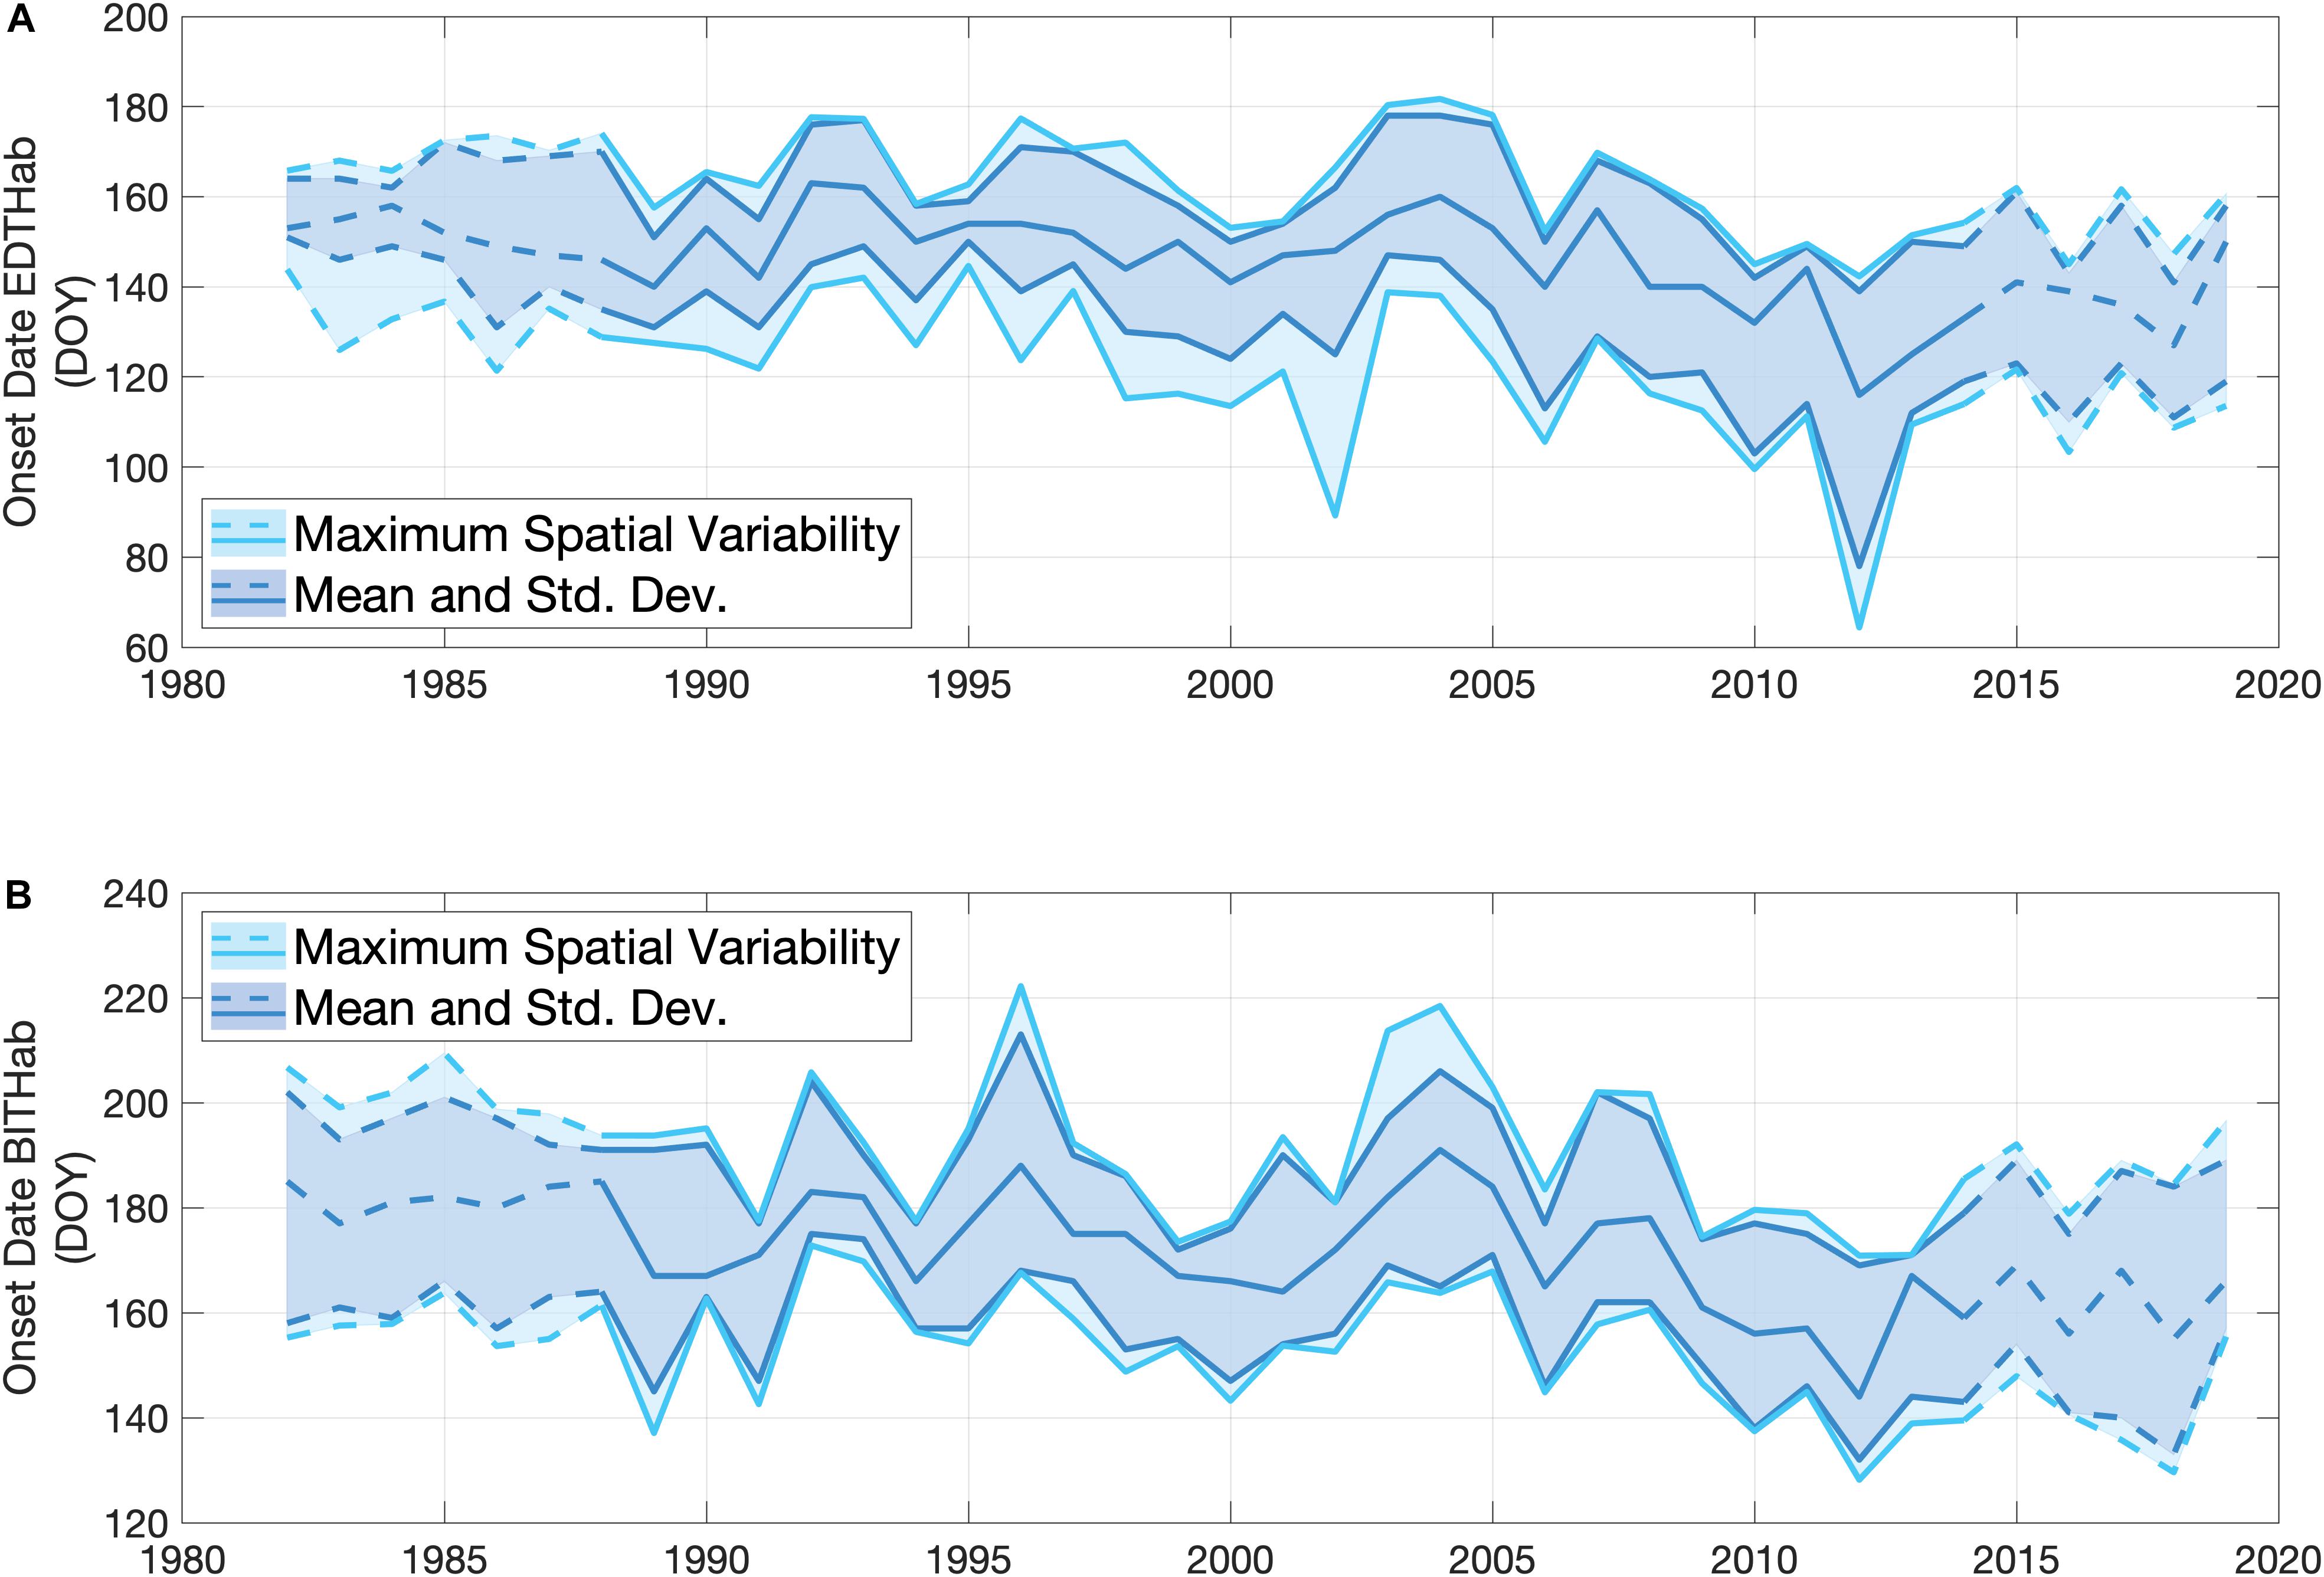
Figure 5. Interannual variability in the onset dates of EDTHab (A) and BITHab (B) for A. catenella in the central basin of the Bay of Fundy (12 grid points) over the time period of SST data availability (1982 to 2019). The darker lines and shaded areas represent the mean arrival date over the central basin for the mean temperature (central line) and ± 1 standard deviation defining the habitats (obtained from Figure 4). The lighter lines and shaded areas represent the spatial variability in the occurrence of the end members of the temperature envelope over the 12 grid points of the central basin in each year. The upper (lower) light blue line corresponds to + 1 standard deviation (– 1 standard deviation) obtained when estimating the onset of the thermal habitat using the mean temperature + 1 standard deviation (– 1 standard deviation). The solid lines in all the cases correspond to the time period (1988–2014) of A. catenella data availability, while dashed lines represent the period of only OISST data availability.
Separation of the years into those in which blooms of A. catenella occur prior to or after the date of the mean BITHab in the region is one approach to assessing the relative association and importance of other bloom characteristics. A strong difference is evident in bloom magnitude between weaker blooms in years when blooms precede the mean BITHab date (occur in colder water) and stronger blooms in years when the bloom follows the date (occur in warmer water) (Figure 6A) (p = 0.036, n = 27). No significant difference was evident for bloom duration (Figure 6B). We examined the extent to which readily available environmental variables linked to stratification, as wind-driven turbulence and freshwater discharge, were associated with A. catenella bloom timing. Years with blooms prior to the mean BITHab date (in colder water) are associated with higher total integrated early season discharge (March through May) than years with later blooms (Figure 6C, p = 0.03, n = 27). No significant difference was evident in the integrated wind-driven turbulent momentum (U*3) (Figure 6D).
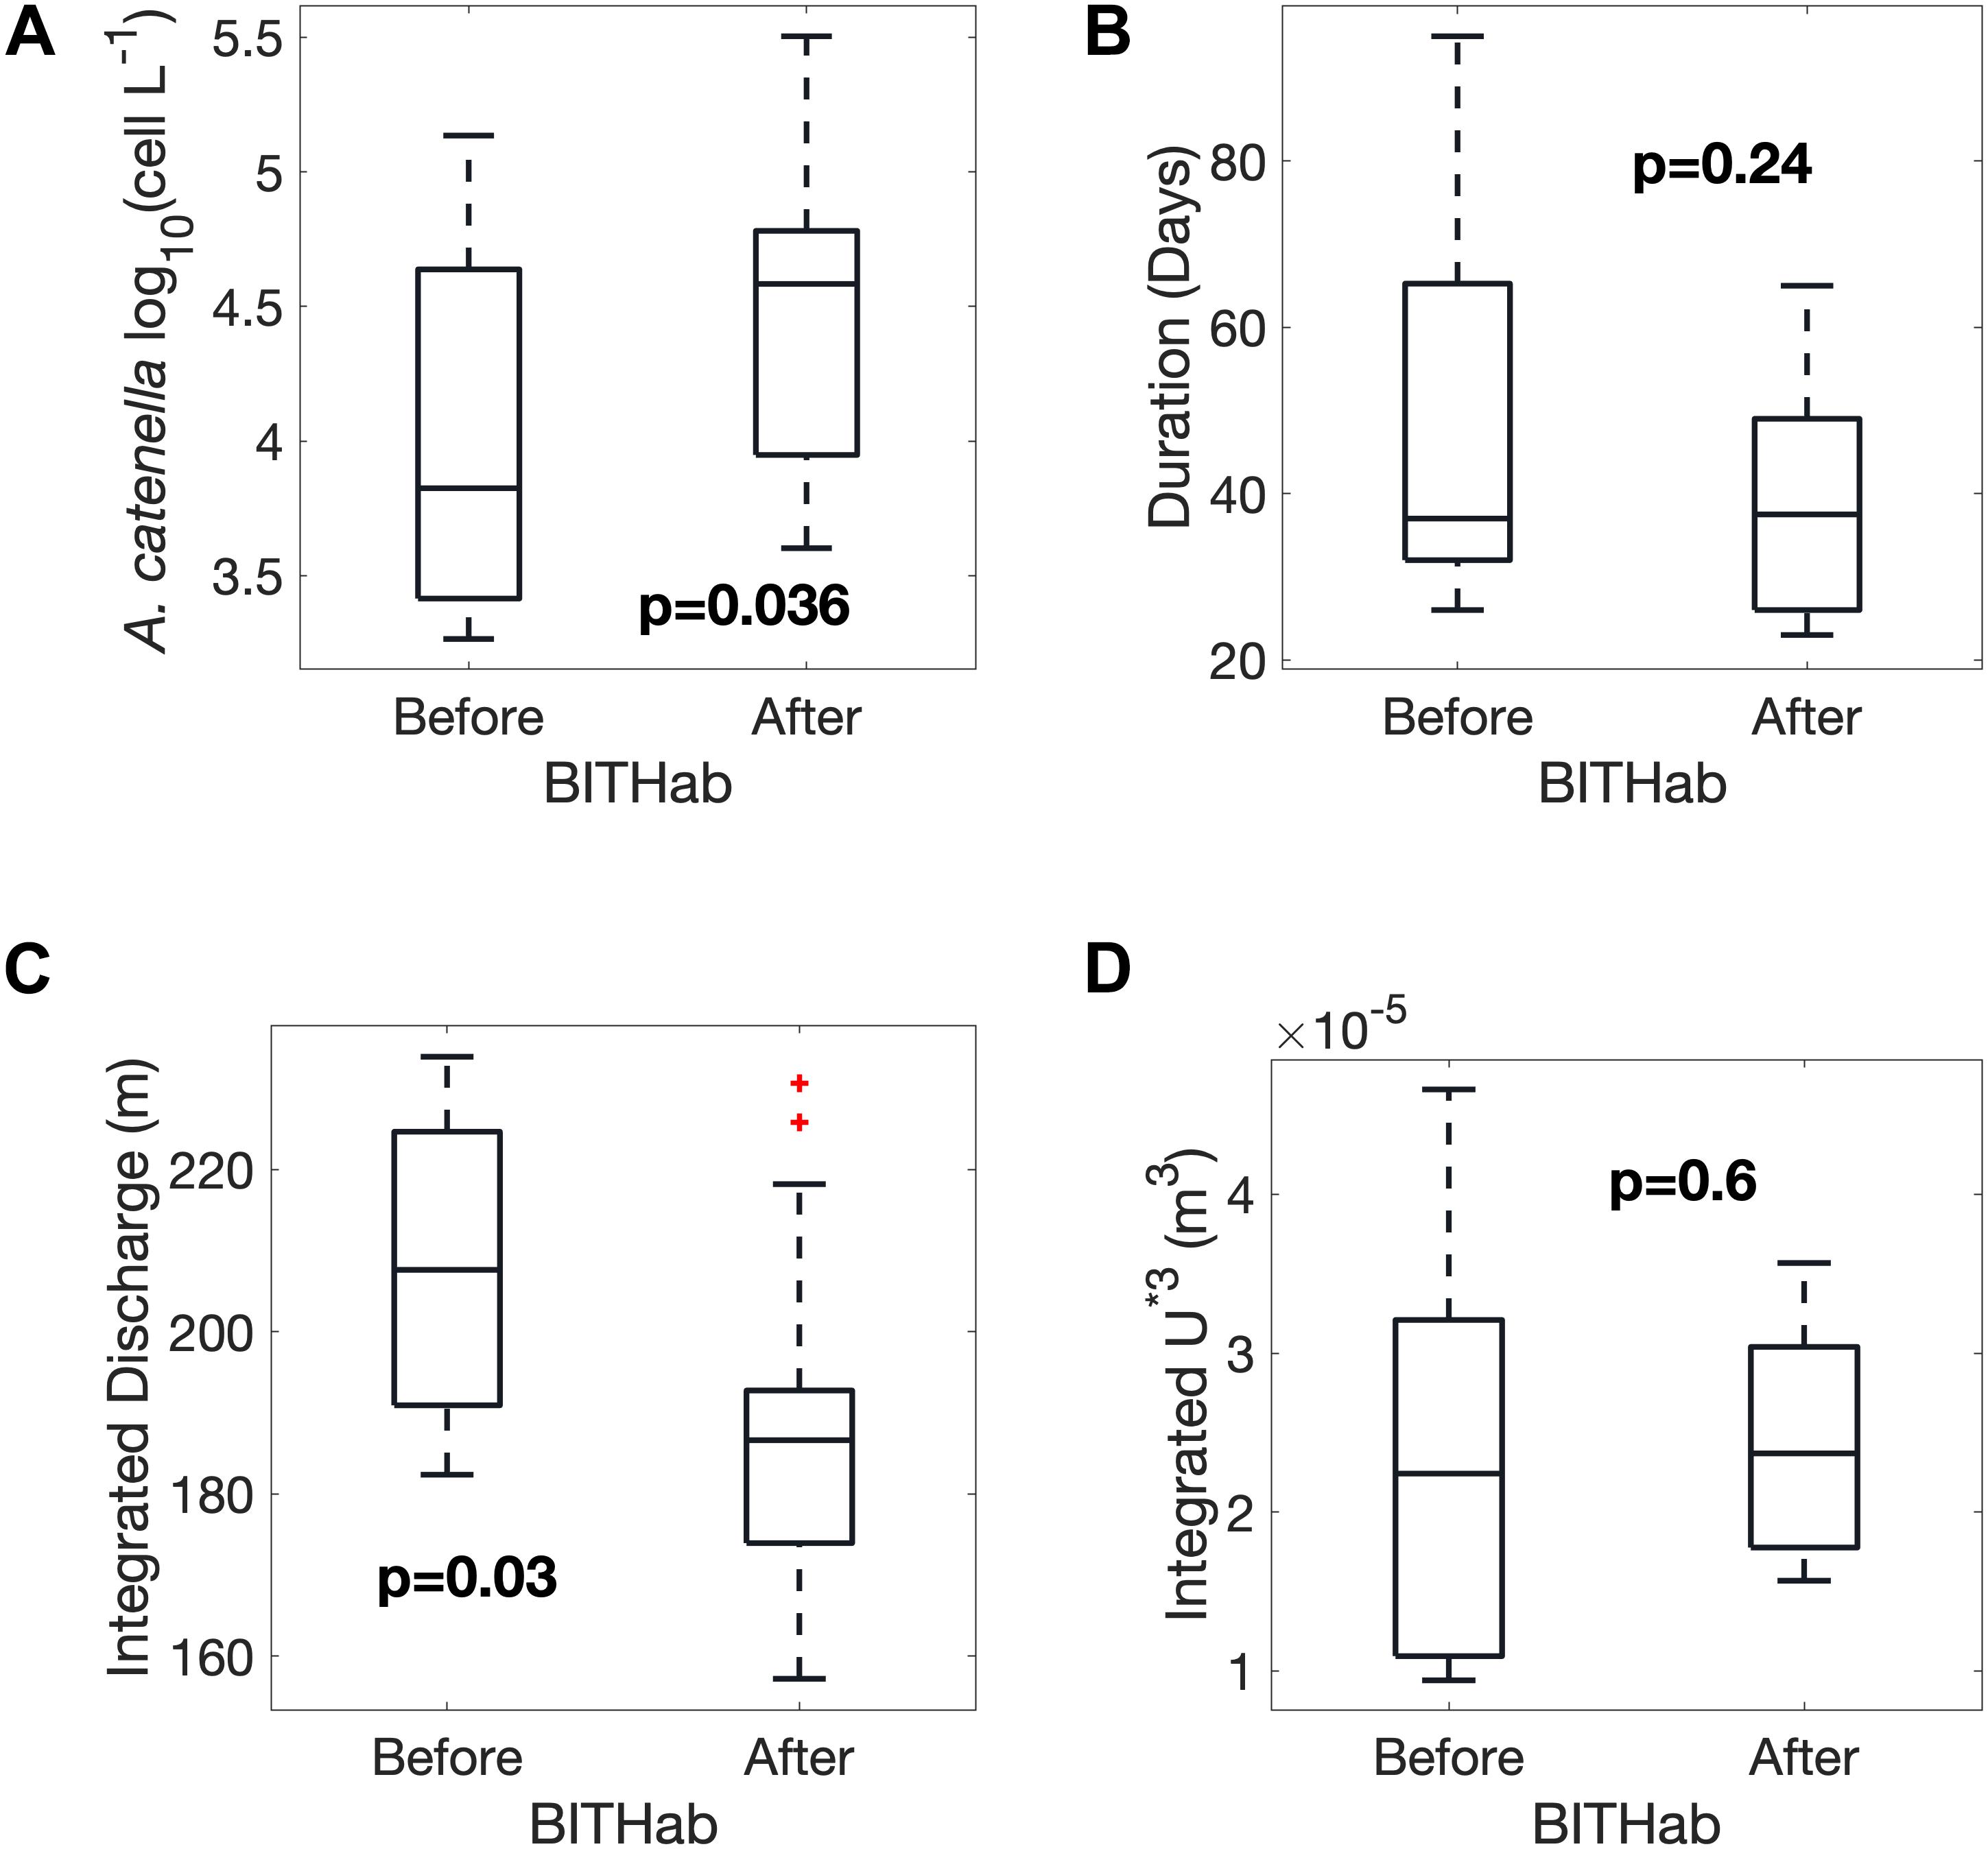
Figure 6. Differences between years in which blooms occur before or after the mean BITHab date as boxplots showing the mean, standard deviation and total range of the Magnitude (A) and Duration (B) of A. catenella blooms, spring St. John River Freshwater Discharge (C) and spring Wind-Driven Turbulent Momentum (D) (C and D are integrated in time from March through May).
The relationship between the integrated river discharge and two metrics of A. catenella bloom phenology, bloom initiation, and date of maximum concentration, are quantified in Figure 7. Both metrics decrease (shift earlier) with increasing total freshwater discharge. For both metrics, the strength of the relationship is weak due to a few years falling outside the main trend (e.g., 2003, 2012, and 2013 in both metrics). We also investigated the effects of the timing of maximum freshwater discharge from the St. John River on these bloom metrics, as freshwater discharge is strongly seasonal in mid latitudes systems, however, no relationships were evident.
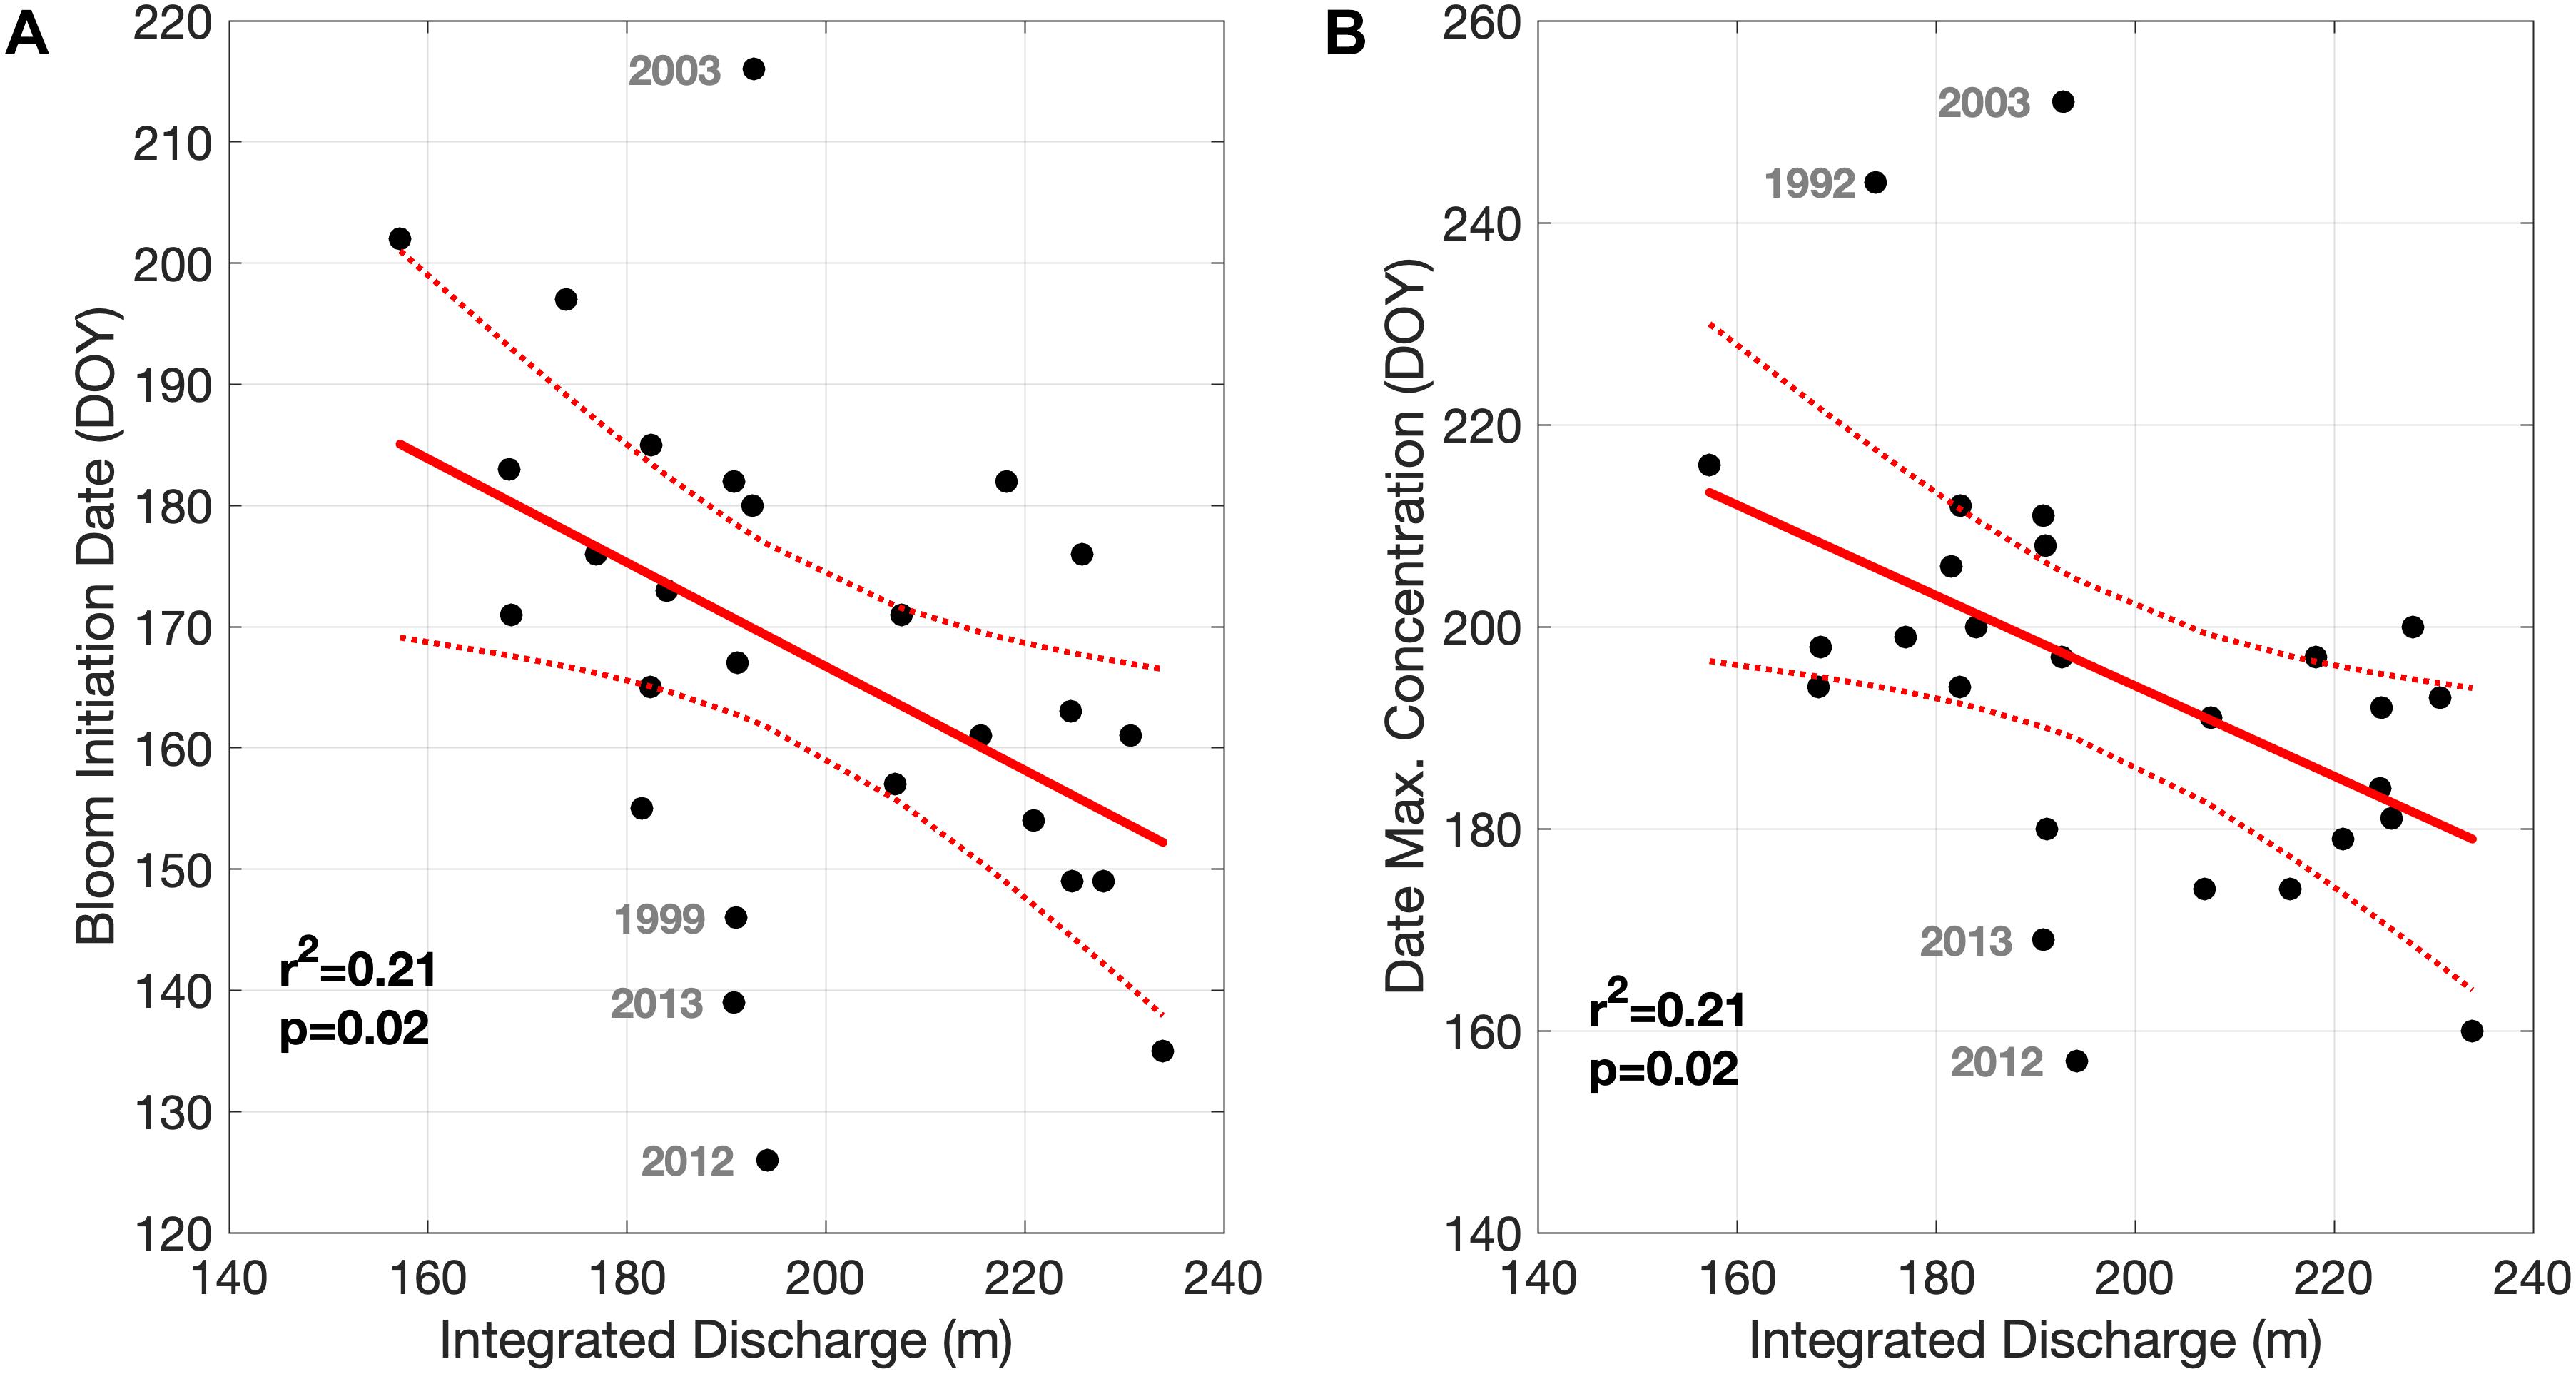
Figure 7. Relationship between the integrated (March through May) freshwater discharge from the St. John River and the Bloom Initiation Date (A) and Date of Maximum Concentration (B). Highlighted years are displayed in gray.
The impact of SST interannual variability on the timing of habitat onset and bloom phenology is isolated by removing the seasonal cycle and comparing each onset time to averaged SST anomalies for the period of March through July (SSTa, Mar–Jul). There is a strong relationship between the dates of onset of the two thermal habitats and the Bay of Fundy SSTa Mar–Jul (Figures 8A,B). Colder bloom seasons (negative anomalies) are associated with both EDTHab and BITHab occurring later in the year at the rate of 11.4 and 12.2 days °C–1, respectively. Although this relationship is expected, the rate is an important quantification for forecasting strategies. There are also relationships between SSTa Mar-Jul and both early detection and bloom initiation dates (Figures 8C and D, respectively). Although the relationship is weaker, trends are evident and significant, with both early detection and bloom initiation dates occurring later in colder bloom seasons at a rate of 32.3 and 34.8 days °C–1, respectively. These relationships suggest an important linkage between habitat, HABs timing in the study area and interannual variability in SSTa, and so potentially to local warming associated with climate change.
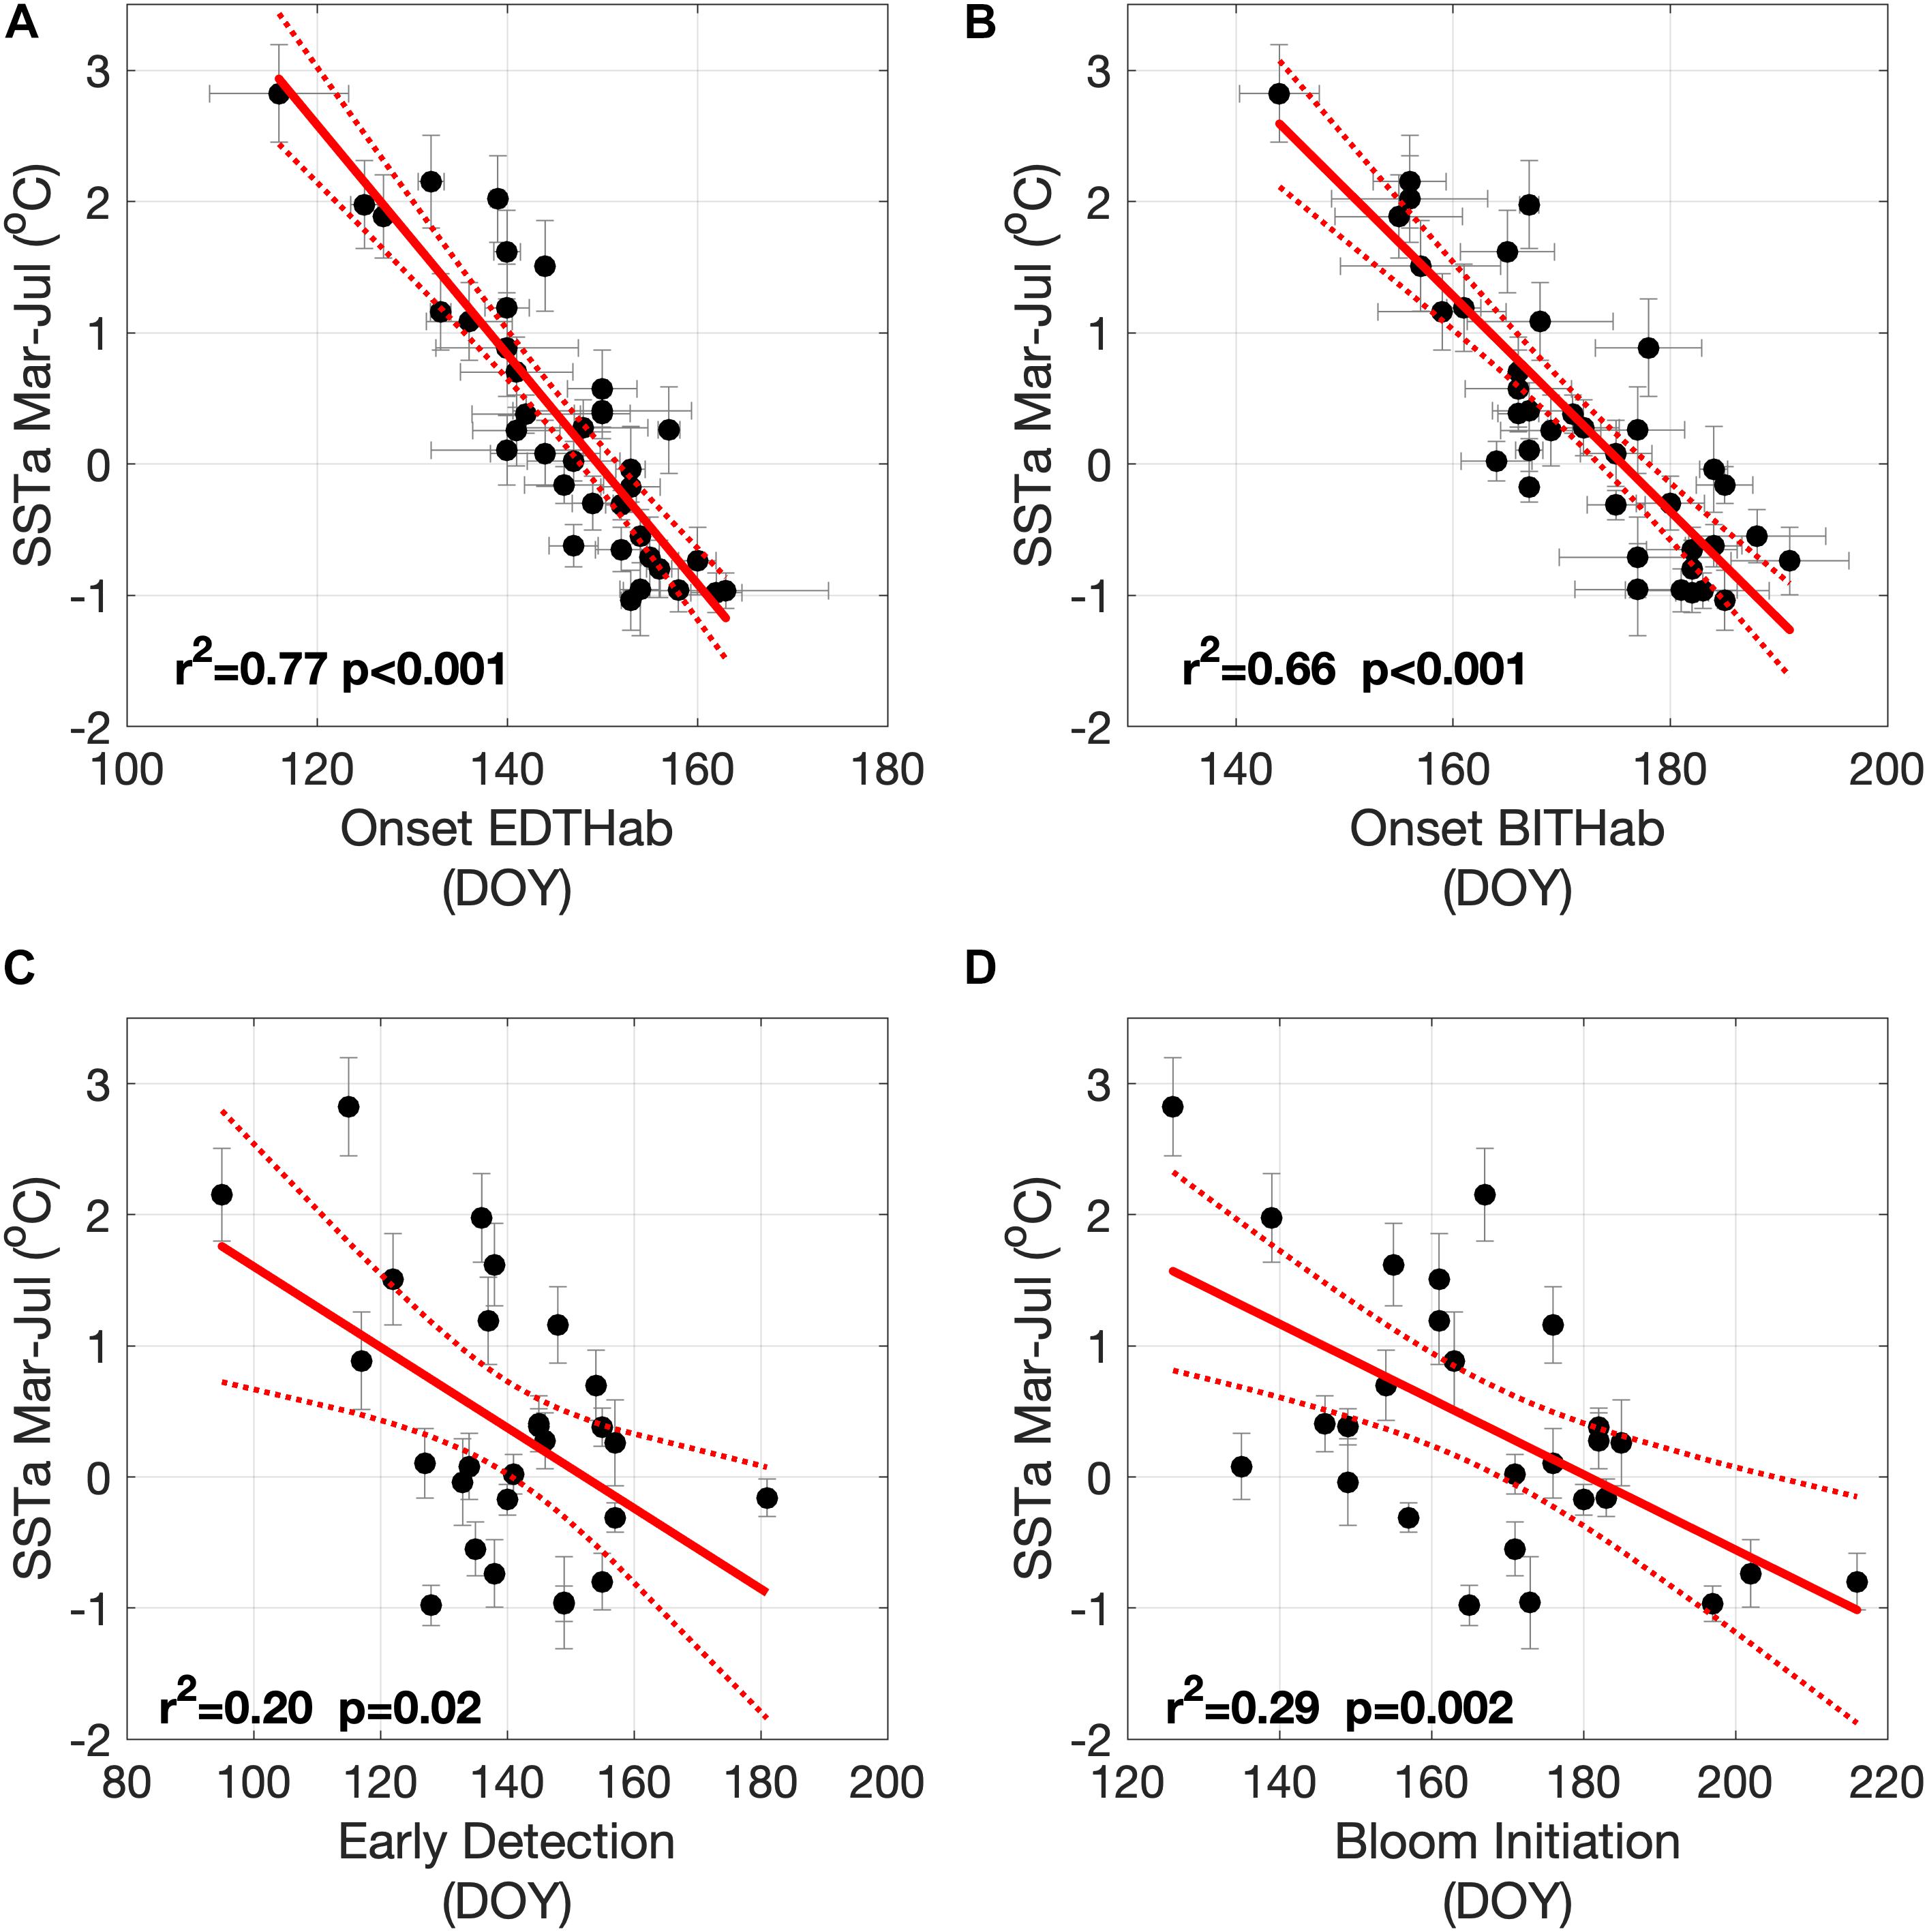
Figure 8. Relationships between mean SSTa Mar–Jul and: (A) EDTHab mean occurrence date, (B) BITHab mean occurrence date, (C) early detection date and (D) bloom initiation date. Vertical and horizontal lines represent the standard deviation.
Given the possible linkage between SSTa and A. catenella bloom development, a view of future SSTa in this region with rapidly changing ocean climate is highly desirable. A simple extrapolation of historical SSTa trends in the period of March to July in the Bay of Fundy provides a view of what the SSTa may look like by the middle of the century (2050) (Figure 9A). The mean SSTa Mar-Jul trend over the period of OISST data availability (1982–2019) is 0.069°C year–1 (± 0.02) over the 23 grid points in the Bay of Fundy. Using these rates, the projected 2050 SSTa Mar–Jul mean in the region is 3.8°C (ranges from 2.8 to 4.7°C) above the 30-year climatology. Bloom phenology metrics can be projected out to 2050 by using current SSTa Mar–Jul trends and the observed relationships between A. catenella blooms and SSTa Mar-Jul (Figures 9B–E). The projected date of onset of EDTHab (Figure 9B) in the Bay of Fundy advances 31 days from its current average date of day 146 (late May) to day 115 (late April). BITHab (Figure 9C) would be expected to occur on average at day 140 (mid-May), 32 days earlier than the current average date of 172 (mid-June). By 2050, the early detection dates (Figure 9D) are expected to occur at day 112 (late April), 28 days earlier than the current average date of day 140 (mid-May). The bloom initiation date (Figure 9E) is expected to occur 40 days earlier than the current average date (day 167, mid-June), at day 127 (early May).
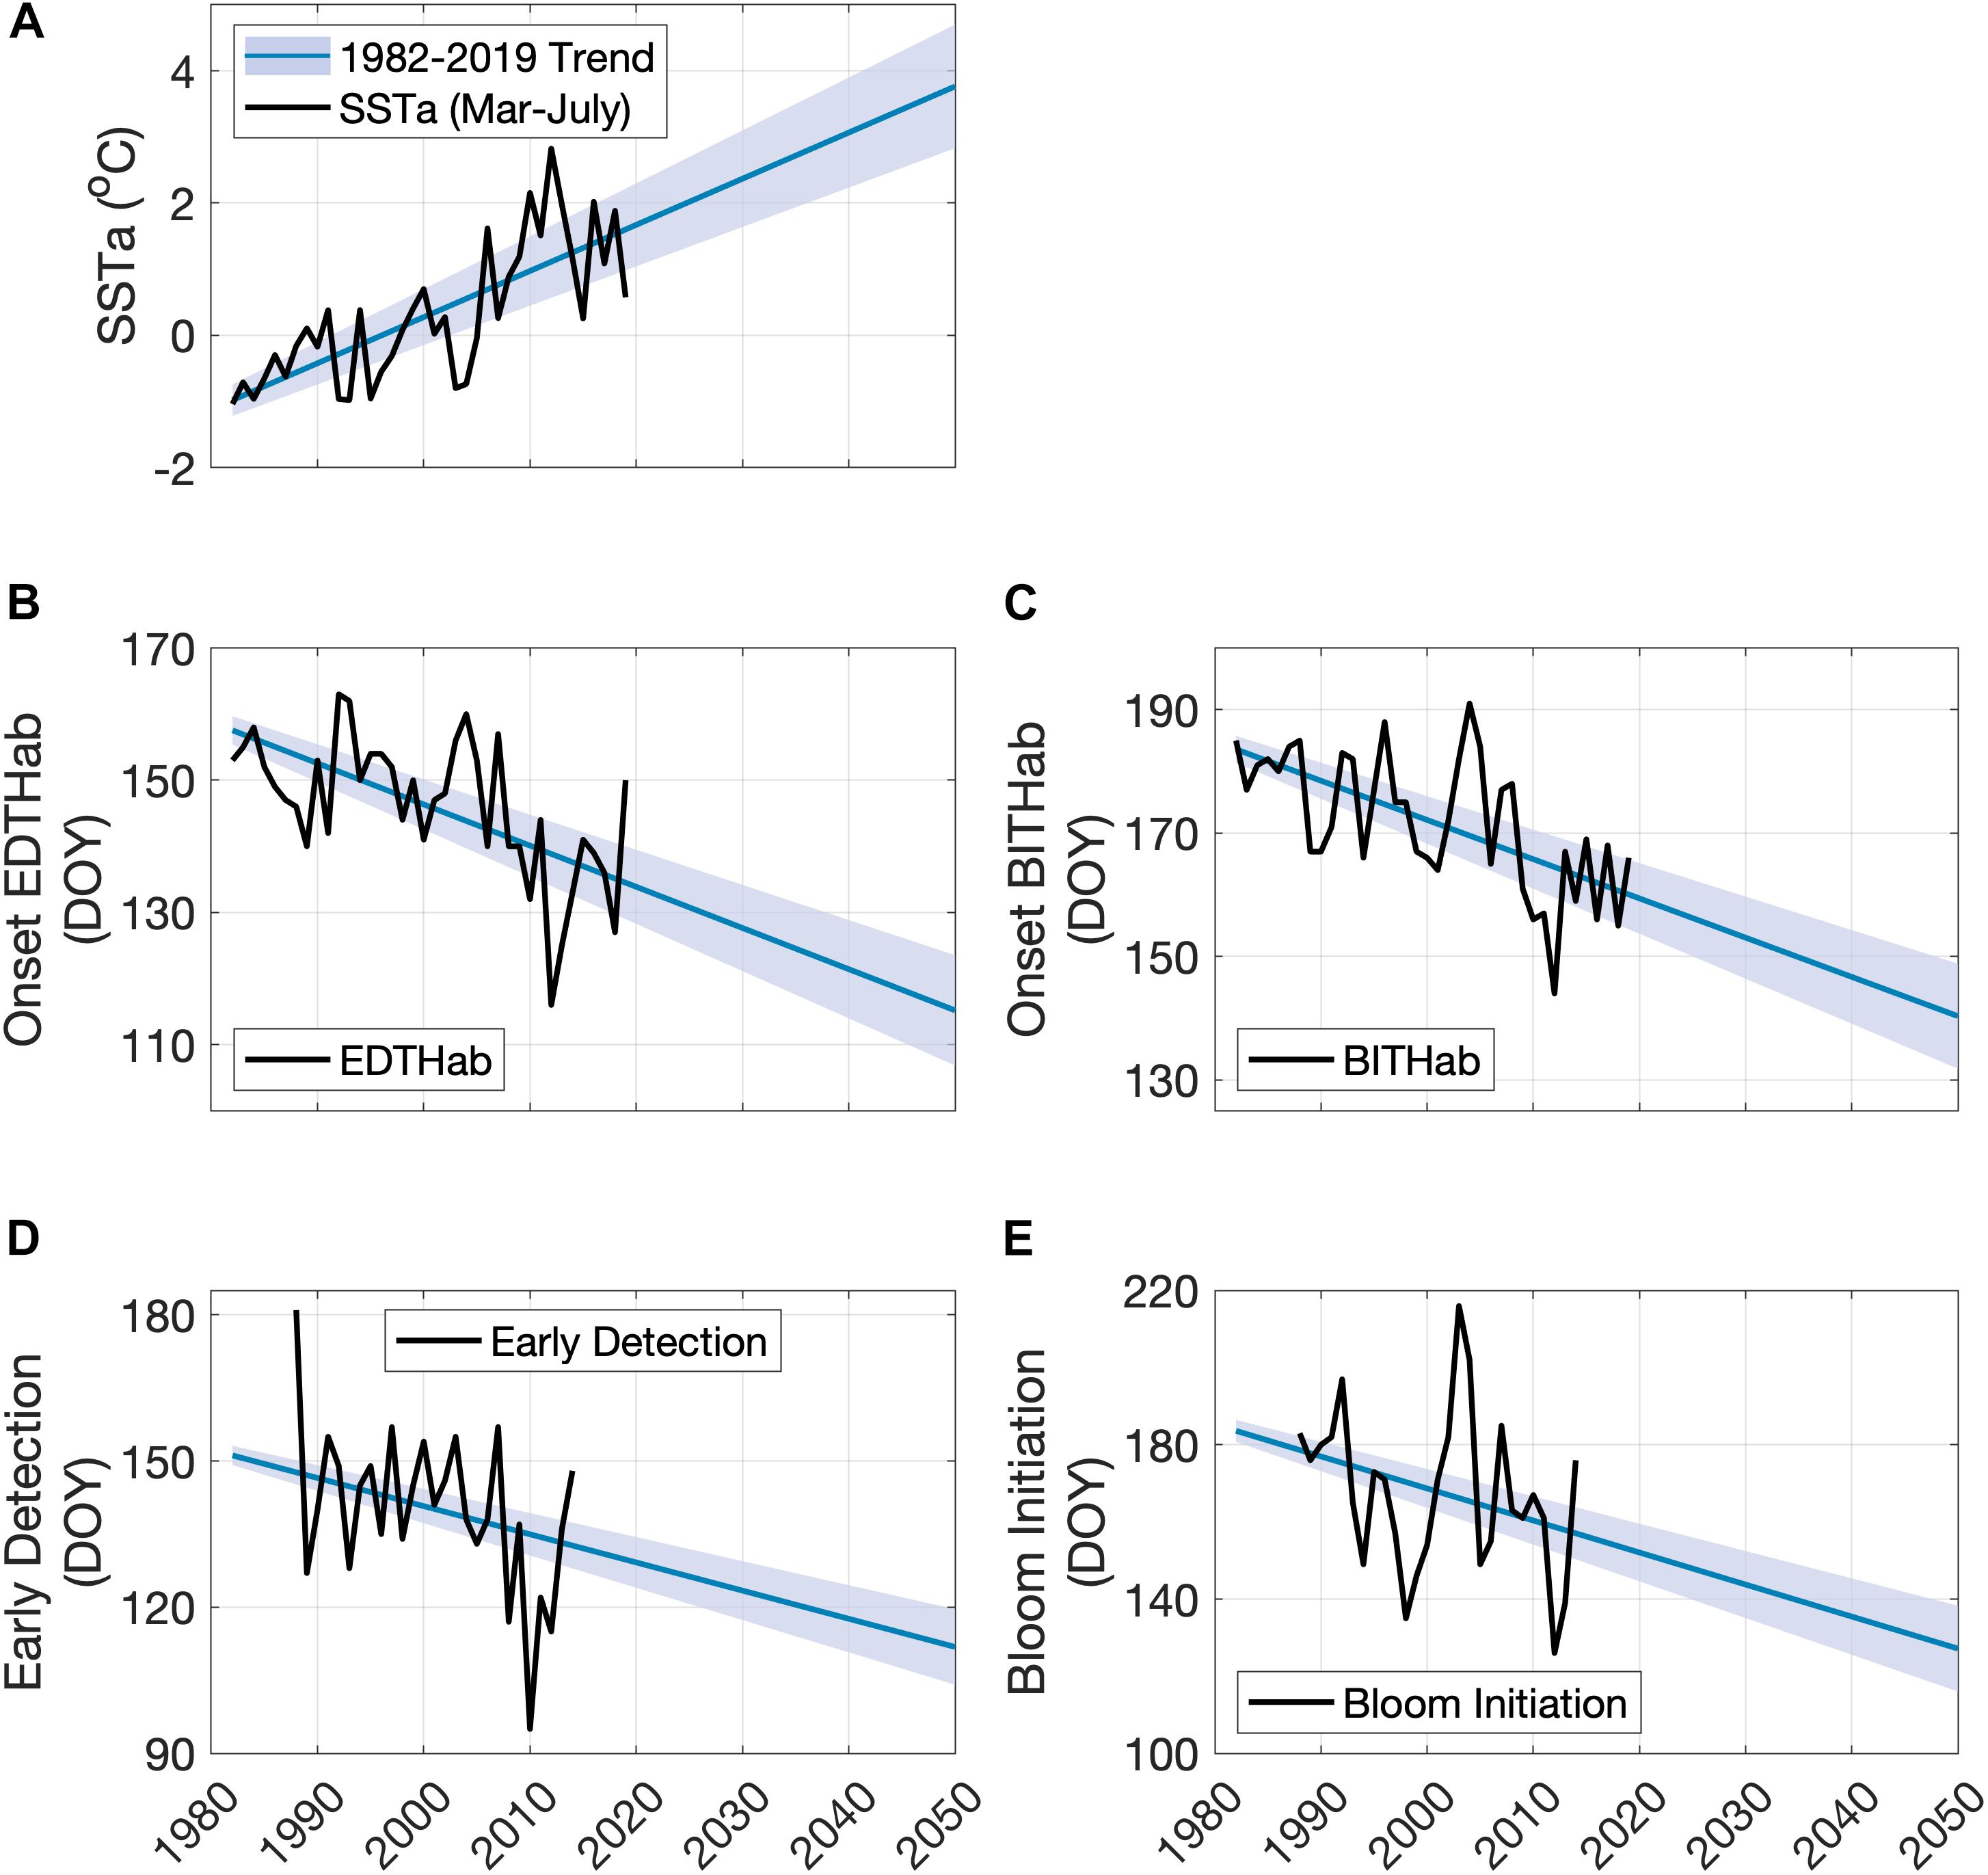
Figure 9. Observed and projected SSTa Mar-Jul for the Bay of Fundy (A), dates of EDTHab (B) and BITHab (C), early detection (D), and bloom initiation (E) of A. catenella in the Bay of Fundy. The black solid line in each plot corresponds to the observed data. The blue line represents the projected data using the full extent of available SSTa (1982–2019) ± 1 standard deviation (shaded blue area).
The strong interannual variability in HAB intensity, frequency and distribution in the study region (e.g., Anderson et al., 2014; Martin et al., 2014b) makes understanding the dominant driving mechanisms and any potential prediction of such events very challenging. Linking bloom metrics to interannual variability in thermal habitat of A. catenella and other environmental parameters contributes to an integrated perspective on the mechanisms coupling bloom initiation and development and environmental drivers. Isolating consistent patterns of bloom development of A. catenella is still elusive. However, our findings show that sea surface temperature and freshwater discharge, likely due to their impacts on water column stability, are contributing to the variability in the seasonal timing of A. catenella blooms.
Most of the descriptive metrics for A. catenella blooms presented here show strong interannual variability, with distinct patterns between metrics at a given year. The relatively constant early detection dates over the studied period are likely explained by a tighter connection between this metric, winter deeper water mixing and cyst germination and inoculation of the surface layers. Matrai et al. (2005) identified a circannual endogenous cycle of cysts germination in the Bay of Fundy with a constant phase regardless of changes in environmental conditions. Our data shows that the time interval from early detection, to bloom initiation and finally, bloom peak varies among years. This probably reflects the combined effects of distinct growth and physical accumulation rates, and their responses to changes in the environmental conditions, cysts inoculation rates and biological interactions. However, there is a trend, although not statistically significant, for early detection, bloom initiation and maximum concentration dates to occur earlier over the study period. This shift to earlier occurrence of A. catenella blooms in the season warrants further exploration of the thermal habitat and long-term trends in sea surface temperature anomalies. Previous studies used a more limited time series to examine aspects of phenology (e.g., 1988–2004; Page et al., 2006) or its relationship to cyst abundance in local seed beds and trends in shellfish toxicity (White, 1987; Martin et al., 2014b). The average early observation date over our 27-year study period was consistent with those observations, but the average bloom duration is within the lower limits observed by Page et al. (2006). However, these earlier studies used a different definition for duration, such as the total number of days in a year with presence of A. catenella or an unbroken sequence of days with presence of the organism, therefore differences are not unexpected.
Early detection of A. catenella is associated with the 6.5°C (± 1.6°C) temperature envelope, while the bloom initiates in the temperature envelope of 9.2°C (± 1.7°C). Although we opted for a single temperature interval for BITHab, we note two features of the bimodal distribution of temperatures for this habitat. First, most of the years that comprise the colder mode in BITHab, are characterized by La Niña events, associated with relatively colder weather and higher winter precipitation rates over eastern North America. Second, there is still considerable overlap in the temperature frequency distribution for the two modes and the choice of temperature interval presented here is representative of both modes. With increasing global and local warming of the surface oceans and more extreme climate fluctuations, these two modes could potentially separate and this thermal habitat interval should be revisited in the future. Both thermal habitats (EDTHab and BITHab) represent sub-optimal conditions for A. catenella maximum growth. Experiments with A. catenella have shown that maximum growth rates are achieved around 15°C (Etheridge and Roesler, 2005). Anderson et al. (1983) pointed out that blooms of A. catenella in the Gulf of Maine occur in sub-optimal temperature conditions. This was also observed with Alexandrium tamarense, an ecophysiological similar species, in Chinhae Bay, Korea (Han et al., 1992). Cysts from the Bay of Fundy and eastern Gulf of Maine show an endogenous circannual germination cycle peaking between November and February and declining during spring (Matrai et al., 2005). This timing is earlier than cysts from the western Gulf of Maine (Anderson and Keafer, 1987), and could explain the frequent presence of A. catenella vegetative cells in waters with temperatures on the colder side of the optimal growth curve. Optimal temperature conditions for A. catenella growth are, in fact, observed later in the summer in the Bay of Fundy and the Gulf of Maine (Townsend et al., 2005b). Several studies in the region discuss the temperature conditions in which A. catenella occur (Martin et al., 2005; Townsend et al., 2005a), but not necessarily the temperature interval for bloom initiation.
Water column stratification is a key component in the competitive success of dinoflagellates such as A. catenella. Blooms with the highest concentrations of A. catenella in the Bay of Fundy are observed after stratification and during extended periods of low winds (Martin et al., 2014b). Seasonal thermal stratification and its associated impact on nutrient and light dynamics are recognized to provide a competitive advantage for A. catenella (Blasco et al., 2003). Blooms occurring prior to the onset of the mean BITHab shared two characteristics; first, they were weaker than those occurring later, and second, they were associated with stronger St. John River spring runoff. This suggests that for blooms occurring later, temperature might be a more important driver of stratification leading to enhancement of bloom conditions. After winter water column inoculation (Matrai et al., 2005), the vegetative populations are subjected to local water column dynamics and ecological competition. In years when blooms occur prior to the mean thermal habitat, other environmental factors might impact the stabilization of the water column, such as stronger freshwater discharge. Although direct metrics of water column stratification are not available, we suggest that stability of the water column in the region, either achieved by the warming of the surface layer or increase in buoyancy due to freshwater discharge, is creating suitable conditions for A. catenella growth.
There is a link, although weak, between spring integrated freshwater discharge and both the bloom initiation date and the date of maximum concentration. These results are consistent with other regions (Moore et al., 2009) and other dinoflagellate species (Klais et al., 2011). The observed link between freshwater discharge and some of the bloom timing metrics suggests that this river plume is creating stratified conditions earlier in the year, prior to the normal seasonal thermal stratification. In Alaskan coastal waters, the level of stratification is associated with the time of onset of A. catenella blooms (Tobin et al., 2019). For A. tamarense, blooms develop when water column stability is maximum, associated with high surface water temperatures and low wind conditions (Therriault et al., 1985; Fauchot et al., 2008).
Previous work has shown that long periods of low wind speed are associated with stronger A. catenella summer blooms (Martin et al., 2014b) and high shellfish toxicity levels along the New Brunswick coast (Martin and Richard, 1996). Over the Gulf of Maine, linkages of wind metrics (speed, direction, and turbulence) and A. catenella abundance (McGillicuddy et al., 2014) and coastal shellfish toxicity (Thomas et al., 2010; Nair et al., 2013) have been made. In our study, neither shellfish toxicity data nor mid-summer wind conditions were examined. Our results, however, did not show a systematic link between interannual variability in spring wind mixing and the bloom metrics and thermal habitat occurrence. In the Gulf of Maine, where such linkages are observed, the transport and accumulation of A. catenella in the strongly wind driven coastal boundary layer are important for bloom development (Townsend et al., 2001). In the Bay of Fundy, circulation is more tightly connected to tides and freshwater discharge (Aretxabaleta et al., 2008) and to a lesser extent to any wind component (Aretxabaleta et al., 2009).
Removal of the seasonal cycle by examining SST anomalies eliminates the obvious strong seasonal dependence on thermal timing. The timing of onset of both thermal habitats of A. catenella in the Bay of Fundy as well as the early detection and bloom initiation dates are connected to interannual fluctuations in SSTa. The systematic reduction in the timing of both thermal habitats (EDTHab and BITHab) over the study period is consistent with climate-linked warming trends for the Gulf of Maine (e.g., Pershing et al., 2015; Thomas et al., 2017; Alexander et al., 2018). Increased temperatures, especially during summer, drive thermal phenological shifts, including earlier arrival dates of specific temperature thresholds and an average reduction in summer start date by approximately 1 day year–1 (Thomas et al., 2017). Comparing historical and future thermal habitat distributions of A. catenella from Puget Sound (United States) Moore et al. (2008) identified an increase in the seasonal window of opportunity for bloom development, from a historical average of 68 days up to 259 days in the future. Overlaying the long-term trends in SSTa are the episodic effects of local heat waves. Heat waves have become more frequent and their effect in Gulf of Maine fisheries and ecosystem functionality are severe (Mills et al., 2013). Both EDTHab and BITHab, as well as the bloom initiation have an episodic decrease in date of occurrence in 2006 and 2012, both years recognized heat wave events (Scannell et al., 2016; Hobday et al., 2018).
Simple extrapolation of present relationships to the middle of this century shows the EDTHab of A. catenella occurring in late April, one month earlier than the present climatology. Similarly, changes in the onset of BITHab result in a 32 days shift from mid-June (current) to mid-May. This difference is consistent with previous work showing seasonal differences in the strength of warming (Thomas et al., 2017; Alexander et al., 2018). Similarly, by 2050, the early detection and bloom initiation dates are expected to occur earlier than presently observed. Although based on simple extrapolation, the SST projections are consistent with global climate model projections for ocean surface temperature in the region. All 26 models in the Coupled Model Intercomparison Project (CMIP5) estimate warming in every month for the 1976–2099 period over both Large Marine Ecosystem (LME) 7 (Mid Atlantic Bight – Gulf of Maine) and 8 (Scotian Shelf – southern Gulf of St. Lawrence) (Alexander et al., 2018). We isolated these same model data for the period 1976–2050 and note that the ensemble mean trend for LME 7 is 0.29°C decade–1 (standard deviation across 26 models is 0.08) and for LME 8 is 0.33 (0.10)°C decade–1. The SSTa trend in the Bay of Fundy (Figure 9A, 0.69°C decade–1) is higher than these, but it is of note that 1) values for these LME regions average over much larger regions than the Bay of Fundy, none of which are warming as fast (Thomas et al., 2017; Alexander et al., 2018) and 2) a comparison of OISST SSTa trends spatially averaged over the same LME regions in the period of overlap (1982–2019) showed that although the overall CMIP5 model family encompassed the observed trends, the CMIP5 ensemble mean underestimates the observed OISST trends in both LME regions. These suggest that although the projections carried out here are simple extrapolations, they represent plausible future scenarios for Bay of Fundy HABs events and are of potential concern and high importance for policy makers.
The data provide evidence of links between freshwater discharge and bloom timing, likely through its influence on local stratification. In addition to warming, changing climate in the region is also projected to bring an increase in precipitation and freshwater discharge to the watersheds in the Gulf of Maine, including the St. John River (20% increase in discharge; Huntington and Billmire, 2014). Global climate models predict an overall increase (10–20%) in precipitation along the northeastern United States (Ning et al., 2015). The further stabilization of the water column in a future scenario is enhanced by an increase in fresher Scotian Shelf Water entering the Gulf of Maine and Bay of Fundy (Smith et al., 2012), therefore decreasing the surface salinity in the region. Freshening of the North Atlantic has been reported (Capotondi et al., 2012; Cheng et al., 2013; Bingham et al., 2014) and is expected to increase along the northeastern North America coast and Scotian Shelf (Alexander et al., 2020) due to advection of Labrador and Greenland freshwater. Both these salinity-driven impacts on stratification, as well as the interaction of increased stratification on enhanced surface warming have implications for the phenology of A. catenella blooms in the Bay of Fundy, driving earlier seasonal metrics. As regional surface salinity is expected to decrease, the contrast between the St. John River plume and local ocean surface layers might decrease. This could also have an impact on bloom phenology, especially in the period when blooms occur earlier in the year and are likely assisted by the stratification promoted by the river plume. Such interactions are likely best studied in a modeling environment.
The phenological responses of A. catenella blooms to increases in temperature and freshwater discharge need to be taken into account in monitoring studies and modeling of A. catenella in the region. The current forecast model for A. catenella distribution in the Gulf of Maine (Stock et al., 2005; Anderson et al., 2014) includes temperature in both physical and biological components (e.g., growth rates; He et al., 2008) as well as freshwater discharge in the physical component. Moreover, any responses of cysts germination to changes in temperature and its seasonality also play a role in the dynamics of A. catenella blooms in a warming climate (Brosnahan et al., 2020). Recently, Devred et al. (2018) developed a remote sensing approach to early detection of A. catenella in the Bay of Fundy using climatological surface temperature values to determine detection thresholds for their model. These temperature thresholds are likely to change in the future. Hence, shifts in the timing of occurrence of A. catenella blooms suggest that biophysical models that initiate their variables at a given month (e.g., Stock et al., 2005) or that rely on previous mean occurrence dates of A. catenella to determine thresholds (e.g., Devred et al., 2018) will need to adapt their parameters for future conditions.
Future scenarios where blooms of A. catenella start earlier and last longer are likely to cause associated shifts in shellfish harvesting closures to prevent PSP. The effects of toxins on shellfish is species-dependent (Hégaret et al., 2007), and some of the commercial shellfish species are able to rapidly depurate toxins (e.g., blue mussels and soft shell clams) (Bricelj and Shumway, 1998), making them safe to consume shortly after the end of a PSP event. Most of the economic losses associated with PSP outbreaks are usually related to delays in harvests rather than loss of production (Landsberg, 2002). The rates of recovery and detoxification of shellfish depend on the timing of the HABs and are negatively affected if it occurs close to, or during, spawning season (Galimany et al., 2008). As the thermal habitat occupied by A. catenella and the timing of the bloom shift earlier in the year, the likelihood of PSP outbreaks overlapping with commercial shellfish spawning seasons becomes higher. Most of the spawning season for blue mussels and soft-shell clams occurs between May and July, depending on the temperature of the water (Brousseau, 1978; Maloy et al., 2003). This spawning season is within the projected bloom initiation date for A. catenella by 2050, resulting in potential PSP events through most of the shellfish spawning season. Of course, the spawning season for such species might also shift, as the trigger mechanism for spawning relies on temperature thresholds (Brousseau, 1978).
Our findings add to the growing body of information on A. catenella blooms in the Bay of Fundy. There are links between metrics of bloom phenology and surface temperature anomalies such that climate-driven regional warming is driving the date of occurrence of thermal habitats earlier. Moreover, freshwater discharge also impacts the temporal occurrence of the thermal habitats and bloom phenology, and regional precipitation is projected to increase in a warming climate. Based on current rates of SST change, bloom phenology metrics can be expected to shift 1–2 months earlier in the season by mid-century. Such changes in the phenology of A. catenella blooms will need to be incorporated into both monitoring strategies and forecasting models for the region.
Publicly available datasets were analyzed in this study. This data can be found here: (1) Optimum Interpolated Sea Surface Temperature, NOAA National Centers for Environmental Information. https://www.ncdc.noaa.gov/oisst/data-access (2) Daily Cross-Calibrated Multi-Platform Wind, Remote Sensing Systems. http://www.remss.com/support/data-shortcut/ (3) St. John River water level, Environment Canada. https://wateroffice.ec.gc.ca/search/historical_results_e.html?search_type=station_number&station_number=01AP005&start_year=1850&end_year=2020&minimum_years=&gross_drainage_operator=%3E&gross_drainage_area=&effective_drainage_operator=%3E&effective_drainage_area=.
AB and AT performed the analysis and research. AB, AT, and IC wrote the manuscript. All authors contributed to the article and approved the submitted version.
Funding for this work was provided by NASA through grants NNX16AG59G and NNX16AQ94A, by NASA Plankton, Aerosol, Cloud, ocean Ecosystem (PACE) mission, and by NERACOOS.
The authors declare that the research was conducted in the absence of any commercial or financial relationships that could be construed as a potential conflict of interest.
We thank Dr. Jennifer L. Martin (retired, Department of Fisheries and Ocean Canada) for providing the cell counts data of Alexandrium catenella, Dr. Michael Alexander (NOAA ESRL Boulder, CO, United States) for assistance with CMIP5 SST time series, Environmental Canada for providing St. John River water height data, NOAA NCEI for providing OISST data and Remote Sensing Systems (Santa Rosa, CA, United States) for making wind data available. We thank the reviewers for their valuable remarks and comments, which significantly contributed to the quality of this work.
Alexander, M. A., Scott, J. D., Friedland, K. D., Mills, K. E., Nye, J. A., Pershing, A. J., et al. (2018). Projected sea surface temperatures over the 21st century: changes in the mean, variability and extremes for large marine ecosystem regions of Northern Oceans. Elem. Sci. Anthr. 6:9. doi: 10.1525/elementa.191
Alexander, M. A., Shin, S.-I., Scott, J. D., Curchitser, E., and Stock, C. (2020). The response of the Northwest Atlantic Ocean to climate change. J. Clim. 33, 405–428. doi: 10.1175/JCLI-D-19-0117.1
Anderson, D., Glibert, P. M., and Burkholder, J. M. (2002). Harmful algal blooms and eutrophication: nutrient sources, composition, and consequences. Estuaries 25, 704–726. doi: 10.1007/bf02804901
Anderson, D. M. (2009). Approaches to monitoring, control and management of harmful algal blooms (HABs). Ocean Coast. Manag. 52, 342–347. doi: 10.1016/j.ocecoaman.2009.04.006
Anderson, D. M., Chisholm, S. W., and Watras, C. J. (1983). Importance of life-cycle events in the population dynamics of Gonyaulax tamarensis. Mar. Biol. 76, 179–189. doi: 10.1007/bf00392734
Anderson, D. M., Couture, D., Kleindinst, J. L., Keafer, B. A., and McGillicuddy, D. J. Jr. (2014). Understanding interannual, decadal level variability in PSP toxicity in the Gulf of maine: the HAB Index and Alexandrium fundyense cyst abundance. Deep Sea Res. II 103, 264–276. doi: 10.1016/j.dsr2.2013.09.018
Anderson, D. M., and Keafer, B. (1987). An endogenous annual clock in the toxic marine dinoflagellate Gonyaulax tamarensis. Nature 325, 616–617. doi: 10.1038/325616a0
Anderson, D. M., Stock, C., Keafer, B., Nelson, A., McGillicuddy, D., Keller, M., et al. (2005). Alexandrium funsyense cyst dynamics in the Gulf of Maine. Deep Sea Res. II 52, 2522–2542. doi: 10.1016/j.dsr2.2005.06.014
Aretxabaleta, A. L., McGillicuddy, D. J. Jr., Smith, K. W., and Lynch, D. R. (2008). Model simulations of the Bay of Fundy gyre: 1. climatological results. J. Geophys. Res. 113:JC10027. doi: 10.1029/2007/JC004480
Aretxabaleta, A. L., McGillicuddy, D. J. Jr., Smith, K. W., Manning, J. P., and Lynch, D. R. (2009). Model simulations of the Bay of Fundy gyre: 2. hindcasts for 2005-2007 reveal interannual variability in retentiveness. J. Geophys. Res. 114:JC09005. doi: 10.1029/2008JC004948
Babin, M., Cullen, J. J., Roesler, C. S., Donaghay, P. L., Doucette, G. J., Kahru, M., et al. (2005). New approaches and technologies for observing harmful algal blooms. Oceanography 18, 210–227. doi: 10.5670/oceanog.2005.55
Bingham, F. M., Busecke, J., Gordon, A. L., Giulivi, C. F., and Zhijin, L. (2014). The North Atlantic subtropical surface salinity maximum as observed by Aquarius. J. Geophys. Res.: Oceans 119, 7741–7755. doi: 10.1002/2014JC009825
Blasco, D., Levasseur, M., Bonneau, E., Gelinas, R., Packard, T. T., Ciències, I., et al. (2003). Patterns of paralytic shellfish toxicity in the St. Lawrence region in relationship with the abundance and distribution of Alexandrium tamarense. Sci. Mar. 67, 261–278. doi: 10.3989/scimar.2003.67n3261
Bricelj, V. M., and Shumway, S. E. (1998). Paralytic shellfish toxins in bivalve molluscs: occurrence, transfer, kinetics, and biotransformation. Rev. Fish. Sci. 6, 315–383. doi: 10.1080/10641269891314294
Brody, S. R., Lozier, M. S., and Dunne, J. P. (2013). A comparison of methods to determine phytoplankton bloom initiation. J. Geophys. Res. 118, 2345–2357. doi: 10.1002/jgre/20167
Brosnahan, M. L., Fischer, A. D., Lopez, C. B., Moore, S. K., and Anderson, D. M. (2020). Cyst-forming dinoflagellates in a warming climate. Harmful Algae 91:101728. doi: 10.1016/j.hal.2019.101728
Brosnahan, M. L., Ralston, D. K., Fischer, A. D., Solow, A. R., and Anderson, D. M. (2017). Bloom termination of the toxic dinoflagellate Alexandrium catenella: vertical migration behavior, sediment infiltration, and benthic cyst yield. Limnol. Oceanogr. 62, 2829–2849. doi: 10.1002/lno.10664
Brousseau, D. J. (1978). Spawning cycle, fecundity, and recruitment in a population of soft-shell clam, Mya arenaria, from Cape Ann, Massachusetts. Fish. Bull. 76, 155–166.
Capotondi, A., Alexander, M. A., Bond, N. A., Curchitser, E. N., and Scott, J. D. (2012). Enhanced upper ocean stratification with climate change in the CMIP3 models. J. Geophys. Res. 117:JC04031. doi: 10.1029/2011JC007409
Cheng, W., Chiang, J. C. H., and Zhang, D. (2013). Atlantic meridional overturning circulation (AMOC) in CMIP5 models: RCP and historical simulations. J. Clim. 26, 7187–7197. doi: 10.1175/JCLI-D-12-00496.1
Devred, E., Martin, J., Sathyendranath, S., Stuart, V., Horne, E., Platt, T., et al. (2018). Development of a conceptual warning system for toxic levels of Alexandrium fundyense in the Bay of Fundy based on remote sensing data. Remote Sens. Environ. 211, 413–424. doi: 10.1016/j.rse.2018.04.022
Díaz, P. A., Molinet, C., Seguel, M., Díaz, M., Labra, G., and Figuerosa, R. I. (2014). Coupling planktonic and benthic shifts during a bloom of Alexandrium catenella in southern Chile: implications for bloom dynamics and recurrence. Harmful Algae 40, 9–22. doi: 10.1016/j.hal.2014.10.001
Etheridge, S. M., and Roesler, C. S. (2005). Effects of temperature, irradiance, and salinity on photosynthesis, growth rates, total toxicity, and toxin composition for Alexandrium fundyense isolates from the Gulf of Maine and Bay of Fundy. Deep Sea Res. II 52, 2491–2500. doi: 10.1016/j.dsr2.2005.06.026
Fauchot, J., Saucier, F. J., Levasseur, M., Roy, S., and Zakardjian, B. (2008). Wind-driven river plume dynamics and toxic Alexandrium tamarense blooms in the St. Lawrence estuary (Canada): a modeling study. Harmful Algae 7, 214–227. doi: 10.1016/j.hal.2007.08.002
Forsyth, J. S. T., Andres, M., and Gawarkiewicz, G. G. (2015). Recent accelerated warming of the continental shelf off New Jersey: observations from the CMV Oleander expendable bathythermograph line. J. Geophys. Res.: Oceans 120, 2370–2384. doi: 10.1002/2014JC010516
Galimany, E., Sunila, I., Hégaret, H., Ramon, M., and Wikfors, G. H. (2008). Experimental exposure of the blue mussel (Mytilus edilus, L.) to the toxic dinoflagellate Alexandrium fundyense: histopathology, immune responses, and recovery. Harmful Algae 7, 702–708. doi: 10.1016/j.hal.2008.02.006
Glibert, P. M., Allen, J. I., Artioli, Y., Beusen, A., Bouwman, L., Harle, J., et al. (2014). Vulnerability of coastal ecosystems to changes in harmful algal bloom distribution in response to climate change projections based on model analysis. Glob. Chang. Biol. 20, 3845–3858. doi: 10.1111/gcb.12662
Gobler, C. J. (2020). Climate change and harmful algal blooms: insights and perspective. Harmful Algae 91:101731. doi: 10.1016/j.hal.2019.101731
Gobler, C. J., Doherty, O. M., Griffith, A. W., Hattenrath-Lehmann, T. K., Kang, Y., and Litaker, W. (2017). Ocean warming since 1982 has expanded the niche of toxic algal blooms in the North Atlantic and North Pacific oceans. Prod. Nat. Acad. Sci. U.S.A. 114, 4975–4980. doi: 10.1073/pnas.1619575114
Hallegraeff, G. M. (2010). Ocean climate change, phytoplankton community responses, and harmful algal blooms: a formidable predictive challenge. J. Phycol. 46, 220–235. doi: 10.1111/j.1529-8817.2010.00815.x
Han, M. S., Jeon, J. K., and Kim, Y. O. (1992). Occurrence of dinoflagellate Alexandrium tamarense, a causative organism of paralytic shellfish poisoning in Chinhae Bay, Korea. J. Plankton Res. 14, 1581–1592. doi: 10.1093/plankt/14.11.1581
Hattenrath, T. K., Anderson, D. M., and Gobler, C. J. (2010). The influence of anthropogenic nitrogen loading and meteorological conditions on the dynamics and toxicity of Alexandrium fundyense blooms in New York (USA) estuary. Harmful Algae 9, 402–412. doi: 10.1016/j.hal.2010.02.003
He, R., McGillicuddy, D. J. Jr., Keafer, B. A., and Anderson, D. M. (2008). Historic 2005 toxic bloom of Alexandrium fundyense in the western Gulf of Maine: 2. Coupled biophysical numerical modeling. J. Geophys. Res. Oceans 113:JC004602. doi: 10.1029/2007JC004602
Hégaret, H., Wikfors, G. H., and Shumway, S. E. (2007). Diverse feeding responses of five species of bivalve mollusc when exposed to three species of harmful algae. J. Shellf. Res. 26, 549–559. doi: 10.2983/0730-8000(2007)26[549:dfrofs]2.0.co;2
Hobday, A. J., Oliver, E. C. J., Gupta, A. S., Benthuysen, J. A., Burrows, M. T., Donat, M. G., et al. (2018). Categorizing and naming marine heatwaves. Oceanography 31, 162–173.
Huntington, T. G., and Billmire, M. (2014). Trends in precipitation, runoff, and evapotranspiration for rivers draining to the Gulf of Maine in the United States. J. Hydrometeorol. 15, 726–743. doi: 10.1175/JHM-D-13-018.1
Kavanaugh, M. T., Rheuban, J. E., Luis, K. M. A., and Doney, S. C. (2017). Thirty-three years of ocean benthic warming along the U.S. Northeast continental shelf and slope: patterns, drivers, and ecological consequences. J. Geophys. Res. Oceans 122, 9399–9414. doi: 10.1002/2017JC012953
Keafer, B. A., Churchill, J. A., Geyer, W. R., Signell, R. P., Hurst, J. W., Bean, L. L., et al. (2004). “Detection of Alexandrium fundyense bloom initiation and transport in the western Gulf of Maine, USA, using mussel bags (Mytilus edulis) on offshore hydrographic moorings,” in Harmful Algae 2002, eds K. A. Steidinger, J. H. Landsberg, C. R. Thomas, and G. A. Vargo (St. Petersburg, FL: Florida Institute of Oceanography), 285–287.
Klais, R., Tamminen, T., Kremp, A., Spilling, K., and Olli, K. (2011). Decadal-scale changes of dinoflagellates and diatoms in the anomalous Baltic Sea spring bloom. PLoS One 6:e21567. doi: 10.1371/journal.pone.0021567
Klinger, B. A., Huang, B., Kirtman, B., Schopf, P., and Wang, J. (2006). Monthly climatologies of oceanic friction velocity cubed. J. Clim. 19, 5700–5708. doi: 10.1175/jcli3863.1
Landsberg, J. H. (2002). The effects of harmful algal blooms on aquatic organisms. Rev. Fish. Sci. 10, 113–290. doi: 10.1080/20026491051695
Lilly, E. L., Halanych, K. M., and Anderson, D. M. (2007). Species boundaries and global biogeography of the Alexandrium tamarense complex (Dinophyceae). J. Phycol. 43, 1329–1338. doi: 10.1111/j.1529-8817.2007.00420.x
Maloy, A. P., Barber, B. J., and Rawson, P. D. (2003). Gametogenesis in a sympatric population of blue mussels, Mytilus edulis and Mytilus trossulus, from Cobscook Bay (USA). J. Shellf. Res. 22, 119–123.
Mardones, J. I., Bolch, C., Guzmán, L., Paredes, J., Varela, D., and Hallegraeff, G. M. (2016). Role of resting cysts in Chilean Alexandrium catenella dinoflagellate bloooms revisited. Harmful Algae 55, 238–249. doi: 10.1016/j.hal.2016.03.020
Martin, J. L., and LeGresley, M. M. (2014). Phytoplankton monitoring in the Western Isles region of the Bay of Fundy during 2003-2006. Can. Tech. Rep. Fish. Aquat. Sci. 3100 5, 1–190.
Martin, J. L., LeGresley, M. M., and Gidney, M. E. (2014a). Phytoplankton monitoring in the Western Isles region of the Bay of Fundy during 2007-2013. Can. Tech. Rep. Fish. Aquat. Sci. 3105 5, 1–262.
Martin, J. L., LeGresley, M. M., and Hanke, A. R. (2014b). Thirty years - Alexandrium fundyense cyst, bloom dynamics and shellfish toxicity in the Bay of Fundy, eastern Canada. Deep Sea Res. II 103, 27–39. doi: 10.1016/j.dsr2.2013.08.004
Martin, J. L., LeGresley, M. M., and Li, W. K. W. (2014c). Phytoplankton, picophytoplankton, nanophytoplankton and bacterioplankton monitoring in the Western Isles region of the Bay of Fundy during 2001-2002. Can. Tech. Rep. Fish. Aquat. Sci. 3075 7, 1–108.
Martin, J. L., LeGresley, M. M., Haya, K., Sephton, D. H., Burridge, L. E., Page, P. H., et al. (2006a). Salmon mortalities associated with a bloom of Alexandrium fundyense in 2003 in the Bay of Fundy, and subsequent early warning approaches for industry. Afr. J. Mar. Sci. 28, 431–434. doi: 10.2989/18142320609504192
Martin, J. L., LeGresley, M. M., and Strain, P. M. (2006b). Plankton monitoring in the Western Isles region of the Bay of Fundy during 1999-2000. Can. Tech. Rep. Fish. Aquat. Sci. 2629 4, 1–88.
Martin, J. L., LeGresley, M. M., and Strain, P. M. (2001). Phytoplankton monitoring in the Western Isles region of the Bay of Fundy during 1997-98. Can. Tech. Rep. Fish. Aquat. Sci. 2349 4, 1–85.
Martin, J. L., LeGresley, M. M., Strain, P. M., and Clement, P. (1999). Phytoplankton monitoring in the southwest Bay of Fundy during 1993-96. Can. Tech. Rep. Fish. Aquat. Sci. 2265 5, 1–132.
Martin, J. L., Page, F. H., Hanke, A., Strain, P. M., and LeGresley, M. M. (2005). Alexandrium fundyense vertical distribution patterns during 1982, 2001 and 2002 in the offshore Bay of Fundy, eastern Canada. Deep Sea Res. II 52, 2569–2592. doi: 10.1016/j.dsr2.2005.06.010
Martin, J. L., Page, F. H., LeGresle, M. M., and White, J. (2010). “Twenty years - Alexandrium fundyense bloom dynamics in relation to total phytoplankton and shellfish toxicity in the Bay of Fundy,” in Harmful Algae 2008, eds K.-C. Ho, M. J. Zhou, and Y. Z. Qi (Hong Kong: Environmental Publication House), 53–56.
Martin, J. L., and Richard, D. (1996). “Shellfish toxicity from the Bay of Fundy, eastern Canada, 50 years in retrospect,” in Harmful and Toxic Algal Blooms, eds T. Yasumoto, Y. Oshima, and Y. Fukuyo (Paris: Intergovernmental Oceanographic Commission of UNESCO), 3–6.
Martin, J. L., Wildish, D. J., LeGresley, M. M., and Ringuette, M. M. (1995). Phytoplankton monitoring in the southwestern Bay of Fundy during 1990-92. Can. Manuscr. Rep. Fish. Aquat. Sci. 2277 3, 1–154.
Matrai, P., Thompson, B., and Keller, M. (2005). Circannual excystment of resting cysts of Alexandrium spp. from eastern Gulf of Maine populations. Deep Sea Res. II 52, 2560–2568. doi: 10.1016/j.dsr2.2005.06.013
McGillicuddy, D. J. Jr., Anderson, D. M., Lynch, D. R., and Townsend, D. W. (2005). Mechanisms regulating large-scale seasonal fluctuations in Alexandrium fundyense populations in the Gulf of Maine: results from a physical-biological model. Deep Sea Res. II 52, 2698–2714. doi: 10.1016/j.dsr2.2005.06.021
McGillicuddy, D. J. Jr., Brosnahan, M. L., Couture, D. A., He, R., Keafer, B. A., Manning, J. P., et al. (2014). A red tide of Alexandrium fundyense in the Gulf of Maine. Deep Sea Res. II 103, 174–184. doi: 10.1016/j.dsr2.2013.05.011
McGillicuddy, D. J. Jr., Townsend, D. W., He, R., Keafer, B. A., Kleindinst, J. L., Li, Y., et al. (2011). Suppression of the 2010 Alexandrium fundyense bloom by changes in physical, biological, and chemical properties of the Gulf of Maine. Limnol. Oceanogr. 56, 2411–2426. doi: 10.4319/lo.2011.56.6.2411
Mills, K. E., Pershing, A. J., Sheehan, T. F., and Mountain, D. (2013). Climate and ecosystem linkages explain widespread declines in North American Atlantic salmon populations. Glob. Chang. Biol. 19, 3046–3061. doi: 10.1111/gcb.12298
Moore, S. K., Mantua, N. J., Hickey, B. M., and Trainer, V. L. (2009). Recent trends in paralytic shellfish toxins in Puget Sound, relationships to climate, and capacity for prediction of toxic events. Harmful Algae 8, 463–477. doi: 10.1016/j.hal.2008.10.003
Moore, S. K., Trainer, V. L., Mantua, N. J., Parker, M. S., Laws, E. A., Backer, L. C., et al. (2008). Impacts of climate variability and future climate change on harmful algal blooms and human health. Environ. Health 7(Suppl. 2):S4. doi: 10.1186/1476-069X-7-S2-S4
Nair, A., Thomas, A. C., and Borsuk, M. E. (2013). Interannual variability in the timing of New England shellfish toxicity and relationships to environmental forcing. Sci. Total Environ. 447, 255–266. doi: 10.1016/j.scitotenv.2013.01.023
Ning, L., Riddle, E. E., and Bradley, R. S. (2015). Projected changes in climate extremes over the Northeastern United States. J. Clim. 28, 3289–3310. doi: 10.1175/JCLI-D-14-00150.s1
Page, F. H., Martin, J. L., Hanke, A., and LeGresley, M. M. (2006). Temporal and spatial variability in the characteristics of Alexandrium fundyense blooms in the coastal zone of the Bay of Fundy, eastern Canada. Afr. J. Mar. Sci. 28, 203–207. doi: 10.2989/18142320609504148
Pershing, A. J., Alexander, M. A., Hernandez, C. M., Kerr, L. A., Le Bris, A., Mills, K. E., et al. (2015). Slow adaptation in the face of rapid warming leads to collapse of the Gulf of Maine cod fishery. Science 350, 809–812. doi: 10.1126/science.aac9819
Pershing, A. J., Record, N. R., Franklin, B. S., Kennedy, B. T., McClenachan, L., Mills, K. E., et al. (2019). Challenges to natural and human communities from surprising ocean temperatures. Proc. Natl. Acad. Sci. U.S.A. 116, 18378–18383. doi: 10.1073/pnas.1901084116
Scannell, H. A., Pershing, A. J., Alexander, M. A., Thomas, A. C., and Mills, K. E. (2016). Frequency of marine heatwaves in the North Atlantic and North Pacific since 1950. Geophys. Res. Lett. 43, 2069–2076. doi: 10.1002/2015GL067308
Siegel, D., Doney, D., and Yoder, J. (2002). The North Atlantic spring phytoplankton bloom and Sverdrup’s critical depth hypothesis. Science 296, 730–733. doi: 10.1126/science.1069174
Smith, P. C., Pettigrew, N. R., Yeats, P., Townsend, D. W., and Han, G. (2012). Regime shift in the Gulf of Maine. Am. Fish. Soc. Symp. 79, 185–203.
Smith, S. D. (1988). Coefficients for sea surface wind stress, heat flux, and wind profiles as a function of wind speed and temperature. J. Geophys. Res. 93, 15467–15472. doi: 10.1029/jc093ic12p15467
Stock, C. A., McGillicuddy, D. J. Jr., Solow, A. R., and Anderson, D. M. (2005). Evaluating hypotheses of the initiation and development of Alexandrium fundyense blooms in the western Gulf of Maine using a coupled physical-biological model. Deep Sea Res. II 52, 2715–2744. doi: 10.1016/j.dsr2.2005.05.022
Therriault, J. C., Painchaud, J., and Levasseur, M. (1985). “Factors controlling the occurrence of Protogonyaulax tamarensis and shellfish toxicity in the St. Lawrence Estuary: freshwater runoff and the stability of the water column,” in Toxic Dinoflagellates, eds D. M. Anderson, A. W. White, and D. G. Baden (New York, NY: Elsevier Science), 141–146.
Thomas, A. C., Pershing, A. J., Friedland, K. D., Nye, J. A., Mills, K. E., Alexander, M. A., et al. (2017). Seasonal trends and phenology shifts in sea surface temperature on the North American northeastern continental shelf. Elem. Sci. Anth. 5:48. doi: 10.1525/elementa.240
Thomas, A. C., Weatherbee, R., Xue, H., and Liu, G. (2010). Interannual variability of shellfish toxicity in the Gulf of Maine: time and space patterns and links to environmental variability. Harmful Algae 9, 458–480. doi: 10.1016/j.hal.2010.03.002
Tobin, E. D., Wallace, C. L., Crumpton, C., Johnson, G., and Eckert, G. L. (2019). Environmental drivers of paralytic shellfish toxin producing Alexandrium catenella blooms in a fjord system of northern Southeast Alaska. Harmful Algae 88:101659. doi: 10.1016/j.hal.2019.101659
Townsend, D. W., Pettigrew, N. R., and Thomas, A. C. (2001). Offshore blooms of the red tide dinoflagellate Alexandrium sp., in the Gulf of Maine. Cont. Shelf Res. 21, 347–369. doi: 10.1016/s0278-4343(00)00093-5
Townsend, D. W., Bennett, S. L., and Thomas, M. A. (2005a). Diel vertical distributions of the red tide dinoflagellate Alexandrium fundyense in the Gulf of Maine. Deep Sea Res. II 52, 2593–2602. doi: 10.1016/j.dsr2.2005.06.027
Townsend, D. W., Pettigrew, N. R., and Thomas, A. C. (2005b). On the nature of Alexandrium fundyense blooms in the Gulf of Maine. Deep Sea Res. II 52, 2603–2630. doi: 10.1016/j.dsr2.2005.06.028
Townsend, D. W., Rebuck, N. D., Thomas, M. A., Karp-Boss, L., and Gettings, R. M. (2010). A changing nutrient regime in the Gulf of Maine. Cont. Shelf Res. 30, 820–832. doi: 10.1016/j.csr.2010.01.019
Keywords: Alexandrium catenella, harmful algal blooms, thermal habitat, freshwater discharge, stratification, climate change, phenology shifts
Citation: Bucci AF, Thomas AC and Cetinić I (2020) Interannual Variability in the Thermal Habitat of Alexandrium catenella in the Bay of Fundy and the Implications of Climate Change. Front. Mar. Sci. 7:587990. doi: 10.3389/fmars.2020.587990
Received: 27 July 2020; Accepted: 12 November 2020;
Published: 07 December 2020.
Edited by:
Susana Agusti, King Abdullah University of Science and Technology, Saudi ArabiaReviewed by:
Stephanie Kay Moore, Northwest Fisheries Science Center, National Oceanic and Atmospheric Administration (NOAA), United StatesCopyright © 2020 Bucci, Thomas and Cetinić. This is an open-access article distributed under the terms of the Creative Commons Attribution License (CC BY). The use, distribution or reproduction in other forums is permitted, provided the original author(s) and the copyright owner(s) are credited and that the original publication in this journal is cited, in accordance with accepted academic practice. No use, distribution or reproduction is permitted which does not comply with these terms.
*Correspondence: Andre F. Bucci, YW5kcmUuYnVjY2lAbWFpbmUuZWR1
Disclaimer: All claims expressed in this article are solely those of the authors and do not necessarily represent those of their affiliated organizations, or those of the publisher, the editors and the reviewers. Any product that may be evaluated in this article or claim that may be made by its manufacturer is not guaranteed or endorsed by the publisher.
Research integrity at Frontiers
Learn more about the work of our research integrity team to safeguard the quality of each article we publish.