 Emi Yati
 Shoshiro Minobe
 Nathan Mantua
 Shin-ichi Ito
 Emanuele Di Lorenzo
- 1Department of Natural History Sciences, Graduate School of Science, Hokkaido University, Sapporo, Japan
- 2Remote Sensing Application Center, Indonesian National Institute of Aeronautics and Space, Jakarta, Indonesia
- 3Department of Earth and Planetary Sciences, Faculty of Science, Hokkaido University, Sapporo, Japan
- 4Fish Ecology Division, Southwest Fisheries Science Center, National Marine Fisheries Service, National Oceanographic and Atmospheric Administration, Santa Cruz, CA, United States
- 5Atmosphere and Ocean Research Institute, University of Tokyo, Kashiwa, Japan
- 6School of Earth and Atmospheric Sciences, Georgia Institute of Technology, Atlanta, GA, United States
In order to understand how North Pacific (NP) marine ecosystems have varied, 120 marine biological time series for both the western (29 time series) and eastern (91 time series) NP were analyzed with a Principal Component Analysis (PCA) for the period 1965–2006. This is the first attempt to conduct a multivariate analysis for a large number of marine biological data in the western and eastern NP combined. We used Monte-Carlo simulation to evaluate confidence levels of correlations and explained variance ratio of PCA modes while accounting for auto-correlation within the analyzed time series. All first mode principal components (PC1s), which are the time coefficients of the first PCA modes, calculated for the data in the whole, western, and eastern NP exhibit a long-term trend. The PC1s were associated with an overall increase of Alaskan and Japanese/Russian salmon, and decreases of groundfish across the basin. This mode was closely related to the warming of sea-surface temperature over the NP and over the global oceans, thereby suggesting that the strongest mode of the NP marine ecosystem was already influenced by global warming. The eastern NP PC2, characterized by multi-decadal variability, was correlated positively with salmon and negatively with groundfish. On the other hand, the western NP PC2 exhibited slightly shorter timescale interdecadal variability than the eastern NP PC2 and was negatively correlated with zooplankton and two small pelagic fish time series around Japan. The eastern NP PC2 was most strongly related to the Pacific (inter-)Decadal Oscillation index, while the western NP PC2 was most closely related to the North Pacific Gyre Oscillation index. Consequently, the present analysis provides a new and unified view of climate change and marine ecosystem variations across the western and eastern NP. In particular, it is suggested that global warming has already substantially influenced the NP marine ecosystem, and that groundfish may suffer more than pelagic fish in response to future global warming.
Introduction
Marine ecosystems are influenced by physical climate variability and change (e.g., Cushing, 1982; Brander, 2007; Bindoff et al., 2019). The effects of physical climate variability on marine species in the North Pacific (NP) have been studied in the last few decades. Earlier studies focused their attention on target marine species such as salmon (e.g., Ebbesmeyer et al., 1991; Beamish and Bouillon, 1993; Francis and Hare, 1994; Mantua et al., 1997; Beamish et al., 1999; Hare et al., 1999), sardine (Kawasaki and Omori, 1995; Noto and Yasuda, 1999; Yasuda et al., 1999), and groundfish (Hoff, 2006). An important finding of these studies was that large-scale decadal variability of climate characterized by Aleutian Low strength changes and associated sea-surface temperature (SST) anomalies, which are known as the Pacific (inter-)Decadal Oscillation (PDO; Minobe, 1997; Mantua et al., 1997), strongly influenced a wide range of marine species in much of the 20th Century (e.g., Mantua et al., 1997; Yasuda et al., 1999; Hare and Mantua, 2000; Chavez et al., 2003; Litzow and Mueter, 2014).
In particular, as evidence of climate influence on the marine ecosystem, step-like shifts commonly occurring in both the marine ecosystem and physical climate attracted attention (e.g., Ebbesmeyer et al., 1991; Beamish and Bouillon, 1993; Francis and Hare, 1994; Mantua et al., 1997), and such a shift is often referred as a climate and ecosystem regime shift. A regime shift for physical climate is defined as a transition from one climatic state to another within a period substantially shorter than the lengths of the individual epochs of each climate state (Minobe, 1997). A marine ecosystem regime shift can also be defined in the same way as the climatic regime shift, i.e., a rapid transition from one state to another (Möllmann and Diekmann, 2012), but sometimes marine ecosystem regimes mean different states of dominant species (e.g., Lluch-Belda et al., 1989). In this article, we use the marine ecosystem regime shift in the former meaning, i.e., a rapid step-like change that persists for a length of time that far exceeds that of the transition.
In order to understand marine ecosystem variability and change in a more holistic way than analyses of selected species, a useful approach is an analysis of a large number of marine biological time series, typically more than several tens, by using a multivariate analysis method. We call this type of analysis a Large-number Multivariate Analysis (LMA). The pioneering first study of LMA was conducted by Hare and Mantua (2000), who analyzed 69 marine species time series data in the eastern NP, from California waters to the Bering Sea, combined with 31 physical climate indices from 1965 to 1997. They applied a Principal Component Analysis (PCA), which is also known as an Empirical Orthogonal Function analysis. They reported that marine ecosystem regime shifts occurred in 1976/77 and 1988/89 over the eastern NP. A decade later, by using 64 eastern NP biological time series with several climate indices in 1965–2008, Litzow and Mueter (2014) also reported shifts in marine biology in the 1976/77 but they did not find a biological shift in the late 1980s. Rather, they emphasized that the time series of the first biological PCA mode, referred to as PC1, was characterized by a gradual change and not a step-like shift. For the western side of basin, Tian et al. (2006) analyzed 58 Japanese fish catch time series from the Sea of Japan in 1958–2003, and Ma et al. (2019) recently analyzed 147 catch time series in the Yellow and East China Seas for 1965–2008. Tian et al. (2006) reported that the biological PC1 is highly correlated with the PDO index (Mantua et al., 1997) and the Arctic Oscillation (AO) index (Thompson and Wallace, 1998), while Ma et al. (2019) found strong correlations between biological PCs with indices for local physical conditions but not with large scale climate indices. LMA was also used for the northeastern North Atlantic by Brunel and Boucher (2007), who reported that the first mode of 40 fish recruitment time series is characterized by the long-term change probably in association with global warming.
It should be noted that previous LMA studies in the NP were limited either on the eastern NP only or marginal seas in the western NP only. This hinders a unified understanding of the marine ecosystem variability and change over the whole NP. It is already known that climate variability causes synchronized changes in marine ecosystems in both the eastern and western NP for sardine and anchovy (Lluch-Belda et al., 1992; Kawasaki and Omori, 1995; Yasuda et al., 1999; Chavez et al., 2003) and for salmon (e.g., Beamish and Bouillon, 1993). These results underline the importance of whole basin analyses.
The purpose of this study is to identify the dominant modes of marine ecosystem variations in the last half century both in the western and eastern NP basin and their relationships to basin-scale physical climate variability and change. To this end, 120 marine species time series, consisting of 91 eastern NP and 29 western NP time series are analyzed. The data consist of biological time series for zooplankton, invertebrates, small-pelagic fish, groundfish and salmon. This is the first LMA study analyzing data from both the western and eastern NP. We applied PCA on biological data and used correlation analysis to understand the relationships between marine ecosystem and physical climate variations with a rigorous estimation of the corresponding confidence level. In addition to indices for climate modes such as the PDO and North Pacific Gyre Oscillation (NPGO) (Di Lorenzo et al., 2008), we analyze the NP and global mean SST time series, which were not examined by the previous NP LMA studies, in order to evaluate the possible relationships between marine ecosystem changes and global warming.
Data and Methods
Data
We used 120 annually sampled marine biological time series (Supplementary Table 1) consisting of 29 western NP time series from Japan and Russia, and 91eastern NP time series over areas including the Bering Sea, Gulf of Alaska, and the west coast of the United States of America and Canada. These consist of 54 groundfish recruitment, 13 small-pelagic fish recruitment, 34 salmon abundance, eight invertebrate recruitment, and eleven zooplankton biomass time series. Some of our eastern NP data are overlapped with those used by previous studies; 48% of groundfish, 80% of small-pelagic, 13% of invertebrate, and 25% of salmon were also used by Litzow and Mueter (2014). On the other hand, western NP data analyzed in this study, which mainly come from analyses of Japan Fisheries Research and Education Agency (Japan Fisheries Agency, and Fisheries Research Agency, 2015), have not been used for previous LMA studies. We set our analysis period from 1965 to 2006 based on a criteria of available data ratio larger than 50%, following Hare and Mantua (2000). This is 10-years longer than the analysis period of Hare and Mantua (2000), but similar to that of Litzow and Mueter (2014). Some of our results will be shown by map-format figures and the correspondences between the spatial positions of the biological time series on the map and index number are summarized in Figure 1, along with abbreviations of time series in Supplementary Table 1.
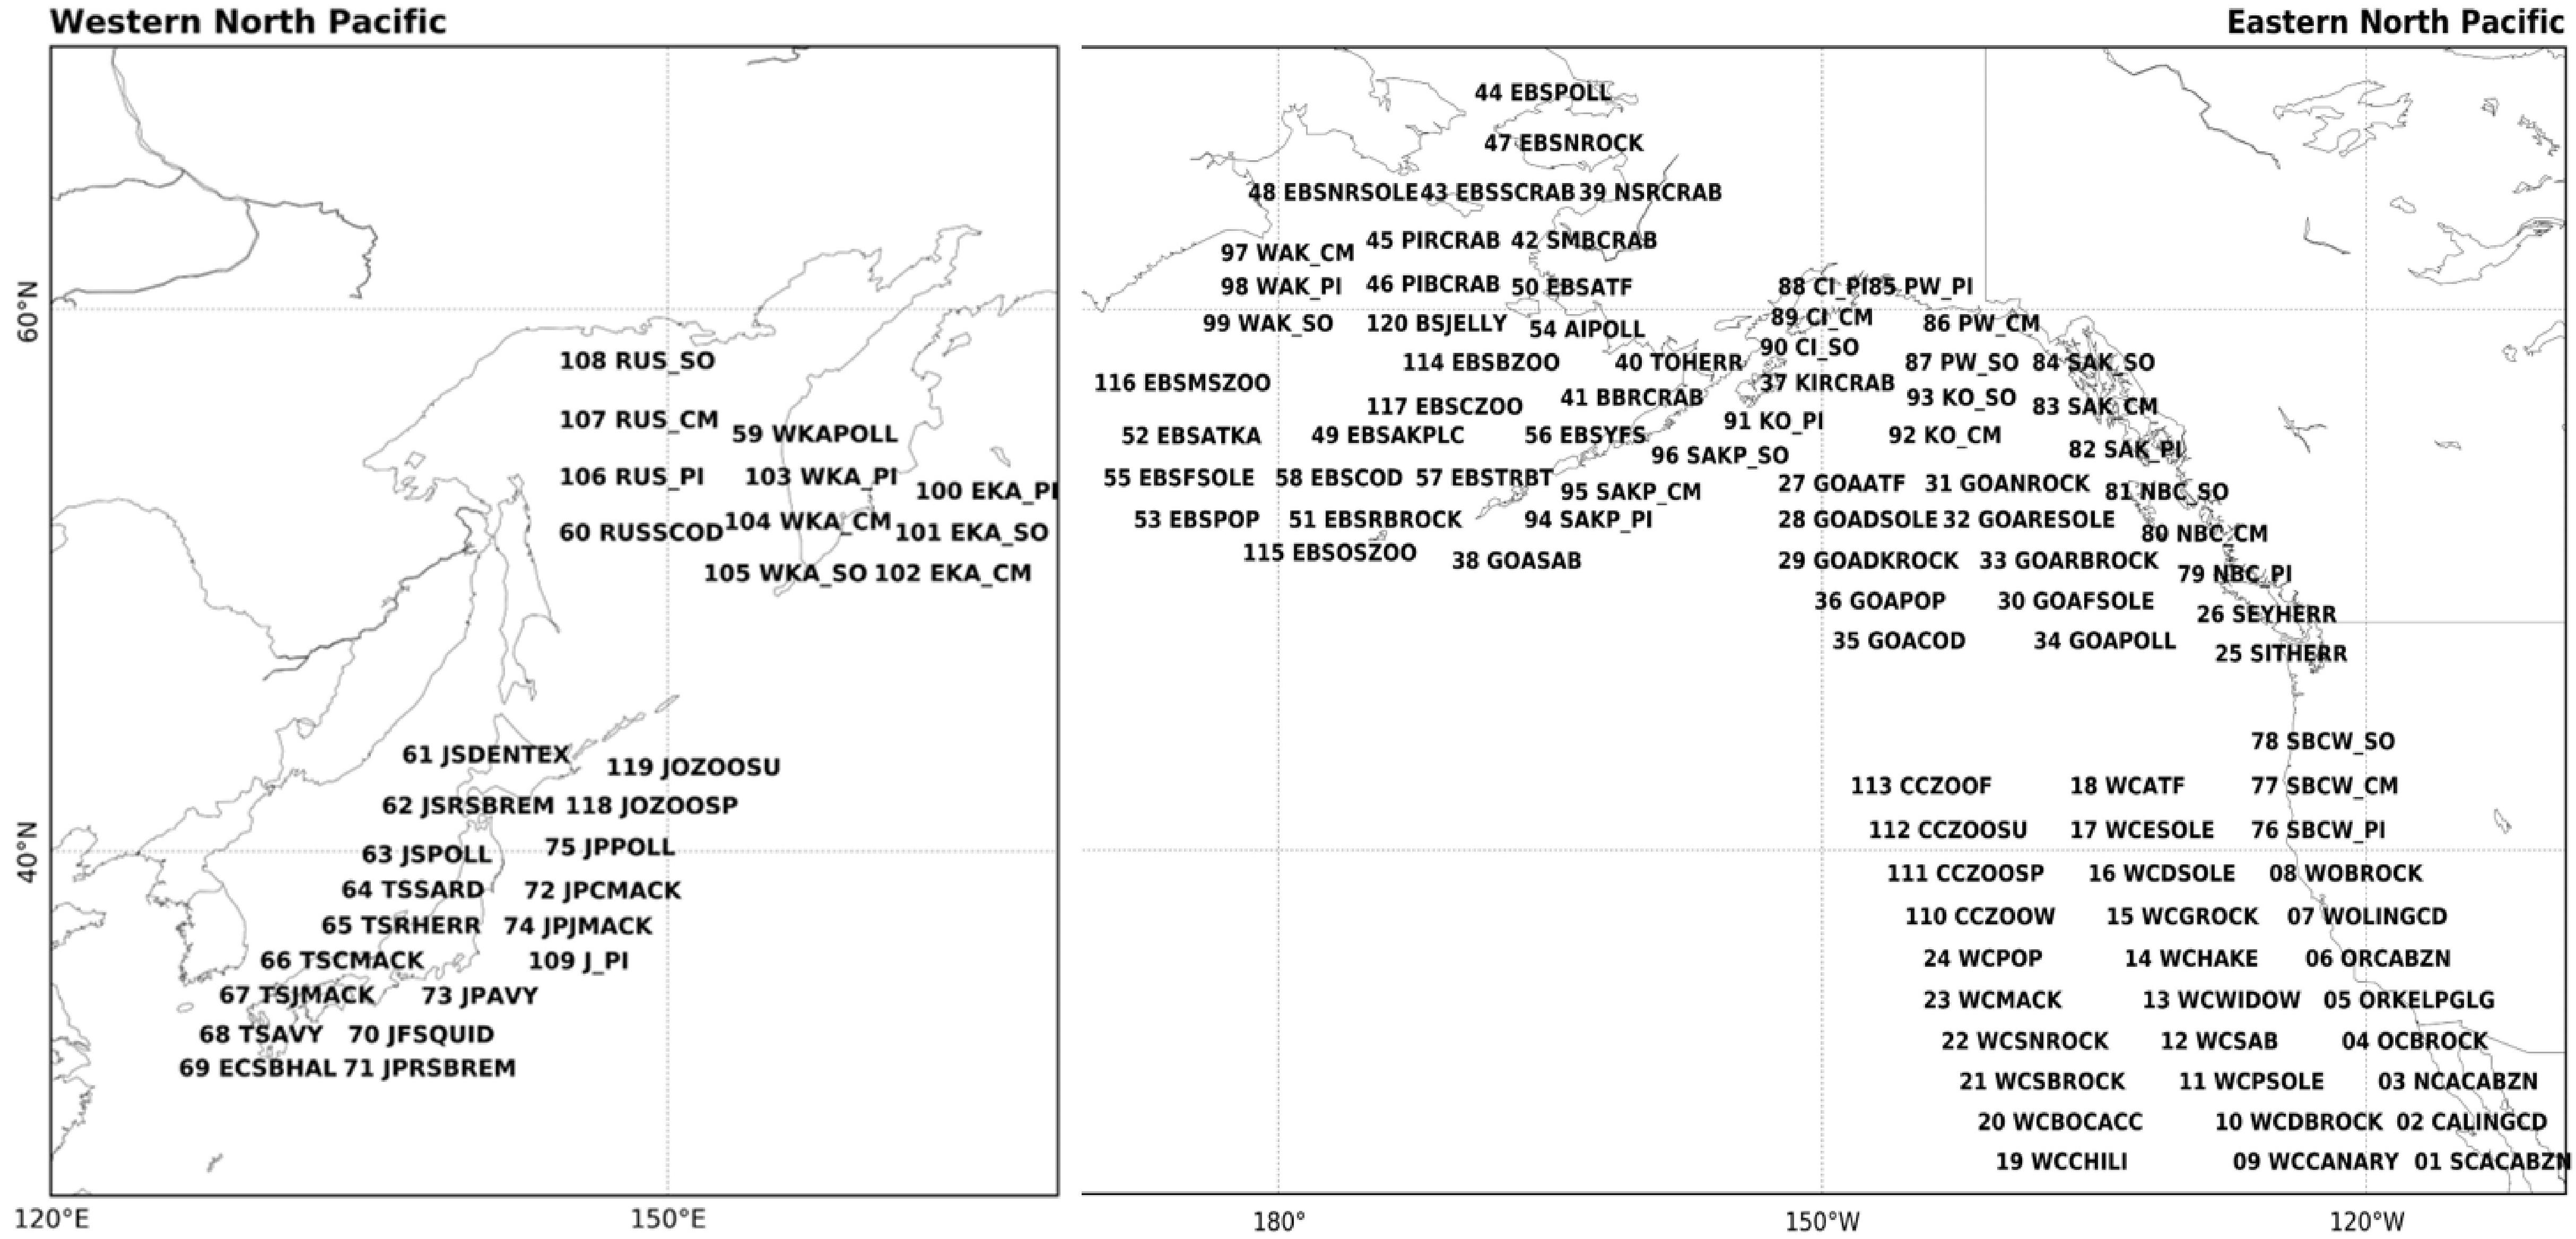
Figure 1. Identification number and alphabetic abbreviations for the 120 marine species data. See Supplementary Table 1 for a definition of each abbreviation. The locations of the species on the map are approximate.
In order to understand relationships between variations in marine biology and climate, we analyzed seven annually averaged physical climate indices: 1. global-mean sea-surface temperature (G-SST), 2. NP-mean SST (NP-SST), 3. PDO index, 4. NPGO index, 5. the multivariate El Niño-Southern Oscillation Index (MEI) (Wolter and Timlin, 2011), 6. The North Pacific Index (NPI) (Trenberth and Hurrell, 1994), and 7. AO index (Table 1). The NPI represents the strength of the Aleutian Low, a large-scale low-pressure over the NP in winter, and an Aleutian Low is stronger than usual when the NPI anomaly is negative. The NPI is closely related to the PDO index (Mantua et al., 1997; Minobe, 1997). We use the Centennial in situ Observation-Based Estimates of the Variability of SST and Marine Meteorological Variables (COBE) version 2 (Hirahara et al., 2014) to calculate the G-SST and NP-SST indices.
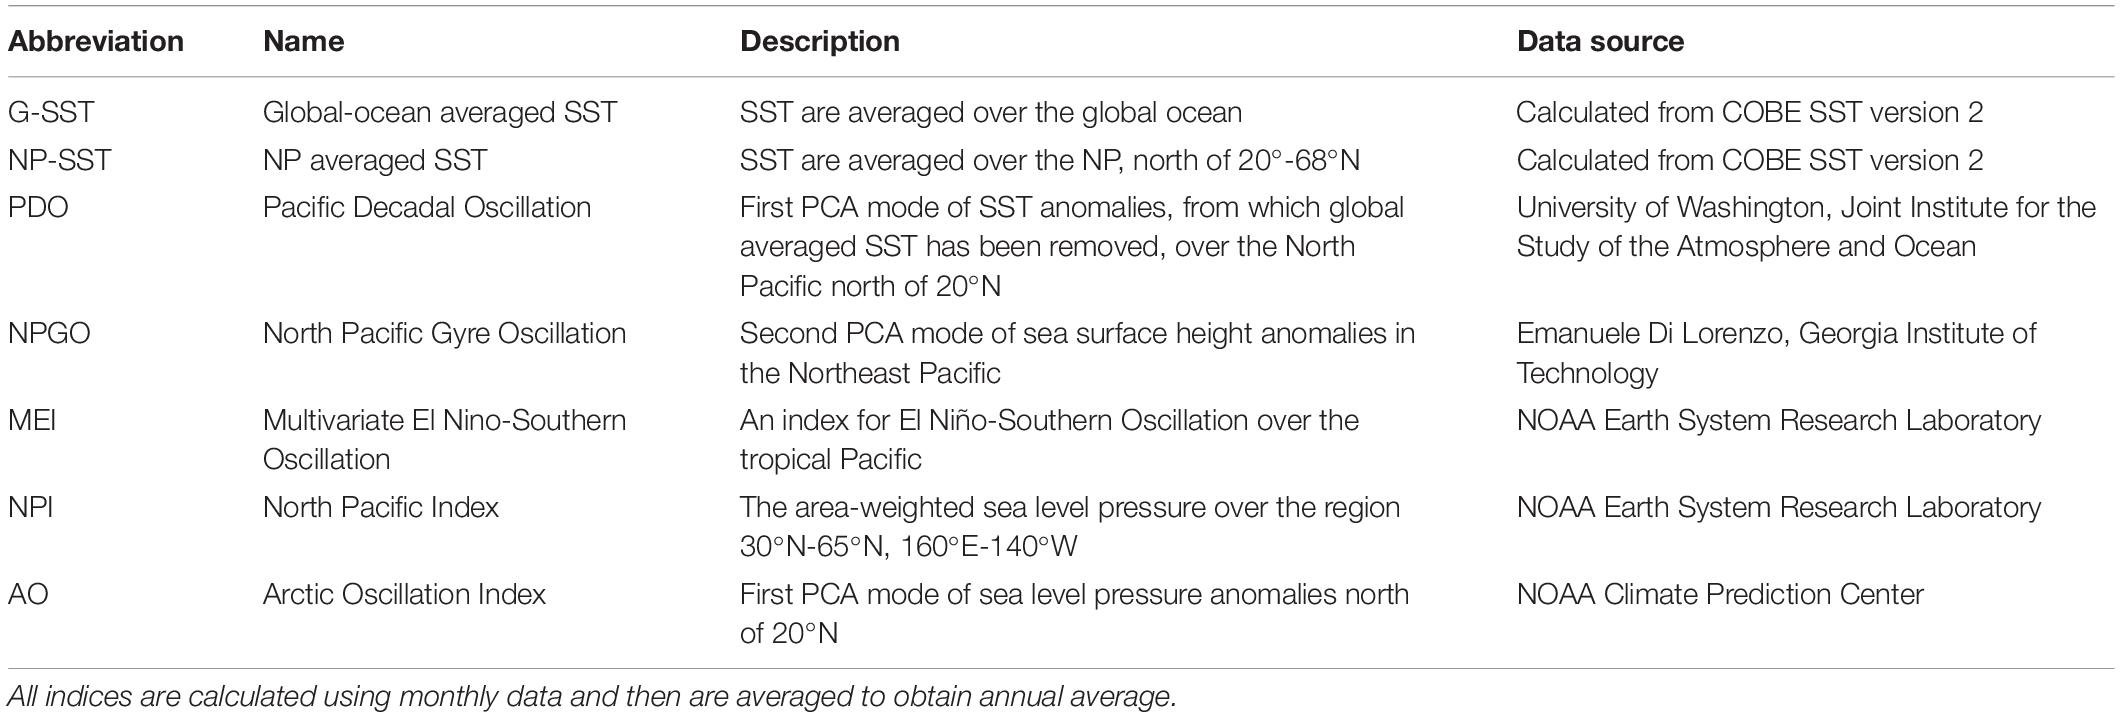
Table 1. Seven climate indices.
Methods
We employed PCA to the marine biological time series, and calculated PCA modes using the biological time series in the whole, western, and eastern NP, separately. Before calculating the PCA modes, marine biological time series were normalized by their respective standard deviations and removing the means. Thus, reflecting the larger number of time series in the eastern NP than in the western NP, the former more strongly contributes to the whole NP PCA than the latter does. By this reason, we mainly show western and eastern NP PCA modes rather than the whole NP modes. A covariance between two biological time series was calculated for the temporal points at which both time series data are available (von Storch and Zwiers, 2012).
The relation between the PC time series and respective biological or physical time series were evaluated by the Pearson correlation, and its statistical significance is estimated with a Monte-Carlo simulation that takes into account effective degrees of freedom. Since co-variability among biological time series mostly occurs on decadal timescales as will be shown later, we evaluated correlations with a 5-year running mean low-pass filter as main results and without it as Supplementary results. Statistical significance of correlations was assessed as follows. First, we generated 1,000 surrogate time series for the respective PCs (without the running mean), by using a red noise model, where lag-1 correlation was estimated by using Burg’s method (e.g., Kay, 1988). In the case of the significance estimation for correlations with the low-pass filter, the filter was applied to both observed data and surrogate PCs before calculating correlations. Then surrogate correlation coefficients were calculated between observed data (e.g., marine biological time series) and the surrogate PC. The confidence level was estimated as the percentile of the absolute value of the observed correlation with respect to the absolute surrogate correlations. We employ Monte-Carlo simulation instead of using theoretical estimation of effective degrees of freedom (e.g., Metz, 1991; Pyper and Peterman, 1998) because the theoretical estimation is difficult to use for data that have missing values and with time filtering, but these factors are automatically included by the present Monte-Carlo simulation.
We also examined statistical significance of the explained variance ratio (EVR) of PCA modes by using another Monte-Carlo simulation. We use this analysis because the correlations between some biological indices and PCs can become statistically significant just by chance associated with the large number of tests as discussed by Ventura et al. (2004) and Wilks (2016). For the significance test of the EVR for the first mode (EVR1), we generated 1,000 sets of observed biological indices (e.g., 1,000 sets of 120 time series for the whole NP basin) by using a red noise model with a lag-1 auto-correlation for each time series, with missing data in the same years as observed. By considering correlations between biological indices, we reduce the number of surrogate indices by 5% (e.g., from 120 to 114 indices for the whole NP basin) for each set, because the number of statistically significant pairs of biological indices is 9–10% of the number of total pairs in all three PCA domains and removal of 10% of pairs is equivalent to removal of 5% of time series as square root of 0.90 is approximately 0.95. The PCA is calculated for each set of reduced surrogate data, yielding 1,000 surrogate EVR1s. The percentile obtained by the observed EVR1 with respect to the 1,000 surrogate EVR1s gives the confidence level. If EVR1 is larger than any of surrogate EVR1s, the confidence level is higher than 99.9%, and equivalently p-value is smaller than 0.1%. Such a rigorous estimation of statistical significance was not used in previous LMA studies.
Results
First PCA Modes of Marine Biological Time Series
Each of the PC1s for the whole, eastern, and western NP basins show a long-term trend-like feature with the single-phase reversal in the 1980s, and western and eastern NP PC1s are generally similar (r = 0.90) especially after 1990 (Figure 2A). Interestingly, the 1980s phase reversal is gradual for the eastern NP PC1 as seen in biological PC1s of Hare and Mantua (2000) and Litzow and Mueter (2014), but it is more rapid in the western one. As expected, the whole NP PC1 shares the features of the eastern and western NP PC1s. The EVR1s for the three analysis domains, which ranges between 12.4 and 27.7% (Figure 2A), are statistically significant (p-value < 0.1%) according to the Monte-Carlo simulation.
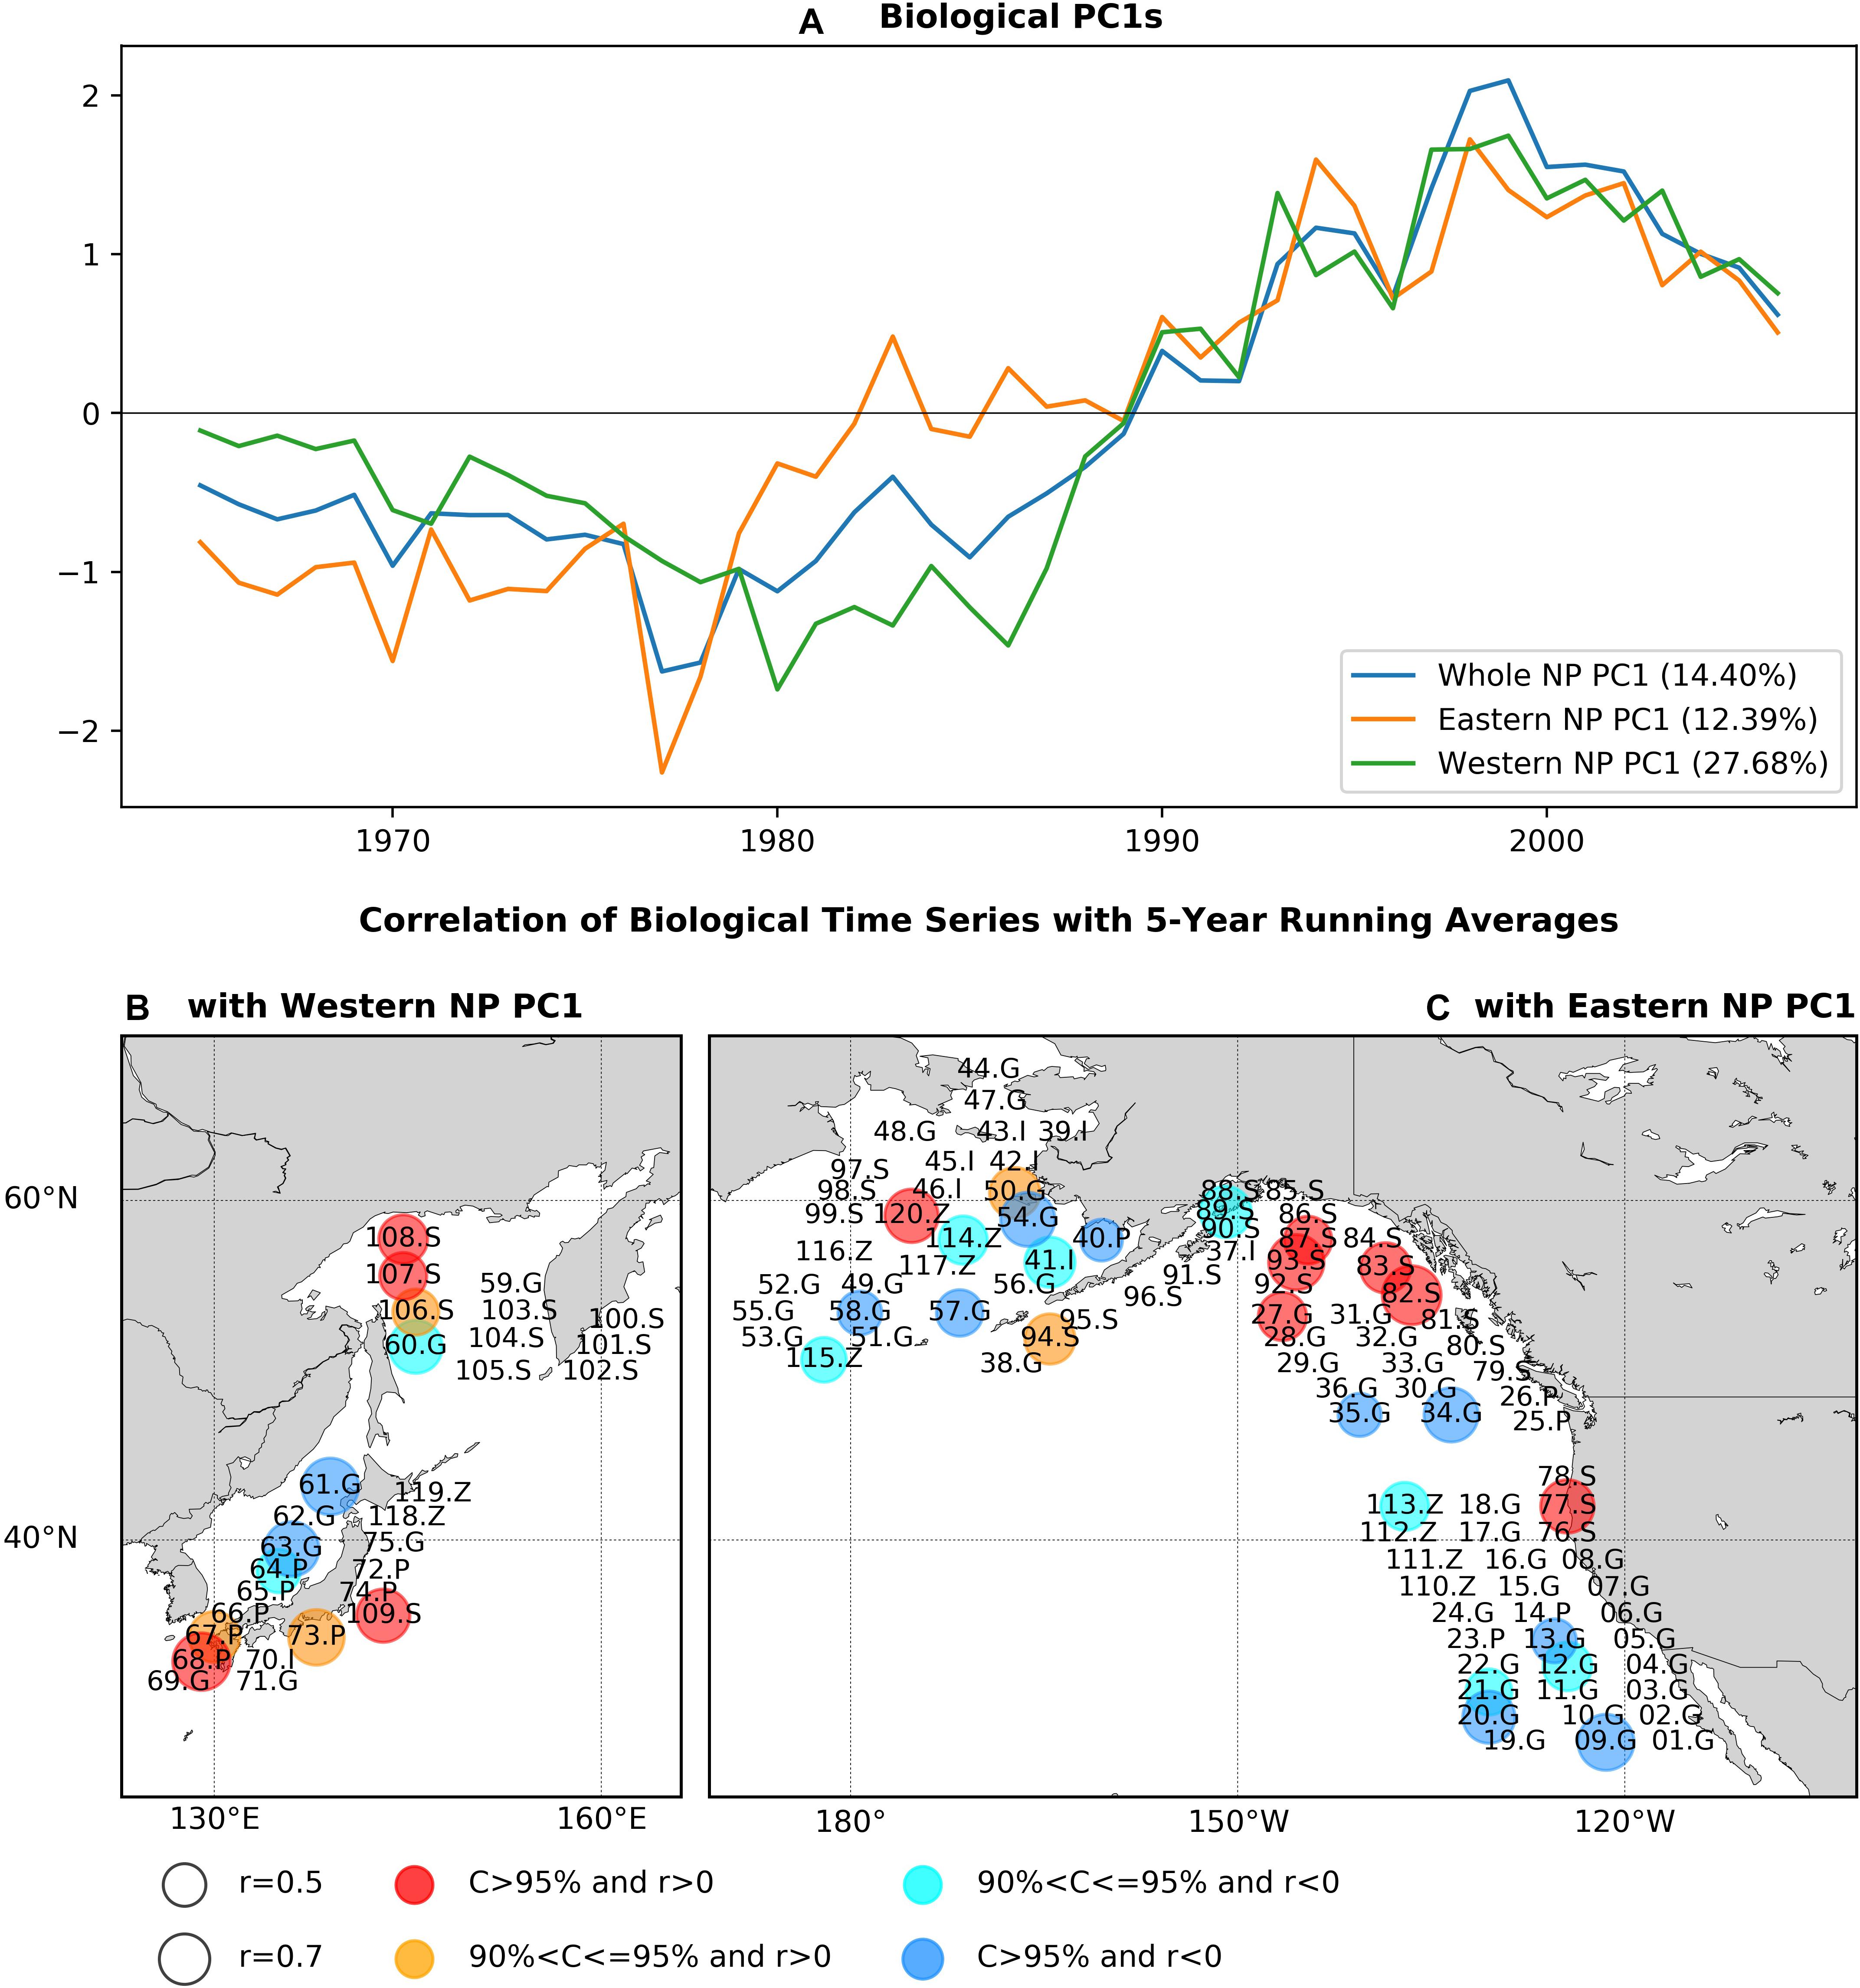
Figure 2. (A) PC1s for the whole NP, eastern NP, and western NP marine biological time series, and statistically significant correlations of marine biological time series (B) with the western NP PC1, (C) with the eastern NP PC1. Before calculating correlations 5-year running means are applied to PC1s and marine biological time series. In (B,C), numbers indicate species ID in Supplementary Table 1, while S, G, P, Z, and I indicate salmon, groundfish, small-pelagic, zooplankton, and invertebrate, respectively. Circle size indicates the absolute values of correlations and colors of the circles (red, orange, cyan, blue) indicate the sign of correlations and the corresponding confidence levels.
The pattern of PCA first mode is shown (Figures 2B,C) as statistically significant correlations at a confidence level of 90% or higher between the PC1s and biological time series with the low-pass filter. The correlations calculated without the filter give essentially the same pattern (Supplementary Figure 1). Two fish groups, salmon and groundfish, have significant correlations in both the western and eastern NP. Ten salmon time series (30% of all salmon time series) are positively correlated, including chum salmon (77.S, 83.S, 107.S), pink salmon (82.S, 94.S, 106.S, 109.S), and sockeye salmon (87.S, 93S, 108.S), mainly around Alaska (82.S, 83S, 87.S, 93.S, 94.S), and Russia/Japan (106S, 107.S, 108.S, 109.S). On the other hand, 13 groundfish time series (24% of groundfish time series) have negative correlations with PC1s, including west coast rockfish (09.G, 12.G, 13.G, 20.G, 21.G), walleye pollock (34.G, 54.G, 63G), cod (35.G, 58.G, 60.G), and others (57.G, 61.G). There are exceptions from this general tendency such as negative correlations for salmon (89.S) and positive correlations of groundfish (27.G, 50.S), but these are minor. Therefore, positive correlations of salmon and negative correlations of groundfish are the major feature commonly found in both the western and eastern NP associated with the first PCA mode.
Some species exhibit significant correlations in only either the western or eastern NP (Figures 2B,C). In the western NP, PC1 is positively correlated with three small pelagic fish recruitment time series (38% of western NP small pelagic fish) around Japan, i.e., jack mackerel (67.P), anchovy (68.P, 73.P). In the eastern NP, on the other hand, negative correlations are also found for three zooplankton time series (33% of eastern NP zooplankton) (113.Z, 114.Z, 115.Z) and one invertebrate (Bristol Bay red king crab, 41.I), and positive correlation occurs for the large medusae jellyfish in the eastern Bering Sea (120.Z). These basin-specific associations, especially those for small pelagic fish in the western NP and zooplankton in the eastern NP, are also important aspects of the first PCA mode of the NP ecosystem.
Biological time series that are significantly correlated to the PC1s are compared with those PC1 with the low-pass filter (Figure 3). Consistent with the trend-like feature of the PC1s, the biological time series generally exhibit long-term increases for Alaskan and Japanese/Russian salmon and decreases for groundfish irrespective of basins, and increases of small pelagic fish in the western NP and decreases of zooplankton in the eastern NP. It is interesting to note that the time series of the western NP salmon exhibit rapid negative-to-positive phase transition around 1990, which appears consistent with the aforementioned rapid phase reversal of the western NP PC1 (Figure 3A). Aside from this rapid transition around 1990, co-variability between biological time series and PC1s occurs on multidecadal and longer timescale. For example, decadal fluctuations are apparent in the eastern NP salmon, but these decadal fluctuations do not occur in the PC1 (Figure 3D). Furthermore, the time series comparison without time filtering (Supplementary Figure 2) shows no clear co-variability on interannual timescale. Consequently, in association with the trend-like first PCA mode of the marine ecosystem, the major features are increases in Alaskan and Japanese/Russian salmon, decreases in groundfish in both the western and eastern NP, increases in western NP small pelagic fish, and decreases in eastern NP zooplankton.
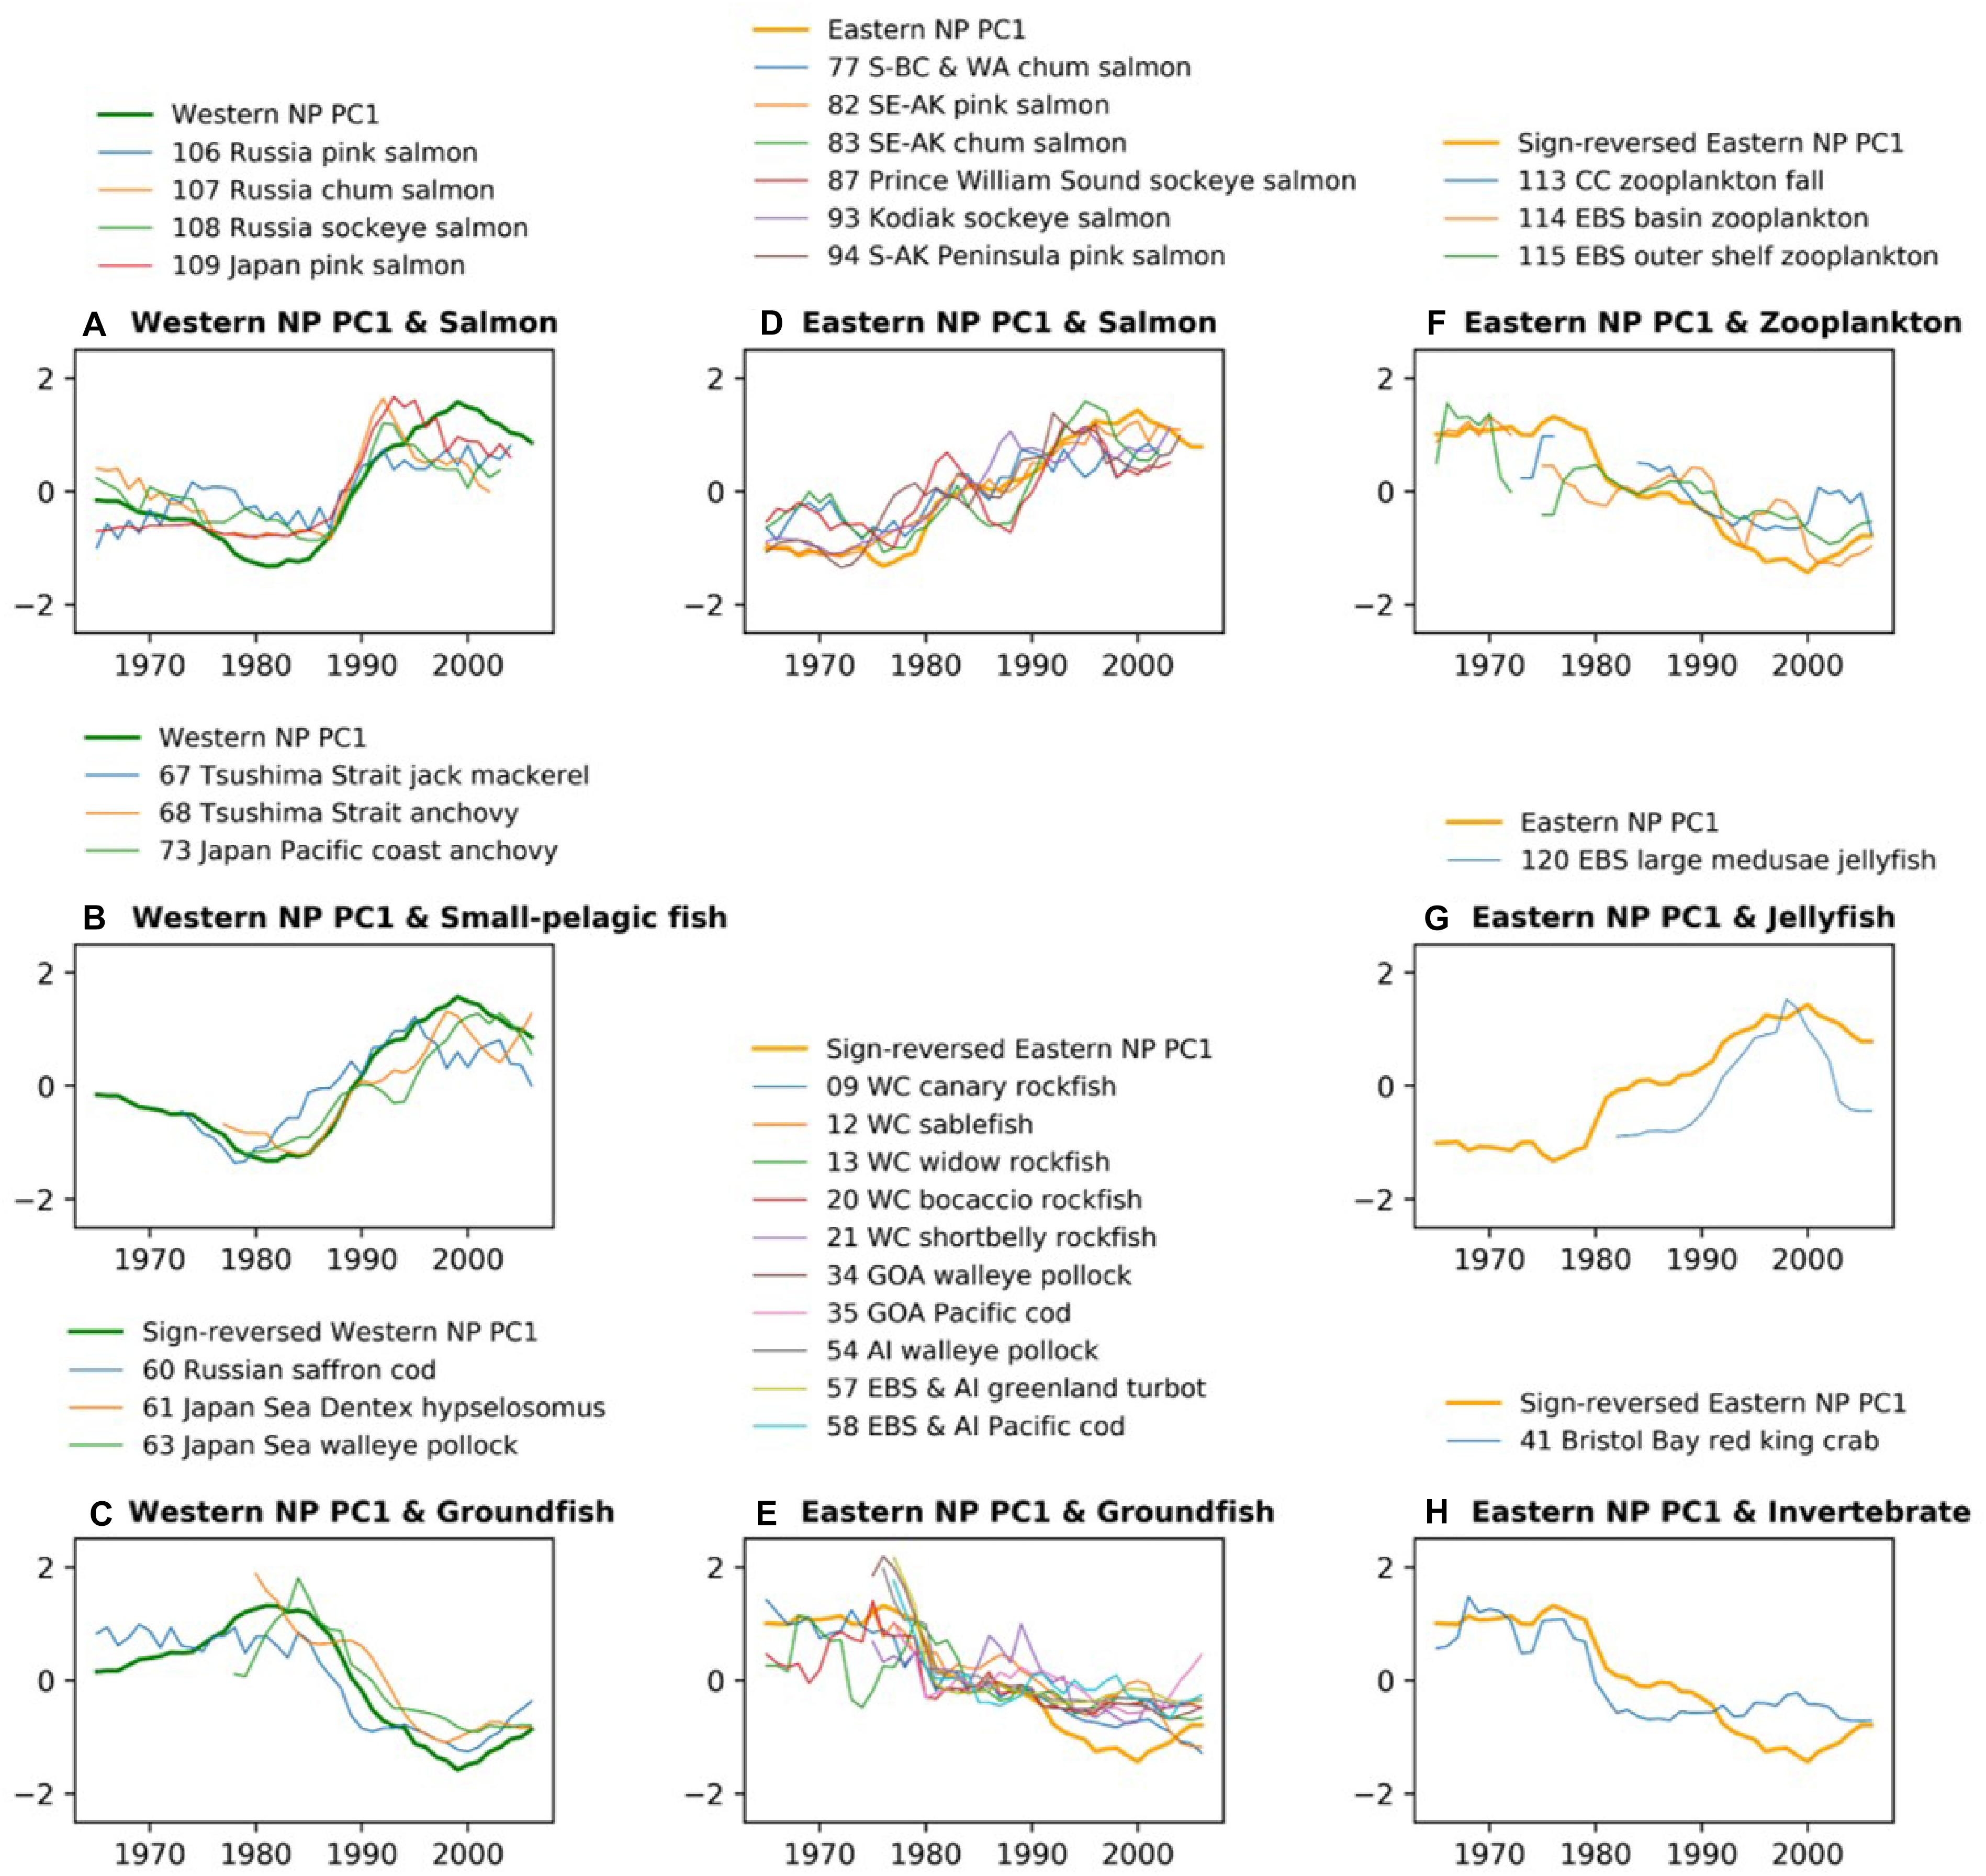
Figure 3. Time-series comparison between marine biological PC1 and biological time series that have significant correlations with that PC1 in each basin shown in Figures 2B,C. The time series of western NP (A) salmon, (B) small pelagic fish, and (C) groundfish are shown along with the western NP PC1. The time series of eastern NP (D) salmon, (E) groundfish, (F) zooplankton, (G) jellyfish, and (H) invertebrate are shown along with eastern NP PC1. All time series are smoothed by 5-year running mean. For an easier comparison, the PC1 time series are sign-reversed (multiplied by –1) for (C,E,F).
Second PCA Modes of Marine Biological Time Series
The PC2s of eastern and western basins exhibit slightly different timescales (Figure 4A). The eastern NP PC2 is characterized by multidecadal variability with phase reversals in the 1970s and in the 1990s. The western NP PC2 exhibits three phase reversals and is characterized by shorter timescale interdecadal variability than that of the eastern NP PC2. When PCA modes are calculated using data from which linear trends are removed, the resultant PC1s with detrending are quite similar to the PC2s without detrending (r = 0.92 for the eastern NP and r = 0.82 for the western NP), thereby indicating the robustness of these modes. Furthermore, the EVR1s for the detrended PC1s are statistically significant (p-value < 0.1% for the eastern NP and p-value = 3.3% for the western NP). Here, we apply the statistical significance test for the PCA first mode with detrending, because the present Monte-Carlo simulation, which assume the no-signals, does not work accurately for the second mode when a signal exists in the first mode.
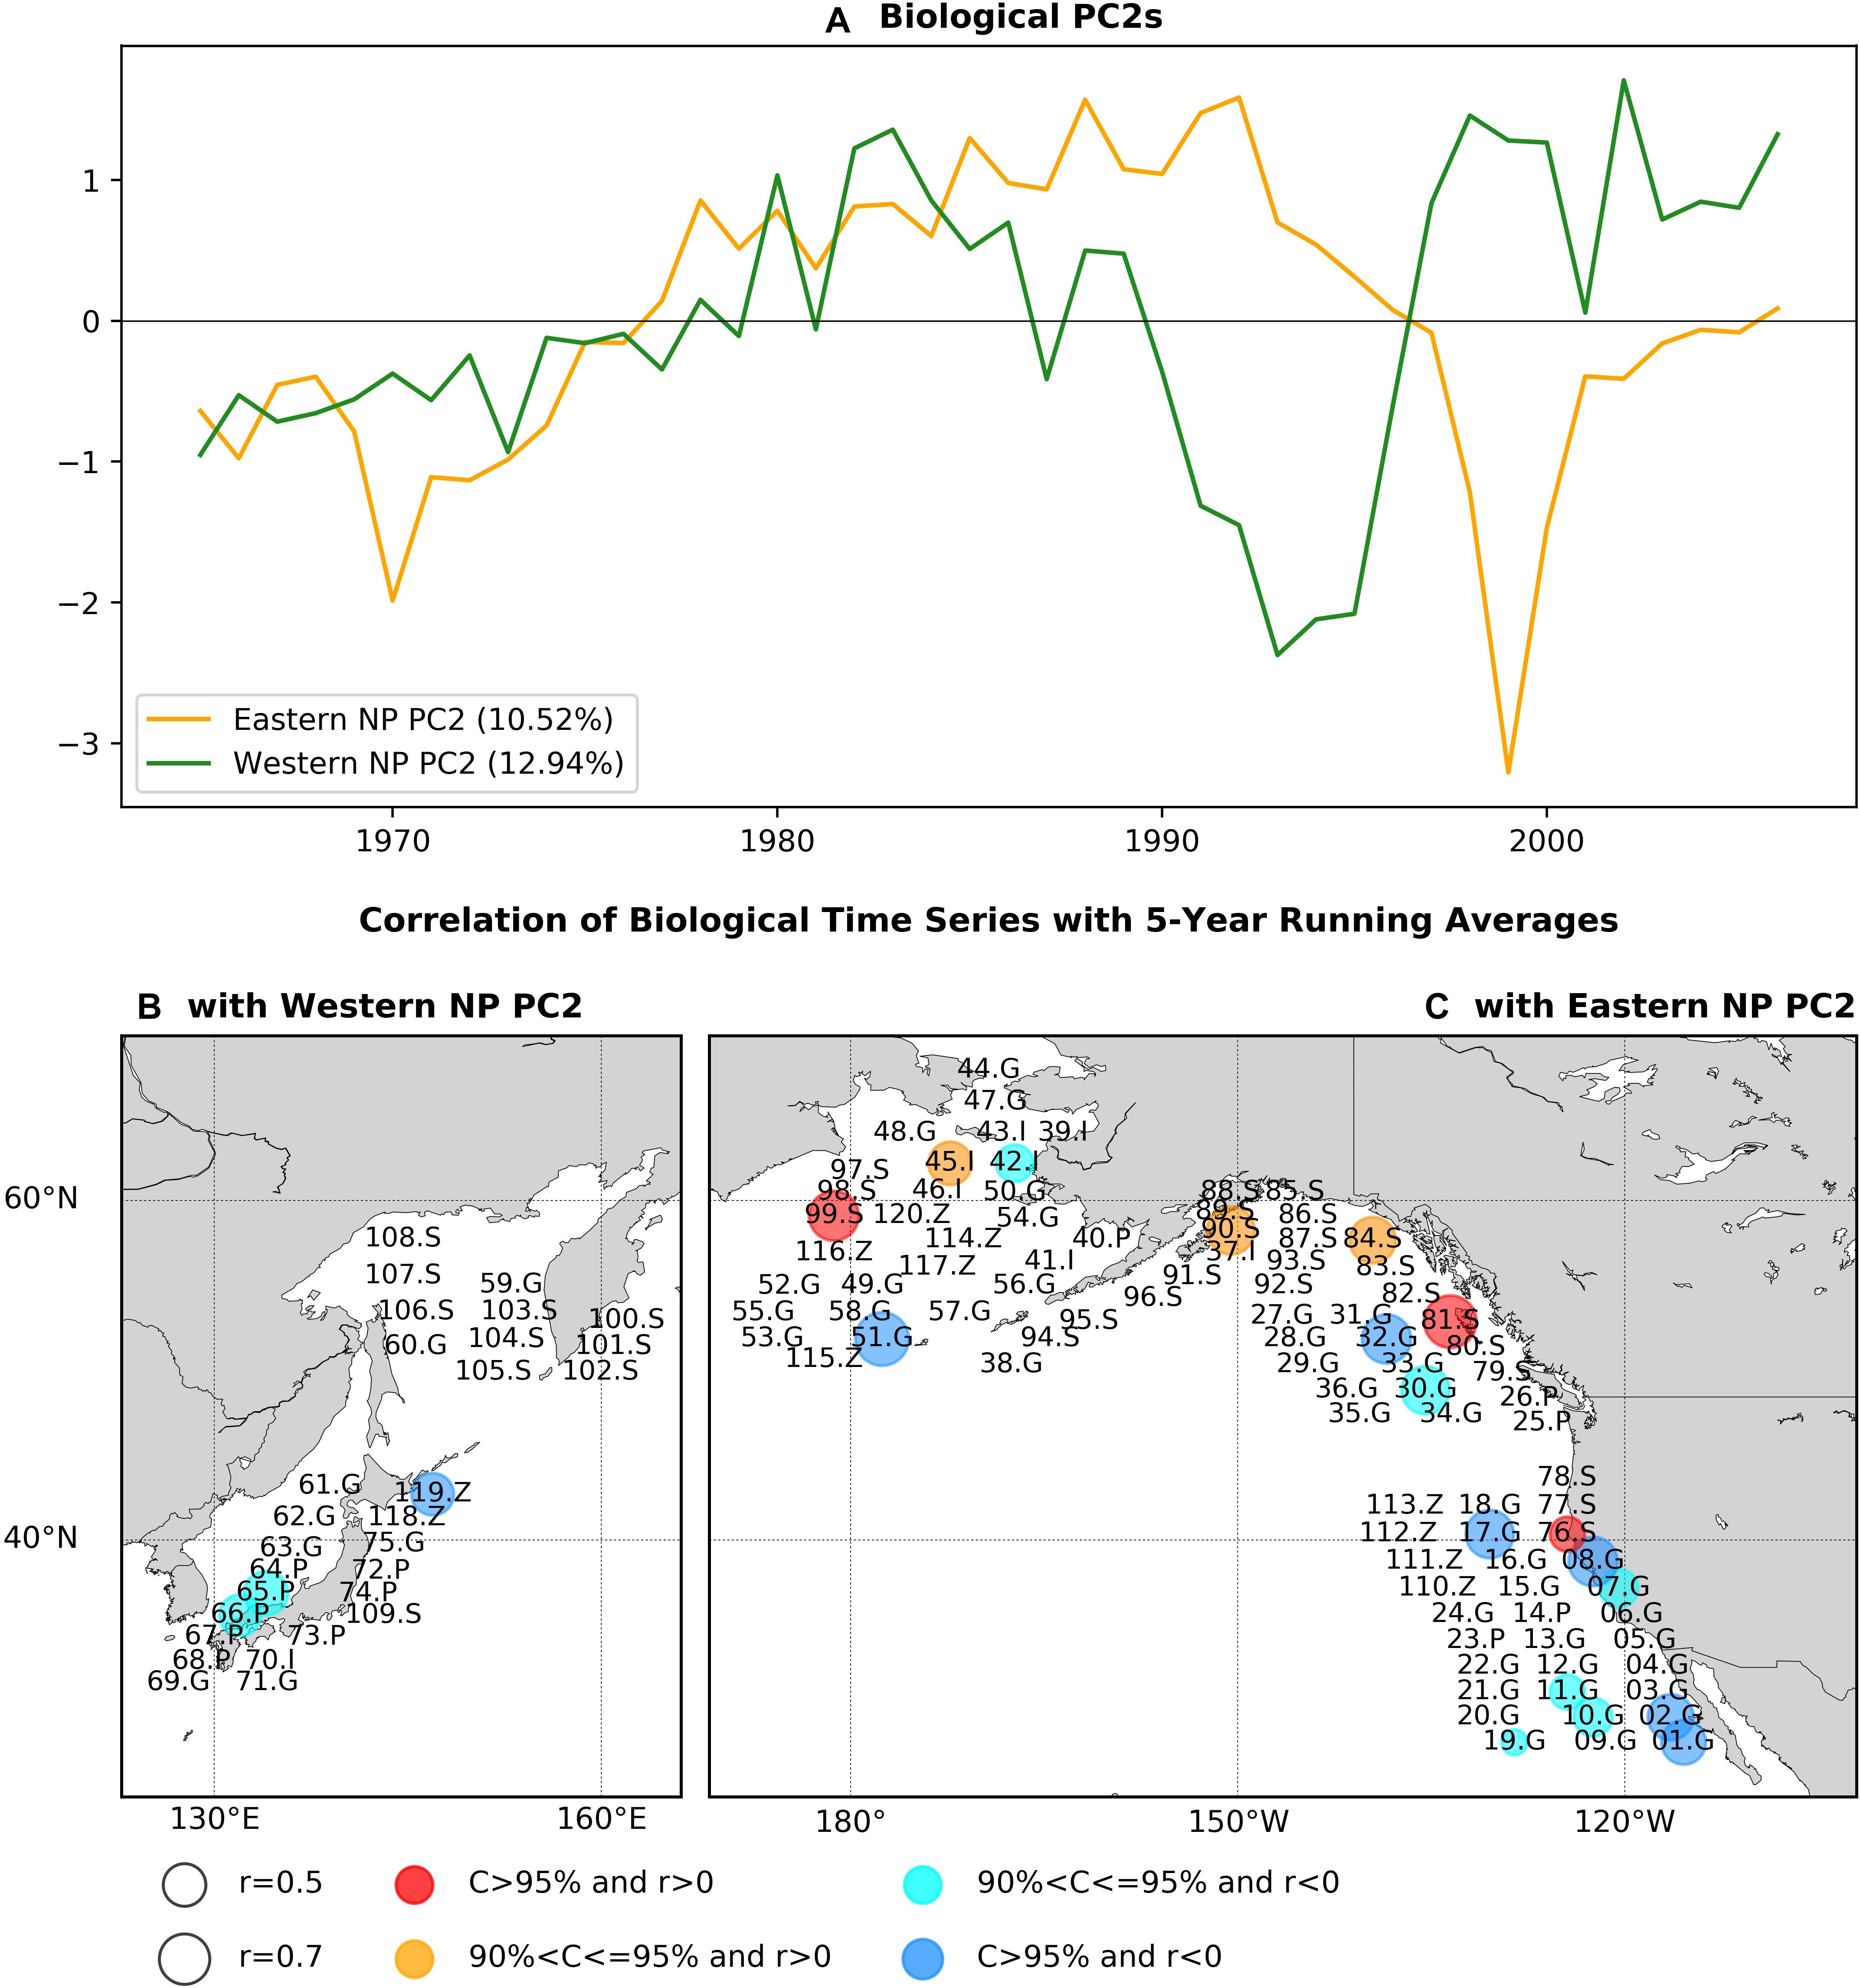
Figure 4. As in Figure 2, but for the PCA second modes.
Figures 4B,C shows the statistically significant correlation coefficients of marine ecosystem time series with the respective basin PC2s again using the low-pass filter before calculating correlations. It is interesting to note that, of the time series showing significant correlations with the PC2s, none are significantly correlated with the respective eastern or western NP PC1s. For the western basin (Figure 4B), there are three time series with significant correlations consisting of round herring recruitment (65.P), chub mackerel recruitment (66.P), and zooplankton biomass (119Z). When we calculate the correlation map without the low-pass filter, the number of time series with significant correlation is increased by three times to nine in total, with negative correlations for eight biological time series (Supplementary Figure 3). This increase of significantly correlated time series can be either due to the increase of effective degrees of freedom in non-filtered analysis or due to the contribution of interannual variability.
On the other hand, significant correlations for the eastern NP PC2 (Figure 4C) were positive for mainly salmon abundance (76.S, 81.S, 84.S, 90.S, 99.S) and negative for groundfish recruitment (01.G, 02.G, 07.G, 08.G, 10.G, 11.G, 17.G, 19.G, 30.G, 32.G, 51.G). The opposite sign of correlations between salmon and groundfish was also found for the first PCA mode (Figure 2C). Two invertebrate time series were significantly correlated but with split signs (positive correlation for 45.I and negative for 42.I). The jellyfish in the eastern Bering Sea (120.Z) was negatively correlated, whereas no other zooplankton time series were significantly correlated. The correlation map without time filtering (Supplementary Figure 3c) also exhibits positive correlations for salmon and negative correlations for groundfish but with increased number of biological time series that are significantly correlated [from 18 with the filter (Figure 4C) to 27 without it (Supplementary Figure 3c)].
Figure 5 shows the biological time series that are significantly correlated to the PC2s shown in Figures 4B,C with the low-pass filter. The western NP PC2 is characterized by a overall negative trend, small negative anomalies in the 1980s, and large positive anomalies in the 1990s. This feature is shared by zooplankton (119.Z) and chub mackerel (66.P) with a delayed peak in the 1990s (Figures 5A,B). In contrast, the peak in round herring (65.P) occurs earlier than the peak of the western NP PC2 (Figure 5B). The low-pass filtered eastern NP PC2 is characterized by a negative-to-positive change in the 1970s and positive-to-negative change in the 1990s. These two phase transitions generally occur for salmon (Figure 5C), but only the later transition is evident in groundfish (Figure 5D). Furthermore, non-filtered data show that most of the groundfish time series exhibit a sharp peak at the end of 1990s (Supplementary Figure 4) simultaneously in general with the sharp negative peak of the eastern NP PC2 at 1999 shown in Figure 4C.
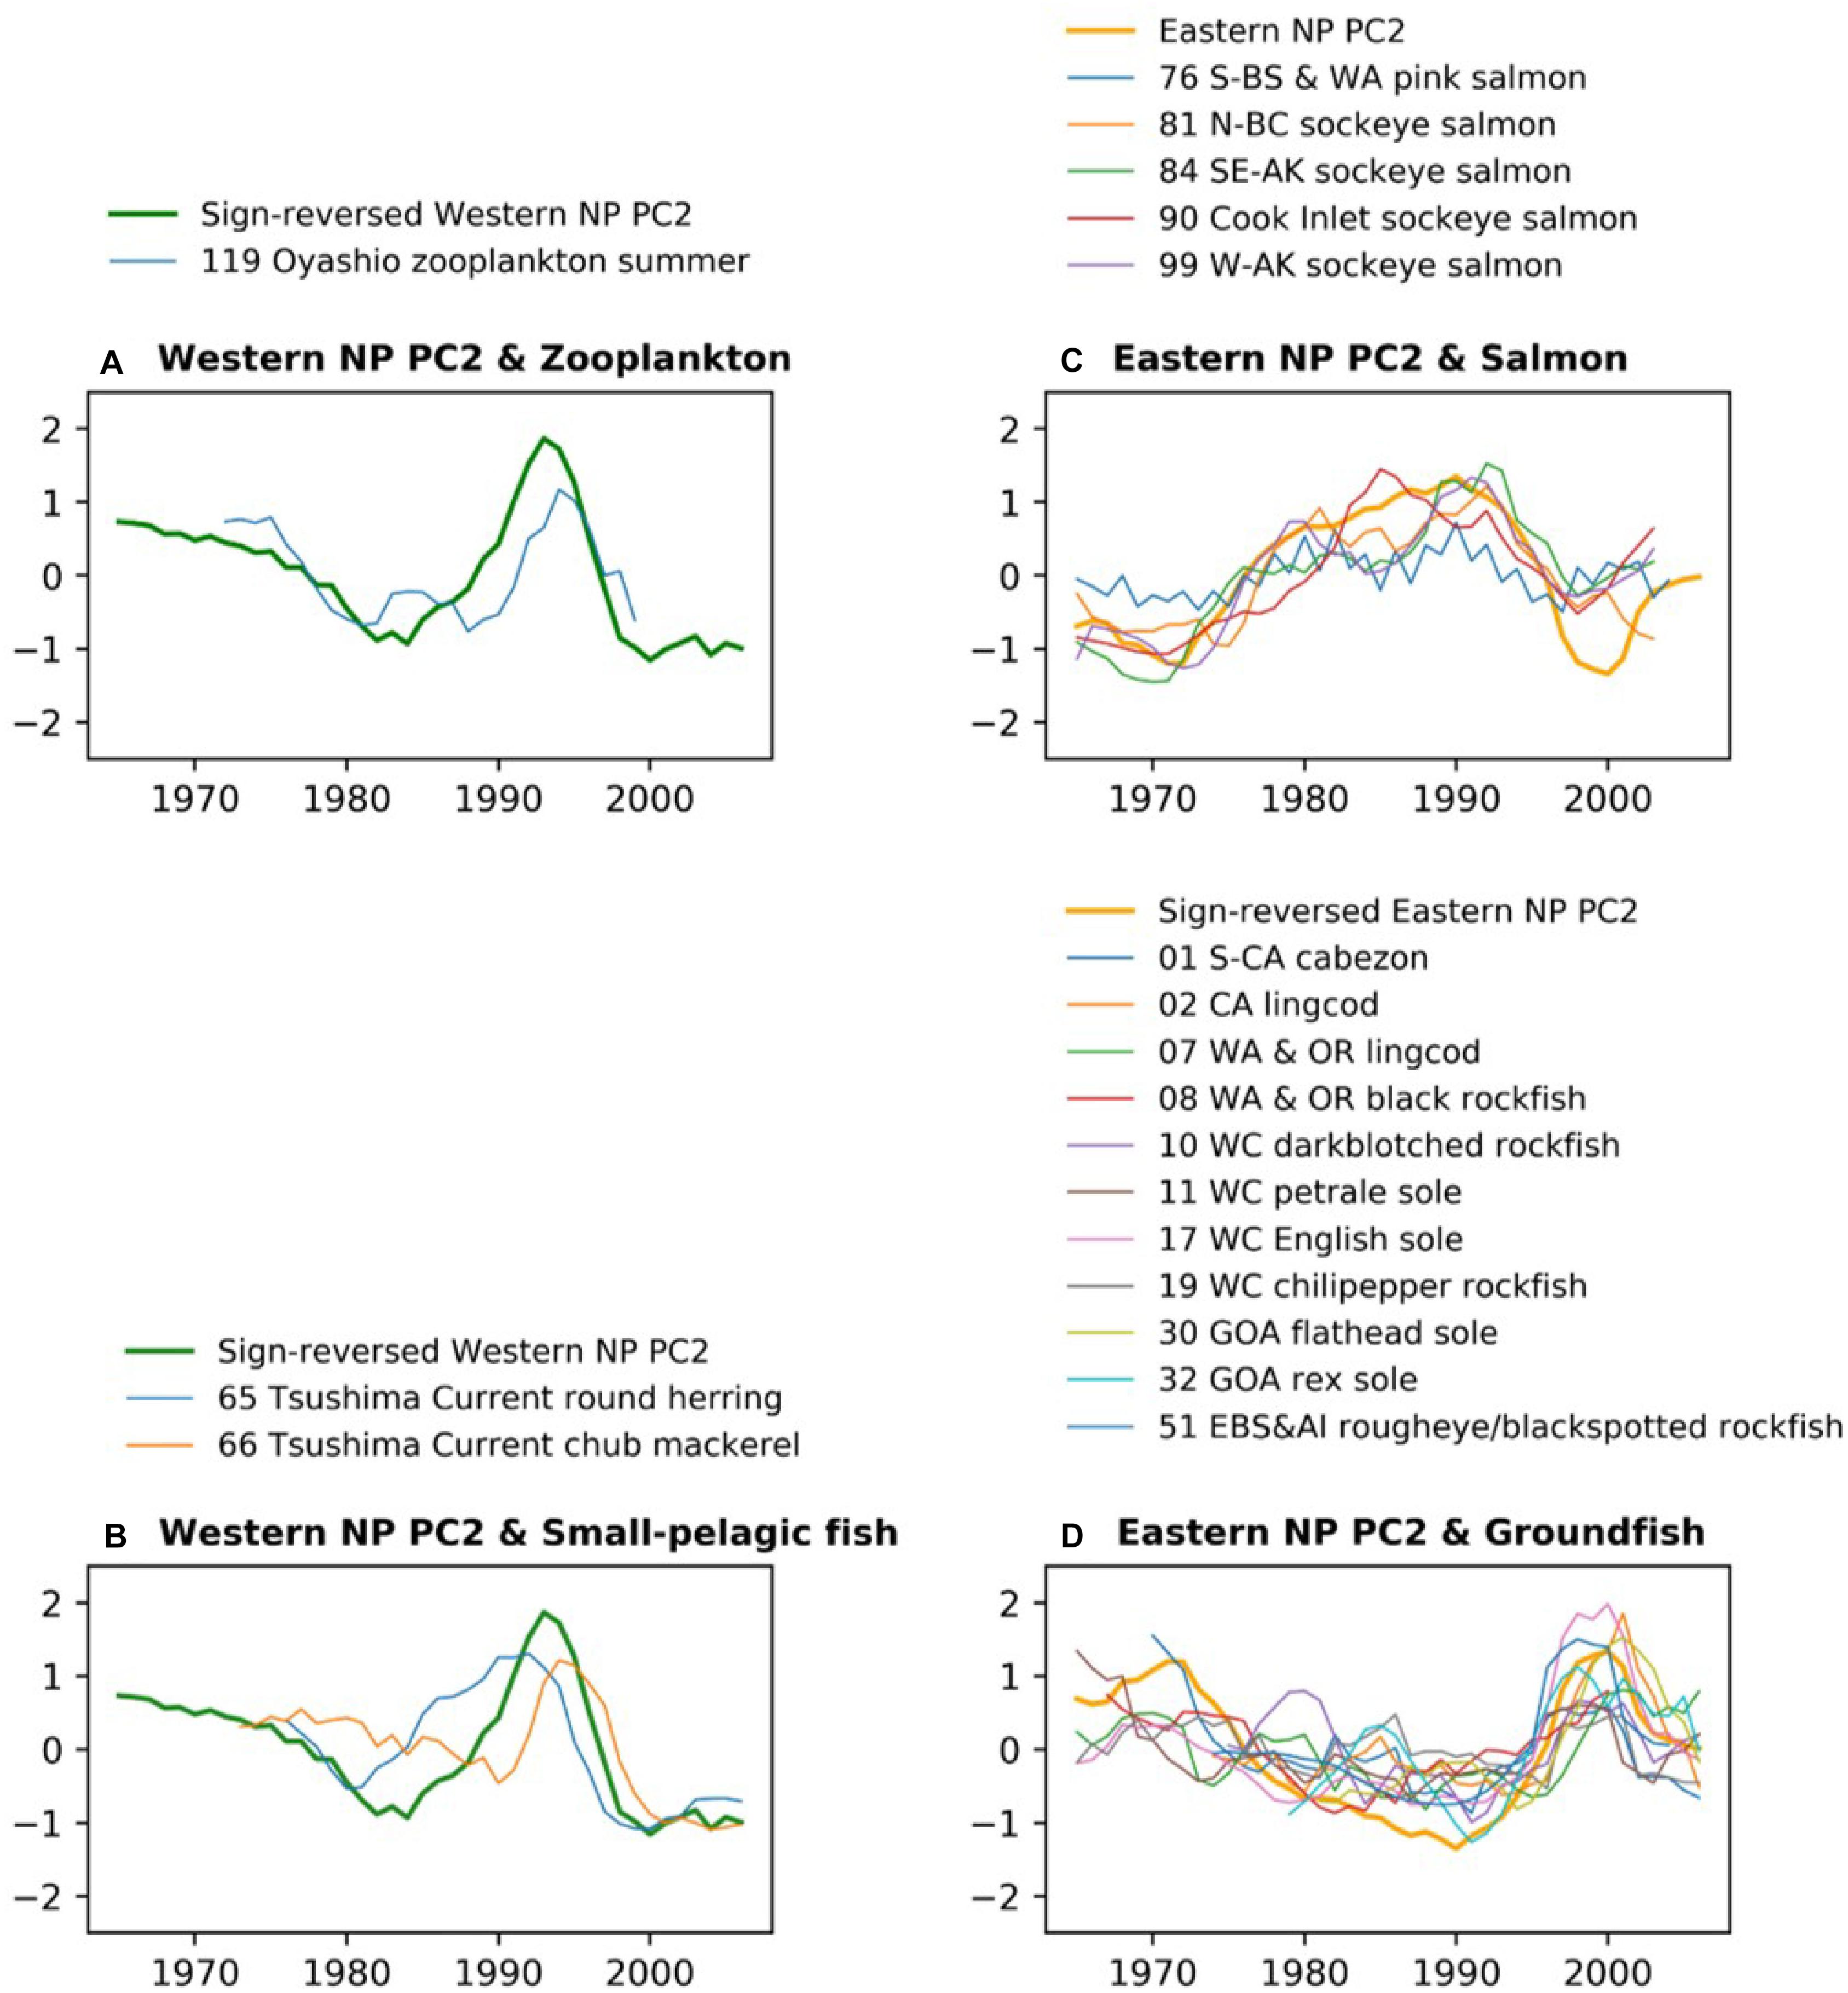
Figure 5. As in Figure 3, but for western NP (A) zooplankton and (B) small pelagic fish along with western NP PC2, and eastern NP (C) salmon and (D) groundfish along with eastern NP PC2. All time series are smoothed by 5-year running mean. For an easier comparison, the PC2 time series are sign-reversed (multiplied by –1) for (A,B,D).
Relation Between Marine Ecosystem PCA and Climate Modes
Table 2 shows correlations between the PCs and climate time series. All PC1s, i.e., the whole NP PC1, the western NP PC1 and the eastern NP PC1, were highly correlated with NP-SST as well as G-SST with correlation coefficients between 0.76 and 0.90. The PC1s are not significantly correlated with other climate time series except for moderate correlations of the eastern NP PC1 with the MEI and NPI. The G-SST and NP-SST time series share multidecadal variability with biological PC1s including the negative-to-positive polarity change in the 1980s (Figure 6A). The warming of the G-SST is most likely due to anthropogenic global warming (Bindoff et al., 2019), and the similar trend between the G-SST and NP-SST suggests that global warming caused the warming trend of the NP-SST. Furthermore, the major causality between global warming and the marine ecosystem is that the former influenced the latter and not vise versa (Bindoff et al., 2019). Therefore, the close co-variability between the SST time series and biological PC1s suggests global warming influenced the first mode of the NP marine ecosystem.
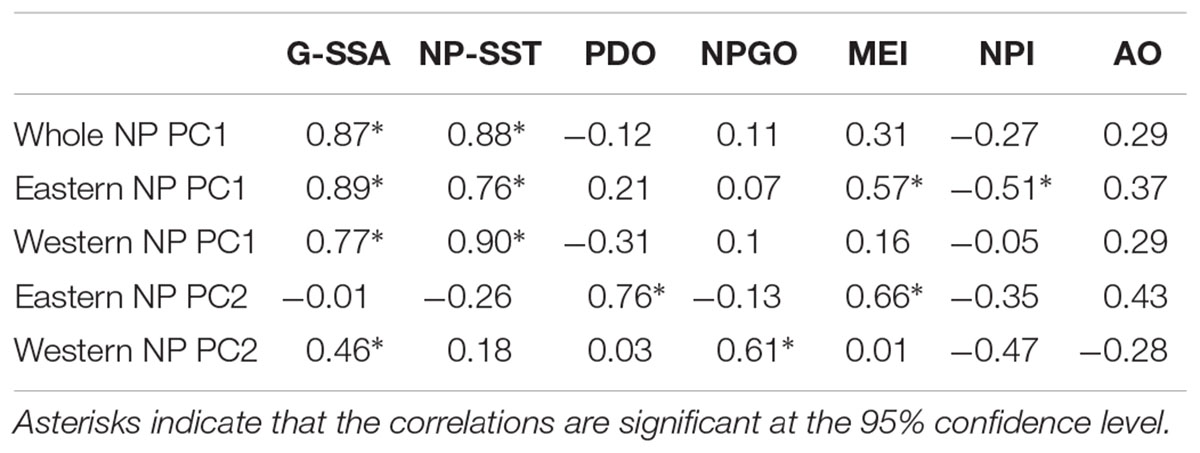
Table 2. Correlations between marine ecosystem PCs and climate indices with 5-year running mean.
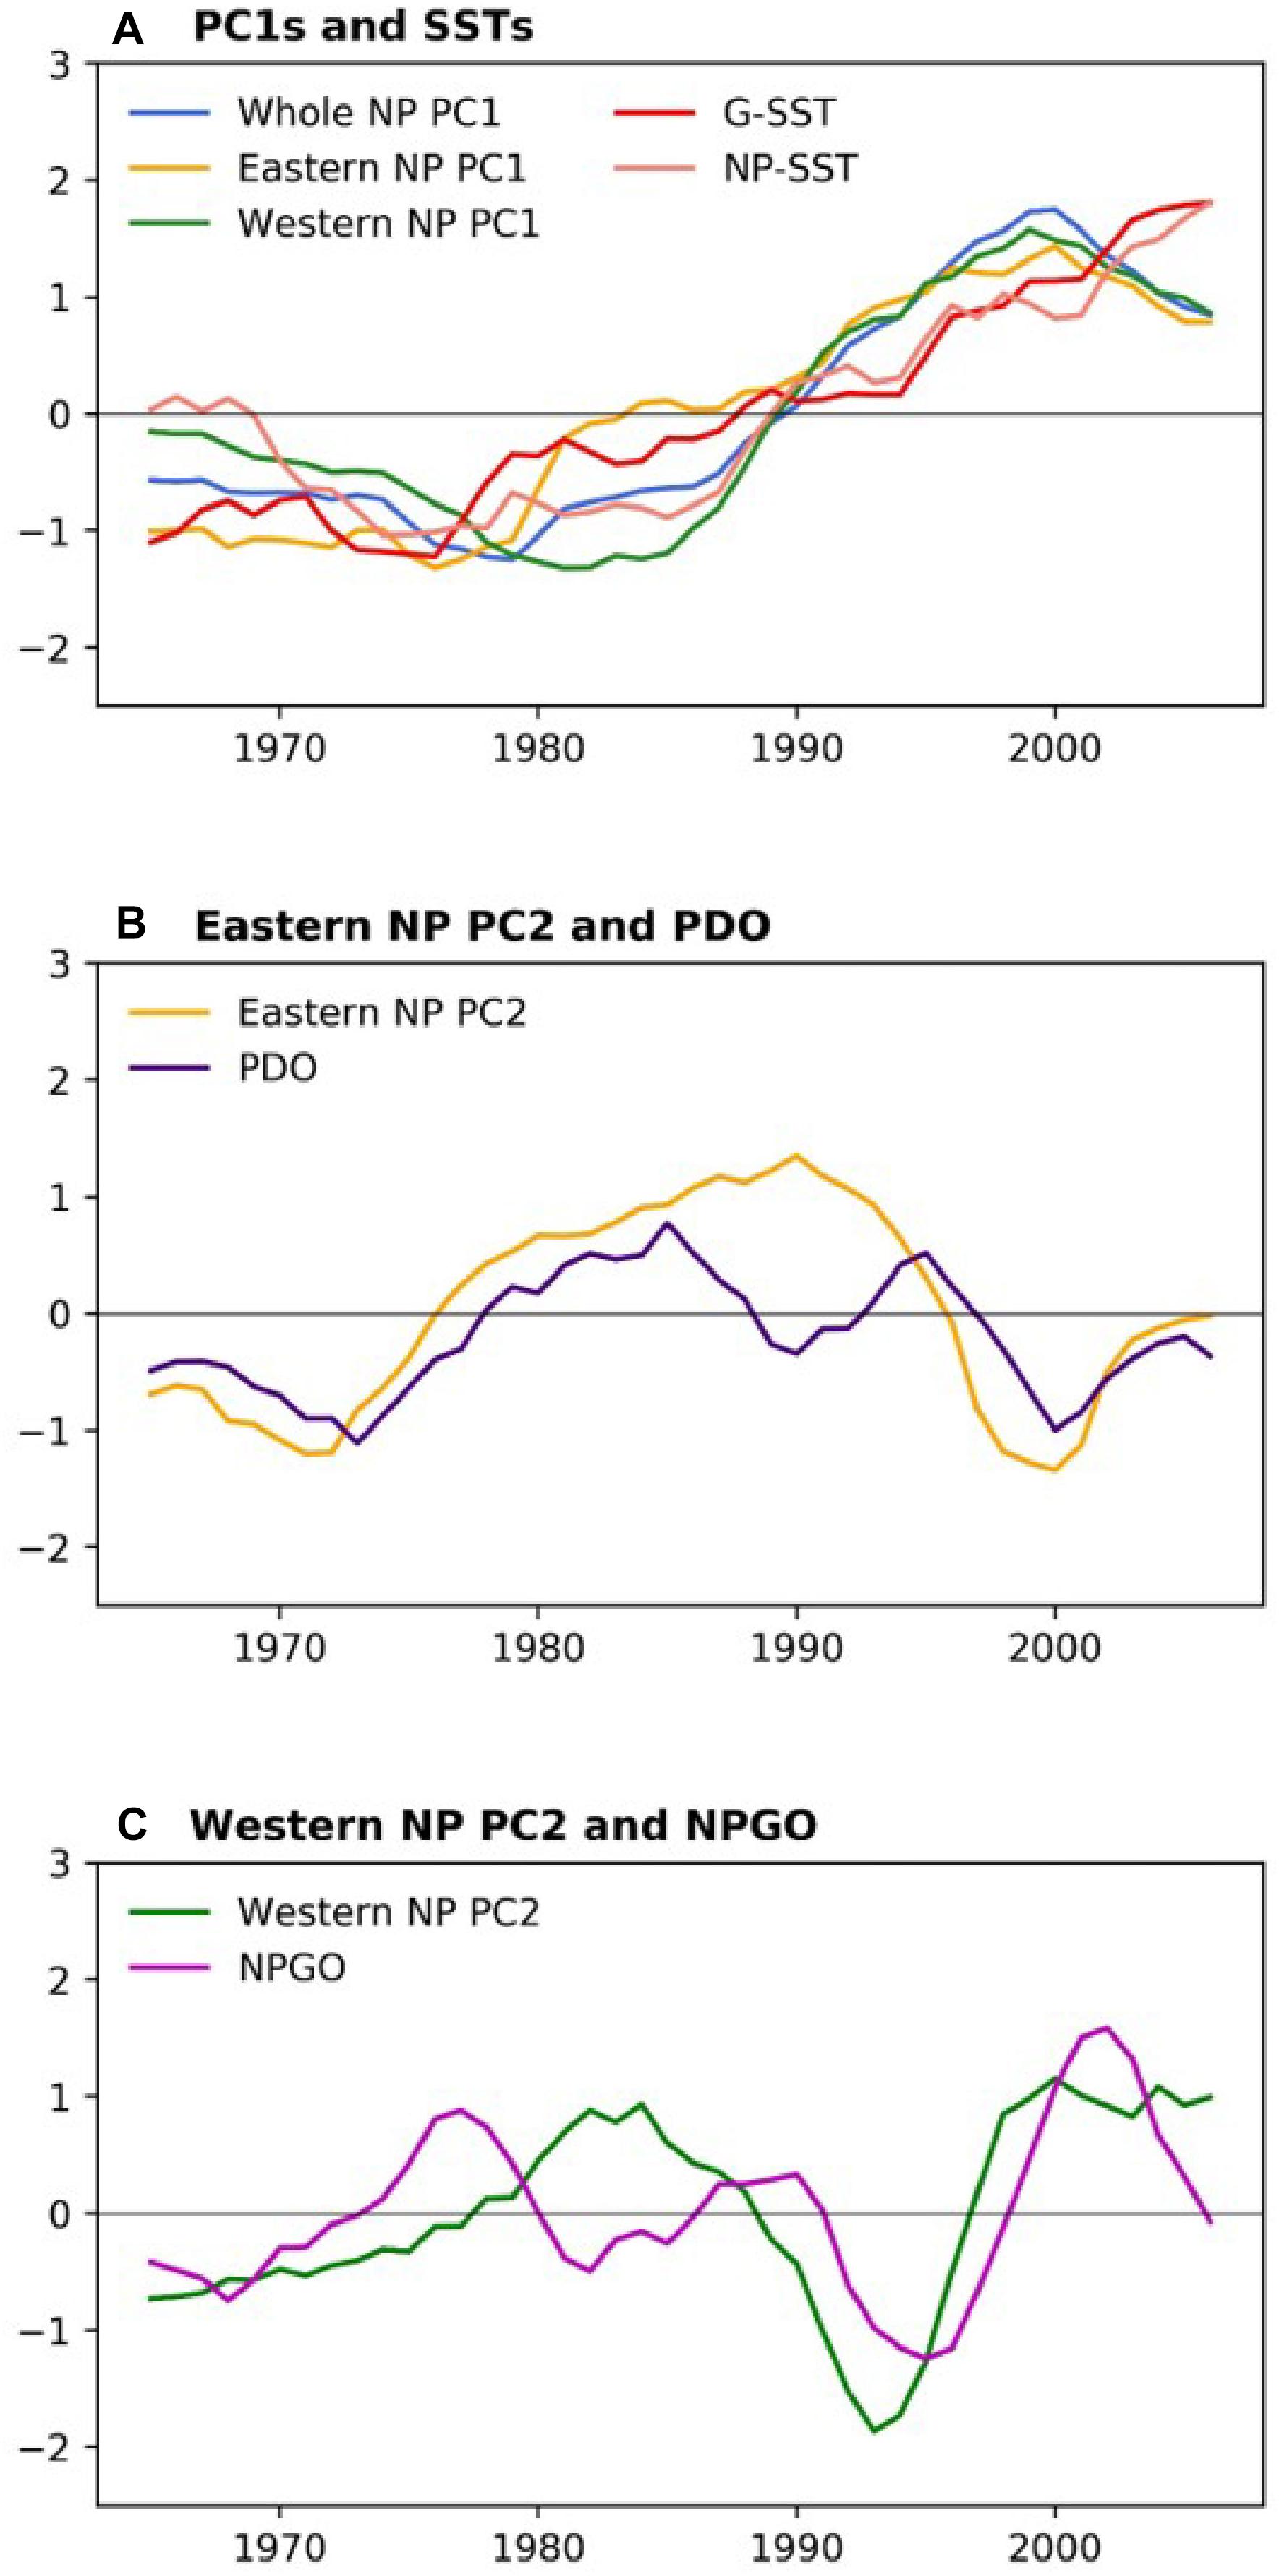
Figure 6. (A) Marine biological PC1s and G-SST and NP-SST (B) eastern NP PC2 and PDO index, and (C) western NP PC2 and NPGO index. From all climate indices, their respective averages in 1965–2006 have been removed, and G-SST and NP-SST are further divided by their respective standard deviations. All time series are smoothed by 5-year running mean.
The biological eastern NP PC2 is the most strongly correlated with the PDO index (Table 2). Consistently, the eastern NP PC2 and PDO index share the phase reversals in the 1970s and 1990s (Figure 6B), in association with the previously reported climate and ecosystem regime shifts (Mantua et al., 1997; Minobe, 1997; Chavez et al., 2003). An interesting difference between the two time series occurs around 1990, when the PDO index exhibited negative values for a short time without a similar feature in the eastern NP PC2. Some studies characterized the PDO index phase transition in the late 1980s a climatic regime shift (Yasunaka and Hanawa, 2002), but Minobe (2000) suggested that this was a minor climate regime shift and is different from the major regime shifts in the 1920s, 1940s, and 1970s. The eastern NP PC2 shows no correspondence with this short-lived event. The second strongest correlation with eastern NP PC2 is found for MEI (Table 2), probably reflecting the fact that the PDO, the most strongly correlated climate mode to the eastern NP PC2, is accompanied by ENSO-like interdecadal variability in the tropical Pacific (Mantua et al., 1997; Zhang et al., 1997). The relation between the North and tropical Pacific for decadal variability was at least partly due to the tropical influence on the mid-latitudes (Newman et al., 2003; see also review of Newman et al., 2016), but causality in the opposite direction, i.e., mid-latitude forces the tropics, was also reported (e.g., Vimont et al., 2003, Zhao and Di Lorenzo, 2020; see also review of Amaya, 2019).
In contrast to the relation between eastern NP PC2 and the PDO index, the western NP PC2 is correlated with the NPGO index (Table 2). It is noteworthy that the correlations of different combinations, i.e., between eastern NP PC2 and the NPGO index and between western NP PC2 and the PDO index, are very small. The time series comparison shows that the coherent variability between the NPGO index and western NP PC2 is limited to the 1990s and 2000s (Figure 6C). This may be related to the recent enhancement of decadal variability of the NPGO (Di Lorenzo et al., 2008; Joh and Di Lorenzo, 2017).
Figure 7 shows that the SST correlation patterns associated with biological PCs. The correlation map associated with the whole NP PC1 (Figure 7A) is characterized by overall positive correlations, accompanied by especially strong correlations in the western subtropical gyre and in the East China Sea. The correlations with the whole NP PC1 were weak along the subpolar front near 40°N and the subtropical front near 30°N, 150°W. Similar patterns are produced in correlation maps between gridded SSTA and the western and eastern NP PC1s (Figures 7B,C). The correlation map associated with the eastern NP PC2 (Figure 7D) is similar to the PDO pattern, which was the first PCA mode of NP SSTs, while the correlation map with the western NP PC2 (Figure 7E) is similar to the second mode of SST pattern (Bond et al., 2003), which is known to be closely related to the NPGO. The correlations with the eastern NP PC2 are generally strong in the eastern and central NP rather than in the western NP, consistent with the PDO pattern itself (Mantua et al., 1997). On the other hand, the correlations with the western NP PC2 are generally strong in the subtropical western NP.
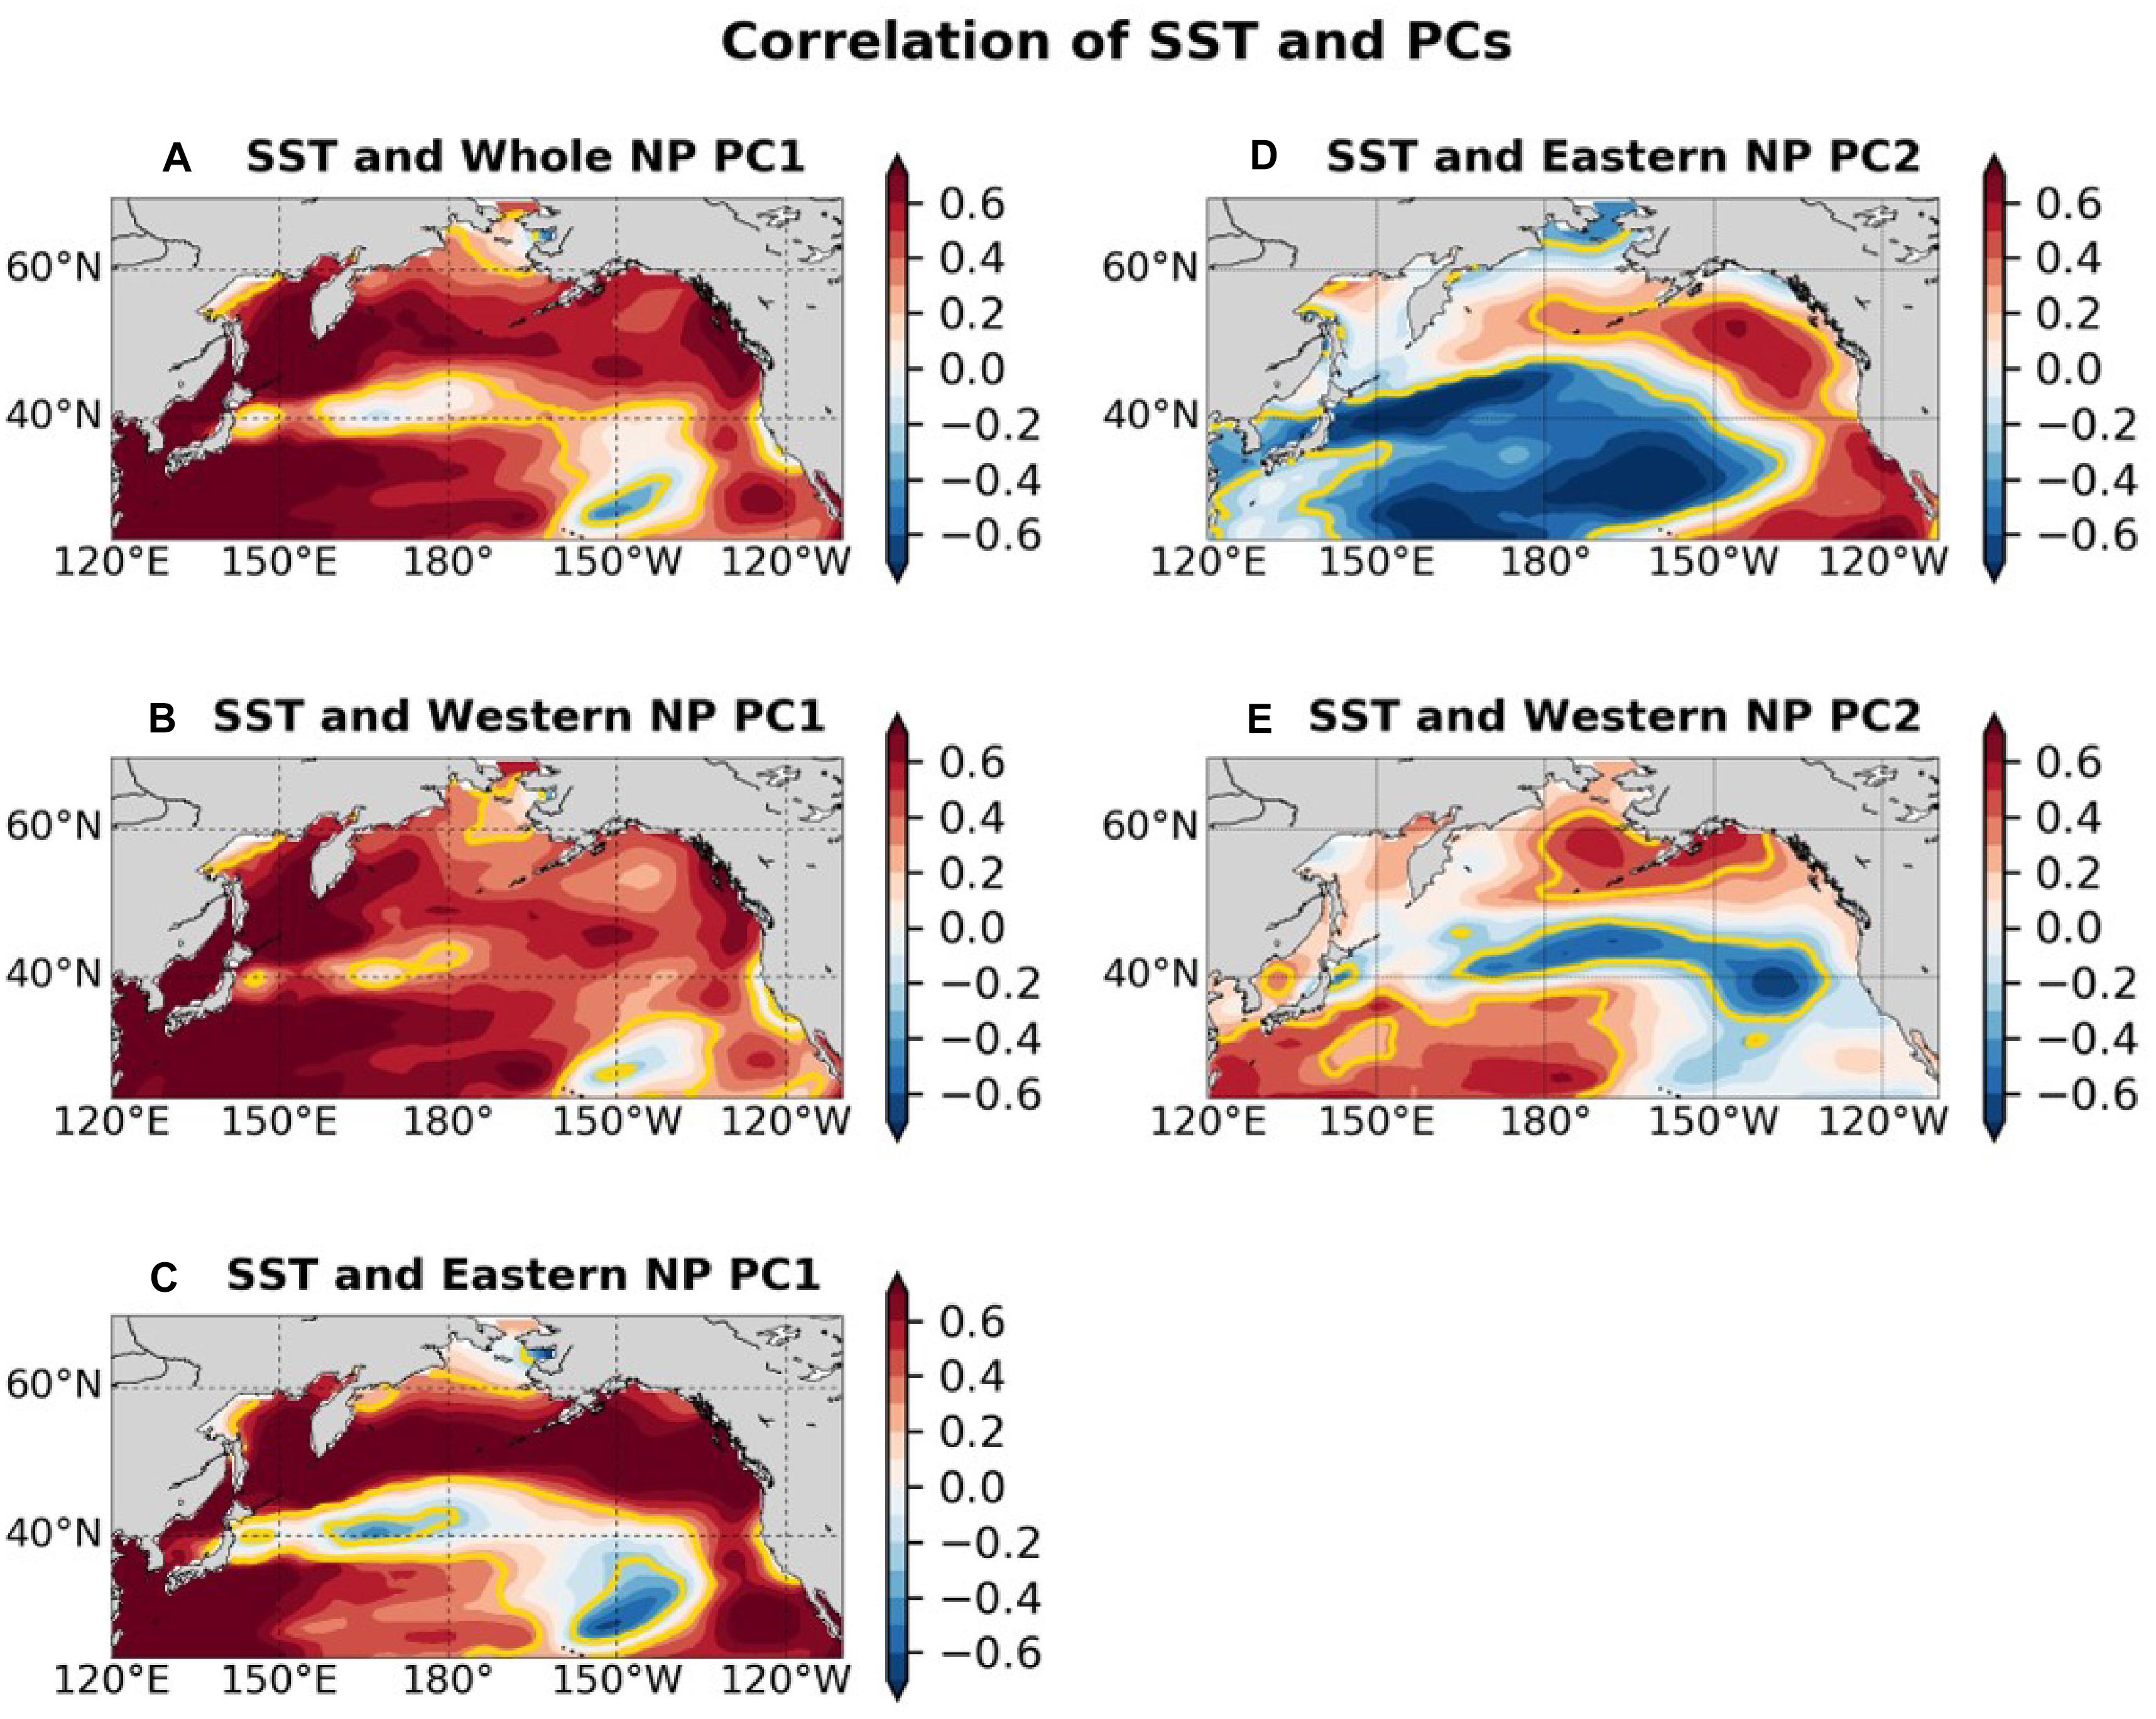
Figure 7. Correlation map between SST and (A) whole NP PC1, (B) western NP PC1, (C) eastern NP PC1, (D) eastern NP PC2, (E) western NP PC2. The color shade indicates correlation value and the yellow contours indicate that areas have significant correlation at the 95% confidence level. Before calculating correlations 5-year running mean are applied to PCs and SSTs.
Discussion
Comparison of PCA Modes Between the Present and Previous Studies and Possible Future LMAs
The trend-like feature is consistent with the biological PC1s of the previous eastern NP LMAs by Hare and Mantua (2000) and Litzow and Mueter (2014) as well as PC1s of western NP LMAs by Tian et al. (2006) and Ma et al. (2019). The physical-biological combined PC1 of Hare and Mantua (2000) exhibited rapid transition feature, but the changes were much more gradual in biological-only PC1s by Hare and Mantua (2000) and Litzow and Mueter (2014). Although the biological PC1s in this study were similar to those obtained by previous studies as noted above, the relationship between the PC1 and global warming was first identified by the present study. Our results strongly suggest that global warming has already impacted marine ecosystems in the NP.
The eastern NP PC2 was consistent with biological PC2s of Litzow and Mueter (2014). The biological PC2 of Hare and Mantua (2000) also exhibited the 1970s phase reversal, but the second phase change occurred around 1990, earlier than that in this study. The western NP PC2 was different from PCs reported by LMA analyses for western NP marginal seas (Tian et al., 2006; Ma et al., 2019). The different features of western NP PC2 can be due to the different kind of data, i.e., fish catch data in previous studies and recruitment and biomass data along with the abundance in the present study or due to the high spatial heterogeneity in the western NP.
The present and previous LMA studies indicate that the LMA is useful to identify the influence of climate variability and change on marine ecosystems, probably because LMA is effective at extracting the influence of common forcing across the time series even when the magnitude of the response is relatively small. Thus further LMA studies are desirable especially for the regions where LMA analyses have not been conducted yet. For those future LMA studies, it is suggested to use recruitment and/or abundance rather than fish catch data to understand changes in marine ecosystems, because fish catch data are directly influenced by fish catch efforts.
Possible Processes of Global Change Influence
It is interesting to discuss what processes are responsible for the biological variations documented in the present study, especially for the PCA first modes, which are suggested to be related to global warming. It is expected that the temperature increase due to global warming may cause geographical migration of marine species to colder areas, i.e., higher latitudes and deeper depths, and shifts of phenology (e.g., Pinsky et al., 2013; see also review by Poloczanska et al., 2016). The geographical migration increases warm water species and decreases cold water species in each region. This may be consistent with the pattern of small pelagic fishes characterized by increased jack mackerel and anchovy recruitment (P.67, P.68, P.73) in the western NP by the Japanese records. The migration can be more difficult for groundfish than pelagic fish because demersal fish habitat can be constrained by bottom topography (Li et al., 2019). This might partly explain why groundfish generally exhibit declines associated with the PCA first modes across the basin. The increase of salmon mainly occurs for Alaska and Russia, which are generally the northern limit of their habitat in the 20th century. Therefore, there is a possibility that global warming brought better condition for salmon in these areas. Indeed, Kaeriyama et al. (2014) suggested that the increase of salmon in the second half of the 20th century is strongly influenced by global warming, through the enhanced growth of age 1-year salmon in the Okhotsk Sea. Consistently, Pacific salmon catch increases have been noted on the Arctic side of Alaska since the 1990s (Carothers et al., 2019). Therefore, it is suggested that NP warming in the last several decades may have provided a better environment for some Russian and Alaskan salmon, though further temperature increase due to global warming may become harmful even for them. From the latter point of view, it is important to note that the time series of Japanese/Russian salmon decline after 1990 (Figure 3A) and that the PC1s exhibit decreasing tendency after 2000 against continuing SSTA warming (Figure 6A).
Of course, climate change influences on marine ecosystems are not limited to temperature increases, but also include ocean acidification and ocean deoxygenation. Among these two threats, the species investigated in the present study may be more strongly influenced by the ocean deoxygenation, because the primary species impacted by ocean acidification are likely the species that build calcium carbonate-based shells and other structures (e.g., Doney et al., 2009). On the other hand, the NP is an area where strong ocean deoxygenation has been documented over the last 50–60 years, as reported by recent global analyses (Ito et al., 2017; Schmidtko et al., 2017), and thus the deoxygenation can have negatively impacted marine species, especially groundfish. Indeed, Ono et al. (2001) suggested that the shoaling of the hypoxia upper boundary influenced the deepest habitat of pacific cod over the Pacific continental shelf off northeast of Japan. Oxygen changes also impacted mesopelagic and demersal fish in California Current System (Koslow et al., 2011, 2019). Ocean deoxygenation is generally caused by increased water temperature through the reduced oxygen saturation concentration at the surface and weakened circulation and mixing that supply dissolved oxygen at depth (e.g., Keeling et al., 2010). The strong oxygen decrease over the NP may be due to reduced ventilation caused by weaker cooling in the Okhotsk Sea (Nakanowatari et al., 2007). In addition, vertical displacements of isopycnal surfaces and advection on those surfaces play important roles in varying dissolved oxygen concentration in different regions of the NP (Pozo Buil and Di Lorenzo, 2017; Ito et al., 2019). Further studies are necessary to understand the mechanisms of deoxygenation over the NP basin and its influences on marine ecosystems.
These possible mechanisms suggest that groundfish may have more difficulties than pelagic fish in adjusting to the impacts of global warming. In order to understand this aspect better, we plot the depth ranges of the fish species that have significant correlations with the biological PC1s from our analyses (Figure 8). For the first PCA modes, among 17 time series of significant positive correlations 12 time series are for species with depth range shallower than 300 m, while among 20 time series of significant negative correlations 13 time series are for species with depth range deeper than 300 m. This result shows that the sign of the loadings on our ecosystem PCA modes are generally opposite for shallow and deep-water species. Consistently, the LMA in the northeast Atlantic also revealed global-warming related decline of cod and plaice but increase of herring (Brunel and Boucher, 2007). Since the disadvantageous conditions to the ground fish, i.e., bottom topography constraint for habitat and ocean deoxygenation, will not be relaxed in future, we expect that groundfish will suffer more than pelagic fish species in the warming oceans.
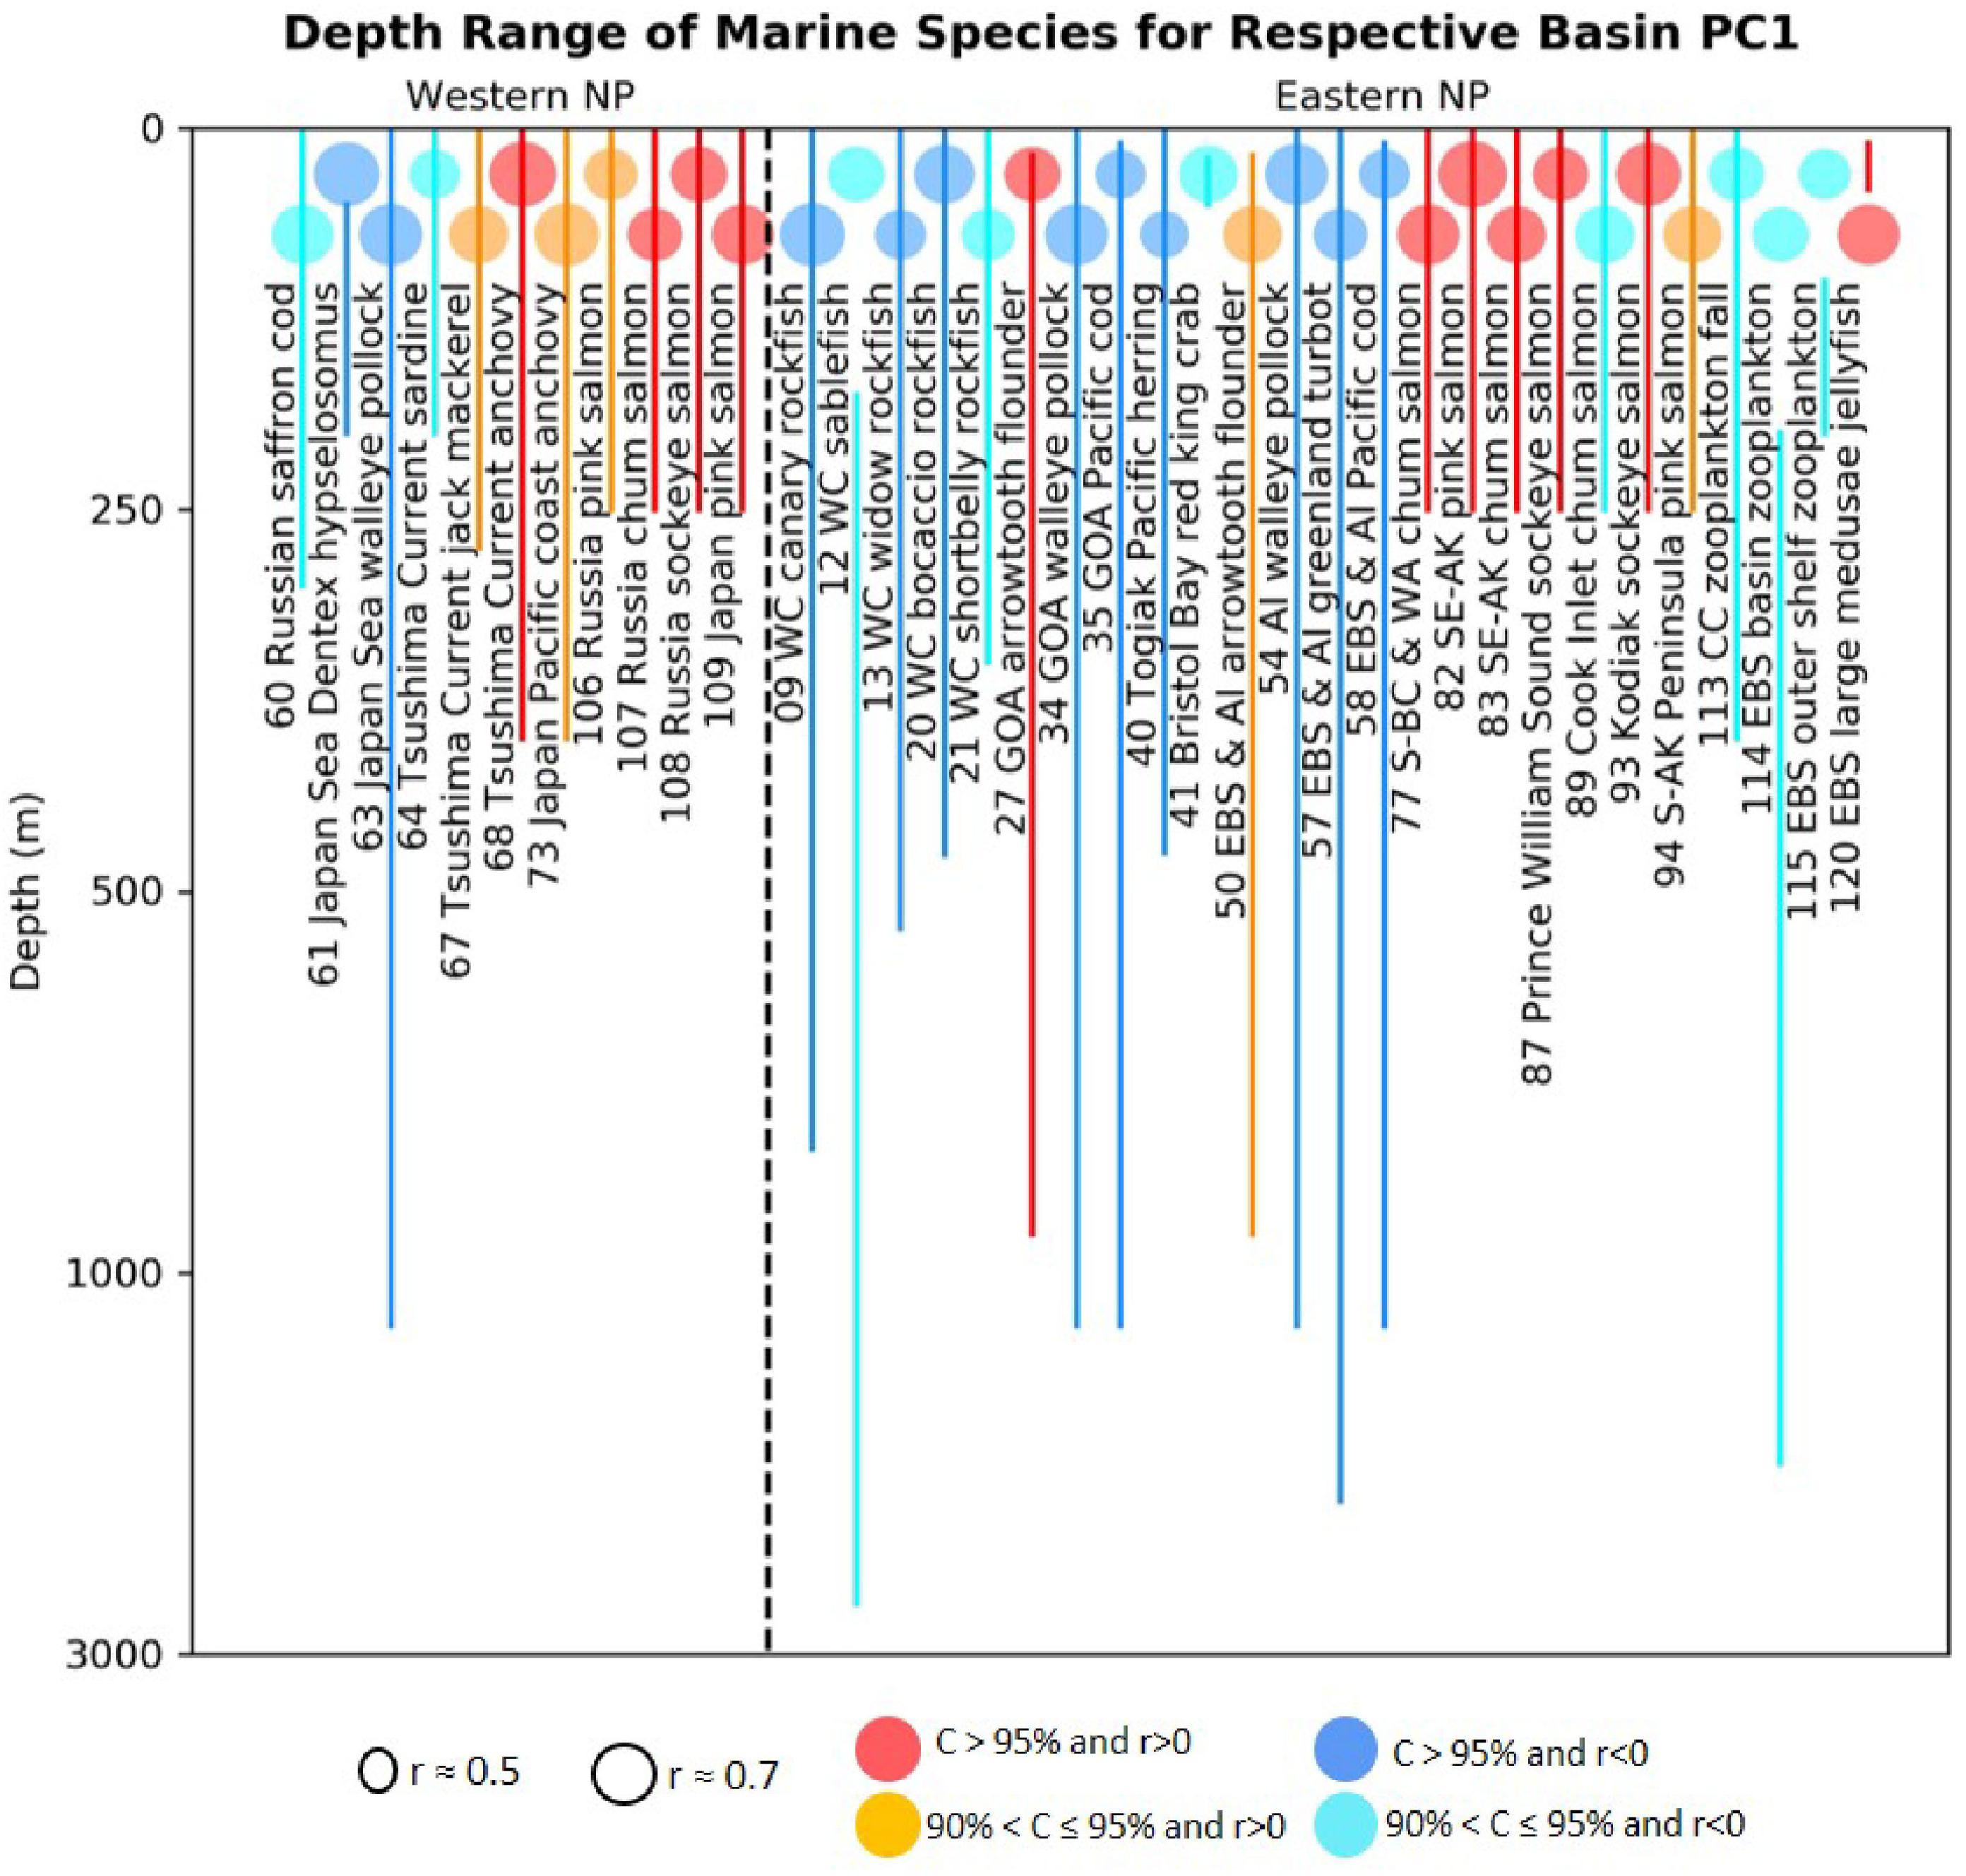
Figure 8. Depth ranges (lines) of western and eastern basin marine species that have statistically significant correlations (colored circles) with respective basin PC1s. The colored circles indicate the absolute correlations and color indicates the corresponding confidence levels as in Figure 2.
Although we consider that the first mode is mainly caused by global warming, but other anthropogenic factors such as fishing may have some influence. Recruitment and abundance, which are the main data used in the present study, are less influenced directly by fishing than fish catch data, which were used in some LMA studies. However, our data are not free from effects of fishing; for example, if a species is substantially removed by fishing, it can impact its predator and prey species. It is difficult to identify these factors from observational data analysis alone. In future, it is desirable that these factors are estimated by using mathematical or numerical models (e.g., Coll et al., 2019; Bueno-Pardo et al., 2020).
Possible Mechanisms of Zooplankton Variations
Among marine species analyzed in the present study zooplankton are important as food for other species. Thus, it is interesting to discuss what mechanisms can work on the observed zooplankton variations.
Three zooplankton biomass time series in the eastern NP, one from California Current waters (113.Z) and two from the eastern Bering Sea (114.Z, 115.Z), were highly correlated with the eastern NP PC1, which is suggested to be influenced by warming ocean temperatures. For California Current waters, Roemmich and McGowan (1995) reported that a substantial decline of zooplankton associated with warming of a surface layer from the 1950s to the 1990s. The warmed surface water enhances stratification, which in turn reduces the upwelling resulting in weakened productivity due to the reduced upwelled nutrients. Our result shows that the California Current zooplankton stayed low level except for a positive spike 2003 (Supplementary Figure 2f). If the hypothesis of Roemmich and McGowan (1995) is true, the decline of California Current zooplankton is an aspect of marine ecosystem response to the global warming discussed in the previous subsection. For the eastern Bering Sea, Sugimoto and Tadokoro (1997) reported an increase in zooplankton biomass in the 1960s and 1970s relative to the preceding decade, and a decline from the 1970s to the 1990s (when the records they examined end). They suggested that on decadal timescales a bottom-up effect may be responsible for zooplankton variations.
In the western NP, summertime zooplankton biomass in Oyashio waters (119.Z) was related to the western NP PC2 (Figure 4B). The zooplankton time series is consistent with those in Tadokoro et al. (2005) and Tadokoro et al. (2009). As drivers for the zooplankton variations in Oyashio waters, predation pressure by Japanese sardine (Tadokoro et al., 2005) and surface nutrient variability via primary production (Tadokoro et al., 2009) were suggested. Ito et al. (2007) demonstrated the effect of predation pressure on zooplankton by Japanese sardine on other pelagic fish growth by using a simple box model. The decrease of other small pelagic species in the western NP PC2 was consistent with the estimates generated (Figure 4B). Furthermore, the high biomass of zooplankton in Oyashio water in the 1990s in the present study and Tadokoro et al. (2005, 2009) was also seen in zooplankton biomass in the Kuroshio-Oyashio Extension region (Chiba et al., 2013). Chiba et al. (2013) suggested that changes in advection of Kuroshio water in association with the NPGO caused the observed zooplankton biomass changes in this region (see also Di Lorenzo et al., 2008).
Summary
The LMA of marine biological time series for both the western and eastern NP basins was conducted for the first time using PCA of 120 biological time series. Marine biological PC1s both in the eastern and western NP exhibit long-term trends and are associated with overall increased Alaskan and Japanese/Russian salmon abundance and some small pelagic fish recruitment in the western NP, and decreases of groundfish recruitment across the basin and eastern NP zooplankton biomass (Figures 2, 3). This mode is closely related to NP- and G-SSTs (Figure 6A). This suggests that the first mode of the NP marine ecosystem is strongly influenced by global warming. These PC1s are consistent with biological PC1s of previous studies for the eastern NP (Hare and Mantua, 2000; Litzow and Mueter, 2014) as well as those for the western NP marginal seas (Tian et al., 2006; Ma et al., 2019), although those studies did not examine relationships with global warming. We expect that future global warming will cause more difficulties for groundfish than pelagic fish. The eastern NP PC2, characterized by multidecadal variability, was correlated positively with salmon abundance and negatively with groundfish recruitment (Figures 4C, 5C,D). On the other hand, the western NP PC2 exhibits slightly shorter timescale interdecadal variability than the eastern NP PC2 and was negatively correlated with zooplankton biomass and two small pelagic fish recruitment records around Japan. The eastern NP PC2 is the most strongly related to the PDO index (Figures 4A, 6B), while the western NP PC2 is the most closely related to the NPGO index (Figures 4A, 6C). Consequently, the present LMA provides a new and unified view for climate change and marine ecosystem variations across the western and eastern NP.
Data Availability Statement
The data analyzed in this study is subject to the following licenses/restrictions: Japanese data of fish recruitment is publically available at http://abchan.fra.go.jp/digests26/index.html (in Japanese) and other data are collected by authors. Requests to access these datasets should be directed to Nathan Mantua for United States/Canada data bmF0ZS5tYW50dWFAbm9hYS5nb3Y=.
Author Contributions
SM, NM, and ED designed the present study. NM and SI collected the data. EY and SM analyzed the data and wrote the draft manuscript. All authors discussed about the manuscript.
Funding
EY thank the Research and Innovation Science and Technology Project, Ministry of Research and Technology/National Research and Innovation Agency of Republic of Indonesia for funded her doctoral course. SM is supported by the Japan Society for the Promotion of Science (JSPS) KAKENHI (JP18H04129). SI is supported by the Japan Society for the Promotion of Science (JSPS) KAKENHI (JP18H03956).
Conflict of Interest
The authors declare that the research was conducted in the absence of any commercial or financial relationships that could be construed as a potential conflict of interest.
Acknowledgments
We thank Dr. Kazuaki Tadokoro for providing Japanese zooplankton data and Dr. Yury I. Zuenko for providing Russian Saffron cod data, Dr. Megan M. Stachura for organizing the biological time series data, and Dr. Will Satterthwaite for his helpful comments on a draft of the manuscript. We also thank two reviewers for their constructive comments.
Supplementary Material
The Supplementary Material for this article can be found online at: https://www.frontiersin.org/articles/10.3389/fmars.2020.578165/full#supplementary-material
References
Amaya, D. J. (2019). The Pacific Meridional Mode and ENSO: a review. Curr. Clim. Change Rep. 5, 296–307. doi: 10.1007/s40641-019-00142-x
Beamish, R. J., and Bouillon, D. R. (1993). Pacific salmon production trends in relation to climate. Can. J. Fish. Aquat. Sci. 50, 1002–1016. doi: 10.1139/f93-116
Beamish, R. J., Noakes, D. J., McFarlane, G. A., Klyashtorin, L., Ivanov, V. V., Kurashov, V., et al. (1999). The regime concept and natural trends in the production of Pacific Salmon. Can. J. Fish. Aquat. Sci. 56, 516–526. doi: 10.1139/f98-200
Bindoff, N. L., Cheung, W. W. L., Kairo, J. G., Arístegui, J., Guinder, V. A., Hallberg, R., et al. (2019). “Changing ocean, marine ecosystems, and dependent communities,” in IPCC Special Report on the Ocean and Cryosphere in a Changing Climate, eds H.-O. Pörtner, D. C. Roberts, V. Masson-Delmotte, P. Zhai, M. Tignor, E. Poloczanska, et al. (Geneva: IPCC).
Bond, N. A., Overland, J. E., Spillane, M., and Stabeno, P. (2003). Recent shifts in the State of the North Pacific. Geophys. Res. Lett. 30:2183. doi: 10.1029/2003gl018597
Brander, K. M. (2007). Global fish production and climate change. Proc. Natl. Acad. Sci. U.S.A. 104, 709–719.
Brunel, T., and Boucher, J. (2007). Long-term trends in fish recruitment in the north-east Atlantic related to climate change. Fish. Oceanogr. 16, 336–349. doi: 10.1111/j.1365-2419.2007.00435.x
Bueno-Pardo, J., Petitgas, P., Kay, S., and Huret, M. (2020). Integration of bioenergetics in an individual-based model to hindcast anchovy dynamics in the Bay of Biscay. ICES J. Mar. Sci. 77, 655–667. doi: 10.1093/icesjms/fsz239
Carothers, C., Sformo, T. L., Cotton, S., George, J. C., and Westley, P. A. H. (2019). Pacific salmon in the rapidly changing arctic: exploring local knowledge and emerging fisheries in Utqiaġvik and Nuiqsut, Alaska. Arctic 72, 273–288. doi: 10.14430/arctic68876
Chavez, F. P., Ryan, J., Lluch-Cota, S. E., and Niquen, M. (2003). From anchovies to sardines and back: multidecadal change in the Pacific Ocean. Science 299, 217–221. doi: 10.1126/science.1075880
Chiba, S., Lorenzo, E. D., Davis, A., Keister, J. E., Taguchi, B., Sasai, Y., et al. (2013). Large-scale climate control of zooplankton transport and biogeography in the kuroshio-oyashio extension region. Geophys. Res. Lett. 40, 5182–5187. doi: 10.1002/grl.50999
Coll, M., Albo-Puigserver, M., Navarro, J., Palomera, I., and Dambacher, J. (2019). Who is to blame? Plausible pressures on small pelagic fish population changes in the northwestern Mediterranean Sea. Mar. Ecol. Prog. Ser. 617-618, 277–294. doi: 10.3354/meps12591
Di Lorenzo, E., Combes, J. E., Keister, P. T., Strub, A. C., Thomas, P. J. S., Franks, M. D., et al. (2008). Synthesis of pacific ocean climate and ecosystem dynamics. Oceanography 26, 68–81. doi: 10.5670/oceanog.2013.76
Di Lorenzo, E., Schneider, N., Cobb, K. M., Franks, P. J. S., Chhak, K., Miller, A. J., et al. (2008). North Pacific gyre oscillation links ocean climate and ecosystem change. Geophys. Res. Lett. 35, 1–6. doi: 10.1029/2007gl032838
Doney, S. C., Fabry, V. J., Feely, R. A., and Kleypas, J. A. (2009). Ocean acidification: the other CO2Problem. Annu. Rev. Mar. Sci. 1, 169–192. doi: 10.1146/annurev.marine.010908.163834
Ebbesmeyer, C. C., Cayan, D. R., Mclain, D. R., Nichols, F. H., Peterson, D., Redmond, K., et al. (1991). “1976 step in the pacific climate: forty environmental changes between 1968-1975 and 1977-1984,” in Proceedings of the Seventh Annual Pacific Climate (PACLIM) Workshop, 10-13 April 1990, (Pacific Grove, CA: Asilomar Conference Center).
Francis, R. C., and Hare, S. R. (1994). Decadal-scale regime shifts in the large marine ecosystems of the north-east pacific: a case for historical science. Fish. Oceanogr. 3, 279–291. doi: 10.1111/j.1365-2419.1994.tb00105.x
Hare, S. R., and Mantua, N. J. (2000). Empirical Evidence for North Pacific Regime Shifts in 1977 and 1989. Prog. Oceanogr. 47, 103–145. doi: 10.1016/s0079-6611(00)00033-1
Hare, S. R., Mantua, N. J., and Francis, R. C. (1999). Inverse production regimes: Alaska and West Coast Pacific Salmon. Fisheries 24, 6–14. doi: 10.1577/1548-8446(1999)024<0006:ipr>2.0.co;2
Hirahara, S., Ishii, M., and Fukudaet, Y. (2014). Centennial-scale sea surface temperature analysis and its uncertainty. J. Clim. 27, 57–75. doi: 10.1175/jcli-d-12-00837.1
Hoff, G. R. (2006). Biodiversity as an index of regime shift in the eastern Bering Sea. Fish. Bull. 104, 226–237.
Ito, S.-I., Megrey, B. A., Kishi, M. J., Mukai, D., Kurita, Y., Ueno, Y., et al. (2007). On the interannual variability of the growth of Pacific saury (Cololabis saira): a simple 3-box model using NEMURO.FISH. Ecol. Model. 202, 174–183. doi: 10.1016/j.ecolmodel.2006.07.046
Ito, T., Long, M. C., Deutsch, C., Minobe, S., and Sun, D. (2019). Mechanisms of low-frequency oxygen variability in the North Pacific. Glob. Biogeochem. Cycles 33, 110–124. doi: 10.1029/2018gb005987
Ito, T., Minobe, S., Long, M. C., and Deutsch, C. (2017). Upper Ocean O2 trends: 1958–2015. AGU J. 44, 4214–4223. doi: 10.1002/2017GL073613
Japan Fisheries Agency, and Fisheries Research Agency (2015). Marine Fisheries Stock Assessment and Evaluation for Japanese Waters (fiscal year 2014/2015). Available online at: http://abchan.fra.go.jp/digests26/index.html (accessed October 25, 2020).
Joh, Y., and Di Lorenzo, E. (2017). Increasing coupling between NPGO and PDO leads to prolonged marine heatwaves in the Northeast Pacific. Geophys. Res. Lett. 44, 11,663–11,671. doi: 10.1002/2017gl075930
Kaeriyama, M., Seo, H., and Qin, Y.-X. (2014). Effect of global warming on the life history and population dynamics of Japanese Chum Salmon. Fish. Sci. 80, 251–260. doi: 10.1007/s12562-013-0693-7
Kawasaki, T., and Omori, M. (1995). Possible mechanisms underlying fluctuations in the far eastern sardine population inferred from time series of two biological traits. Fish. Oceanogr. 4, 238–242. doi: 10.1111/j.1365-2419.1995.tb00147.x
Kay, S. M. (1988). Modern Spectral Estimation: Theory and Application. Englewood Cliffs, NJ: Prentice-Hall.
Keeling, R. F., Körtzinger, A., and Gruber, N. (2010). Ocean Deoxygenation in a Warming World. Annu. Rev. Mar. Sci. 2, 199–229. doi: 10.1146/annurev.marine.010908.163855
Koslow, J., Goericke, R., Lara-Lopez, A., and Watson, W. (2011). Impact of declining intermediate-water oxygen on deepwater fishes in the California current. Mar. Ecol. Prog. Ser. 436, 207–218. doi: 10.3354/meps09270
Koslow, J. A., Davison, P., Ferrer, E., Rosenberg, S. P. A. J., Aceves-Medina, G., and Watson, W. (2019). The evolving response of mesopelagic fishes to declining midwater oxygen concentrations in the southern and central California current. ICES J. Mar. Sci. 76, 626–638. doi: 10.1093/icesjms/fsy154
Li, L., Hollowed, A. B., Cokelet, E. D., Barbeaux, S. J., Bond, N. A., Keller, A. A., et al. (2019). Subregional differences in groundfish distributional responses to anomalous ocean bottom temperatures in the Northeast Pacific. Glob. Change Biol. 25, 2560–2575. doi: 10.1111/gcb.14676
Litzow, M. A., and Mueter, F. J. (2014). Assessing the ecological importance of climate regime shifts: an approach from the North Pacific Ocean. Prog. Oceanogr. 120, 110–119. doi: 10.1016/j.pocean.2013.08.003
Lluch-Belda, D., Crawford, R. J. M., Kawasaki, T., MacCall, A. D., Parrish, R. H., Schwartzlose, R. A., et al. (1989). World-wide fluctuations of sardine and anchovy stocks: the regime problem. S. Afr. J. Mar. Sci. 8, 195–205. doi: 10.2989/02577618909504561
Lluch-Belda, D., Schwartzlose, R. A., Serra, R., Parrish, R., Kawasaki, T., Hedgecock, D., et al. (1992). Sardine and anchovy regime fluctuations of abundance in four regions of the world oceans: a workshop report. Fish. Oceanogr. 1, 339–347. doi: 10.1111/j.1365-2419.1992.tb00006.x
Ma, S., Liu, Y., Li, J., Fu, C., Ye, Z., Sun, P., et al. (2019). Climate-induced long-term variations in ecosystem structure and atmosphere-ocean-ecosystem processes in the Yellow Sea and East China Sea. Prog. Oceanogr. 175, 183–197. doi: 10.1016/j.pocean.2019.04.008
Mantua, N. J., Hare, S. R., Zhang, Y., Wallace, J. M., and Francis, C. (1997). A pacific interdecadal climate oscillation with impacts on salmon production. Bull. Am. Meteorol. Soc. 78, 1069–1079. doi: 10.1175/1520-0477(1997)078<1069:apicow>2.0.co;2
Metz, W. (1991). Optimal relationship of large-scale flow patterns and the barotropic feedback due to high-frequency eddies. J. Atmos. Sci. 48, 1141–1159. doi: 10.1175/1520-0469(1991)048<1141:orolsf>2.0.co;2
Minobe, S. (1997). A 50-70 year climatic oscillation over the North Pacific and North America. Geophys. Res. Lett. 24, 683–686. doi: 10.1029/97gl00504
Minobe, S. (2000). Spatio-temporal structure of the pentadecadal variability over the North Pacific. Prog. Oceanogr. 47, 381–408. doi: 10.1016/s0079-6611(00)00042-2
Möllmann, C., and Diekmann, R. (2012). Marine ecosystem regime shifts induced by climate and overfishing. Adv. Ecol. Res. Glob. Change Multispecies Syst. 47, 303–347. doi: 10.1016/b978-0-12-398315-2.00004-1
Nakanowatari, T., Ohshima, K. I., and Wakatsuchi, M. (2007). Warming and oxygen decrease of intermediate water in the Northwestern North Pacific, Originating from the Sea of Okhotsk, 1955–2004. Geophys. Res. Lett. 34. doi: 10.1029/2006gl028243
Newman, M., Alexander, M. A., Ault, T. R., Cobb, K. M., and Deser, C. E. (2016). The pacific decadal oscillation, revisited. J. Clim. 29, 4399–4427. doi: 10.1175/jcli-d-15-0508.1
Newman, M., Compo, G. P., and Alexander, M. A. (2003). ENSO-forced variability of the pacific decadal oscillation. J. Clim. 16, 3853–3857. doi: 10.1175/1520-0442(2003)016<3853:evotpd>2.0.co;2
Noto, M., and Yasuda, I. (1999). Population decline of the Japanese sardine, sardinops melanostictus, in relation to sea surface temperature in the kuroshio extension. Can. J. Fish. Aquat. Sci. 56, 973–983. doi: 10.1139/f99-028
Ono, T., Midorikawa, T., Watanabe, Y. W., Tadokoro, K., and Saino, T. (2001). Temporal increases of phosphate and apparent oxygen utilization in the subsurface waters of western subarctic pacific from 1968 to 1998. Geophys. Res. Lett. 28, 3285–3288. doi: 10.1029/2001gl012948
Pinsky, M. L., Worm, B., Fogarty, M. J., Sarmiento, J. L., and Levin, S. A. (2013). Marine taxa track local climate velocities. Science 341, 1239–1242. doi: 10.1126/science.1239352
Poloczanska, E. S., Burrows, M. T., Brown, C. J., Molinos, J. C., Halpern, B. S., Guldberg, O. H., et al. (2016). Responses of marine organisms to climate change across Oceans. Front. Mar. Sci. 3:62. doi: 10.3389/fmars.2016.00062
Pozo Buil, M., and Di Lorenzo, E. (2017). Decadal dynamics and predictability of oxygen and subsurface tracers in the california current system. Geophys. Res. Lett. 44, 4204–4213. doi: 10.1002/2017gl072931
Pyper, B. J., and Peterman, R. M. (1998). Comparison of methods to account for autocorrelation in correlation analyses of fish data. Can. J. Fish. Aquat. Sci. 55, 2127–2140. doi: 10.1139/f98-104
Roemmich, D., and McGowan, J. (1995). Climatic warming and the decline of zooplankton in the california current. Science 267, 1324–1326. doi: 10.1126/science.267.5202.1324
Schmidtko, S., Stramma, L., and Visbeck, M. (2017). Decline in Global Oceanic Oxygen Content during the Past Five Decades. Berlin: Nature Publishing Group.
Sugimoto, T., and Tadokoro, K. (1997). Interannual-interdecadal variations in zooplankton biomass, chlorophyll concentration and physical environment in the Subarctic Pacific and Bering Sea. Fish. Oceanogr. 6, 74–93. doi: 10.1046/j.1365-2419.1997.00031.x
Tadokoro, K., Chiba, S., Ono, T., Midorikawa, T., and Saino, T. (2005). Interannual variation in neocalanus biomass in the oyashio waters of the Western North Pacific. Fish. Oceanogr. 14, 210–222. doi: 10.1111/j.1365-2419.2005.00333.x
Tadokoro, K., Ono, T., Yasuda, I., Osafune, S., Shiomoto, A., Sugisaki, H., et al. (2009). Possible mechanisms of decadal-scale variation in PO4 concentration in the Western North Pacific. Geophys. Res. Lett. 36. doi: 10.1029/2009gl037327
Thompson, D. W. J., and Wallace, J. M. (1998). The arctic oscillation signature in the wintertime geopotential height and temperature fields. Geophys. Res. Lett. 25, 1297–1300. doi: 10.1029/98gl00950
Tian, Y., Kidokoro, H., and Watanbe, T. (2006). Long-term changes in the fish community structure from the tsushima warm current region of the Japan/East Sea with an emphasis on the impacts of fishing and climate regime shift over the last four decades. Prog. Oceanogr. 68, 217–237. doi: 10.1016/j.pocean.2006.02.009
Trenberth, K. E., and Hurrell, J. W. (1994). Decadal atmosphere-ocean variations in the Pacific. Clim. Dyn. 9, 303–319. doi: 10.1007/bf00204745
Ventura, V., Paciorek, C. J., and Risbey, J. S. (2004). Controlling the proportion of falsely rejected hypotheses when conducting multiple tests with climatological data. J. Clim. 17, 4343–4356. doi: 10.1175/3199.1
von Storch, H., and Zwiers, F. (2012). Testing ensembles of climate change scenarios for ‘statistical significance.’. Clim. Change 117, 1–9. doi: 10.1007/s10584-012-0551-0
Vimont, D. J., Wallace, J. M., and Battisti, D. S. (2003). The seasonal footprinting mechanism in the Pacific: Implications for ENSO. J. Climate 16, 2668–2675. doi: 10.1175/1520-0442(2003)016<2668:TSFMIT>2.0.CO;2
Wilks, D. (2016). “The stippling shows statistically significant grid points”: how research results are routinely overstated and over-interpreted, and what to do about it. Bull. Am. Meteorol. Soc. 97, 2263–2273. doi: 10.1175/bams-d-15-00267.1
Wolter, K., and Timlin, M. S. (2011). El Niño/southern oscillation behaviour since 1871 as diagnosed in an extended multivariate enso index (MEI.ext). Int. J. Climatol. 31, 1074–1087. doi: 10.1002/joc.2336
Yasuda, I., Sugisaki, H., Watanabe, Y., Minobe, S. S., and Oozeki, Y. (1999). Interdecadal variations in Japanese sardine and ocean/climate. Fish. Oceanogr. 8, 18–24. doi: 10.1046/j.1365-2419.1999.00089.x
Yasunaka, S., and Hanawa, K. (2002). Regime Shifts Found in the Northern Hemisphere SST Field. J. Meteorol. Soc. Jpn. 80, 119–135. doi: 10.2151/jmsj.80.119
Zhang, Y., Wallace, J. M., and Battisti, D. S. (1997). ENSO-like interdecadal variability: 1900–93. J. Climate 10, 1004–1020. doi: 10.1175/1520-0442(1997)010<1004:ELIV>2.0.CO;2
Keywords: marine ecosystem, decadal climate variability, global warming, North Pacific, regime shift
Citation: Yati E, Minobe S, Mantua N, Ito S and Di Lorenzo E (2020) Marine Ecosystem Variations Over the North Pacific and Their Linkage to Large-Scale Climate Variability and Change. Front. Mar. Sci. 7:578165. doi: 10.3389/fmars.2020.578165
Received: 30 June 2020; Accepted: 12 October 2020;
Published: 05 November 2020.
Edited by:
Athanassios C. Tsikliras, Aristotle University of Thessaloniki, GreeceReviewed by:
Michael Adam Alexander, National Oceanic and Atmospheric Administration (NOAA), United StatesBrett W. Molony, Oceans and Atmosphere (CSIRO), Australia
Copyright © 2020 Yati, Minobe, Mantua, Ito and Di Lorenzo. This is an open-access article distributed under the terms of the Creative Commons Attribution License (CC BY). The use, distribution or reproduction in other forums is permitted, provided the original author(s) and the copyright owner(s) are credited and that the original publication in this journal is cited, in accordance with accepted academic practice. No use, distribution or reproduction is permitted which does not comply with these terms.
*Correspondence: Shoshiro Minobe, bWlub2JlQHNjaS5ob2t1ZGFpLmFjLmpw