 Alan Williams1*
 Franziska Althaus1
 Kylie Maguire1
 Mark Green1
 Candice Untiedt1
 Phil Alderslade1
 Malcolm R. Clark2
 Nicholas Bax1,3
 Thomas A. Schlacher4†
- 1CSIRO Oceans and Atmosphere, Hobart, TAS, Australia
- 2National Institute of Water and Atmospheric Research (NIWA), Wellington, New Zealand
- 3Institute for Marine and Antarctic Science, University of Tasmania, Hobart, TAS, Australia
- 4School of Science and Engineering, University of the Sunshine Coast, Maroochydore, QLD, Australia
Environmental harm to deep-sea coral reefs on seamounts is widely attributed to bottom trawl fishing. Yet, accurate diagnoses of impacts truly caused by trawling are surprisingly rare. Similarly, comprehensive regional assessments of fishing damage rarely exist, impeding evaluations of, and improvements to, conservation measures. Here we report on trawling impacts to deep-sea scleractinian coral reefs in a regional (10–100s of km) fishery seascape off Tasmania (Australia). Our study was based on 148 km of towed camera transects (95 transects on 51 different seamounts with 284,660 separate video annotations and 4,674 “on-seamount” images analysed), and commercial trawling logbook data indexing fishing effort on and around seamounts. We detect trawling damage on 88% (45 of 51) of seamounts. Conversely, intact deep-sea coral reefs persist in refuge areas on about 39% (20 of 51) of the seamounts, and extend onto rocky seabed adjacent to seamounts. Depth significantly shapes the severity of trawl damage. The most profound impacts are evident on shallow seamounts (those peaking in < 950 m depths) where recent and repeated trawling reduced reefs built by scleractinian corals to rubble, forming extensive accumulations around seamount peaks and flanks. At intermediate depths (∼950–1,500 m), trawling damage is highly variable on individual seamounts, ranging from substantial impacts to no detection of coral loss. Deep seamounts (summit depth > 1,500 m) are beyond the typical operating depth of the trawl fishery and exceed the depth range of living deep-sea coral reefs in the region. Accurately diagnosing the nature and extent of direct trawling impacts on seamount scleractinian coral reefs must use stringent criteria to guard against false positive identifications of trawl impact stemming from either (1) misidentifying areas that naturally lacked deep-sea coral reef as areas where coral had been removed, or (2) attributing trawling as the cause of natural processes of reef degradation. The existence of sizeable deep-sea coral reef refuges in a complex mosaic of spatially variable fishing effort suggests that more nuanced approaches to conservation may be warranted than simply protecting untrawled areas, especially when the biological resources with conservation value are rare in a broader seascape context.
Introduction
Undersea mountains, or seamounts (including knolls and hills after Pitcher et al., 2007), create spectacularly rugged underwater landscapes throughout the world’s oceans (Clark et al., 2010b; Schlacher et al., 2010). These deep mountains also form unique habitats for a rich biodiversity of deep-sea fauna (Rowden et al., 2010b, a; Schlacher et al., 2014). This biodiversity is, however, frequently under threat from human activities, particularly from deep-water fishing using trawls operated on the seafloor (Clark et al., 2016a).
Seamounts off Tasmania, Australia, provide a model habitat system to examine environmental harm to iconic ecosystems in the deep ocean. Seamounts in the area support a diverse fauna (Koslow et al., 2001) associated with deep-sea reefs formed by the scleractinian coral Solemosmilia variabilis Ducan, 1873. These deep-sea coral reef communities are vulnerable to physical harm from bottom-contact trawling (Althaus et al., 2009; Clark and Rowden, 2009) and constitute vulnerable marine ecosystems (VME) (FAO, 2009) where extensive areas of live corals are present (Williams et al., 2020). The seamount fauna in this region has a documented history of impact from a deep-sea bottom trawl fishery (Koslow et al., 2001; Althaus et al., 2009). The fishery operating on and near the region’s seamounts primarily targets orange roughy (Hoplostethus atlanticus Collette, 1889), a widespread species at mid-continental slope depths that is commonly the target of deep-sea fisheries (Clark et al., 2010a). The broad-scale intensity and distribution of trawling effort can be gauged from logbooks (i.e., commercial fishers must record the location and depth of every trawling operation).
The vulnerability of this seamount fauna to the impacts of trawling was recognised a decade or so after the fishery commenced, and an interim protected area containing several of the deeper seamounts was established, with support from the fishing industry, in 1995. A scientific survey in 1997 (Koslow et al., 2001) found that benthic biodiversity was rich and novel, and that trawling had dramatically reduced both species richness and biomass on many shallower seamounts. Further, it has been widely cited that the trawl operations removed the living and dead reef aggregate of the “framework-building” scleractinian coral, Solenosmilia variabilis, from the shallow and most heavily fished seamounts. A better understanding of the seamount biodiversity values, and increased concern about the scale of impact upon them, resulted in many seamounts off southern Tasmania being incorporated into marine parks in 2007 (Director of National Parks, 2013). A survey of the area a decade later, using better image-based sampling tools and improved geolocation of images (Althaus et al., 2009; Williams et al., 2010), showed ecological changes on heavily-trawled seamounts in the form of substantial reductions in coral cover and significantly lower species of benthic taxa. On seamounts in marine parks where trawling had ceased, there was no clear signal of deep-sea coral reef recovery after 5–10 years (Althaus et al., 2009; Williams et al., 2010). Despite these efforts, and the significant conservation measures put in place, large areas of the continental slope and many seamount features in the region remained unsampled; this severely limited our ability to evaluate trawling impacts at a regional scale.
The large area and wide depth range used by the regional fishery was mismatched by a small and scattered body of data on biological resources potentially vulnerable to trawling. In addition, we lacked a robust framework to accurately diagnose changes to corals caused by trawling and distinguish these from natural processes affecting coral reefs in the deep sea. Consequently, our main objectives are threefold: (1) document the diversity of impact types on deep-sea reefs composed of scleractinian corals; (2) develop and test a suite of diagnostic indicators to reliably detect and attribute changes to reefs caused by trawling; and (3) map impacts of trawling in a regional fishery seascape that is highly heterogeneous both in terms of seafloor features and the spatial footprint of trawling intensity. We examine new data on the distribution and condition of deep-sea coral reefs, collected over a significantly greater area at much denser coverage, using data from 95 towed-camera transects on 51 different seamounts. We use this extensive empirical field information on observed impacts to develop a set of indicators to diagnose the type and level of coral damage attributable to trawling. Finally, compound measures of impact are aggregated for individual seamounts, and, when combined with mapped trawling effort data from commercial trawling logbooks, provide a regional picture of the condition of deep-sea coral reefs. These are critical components of understanding the impact of bottom trawling on benthic communities and hence to inform robust fisheries management and environmental conservation.
Materials and Methods
Study Area
The study area lies off the east and south coasts of Tasmania, Australia. Here, 191 geomorphologically distinct volcanic seamounts on the continental slope peak in approximately 570 to 2,400 m depths (Figure 1). The seamount features range in size from ∼20 to <0.2 km2 base area, but are mostly small: 133 (70%) are <2 km2; those studied by us for this paper peak between 575 and 1,500 m depths and have elevations to 550 m.
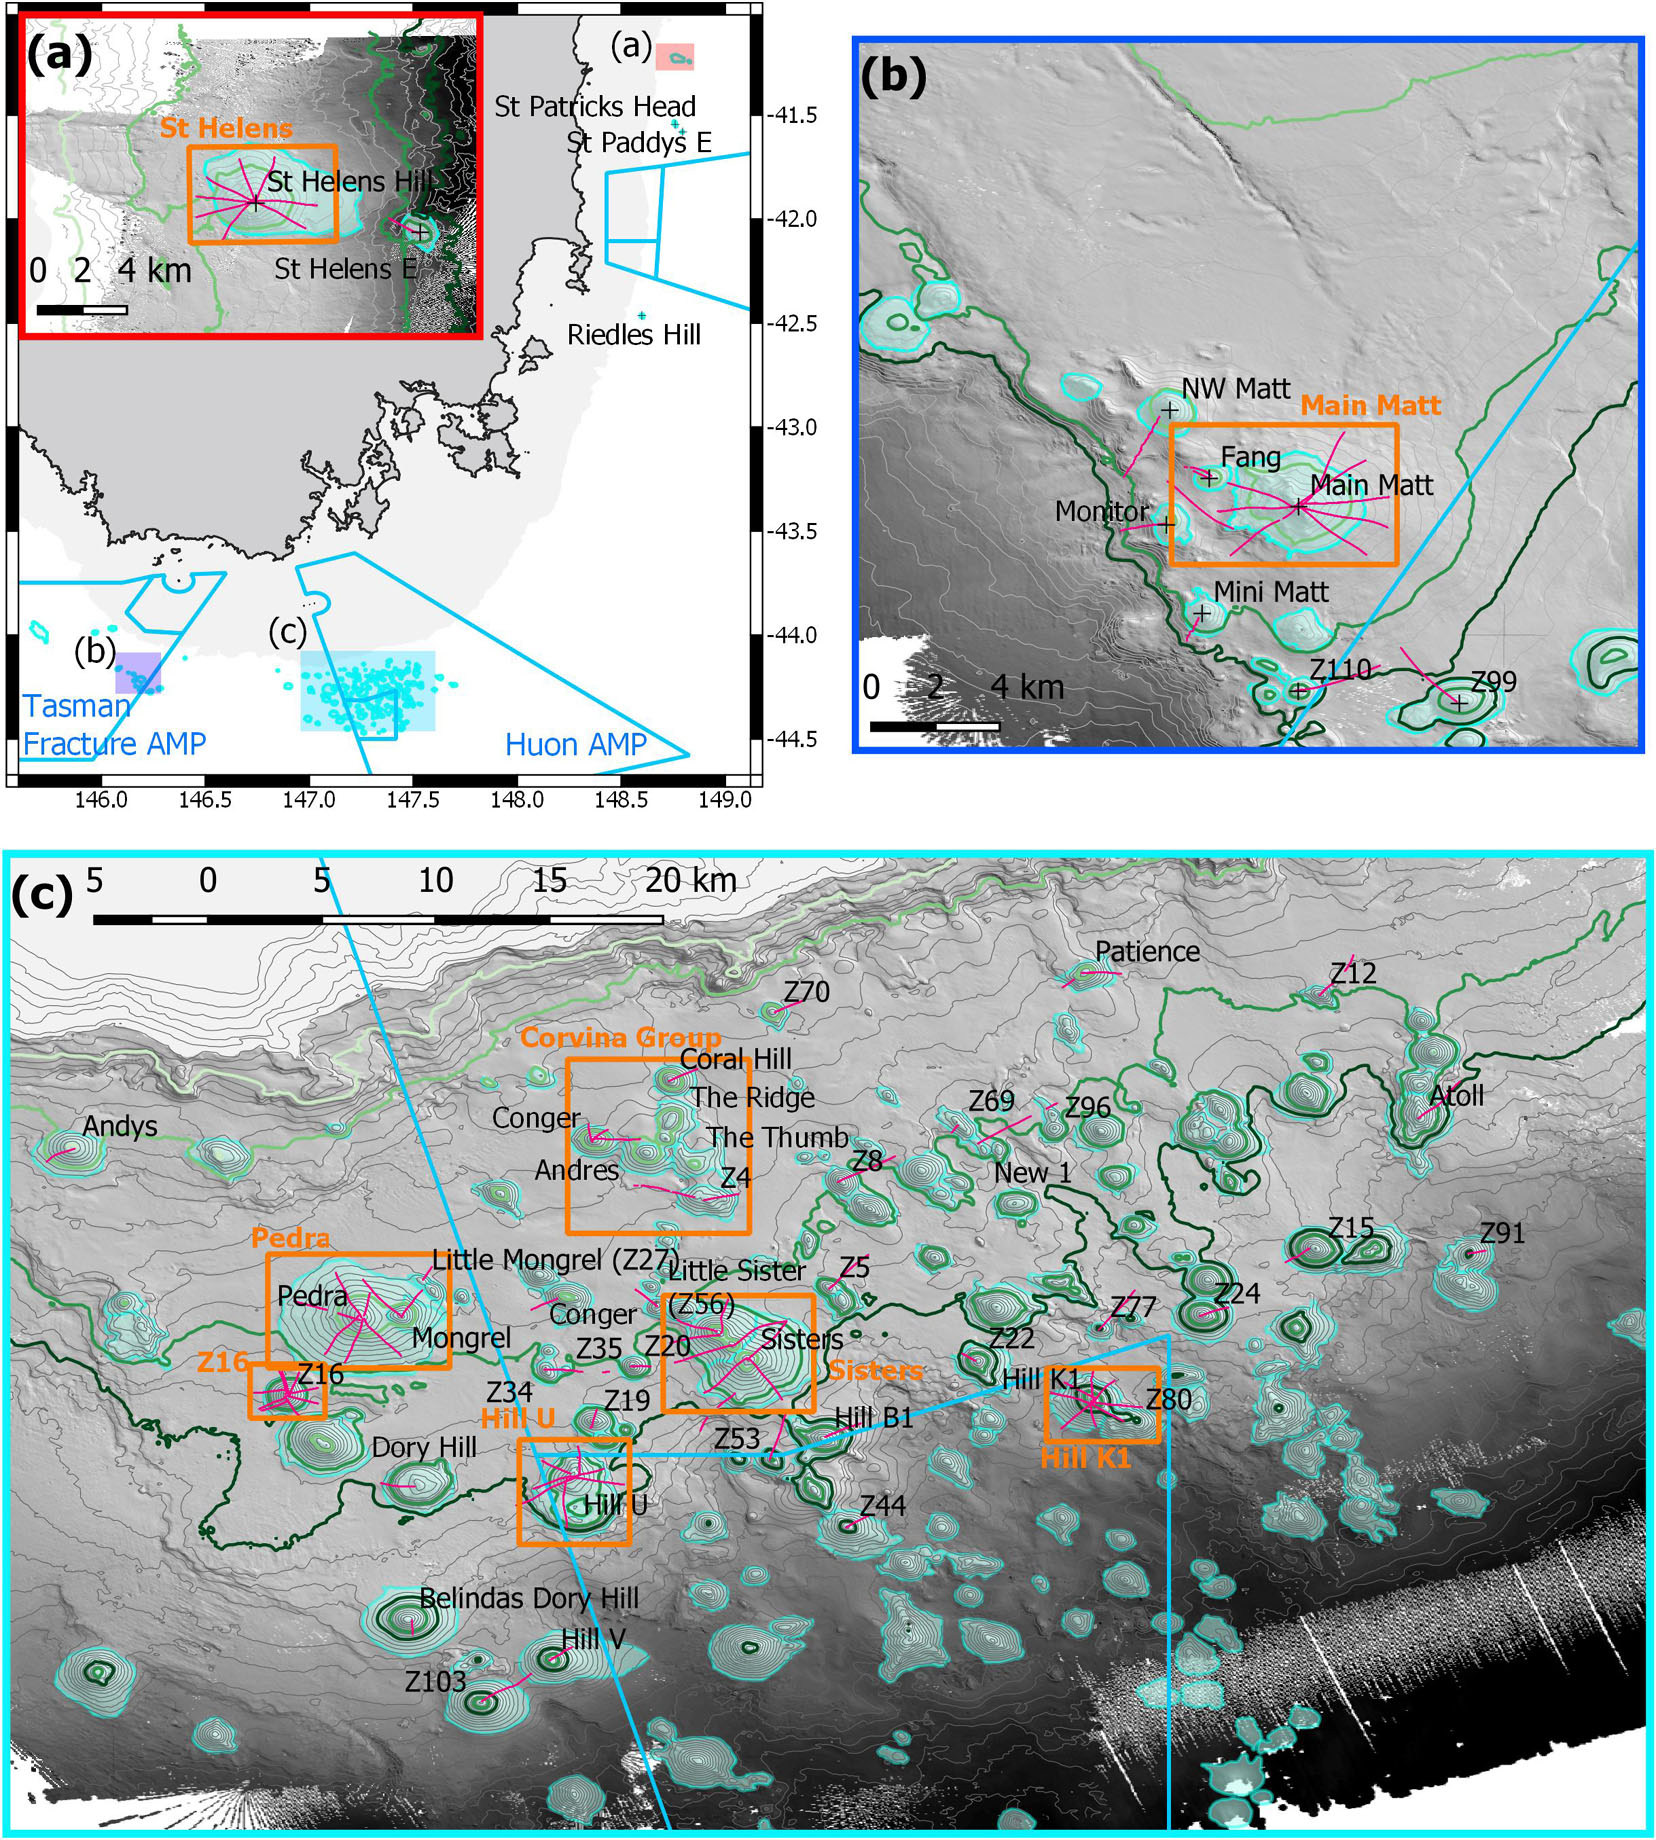
Figure 1. Map of study area off eastern and southern Tasmania, Australia, showing locations and names of study sites, camera transects (pink lines), eight Focal areas with relatively higher sampling intensity (orange boxes), and the Australian Marine Park (AMP) boundaries (light blue): (a) overview map showing the relative locations of the three study areas and a 0–500 m depths mask (grey), with inset showing sites at the St Helens Seamount and one adjacent seamount; (b) sites in and adjacent to the Tasman Fracture AMP; (c) sites in and adjacent to the Huon AMP. Depth contours are 50 m intervals with 650, 950, 1,350, and 1,500 m contour lines highlighted as light to dark green; the seamounts are outlined by their base boundaries (cyan).
Most data used in this analysis come from a voyage in late 2018 (CSIRO MNF RV Investigator voyage 2018_V06), supplemented with data from additional seamounts in the same area collected in 2006/07 (CSIRO FRV Southern Surveyor voyages SS200611 and SS200702) (see Althaus et al., 2009). All surveys used a towed camera to take video and paired still images along transects that were typically 2 km in length. We attempted to sample a broad range of seamount attributes in terms of depth, size, and degree of exposure to bottom trawl fishing. The 2018 transects were located using a flexible spatially-balanced design (Foster et al., 2019) and were of two types: (1) randomised radial transects on eight “Focal” seamounts (St Helens, Main Matt, Pedra, Sisters, the Corvina Group, Z16, Hill U and Hill K1) that represented a contrast of historical trawling exposure (57 transects); and (2) randomised “baseline” transects that crossed slope and seamount habitats (33 transects). We also opportunistically sampled 25 “ad hoc” transects that were completed during vessel transits among stations sampled under criteria one and two. The present analysis includes focal, baseline and ad hoc transects, but includes only transects that intersect seamount features (total 95 transects–57, 17 and 21, respectively). Three sites and one Focal area (St Helens) are located on the Tasmanian east coast (Figure 1a); the majority of sites, and the other seven Focal areas (Main Matt, Pedra, Z16, Corvina Group, Hill U, Sisters, and Hill K1), are within the “Tasmanian Seamounts” area that lies within and between the Huon and Tasman Fracture Australian Marine Parks (AMP) on the south coast (Figures 1b,c). Six of these seven Focal areas contain individual seamounts, although Pedra has a parasitic cone (Mongrel) and Main Matt has a second peak (NW Matt); the Corvina Group has six inter-connected seamounts, three of which were sampled (Figure 1c).
Data Collection
The towed camera system used in 2018 was similar to that used in 2006/07 (detailed in Althaus et al., 2009). It incorporated a Canon EOS-1DX video camera that provided continuous HD video imagery and a calibrated pair of Canon EOS-1DX Mark II still cameras that provided image pairs at 5 s intervals (Marouchos et al., 2017). The system was towed at a speed of 1 knot (0.5 ms–1) and maintained at a height of 2 m (±1.5 m) above the seafloor by a remote pilot guided by camera vision and sensor data transmitted back to the vessel in real-time. An Ultra Short Baseline (USBL) beacon recorded the location of the camera system. All pairs of still images were individually aligned with the video, and all imagery (∼200 km of linear video track and 49,035 high resolution still image pairs), and post-processed data from the USBL beacon and other camera sensors, were was registered into the Video Annotation and Reference System (VARS) developed by the Monterey Bay Aquarium Research Institute (Schlining and Jacobsen Stout, 2006). The VARS platform enabled annotation and georeferencing of imagery to approximately + 5 m using post-processed data from the USBL beacon.
A mix of data from video and still images were systematically scored in the laboratory to characterise seamount substrata, coral distributions and to identify impacts (see below). We scored all video footage covering full transects (total length 148 km) at 1 s intervals, yielding 284,660 separate annotations. A spatially-balanced random selection process (Robertson et al., 2013) was used to subsample ∼10% of the stills from each transect for annotation. Transects were then clipped to the base of each seamount to retain only the “on-seamount” images for analysis; the base of each seamount was defined using a rate of change of slope contour (where slope changed from <1 to >1 degree). The final data set analysed represented 93 transects on 51 different seamounts (40 surveyed in 2018 and 11 in 2006/07) and comprised 4,674 images (Table 1).
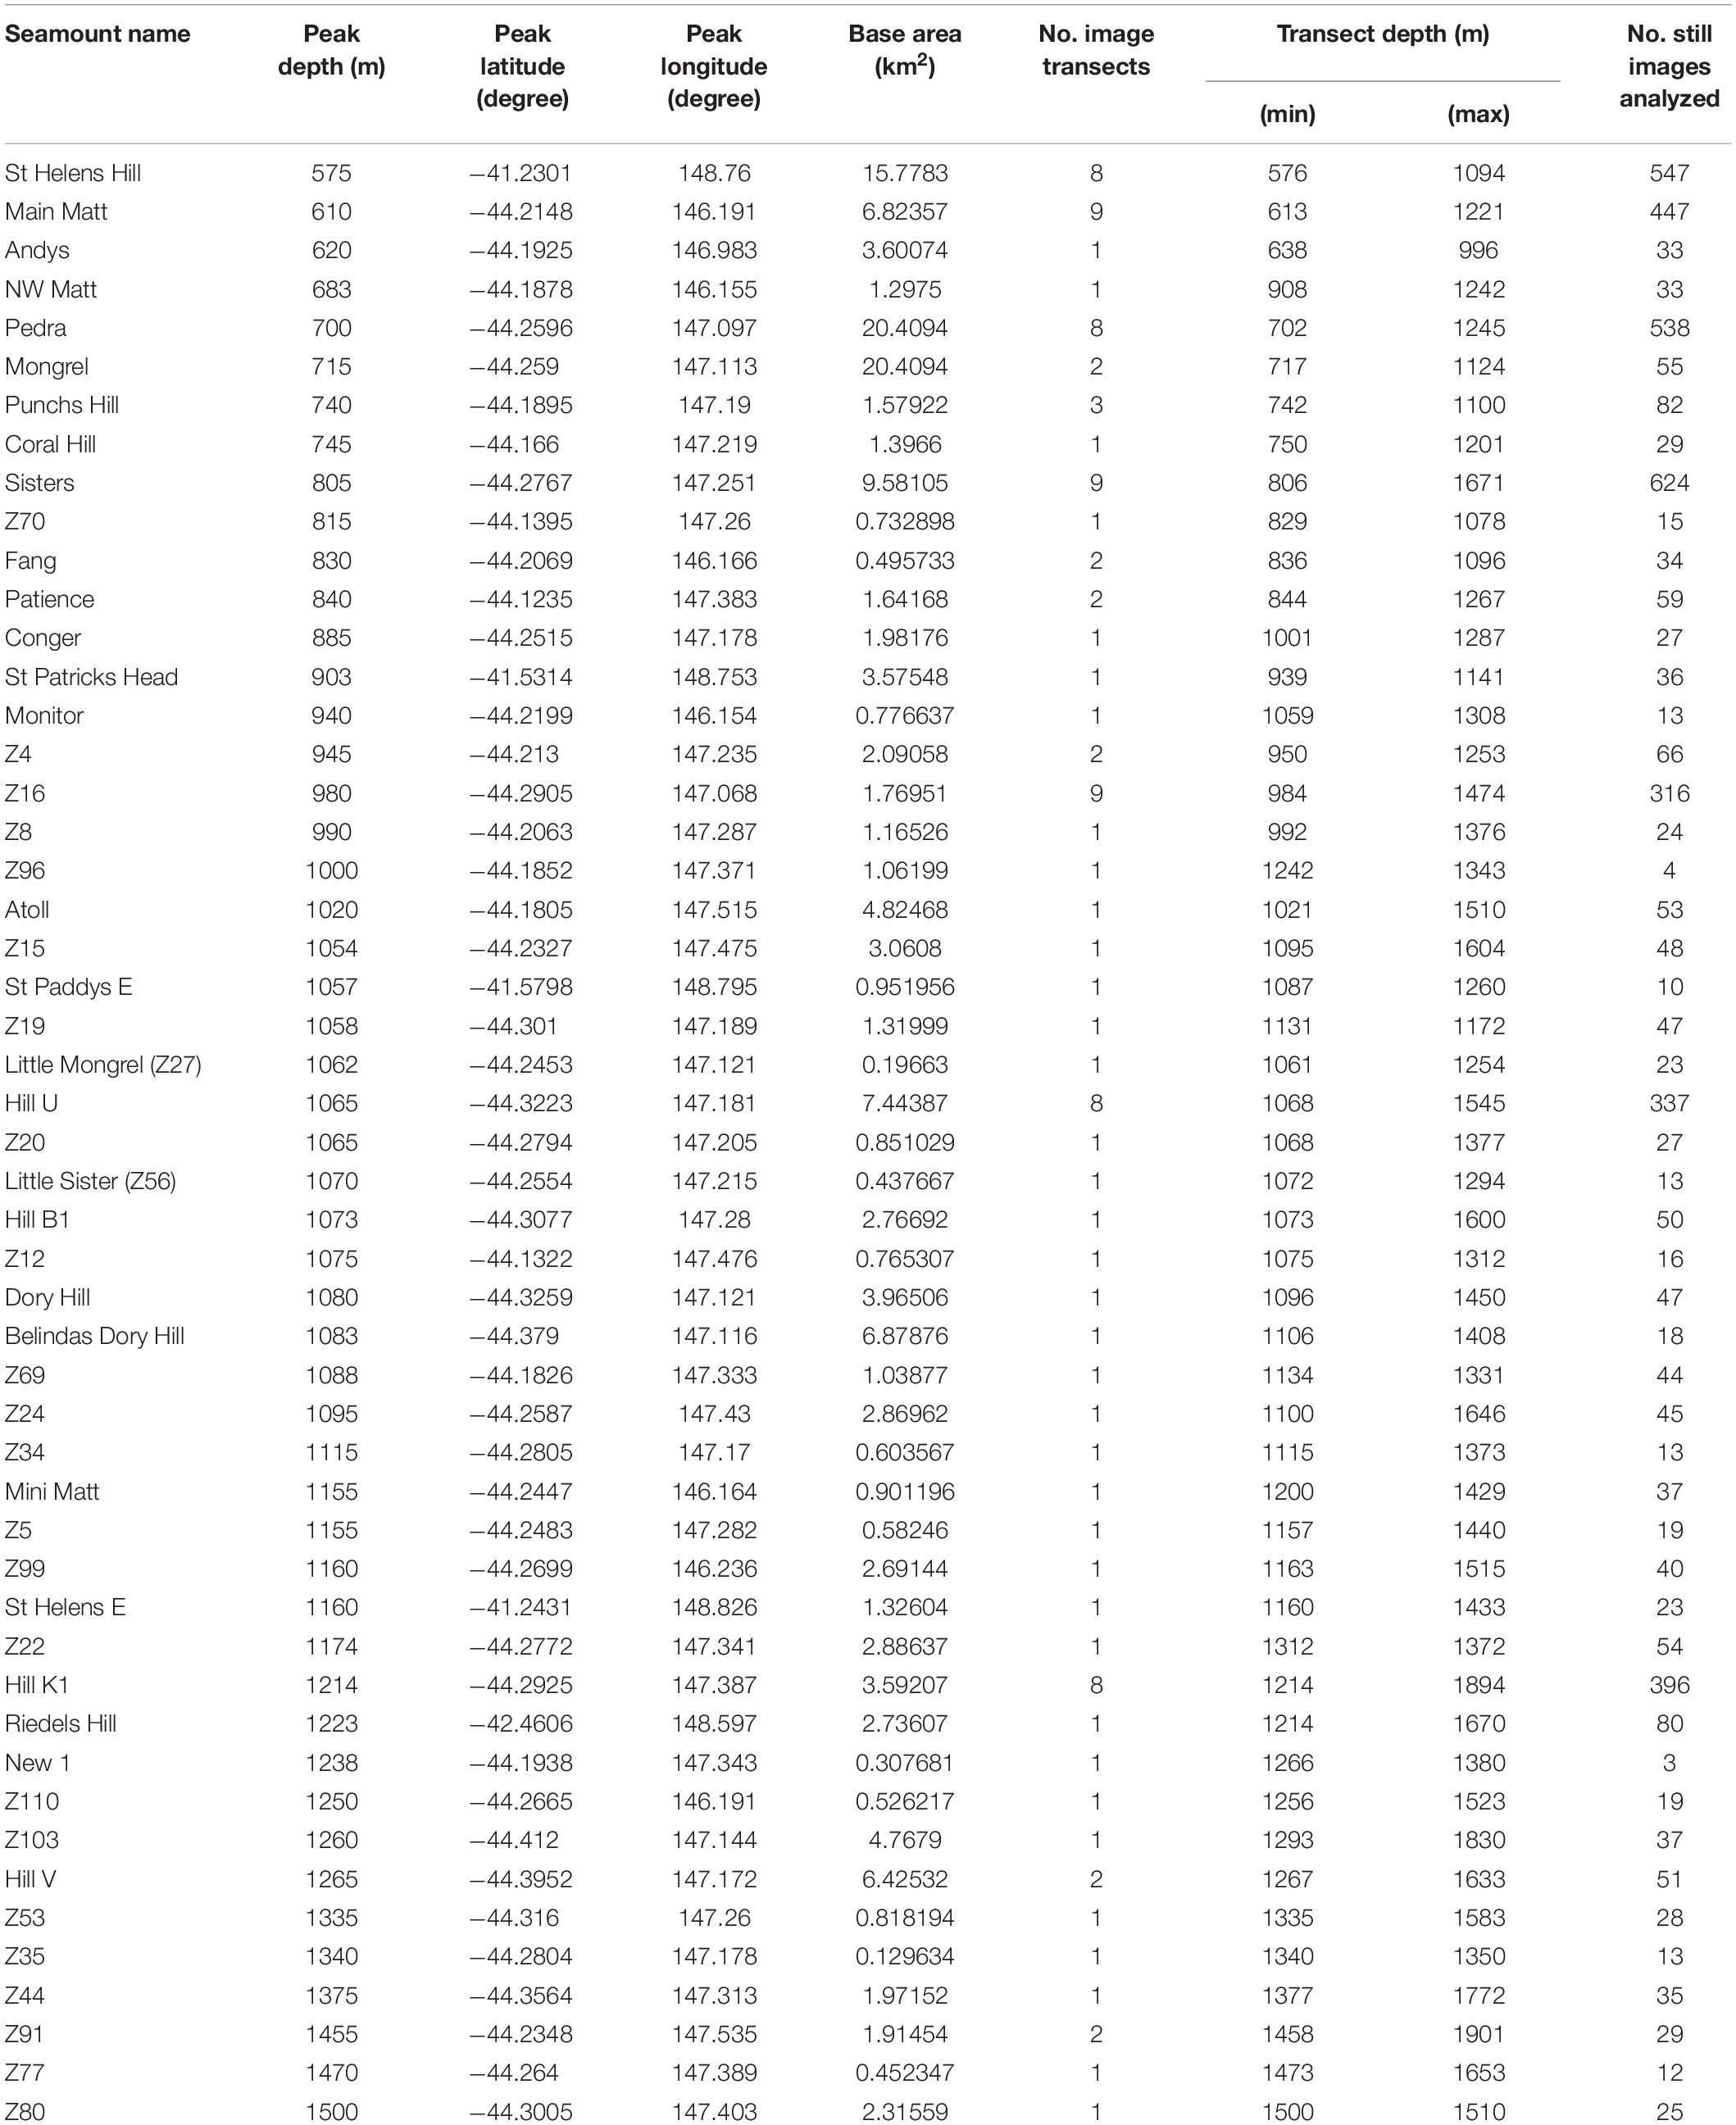
Table 1. The seamounts sampled using a towed camera system showing details of the seamount, the number of camera transects taken and the number of still images analysed.
The Tasmanian Orange Roughy Fishery
The primary target of the trawl fishery on seamounts is orange roughy, a species found over a wide depth range, but off Tasmania occurring typically at depths of 700–1,200 m (Koslow et al., 1997). Commercial trawling logbooks indicate approximately 46,497 trawling operations were done in the study area between 1979 and 2017, and a total of 198,000 metric tonnes of orange roughy were caught during the main phase of the fishery between 1985 and 2006 (Upston et al., 2014). Some effort was also targetted at “oreo dories” that made minor contributions to the catch particularly in the developmental phase of the fishery (the 1980s) when their economic potential was being assessed, and because it was difficult to differentiate them from orange roughy with the hull-mounted echosounders used by commercial trawlers at that time: the spiky oreo (Neocyttus rhomboidalis, Gilchrist, 1906), warty oreo (Allocyttus verrucosus, Gilchrist, 1906) and smooth oreo (Pseudocyttus maculatus Gilchrist, 1906). The overall depth range of trawling was expected to be in ∼600 to 1,500 m depths, reflecting that oreo species occur slightly shallower (to 650 m) and deeper (to 1,300 m) than orange roughy, and because bottom trawl fishing typically involves landing the gear near the seamount summit (Clark and O’Driscoll, 2003) to stabilise it before towing downslope to herd fish into the net before winching the gear off the seabed on the deep flanks of seamounts.
Geographic Distribution of Commercial Trawling Effort
We evaluated the utility of commercial trawling logbook data compiled by the Australian Fisheries Management Authority (AFMA) to identify the depths and spatial distribution of bottom trawling impacts in the study area. Individual trawl operations were extracted from the AFMA database for the duration of the deep-sea fishery in this area: from its commencement (1979) to the most recently available annual data compilation prior to our survey (2017).
The average of the depth reported at the start and end of operations provided an estimate of the depth of each trawl. To map trawl effort we processed individual trawl tows as straight lines between trawl start and end locations and overlaid them on a 1 km grid. We cleaned the data by removing trawls with reported mean depth <500 m (outside the depth range of the fishery) and removed end position where trawl lines were longer than 7 km (a natural cut-off based on a frequency histogram of seamount trawl tow lengths). Straight-line interpolation of the tow lines appropriately represented trawling practise. We then calculated an index of trawl effort that combined two metrics: (i) where start and end positions were recorded, the number of trawls lines that intersected a cell, plus (ii) where only the start position was recorded, the number of trawl start positions per cell.
Our initial evaluation concluded that commercial trawling logbook data was not suitable to accurately quantify the level of fishing intensity at a spatial resolution that matches the size of most seamount features for several reasons: (a) the AFMA data generally have a low spatial resolution (1 min or ∼1.85 km at best), and this is variable over time; (b) the start and end positions recorded at sea are for the vessel and do not account for any offset of the trawl gear, making it uncertain where any bottom contact was made; (c) a large number of tows only recorded the start position. For these reasons, trawl effort was summarised into “effort blocks” to visualise geographic variation in trawling: effort was categorised in five ordinal classes as “very high” (>1,000 trawl records), “high” (250–1,000), “medium” (50–250), “low” (10–50), and “very low” (5–10), and blocks were defined by aggregating all contiguous cells with >50 trawl tows. Tallies of trawl tows were made for individual blocks based on counting each trawl tow only once. We did not map tows for cells with fewer than five records because these cells were scattered and mostly associated with very long trawls.
We used maps of effort blocks to identify where trawling effort was concentrated and where it was absent; trawl tallies within blocks provide a quantum of total trawl effort that can be compared among blocks. Further, the spatial proximity of effort blocks with the larger individual seamounts reliably identifies the primary fishing targets; overlap of blocks with smaller adjacent seamounts – particularly those named by the fishing industry – identifies them as likely to have been exposed to some level of trawling.
Scleractinian Coral Reefs and Indicators for Identifying Trawling Impacts
Deep-sea reefs built by scleractinian corals on seamounts have high ecological value because they enhance structural complexity and support elevated diversity and biomass compared to surrounding seafloor habitats (Althaus et al., 2009; Rowden et al., 2010a). Reefs in the study area are composed of the accumulating skeletal matrix of five scleractinian coral species (Figure 2): Solenosmilia variabilis Ducan, 1873, was typically the most abundant; this semi-cosmopolitan species is a widely distributed framework-building coral on seamounts in the South Pacific Ocean (Tracey et al., 2011); four other taxa were much less abundant and scattered – Dendrophyllia spp. (possibly two species, Marcelo Kitahara pers. comm.), Madrepora oculata Linnaeus, 1758, and Enallopsamia rostrata (Pourtalès, 1878). Although the shape, size, structural complexity, and architecture of the skeletal matrix differs among species, the common trait is that coral frameworks are elevated above the seafloor. This accumulated framework forms “reefs” that can exceed 1 km2 in extent in the study area (Williams et al., 2020).
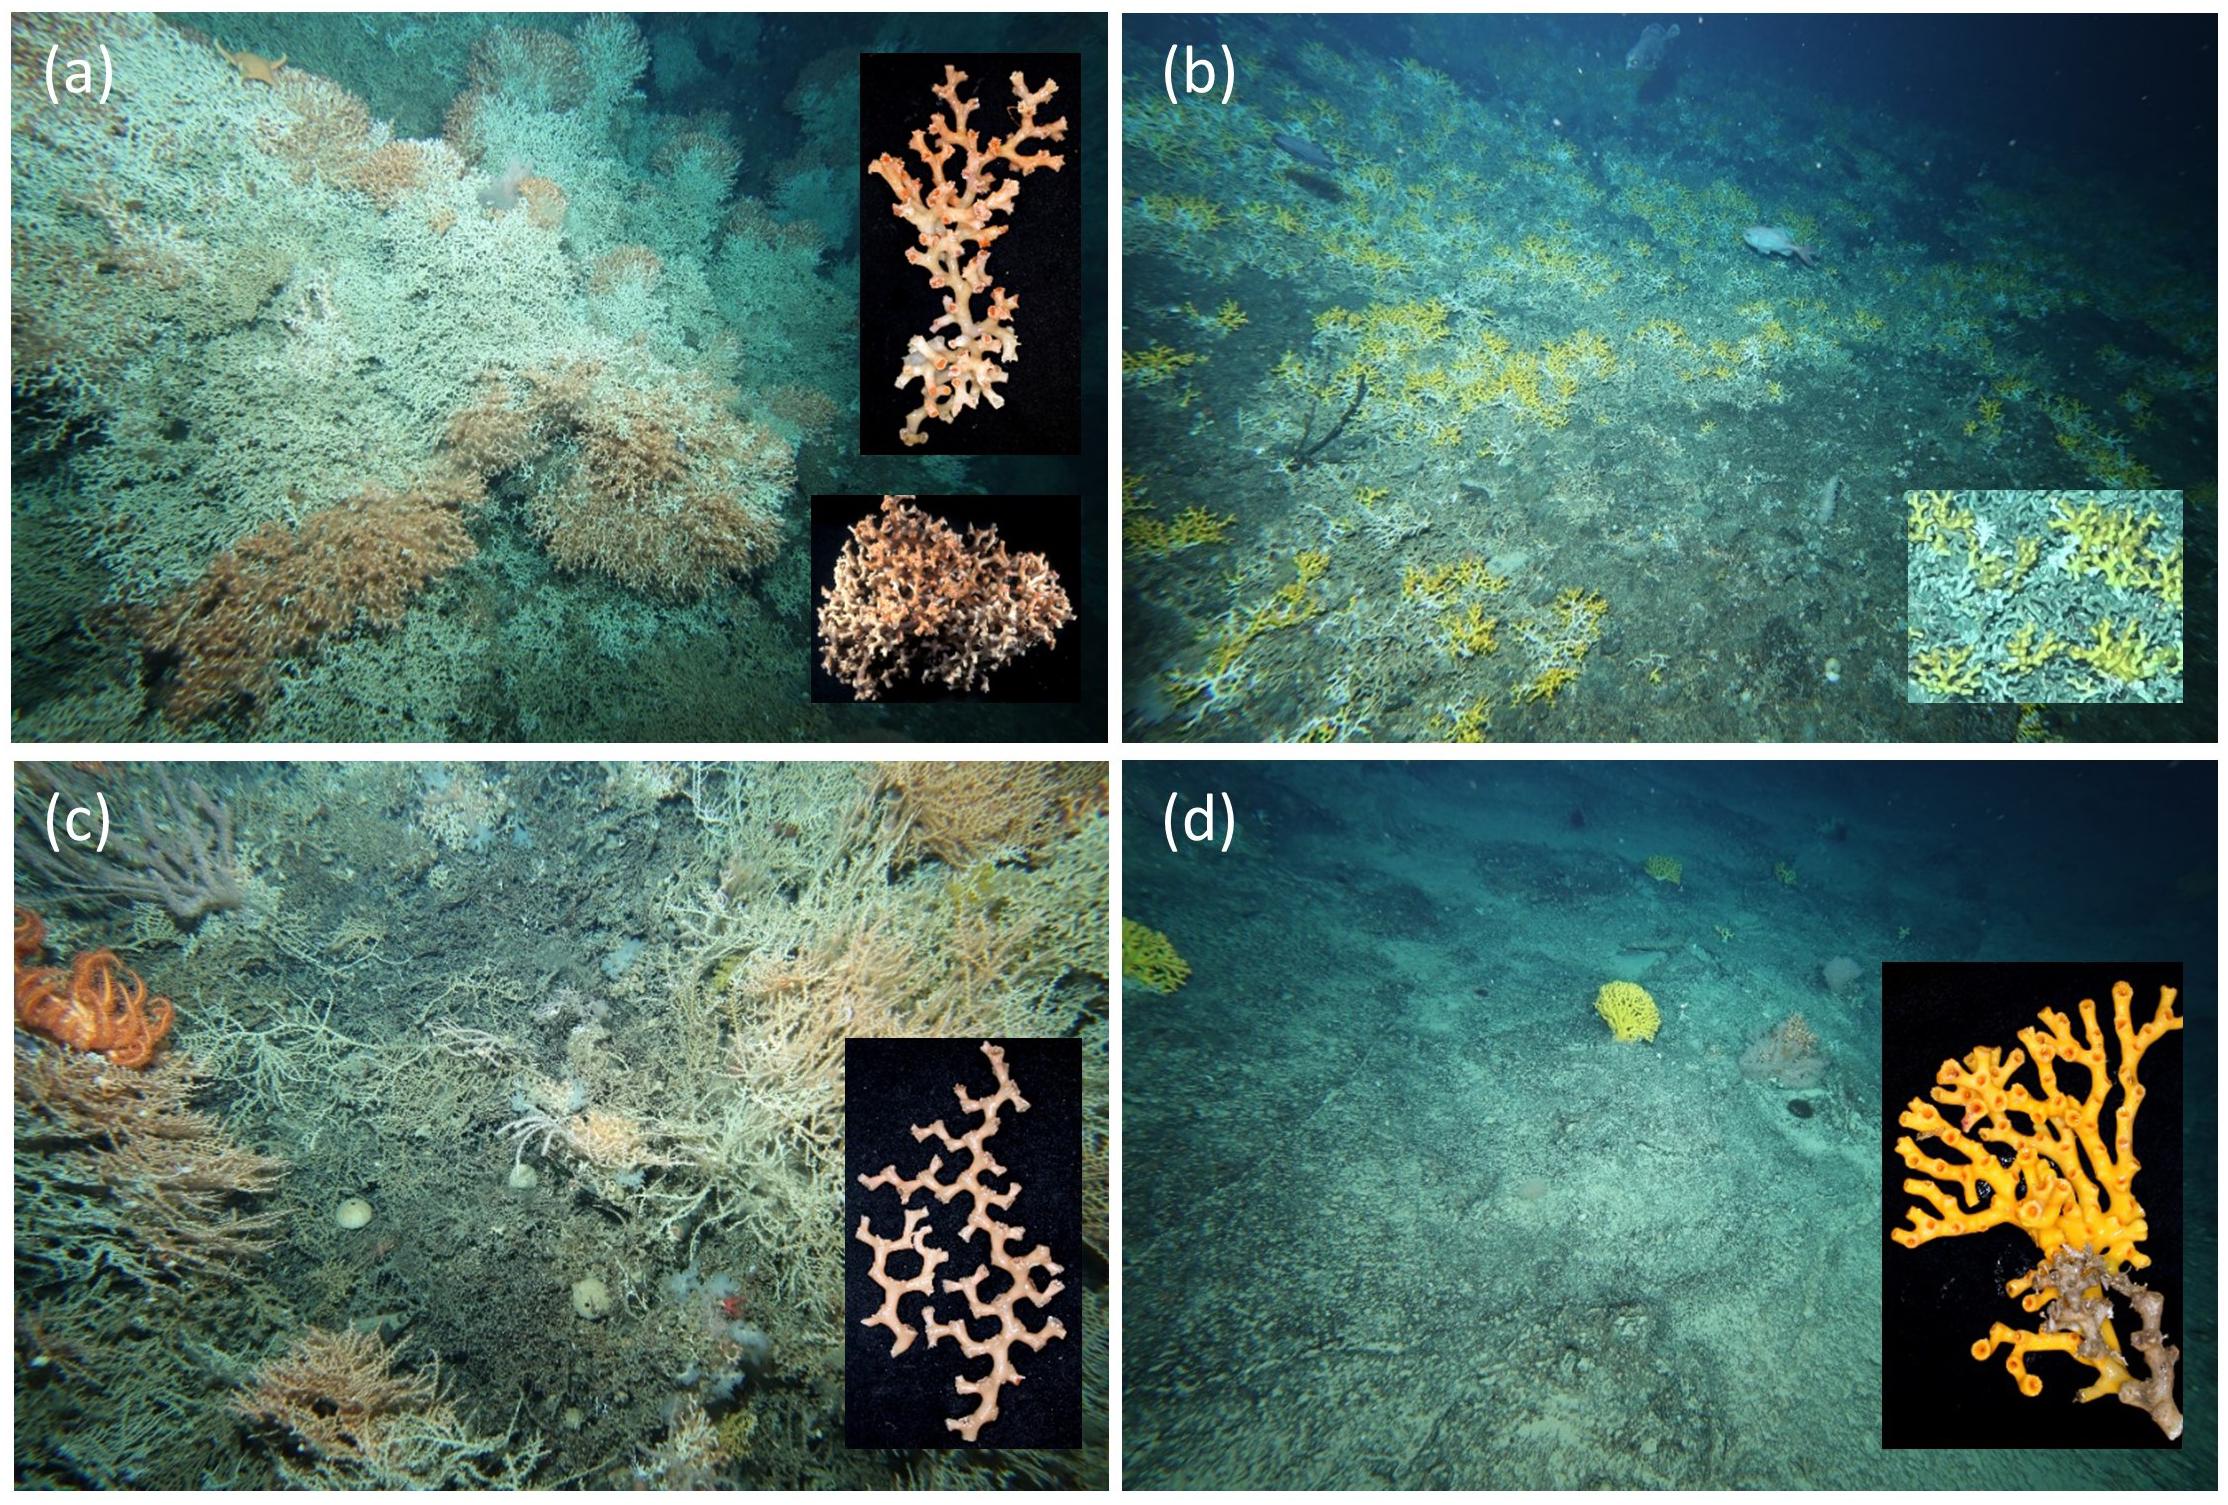
Figure 2. Images of scleractinian corals in the study area illustrating the terms used to define indicators of impact; insets show the structure of the coral skeleton “matrix” and branching pattern: (a) Solenosmilia variabilis – “reef” formed of extensive matrix made sturdy and resilient by extensive branch anastomosis; upper inset shows large, intact and bushy branch, and lower inset a detached “clump” of anastomosed branches (seamount Z4, 977 m); (b) Dendrophyllia spp. (probably two species) – “reef” formed by extensive matrix of low, sparsely-branched colonies; inset shows “fragments” of coral branches (Sisters, 879 m); (c) Madrepora oculata – “patches” of matrix formed by dense, delicate, multiplanar bushes; inset shows large and small “fragments” with distinctive zig-zag branching (St Helens east, 1,179 m); (d) Enallopsammia rostrata – small “patches” of matrix formed by individual colonies; inset shows, uniplanar with corallites on one-side (Main Matt, 1,017 m).
We expected to see three primary types of impact stemming from interactions between trawl gear and deep-sea coral reefs. First, we identify “blunt” impacts, caused by the motion of the ground-gear, trawl doors, and trawl net (sometimes with the cod-end containing a catch of fish and benthic by-catch), and line-shear impacts caused by the motion of the trawl sweeps and lower bridles (Ewing and Kilpatrick, 2014). Second, we observe accumulations of rubble and fragments from repeated disturbance of biogenic material by various parts of the trawling gear, but not removed in the net, and scattered coral in clumps or pieces resulting from discarding the by-catch at sea (Hall-Spencer et al., 2002; Gage et al., 2005; Althaus et al., 2009). Third, we observe lost fishing gear and gear marks on the seabed. We expected impacts would vary in severity and spatial extent due to factors such as frequency of trawling and the area and structure of the deep-sea coral reef. Based on these expectations, and observations in other studies (Koslow et al., 2001; Thresher et al., 2009; Clark et al., 2010b), we developed a set of indicators to identify impacts on deep-sea coral reefs that we could confidently attribute to trawling (Table 2 and Figure 3).
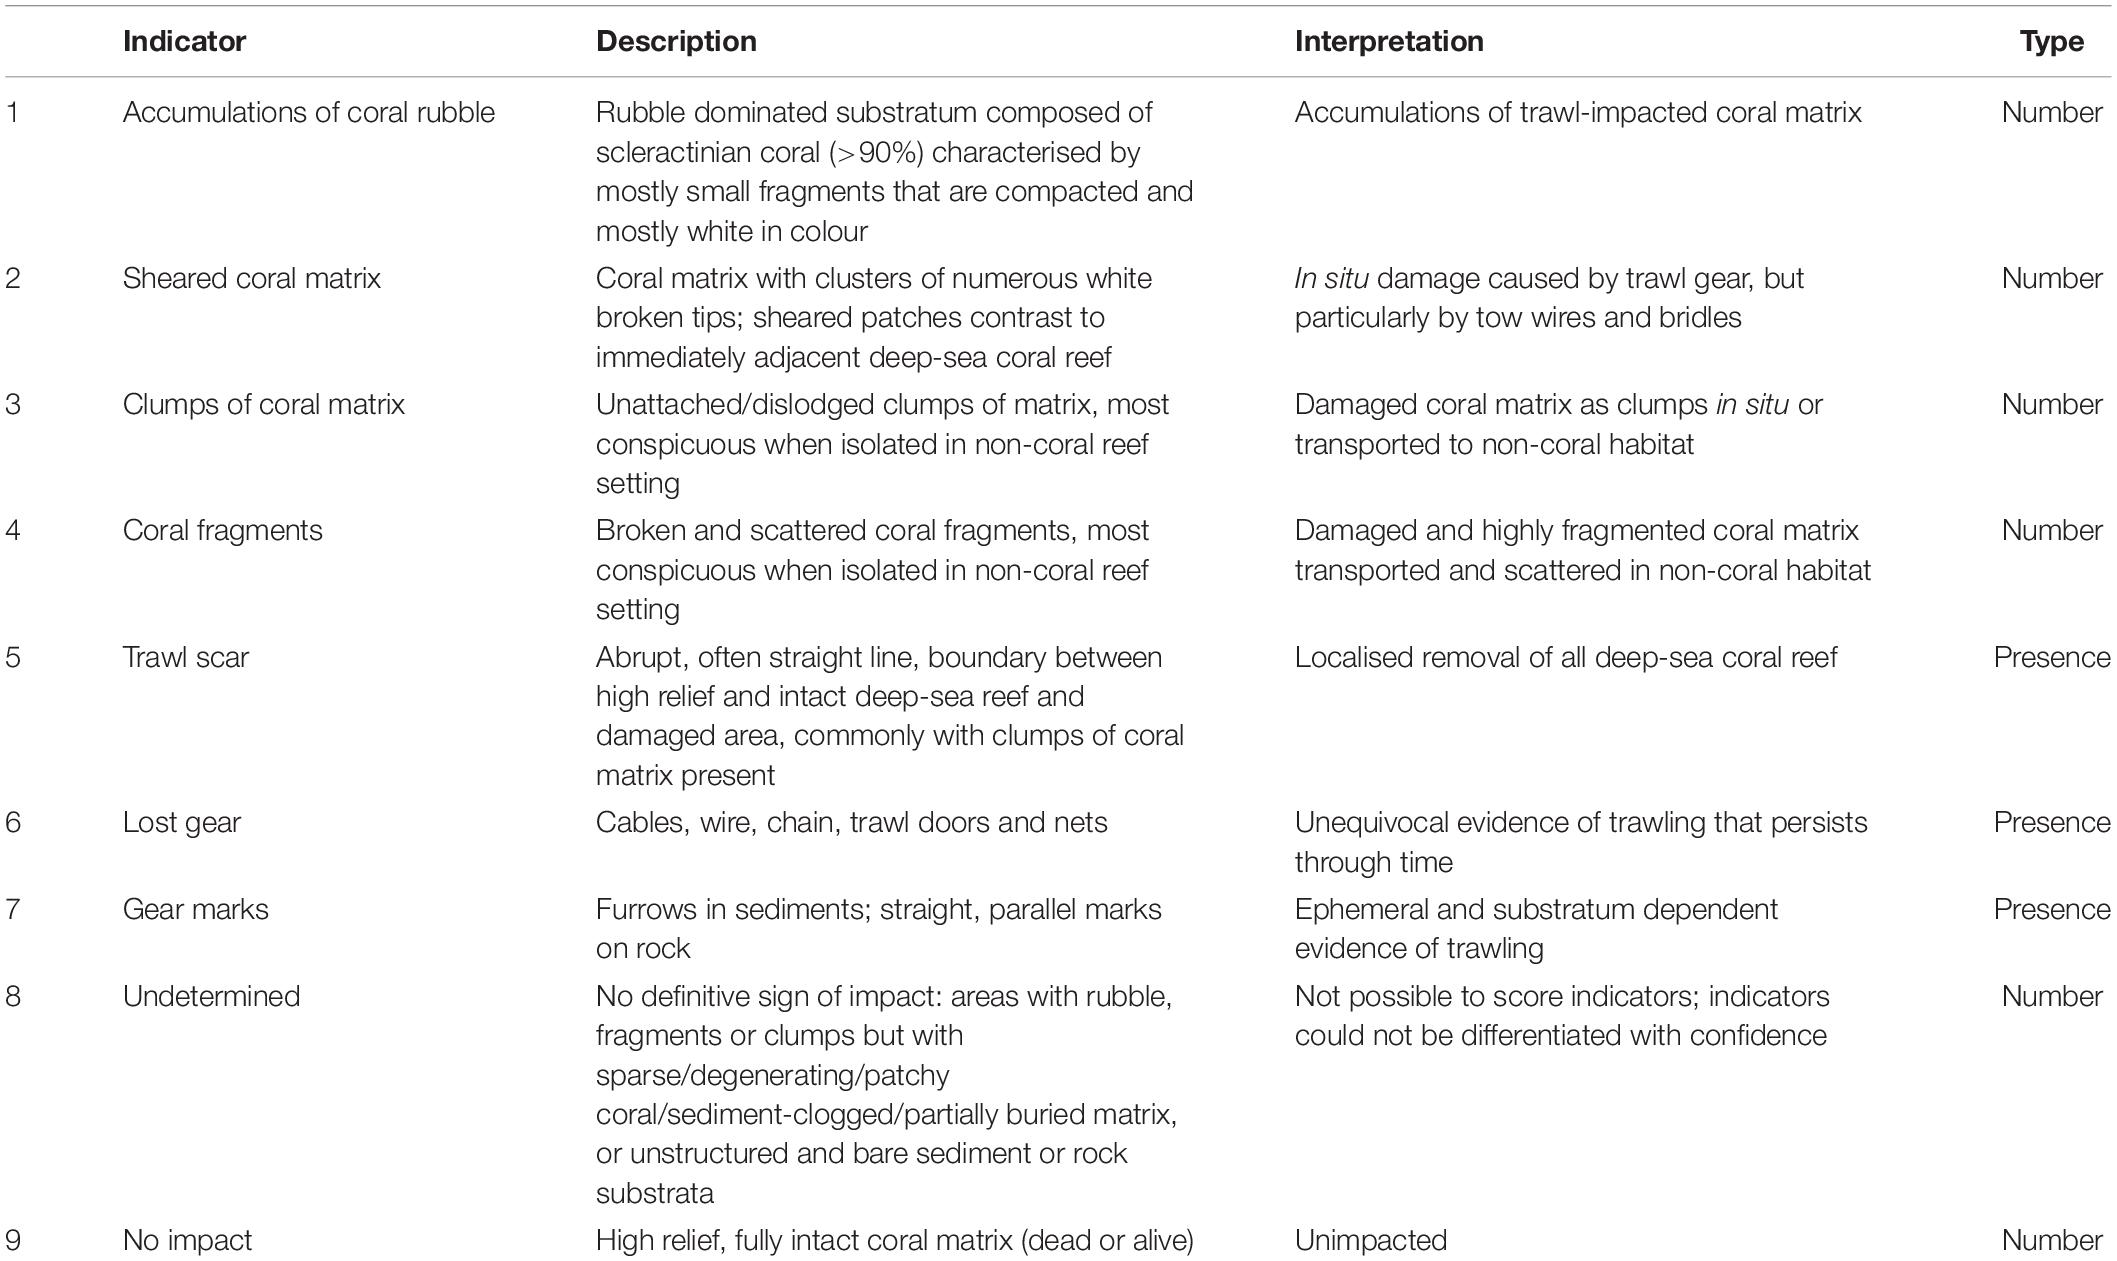
Table 2. Indicators used to assess the level of trawl impact and lack of impact on scleractinian deep-sea coral reef, showing their description and interpretation, and the type of data derived from either video (presence only) or still imagery (counts).
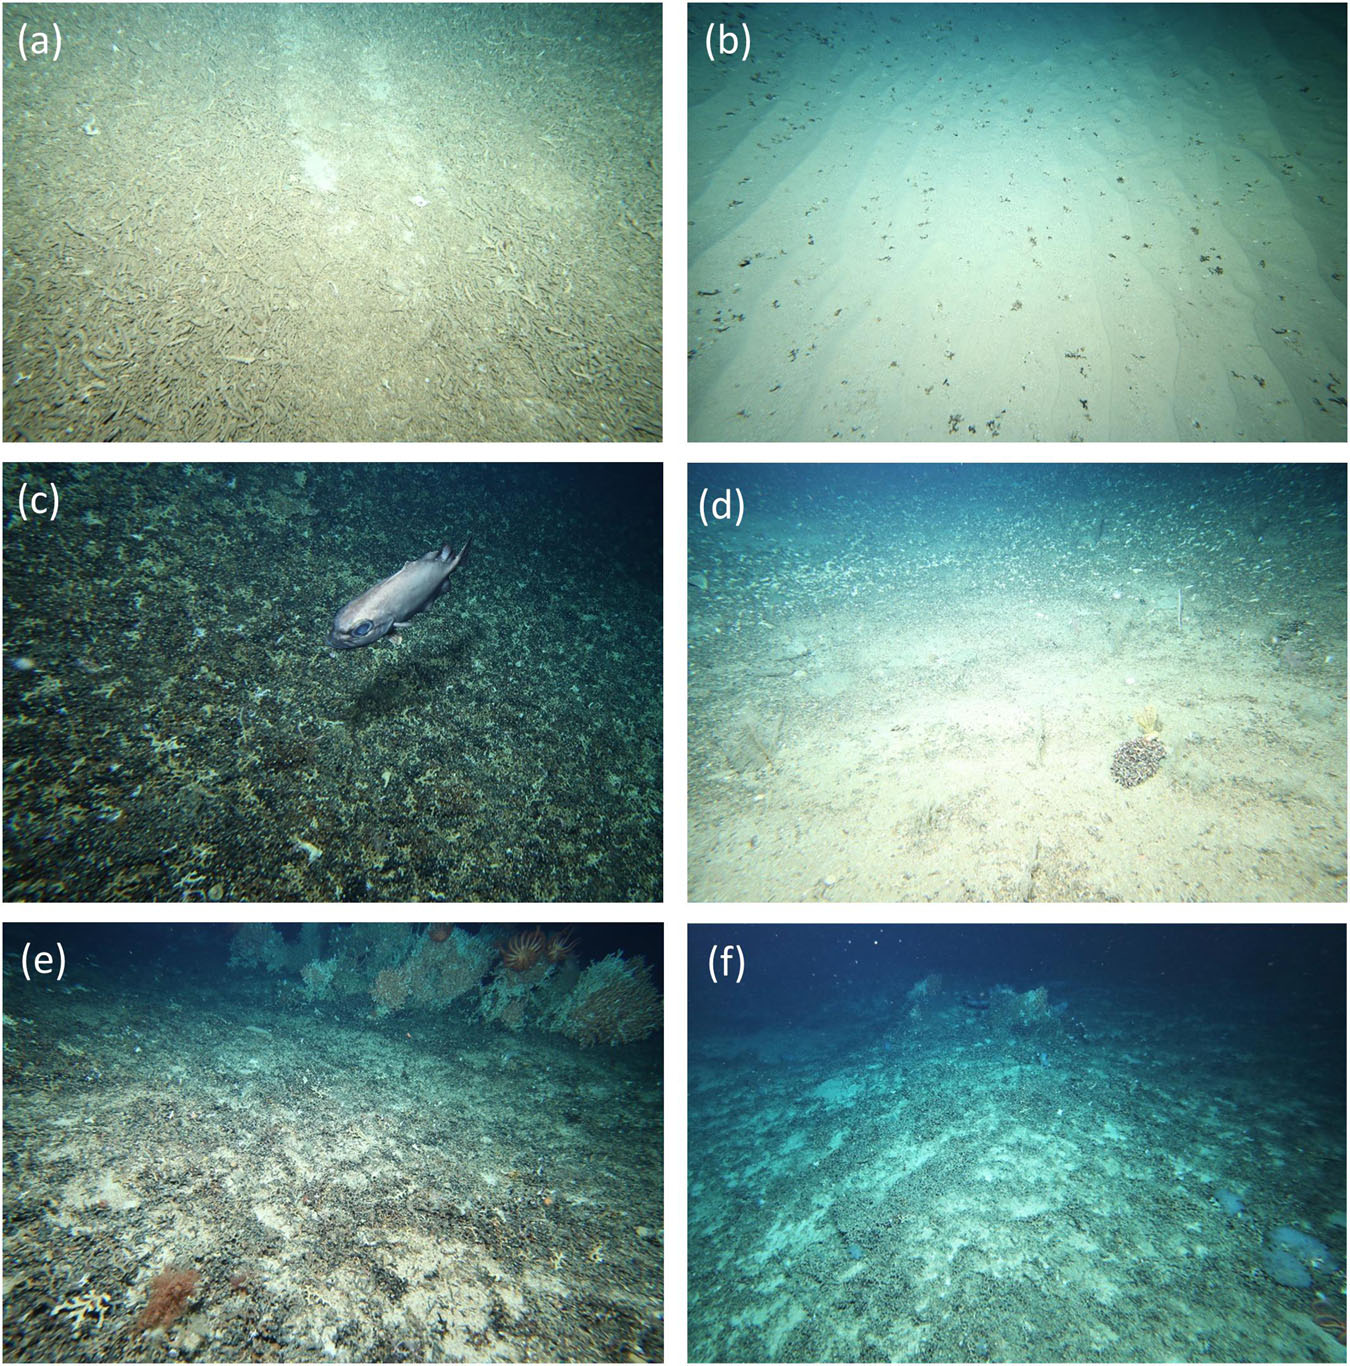
Figure 3. Examples of impact indictors: (a) “dense rubble” with “gear mark” – St Helens (685 m); (b) “fragments” – Main Matt (1,003 m); (c) “sheared” – Atoll (1,072 m); (d) “clumps” – Pedra (1,079 m); (e) “trawl scar” – Hill U (1,172 m); (f) “undetermined” – Z5 (1,347 m).
To provide a consistent interpretation of the indicators, we used the following four terms to describe the structural coral matrix formed by live or dead coral skeleton (and see Figure 2): (1) “fragment” to describe detached branches of dead matrix, typically ∼ <10 cm in size; (2) “clump” for detached pieces of anastomosed matrix (dead or alive) typically ∼5–30 cm in size; (3) “patch” for small areas of matrix that are isolated and not contiguous, typically representing a single colony or few colonies; and (4), “reef” to describe large areas of contiguous coral matrix, ranging in size from several metres to >1 km2 (e.g. Mortensen et al., 2001). We also attempted to determine which coral species made up coral rubble. In many instances, where rubble was uncompacted and contained large fragments, we could identify its species composition. Conversely, where rubble was worn, it was difficult because eroded corallites and small fragment size mask the distinctive morphology of coral species.
The suite of impact indicators reflects seven signs of visible trawling damage to corals: (1) “coral rubble” (number), (2) “coral fragments” (number), (3) “sheared coral” (number), (4) “coral clumps” (number); we scored these four numerical indicators using still images. The set also included three presence/absence indicators: (5) “trawl scar” (±), (6) “lost gear” (±), and (7) “gear marks” (±). We scored the presence/absence indicators using the video. We also included the numerical indicator – (8) “undetermined,” to capture seabed areas composed of bare rock, clear sediment, or sparse and patchy reef matrix (sometimes with rubble or fragments) that lacked unequivocal evidence of trawling. It was also used for the often-extensive areas of dead, eroding, and sediment-clogged matrix present on the deep flanks and bases of seamounts where the presence or type of impacts were difficult to recognise with confidence. This indicator was not used in the analysis because by doing so we would have risked introducing both false positive and false negative observations, thereby biasing the assessment of fishing impacts in an unknowable direction. Indicator (9) “no impact” (number) was the presence of an intact high-relief coral matrix (live and dead) without any apparent signs of degradation or damage.
The still images were best suited to score the numerical indicators (1–4, 8, 9), because of their higher resolution compared with video. We scored only the dominant indicator (most obvious or covering the largest area) in each still image. Detailed examination of stills also allowed us to identify coral fragments to species level. The videos were best suited to score the presence-only indicators (5–7). Thus, the context provided by moving imagery enabled detection of “trawl scars” which were typically narrow and present in only one or two consecutive still images and it avoided double-counting of “lost gear” and “gear marks” which often spanned many successive still images along a transect. We also used the video to identify the dominant substratum type, including deep-sea coral reef and biogenic rubble, using the CATAMI classification (Althaus et al., 2015). We could distinguish “live” reef from “dead” in videos by recording the number of coral heads with living polyps (distinctly orange in colour) in slow-speed replays. A cross-check was made between selected images from both video and stills to check the consistency of the indicator assignment and scoring. The scores assigned to individual still images were summarised as count (frequency) data and presented as a proportion of the number of images analysed per seamount. The analysis used only data from “on-seamount,” i.e., transects were clipped at seamount bases as described above. Georeferenced annotations were visualised in maps of seamounts using QGIS (QGIS, 2018).
Results
Depth Distributions of Scleractinian Corals
The main framework-building coral species, Solenosmilia variabilis, can occasionally be present as isolated patches but typically forms extensive and continuous reefs in the study region. Its core depth range (reef with live corals), based on analysing 106 transects on 51 seamounts, and with reference to the depth range of contiguous patches (deep-sea coral reef vulnerable marine ecosystems sensu Williams et al., 2020), is ∼950–1,350 m (Figure 4). We did observe rare, scattered, and isolated small patches of live S. variabilis reef slightly shallower (to 817 m depth) and slightly deeper (to 1,485 m depth). Areas of “dead reef” (intact matrix without living coral polyps) occurred from 775 to 1,647 m depths, with extensive areas of dead reef occurring deeper than ∼1,250 m (Figure 4). Large reef areas of the minor species were not observed. Matrix of the less abundant framework-building corals extended into shallower depths and had narrower depth ranges (Dendrophyllia spp. and Enallopsammia: 606–1,287 m depths; Madrepora occulata: 1,006–1,286 m depths (Figure 4). In the minor species, the depth range of living coral encompassed the depth range of dead intact matrix, but rubble was observed in shallower depths: Enallopsammia to 597 m and Madrepora to 663 m.
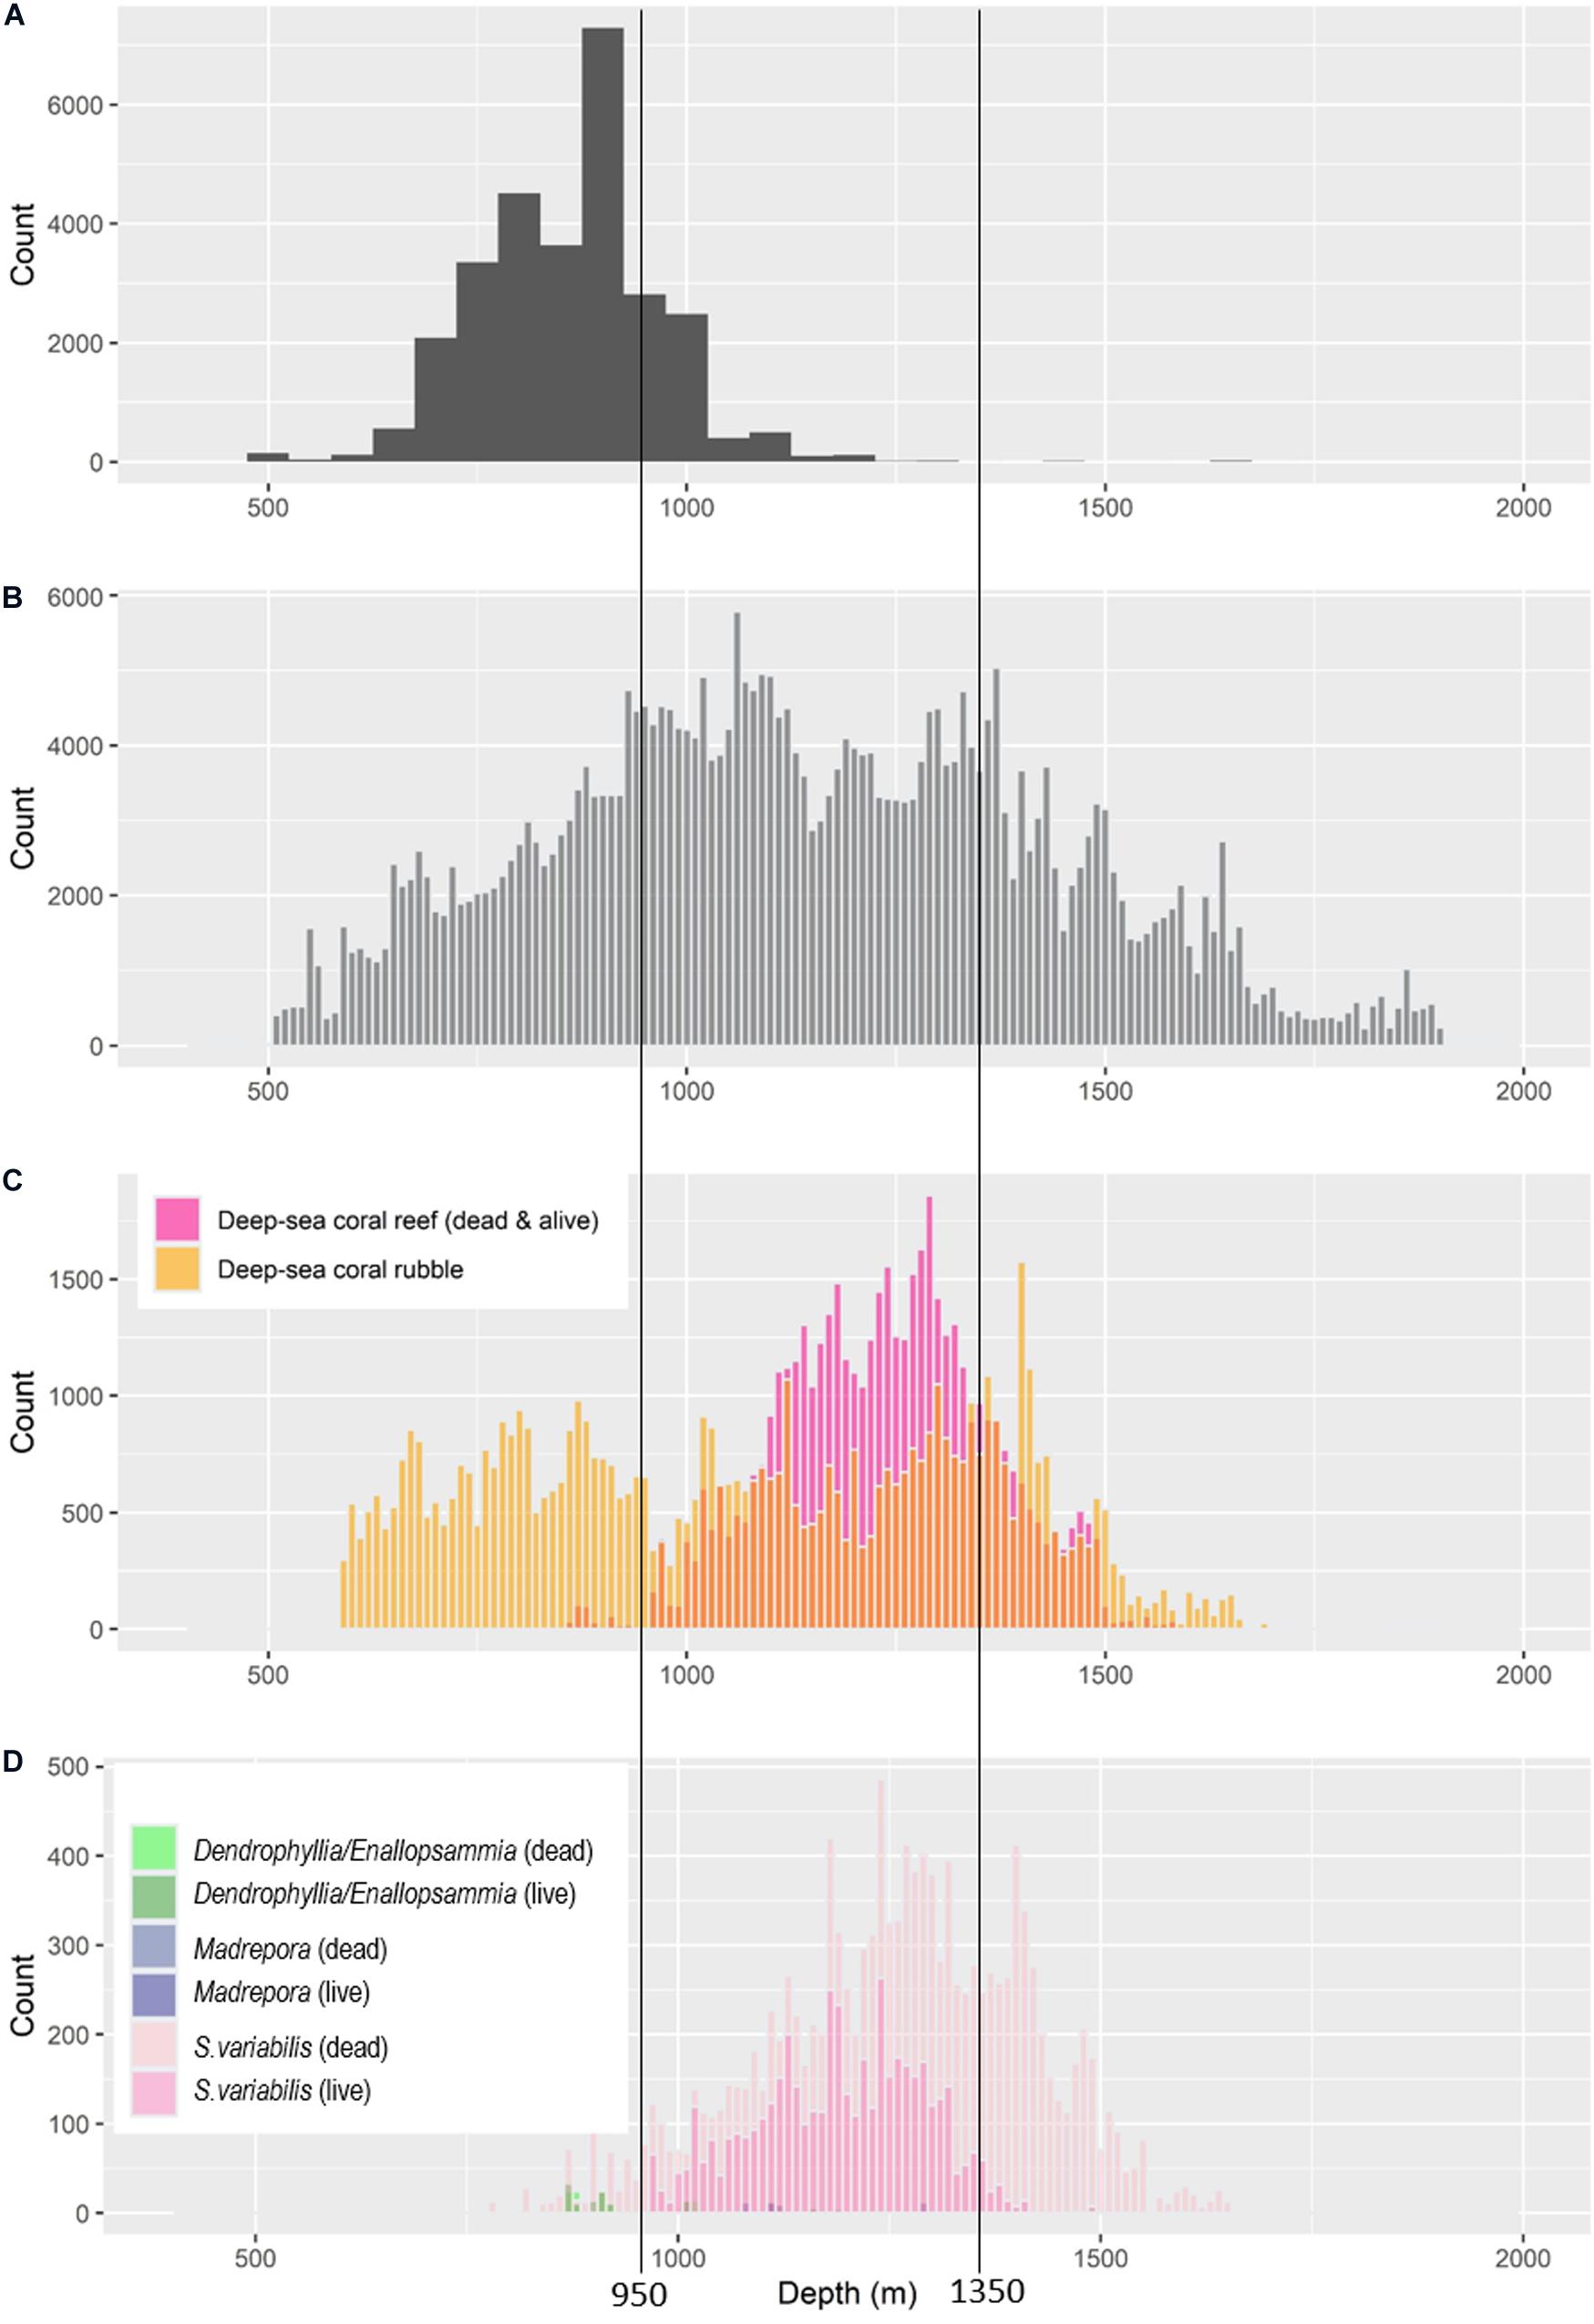
Figure 4. Depth ranges of parameters relevant to understanding trawling impacts: (A) frequency of the average depth of trawl operations reported in commercial logbooks; (B) frequency of combined observations from video imagery to show the depth range sampled; (C) depth ranges of dead and live matrix, and rubble, for all framework-building scleractinian corals combined based on frequency of observations in video imagery (D) depth ranges of dead and live matrix of Solenosmila variabilis, Dendrophyllia/Enallopsammia spp. and Madrepora oculata based on frequency of observations in still images. Vertical lines mark the core distribution of live coral reef formed by S. variabilis (approximating 95% records, and as mapped in Williams et al., 2020).
Distribution of Trawling Effort
Based on commercial trawling logbook data, the average depth of most bottom trawling deployments was between 700 and 1,100 m depths (Figure 4). A shoreward distribution of effort to ∼500 m (the shallow depth limit of our analysis) primarily reflects that some trawling is “off-seamount” on the continental slope. The deep end of the trawling range reflects trawls being winched up in deeper water after herding fish down the flanks of seamounts. These ranges are consistent with the collective depth ranges of the target species and trawling practise on these seamounts.
The geographic distribution of trawl effort as defined by “blocks” (aggregations of contiguous 1 km2 grid cells with >50 trawl tows) showed 19 blocks of concentrated trawling; these varied greatly with respect to size, the number of tows, and the concentration of tows within a block (Figure 5). Commercial trawling logbook data also identified areas of relatively low effort and where there was no effort, in waters deeper than about 1,500 m and on seamounts with peaks deeper than about 1,200 m (Figure 5). Three blocks accounted for >8,000 tows each, being associated with the three largest individual seamounts (St Helens, Main Matt – including NW Matt, and Pedra) in our survey area. Relatively high effort (1,164–3,273 tows) occurred in five blocks also associated with distinct seamounts (Sisters, St Patricks Head, Sharks Tooth, Andys – Mackas, and the Corvina Group (comprised of Punchs Hill, Coral Hill, The Thumb, The Ridge and Andres). Collectively, these eight areas were the primary deep-sea fishing grounds and represent the major spatial concentrations of bottom trawling at this depth in the region (Figure 5). The 11 other blocks were small, and intensity was less (a range of 114–623 tows per block).
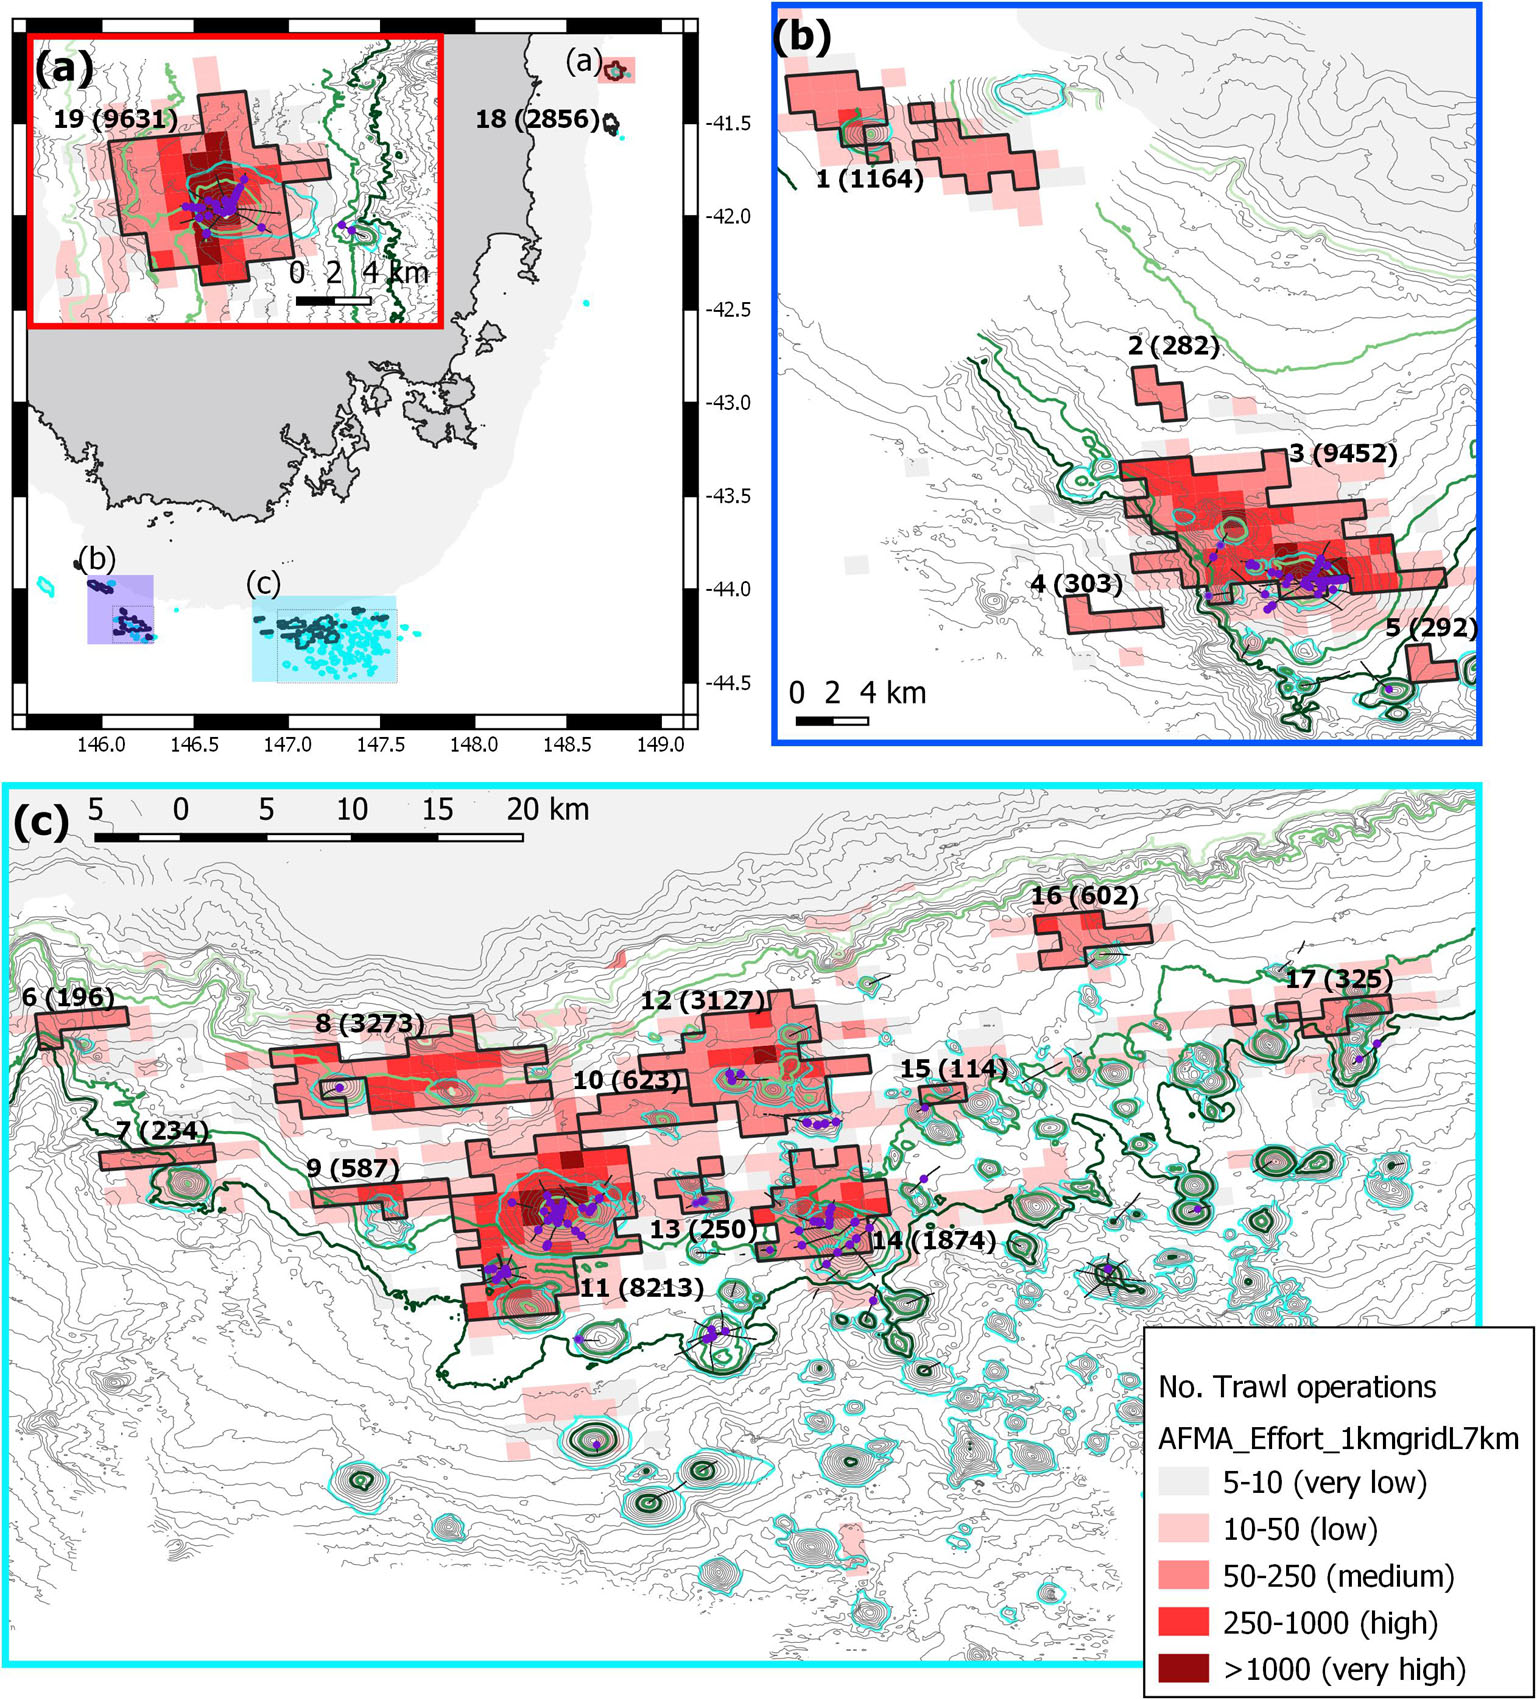
Figure 5. Map of region showing the number of trawl operations and categories of effort. Trawl data mapped into 1 km cells with concentrations of effort shown as bounded “trawl blocks” (total number of operations tallied in parentheses): 1 – Sharks Tooth; 2 – no ID; 3 – Main Matt – including NW Matt; 4 – no ID; 5 – Z99; 6 – Noddys Knob; 7 –Growler; 8 – Andys – Mackas; 9 – Lorna – Belinda; 10 – Z61; 11 – Pedra; 12 – Corvina Group; 13 – Conger; 14 – Sisters Seamount; 15– Brians; 16 – Patience; 17 – Atoll Group; 18 – St Patricks Head; 19 – St Helens. Video transects are shown as black lines and observations of lost gear, gear marks and trawl scars (purple circles) are highlighted. Contours are 50 m intervals with 650, 950, 1,350, and 1,500 m highlighted as light to dark green; the seamounts are outlined (cyan). (a) Overview map showing the 500 m depth mask and the relative locations of the three maps, the inset of (a) effort map of the seamounts off St Helens; (b) eastern deep edge of the Tasman Fracture AMP; (c) western edge of the Huon AMP.
Trawling Impacts on Deep-Sea Coral Reefs
Patterns of Damage in the Eight Focal Areas
The trawling impact indicators were first examined on seamounts in the eight Focal areas where intensive sampling (multiple transects per seamount) enabled us to identify patterns of coral damage and compare these to the ranges of recorded trawling effort. The comparisons were possible due to the contrast in trawling history across the eight Focal areas: three overlapped trawl effort blocks with high trawling concentrations (St Helens, Main Matt, Pedra), and two overlapped medium trawling blocks (Sisters and Corvina Group) (Figure 5). Of the other three, Seamount Z16 was within the Pedra block, but was previously believed to be untrawled (Althaus et al., 2009), while the two deeper seamounts, Hill U and Hill K1, had no trawl effort recorded in logbooks (Figure 5c).
The two shallowest seamounts (St Helens and Main Matt, summits at 575 and 610 m depth, respectively, Figures 6a,b), both exposed to high trawling effort, were characterised by an absence of unimpacted matrix or reef, but extensive accumulations of coral rubble around their peaks. This rubble was highly fragmented, mostly light in colour, and composed predominantly of the shallow species: Dendrophyllia spp., Enallopsamia rostrata with some Madrepora oculata. There were also extensive areas of bare rock on their flanks. Observations of fragmented, sheared and detached clumps of coral were relatively infrequent and restricted to the lower flanks, base and off-seamount areas. There were numerous observations of lost trawl gear and gear marks on and around both seamounts (Figure 5). Collectively, these patterns suggest that coral reefs had initially formed on the upper parts of these seamounts and that trawling had reduced them to rubble, much of which was not removed. There was minor evidence of Solenosmilia variabilis rubble (on the extensive areas of bare rock).
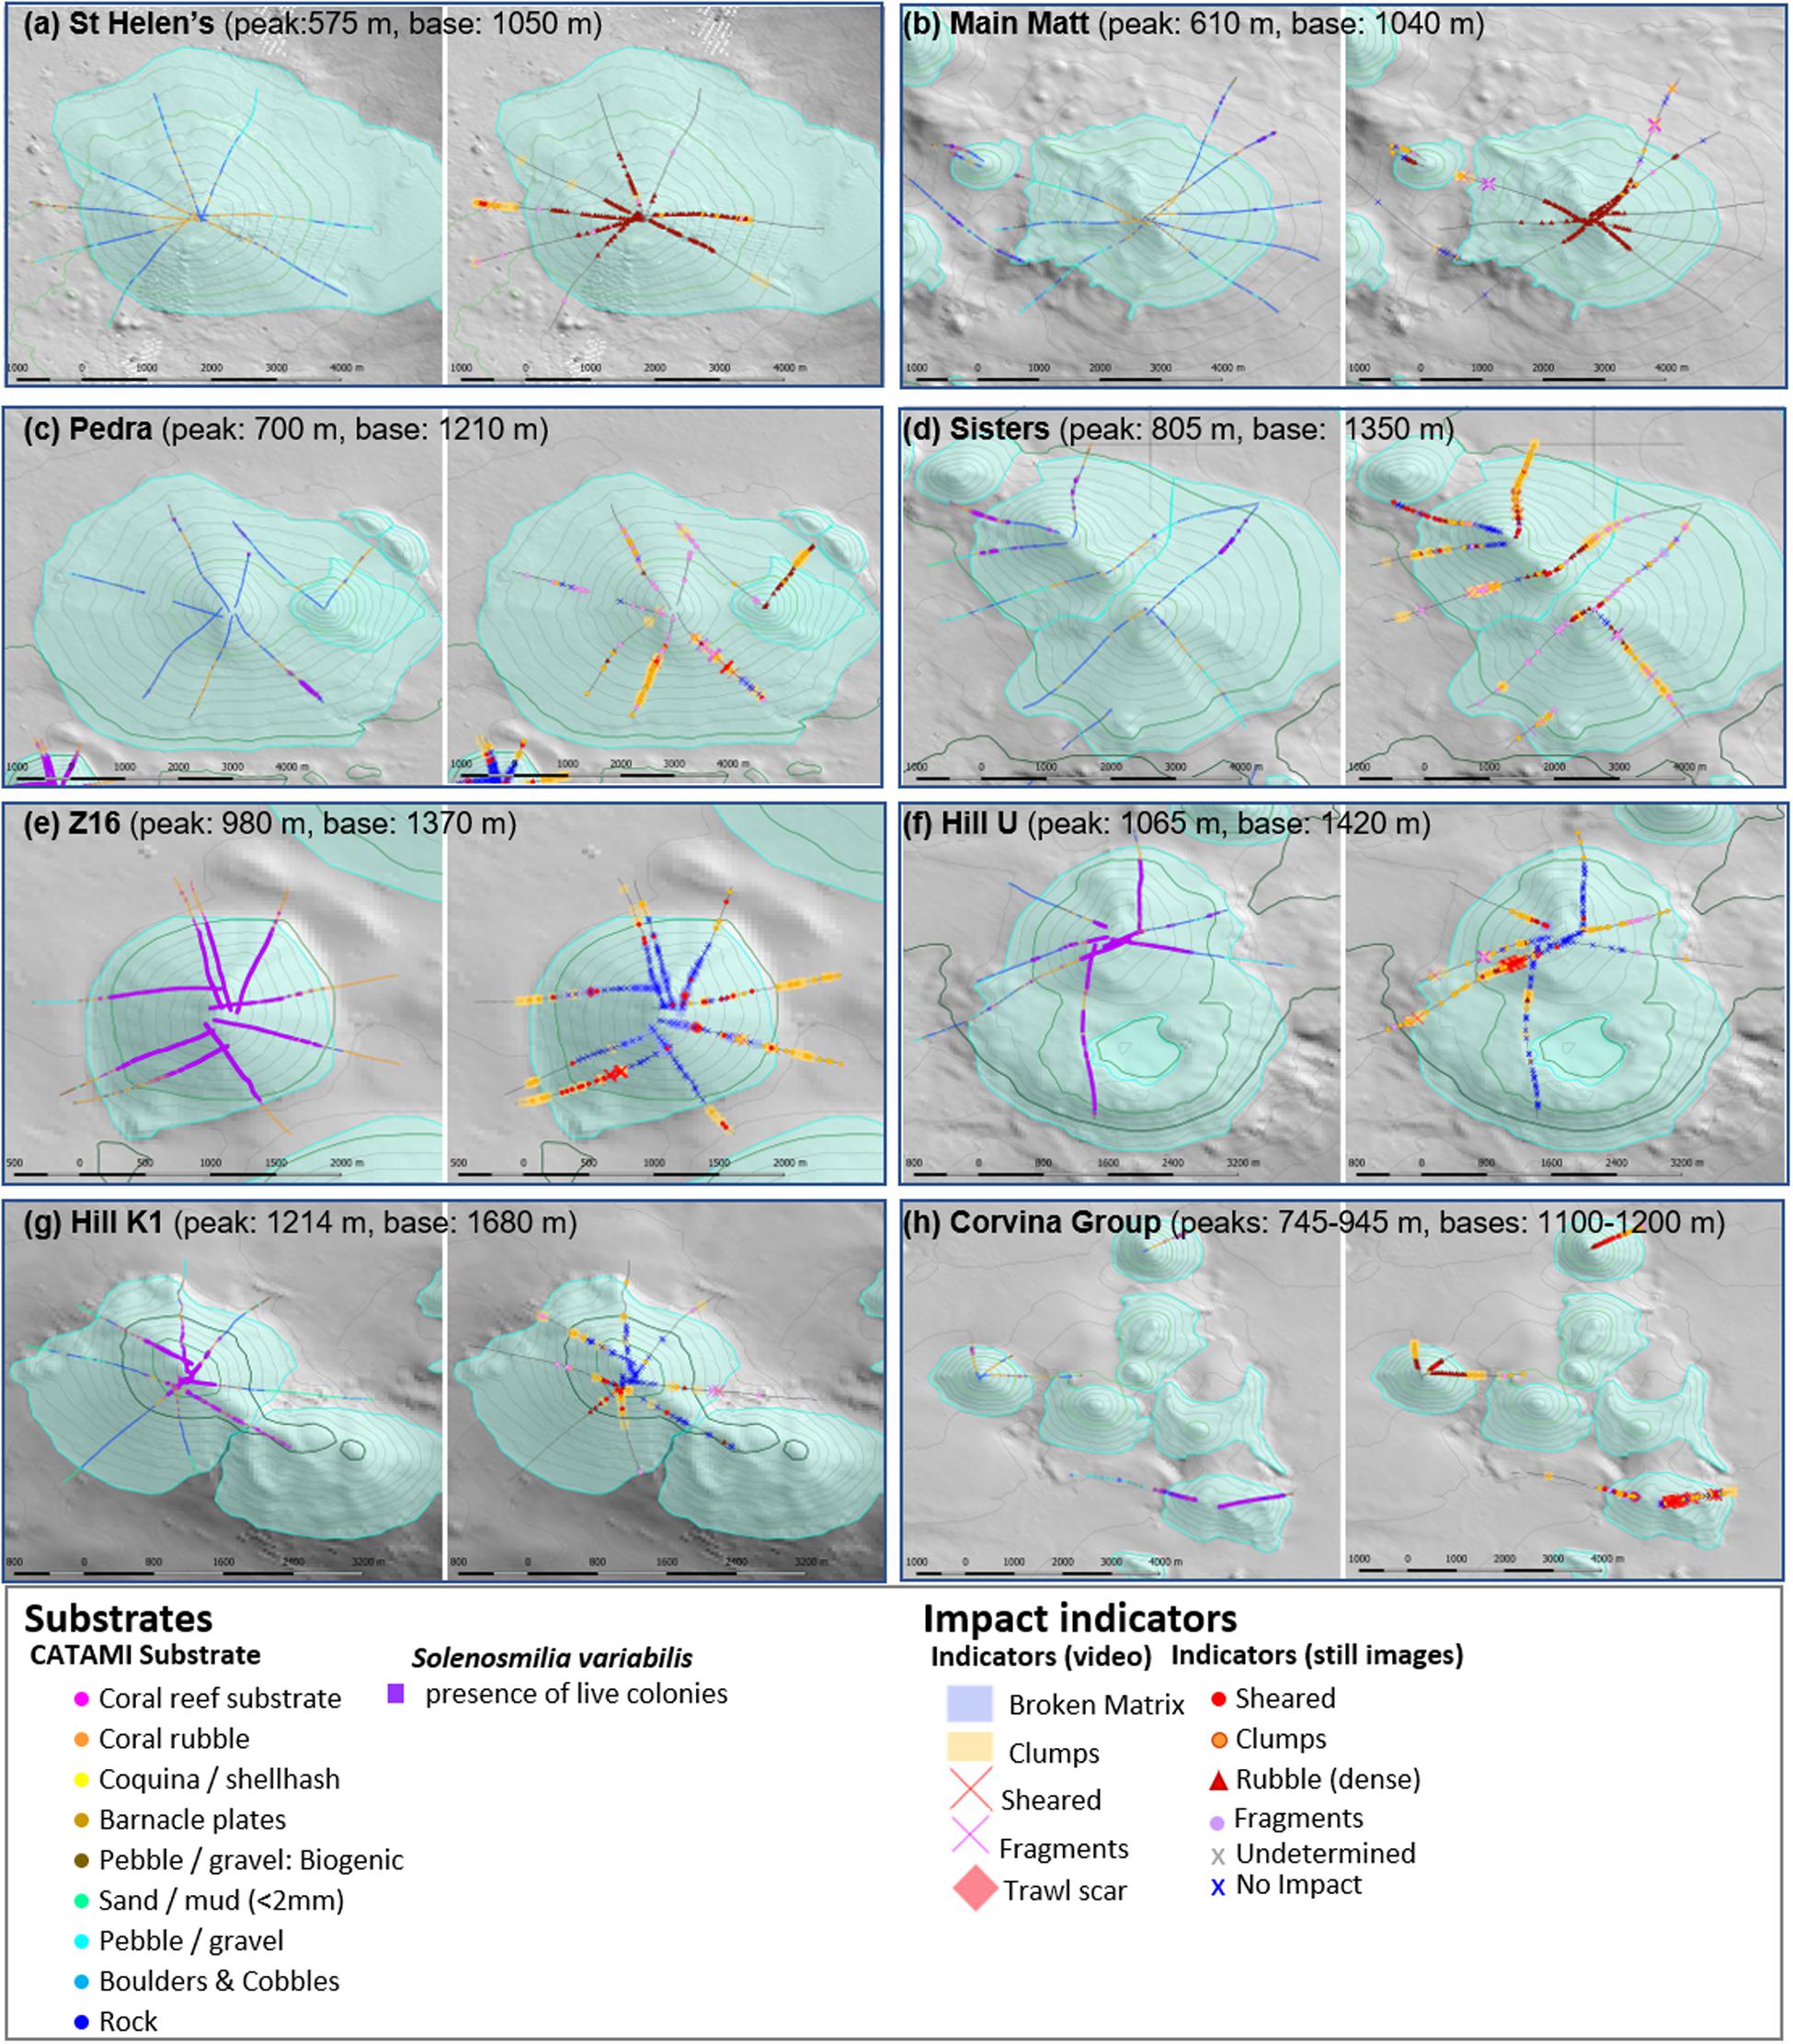
Figure 6. The eight Focal areas sampled with multiple transects showing detailed mapping of impact indicators, substratum types and distribution of live coral matrix. Their locations are shown in Figure 1. Supplementary Figure 1 shows example detail of the four annotation types for Hill U and expanded images to show detail for all Focal areas are shown in Supplementary Figure 2. Most focal areas contain individual seamounts, although Pedra has a parasitic cone (Mongrel) and Main Matt has a second peak (NW Matt); the Corvina Group has six inter-connected seamounts: (a) St Helens, (b) Main Matt, (c) Pedra, (d) Z16, (e) Corvina Group, (f) Hill U, (g) Sisters, and (h) Hill K1.
In contrast to St Helens and Main Matt, the two other large, relatively shallow and heavily trawled seamounts (Pedra and Sisters; summits at 700 and 805 m depth, Figures 6c,d) lacked large accumulations of coral rubble around their peaks. These seamounts were instead characterised by relatively abundant detached clumps and infrequent areas of sheared S. variabilis. There were extensive areas of bare rock on the flanks of both Pedra and Sisters, where coral rubble and fragments were widespread. The rubble contained some Dendrophyllia and E. rostrata but S. variabilis was dominant. Extensive, intact areas of S. variabilis were observed only in localised areas in depths >1,000 m; this too showed evidence of shearing in places. Scattered and small areas of live E. rostrata and small isolated clumps of live S. variabilis, and fragments of both species, were observed around the peaks on Sisters on rugged bottom that would be difficult to access with bottom trawls. There were numerous observations of lost trawl gear and gear marks on and around both seamounts (Figure 5). These observations collectively indicated that shallow scleractinian coral reefs were not as extensive on the upper parts of Pedra and Sisters as on St Helens and Main Matt. The deeper living S. variabilis was the dominant species on both seamounts, but extensive coral reefs were restricted mainly to depths >1,000 m. It is possible that this species may have been more abundant at shallower depths before trawling – especially on Pedra where there are extensive areas of trawlable bottom; there was, however, no extensive rubble as was observed on the shallowest seamounts.
Three deeper seamounts [Z16 (982 m), Hill U (1,065 m) and Hill K1 (1,214 m)], Figures 6e–g, respectively) were each characterised by extensive areas of deep-sea coral reef formed by S. variabilis, and showed some evidence of trawling impact. This was most apparent on Seamount Z16 that is immediately adjacent to Pedra Seamount and within its block of very high trawling effort (block 7). Seamount Z16 had a near-contiguous cover of S. variabilis that was mostly unimpacted; there was, however, occasional coral shearing observed on all camera transects, a concentration of shearing and detached coral clumps on the southwest flank, and trawl scars near the peak. Numerous coral clumps were observed around the base of the seamount on all transects; these were interpreted as a mix of natural reef erosion (as this comprised mostly dead matrix), possible translocation of coral by-catch from Pedra seamount, but also local disturbance. The slightly deeper Seamount Hill U also had extensive areas of S. variabilis but a higher degree of impact (Figure 6f). Deep-sea coral reef was mostly unimpacted on the northern and southern transects, but there were large areas of sheared coral with coral clumps, particularly on the western flank. As for Z16, areas of dead coral clumps at the base of the seamount were interpreted partly as natural reef erosion at and beyond the present-day deep limit of live S. variabilis reef and partly local disturbance. The third seamount, Hill K1 (Figure 6g) was relatively deep. Dense S. variabilis was restricted to the peak with most unimpacted although shearing and coral clumps were observed in the southwestern sector. On the flanks, all of which were below the depth of live S. variabilis, there were extensive areas of unimpacted dead coral reef and bare rocky areas (Figure 6g). There was lost gear and gear marks on Seamounts Z16 and Hill U.
The three small seamounts in the eighth Focal area – the Corvina Group (Figure 6h) – reinforce the depth-related patterns observed in greater detail in the seven other Focal areas. The shallowest (Punchs Hill, summit at 740 m depth) had large rubble accumulations (predominantly Dendrophyllia) around its peak, sheared coral matrix and mixed-species rubble on its flanks, and accumulations of S. variabilis coral clumps at its base. Isolated small areas of Dendrophyllia and live S. variabilis clumps were observed on rugged bottom, but the proportion of unimpacted seabed was very small (Figure 6h). The Coral Hill seamount (summit at 745 m depth) was sampled with only a single transect. Still, it had a similar pattern to Punchs Hill, with rubble accumulation below the peak, sheared S. variabilis coral matrix on the flank, and accumulations of S. variabilis coral clumps at the base (Figure 6h). Seamount Z4 was the deepest (summits at 945 m depth) in this Focal area and, similarly to other seamounts at this depth, characterised by a high cover of S. variabilis reef. Z4 was unimpacted in places, particularly on rugged and steep slopes, but there were many observations of sheared matrix and accumulations of clumps (Figure 6h), and trawl scars below the peak. Lost gear (Punchs Hill) and gear marks (Z4) (Figure 5) corroborate the trawling activity there and the high level of trawling effort tallied for the block containing the Corvina Group of seamounts.
Collectively, these observations highlight the difference in the species-mix of dominant framework-building scleractinian coral species between deep and shallow (∼ ≪cps:it > 950 < /cps:it≫ m) seamounts. We demonstrate unequivocally that there has been some trawling on all these seamounts, notwithstanding earlier assumptions that some (Z16, Hill U and Hill K1) were classified as being “untrawled” (Althaus et al., 2009). We find that fishery-independent data demonstrate that commercial trawling logbook data may not be reliable to accurately interpret trawling effort and infer impact at the scale of small or closely adjacent individual seamounts.
Patterns on Other Individual Seamounts
The analysis of trawling impact was then extended to the seamounts surveyed outside the eight Focal areas – a combined total of 51 seamounts. Nearly all surveyed seamounts (45 of 51, or 88%) showed some sign of damage attributable to bottom trawling (Figures 7, 8). There was, however, also a sizeable proportion (>25%) of unimpacted deep-sea coral reef on many seamounts (20 of 51, or 39%).
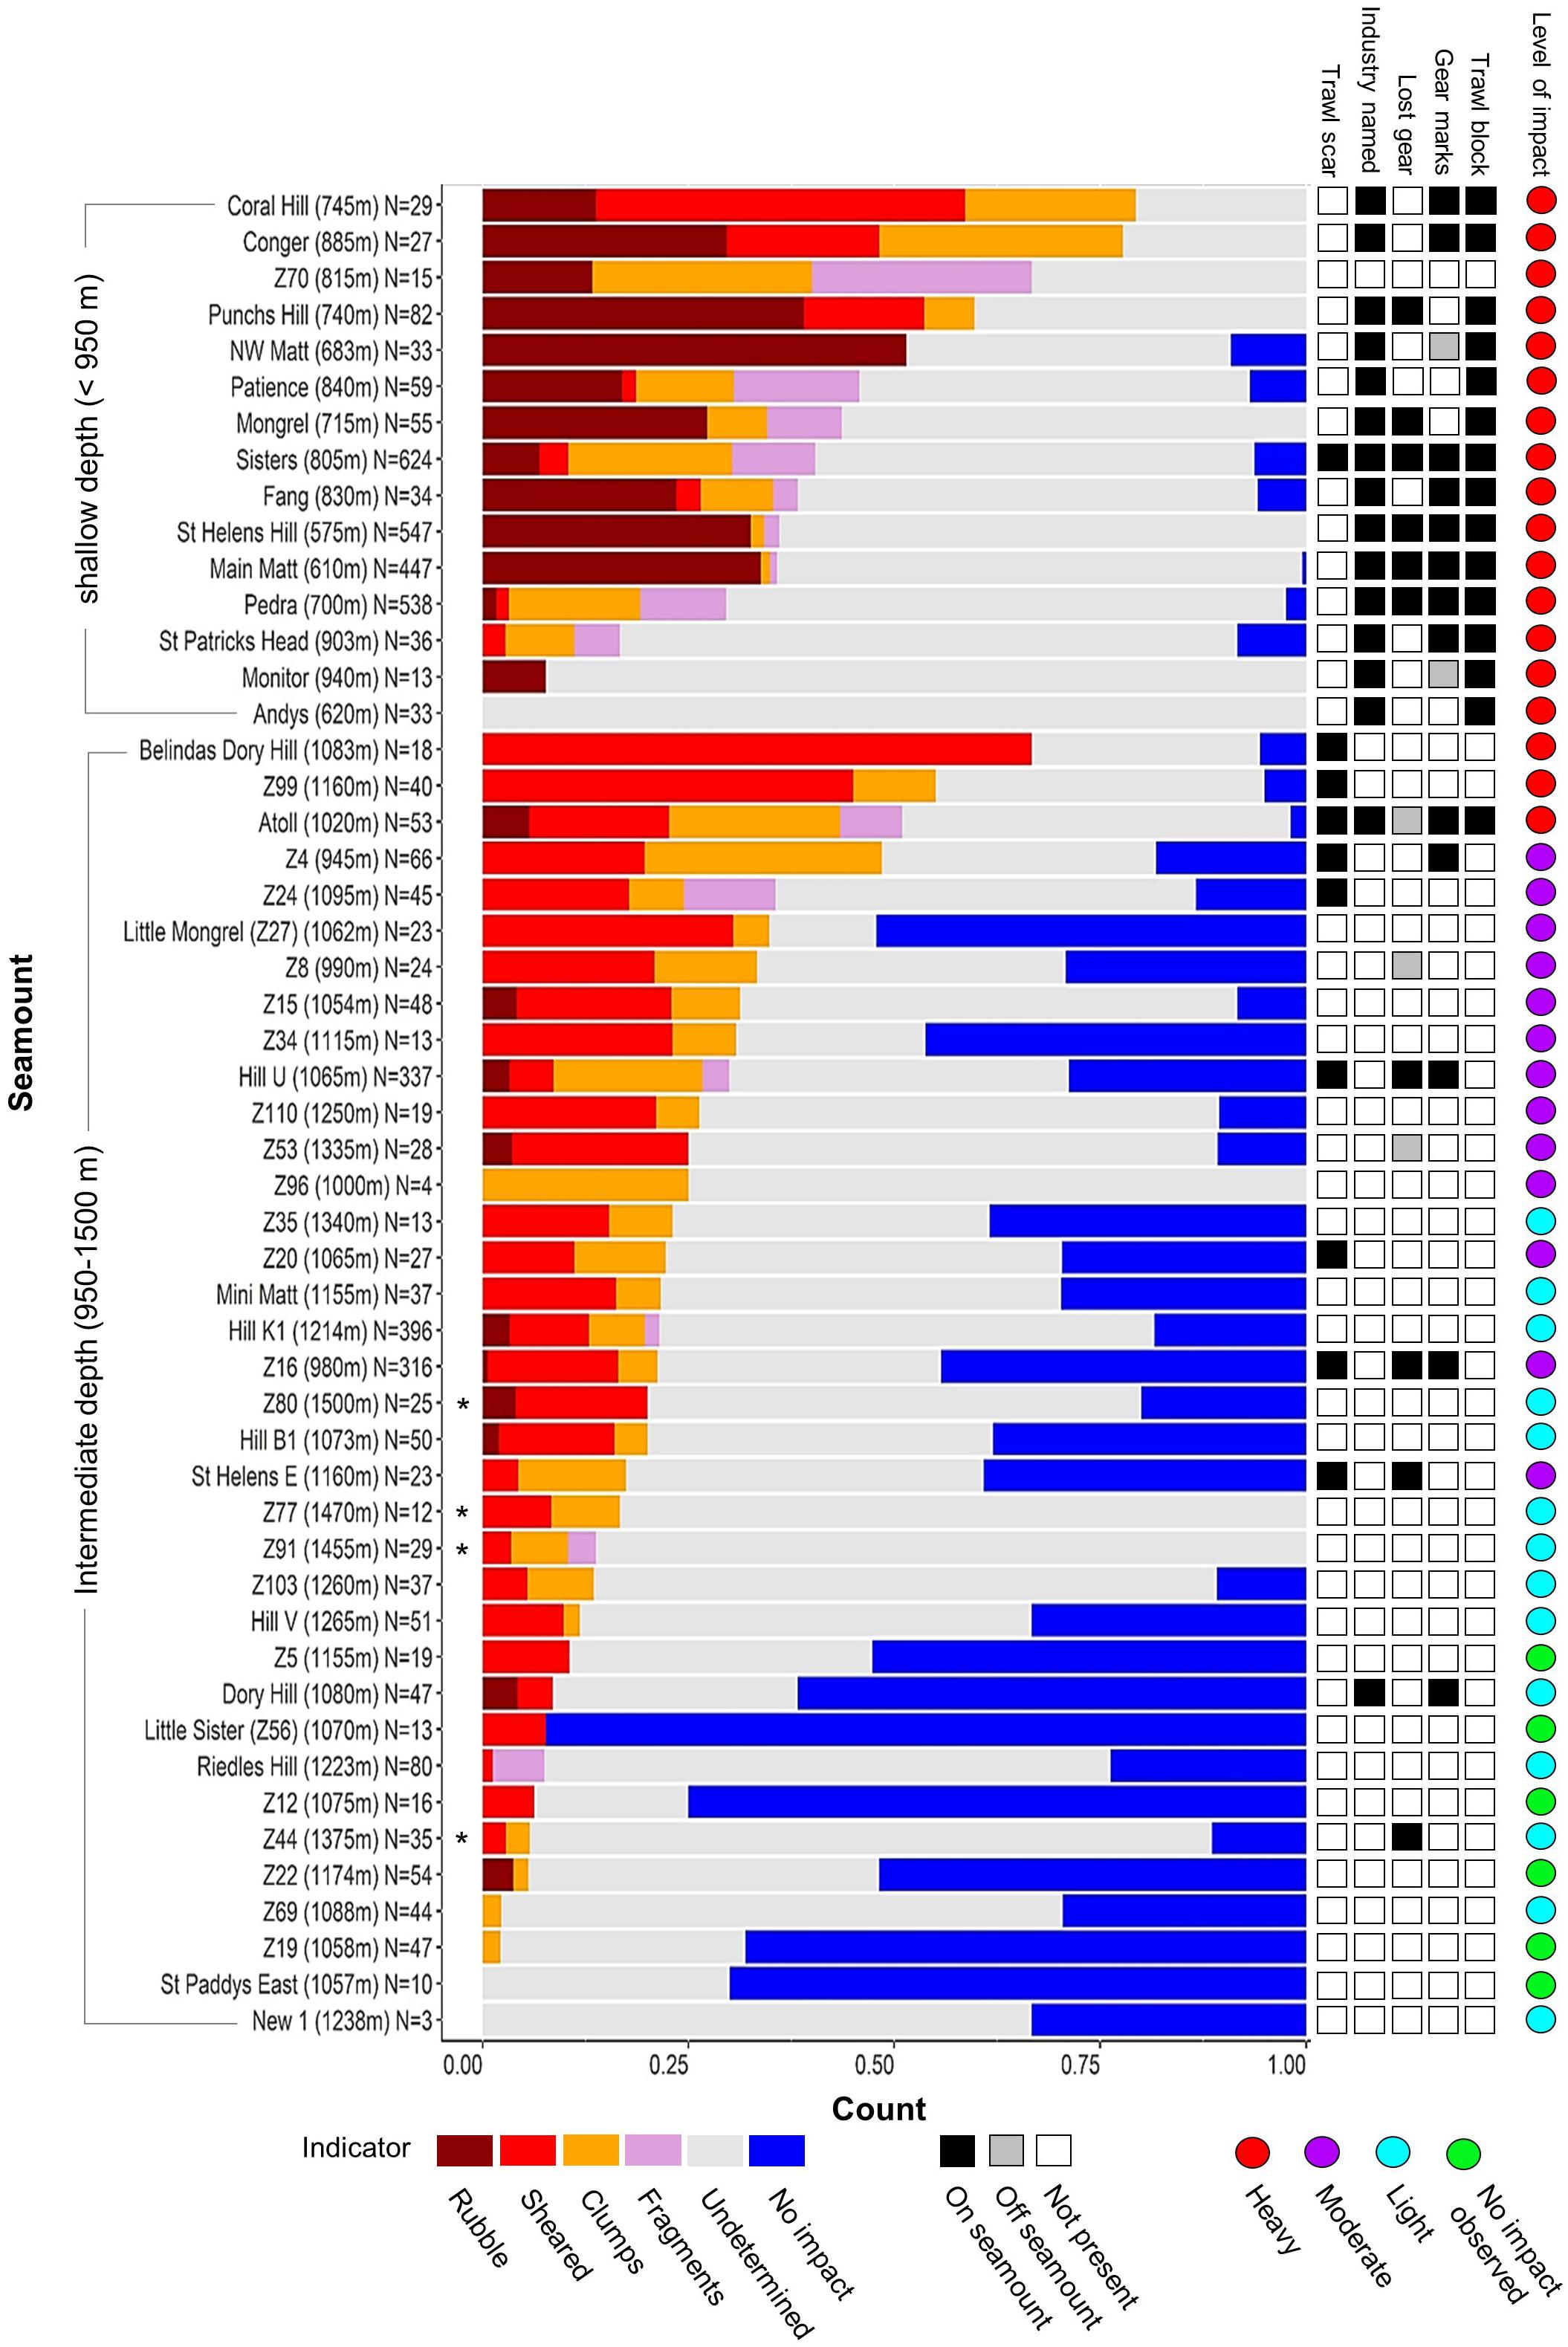
Figure 7. Proportions of impact indicators (Table 2) used to classify the “level of impact” on individual seamounts. Histogram shows proportions of numeric indicators sorted by combined proportion of impact indicators for shallow and intermediate depth seamounts separately; shallow and intermediate depth seamounts distinguished by the core depth range (950–1,350 m) of the dominant scleractinian coral (Solenosmilia variabilis); an asterix identifies deep seamounts >1,350 m. Side bar shows the presence-only indicators – including seamount membership of blocks of high trawl effort and those named by the fishing industry).
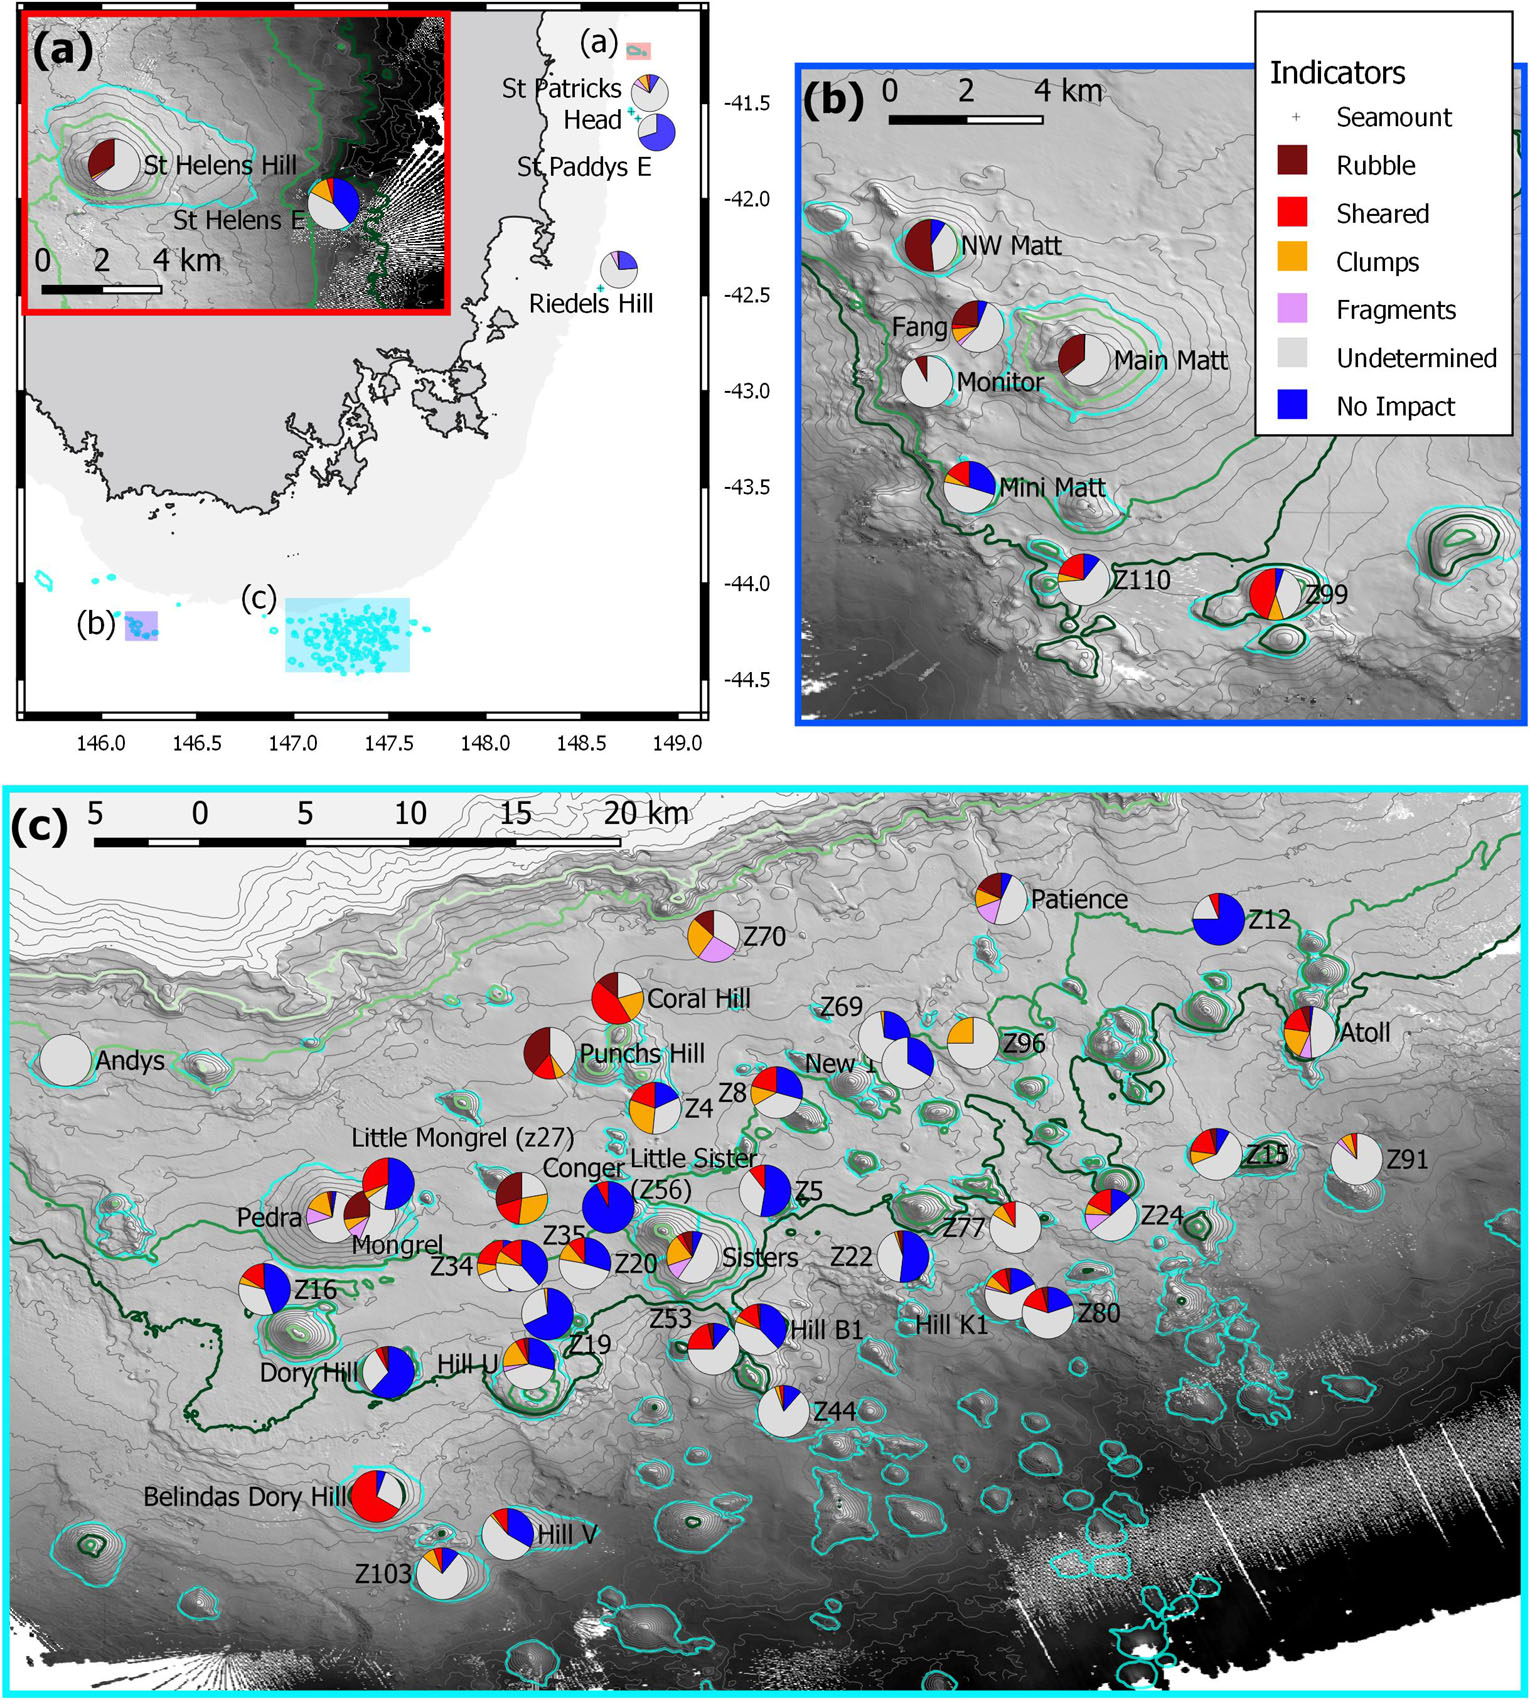
Figure 8. The spatial distribution of the numeric impact indicators (Figure 7) on individual seamounts. Contours are 50 m intervals with 650, 950, 1,350, and 1,500 m highlighted as light to dark green; the seamounts are outlined (cyan). (a) Overview map showing the 500 m depth mask and the relative locations of the three maps with inset of (a) the seamounts off St Helens; (b) sites in and adjacent to the Tasman Fracture AMP; (c) sites in and adjacent to the Huon AMP.
The depth-related patterns of impacts seen in the Focal areas were also seen across the study area. Thus, the 16 shallowest seamounts (<950 m) were characterised by accumulations of rubble, often with high proportions of coral fragments and/or coral clumps, and scarcity or absence of unimpacted reef areas (Figure 7). Extensive areas of bare rock overlain with scattered coral rubble on Andys and Monitor were scored as “undetermined” but, given that they were primary targets in high trawl effort blocks, it is likely their deep-sea coral reefs were removed from the areas surveyed. The relatively large group of 31 seamounts peaking at intermediate depths (∼950 and 1,350 m) varied greatly in both the proportions of the impacts seen and the cover of unimpacted coral matrix. Three seamounts (Belindas Dory Hill, Z99 and Atoll) had very high (>75%) combined proportions of rubble accumulation, fragments, shearing and clumps; another nine had a moderately high percentage (>25%), the remaining 15 were lower with three having no coral-related impact observed (Figures 7, 8). The deepest seamounts (peaks > 1,350 m) tended to have high proportions of undetermined impact, consistent with a high abundance of naturally eroded and sediment-clogged S. variabilis reef, and small proportions of an intact matrix which was primarily dead S. variabilis (Figure 7).
Extrapolating Observed Trawling Impacts to all Seamounts
Based on our observations of trawling impact, we developed a simple step-wise hierarchical classification process to define five relative “levels of impact” for individual seamounts (Figure 9). The classification included the 51 surveyed seamounts and the 140 unsurveyed seamounts, and used criteria based on quartiles of observed impact and no impact (surveyed seamounts only); presence in a trawling effort block; being within the fishery depth range (<1,500 m); and fishing history (whether the seamount was named by the fishing industry or direct evidence of fishing activity). The scheme used quartiles as thresholds for the image-derived proportional impacts data because they are free of underlying assumptions or biases, and because exploratory multivariate analysis failed to provide a robust alternative. The proportional indicators were summed because their relative severity could not be objectively distinguished; similarly, the presence-absence indicators were treated equally because there was no objective way to assess their relative importance.
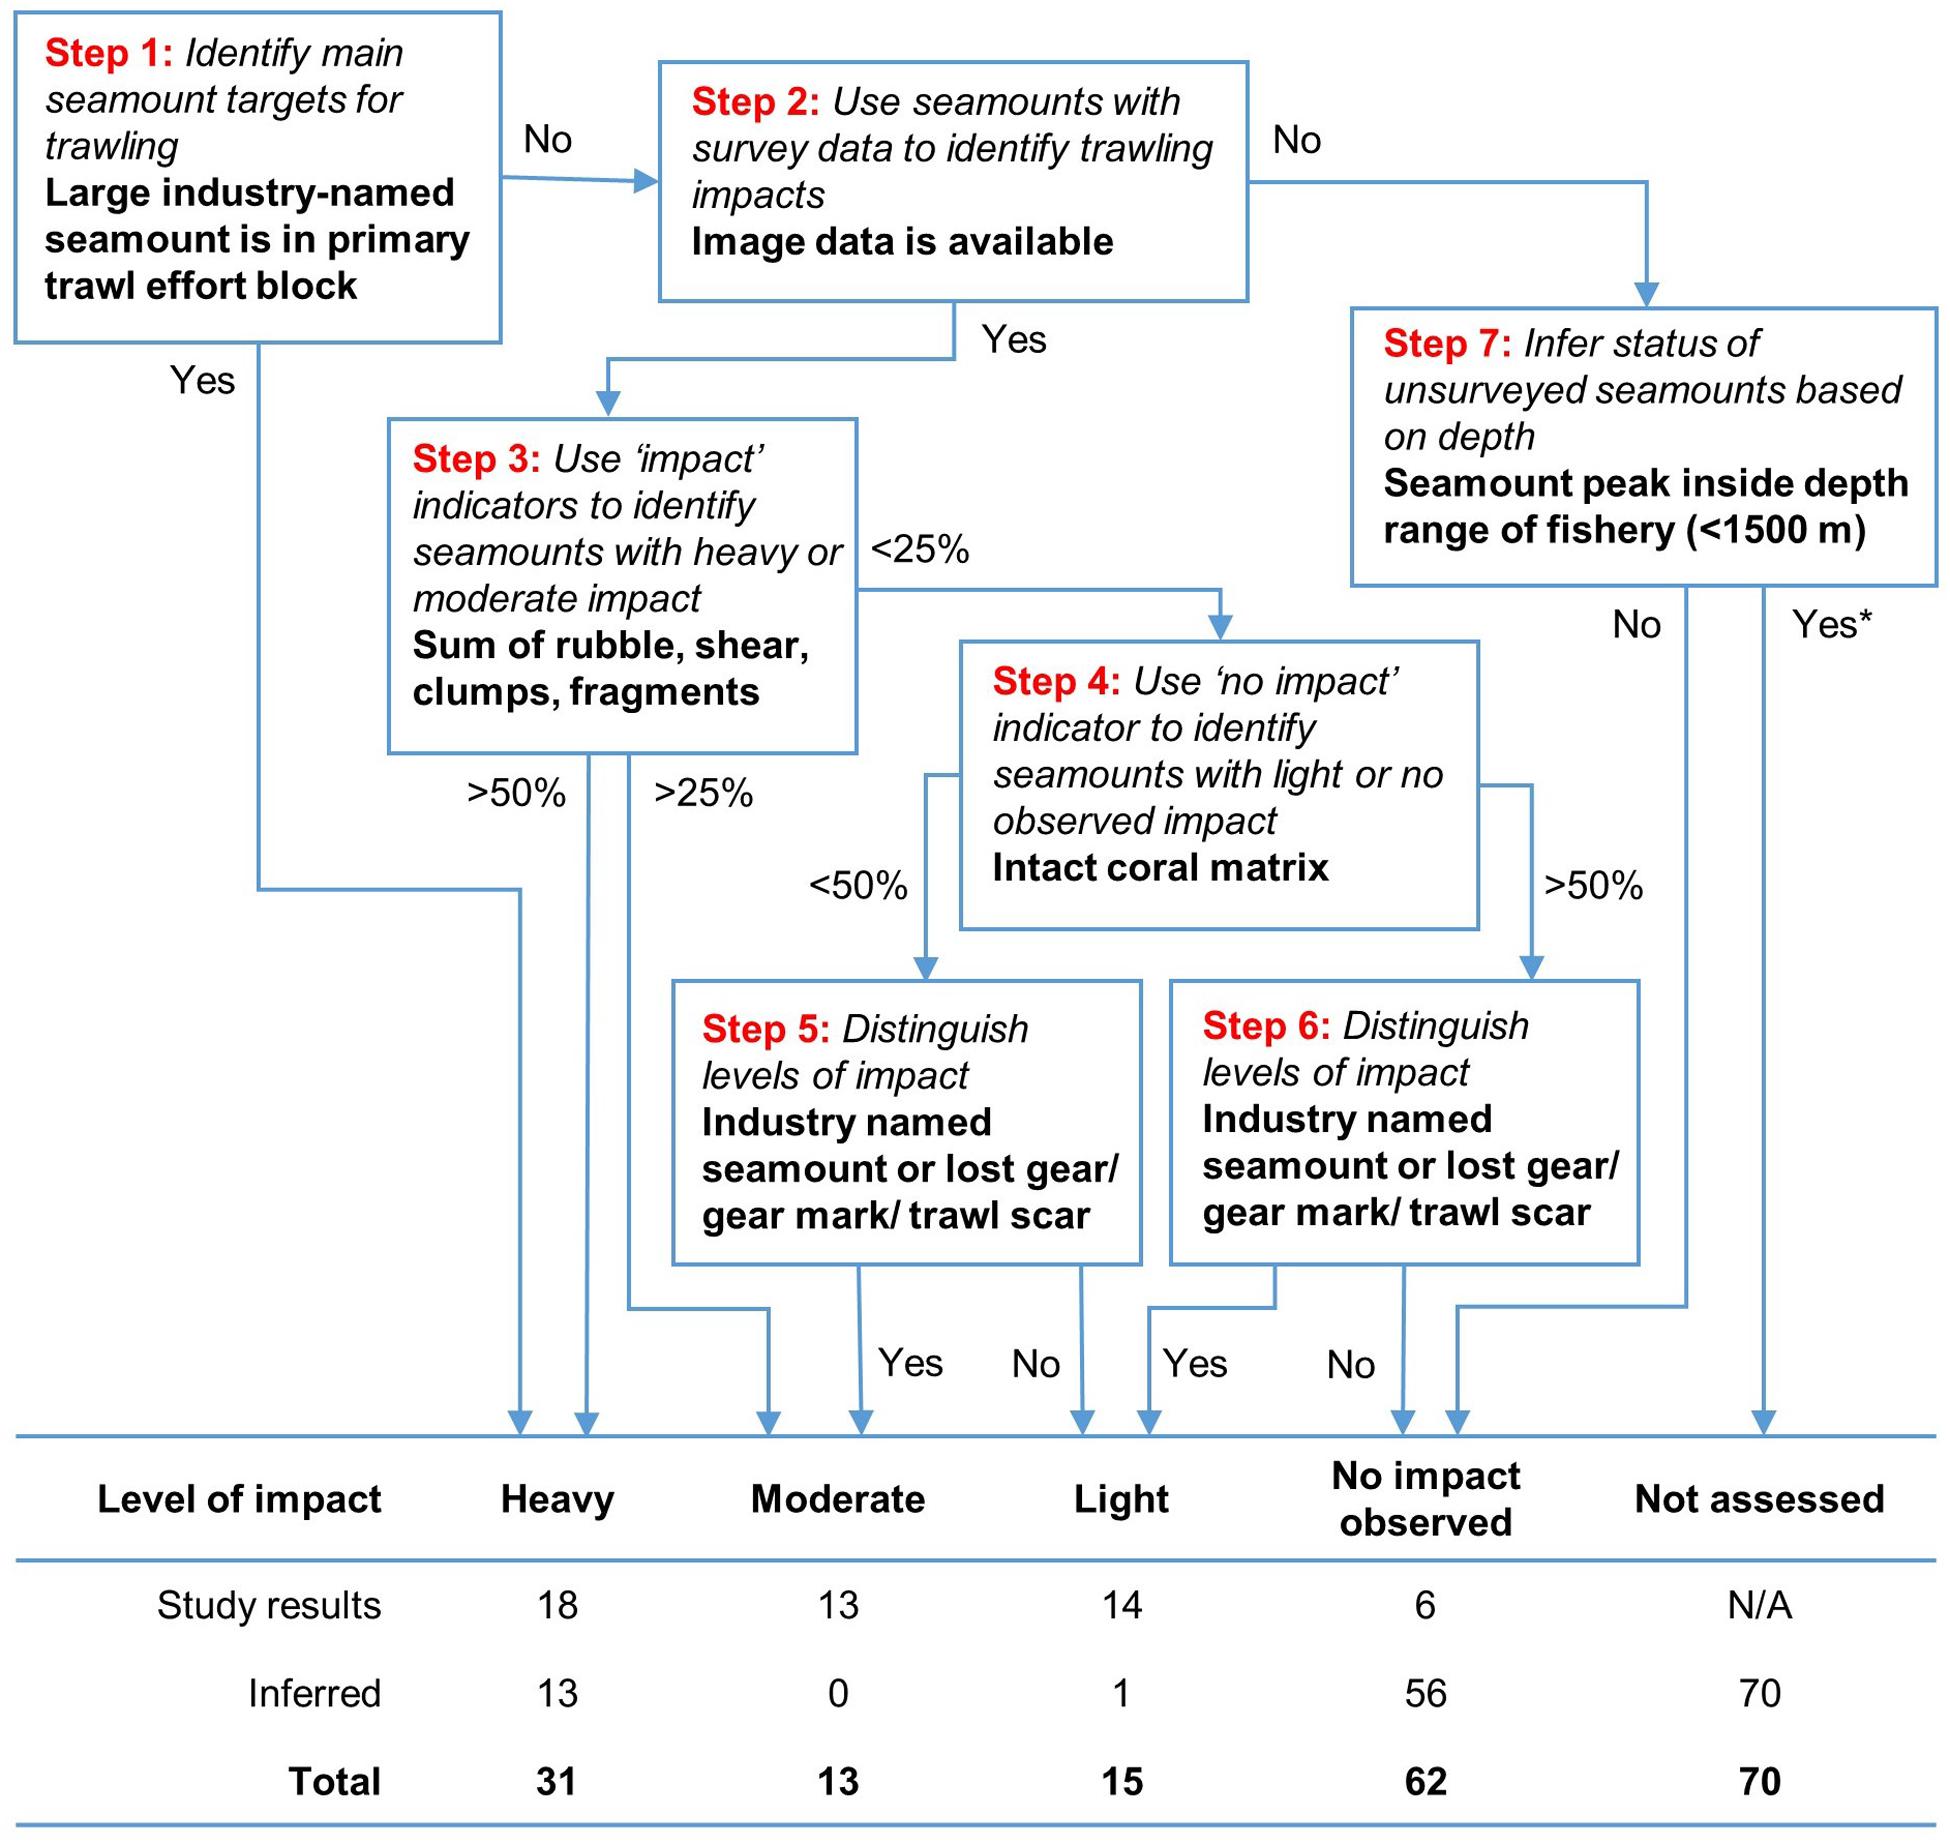
Figure 9. A step-wise hierarchical classification process to classify relative levels of impact on individual seamounts. The steps use a seamount’s membership of blocks with high trawl effort, arbitrary thresholds of 25 and 50% to split the proportional indicators of “impact” and then indicator of “no impact,” and presence of lost gear/gear marks/trawl scars and/or industry-named seamounts. Impact on unsurveyed seamounts inferred from their membership of trawl effort blocks and whether or not they peak inside the operating depth of the fishery.
Applying this method to the 51 surveyed seamounts, we classified 18 as heavily impacted, 13 moderately impacted, 14 lightly impacted and six without signs of impact. Extrapolating the same approach to the 140 unsurveyed seamounts in the study area, we classified 13 as heavily impacted (based on fishing history), one lightly impacted (a named seamount), 56 unimpacted (all from >1,500 m depths beyond the operating range of the fishery), and 70 that were not able to be assessed (within fishery depth range but no fishing history or observation). The classification is mapped in Figure 10.
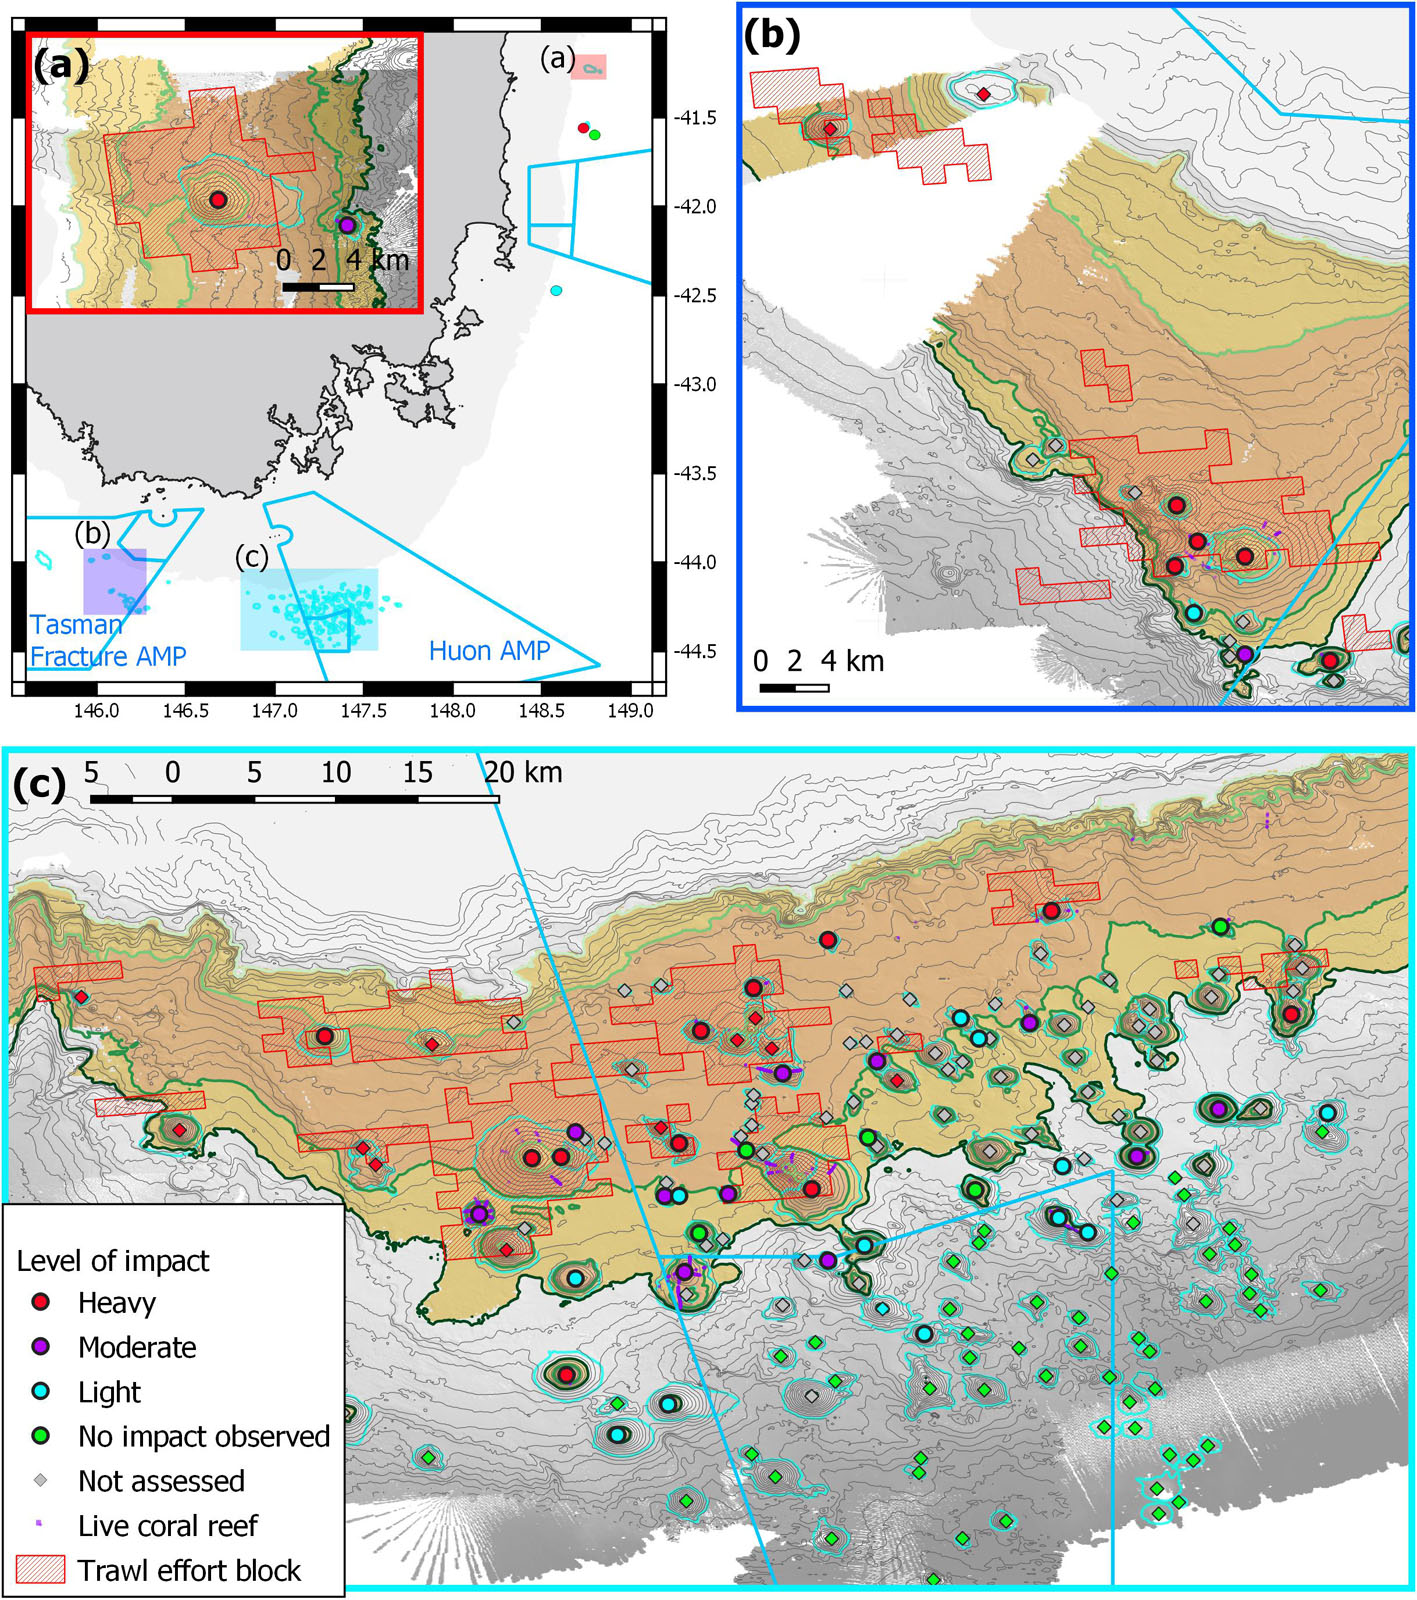
Figure 10. Map of region showing the relative level of impact for surveyed seamounts (circles) and unsurveyed seamounts (diamonds), and areas of live deep-sea coral reef formed by Solenosmilia variabilis. Background shading shows primary depth ranges relevant to scleractinian coral reefs and trawling effort: pale orange – inshore of seamount fishery (500–650 m); brown – shallow (650–950 m) range of coral reef and blocks of concentrated trawling effort; orange – intermediate (950–1,500 m) depth range of scleractinian coral reef and some trawling effort; and grey – deep (>1,500 m) range beyond the depths of living scleractinian coral reef and operational depth of trawl fishery. Australian Marine Park (AMP) boundaries in light blue: (a) overview map showing the relative locations of the three study areas, with inset showing sites at the St Helens Seamount and one adjacent seamount; (b) sites in and adjacent to the Tasman Fracture AMP; (c) sites in and adjacent to the Huon AMP.
Because the depth distribution of trawl fishing is driven primarily by target species with a substantial overlap in depth range (∼650–1,300 m) as living scleractinian corals in this area (Figure 4), and frequently concentrate around the same topographic features, there is a strong overlap of heavy to moderate levels of trawling impacts with areas that are likely to support, or have supported, deep-sea coral reefs. This is most evident in the shallowest range of this study area (∼650–950 m depths), but variable in intermediate depths (950–1,500 m) where seamounts are characterised by a mix of impacts ranging from heavy to no impact.
An a posteriori check of the “expert” classification against a statistical multivariate classification (see Supplementary Material) indicated no inconsistencies or anomalies. The between-classification differences for a few individual seamounts were explainable, while general patterns were consistent and intuitive: shallow seamounts in areas where trawling was concentrated and which were named by the fishing industry were those classified as heavily impacted; very deep seamounts outside the range of target species and trawl exposure were classified as unimpacted; and seamounts at intermediate depth (where image data shows high between-seamount variability in level of impact) were variously classified, with unsurveyed seamounts treated cautiously and were mostly “not assessed.”
Discussion
Attributing Signs of Change to Trawling
Estimating the nature and extent of direct trawling impacts on seamount scleractinian coral reefs in images was surprisingly taxing. The main challenges were to avoid false-positive identification of trawl impact stemming from either (1) misidentifying areas that naturally lacked coral reef as areas where coral had been removed, or (2) attributing trawling as the cause of natural processes of reef degradation.
Bioerosion, dissolution and natural breakage gradually degrade the structural integrity of coral matrix in the deep sea (Roberts et al., 2006). These processes can lead both to the appearance of shear (white tips at the ends of multiple coral branches) and to accumulations of debris in the form of clumps and rubble. Debris may form distinct zones of “rubble apron” habitat around the bases of carbonate mounds composed of the scleractinian coral Desmophyllum pertusum (Linnaeus, 1758) (Howell et al., 2010) with debris becoming more scattered and composed of smaller fragments as the distance from mounds increases (Wienberg et al., 2008). As well, if reefs are not exposed to a sufficiently high hydrodynamic regime they can be buried by mobile sediment as it is baffled and trapped in the reef matrix (White et al., 2005; Roberts et al., 2006). This process may occur over large spatial and temporal time scales: in the North Atlantic growth of carbonate mounds formed by D. pertusum is cyclic with phases of reef development during inter-glacial periods and burial during glaciation (Roberts et al., 2006), and fully buried mounds have been observed (Colman et al., 2005). Given the potential for these signals of natural processes to also be observed in our study area it was particularly important to recognise and distinguish between natural and trawl-induced causes of (1) rubble accumulation, and (2) partially buried reef with shear and/or patchy and scattered distributions.
We adopted a conservative approach to the interpretation of the indicators to minimise the risk of false-positive identifications of trawl impact. First, we scored only “on-seamount” imagery, thereby excluding seamount bases (∼15% of total data) where natural accumulations of rubble were more likely, where naturally degraded reef was more abundant, and where areas of muddy and sandy sediments and bare rock were prevalent (Figure 6). Secondly, we classified all observations that either lacked evidence of impact or were uncertain in terms of whether an impact was being observed, as “undetermined.” This category was relevant both to account for “on-seamount” areas of featureless rock or sediment substrate where there was neither evidence nor lack of evidence of impact, and to eliminate the risk of misidentifications of impacts, particularly on deep seamount flanks below the depth of living coral reef (∼1,350 m) where there are extensive areas of dead S. variabilis (Thresher et al., 2014), and where naturally degrading, sediment-clogged and partially buried reef areas were more abundant. We acknowledge that by including the category “undetermined,” we may have underestimated some trawl-impacts. In that sense, ours are minimum estimates of impact. It would, however, be invalid to do the opposite. Inferring (wrongly) that an effect is caused by trawling when no unequivocal evidence exists creates a false-positive and becomes speculative. Thirdly, we checked for consistency in our classifications by cross-referencing still images and video observations – maximising the strength of each format. For example, the higher resolution of stills was important to confirm the detachment of clumps, while the moving perspective of video was essential to detect narrow trawl scars through intact coral matrix. Fourthly, our observations of lost trawling gear, gear marks and trawl scars were treated as presence-only data to avoid double-counting. Finally, we “reality checked” our interpretation of much of the imagery against the distribution of trawling logbook data, albeit at a relatively coarse spatial scale (Figure 5).
Accumulations of coral rubble in the vicinity of deep-sea coral reefs are commonly attributed to trawling. While this is not always substantiated, attribution in many cases is based on compelling images of lost gear or gear marks amongst scleractinian rubble (Fosså et al., 2002; Hall-Spencer et al., 2002; Clark and Dunn, 2012; Baco et al., 2020; Du Preez et al., 2020). In our data, extensive accumulations of coral rubble on shallow seamounts (those peaking in <950 m depths) were interpreted as fragmentation of reef matrix due to recent and repeated trawling. This attribution was consistent with patterns of trawl effort distribution, and also consistent with a marked contrast with rubble from two other areas that appeared to have accumulated naturally. Thus, small areas of rubble at the base of the adjacent steep continental slope and on Fang Seamount were characterised by a mix of scleractinian coral with other material (variously, pebble-gravel sized clasts, barnacle plates, mollusc shells, echinoderm tests, octocoral fragments and hydrocoral skeletons); fragments were of mixed size but were mainly relatively large, and uncompacted with many interstitial spaces; and the rubble was heterogeneous in structure and colour, but mostly darker (coated with ferromanganese oxide) (Supplementary Figure 3). In contrast, rubble on the shallow seamounts formed extensive patches, was predominantly composed of coral, it was fragmented into relatively small pieces, more uniform and worn in appearance and often compacted, and mostly white in colour (Supplementary Figure 3).
Where rubble accumulations were low or absent on shallow seamounts in our study area (Andys, Monitor, Pedra and Sisters), there were extensive areas of bare rock either overlain with scattered coral rubble (Andys and Monitor) or with substantial scattered fragments and clumps (Pedra and Sisters). Attributing these signs to trawling impact is consistent with the observation of occasional small patches of live reef and dead reef base around the more rugged peaks of some shallow seamounts and corroborated by the location of all shallow seamounts in trawl blocks of very high to high effort (Figure 5). Our observations of trawling impact are also consistent with observations off New Zealand on similarly small seamounts exposed to similarly heavy/very heavy levels of trawl intensity (100–1,000s of individual tows). Thus, extensive damage to coral habitats can be caused by a small number of tows (O’Driscoll and Clark, 2005; Clark et al., 2019), while repeated trawling on the summit areas may remove almost all the coral (Clark and Tittensor, 2010).
Our strategy to classify relative “levels of impact” on individual seamounts was based on using commercial trawling logbook and image data together in a hierarchical and conservative manner. We were not able to rely solely on quantifying the number and directions of trawl tows overlapping or in close proximity to individual seamounts of varying size (O’Driscoll and Clark, 2005; Clark and Tittensor, 2010) because our initial evaluation showed that cumulative spatial uncertainties in logbook data stemming from variable and low resolution of spatial reporting (+1.85 km for both start and end position plus unknown vessel to trawl gear offsets), were greater than the footprint of the small seamounts and/or the separation between them. Although very detailed examination of data and subjective manual assignment can reduce some of these limitations (e.g. Clark et al., 2016b), in general they preclude using logbook data to estimate effort per seamount. This study shows that two previous “logbook-only” classifications of some Tasmanian Seamounts as very heavily fished to very lightly fished (Koslow et al., 2001; Clark et al., 2019) or fished vs. never fished (Althaus et al., 2009; Williams et al., 2010) include some misinterpretations, especially for “never fished” Seamounts Z16 and Hill U. Our reanalysis provides evidence of lost trawl gear on Hill U where no trawling effort was mapped and therefore an underestimate of the spatial extent of trawl effort distribution. In contrast, Seamount Z16 is overlain by grid cells of high effort and it is part of the Pedra effort block with very high effort, whilst imagery shows it has extensive cover of coral reef (Figure 6e) and the largest total reef area observed in the study area (Williams et al., 2020).
Impact at the Seascape Scale
On the Tasmanian continental slope, as has been observed elsewhere in the deep sea (Clark et al., 2016b; Du Preez et al., 2020), the depth distribution of historical bottom trawling strongly overlaps the depth ranges of scleractinian coral reef (Figures 4, 10). At the regional scale, some 300 nm from Sharks tooth to St Helens, our data and extrapolation indicate there is a range of strongly depth-related impacts on individual seamounts: heavy (31 seamounts), moderate (10), light (18) with no impact observed on 62 (mostly inferred on seamounts peaking at >1,500 m), and 70 not assessed.
In the shallowest fishery range (∼650–950 m depths) off Tasmania, our data indicate there has been substantial and widespread removal of scleractinian coral reef. Based on more limited data, Koslow et al. (2001) postulated that virtually all coral aggregate, living or dead, had been removed from shallow seamounts by the fishery, however, they assumed all the deep-sea coral reef was formed by S. variabilis. Although we were not able to consistently or quantitatively assess the composition of impacted rubble, our observations show that in ∼600–900 m depths, the bulk was made up by different species: Dendrophyllia spp. and some Enallopsammia. Shallow accumulations also contained Madrepora in bands or patches from ∼660 to 1,050 m depths but rarely Solenosmilia which was more typically present in rubble as dislodged or scattered matrix and fragments from ∼800 to 1,200 m depths.
Determining the significance of an impact on vulnerable marine ecosystems (VME) requires knowledge of their status before impacts occur (Baco et al., 2020). Baseline data are, however, very rarely available (Schlacher et al., 2014) including off Tasmania. Whilst we do not know the species composition and cover of deep-water reefs before the fishery commenced, our data presented here constitute a body of evidence that points toward widespread removal of Dendrophyllia and Enallopsammia, and to a lesser extent, Madrepora; this leaves very little scleractinian coral reef at depths <950 m (Figure 10).
We also do not have quantitative data about the amount of coral removed as by-catch. Anecdotal evidence by fishers suggests that “catches” of coral were “substantial” in the early stages of the Tasmanian fishery (Koslow et al., 2001), including some stupendously large individual catches (>10 metric tonnes) (AW, unpublished data). Anderson and Clark (2003) reported a very high by-catch of the coral Solenosmilia variabilis in the first year of a new orange roughy fishery on the South Tasman Rise (just over 200 nm south of Tasmania), with an estimated 1,700 metric tonnes of coral by-catch in trawling operations that took 4,000 metric tonnes of orange roughy.
At intermediate depths (∼950–1,500 m) off Tasmania, where extensive scleractinian coral reefs are formed predominantly by Solenosmilia, the level of trawling impact on individual seamounts appears to be highly variable, ranging from no damage to severe harm to deep-sea coral reefs. Heavily impacted seamounts, those that are either primary fishing targets within areas of highly concentrated trawling (blocks of 100 to 1,000s of trawl tows) and/or where image-derived indicators of impact sum to >50%, may represent a significant and long-term loss of species richness and habitat at the seamount scale. Importantly, however, many areas of intact Solenosmilia coral reef VME remain across the region (Figure 10) (and see Williams et al., 2020). These include many seamounts (20 of 51) where high relief and undamaged coral reef (scored in images as “no impact”) made up sizeable proportions of (>25%) of observations – including on some seamounts (e.g., Z8 and Little Mongrel) where moderate impacts were also observed (indicators of impact >25% images). Surprisingly, there were also patches of unimpacted matrix remaining on some of the most heavily impacted seamounts (e.g., Pedra and Sisters, Figures 6, 10). Importantly, intact deep-sea coral reef extended on to rocky seabed areas adjacent to some seamounts, particularly where seamounts were in close proximity, e.g. Little Sister (Figure 10). The existence of unimpacted coral reef areas in the study area is attributable to complex seabed topography where trawling cannot occur, and to the existence of small features that may not have supported concentration of target species or were too logistically difficult to target with trawling gear. In our data, rugged areas were typically locations where lost gear was observed and this is why “lost gear” was used here only to indicate the presence of trawl impact. We observed sheer cliff-like topography (to 40 m height) and rugged sectors on individual seamounts that are either inaccessible or represent high risks to gear. This parallels observations from New Zealand where Clark and Tittensor (2010) reported isolated patches of coral and an extensive coral area along a lava flow on the flanks of two small but heavily trawled seamounts.
There is unlikely to have been trawling impact beyond 1,500 m depth because this is below the depth limit of concentrations of target species and the depths to which trawls are taken to herd fish into the net. Living framework-building scleractinian coral reef is also absent below 1,500 m (Thresher et al., 2014). The extensive areas of Solenosmilia reef that extend to ∼1,650 m (Figure 4) are made up entirely by dead matrix; die-off may be attributable to a change in historical oceanographic conditions – possibly shallowing of the aragonite saturation horizon – which may set the depth limits for scleractinian corals (Tittensor et al., 2009; Davies and Guinotte, 2011). However, depths >1,500 m are not irrelevant to conservation: other VME indicator taxa, particularly octocorals, are diverse and some abundant (Alderslade et al., 2014; Thresher et al., 2014; Althaus et al., 2017), and extraordinarily high biomass of hormathiid anemones and deep-sea barnacles (Tetrachaelasma tasmanicum Buckeridge, 1999) was observed at ∼2,500 m (Thresher et al., 2011).
Management at the Seascape Scale
The high vulnerability of deep-sea fauna to trawling impacts makes spatial management an important priority, but biodiversity conservation should be balanced with options for open areas that support sustainable fisheries (Clark et al., 2016a). Our findings highlight the benefit that can stem from early management intervention to balance exploitation and conservation, namely that some seamounts representing a range of depths are protected before fishing occurs (Clark and Dunn, 2012). The approach of the Australian Government was to capture many seamounts in marine parks in 2007, but drawing park boundaries in ways that left some seamounts, including the two most productive for orange roughy trawling (St Helens and Pedra), open to fishing. Although the conservation performance of the marine park designs could not be assessed at the time (because the continental slope was incompletely mapped and few seamounts had been sampled), more recent ecological data (Althaus et al., 2009; Williams et al., 2010; Thresher et al., 2014) showed that a large number of individual seamounts and large areas of intact Solenosmilia deep-sea coral reef VME were protected within marine parks. Our study shows the “Tasman Fracture” and “Huon” Australian Marine Parks (AMP) enclose many seamounts assessed to be lightly impacted or to have no measurable signs of fishing impacts. This indicates the dominant framework-building scleractinian coral, S. variabilis, has been protected, although it remains unclear whether similar protection has been afforded to the shallower coral species. In addition, it is likely there are many, as yet unidentified, areas of unimpacted S. variabilis coral reef on the small, closely adjacent and unsurveyed seamounts in the Huon AMP as small areas of the scleractinian coral S. variabilis also persist on previously trawled seamounts and extend onto rocky areas adjacent to seamounts. Adding a criterion of “naturalness” in spatial conservation planning that assumes fished areas contain only damaged and degraded habitat may create a model bias against fished areas. Yet, here we show that detailed empirical field data can reveal deep-sea coral reefs may persist in refuge areas after years of fishing. The existence of sizeable deep-sea coral reef refuges in a complex mosaic of spatially variable fishing effort, suggests that more nuanced approaches to conservation may be warranted than simply closing untrawled areas and ignoring trawled areas. This type of “freeze the footprint” measure also ignores the potential of impacted areas to recover (Baco et al., 2020). A greater flexibility of approach may achieve more effective conservation with fewer areas ineffectively closed to fishing, especially when the biological resources with conservation value are rare in a broader seascape context.
Data Availability Statement
The raw data supporting the conclusions of this article will be made available by the authors, without undue reservation.
Author Contributions
AW, MC, NB, and TS designed the study. AW, KM, MG, CU, MC, NB, and TS acquired the data at sea. AW, FA, MG, KM, CU, and PA acquired and processed the image-derived data. FA and AW performed the analyses. AW led the writing. All authors made substantial contributions to discussing the methods and results and revising the manuscript.
Funding
This work originates from a project that is funded, collectively, by CSIRO Oceans and Atmosphere, Parks Australia and the Australian Government National Environmental Science Programme (NESP), Marine Biodiversity Hub. Project data were collected during a voyage on Australia’s Marine National Facility Vessel, RV Investigator, funded through the Australian Government. MC acknowledges funding from CSIRO and NIWA Coats and Oceans Centre enabling participation in the survey.
Conflict of Interest
The authors declare that the research was conducted in the absence of any commercial or financial relationships that could be construed as a potential conflict of interest.
Acknowledgments
We acknowledge the committees and staff of Australia’s Marine National Facility (MNF) for access to the research vessel RV Investigator, and the captain and the crew of the vessel for their hard work in making the survey successful. We also thank the sea-going staff from the MNF whose support was vital to the field collection of data. We especially thank our many colleagues from CSIRO Oceans and Atmosphere and Parks Australia, and Dr. Tiffany Sih, who helped process photographic imagery whilst at sea, and gratefully acknowledge the many other engineering, technical and administrative staff at CSIRO who contributed in various ways to supporting the project that provided the data for this paper. In particular, for the design and fabrication of the camera platform, and for maintaining and piloting the system at sea, we thank Matt Sherlock, Jeff Cordell, Karl Forcey and Aaron Tyndall, and for advice and assistance with various aspects data preparation and survey design we are indebted to Scott Foster, Amy Nau and Jasmine Bursic (CSIRO), and Jan Jansen and Vanessa Lucieer (University of Tasmania). As well, staff from the Data Centre at CSIRO, notably Nick Mortimer, Chris Jackett, Pamela Brodie and Peter Shanks, made invaluable contributions to handling and processing the image data sets. We are grateful to staff from the Australian Fisheries Management Authority for access to fishing logbook data, and review of its use in this work. We also acknowledge the Monteray Bay Aquarium Research Institute for its Video Annotation and Reference System software and support. Finally, we thank Marcelo Kitahara, Universidade Federal de São Paulo, for expert advice on scleractinian coral identifications.
Supplementary Material
The Supplementary Material for this article can be found online at: https://www.frontiersin.org/articles/10.3389/fmars.2020.567002/full#supplementary-material
References
Alderslade, P., Althaus, F., McEnnulty, F., Gowlett-Holmes, K., and Williams, A. (2014). Australia’s deep-water octocoral fauna: historical account and checklist, distributions and regional affinities of recent collections. Zootaxa 3796, 435–452. doi: 10.11646/zootaxa.3796.3.2
Althaus, F., Hill, N., Ferrari, R., Edwards, L., Przeslawski, R., Schönberg, C. H. L., et al. (2015). A standardised vocabulary for identifying benthic biota and substrata from underwater imagery: the CATAMI classification scheme. PLoS One 10:e0141039. doi: 10.1371/journal.pone.0141039
Althaus, F., Williams, A., Alderslade, P., Schlacher, T. A., and Beger, M. (2017). Conservation of marine biodiversity on a very large deep continental margin: how representative is a very large offshore reserve network for deep-water octocorals? Diver. Distrib. 23, 90–103. doi: 10.1111/ddi.12501
Althaus, F., Williams, A., Schlacher, T. A., Kloser, R. J., Green, M. A., Barker, B. A., et al. (2009). Impacts of bottom trawling on deep-coral ecosystems of seamounts are long-lasting. Mar. Ecol. Prog. Ser. 397, 279–294. doi: 10.3354/meps08248
Anderson, O. F., and Clark, M. R. (2003). Analysis of bycatch in the fishery for orange roughy, Hoplostethus atlanticus, on the South Tasman Rise. Mar. Freshw. Res. 54, 643–652. doi: 10.1071/MF02163
Baco, A. R., Morgan, N. B., and Roark, E. B. (2020). Observations of vulnerable marine ecosystems and significant adverse impacts on high seas seamounts of the northwestern Hawaiian Ridge and Emperor Seamount Chain. Mar. Policy 115:103834. doi: 10.1016/j.marpol.2020.103834
Clark, M. R., Althaus, F., Williams, A., Niklitschek, E., Menezes, G. M., Hareide, N.-R., et al. (2010a). Are deep-sea demersal fish assemblages globally homogenous? Insights from seamounts. Mar. Ecol. 31, 39–51. doi: 10.1111/j.1439-0485.2010.00384.x
Clark, M. R., Rowden, A., Williams, A., Consalvey, M., Stocks, K., Rogers, A., et al. (2010b). The ecology of seamounts: structure, function, and human impacts. Annu. Rev. Mar. Sci. 2, 253–278. doi: 10.1146/annurev-marine-120308-081109
Clark, M. R., Althaus, F., Schlacher, T. A., Williams, A., Bowden, D. A., and Rowden, A. A. (2016a). The impacts of deep-sea fisheries on benthic communities: a review. ICES J. Mar. Sci. 73(Suppl._1), i51–i69. doi: 10.1093/icesjms/fsv123
Clark, M. R., Anderson, O. F., McKenzie, A., and Doonan, I. J. (2016b). Estimating Orange Roughy Stock Size on Seamounts: a Meta-Analysis of Physical Seamount Characteristics. New Zealand Fisheries Assessment Report. 2016/47. 19 p.
Clark, M. R., Bowden, D. A., Rowden, A. A., and Stewart, R. (2019). Little evidence of benthic community resilience to bottom trawling on seamounts after 15 years. Front. Mar. Sci. 6:63. doi: 10.3389/fmars.2019.00063
Clark, M. R., and Dunn, M. R. (2012). Spatial management of deep-sea seamount fisheries: balancing sustainable exploitation and habitat conservation. Environ. Conserv. 39, 204–214. doi: 10.1017/s0376892912000021
Clark, M. R., and O’Driscoll, R. L. (2003). Deepwater fisheries and aspects of their impact on seamount habitat in New Zealand. J. Northwest Atlant. Fish. Sci. 31, 441–458. doi: 10.2960/J.v31.a34
Clark, M. R., and Rowden, A. A. (2009). Effect of deepwater trawling on the macro-invertebrate assemblages of seamounts on the Chatham Rise, New Zealand. Deep Sea Res. Part I Oceanogr. Res. Pap. 56, 1540–1554. doi: 10.1016/j.dsr.2009.04.015
Clark, M. R., and Tittensor, D. P. (2010). An index to assess the risk to stony corals from bottom trawling on seamounts. Mar. Ecol. Evolut. Perspect. 31, 200–211. doi: 10.1111/j.1439-0485.2010.00392.x
Colman, J. G., Gordon, D. M., Lane, A. P., Forde, M. J., and Fitzpatrick, J. J. (2005). “Carbonate mounds off Mauritania, Northwest Africa: status of deep-water corals and implications for management of fishing and oil exploration activities,” in Cold-Water Corals and Ecosystems, eds A. Freiwald and J. M. Roberts (Berlin: Springer), 417–441. doi: 10.1007/3-540-27673-4_21
Davies, A. J., and Guinotte, J. M. (2011). Global habitat suitability for framework-forming cold-water corals. PLoS ONE 6:e18483. doi: 10.1371/journal.pone.0018483
Director of National Parks (2013). South-East Commonwealth Marine Reserves Network Management Plan 2013-23. Canberra: Director of National Parks.
Du Preez, C., Swan, K. D., and Curtis, J. M. R. (2020). Cold-water corals and other vulnerable biological structures on a North Pacific seamount after half a century of fishing. Front. Mar. Sci. 7:17. doi: 10.3389/fmars.2020.00017
Ewing, G. P., and Kilpatrick, R. (2014). “Estimating the gear footprint of demersal trawl and longline fishing gears used in the Heard Island and McDonald Islands fisheries,” in Demersal Fishing Interactions with marine Benthos in the Australian EEZ of the Southern Ocean: an Assessment of the Vulnerability of Benthic Habitats to Impact by Demersal Gears, FRDC Project 2006/042, eds D. C. Welsford, G. P. Ewing, A. J. Constable, T. Hibberd, and R. Kilpatrick (Hobart: Australian Antarctic Division and the Fisheries Research and Development Corporation).
FAO (2009). International Guidelines for the Management of Deep-Sea Fisheries in the High Seas. Rome: Food and Agriculture Organization of the United Nations.
Fosså, J. H., Mortensen, P. B., and Furevik, D. M. (2002). The deep-water coral Lophelia pertusa in Norwegian waters: distribution and fishery impacts. Hydrobiologia 471, 1–12. doi: 10.1023/A:1016504430684
Foster, S. D., Hosack, G. R., Monk, J., Lawrence, E., Barrett, N. S., Williams, A., et al. (2019). Spatially-balanced designs for transect-based surveys. Methods Ecol. Evolut. 11, 95–105. doi: 10.1111/2041-210X.13321
Gage, J. D., Roberts, J. M., Hartley, J. P., and Humphery, J. D. (2005). “Potential impacts of deep-sea trawling on the benthic ecosystem along the northern European continental margin: a review,” in Proceedings of the Benthic Habitats and the Effects of Fishing (American Fisheries Society Symposium, Vol. 41, eds P. W. Barnes and J. P. Thomas (Bethesda, MD: American Fisheries Society), 503–517.
Hall-Spencer, J., Allain, V., and Fosså, J. H. (2002). Trawling damage to Northeast Atlantic ancient coral reefs. Proc. R. Soc. B Biol. Sci. 269, 507–511. doi: 10.1098/rspb.2001.1910
Howell, K. L., Davies, J. S., and Narayanaswamy, B. E. (2010). Identifying deep-sea megafaunal epibenthic assemblages for use in habitat mapping and marine protected area network design. J. Mar. Biol. Assoc. U. K. 90, 33–68. doi: 10.1017/s0025315409991299
Koslow, J. A., Bax, N. J., Bulman, C. M., Kloser, R. J., Smith, A. D. M., and Williams, A. (1997). “Managing the fishdown of the Australian orange roughy resource,” in Proceedings of the Developing and Sustaining World Fisheries Resources: the State of Science and Management and the Second World Fisheries Congress, Brisbane.
Koslow, J. A., Gowlett-Holmes, K., Lowry, J. K., O’Hara, T., Poore, G. C. B., and Williams, A. (2001). Seamount benthic macrofauna off southern Tasmania: community structure and impacts of trawling. Mar. Ecol. Prog. Ser. 213, 111–125. doi: 10.3354/meps213111
Marouchos, A., Sherlock, M., Filisetti, A., and Williams, A. (2017). “Underwater imaging on self-contained tethered systems,” in Proceedings of the IEEE Oceans Anchorage, Anchorage.
Mortensen, P. B., Hovland, T., Fosså, J. H., and Furevik, D. M. (2001). Distribution, abundance and size of Lophelia pertusa coral reefs in mid-Norway in relation to seabed characteristics. J. Mar. Biol. Assoc. U. K. 81, 581–597. doi: 10.1017/s002531540100426x
O’Driscoll, R. L., and Clark, M. R. (2005). Quantifying the relative intensity of fishing on New Zealand seamounts. N. Zeal. J. Mar. Freshw. Res. 39, 839–850. doi: 10.1080/00288330.2005.9517356
Pitcher, T. J., Morato, T., Hart, P. J., Clark, M. R., Haggan, N., and Santos, R. S. (2007). “The depths of ignorance: an ecosystem evaluation framework for seamount ecology, fisheries and conservation,” in Seamounts: Ecology, Fisheries, and Conservation. Fisheries and Aquatic Resources Series, 12, eds T. J. Pitcher, T. Morato, P. J. B. Hart, M. R. Clark, N. Haggan, and R. S. Santos (Oxford: Blackwell Science), 476–488.
QGIS (2018). QGIS Version 3.4.15-Madeira (Release Sept 15, 2018). Available online at: https://qgis.org/en/site/ (accessed August 2020).
Roberts, J. M., Wheeler, A., Freiwald, A., and Cairns, S. (2006). Cold water corals: the biology and geology of deep-sea coral habitats. Science 312, 543–547. doi: 10.1017/cbo9780511581588
Robertson, B. L., Brown, J. A., McDonald, T., and Jaksons, P. (2013). BAS: balanced acceptance sampling of natural resources. Biometrics 69, 776–784. doi: 10.1111/biom.12059
Rowden, A. A., Schlacher, T. A., Williams, A., Clark, M. R., Stewart, R., Althaus, F., et al. (2010a). A test of the seamount oasis hypothesis: seamounts support higher epibenthic megafaunal biomass than adjacent slopes. Mar. Ecol. 31, 95–106. doi: 10.1111/j.1439-0485.2010.00369.x
Rowden, A. A., Schnabel, K., Macpherson, E., Ahyong, S., and Forges, B. (2010b). Squat lobster assemblages on seamounts differ from some, but not all, deep-sea habitats of comparable depth. Mar. Ecol. 31, 63–83. doi: 10.1111/j.1439-0485.2010.00374.x
Schlacher, T. A., Baco, A. R., Rowden, A. A., O’Hara, T. D., Clark, M. R., Kelley, C., et al. (2014). Seamount benthos in a cobalt-rich crust region of the central Pacific: conservation challenges for future seabed mining. Diver. Distribut. 20, 491–502. doi: 10.1111/ddi.12142
Schlacher, T. A., Rowden, A., Dower, J., and Consalvey, M. (2010). Seamount science scales undersea mountains: new research and outlook. Mar. Ecol. 31, 1–13. doi: 10.1111/j.1439-0485.2010.00396.x
Schlining, B. M., and Jacobsen Stout, N. (2006). “MBARI’s video annotation and reference system,” in Proceedings of the Marine Technology Society/Institute of Electrical and Electronics Engineers Oceans Conference, Boston, MA.
Thresher, R., Williams, A. and Gowlett-Holmes, K. (2009). A Study of the Biodiversity and Conservation Ecology and Potential Threats to Deep Reef Assemblages Within the Huon and Tasman Fracture Commonwealth Marine Reserves. Final Report to the Department of the Environment, Water, Heritage and the Arts.
Thresher, R. E., Adkins, J., Fallon, S. J., Gowlett-Holmes, K., Althaus, F., and Williams, A. (2011). Extraordinarily high biomass benthic community on Southern Ocean seamounts. Sci. Rep. 1:119. doi: 10.1038/srep00119
Thresher, R. E., Althaus, F., Adkins, J., Gowlett-Holmes, K., Alderslade, P., Dowdney, J., et al. (2014). Strong depth-related zonation of megabenthos on a rocky continental margin (∼700–4000 m) off southern Tasmania, Australia. PLoS One 9:e85872. doi: 10.1371/journal.pone.0085872
Tittensor, D. P., Baco, A. R., Brewin, P. E., Clark, M. R., Consalvey, M., Hall-Spencer, J., et al. (2009). Predicting global habitat suitability for stony corals on seamounts. J. Biogeogr. 36, 1111–1128. doi: 10.1111/j.1365-2699.2008.02062.x
Tracey, D. M., Rowden, A. A., Mackay, K. A., and Compton, T. (2011). Habitat-forming cold-water corals show affinity for seamounts in the New Zealand region. Mar. Ecol. Prog. Ser. 430, 1–22.
Upston, J., Punt, A. E., Wayte, S., Ryan, T., Day, J., and Sporcic, M. (2014). Orange Roughy (Hoplostethus Atlanticus) Eastern Zone Stock Assessment Incorporating Data up to 2014. Hobart: CSIRO Oceans and Atmosphere - Australian Fisheries Management Authority.
White, M., Mohn, C., de Stigter, H., and Mottram, G. (2005). “Deep-water coral development as a function of hydrodynamics and surface productivity around the submarine banks of the Rockall Trough, NE Atlantic,” in Cold-Water Corals and Ecosystems, eds A. Freiwald and J. M. Roberts (Berlin: Springer), 503–514.
Wienberg, C., Beuck, L., Heidkamp, S., Hebbeln, D., Freiwald, A., Pfannkuche, O., et al. (2008). Franken Mound: facies and biocoenoses on a newly-discovered “carbonate mound” on the western Rockall Bank, NE Atlantic. Facies 54, 1–24. doi: 10.1007/s10347-007-0118-0
Williams, A., Althaus, F., Green, M., Maguire, K., Untiedt, C., Mortimer, N., et al. (2020). True size matters for conservation: a robust method to determine the size of deep-sea coral reefs shows they are typically small on seamounts in the southwest Pacific Ocean. Front. Mar. Sci. 7:187. doi: 10.3389/fmars.2020.00187
Keywords: scleractinian coral, Solenosmilia, indicators, towed-camera, vulnerable marine ecosystem, VME, fisheries management
Citation: Williams A, Althaus F, Maguire K, Green M, Untiedt C, Alderslade P, Clark MR, Bax N and Schlacher TA (2020) The Fate of Deep-Sea Coral Reefs on Seamounts in a Fishery-Seascape: What Are the Impacts, What Remains, and What Is Protected? Front. Mar. Sci. 7:567002. doi: 10.3389/fmars.2020.567002
Received: 29 May 2020; Accepted: 01 September 2020;
Published: 25 September 2020.
Edited by:
Santiago Herrera, Lehigh University, United StatesReviewed by:
Tina Molodtsova, P. P. Shirshov Institute of Oceanology (RAS), RussiaHelena Passeri Lavrado, Federal University of Rio de Janeiro, Brazil
Les Watling, University of Hawai‘i at Mānoa, United States
Copyright © 2020 Williams, Althaus, Maguire, Green, Untiedt, Alderslade, Clark, Bax and Schlacher. This is an open-access article distributed under the terms of the Creative Commons Attribution License (CC BY). The use, distribution or reproduction in other forums is permitted, provided the original author(s) and the copyright owner(s) are credited and that the original publication in this journal is cited, in accordance with accepted academic practice. No use, distribution or reproduction is permitted which does not comply with these terms.
*Correspondence: Alan Williams, YWxhbi53aWxsaWFtc0Bjc2lyby5hdQ==
†ORCID: Thomas A. Schlacher, orcid.org/0000-0003-2184-9217