Corrigendum: The Effect of Nitrogen Starvation on Biomass Yield and Biochemical Constituents of Rhodomonas sp
 Christos Latsos
 Jasper van Houcke
 Klaas R. Timmermans
- 1Research Group Aquaculture, HZ University of Applied Sciences, Vlissingen, Netherlands
- 2Department of Estuarine and Delta Systems, Royal Netherlands Institute for Sea Research (NIOZ), Utrecht University, Yerseke, Netherlands
The microalgae Rhodomonas sp. is known as an excellent feed source for live feed organisms such as copepods. The main benefits of feeding Rhodomonas to live feed animals are attributed to the relative high polyunsaturated fatty acid (PUFA) level, the combination of containing both docosahexaenoic acid (DHA) and eicosapentaenoic acid (EPA), and the ratio between these fatty acids (FA). It has been shown that microalgae are able to accumulate valuable metabolites, such as lipids, under adverse conditions. The easiest and most inexpensive method to induce stress to microalgae is through nitrogen (N) starvation. In this study, the effect of N-starvation on biomass concentration, cell volume, and cellular composition, such as fatty acid concentration and composition, and phycoerythrin (PE) concentration of Rhodomonas sp. during a period of 8 days, was investigated. The research was divided into two stages. In the first (growth) stage, Rhodomonas sp. was cultivated in small 400 ml photobioreactors (Algaemist-S) under optimal conditions in turbidostat mode, which reached a biomass concentration of 1.5 gDW L–1 and dilution rate of 1.3 d–1. Samples were taken every 24 h for cell density and volume and productivity measurements in order to ensure a healthy and stable culture. In the next stage (N-starvation), the biomass was washed and transferred in a reactor filled with N-depleted medium. During N-starvation, samples were taken for biomass concentration, cell volume, PE and FA composition. The results of this study demonstrate that the lipid content increased significantly from 9% (t = 0 h) to 30% (t = 120 h) of the dry weight. After 120 h of N-starvation, the total FA content of Rhodomonas sp. remained stable for the remainder of the experiment (next 72 h). The highest increase of the FA concentration was represented by C16:0, C:18:1, C18:2, and C18:3, with highest concentrations after 120 h of starvation. The maximum EPA and DHA concentrations were observed after 48 h of starvation, while the maximum DHA to EPA ratio was detected at the end of the starvation.
Introduction
In the aquaculture industry, microalgae are mainly used as a live feed. Microalgae are usually used in the cultivation of bivalves, crustaceans, marine fish and zooplankton. The main benefit attributed to using live microalgae is their high nutritional value (Borowitzka, 1997). The application for animal feed accounts for about 30% of the algal production in the world (Becker, 2007). The cost of feed contributes significantly to the final cost price of aquaculture products. High priority is, therefore, given to improving feed efficiency in industrial systems (Patil et al., 2007). It is stated that algae could increase aquaculture production up to 4-fold and as a result decrease the fish production cost by €0.10 to €0.21 kg–1 (Brune, 2012).
Microalgae nutritional value as aquaculture feed needs to be high in order to guarantee the best production of cultured animals (Volkman et al., 1989). The nutritional quality is connected with cell size, digestibility, and biochemical composition of microalgae, especially the fatty acid concentration and composition and the relative proportions of eicosapentaenoic acid (EPA) and docosahexaenoic acid (DHA) (Chu and Dupuy, 1980; Watanabe et al., 1983; Brown et al., 1997; Muller-Feuga, 2000). Most aquatic animals are not able to synthesize polyunsaturated fatty acids (PUFAs), such as EPA and DHA (Kanazawa et al., 1979). PUFAs are crucial for growth and development in penaeid prawns and shrimps and oyster species (Langdon and Waldock, 1981; González-Araya et al., 2012). Even marine animals that do not require EPA or DHA have demonstrated higher growth rates and larval survival rates when these PUFAs were included in their diet (Brown and Blackburn, 2013). For instance, C. gigas larvae did not show any boosted growth when the feed was enriched with DHA more than 2% of total fatty acids (Thompson et al., 1993), while also clams do not require PUFAs in their diet (Helm and Bourne, 2004). Except for the quantity of DHA and EPA, the ratio of these fatty acids is nutritionally important in the larval performance of mussel and fish larvae (Rodríguez et al., 1998; Pettersen et al., 2010). Pettersen et al. (2010) study correlated positively the Mytilus galloprovincialis larvae settlement and metamorphosis with the EPA and DHA ratio of the microalgae diets. Rodríguez et al. (1998) reported that for fish larvae diet DHA/EPA ratio should be 1:1 to 2:1. Decreases of DHA/EPA ratios in rotifers feed resulted in lower larval growth performance, while the most deficient larval growth was obtained in rotifers fed with the lowest DHA/EPA ratio (Rodríguez et al., 1997).
The main benefits of feeding Rhodomonas sp. to live feed animals are attributed to the relative high PUFAs level, the combination of containing both DHA and EPA, and the ratio between these fatty acids. Rhodomonas sp. has a high content of essential fatty acids (PUFAs) and nutrients, lipid accounts for about 10–30%, and protein takes about 30–60% of the dry weight (Renaud et al., 1999; Seixas et al., 2009; Costard et al., 2012; Coutinho et al., 2020). The variability of lipid and protein concentration depends on cultivation conditions. The high protein concentration is attributed to by another characteristic of Rhodomonas sp., the high phycoerythrin (PE) content. PE is a water soluble, colored and fluorescent phycobiliprotein that harvests light in the green wavelength (λmax = 545 nm) and provides energy to Photosystem II (PSII) (Doust et al., 2006). So, live Rhodomonas sp. can be an excellent feed for aquaculture. It has been previously proved to constitute a high-quality diet to rear calanoid copepods Acartia sinjiensis and Artemia sp. (Knuckey et al., 2005; Seixas et al., 2009; Coutinho et al., 2020).
It has been shown that microalgae are able to accumulate lipids under adverse conditions. The easiest and most inexpensive method to induce stress to microalgae is through N-starvation. The availability of nitrogen can influence the lipid quantity and quality of many microalgae (Richardson et al., 1969; Breuer et al., 2012; Simionato et al., 2013). A reduction of photosynthetic performance is also observed under N-depleted growth medium, because microalgae decrease their light harvesting efficiency and energy transduction (Berges et al., 1996; Young and Beardall, 2003). Especially cryptophytes under N-starvation lose their PE antenna entirely, while the chlorophyll a/c and PS II are affected as well (Rhiel et al., 1986; Bartual et al., 2002). Rhodomonas cells in N-starvation conditions decrease their PE concentration and their fluorescence capacity up to 90% (da Silva et al., 2009). As a result, PE acts as an internal N reserve for cells in order to ensure their continuation of growth.
The aim of our study is to investigate the effect of N-starvation on biomass yield cell volume, lipid concentration and composition, and PE concentration (as a proxy for protein concentration) of Rhodomonas sp. The effect of an N stress time period of 8 days on the total fatty acids (TFA) and PUFAs content of Rhodomonas sp. is explored. The change of the absolute and also the relative DHA and EPA levels during the N-starvation period is determined.
Materials and Methods
Strain, Growth Medium, and Pre-cultivation
Rhodomonas sp. was supplied by the Dutch aquaculture industry, as a strain used in commercial application. The strain was characterized by 18S sequencing and confirmed as Rhodomonas sp. (data not shown). Rhodomonas sp. inoculum for the experiments was pre-cultured in 300 ml pre-sterilized (20 min at 120°C) Erlenmeyer flasks in a conditioned shaker incubator. Cool white TL fluorescent tubes continuously provided a photon flux intensity of 100 μmol photons m–2 s–1 and the temperature was kept stable at 20 ± 1°C. Algae were maintained in 20 times concentrated nutrients of filtrated (0.2 μm pore size) f/2 medium, to maintain a nutrient-rich condition. The final concentration of NaNO3 and NaH2PO42H2O was 1.5 g L–1 and 113 mg L–1, respectively, and a salinity of 30 g L–1. Air enriched with 5% CO2 V/Vair was supplied in the headspace of the Erlenmeyer flasks. The growth of the cultures was monitored by measuring the cell abundance with a Coulter counter (Beckman coulter Z1) in order to ensure that the inoculum was in the exponential phase before it was used in the experiments.
Experimental Setup
In the experiments, Rhodomonas sp. was continuously cultivated in flat panel airlift-loop photobioreactor (PBR) (Algaemist-S, Technical Development Studio, Wageningen University, Netherlands) with 0.4 L working volume, 14 mm light path and 0.028 m2 total illuminated area (Breuer et al., 2013). Warm light was continuously provided by Bridgelux LED lamps (BXRAW1200, Bridgelux, United States) from one side of the Algaemist-S system. Unintentional exposure to other light sources was prevented by a black cover on the other side of the reactor. The primary light intensity was firstly set at around 100 μmol photons m–2 s–1 after the algae were inoculated to resemble the environment of the orbital incubator where the algae grew at the pre-culture phase. Then the light intensity was raised gradually until reaching 300 μmol photons m–2 s–1, which is reported as non-limiting for Rhodomonas sp. (Vu et al., 2016). The temperature was maintained at 22°C using a water jacket, attached to the culture compartment of the photobioreactor. The pH was set at 7.5 ± 0.1 and maintained constant by mixing CO2 with the airflow on demand. For the experiment, a two-phase N starvation strategy (growth and N-starvation, respectively) was applied. The experimental setup was performed in duplicate.
Growth Phase
The PBR was filled with 20 times concentrated nutrients of filtrated (0.2 μm pore size) f/2 medium, to ensure nitrogen sufficient conditions. After inoculation, the reactor was operated in batch mode until the outgoing light intensity equaled 15 μmol photons m–2 s–1 and the biomass concentration reached 1.4 g L–1. Then, the turbidostat mode was applied and the secondary light PAR sensor of the systems ensured stable outgoing light of 15 μmol photons m–2 s–1 and continuous operation. The growth phase was continued for 5 days with a stable dilution rate. Samples were taken every 24 h in order to ensure a healthy and stable culture.
N-Starvation Phase
After the growth phase, the biomass of the reactor was harvested and centrifuged in 2000 rpm for 15 min. The supernatant was discarded and the cells were washed with N-depleted medium in order to remove nitrogen residuals. The procedure was repeated. After washing, the biomass was transferred in a PBR filled with N-depleted medium. Excepting the nitrogen concentration of the medium, the growth conditions were the same as in the growth phase. During N-starvation, samples were taken at 0, 8, 16, 24, 48, 72, 96, 120, 144, 168, and 192 h after changing to the N-depleted medium. Samples were taken for biomass concentration, cell density and volume, PE and FA composition.
Culture Analysis
Growth Phase
Optical density was measured at 750 nm (OD750 nm) in a spectrophotometer (DR 5000, HACH, United States), from which biomass concentration (Cx) was calculated according to Oostlander et al. (2020). Cell volume was measured in Coulter Counter (Multisizer 3, Beckman Coulter, United States) in the size range 7–14 μm. The growth rate (μ) was calculated when the PBR was running in turbidostat mode as the dilution rate (D) according to equation 1, where VH is the harvested volume in a Δt period of time and VR the reactor volume. The biomass production rate (rx) for the turbidostat mode was calculated from the growth rate and the biomass concentration (Cx, eq. 2).
N-Starvation Phase
In the N starvation phase, the cell density and volume and the biomass concentration were measured in triplicates as according to the method described in the section “Growth Phase.” Additionally, the daily cell death rate (kd) was calculated according to eq. 3.
The biomass of each sample was centrifuged at 2500 rpm for 15 min, washed twice with 0.5 M ammonium formate, stored at −80°C and freeze-dried. The lyophilized biomass was used in PE and FA analysis.
Phycoerythrin analysis
The phycobilin pigments were extracted by a freeze-thawing process in 0.05 M phosphate buffer (containing equal volumes of 0.1M 0.1 M K2HPO4 and KH2PO4 and pH 6.7). The samples were kept in −80°C for 48 h and then for 24 h in 5°C for thawing. A centrifugation step at 4000 rpm for 10 min was followed to discard the biomass pellets from the tubes. The supernatant was analyzed using UV-VIS spectroscopy at 545 nm, according to Bennett and Bogobad (1973) and Lawrenz et al. (2011). PE was calculated in (g L–1) according to eq. 4, where A is the absorbance at 545 nm, ε is the molar extinction coefficient (for PE: 2.41 × 10⁶ L⋅mol–1⋅cm–1), d represents the path length of the cuvette and MW stands for the molecular weight of phycobilin (for PE: 240,000 g mol–1).
Fatty acid analysis
Fatty acids were quantified in 10 mg of lyophilized biomass, according to Breuer et al. (2012). Cell disruption was performed in beat beater tubes (“Lysing matrix E,” MP biomedicals, United States) using a Bead Beater (Precellys 24, Bertin Instruments, France) in the presence of glass beads (150–212 μm diameter). Three cycles of 60 s at 2500 rpm with 120 s interval were performed. The lipids were extracted using a chloroform:methanol (1:1.25 v/v) mixture and methylated in a MeOH solution containing 5% H2SO4 for 3 h at 70°C in a block heater. The fatty acid methyl esters (FAME) quantification was performed in gas chromatography (7890, Agilent, United States) using a 30 m column (Supelco NukolTM) with Helium as carrier gas. FA/FAMEs were identified based on retention time data of known standards. Tripentadecanoin (C15:0 TAG) was used as internal standard for fatty acid quantification. TFA was calculated as the sum of all individual FA. FA were also processed as saturated fatty acids (SFA), monounsaturated fatty acids (MFA), PUFAs and DHA/EPA ratio.
Statistical Analysis
All data measurements are shown as average +/− standard deviation (±SD) of three independent replicates. Data were tested for normal distribution (Kolmogorov-Smirnov goodness of fit test) before being analyzed by one-way analyses of variance (ANOVA) with α = 0.05, using SPSS 15.0. Mann–Kendall test was performed to determine whether the results have a monotonic trend over the period of N-starvation.
Results
Growth Phase
During the growth phase, the PBR was in a steady state for 6 days (Figure 1). The volumetric productivity was stable, 1.5 ± 0.1 g L–1 d–1, while the dilution rate was 1.3 ± 0.1 d–1. The biomass concentrations in the PBR was 1.2 ± 0.1 g L–1, which equals 9.2 ± 1.2 × 10⁶ cells ml–1. In the time of the growth phase, the cell volume was stable, 535 ± 18 μm3.
FIGURE 1
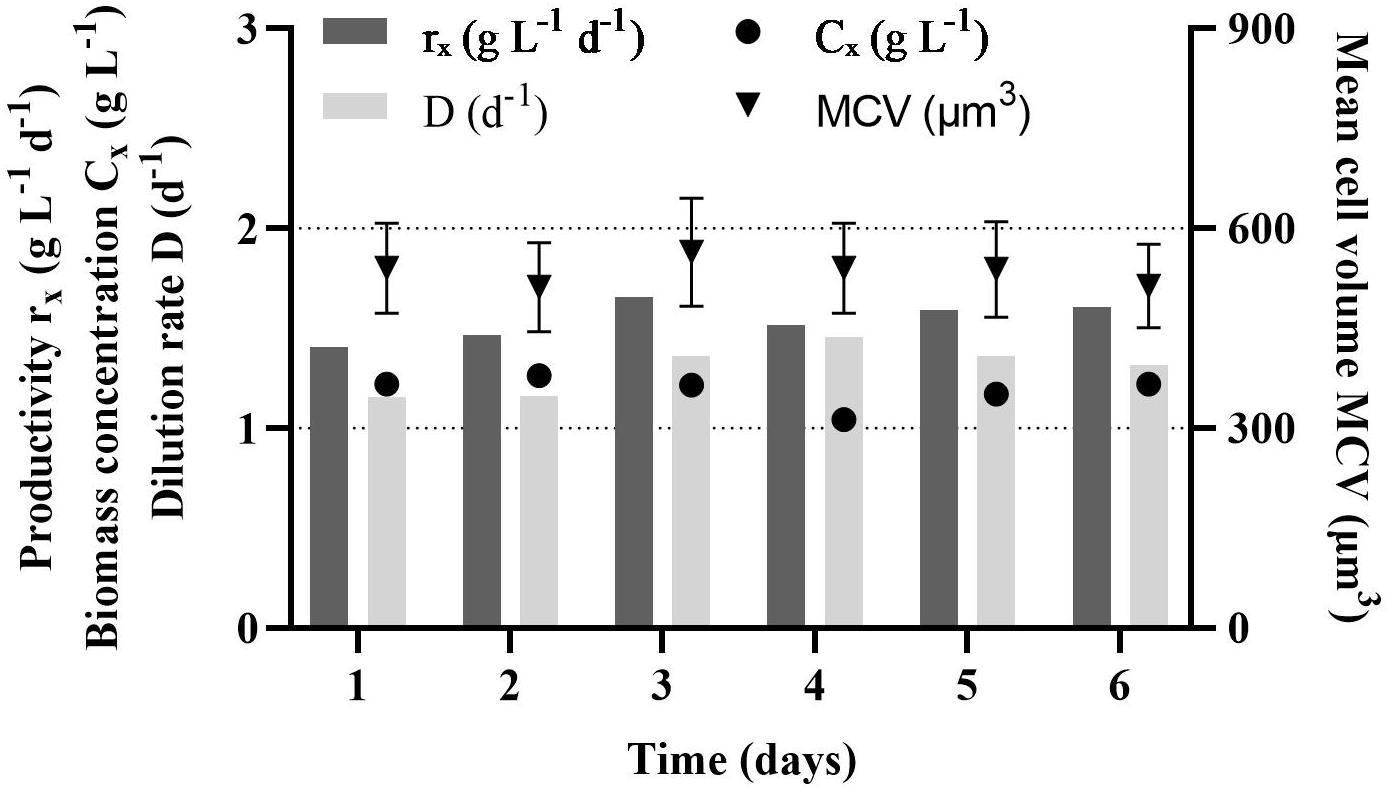
Figure 1. Steady state volumetric productivity (rx), dilution rate (D), biomass concentration (Cx) and mean cell volume (MCV) of Rhodomonas sp. in a photobioreactor during the growth phase.
N-Starvation Phase
Biomass Yield: Cell Density and Cell Volume
The cell density and volume of Rhodomonas sp. changed when grown under N-starvation. The cell density reduced significantly (P < 0.01) from 6.3 × 10⁶ cells ml–1 at 0 h until 32 h of N-starvation phase, with a death rate of 0.24 d–1, to 4.6 ± 0.1 × 10⁶ cells ml–1 (Figure 2). From 32 to 120 h of N-starvation, no significant difference (P > 0.05) was observed on the cell density. The highest death rate was observed at 144 h, 0.46 d–1, where the cell density decreased to 3.1 × 10⁶ cells ml–1. From then on, the cell density continued declining significantly (P < 0.01) with a rate of 0.46 d–1. When the experiment stopped, after 192 h in N-starvation phase, the cell density was 2.5 × 10⁶ cells ml–1. The cell volume increased significantly after N starvation from 556 ± 65 μm3 at t = 0 h to 660 ± 67 μm at t = 32 h (P < 0.01). After 32 h the cell volume reduced gradually to 304 ± 36 μm at t = 192 h (P < 0.01).
FIGURE 2
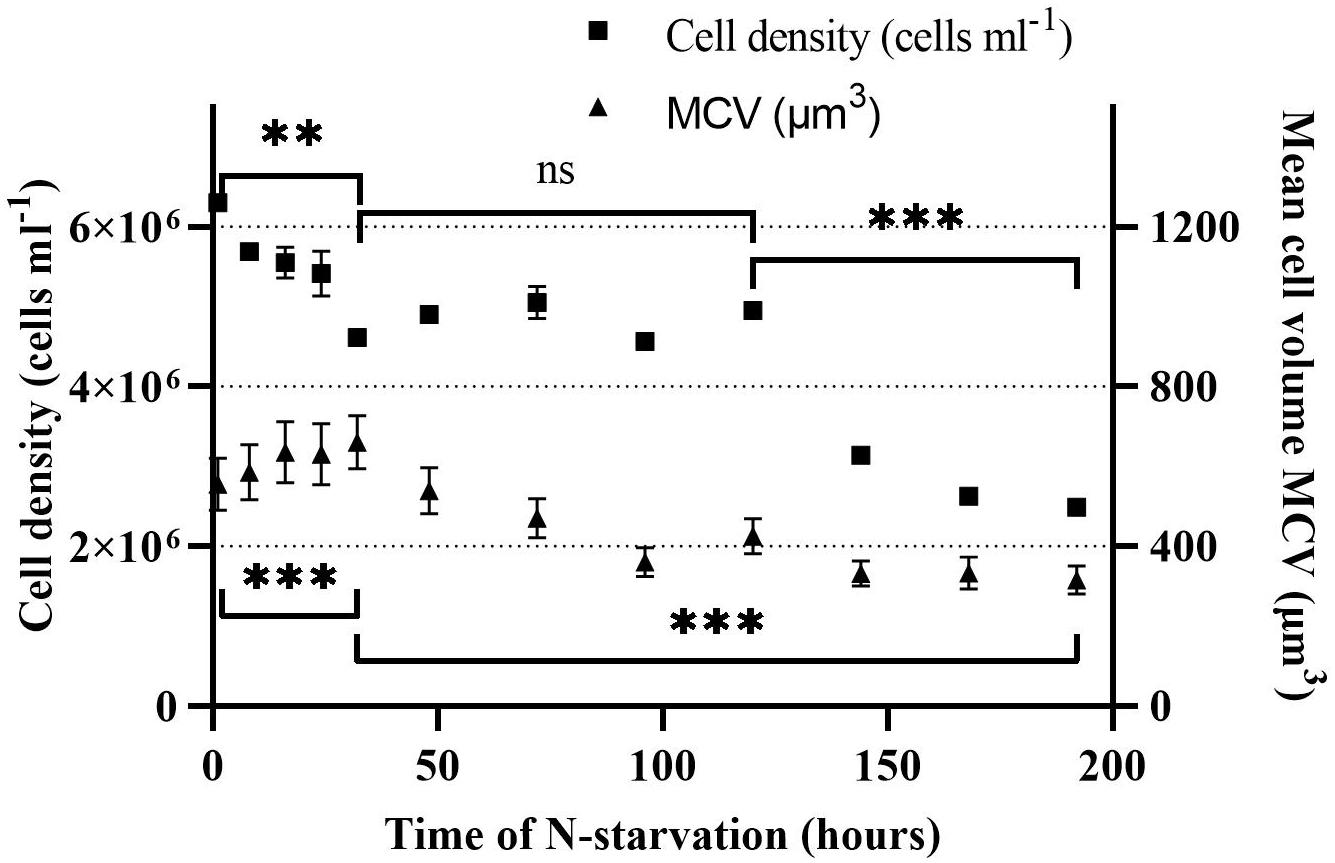
Figure 2. Cell density and mean cell volume (MCV) of Rhodomonas sp. during a 192 h N-starvation period of time. Data are expressed as the average of three replicates ± SD. *Indicates the significant difference after ANOVA post hoc test. ns P > 0.05, **P < 0.01, ***P < 0.001.
Phycoerythrin
The PE concentration in Rhodomonas sp. when the N-starvation phase started was 19.1% of total DW and remained stable for the first 8 h (Figure 3). After 8 h, PE declined significantly (P < 0.01) until 32 h after N-starvation, when it was equal to 4.5% of total DW. From 32 until 74 h after N-starvation, there was no significant change in PE concentration (P > 0.05). After 74 h of N-starvation, PE concentration declined further significantly (P < 0.01) until 144 h after N starvation, when no PE could be measured.
FIGURE 3
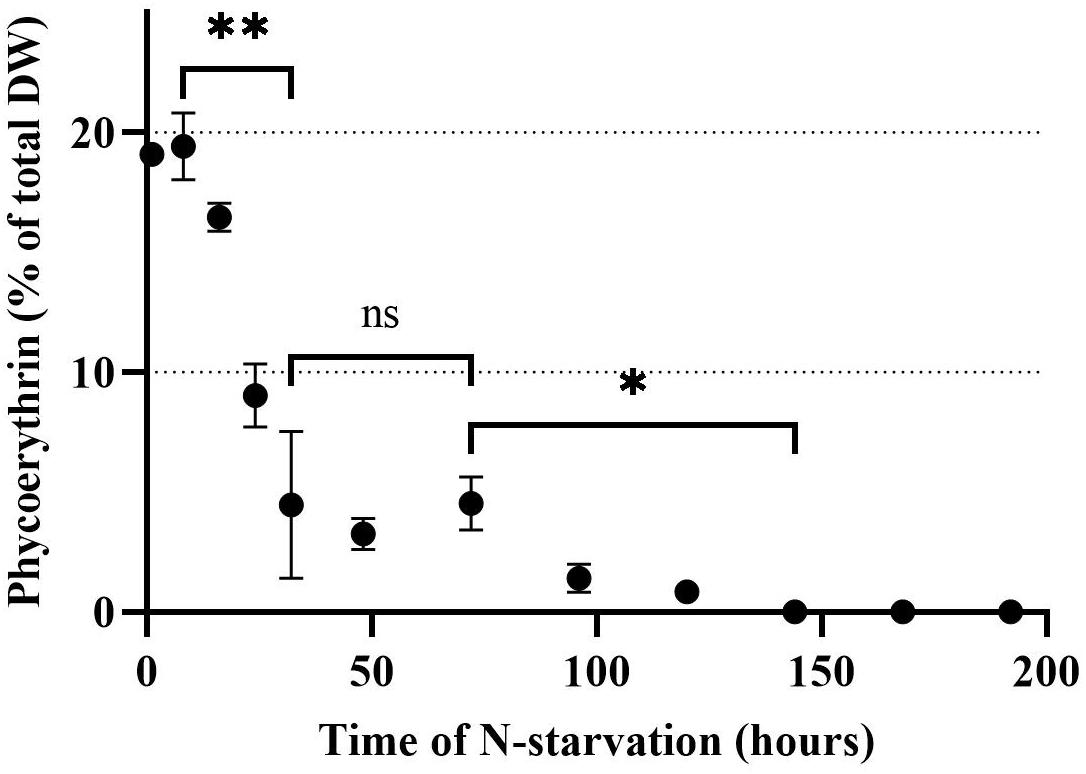
Figure 3. Phycoerythrin concentration of Rhodomonas sp. during a 192 h N-starvation period of time. Data are expressed as the average of three replicates ± SD. *Indicates the significant difference after ANOVA post hoc test. ns P > 0.05, *P < 0.05, **P < 0.01.
Fatty Acid Analysis
Rhodomonas sp. accumulated FA 32 h after the transfer into the N-depleted medium (Figure 4). There was no significant difference in TFA the first 24 h of N-starvation phase (P > 0.05). TFA increased significantly from 9.2% of total DW at 24 h to 30.3% of total DW at 120 h (P < 0.01). After 120 h no significant (P > 0.05) increase of TFA was measured up until 192 h of N- starvation. SFA did not change significantly in the first 24 h of N-starvation (P > 0.05). A significant increase (P < 0.01) of SFA concentration was observed after 24 h and continued until 120 h of N-starvation, from 2.3% to 12.4% of total DW, respectively. PUFA content followed the same pattern as SFA (Figure 4). PUFAs content started at 6% of total DW before the N-starvation phase and raised to 12.5% of total DW 120 h after the N-starvation started. The same pattern was followed by the MUFA rising from 1% at 24 h to 6.4% of total DW at 120 h of N-starvation. After 120 h the SFA and PUFA showed a decrease, while the MUFA kept increasing until 192 h of N starvation period to 8.4% of total DW. EPA and DHA showed a peak after 72 h, 1.2 and 0.9% of total DW, respectively. The initial concentration was 0.7% and 0.6% of total DW for EPA and DHA (Figure 5). After 192 h, the EPA and DHA concentration dropped to 0.4% and 0.6% of total DW, respectively. The DHA to EPA ratio did not show a significant difference (P > 0.05) the first 120 h after N-starvation and remained around 0.72. At 144 h, the DHA to EPA ratio more than doubled (P < 0.01), to 1.46 at 192 h.
FIGURE 4
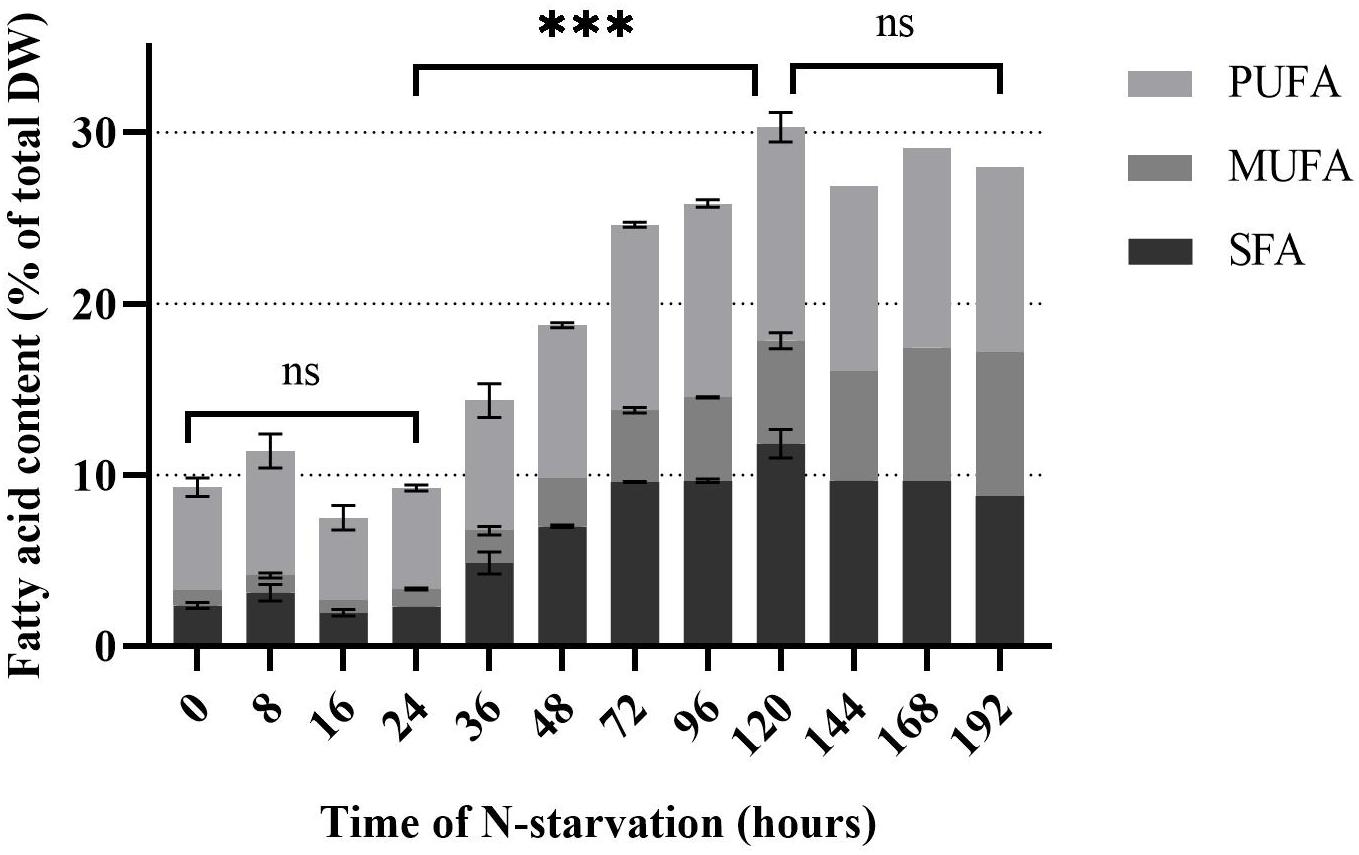
Figure 4. Fatty acid concentration of Rhodomonas sp. during a 192 h N-starvation period. SFA: Saturated fatty acids, MUFA: Monounsaturated fatty acids and PUFA: Polyunsaturated fatty acids. Data are expressed as the average of three replicates ± SD. *Indicates the significant difference after ANOVA post hoc test. ns P > 0.05, ***P < 0.001.
FIGURE 5
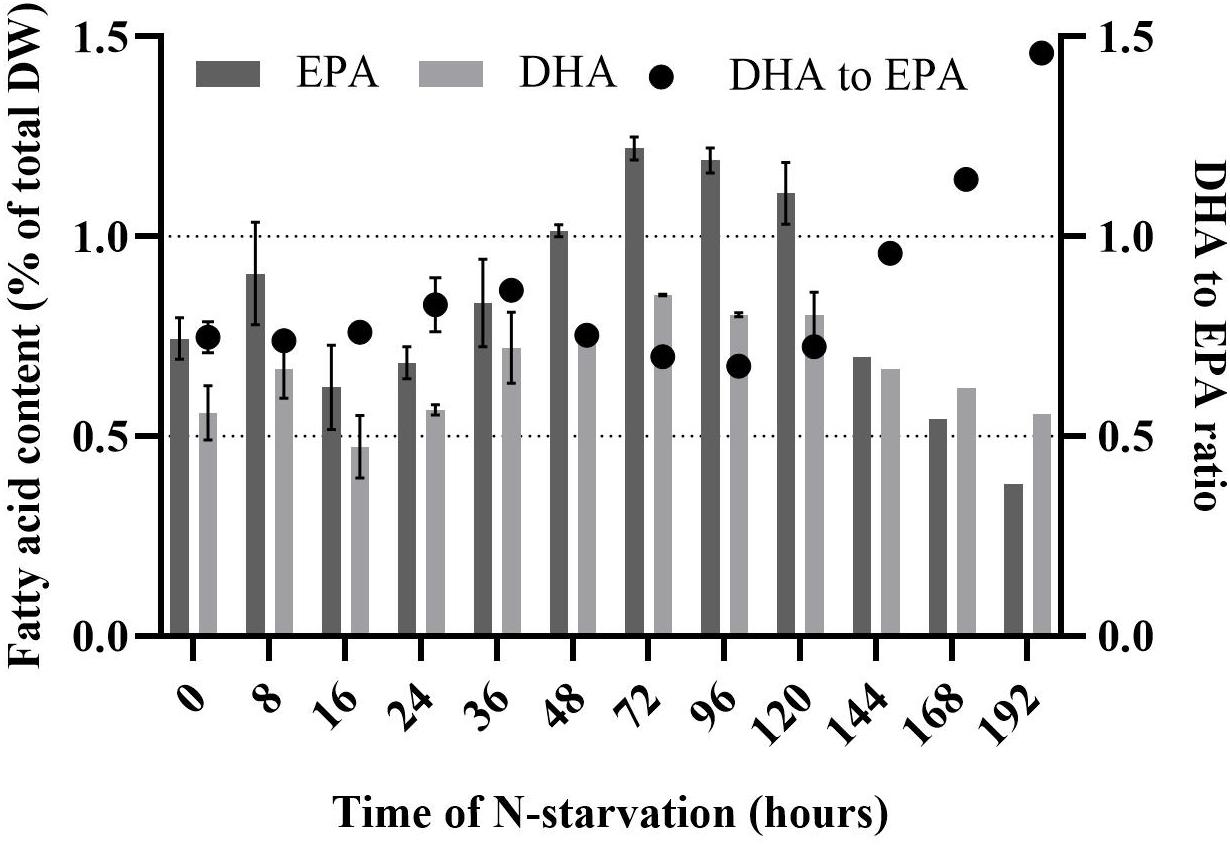
Figure 5. Eicosapentaenoic acid (EPA), docosahexaenoic acid (DHA) and DHA to EPA ratio of Rhodomonas sp. during a 192 h N-starvation period. Data are expressed as the average of three replicates ± SD.
The FA with the highest concentration were linolenic (18:3, 1.8% of total DW), stearidonic (18:4, 1.5% of total DW), palmitic acid (16:0, 1.2% of total DW) and linoleic (18:2, 1.2% of total DW) acids before the starvation period. After 120 h of N-starvation the highest FA in Rhodomonas sp. were palmitic acid (6.1% of total DW), oleic acid (18:1, 5.5% of total DW) and linolenic acid (3.7% of total DW) (Supplementary Table S1).
Discussion
The nutritional value of microalgae as aquaculture feed is an essential key factor for the aquaculture sector. This study established that Rhodomonas sp. quality can be maintained stable in a PBR, but it can also be manipulated. An N-starvation application can modify the quality of Rhodomonas sp. by inducing the FA accumulation and protein consumption (PE as proxy).
Growth Phase
During the growth phase Rhodomonas sp. was stable in the PBR in the sense of biomass productivity and cell volume. The growth rate that was observed during a period of 6 days, 1.3 ± 0.1 d–1, was higher than most of the maximum growth rates that have been reported for Rhodomonas species in the literature, 0.8 to 1.0 d–1 (Bartual et al., 2002; Lafarga-De la Cruz et al., 2006; Vu et al., 2016). Only Fernandes et al. (2016) reported a higher growth rate of 1.6 d–1 for the strain of Rhodomonas marina. It has to be noted that the maximum growth rate data from these studies were obtained in batch cultures during exponential phase. In our study, we present the steady state growth rates during a turbidostat mode, not the maximum growth rate of the strain. Moreover, interspecific variation can explain the variation of the growth phase data of this study with the data given in other studies. For example, Guevara et al. (2016) studied two Rhodomonas salina species and obtained significant differences in growth and nutritional quality between the species (protein, total lipids, EPA, and DHA).
N-Starvation Phase
Cell Volume and Phycoerythrin
The cell volume of Rhodomonas sp. changed under N-starvation, with cells being bigger the first 32 h of N-starvation phase, thereafter observing a significant cell decrease. The volume increase at the beginning of the N-starvation phase could be explained by carbohydrate accumulation, which is reported to start earlier than lipid accumulation. Jia et al. (2015) cultivated Nannochloropsis oceanica in N-deplete medium for 14 days and observed a 2-fold increase of free glucose and mannitol the first and second day of starvation, respectively. Previous research on Rhodomonas sp. (da Silva et al., 2009) illustrated that N-starved cells increased their volume in the first 3 days of the N-starvation phase. The decrease of cell volume that followed after 48 h in N-free medium in our experiment is supported in many studies. Kilham et al. (1997) found that the volume per cell of Ankistrodesmus falcatus decreased as a function of N-limitation compare to non-limited cells. Lynn et al. (2000) also observed smaller cell sizes for N-limited Stephanodiscus minululus cultures as compared to non-limited cultures. Rhee (1978) observed that Scenedesmus sp. cells size was smaller when growing in N-limited medium and explained it in terms of lower protein content. The decrease of protein content has been reported for many algae species grown under N-starvation conditions (Harrison et al., 1990; Lynn et al., 2000). Jia et al. (2015) reported a decrease in protein concentration of Nannochloropsis oceanica, which started 48 h after N-starvation phase.
The reduction of cell volume and the correlation with protein content can be explained in our study by the decrease of PE concentration (here used as a proxy for cellular protein concentration), which started 16 h after the N-starvation started. It has also been demonstrated in other studies that cells of Rhodomonas sp., as in some other cryptomonads, showed a drastic decrease of the protein and phycoerythrin content upon N-starvation (Sciandra et al., 2000; Bartual et al., 2002; Vu et al., 2016). Yamamoto et al. (2020) reported for Rhodomonas sp. a 75% reduction of PE concentration between the exponential and late stationary phase, where no N-source is available. In our research, the PE concentration was reduced by 75% 32 h after N-starvation, while after 4 days of starvation, the PE reduction was 93%. The different light intensity conditions that were used in Yamamoto et al. research can clarify the differences in the PE concentrations with our results. Consistent with Vu et al. (2016) study, N-starvation conditions caused a reduction in PE. Proteolysis of phycobiliproteins in cyanobacteria under N-starvation maintain the protein turnover (Grossman et al., 1994). These studies suggest that PE behaves as cell reserves in N-deprivation conditions providing amino acids for new protein synthesis.
FA Concentration
Many publications support that microalgae decrease their cell division and start to accumulate lipid under nutritional limitation (Shifrin and Chisholm, 1981; Piorreck et al., 1984) or starvation (Tornabene et al., 1983; Converti et al., 2009). Illman et al. (2000) showed the response of five Chlorella species to N-limitation. Lipid content doubled for all Chlorella species in low N medium. PUFA content increases relative to the increasing nutrient limitation (Janssen et al., 2019). In our study, the FA (SFA, MUFA, and PUFA) increase is in line with the literature for Rhodomonas sp. in N-starvation phase (Yamamoto et al., 2020). The highest increase during N-starvation was obtained for oleic (C18:1), palmitic (C16:0), and linoleic (C18:2) acid, 10-fold, 5-fold and 4-fold, respectively. PUFAs, which are the most important FA for aquaculture, indicated a 2-fold increase in the first 96 h of N-starvation. Similar increased PUFA content (65% of total FA) was reported by Coutinho et al. (2020) for Rhodomonas lens maintained under nitrate saturated conditions. DHA and EPA presented a peak in concentration 72 h after N-starvation. However, at the end of the experiment (120 h in N-starvation), DHA concentration returned to the initial value (t = 0 h), while EPA showed a 2-fold decrease compared to the initial concentration.
Fatty Acid Composition
The major FA’s of Rhodomonas sp. in this study were palmitic (C16:0), linoleic (C18:2), linolenic (C18:3), and stearidonic (C18:4) acid. These FA’s are in line with the literature results for Rhodomonas species (van Houcke et al., 2017; Vu et al., 2019; Coutinho et al., 2020). However, differ from lipid profiles of other microalgae that are used in aquaculture, for example, Tisochrysis lutea, Chaetoceros neogracile, Skeletonema marinoı, Pavlova lutheri, Nitzschia sp., Thalassiosira sp. Tetraselmis sp., Dictyosphaerium pulchellum, Stichococcus sp., Chlorella sp. and Scenedesmus sp. (Pratoomyot et al., 2005; González-Araya et al., 2012; González-Araya and Robert, 2018). The SFA composition or Rhodomonas sp. varies from 25 to 39% of TFA, which is similar to Yamamoto et al. (2020) research on Rhodomonas sp. The most significant difference is noticed in PUFA, which is 65% of TFA in Rhodomonas sp., while in other marine algae varies from 25 to 47% of TFA. This difference is defined mainly by the higher DHA content, 6% of TFA, while the EPA concentration is 8% of TFA, higher than Tisochrysis lutea and Tetraselmis sp., but lower than Pavlova lutheri, Chaetoceros neogracile, Skeletonema marinoı, Thalassiosira sp. and Nitzschia sp. This comparison confirms the interspecific nutritional value variability due to the differences in absolute amounts of TFA, EPA and DHA between algae species (Boelen et al., 2013).
DHA to EPA Ratio
Due to the changes in the absolute value of DHA and EPA, the DHA to EPA ratio is affected. In our study, the DHA to EPA ratio the first 120 h in N-starvation remained relatively stable, 0.75 ± 0.05. This ratio is similar to the ratio that has been reported before for Rhodomonas species (Dunstan et al., 2005; Drillet et al., 2006; Vu et al., 2016). Boelen et al. (2017) reported that DHA to EPA ratio of Rhodomonas salina decreased from exponential to stationary and late stationary phase, from 0.72 to 0.56 and 0.46, respectively. In contrast to Boelen et al. (2017) results, our research showed a twofold increase of DHA to EPA ratio of Rhodomonas sp. to 1.5 after 192 h in N-starvation. The effect of N-starvation on DHA and EPA can affect the nutritional quality of Rhodomonas sp., as it is reported that the nutritional value of microalgae in aquaculture depends not only on the quantity of DHA and EPA but also on the DHA to EPA ratio, which has proved essential for fish larvae development (Rodríguez et al., 1998).
Conclusion
This study has illustrated that Rhodomonas sp. adapts rapidly to changes in N availability by changes in cell density and volume and biochemical composition and as a result, N availability can strongly enhance the nutritional value of Rhodomonas sp. The high PUFA concentration of Rhodomonas sp. and the increase of PUFA under N-starvation makes it good nutritional feed for aquaculture animals. This research demonstrates that in the application of Rhodomonas sp. as aquaculture feed, the time of harvest (and the starvation applied) is essential in order to obtain the desired quality as a feed.
In order to benefit from our results on a (semi-)commercial scale cultivation systems of management should be adapted. A cultivation system could be divided into two phases. The first phase enables a steady and high production rate of Rhodomonas sp. in optimal cultivation conditions and N-sufficient medium (20 × f/2 medium, 300 μmol photons m–2 s–1 and 22 °C). The second phase induces N-starvation, where Rhodomonas sp. accumulates lipids. In the second phase, there is a critical point for harvesting, and it depends on the purpose of the feed. PUFAs have the highest concentration 120 h after N-starvation, while EPA and DHA present maximum concentration 72 h after N-starvation and DHA to EPA ratio rises above 1 after 144 h in N-starvation.
Data Availability Statement
The raw data supporting the conclusions of this article will be made available by the authors, without undue reservation.
Author Contributions
CL contributed to the design and implementation of the research, analysis of the results, and writing of the original draft of the manuscript. JH and KT supervised the project and results, and contributed to the final version of the manuscript. All authors contributed to the article and approved the submitted version.
Funding
This work was financially supported by ValgOrize project, funded by the INTERREG V 2 Seas Mers Zeeën program, with the financial support of the European Regional Development Fund.
Conflict of Interest
The authors declare that the research was conducted in the absence of any commercial or financial relationships that could be construed as a potential conflict of interest.
Supplementary Material
The Supplementary Material for this article can be found online at: https://www.frontiersin.org/articles/10.3389/fmars.2020.563333/full#supplementary-material
References
Bartual, A., Lubián, L. M., Gálvez, J. A., and Niell, F. X. (2002). Effect of irradiance on growth, photosynthesis, pigment content and nutrient consumption in dense cultures of Rhodomonas salina (Wislouch) (Cryptophyceae). Ciencias Mar. 28, 381–392. doi: 10.7773/cm.v28i4.236
Becker, E. W. (2007). Micro-algae as a source of protein. Biotechnol. Adv. 25, 207–210. doi: 10.1016/j.biotechadv.2006.11.002
Bennett, A., and Bogobad, L. (1973). Complementary chromatic adaptation in a filamentous blue-green alga. J. Cell Biol. 58, 419–435. doi: 10.1083/jcb.58.2.419
Berges, J. A., Charlebois, D. O., Mauzerall, D. C., and Falkowski, P. G. (1996). Differential effects of nitrogen limitation on photosynthetic efficiency of photosystems I and II in microalgae. Plant Physiol. 110, 689–696. doi: 10.1104/pp.110.2.689
Boelen, P., van Dijk, R., Damsté, J. S. S., Rijpstra, W. I. C., and Buma, A. G. J. (2013). On the potential application of polar and temperate marine microalgae for EPA and DHA production. AMB Express 3, 1–9. doi: 10.1186/2191-0855-3-26
Boelen, P., van Mastrigt, A., van de Bovenkamp, H. H., Heeres, H. J., and Buma, A. G. J. (2017). Growth phase significantly decreases the DHA-to-EPA ratio in marine microalgae. Aquac. Int. 25, 577–587.
Borowitzka, M. A. (1997). Microalgae for aquaculture: opportunities and constraints. J. Appl. Phycol. 9, 393–401. doi: 10.1023/A:1007921728300
Breuer, G., Lamers, P. P., Martens, D. E., Draaisma, R. B., and Wijffels, R. H. (2012). The impact of nitrogen starvation on the dynamics of triacylglycerol accumulation in nine microalgae strains. Bioresour. Technol. 124, 217–226. doi: 10.1016/j.biortech.2012.08.003
Breuer, G., Lamers, P. P., Martens, D. E., Draaisma, R. B., and Wijffels, R. H. (2013). Effect of light intensity, pH, and temperature on triacylglycerol (TAG) accumulation induced by nitrogen starvation in Scenedesmus obliquus. Bioresour. Technol. 143, 1–9. doi: 10.1016/j.biortech.2013.05.105
Brown, M. R., and Blackburn, S. I. (2013). Live Microalgae as Feeds in Aquaculture Hatcheries. Sawston: Woodhead Publishing Limited. doi: 10.1533/9780857097460.1.117
Brown, M. R., Jeffrey, S. W., Volkman, J. K., and Dunstan, G. A. (1997). Nutritional properties of microalgae for mariculture. Aquaculture 151, 315–331.
Brune, D. E. (2012). Aquaculture, Algae and Biofuels; Three Decades of Microalgae Lessons. D E Eng. Bioenergy. Available online at: https://www.scribd.com/document/360209905/Brune
Chu, F. L. E., and Dupuy, J. L. (1980). The fatty acid composition of three unicellular algal species used as food sources for larvae of the American oyster (Crassostrea virginica). Lipids 15, 356–364. doi: 10.1007/BF02533551
Converti, A., Casazza, A. A., Ortiz, E. Y., Perego, P., and Del Borghi, M. (2009). Effect of temperature and nitrogen concentration on the growth and lipid content of Nannochloropsis oculata and Chlorella vulgaris for biodiesel production. Chem. Eng. Process. Process Intensif. 48, 1146–1151. doi: 10.1016/j.cep.2009.03.006
Costard, G. S., Machado, R. R., Barbarino, E., Martino, R. C., and Lourenco, S. O. (2012). Chemical composition of five marine microalgae that occur on the Brazilian coast. Int. J. Fish. Aquacult. 4, 191–201. doi: 10.5897/IJFA11.092
Coutinho, P., Ferreira, M., Freire, I., and Otero, A. (2020). Enriching rotifers with “Premium” microalgae: Rhodomonas lens. Mar. Biotechnol. 22, 118–129.
da Silva, A. F., Lourenço, S. O., and Chaloub, R. M. (2009). Effects of nitrogen starvation on the photosynthetic physiology of a tropical marine microalga Rhodomonas sp. (Cryptophyceae). Aquat. Bot. 91, 291–297. doi: 10.1016/j.aquabot.2009.08.001
Doust, A. B., Wilk, K. E., Curmi, P. M. G., and Scholes, G. D. (2006). The photophysics of cryptophyte light-harvesting. J. Photochem. Photobiol. A Chem. 184, 1–17. doi: 10.1016/j.jphotochem.2006.06.006
Drillet, G., Jørgensen, N. O. G., Sørensen, T. F., Ramløv, H., and Hansen, B. W. (2006). Biochemical and technical observations supporting the use of copepods as live feed organisms in marine larviculture. Aquac. Res. 37, 756–772. doi: 10.1111/j.1365-2109.2006.01489.x
Dunstan, G. A., Brown, M. R., and Volkman, J. K. (2005). Cryptophyceae and rhodophyceae; chemotaxonomy, phylogeny, and application. Phytochemistry 66, 2557–2570. doi: 10.1016/j.phytochem.2005.08.015
Fernandes, T., Fernandes, I., Andrade, C. A. P., and Cordeiro, N. (2016). Marine microalgae growth and carbon partitioning as a function of nutrient availability. Bioresour. Technol. 214, 541–547. doi: 10.1016/j.biortech.2016.05.001
González-Araya, R., Lebrun, L., Quéré, C., and Robert, R. (2012). The selection of an ideal diet for Ostrea edulis (L.) broodstock conditioning (part B). Aquaculture 36, 55–66. doi: 10.1016/j.aquaculture.2012.06.029
González-Araya, R., and Robert, R. (2018). Larval development and fatty acid composition of Ostrea edulis (L.) fed four different single diets from conditioning to pre-settlement. Aquac. Res. 49, 1768–1781. doi: 10.1111/are.13631
Grossman, A. R., Schaefer, M. R., Chiang, G. G., and Collier, J. L. (1994). “The responses of cyanobacteria to environmental conditions: light and nutrients,” in The Molecular Biology of Cyanobacteria. Advances in Photosynthesis, Vol. 1, ed. D. A. Bryant (Dordrecht: Springer), 641–675. doi: 10.1007/978-94-011-0227-8_21
Guevara, M., Arredondo-Vega, B. O., Palacios, Y., Saéz, K., and Gómez, P. I. (2016). Comparison of growth and biochemical parameters of two strains of Rhodomonas salina (Cryptophyceae) cultivated under different combinations of irradiance, temperature, and nutrients. J. Appl. Phycol. 28, 2651–2660.
Harrison, P. J., Thompson, P. A., and Calderwood, G. S. (1990). Effects of nutrient and light limitation on the biochemical composition of phytoplankton. J. Appl. Phycol. 2, 45–56. doi: 10.1007/BF02179768
Helm, M., and Bourne, N. (2004). Hatchery Culture of Bivalves. FAO. Fisheries Technical Paper No. 201. Rome: FAO.
Illman, A. M., Scragg, A. H., and Shales, S. W. (2000). Increase in Chlorella strains calorific values when grown in low nitrogen medium. Enzyme Microb. Technol. 27, 631–635.
Janssen, J. H., Wijffels, R. H., and Barbosa, M. J. (2019). Lipid production in nannochloropsis gaditana during nitrogen starvation. Biology 8, 1–13. doi: 10.3390/biology8010005
Jia, J., Han, D., Gerken, H. G., Li, Y., Sommerfeld, M., Hu, Q., et al. (2015). Molecular mechanisms for photosynthetic carbon partitioning into storage neutral lipids in Nannochloropsis oceanica under nitrogen-depletion conditions. Algal Res. 7, 66–77. doi: 10.1016/j.algal.2014.11.005
Kanazawa, A., Teshima, S. I., and Ono, K. (1979). Relationship between essential fatty acid requirements of aquatic animals and the capacity for bioconversion of linolenic acid to highly unsaturated fatty acids. Comp. Biochem. Physiol. Part B Biochem. 63, 295–298.
Kilham, S. S., Kreeger, D. A., Goulden, C. E., and Lynn, S. G. (1997). Effects of nutrient limitation on biochemical constituents of Ankistrodesmus falcatus. Freshw. Biol. 38, 591–596. doi: 10.1046/j.1365-2427.1997.00231.x
Knuckey, R. M., Semmens, G. L., Mayer, R. J., and Rimmer, M. A. (2005). Development of an optimal microalgal diet for the culture of the calanoid copepod Acartia sinjiensis: effect of algal species and feed concentration on copepod development. Aquaculture 249, 339–351. doi: 10.1016/j.aquaculture.2005.02.053
Lafarga-De la Cruz, F., Valenzuela-Espinoza, E., Millán-Núñez, R., Trees, C. C., Santamaría-del-Ángel, E., and Núñez-Cebrero, F. (2006). Nutrient uptake, chlorophyll a and carbon fixation by Rhodomonas sp. (Cryptophyceae) cultured at different irradiance and nutrient concentrations. Aquac. Eng. 35, 51–60. doi: 10.1016/j.aquaeng.2005.08.004
Langdon, C. J., and Waldock, M. J. (1981). The effect of algal and artificial diets on the growth and fatty acid composition of Crassostrea gigas spat. J. Mar. Biol. Assoc. U. K. 61, 431–448. doi: 10.1017/S0025315400047056
Lawrenz, E., Fedewa, E. J., and Richardson, T. L. (2011). Extraction protocols for the quantification of phycobilins in aqueous phytoplankton extracts. J. Appl. Phycol. 23, 865–871.
Lynn, S. G., Kilham, S. S., Kreeger, D. A., and Interlandi, S. J. (2000). Effect of nutrient availability on the biochemical and elemental stoichiometry in the freshwater diatom Stephanodiscus minutulus (Bacillariophyceae). J. Phycol. 36, 510–522. doi: 10.1046/j.1529-8817.2000.98251.x
Muller-Feuga, A. (2000). The role of microalgae in aquaculture: situation and trends. J. Appl. Phycol. 12, 527–534. doi: 10.1023/a:1008106304417
Oostlander, P. C., Houcke, J. V., Wijffels, R. H., and Barbosa, M. J. (2020). Growth and fatty acid content of Rhodomonas sp. under day: night cycles of light and temperature. Algal. Res. 51:102034. doi: 10.1016/j.algal.2020.102034
Patil, V., Källqvist, T., Olsen, E., Vogt, G., and Gislerød, H. R. (2007). Fatty acid composition of 12 microalgae for possible use in aquaculture feed. Aquac. Int. 15, 1–9. doi: 10.1007/s10499-006-9060-3
Pettersen, A. K., Turchini, G. M., Jahangard, S., Ingram, B. A., and Sherman, C. D. H. (2010). Effects of different dietary microalgae on survival, growth, settlement and fatty acid composition of blue mussel (Mytilus galloprovincialis) larvae. Aquaculture 309, 115–124. doi: 10.1016/j.aquaculture.2010.09.024
Piorreck, M., Baasch, K. H., and Pohl, P. (1984). Biomass production, total protein, chlorophylls, lipids and fatty acids of freshwater green and blue-green algae under different nitrogen regimes. Phytochemistry 23, 207–216.
Pratoomyot, J., Srivilas, P., and Noiraksar, T. (2005). Fatty acids composition of 10 microalgal species. Songklanakarin J. Sci. Technol. 27, 1179–1187.
Renaud, S. M., Thinh, L. V., and Parry, D. L. (1999). The gross chemical composition and fatty acid composition of 18 species of tropical Australian microalgae for possible use in mariculture. Aquaculture 170, 147–159.
Rhee, G. Y. (1978). Effects of N: P atomic ratios and nitrate limitation on algal growth, cell composition, and nitrate uptake. Limnol. Oceanogr. 23, 10–25.
Rhiel, E., Krupinska, K., and Wehrmeyer, W. (1986). Effects of nitrogen starvation on the function and organization of the photosynthetic membranes in Cryptomonas maculata (Cryptophyceae). Planta 169, 361–369. doi: 10.1007/BF00392132
Richardson, B., Orcutt, D. M., Schwertner, H. A., Martinez, C. L., and Wickline, H. E. (1969). Effects of nitrogen limitation on the growth and composition of unicellular algae in continuous culture. Appl. Microbiol. 18, 245–250.
Rodríguez, C., Pérez, J. A., Badía, P., Izquierdo, M. S., Fernández-Palacios, H., and Hernández, A. L. (1998). The n - 3 highly unsaturated fatty acids requirements of gilthead seabream (Sparus aurata L.) larvae when using an appropriate DHA/EPA ratio in the diet. Aquaculture 169, 9–23.
Rodríguez, C., Pérez, J. A., Díaz, M., Izquierdo, M. S., Fernández-Palacios, H., and Lorenzo, A. (1997). Influence of the EPA/DHA ratio in rotifers on gilthead seabream (Sparus aurata) larval development. Aquaculture 150, 77–89. doi: 10.1016/S0044-8486(96)01472-X
Sciandra, A., Lazzara, L., Claustre, H., and Babin, M. (2000). Responses of growth rate, pigment composition and optical properties of Cryptomonas sp. to light and nitrogen stresses. Mar. Ecol. Prog. Ser. 201, 107–120. doi: 10.3354/meps201107
Seixas, P., Coutinho, P., Ferreira, M., and Otero, A. (2009). Nutritional value of the cryptophyte Rhodomonas lens for Artemia sp. J. Exp. Mar. Bio. Ecol. 381, 1–9. doi: 10.1016/j.jembe.2009.09.007
Shifrin, N. S., and Chisholm, S. W. (1981). Phytoplankton lipids: interspecific differences and effects of nitrate, silicate and light-dark cycles. J. Phycol. 17, 374–384. doi: 10.1111/j.0022-3646.1981.00374.x
Simionato, D., Block, M. A., La Rocca, N., Jouhet, J., Maréchal, E., Finazzi, G., et al. (2013). The response of Nannochloropsis gaditana to nitrogen starvation includes de novo biosynthesis of triacylglycerols, a decrease of chloroplast galactolipids, and reorganization of the photosynthetic apparatus. Eukaryot. Cell 12, 665–676.
Thompson, P. A., Guo, M., and Harrison, P. J. (1993). The influence of irradiance on the biochemical composition of three phytoplankton species and their nutritional value for larvae of the Pacific Oyster (Crassostrea gigas). Mar. Biol. 117, 259–268. doi: 10.1007/BF00345671
Tornabene, T. G., Holzer, G., Lien, S., and Burris, N. (1983). Lipid composition of the nitrogen starved green alga Neochloris oleoabundans. Enzyme Microb. Technol. 5, 435–440.
van Houcke, J., Medina, I., Maehre, H. K., Cornet, J., Cardinal, M., Linssen, J., et al. (2017). The effect of algae diets (Skeletonema costatum and Rhodomonas baltica) on the biochemical composition and sensory characteristics of Pacific cupped oysters (Crassostrea gigas) during land-based refinement. Food Res. Int. 100, 151–160. doi: 10.1016/j.foodres.2017.06.041
Volkman, J. K., Jeffrey, S. W., Nichols, P. D., Rogers, G. I., and Garland, C. D. (1989). Fatty acid and lipid composition of 10 species of microalgae used in mariculture. J. Exp. Mar. Bio. Ecol. 128, 219–240.
Vu, M. T. T., Douëtte, C., Rayner, T. A., Thoisen, C., Nielsen, S. L., and Hansen, B. W. (2016). Optimization of photosynthesis, growth, and biochemical composition of the microalga Rhodomonas salina—an established diet for live feed copepods in aquaculture. J. Appl. Phycol. 28, 1485–1500.
Vu, M. T. T., Jepsen, P. M., Jørgensen, N. O. G., Hansen, B. W., and Nielsen, S. L. (2019). Testing the yield of a pilot−scale bubble column photobioreactor for cultivation of the microalga Rhodomonas salina as feed for intensive calanoid copepod cultures. Aquac. Res. 50, 63–71. doi: 10.1111/are.13868
Watanabe, T., Kitajima, C., and Fujita, S. (1983). Nutritional values of live organisms used in Japan for mass propagation of fish: a review. Aquaculture 34, 115–143. doi: 10.1016/0044-8486(83)90296-X
Yamamoto, S., Bossier, P., and Yoshimatsu, T. (2020). Biochemical characterization of Rhodomonas sp. Hf-1 strain (cryptophyte) under nitrogen starvation. Aquaculture 516:734648. doi: 10.1016/j.aquaculture.2019.734648
Keywords: Rhodomonas sp., nitrogen starvation, cell volume, fatty acids, phycoerythrin, PUFA, DHA, EPA
Citation: Latsos C, van Houcke J and Timmermans KR (2020) The Effect of Nitrogen Starvation on Biomass Yield and Biochemical Constituents of Rhodomonas sp. Front. Mar. Sci. 7:563333. doi: 10.3389/fmars.2020.563333
Received: 18 May 2020; Accepted: 05 October 2020;
Published: 22 October 2020.
Edited by:
Sami Souissi, Lille University of Science and Technology, FranceReviewed by:
Ana Otero, University of Santiago de Compostela, SpainPetros Katapodis, University of Ioannina, Greece
Copyright © 2020 Latsos, van Houcke and Timmermans. This is an open-access article distributed under the terms of the Creative Commons Attribution License (CC BY). The use, distribution or reproduction in other forums is permitted, provided the original author(s) and the copyright owner(s) are credited and that the original publication in this journal is cited, in accordance with accepted academic practice. No use, distribution or reproduction is permitted which does not comply with these terms.
*Correspondence: Christos Latsos, Y2hyaXN0b3MubGF0c29zQGh6Lm5s