 Morgan Jennifer Martin
 Tess Gridley
 Jean-Paul Roux5
 Simon Harvey Elwen
- 1Mammal Research Institute, Department of Zoology and Entomology, University of Pretoria, Pretoria, South Africa
- 2Wildlife Conservation Society Canada, Whitehorse, YT, Canada
- 3Department of Biology, University of Victoria, Victoria, BC, Canada
- 4Department of Botany and Zoology, Faculty of Science, Stellenbosch University, Stellenbosch, South Africa
- 5SEACODE and Namibia Nature Foundation, Lüderitz, Namibia
Knowledge of a population’s abundance is of primary importance for conservation management. However, robust estimates of abundance are often difficult to obtain, especially for cetaceans which spend most of their lives submerged. Cetacean abundance is commonly estimated using aerial or vessel-based line transect surveys and distance sampling methods. During 2012–2014, the first line transect surveys to estimate cetacean abundance were conducted in Namibian waters. Surveys took place in the Namibian Islands’ Marine Protected Area (NIMPA), a large MPA located along the southern Namibian coastline. A combined visual and acoustic double-platform survey configuration was used to investigate the factors affecting detectability of the endemic Heaviside’s dolphin (Cephalorhynchus heavisidii) and dusky dolphin (Lagenorhynchus obscurus obscurus). The present analysis estimates the probability of detection on the transect line (g(0)) for these two species and generates density and abundance estimates which incorporate a correction for both animals missed on the transect line and attractive responsive movement. The average annual baseline density and abundance estimates for Heaviside’s dolphins in the NIMPA region during 2012–2014 were 0.08 individuals/km2 (CV = 28.6%, 95% CI = 0.04–0.15 individuals/km2) and 1594 individuals (CV = 28.6%, 95% CI = 776–3275), respectively. The average annual baseline density and abundance estimates for dusky dolphins in the NIMPA region during 2012–2014 were 0.16 individuals/km2 (CV = 26.2%, 95% CI = 0.10–0.28 individuals/km2) and 3493 individuals (CV = 26.2%, 95% CI: 2015–6052), respectively. A discussion on the distribution of Heaviside’s and dusky dolphins is provided for this region where such information is urgently needed. Based on existing knowledge of the species and area, these estimates are regarded as reasonable. They indicate moderate sized populations of animals within the NIMPA and provide an important first baseline on which future estimates can build.
Introduction
Estimates of abundance, trends and distribution are fundamental for the conservation management of any species. However, robust estimates of abundance are often difficult to obtain, especially for cetaceans which spend most of their lives submerged. Abundance estimates are especially needed for coastal and riverine species of dolphins and porpoises found in Asia, Africa and South America, as these are amongst the most anthropogenically impacted areas with the least dedicated research (Jefferson, 2019). Furthermore, many small cetacean species have restricted distributions and an increasing number of these species have become threatened with significantly declining populations (e.g., Gerrodette et al., 2011; Jefferson, 2019). Research effort to estimate population sizes and to better understand potential impacts from anthropogenic activites for these species is urgently needed.
Heaviside’s dolphins (Cephalorhynchus heavisidii) and dusky dolphins (Lagenorhynchus obscurus obscurus) are sympatric species within the Benguela Current ecosystem located off southwestern Africa (Findlay et al., 1992; Elwen et al., 2010). Heaviside’s dolphins are endemic to the Benguela region ranging from southern Angola (∼16°S) to the Cape of Good Hope, South Africa (∼34°S) (Best, 2007). They are small in body size (<1.7 m) and are typically observed in groups averaging three to four individuals (Findlay et al., 1992; Elwen et al., 2010; Martin et al., 2019) which can make them challenging to observe at sea. Their range is limited to coastal and shelf waters generally < 100 m depth (Elwen et al., 2006; De Rock et al., 2019) and they have small home ranges within this area (Elwen et al., 2006; Davis et al., 2014), which plays a role in generating some level of population structure within the species’ range (Gopal et al., 2019). The Heaviside’s dolphin conservation status was recently updated from ‘Data Deficient’ to ‘Least Concern’ within South Africa (Gopal et al., 2016), as they appear to be locally abundant in the southern part of their range (Elwen et al., 2009). However, the IUCN Red List global species assessment was revised from ‘Data Deficient’ to ‘Near Threatened’ partly due to remaining uncertainty regarding the overall population structure, abundance and anthropogenic threats (Elwen and Gopal, 2018). Knowledge of the species abundance, threats and conservation status within Namibia remains poor and improved knowledge of these issues was recommended during the IUCN assessment process (Elwen and Gopal, 2018).
In contrast to Heaviside’s dolphins, dusky dolphins (Lagenorhynchus obscurus) are found in several locations in the southern hemisphere, associated with cool temperate shelf waters primarily off New Zealand, eastern and western South America, southwestern Africa and a few mid-ocean islands (Alfaro-Shigueto et al., 2019). Animals within these four main populations are recognized as separate subspecies by the Society for Marine Mammalogy’s Committee on Taxonomy (2018) and on the IUCN Red List (Alfaro-Shigueto et al., 2019). Within the Benguela Current ecosystem, dusky dolphins have a slightly broader range than Heaviside’s dolphins and are typically found in deeper waters up to 500 m depth (Findlay et al., 1992; De Rock et al., 2019). Group sizes range from 2 to 800 individuals ( = 35.3; Findlay et al., 1992; Best, 2007), although most encountered groups consist of fewer than 40 individuals (Best and Meÿer, 2010). In South Africa, the dusky dolphin population is regarded as healthy with relatively few human threats and the species was recently revised from ‘Data Deficient’ to ‘Least Concern’ (Elwen et al., 2016), with the global assessment recently following suit (Alfaro-Shigueto et al., 2019). A hiatus in dusky dolphin distribution has been reported around the border between South Africa and Namibia in the vicinity of the Lüderitz upwelling cell (27°S – 30°S), indicating there may be some level of isolation between these populations (Findlay et al., 1992; Best and Meÿer, 2010), although this has not been confirmed genetically. Currently, there is no information available on the abundance or population structure of dusky dolphins found off Namibia.
Heaviside’s and dusky dolphins are listed amongst the cetacean species most vulnerable to climate change (Macleod, 2009) as they are both limited to a distribution range that includes both suitable shelf habitat and a water temperature ranging between 10°C and 18°C (Würsig and Würsig, 1980; Brownell and Cipriano, 1999; Best, 2007). The Benguela Current is the only eastern-boundary current bordered by warm-water currents at both its northern and southern limits. Consequently, small increases in water temperature could result in all shelf waters in this area becoming too warm for both species, and populations are expected to decline rather than shift poleward due to a lack of shelf habitat south of their existing ranges (Macleod, 2009). Further, both species are exposed to several poorly quantified and rapidly changing human threats including fisheries bycatch related mortality and illegal directed catch (Elwen and Gopal, 2018; Alfaro-Shigueto et al., 2019), changes in prey availability (Coetzee et al., 2008; Roux et al., 2013) and marine eco-tourism (Leeney, 2014). Thus, accurate baseline assessments of population size and distribution are important for the conservation management of Heaviside’s and dusky dolphins.
Vessel-based line transect surveys using distance sampling methods are a widely used and powerful method to systematically assess the density and abundance of cetaceans at sea (Jewell et al., 2012) and are especially suitable for marine protected areas (MPAs). In vessel-based line transect distance sampling, observers transit along a designed transect line and estimate the perpendicular distances of groups of animals from the line. This method accounts for the decrease in sighting probability with distance from the vessel and when combined with environmental and observer covariates, can be used to refine estimates of the density and abundance of a population in a survey area (Buckland et al., 2001). More recently, line transect surveys have been extended to use passive acoustic monitoring (PAM) methods, by towing an array of underwater microphones (i.e., hydrophones) which detect and record cetacean vocalizations (Van Parijs et al., 2009; Marques et al., 2013; Rankin et al., 2020). PAM offers several advantages over visual observer methods in that animals can be detected 24 hours a day, in poor weather conditions such as mist and when animals are submerged (Zimmer, 2011). For cetaceans, acoustic survey methods can dramatically improve detection probabilities (e.g., Gillespie and Chappell, 1998; Barlow and Taylor, 2005; Rankin et al., 2007a) and are becoming an increasingly important tool in the conservation management of rare and endangered cetacean species (Wang et al., 2006; Kimura et al., 2009; Gerrodette et al., 2011; Richman et al., 2014).
To obtain reliable density and abundance estimates from vessel-based line transect distance sampling, biases arising from violations in certain assumptions must be accounted for. When estimating absolute abundance, one assumption is that the probability of animals being detected on the transect line, generally expressed as g(0), is = 1 (Buckland et al., 1993). This assumption can be violated by a failure to detect animals on the transect line, which can result from availability or perception bias. Availability bias arises when animals are missed on the transect line because they are not available for detection (e.g., submerged). Perception bias arises when animals are accessible for detection but are missed due to other factors (e.g., observer fatigue, poor weather conditions). Another important assumption is that animals do not respond to the survey vessel before they are detected (Buckland et al., 2001). On ship surveys, data collected from two independent observation platforms allows for the quantification of biases and is an accepted way to account for missed detections on the transect line and to correct for responsive movement (Buckland and Turnock, 1992; Borchers et al., 1998). This approach utilizes two independent teams of one or more observers simultaneously surveying the area, with detections compared between teams to identify duplicate and missed detections within a mark-recapture framework (e.g., Hammond et al., 1995; Cañadas et al., 2004). However, implementing two independent visual observer platforms on smaller vessels can be difficult due to space constraints and the same availability biases likely remain. An alternative approach is to use a single visual observer platform combined with a PAM platform using a towed hydrophone array (e.g., Barlow and Taylor, 2005; Gerrodette et al., 2011; Rankin et al., 2020). This provides an alternative method of detection that does not have the same limitations as the visual platform. The ability to identify the presence of animals while underwater can improve detectability (i.e., reducing availability bias), assuming the animals are vocalizing, within acoustic detection range and not masked by other noise (Barlow and Taylor, 2005). Most cetaceans vocalize frequently for orientation, foraging and communication, making them ideal subjects for estimating density using passive acoustic detection (see Marques et al., 2013 for review).
Heaviside’s dolphin echolocation clicks are classified as belonging to the narrowband high-frequency (NBHF) click type (Morisaka et al., 2011). The source level, frequency, bandwidth and duration of Heaviside’s dolphin echolocation clicks are highly similar to those of other Cephalorhynchus and porpoise species (e.g., Morisaka et al., 2011; Kyhn et al., 2013). Dusky dolphins produce broadband echolocation clicks which are lower in frequency, broader in bandwidth and shorter in duration compared to NBHF clicks (Au and Würsig, 2004). Heaviside’s and dusky dolphins are acoustically distinct from each other, thereby simplifying the use of PAM in this region.
The current study incorporated the Namibian Islands’ Marine Protected Area (NIMPA), which is currently Namibia’s only MPA. Established in 2009, the NIMPA is a large (400 km long × 30 km wide) coastal no-take area for industrial fishing (trawling and purse seining) in southern Namibia. The NIMPA encompasses the central distribution of Heaviside’s dolphins as well as a known part of the distribution of African dusky dolphins (Best, 2007). As a relatively new MPA, the estimates produced from this study provide a baseline for investigating potential future positive changes due to the MPA’s creation. It includes 11 offshore islands and islets, extending from Hollamsbird Island (24° 38′ S, 14° 31′ E) to Sinclair Island (27° 40′ S, 15° 31′ E) (Currie et al., 2009). The NIMPA encompasses 25% of the overall coastline of Namibia (1574 km), and it is located within the northern Benguela Current upwelling system, one of the most productive marine ecosystems in the world (Carr, 2001). The NIMPA encompasses the Lüderitz upwelling cell, the strongest wind-driven upwelling zone in the Benguela Current, which is characterized by persistent perennial high equatorward wind speeds that generate powerful offshore transport and mixing in the water column (Bakun, 1996; Hutchings et al., 2009). These physical features and associated temperature gradients form a clear separation between the northern and southern Benguela ecosystems (Hutchings et al., 2009). The NIMPA was designed primarily to protect foraging areas for island breeding sea birds (Ludynia et al., 2012) and although cetaceans are thought to be abundant within the MPA, no abundance estimates or trends exist for cetacean populations in the area except for southern right whales (Eubalaena australis) (Roux et al., 2015).
During 2012-2014, the first systematic parallel line transect surveys of the NIMPA and its surrounding waters were conducted using a combined visual and acoustic double-platform survey configuration to estimate the abundance and distribution of Heaviside’s and dusky dolphins in this region. We investigate factors affecting detectability, generate estimates of g(0) and incorporate a correction for both animals missed on the transect line and attractive responsive movement. Resultant baseline density and abundance estimates and a discussion of the distribution of Heaviside’s and dusky dolphins are provided for this region where such information are needed. Distribution was examined using the water depth at time of detection to investigate if our survey detections were consistent with the proposed differences in habitat preference of the two sympatric species (Findlay et al., 1992; De Rock et al., 2019).
Materials and Methods
Survey Design
Surveys were conducted using the Namibian Government’s Ministry of Fisheries and Marine Resources’ (MFMR) Lüderitz-based 22 m long research vessel, the RV !Anichab. Data were collected between March and May during 2012-2014 within the NIMPA and its surrounding waters off southern Namibia (Figure 1). All surveys departed and returned to the port of Lüderitz, with data collection continuing overnight when weather conditions allowed (Beaufort sea state (BF) ≤ 6). In exceptionally poor weather conditions, the survey vessel deviated from the predetermined route to steam back to Lüderitz. Surveys were conducted at a relatively constant speed of 8-10 knots with parallel transect lines designed to head into (220°) and away from (40°) the predominant swell, running from coastal waters of 30 m depth to the 200 m isobath (Figure 1). This design was expected to encompass the offshore limits of the Heaviside’s dolphin distribution (Findlay et al., 1992). A 30 m seabed depth limit was determined as the shallowest depth the hydrophone array could be towed safely. Primary parallel transect lines were spaced 20 km apart based on a random starting point as recommended by Buckland et al. (2004). Secondary parallel transect lines were separated by a width of five km to allow greater coverage in the central survey region (25° 43′ S – 27° 00′ S), which encompassed Mercury, Ichaboe and Possession Islands (Figure 1). Thus, the survey region was stratified into a northern, central and southern region based on geographic location and distribution of survey effort. Sampling effort was lower in the northern and southern strata as these regions were further from port and logistically more challenging to survey (Figure 1).
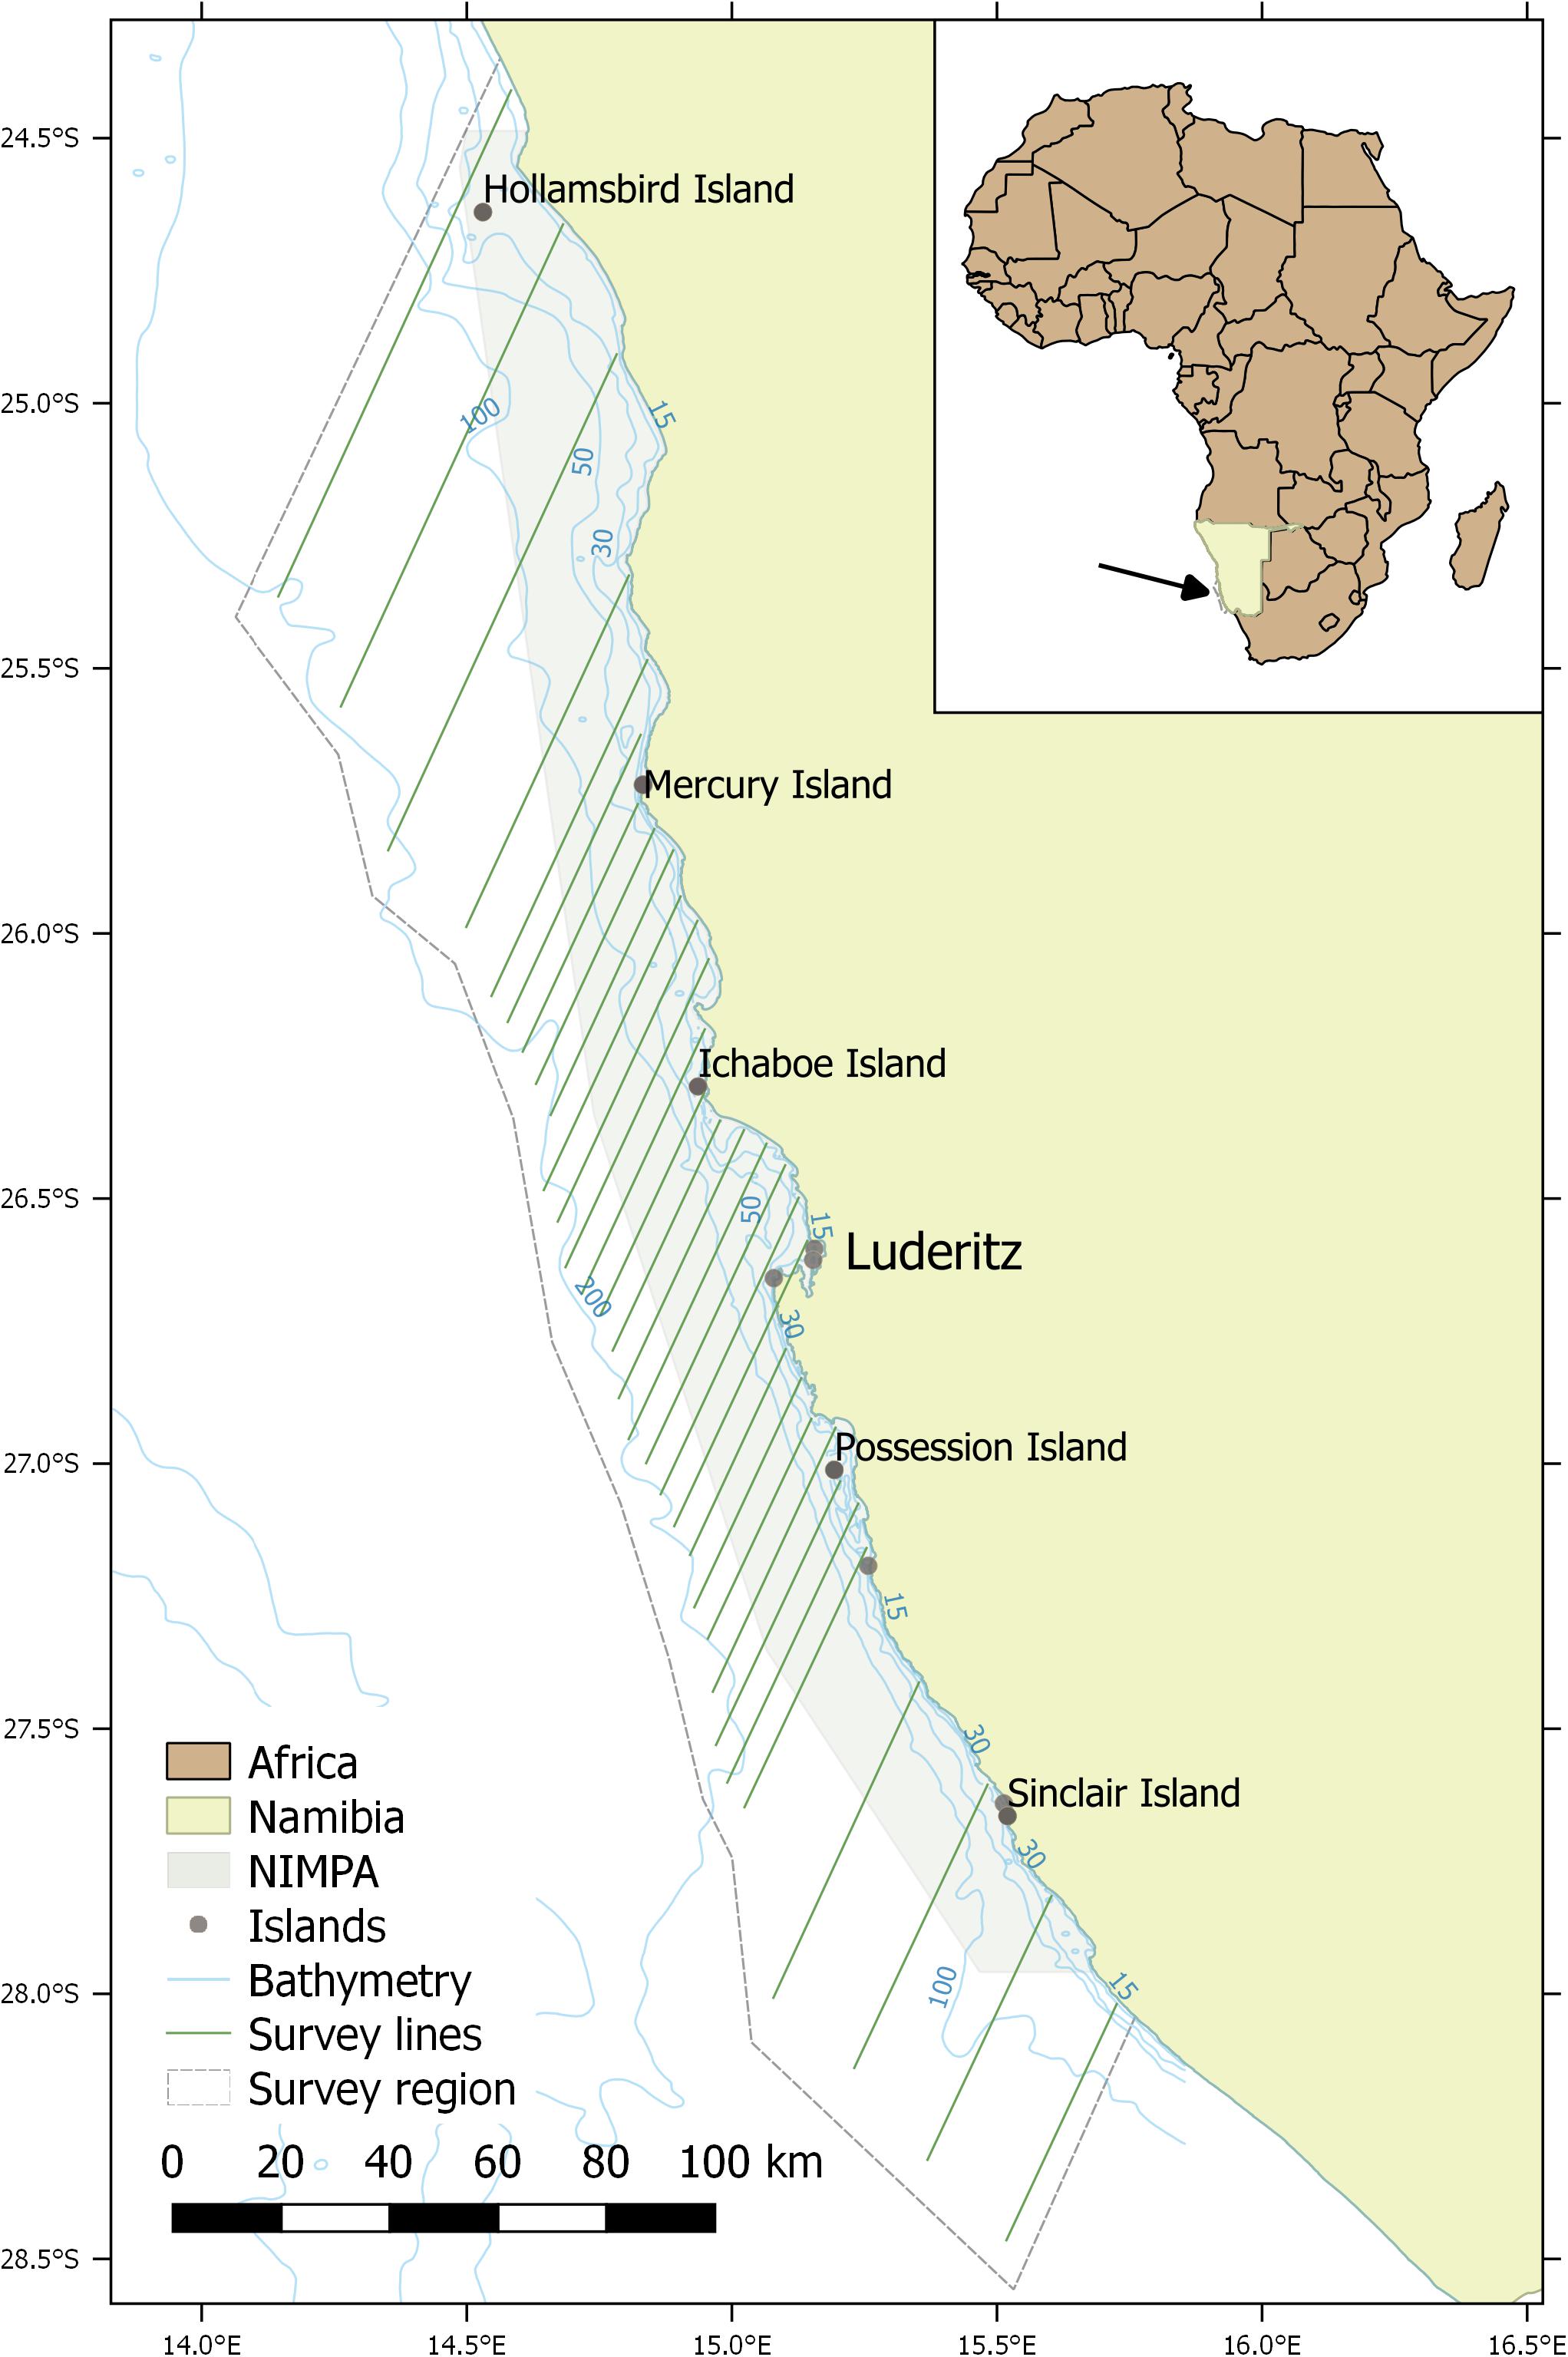
Figure 1. Systematic parallel line transect survey design of the Namibian Islands’ Marine Protected Area (NIMPA) and its surrounding area located along the southern coast of Namibia. The town of Lüderitz and key islands within the MPA are indicated. The four northernmost survey lines represent the northern stratum and the four southernmost lines represent the southern stratum. All lines in between represent the central stratum.
Visual Search Effort
Visual surveys for all cetacean species were conducted during daylight hours, generally between 06:00 h and 17:00 h, whenever survey conditions were favorable i.e., BF ≤ 5, no mist or fog. Surveys were completed in BF ≤ 5, despite the potential impact on detection, as good weather windows were limited. At the start of each survey, standard information on the sighting conditions were collected including: BF, wind direction and speed using an anemometer (kn), swell height (m), cloud cover (out of 8) and sightability (an overall index of visibility conditions; out of 5, where 1 indicated poor visibility and 5 indicated clear visibility). Information on the sighting conditions was collected by trained observers and updated every 30 min or whenever conditions changed. A GPS collected positional information every 1 s, which was used to calculate the covered transect line lengths as well as the vessel’s heading and speed.
Visual surveys were conducted using a team of four to five observers who rotated between port and starboard observer roles, data logger and rest stations every 30 min to prevent observer fatigue. Prior to survey commencement, visual observers were trained in estimating distance using objects at a known distance from the vessel. During survey effort, two observers were stationed on either side of the vessel and searched from the bow to 90° port or starboard. Searches were conducted with 10 × 40 binoculars and the naked eye, with observer eye height approximately 7 m above sea level. Where necessary, species confirmation was made using binoculars and photographs. Upon making a sighting, observers used VHF radios to communicate all sighting information to the data logger stationed in the wheelhouse. Sighting information was recorded to a MS Access database in real time using Logger 2010 (IFAW1). The data recorder noted radial distance (estimated by eye) to the sighting, radial angle (measured using angle boards with the bow considered to be 0°), time, location (GPS), species and estimated group size. Observers reported group sizes as ‘best’, ‘high’ and ‘low’ estimates of the number of animals present, and ‘best’ estimates were used in subsequent analyses. Additional information was recorded on cue type, animal behavior (e.g., foraging, traveling, resting, socializing; Henderson et al., 2012) and animal aspect relative to the vessel to allow for investigation of potential responsive movement. Survey effort was conducted in passing mode (i.e., without stopping or deviating from the transect line to approach groups). For a small number of cases, closing mode (off effort) was used to enable photo-identification of rare or hard to identify species, notably balaenopterid whales. The transect line was resumed from the location where it was left prior to closing mode.
Acoustic Data Collection
Where possible acoustic data were collected continuously during surveys using a custom-built linear hydrophone array. The array was deployed in water depths exceeding 30 m and towed 380 m behind the vessel at a depth of approximately 10 m when the vessel was underway. Acoustic survey effort occurred in BF ≤ 6. The hydrophone array consisted of a 3 m oil filled streamer section containing three hydrophone elements (HS150, Sonar Research and Development Ltd., United Kingdom), with sensitivities of −204 dB re 1V/μPa and a flat frequency response ( ± 2 dB) from 1 Hz to 160 kHz. Data used in this study primarily originated from two hydrophones situated in a linear configuration 25 cm apart, designed for localization of very high frequency cetacean signals ( > 100 kHz, Southall et al., 2019). The third hydrophone was situated 3 m from the first hydrophone for localization of mid-frequency cetacean signals (up to 96 kHz). Localization to the sound source is achieved through the convergence of successive bearing angles which are determined using the time delay of arrival of a signal detected by two closely spaced hydrophone elements in a towed array (Rankin et al., 2008). Pre-amplifiers contained in the array provided a gain of 30 dB. A high pass filter was set at 500 Hz (2-pole Butterworth) and a low pass filter at 200 kHz (1-pole Butterworth). High frequency acoustic data were recorded through a National Instruments Digital Acquisition sound card (USB-X63562) at a 16-bit, 500 kHz sampling rate. Mid-frequency acoustic data were recorded through an RME Fireface UC sound card3 at a 16-bit, 192 kHz sampling rate. Recordings were saved to a computer hard drive using PAMGuard (v. 1.13.034). Acoustic data analysis for Heaviside’s and dusky dolphin detections took place offline. A small number of files were influenced by extreme electrical noise on both channels and were removed from the analysis.
Acoustic Detections
Heaviside’s dolphins produce distinctive NBHF echolocation pulses (i.e., clicks) with a mean apparent source level (ASL; see Møhl et al., 2000 for ASL definition) of 173 dB re 1 μPap–p, centroid frequency of 125 kHz, root mean square bandwidth of 15 kHz and a −10 dB duration of 74 μs (Morisaka et al., 2011; Martin et al., 2018). Heaviside’s dolphin echolocation click parameters are highly similar to those of other NBHF species (e.g., Madsen et al., 2005; Morisaka et al., 2011; Kyhn et al., 2013), including harbor porpoises (Phocoena phocoena), for which a reliable automated click detector and classifier already exists (Gillespie and Chappell, 20024). These automated methods were applied to detect Heaviside’s dolphins and are described in detail in Gridley et al. (in press). Definite Heaviside’s dolphin acoustic detections were click trains containing ≥ 5 NBHF clicks and meeting all validation criteria presented in Gridley et al. (in press).
Dusky dolphins produce broadband echolocation clicks with a mean source level of 191 dB re 1 μPap–p, centroid frequency around 80 kHz, root mean square bandwidth around 34 kHz and duration < 70 μs (Au and Würsig, 2004). Automated methods were applied in PAMGuard’s click detector and classifier to identify dusky dolphin clicks and these methods are described in detail in Martin (2019). Acoustic detection parameters were designed by measuring spectral and temporal parameters of recorded echolocation clicks produced by single species groups of dusky dolphins observed during combined visual and acoustic search effort. Definite dusky dolphin acoustic detections were click trains containing ≥ 10 broadband clicks which met the validation criteria presented in Martin (2019).
Once identified, one or more clicks were grouped as an acoustic event based on the estimated maximum detection distance of clicks and average vessel speed, assuming the dolphins were echolocating from a stationary location in the horizontal plane. Acoustic detection radius can depend on the signal’s source level, vessel speed and environmental covariates (e.g., depth, topography, salinity, ambient noise), not all of which were quantified in this study. Acoustic events were defined as all classified clicks occurring within a time window of 4 min 5 s. This time window was identified using the speed of the vessel (8 kn) and a maximum radial detection distance of 500 m, estimated for an animal echolocating at a stationary location on the horizontal plane (Rayment et al., 2009; Gerrodette et al., 2011). Encounters separated by more than this time limit were assumed to be from separate dolphin groups. In practice most events were discrete and concluded within a much shorter time frame. Acoustic detections were considered a group detection, and were not used to attempt to estimate numbers within the group. The perpendicular distance from the transect line was calculated wherever possible for acoustic events which were localized using the signal time of arrival differences in PAMGuard’s 2D Simplex target motion localization algorithm.
Duplicate Detection Analysis
Analyses combine distance sampling (DS) and mark-recapture (MR) methodology (Borchers et al., 1998; Laake and Borchers, 2004), in which each individual or group of individuals detected by one platform represents a ‘capture’ and duplicate detections made by the other platform represent ‘recaptures.’ As acoustic detections were identified post-survey, MR analysis of duplicates was performed by calculating a distance window following the methods of Richman et al. (2014), where a combined visual and acoustic platform survey was used to estimate the detectability of individual and groups of Ganges River dolphins (Platanista gangetica gangetica). The distance window incorporated the time and radial distance of the visual sighting, vessel speed, distance between detection platforms and time of acoustic detection (Richman et al., 2014). This method worked well for Heaviside’s dolphins. When pairing dusky dolphin sightings with acoustic detections, we noticed a prolonged time period between the first visual detection and first acoustic detection of a group. Closer inspection revealed that in cases where groups were observed bow riding (documented as a behavioral comment in the Logger database post initial sighting), acoustic detection was made only once the group had passed abeam of the vessel. This may be due to the highly directional nature of dolphin echolocation signals as the animals were oriented away from the hydrophone array when bow riding. Dusky dolphins were able to keep up with the vessel for periods up to 10 min; thus, a duplicate detection time window of 10 min from the time of visual sighting was used to identify the acoustic presence of dolphins for potential matched detections.
Heaviside’s and dusky dolphins were occasionally encountered as clusters of sightings in a short time period. The duplicate verification method described in Gridley et al. (in press) was applied to any cases where multiple visual detections occurred under one acoustic event. In these cases, matching decisions were based on careful inspection of the visual and acoustic event information, including localization of click trains. No attempt was made to adjust for potential clustered detections when only acoustic survey effort was being conducted as there were no visual sightings data to confirm the presence of additional groups. Thus, detections occurring on acoustic single platform effort may represent conservative estimates.
Confidence in Acoustic Detections
During the NIMPA survey, no other odontocete species (toothed whales) were sighted by the observer platform. However, there is potential to have misclassified a Heaviside’s or dusky dolphin acoustic detection recorded from another odontocete species. The only other NBHF clicking species potentially in the survey region are dwarf and pygmy sperm whales (Kogia sima, K. breviceps), but these typically occur at very low densities and are found in much deeper water than the surveyed area off the continental shelf (Best, 2007). Dusky dolphins are observed frequently in the NIMPA (De Rock et al., 2019) and have distinctive click characteristics (Martin, 2019), differentiating them from other potentially encountered local broadband clicking species. In addition, local broadband clicking dolphin species prolifically produce whistles except dusky dolphins (Au et al., 2010) and presumably southern right whale dolphins (Lissodelphis peronii) (Rankin et al., 2007b), the latter of which are known to occur occasionally in a small area offshore of the Lüderitz upwelling cell (Findlay et al., 1992). This species is rarely encountered, and we are unaware of any acoustic recordings of southern right whale dolphins from Namibia for comparison.
Vessel Attraction
If animals respond to the survey vessel before they are detected by the visual observers, it will result in density and abundance being either overestimated (if animals are attracted to the vessel) or underestimated (if animals move away from the vessel) (Buckland et al., 2001). Heaviside’s and dusky dolphins are known to be attracted to moving vessels, although the extent of this behavior has not been well quantified (Dr. S. Elwen, pers. obs., August 2020). Animal aspect was described as the degree of orientation of the dolphins representing ‘toward’, ‘away’, ‘left’ (i.e., toward the port side) and ‘right’ (i.e., toward the starboard side). A large proportion of sightings described as oriented ‘toward’ the vessel should indicate attractive responsive movement (Palka and Hammond, 2001). A combination of animal behavior and orientation data were used to examine sightings data for the presence or absence of responsive movement. If a group’s behavior was described as ‘attracted to the vessel’ or ‘bow riding,’ it was automatically considered positive for attractive movement. If the behavior did not indicate responsive movement and no orientation data were available, sightings were assigned as ‘unknown.’ Responsive movement was examined using all visual sightings recorded on search effort per species. A radial sighting distance of 400 m was used as a data partition for both species to examine if distance from the vessel affected behavior following the methods of Dawson et al. (2000) (Table 1). Dawson et al. (2000) found Hector’s dolphins (Cephalorhynchus hectori) were six times more likely to be attracted to the moving vessel within radial distances of < 400 m from the vessel, compared to distances > 400 m.
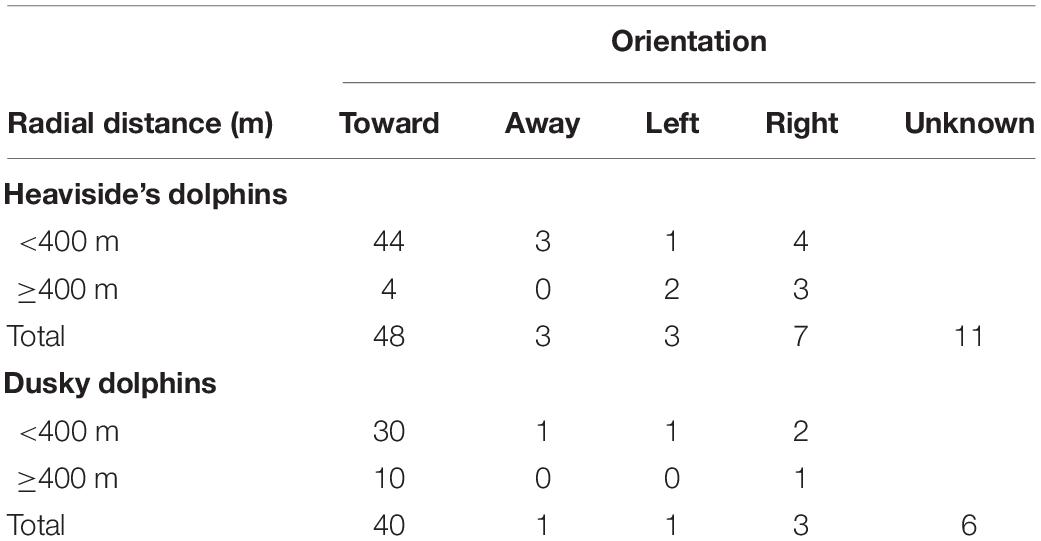
Table 1. Orientation of dolphins with respect to distance from all visual sightings made on search effort.
Estimation of the Detection Function
To ensure a sufficient number of sightings for abundance estimation (minimum of 60–80 is recommended; Buckland et al., 2001), data from the three survey years were pooled and used to calculate an average abundance estimate. Segments of systematic survey effort comprising a single transect line were pooled within years to assist with variance estimation as transect lines were usually only completed once per year. Detections from all systematic, transit and opportunistic transect lines during periods with simultaneous visual and acoustic survey effort were pooled to increase sample size for the estimation of g(0), as no differences in detectability were expected across them (Buckland et al., 2015). Transit and opportunistic transect lines were undertaken in the same way as systematic transect lines, with the same vessel speed and consistency in search effort. Only detections made on effort during systematic transect lines were included in the density and abundance estimates.
Prior to fitting the detection function, it is important to determine which variables may affect the probability of detecting groups of dolphins (Buckland et al., 2001). Sea conditions as indicated by the Beaufort scale are widely known to affect sightability of cetaceans (e.g., Palka, 1996; Buckland et al., 2001; Barlow, 2015). For estimating the detection function, ‘BF’ and ‘year’ were included as potential covariates. ‘Year’ was included as a covariate to account for inter-annual variation, but ‘season’ was not included because all surveys occurred during the austral autumn months. BF was treated as a continuous variable for sea states 0–6, and survey year was treated as a factor variable. Group size was not included as a covariate for either species because there was no evidence of group size bias in relation to perpendicular distance at the time of sighting (see section “Mean Group Size” below). In addition, individual observers and other qualitative environmental variables such as sightability were not included as covariates due to the limited number of detections available to fit the detection function.
Considering the visual observer data, we recognized a pronounced issue of attractive responsive movement by both study species (Table 1). Histograms of the fitted detection functions showed a steep decline in the probability of detection with distance from the transect line (Figures 2, 3), and the spike in our visual data is likely an artifact of animals being attracted to the vessel. Models fit with different distance sampling key functions will likely yield very different estimates of animal density for data such as these, and a double-platform observer approach is recommended as a better option to fit the shape of the detection function (Buckland et al., 2015). In this study we used a relatively novel approach of incorporating the visual and acoustic detection data as independent observer platforms to better fit the detection function and partially address the issue of boat-attraction. To our knowledge, there are no previous studies that address the issue of attractive responsive movement by using an acoustic platform as one of the independent platforms. As the same analyses were conducted for both dolphin species, we do not explicitly state this further, except where applicable.
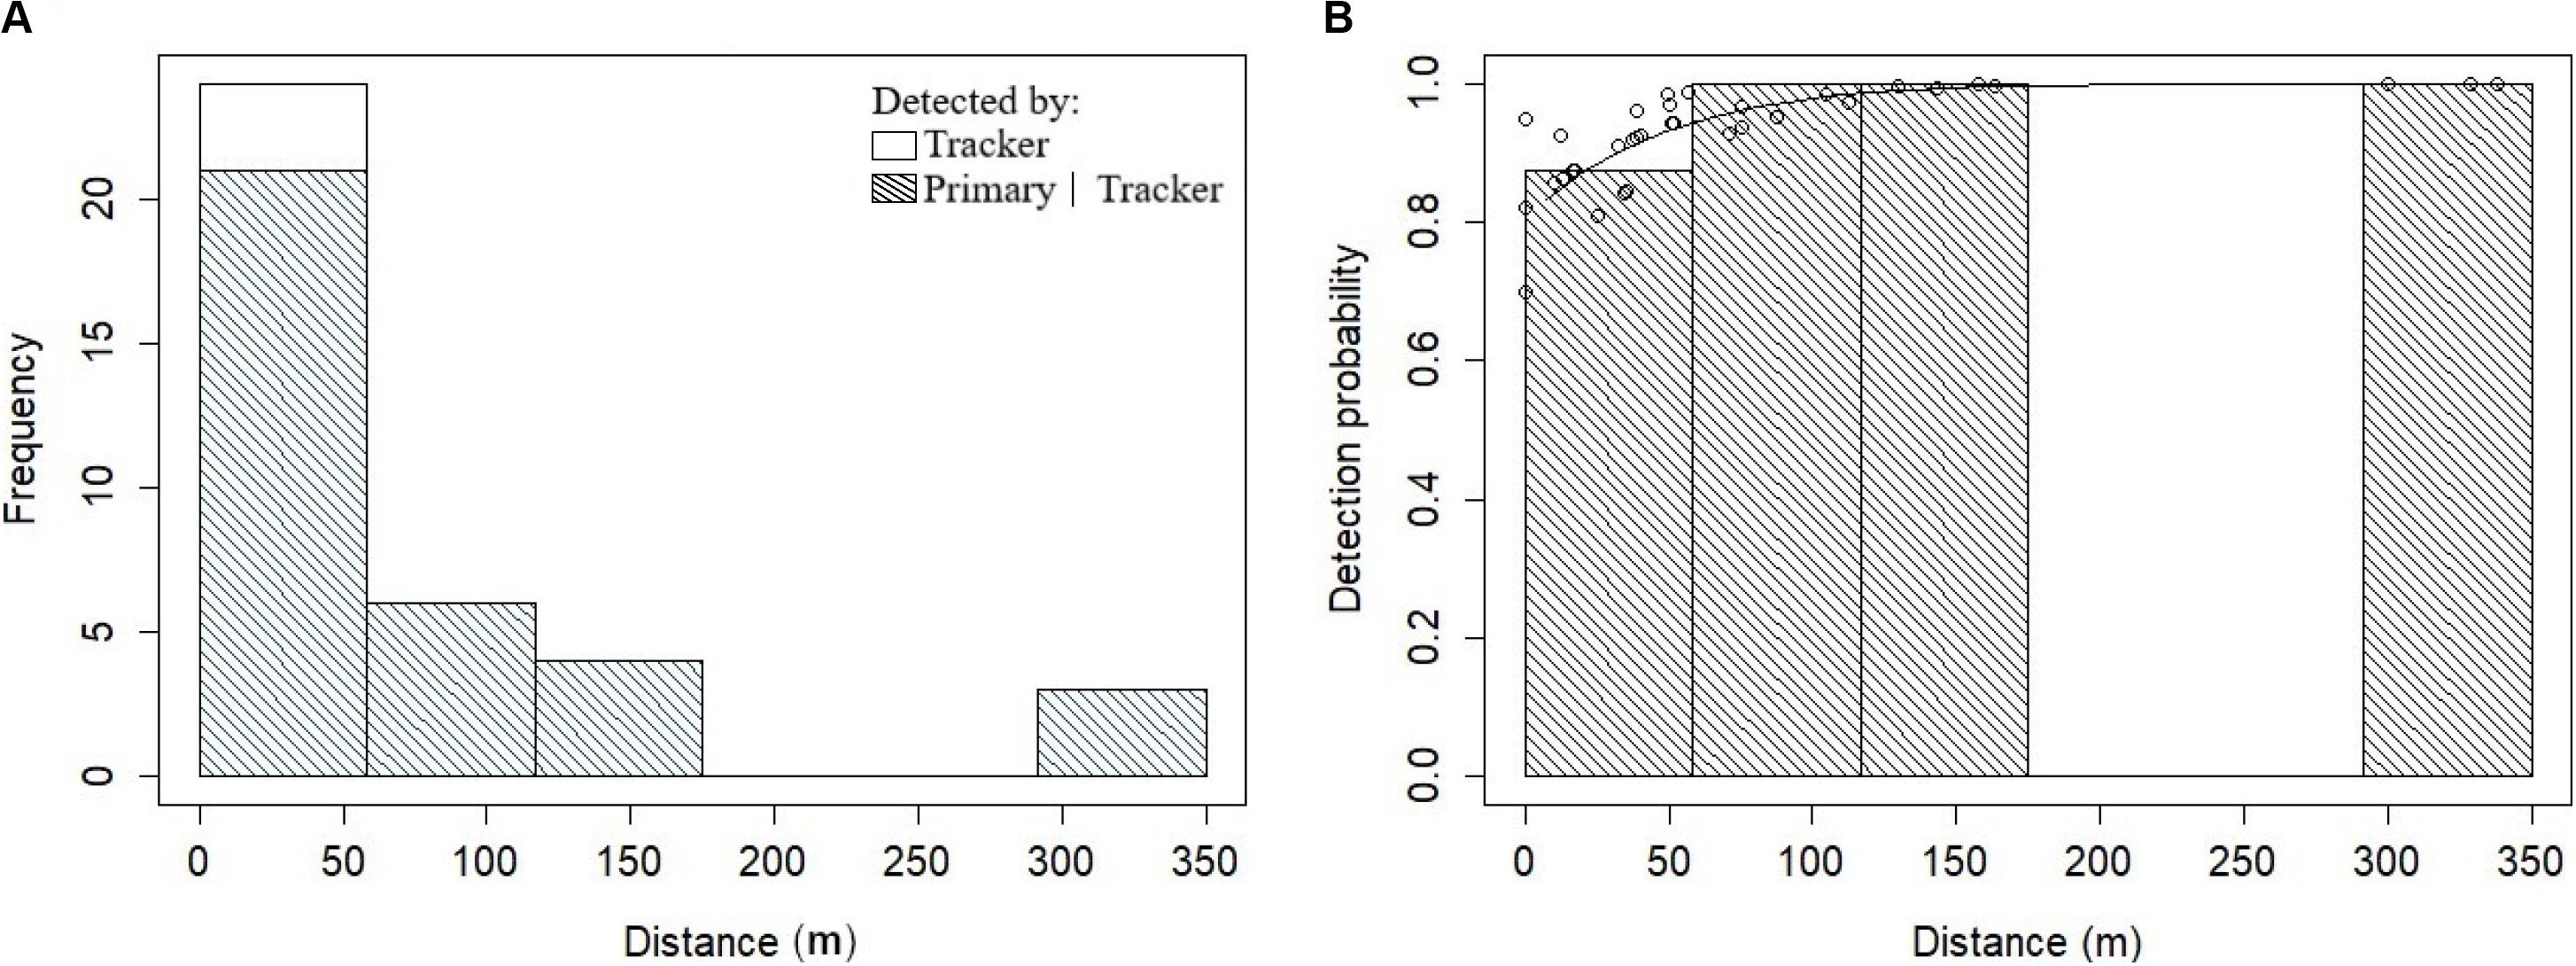
Figure 2. Fitting the Heaviside’s dolphin detection function. (A) Histogram of the frequency distributions of the perpendicular distances (m) truncated to 350 m for Heaviside’s dolphin groups detected by the tracker platform (i.e., visual). Shading indicates duplicate detections made by the primary platform (i.e., acoustic). (B) The conditional detection function for the primary platform based on detection by the tracker platform. The solid line is the fitted MR-FI model for the Heaviside’s dolphin data and dots represent probabilities for individual detections.
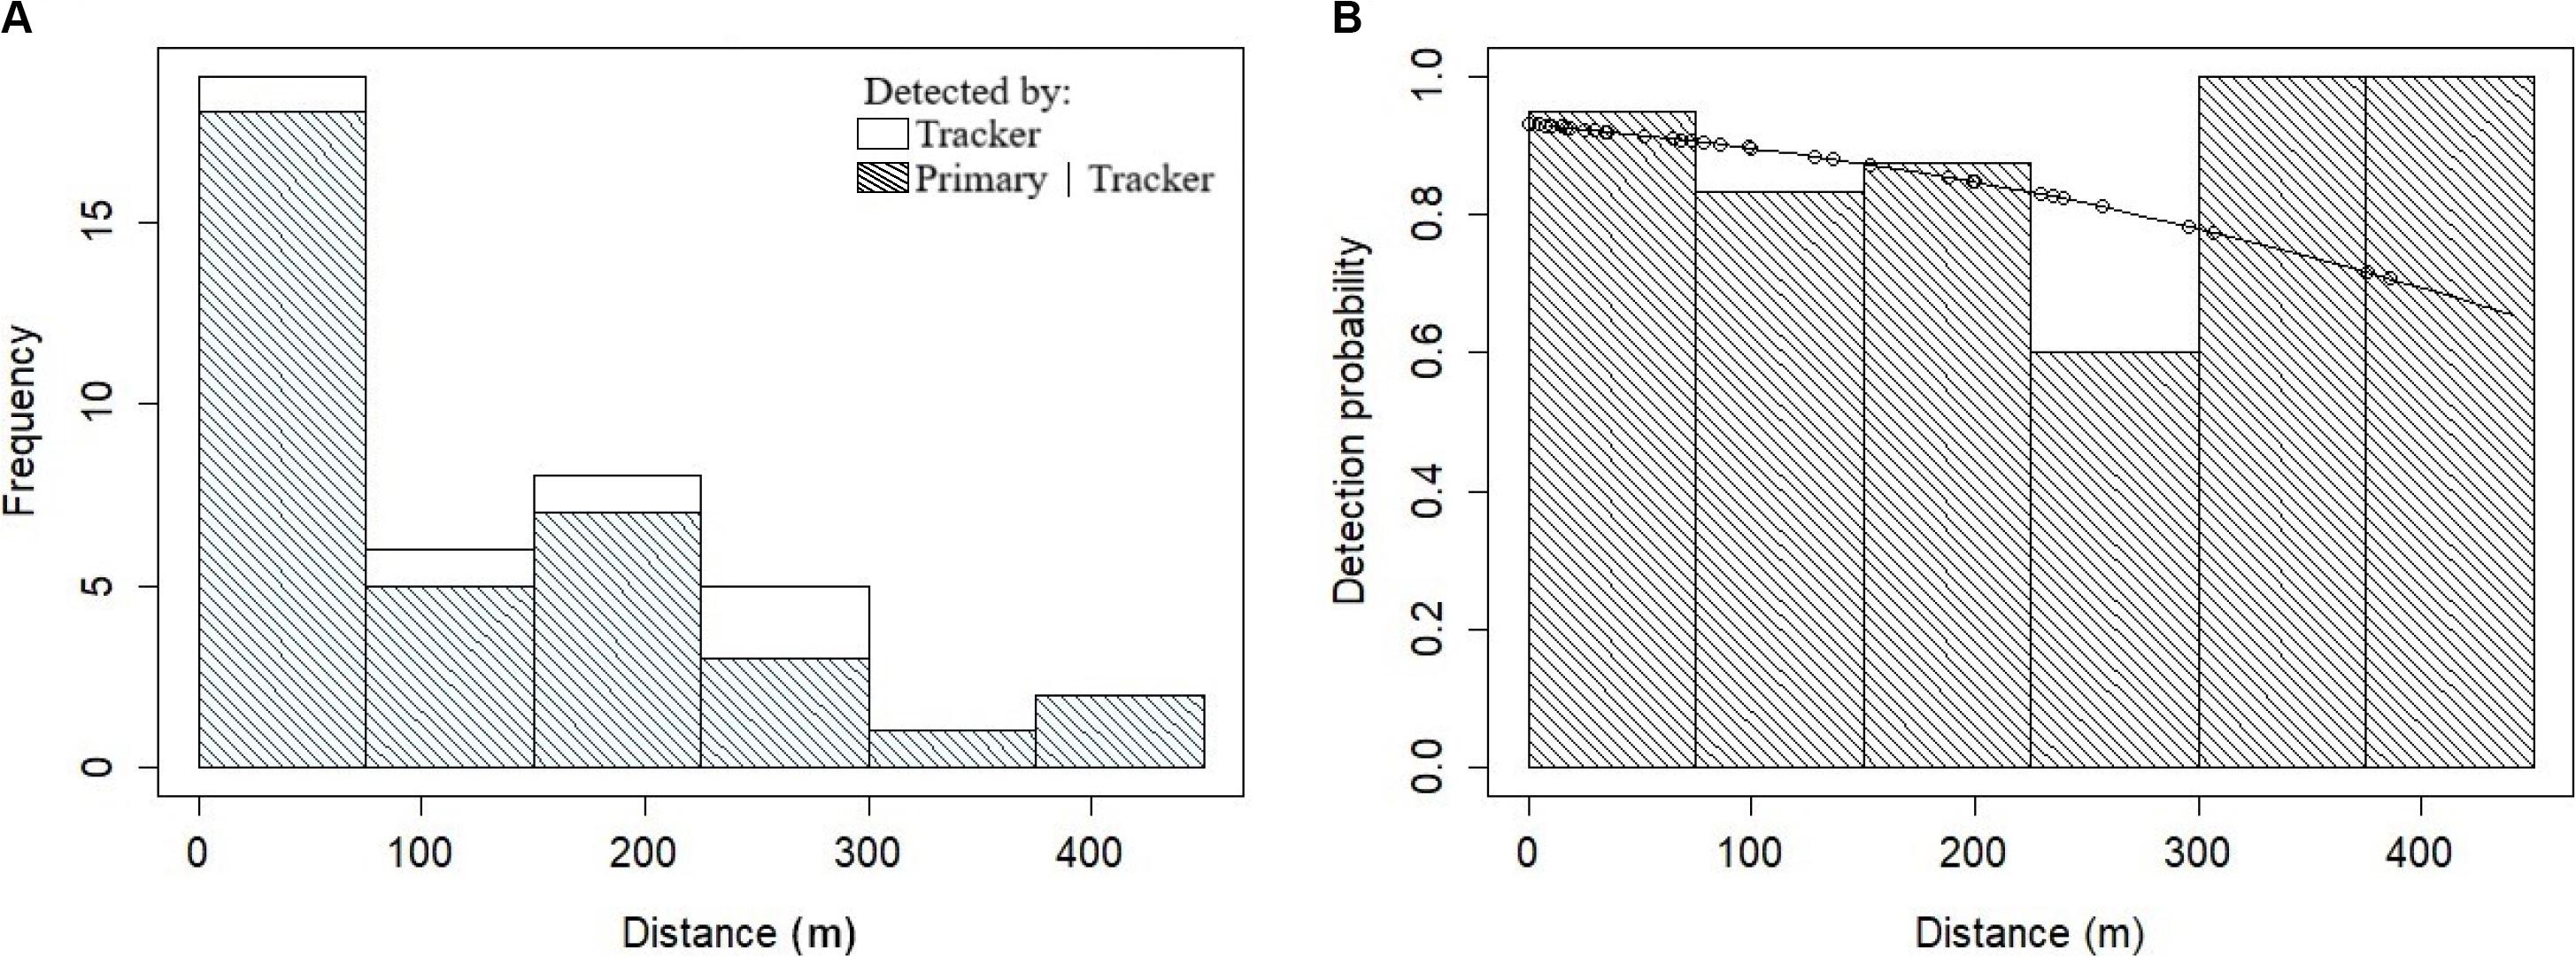
Figure 3. Fitting the dusky dolphin detection function. (A) Histogram of the frequency distributions of the perpendicular distances (m) truncated to 450 m for dusky dolphin groups detected by the tracker platform (i.e., visual). Shading indicates duplicate detections made by the primary platform (i.e., acoustic). (B) The conditional detection function for the primary platform is based on detection by the tracker platform. The solid line is the fitted MR-FI model for the dusky dolphin data and dots represent probabilities for individual detections.
To estimate g(0) and the overall probability of detection, a mark-recapture (MR) modeling approach with a trial configuration was applied due to the issue of responsive movement and subsequent spiked data. A trial configuration (i.e., ‘BT mode’) is one in which there is only one-way independence between the survey platforms (Buckland and Turnock, 1992; Borchers et al., 1998). One platform is responsible for setting up ‘trial’ detections for the other platform, which if also detected, counts as a ‘success’ or duplicate detection between platforms. This was implemented by assigning the independent visual observer platform as the ‘tracker’ platform because it was able to search farther ahead of the vessel than the acoustics platform, which was designated as the ‘primary’ platform (Table 2). By using the perpendicular distances of sightings at the time of detection by the tracker platform when estimating the primary platform’s detection function, an estimate is given for the primary platform that is unaffected by responsive movement (assuming there was no response prior to the tracker platform detecting the animals) (Laake and Borchers, 2004). It is also termed the conditional detection function because the primary platform’s estimated detection function is conditional on the tracker platform having detected the object of interest (Buckland and Turnock, 1992). The tracker platform’s detection function is not estimated, and only the primary platform’s detection function is used.
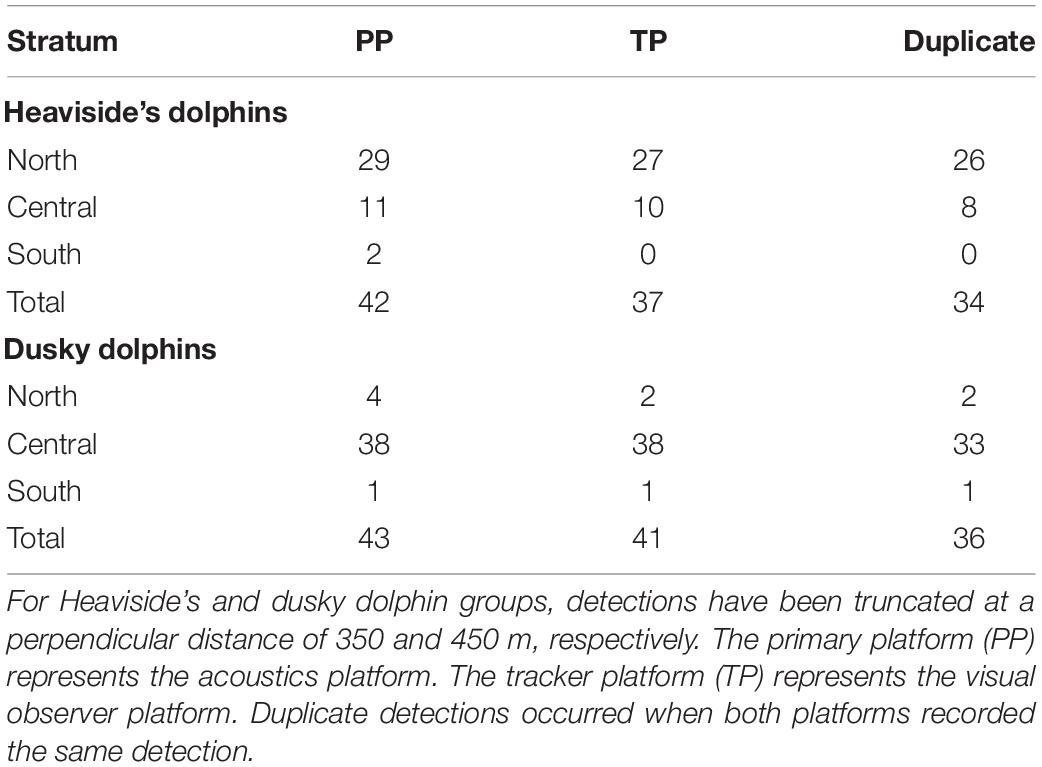
Table 2. Summary of detections of Heaviside’s and dusky dolphin groups by each observer platform when on simultaneous effort.
A logistic regression was fitted to the data to include explanatory variables (perpendicular distance and any other covariates) and provides an estimate of the probability of detection for the primary platform (see Borchers et al., 1998 Eq. 9). When fitting the detection function, we assumed full independence (FI) instead of point independence (PI) because FI does not assume the animals were uniformly distributed (Huggins, 1989; Laake and Borchers, 2004). If responsive movement is believed to be an issue, the FI assumption should be used (Burt et al., 2014).
Perpendicular distance data from the tracker platform were right truncated following the recommendations of Buckland et al. (2001). A MR-FI generalized linear model (GLM) with a logit link function was fitted to the data for each species using DISTANCE 7.1 (Thomas et al., 2010) and R version 3.4.2 (R Core Team, 2013) with the package ‘mrds’ (Laake et al., 2013). Models with more than three parameters were not considered due to the low number of detections, and density and abundance were not calculated at this stage. All candidate detection function models were fitted and the model with the lowest value based on the Akaike information criterion (AIC; Akaike, 1973) was selected per species (Table 3). Diagnostic plots were assessed for model fit using functions within the R package ‘mrds.’ The function plot.trial.fi was used to plot the fitted detection function and histogram of the distances to visually compare the fitted model and data. The function qqplot.ddf was used to construct a quantile-quantile (Q-Q) plot for the fitted model as a graphical check of goodness of fit. Formal goodness of fit testing was evaluated with Kolmogorov-Smirnov and Cramer-von Mises tests. Only one model of the detection function was selected because model averaging is currently not implemented in the ‘mrds’ engine for DISTANCE 7.1 and R. Coefficients of variation (CVs) for the detection function were estimated as the standard error divided by the mean (Buckland et al., 2001). CVs are given as the output from DISTANCE 7.1 for the best fitting MR-FI model by AIC (Table 3).
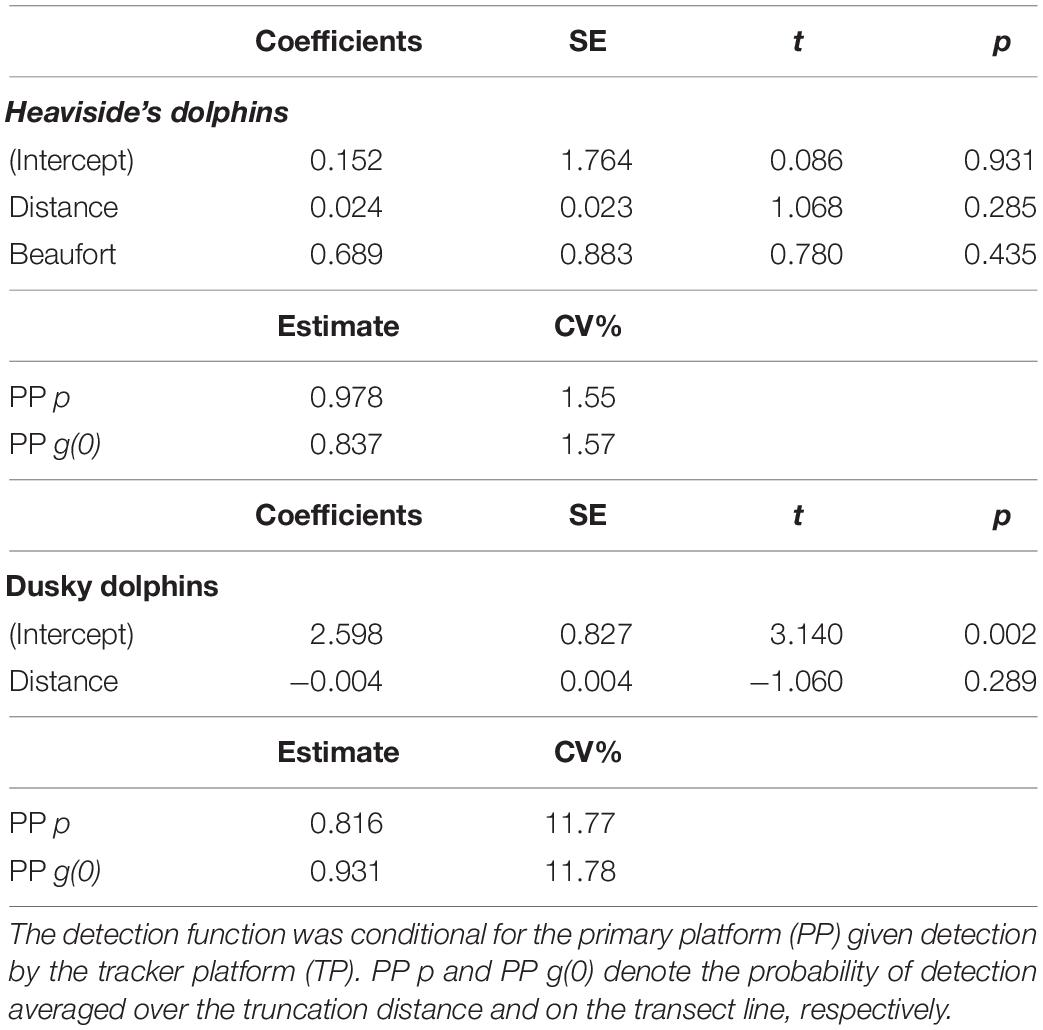
Table 3. The fitted mark-recapture full independence (MR-FI) models of the detection function for Heaviside’s and dusky dolphins, and probabilities of detection obtained from the models.
Mean Group Size
The average group size is used to extrapolate the number of group detections to the number of individuals and to estimate animal density and abundance across the survey area (Buckland et al., 2001). The use of the arithmetic mean group size can result in biased abundance estimates as larger groups are more likely to be detected at greater distances. We tested for evidence of group size bias by fitting a regression of the natural logarithm of group size from visual sightings on the estimated detection probability as a function of distance from the transect line (Buckland et al., 2001). The linear regression was fit using the function lm() in R. Assumptions of the regression were checked in R using diagnostics plots including a plot of the residuals versus predicted values to evaluate linearity and homoscedasticity. Normality was evaluated with a Q-Q plot of the residuals. The mean group size of acoustic detections was assumed to be equal to the mean group size of visual detections.
Estimating Density and Abundance
The line transect equation for estimating density, D, in a defined study area is:
where:
n = number of primary platform detections;
S = mean (expected) group size;
L = total length of transects in the study area;
W = the truncation distance; and
p = the average probability of detecting an animal over 0 – W (i.e., includes estimate of g(0)).
The effective strip half-width, ESW, is estimated by multiplying W and p. Abundance, N, is estimated by multiplying D by the size of the study area, A (Buckland et al., 2001; Laake and Borchers, 2004). Area (km2) was measured for each stratum in QGIS, using the projection WGS 84 UTM Zone 33S, by calculating the area of polygons drawn over each stratum. The sum of the stratum areas was used as the total area for the NIMPA study region.
We estimated density and abundance from simultaneous (combined) platform survey data and acoustic single platform data in the NIMPA region’s northern, central and southern strata. We pooled the primary platform acoustic detections from combined and acoustic single platform effort (Table 4) to produce a single estimate of density and abundance in each stratum (Table 5). We assumed average group size (S), average detection function (p) and transect line detection probability (g) were the same for all strata for each species. The stratum estimators were not independent because they shared these common terms; therefore, the encounter rate variance was estimated empirically based on Innes et al. (2002), using the S2 estimator for non-overlapping systematic parallel survey designs (Fewster et al., 2009). The overall abundance estimate, N, for the NIMPA region was the sum of the estimates of stratum-level abundances (Table 5). The overall density estimate, D, for the NIMPA region was calculated as the total N divided by the total area, A (Table 5). In addition, we investigated how assuming FI vs. PI in the detection function model would alter N per species (Table 6). FI and PI models were compared using identical parameters.
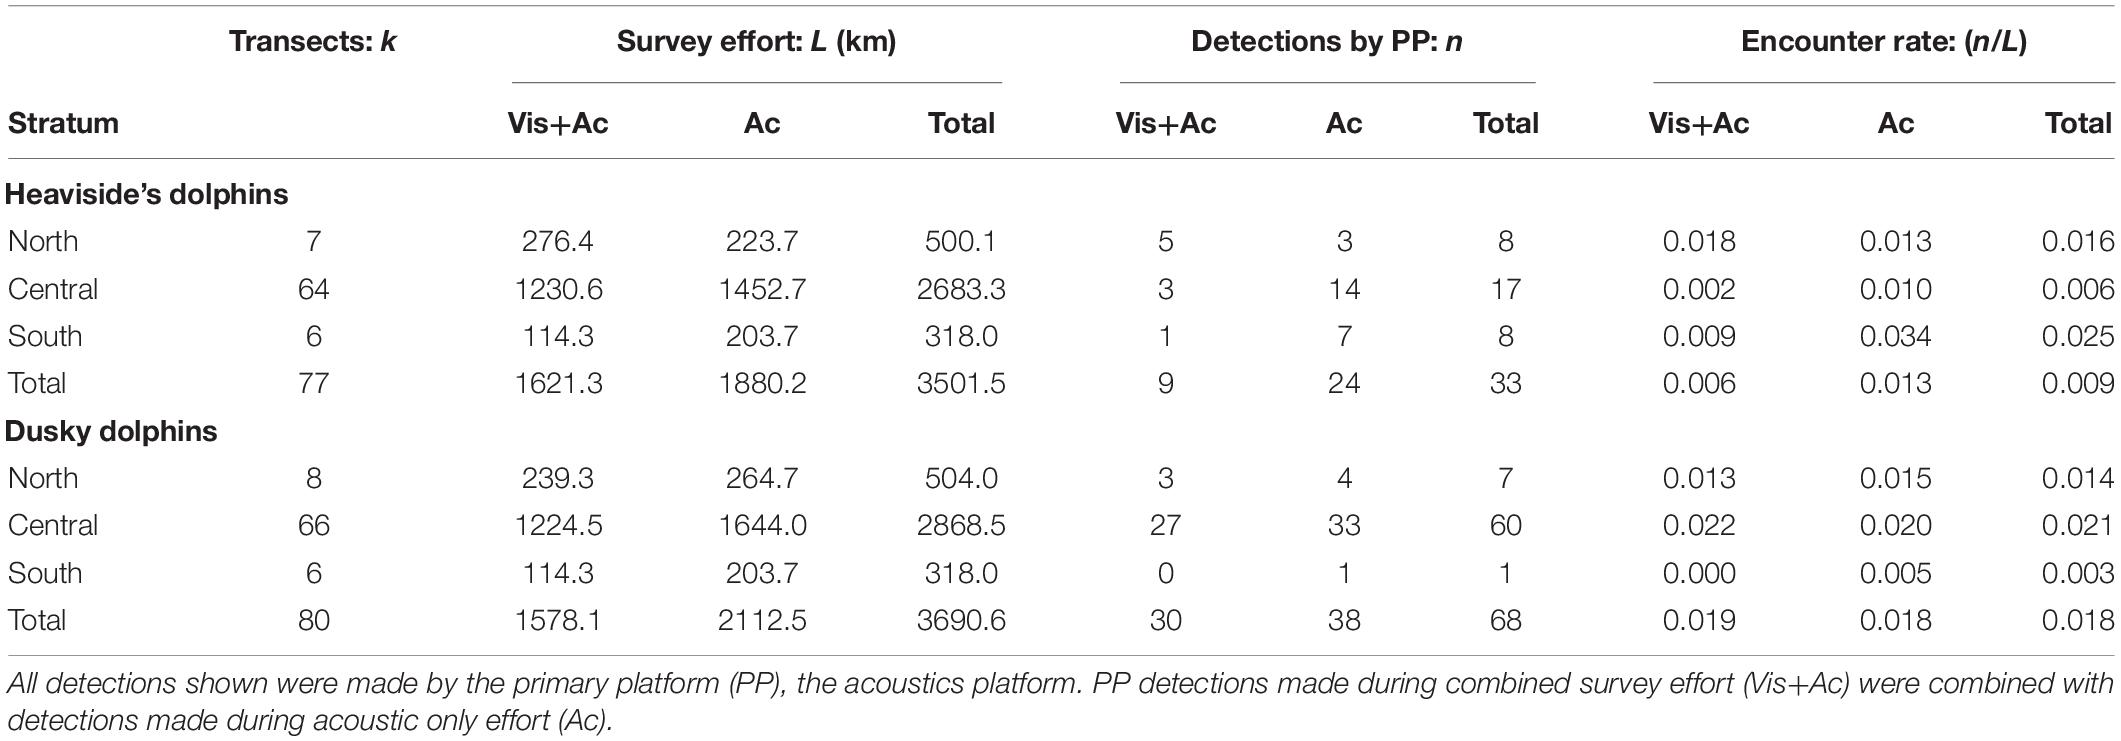
Table 4. Survey effort and detections on systematic transect lines by stratum.
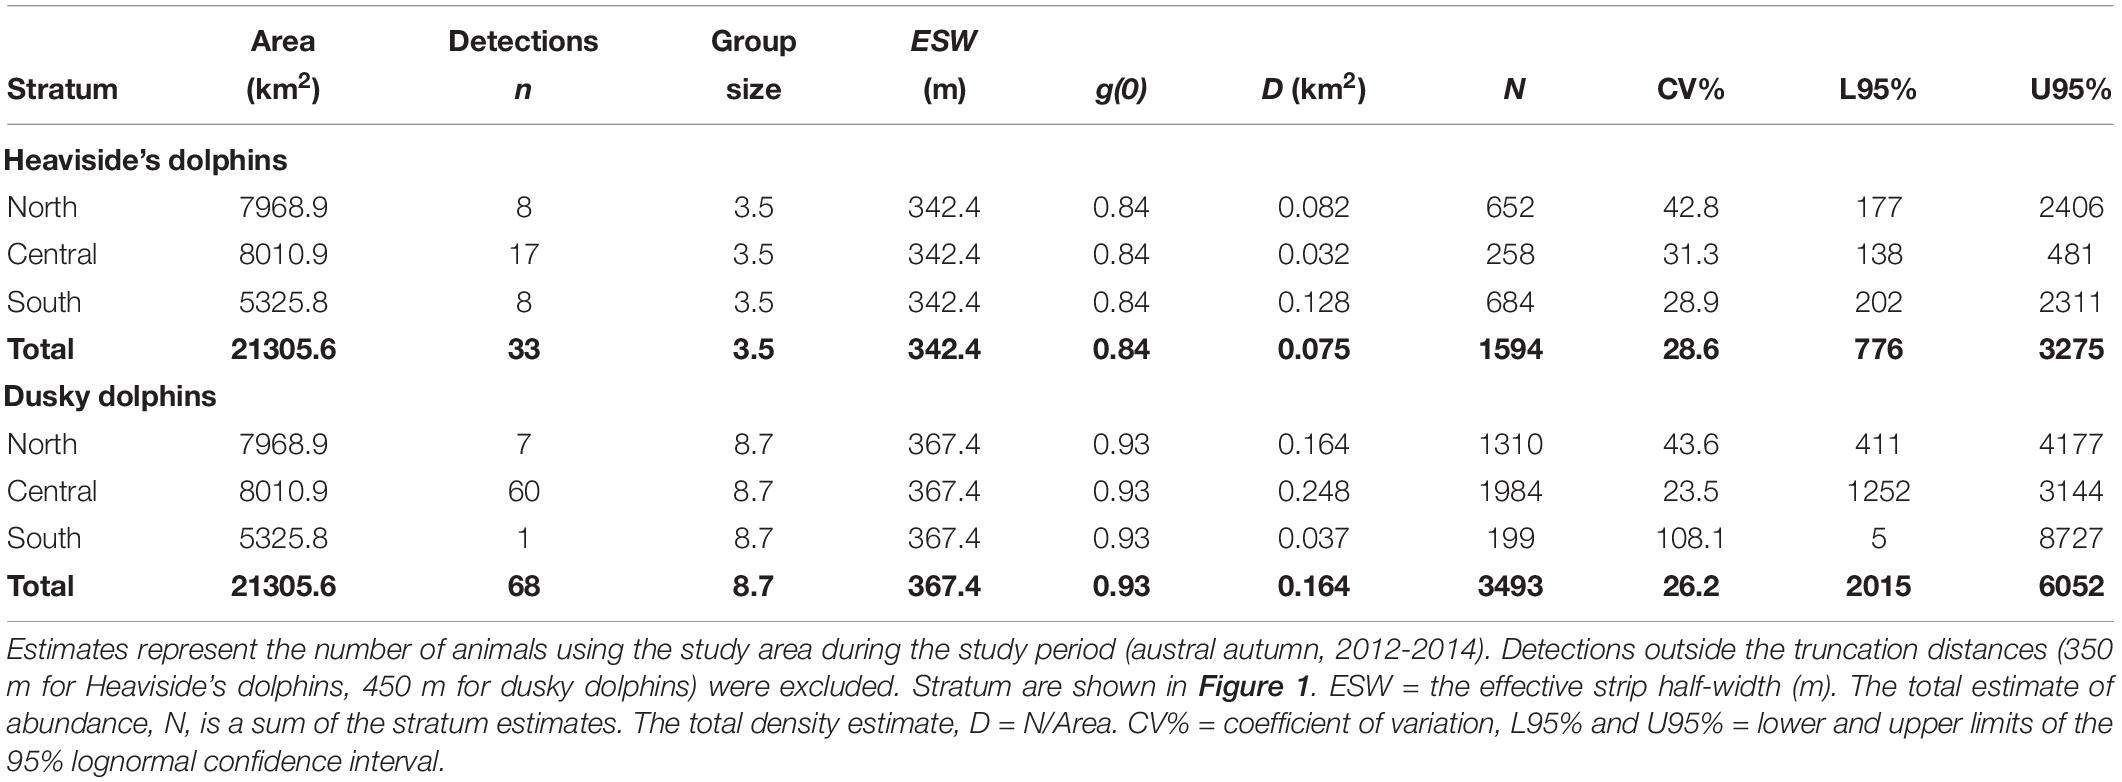
Table 5. Estimates of Heaviside’s and dusky dolphin density and abundance in the study area derived from mark-recapture full independence (MR-FI) models.
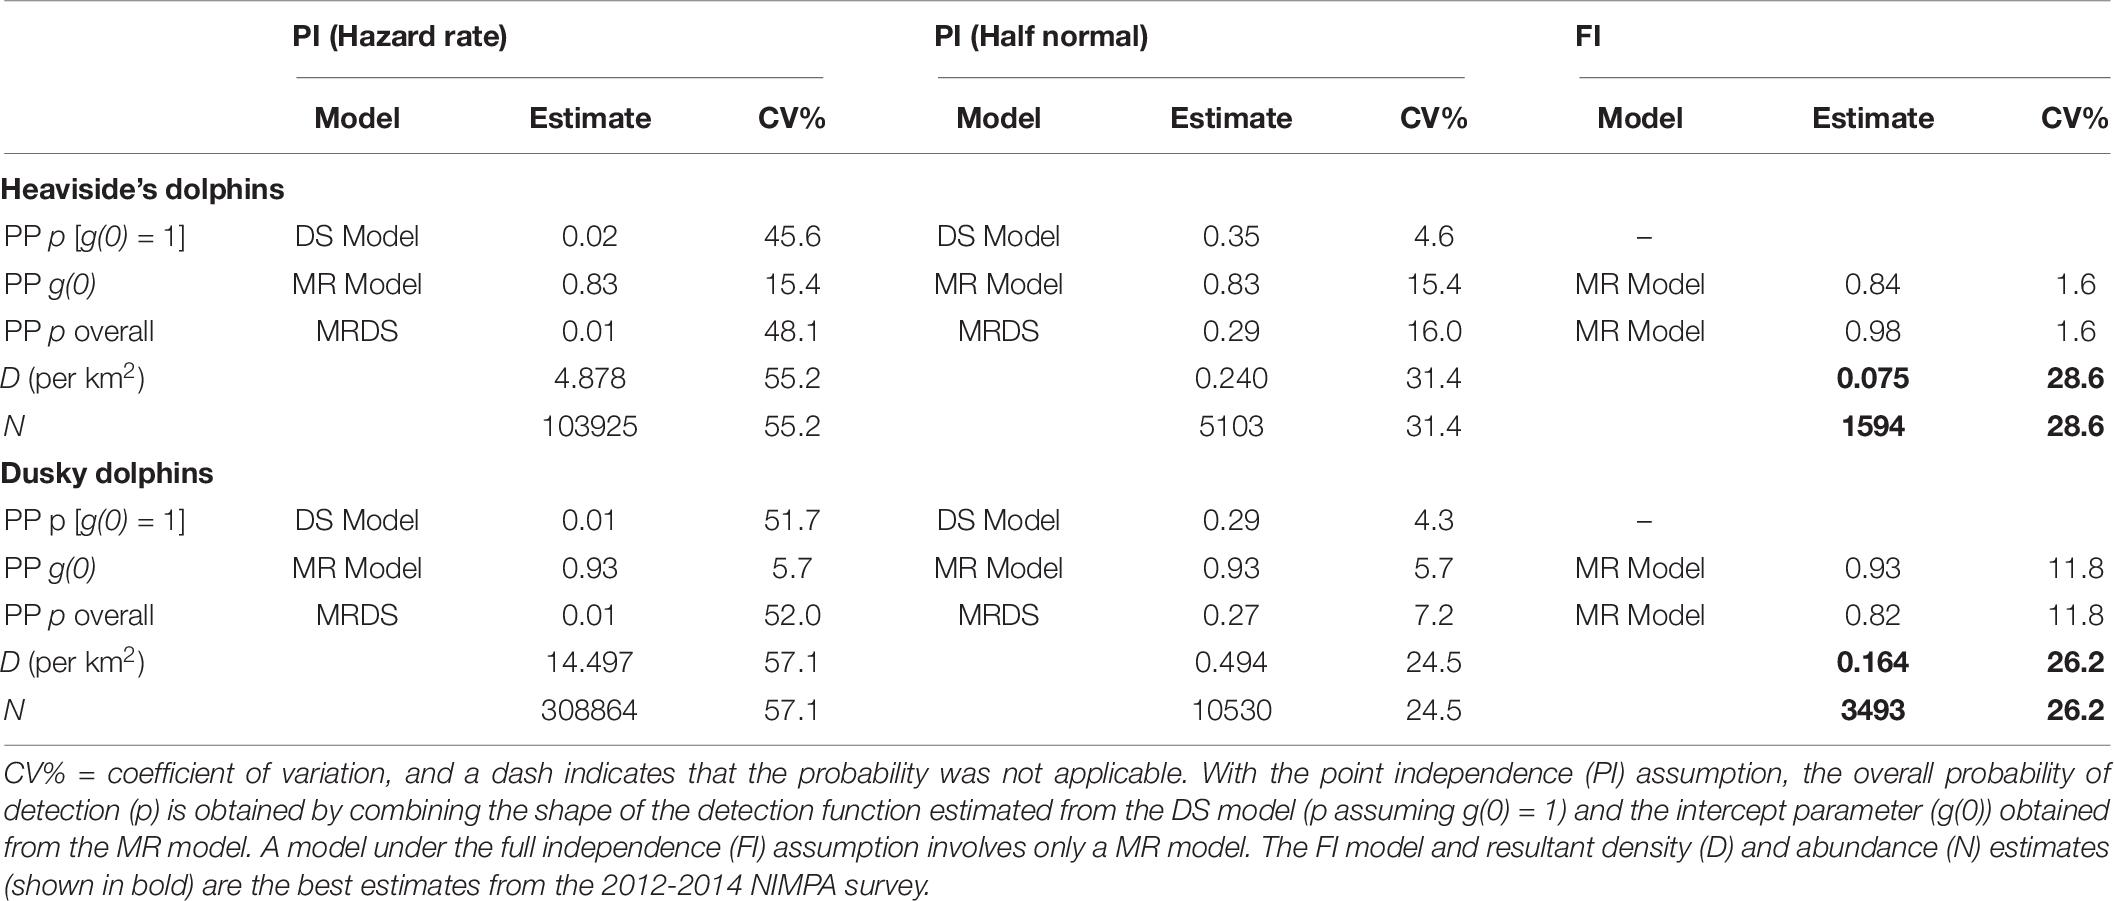
Table 6. Probabilities of detection obtained from the distance sampling (DS) and mark-recapture (MR) models.
Total variances for the stratum-level and overall estimates of abundance were adjusted outside of DISTANCE 7.1 to include the average group size variance using the delta method (Buckland et al., 2001) with the CV and confidence intervals for N estimated using the Satterthwaite degrees of freedom method and assuming a log-normal distribution (Buckland et al., 1993).
Water Depth of Detections
The visual and acoustic detection platforms were compared between species to examine differences between mean water depth at time of detection. The purpose was to examine if our survey detections were consistent with the proposed differences in habitat preference of the two sympatric species (Findlay et al., 1992; De Rock et al., 2019). Acoustic detections were only counted once even if multiple visual detections occurred during a single acoustic event. This was to reduce ambiguity between acoustic detections which occurred on combined effort and acoustic single platform effort. Vessel location at the initial time of detection was used to derive water depth for the area. Depth values were determined in QGIS by sampling from the freely available GEBCO Atlas (20145). Water depth comparisons between groups were conducted using two-sample t-tests. Assumptions of the t-test were checked in Excel using tests for normality (Shapiro-Wilk) and homogeneity of the variances (F-test).
Results
Summary of Survey Effort
Visual and acoustic data were collected over 34 survey days over three years. The most northern and southern single systematic transect lines were never completed due to logistical constraints (Figure 1). Slightly more acoustic survey effort was available for dusky dolphins than Heaviside’s dolphins due to the inclusion of recordings from the mid-frequency array during periods when the high frequency recording system malfunctioned. In total, combined platform and acoustic single platform systematic survey effort covered 3,502 km (1891 nm) for Heaviside’s dolphins and 3,691 km (1993 nm) for dusky dolphins (Table 4). Acoustic single platform effort surveyed a larger area than the combined visual and acoustic effort (Table 4).
Visual survey effort was conducted in BF ≤ 5 and acoustic survey effort in BF ≤ 6. However, both platforms spent little time on effort during BF 5 and 6 (acoustic only). The visual platform spent 4.7% of total search effort during BF 5. The acoustic platform spent 7.1% of total recording effort during BF 5 and 1.4% during BF 6 (Figure 4).
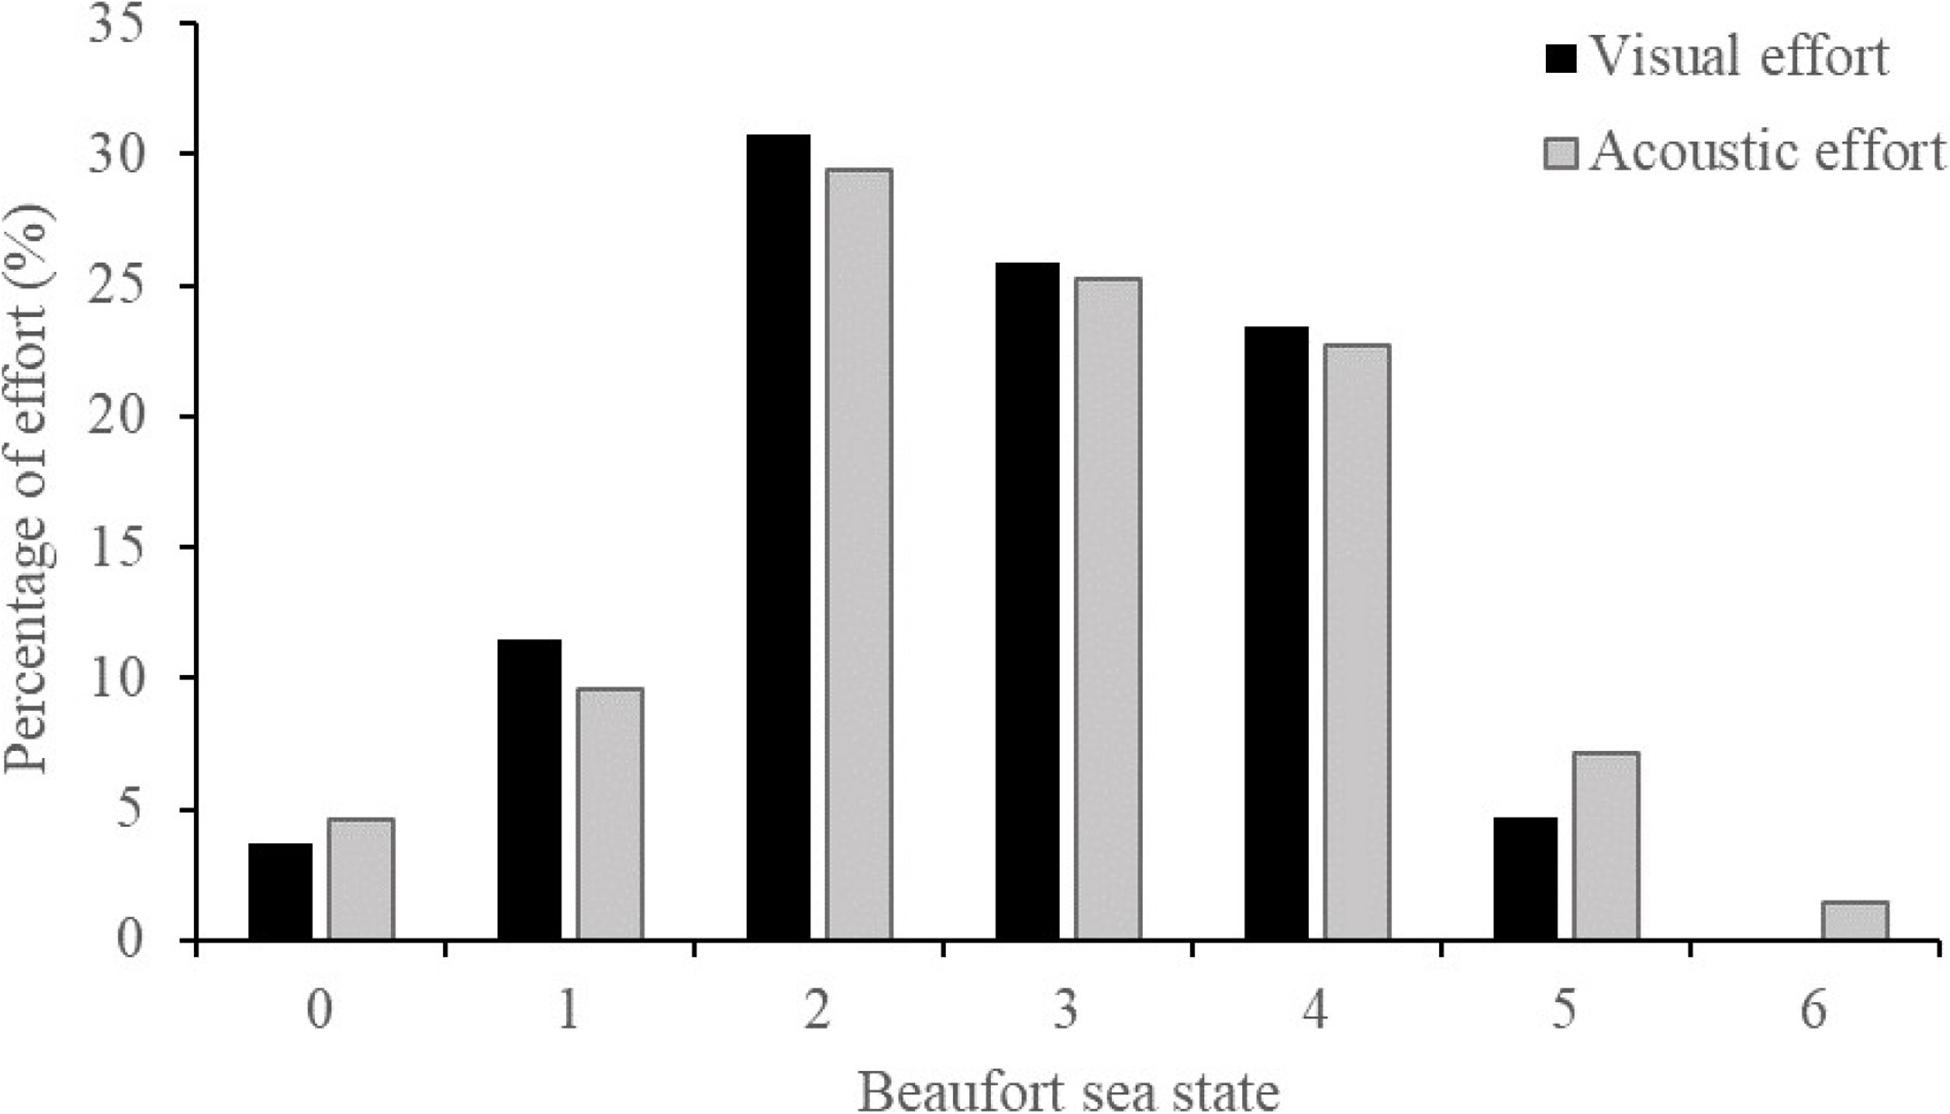
Figure 4. Visual and acoustic platform survey effort as a function of Beaufort sea state.
Estimating the Detection Function
There were 42 Heaviside’s dolphin and 44 dusky dolphin tracker platform (visual observer) sightings available over the three years to fit the detection function. A truncation distance of 350 and 450 m was chosen for Heaviside’s and dusky dolphins, respectively, given the spiked distribution of the data with most tracker sightings close to the transect line (Figures 2, 3). This resulted in removing five observations for Heaviside’s dolphins and three for dusky dolphins comprising 11.9% and 6.8% of detections, respectively. Right truncation of sightings to determine the truncation distance followed the methods of Buckland et al. (2001).
The best fitting detection function for Heaviside’s dolphins included perpendicular distance and BF (Table 3 and Figure 5). Although the model with only perpendicular distance was within 2.0 ΔAIC of the selected model, BF is known to affect detectability, so we chose to retain it in the detection function model. The best fitting detection function model for dusky dolphins included only perpendicular distance (Table 3 and Figure 6).
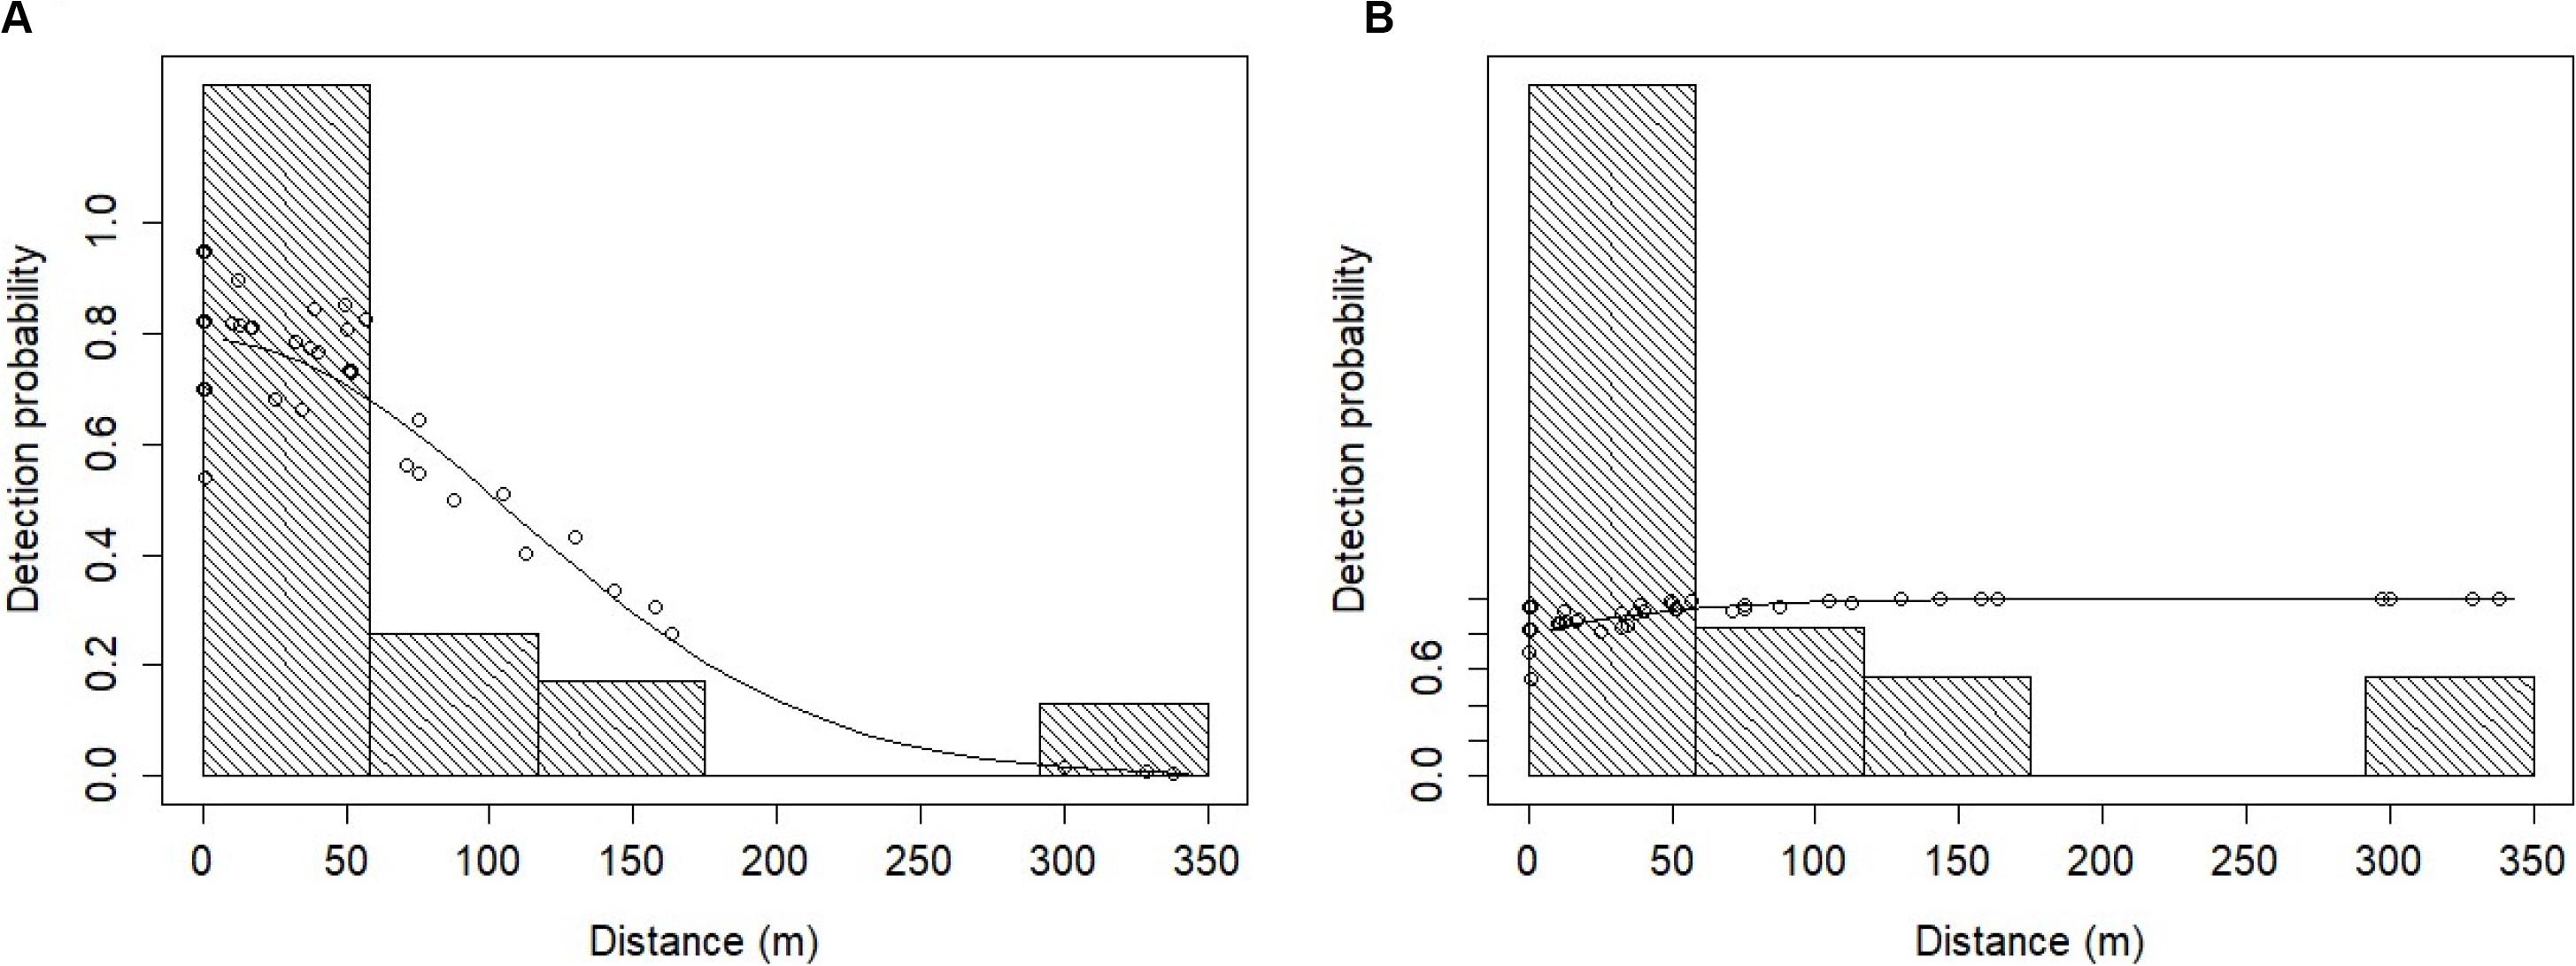
Figure 5. Fitted MRDS and MR models for the Heaviside’s dolphin data under: (A) the point independence (PI) assumption, and (B) the full independence (FI) assumption. The solid line represents the fitted model and the dots represent the detection probabilities for individual primary platform detections. The histogram bars represent the perpendicular distances (m) of Heaviside’s dolphin detections truncated to 350 m. The probability of detection is above 1.0 at perpendicular distances 0 – 50 m.
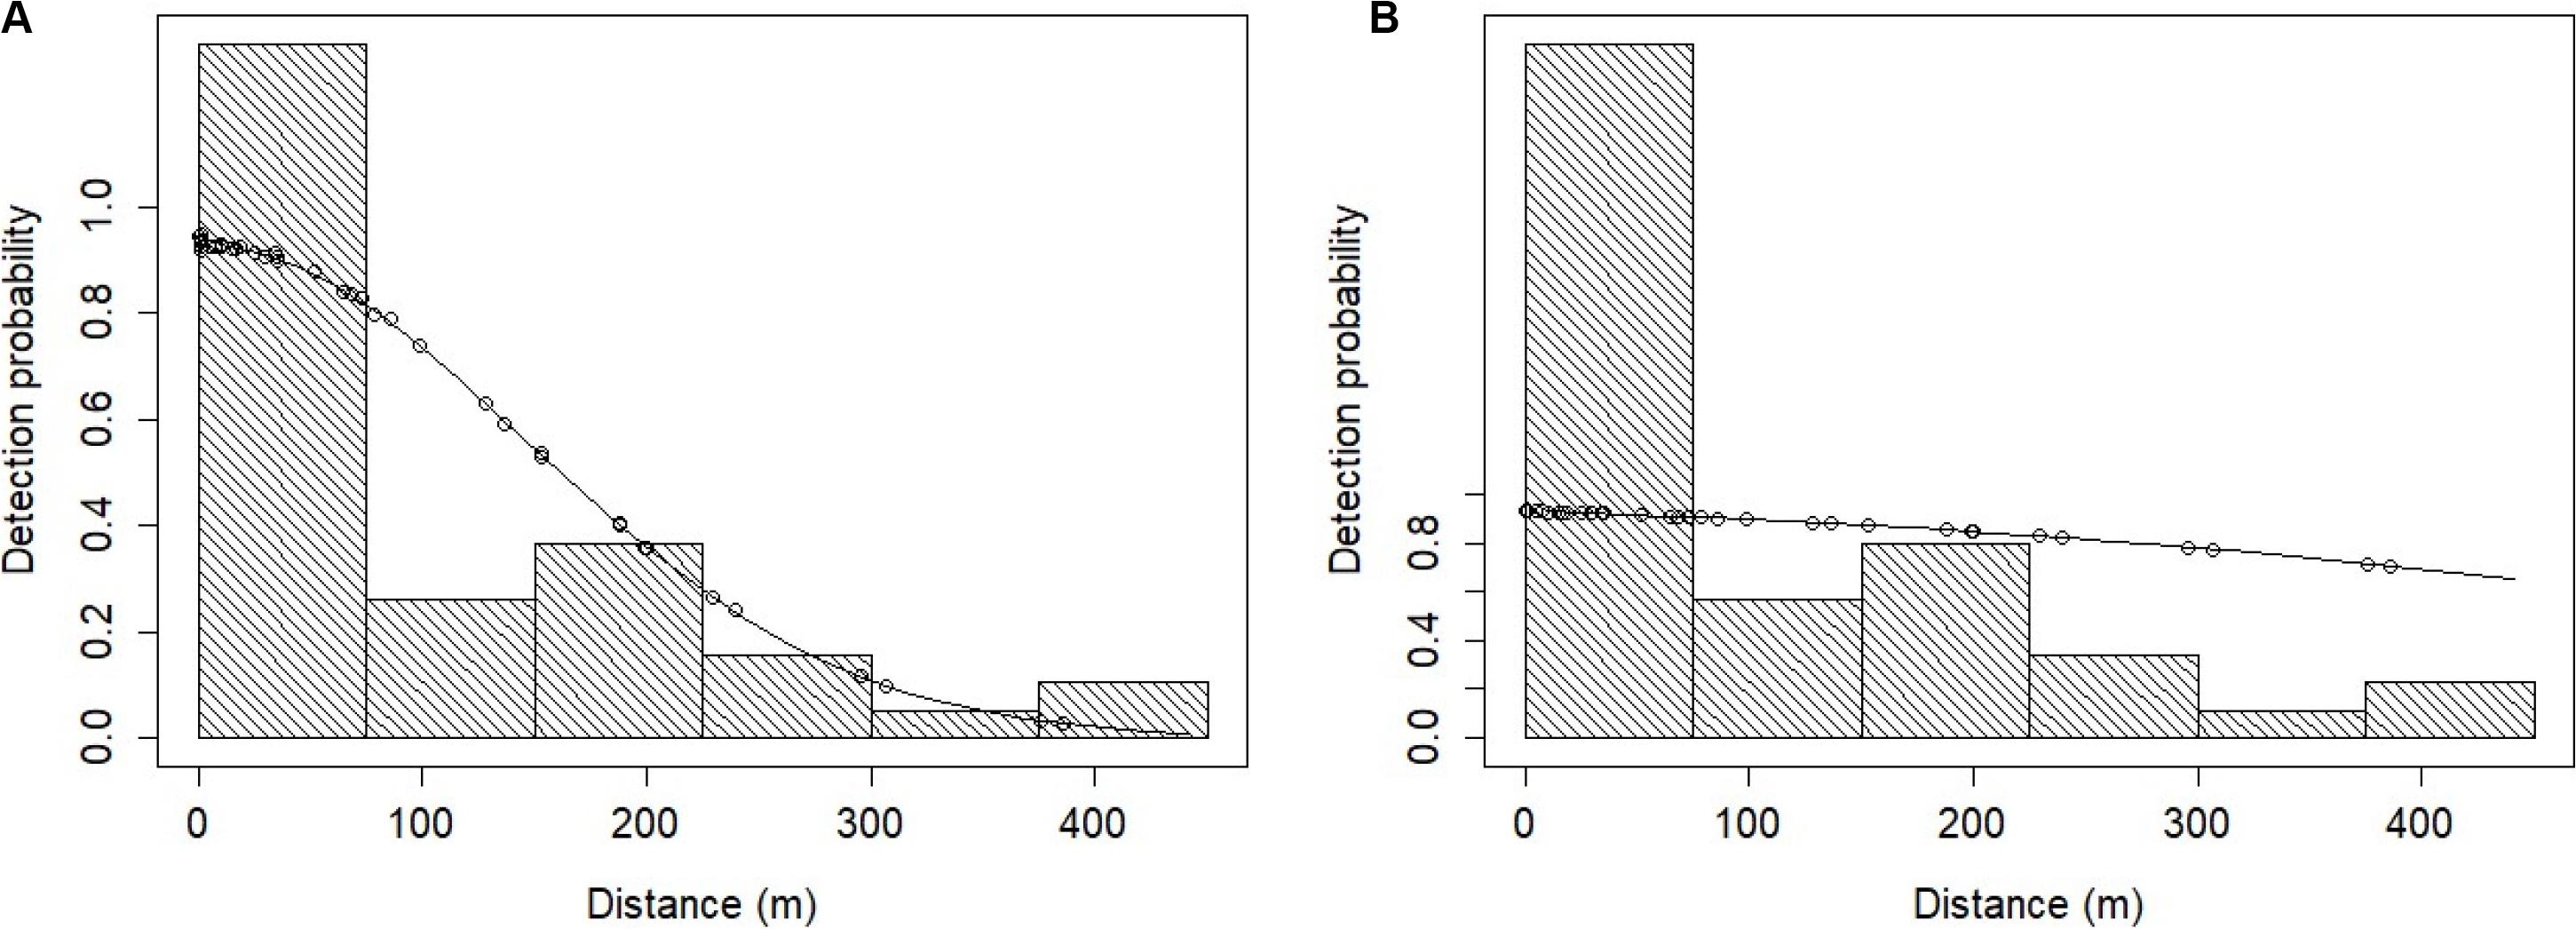
Figure 6. Fitted MRDS and MR models for the dusky dolphin data under: (A) the point independence (PI) assumption, and (B) the full independence (FI) assumption. The solid line represents the fitted model and the dots represent the detection probabilities for individual primary platform detections. The histogram bars represent the perpendicular distances (m) of dusky dolphin detections truncated to 450 m. The probability of detection is above 1.0 at perpendicular distances 0 – 50 m.
BF was selected as an important explanatory variable for the Heaviside’s dolphin detection function. However, the detection function coefficients associated with perpendicular distance and BF are positive values with respect to the intercept (Table 3). Although neither are statistically significant, this result suggests that the sighting probability increases with distance from the vessel and sea state. The opposite effect is expected and a possible explanation for this result is considered in the Discussion section.
Estimating Density and Abundance
During surveys from this study, there were 72 visual sightings of Heaviside’s dolphins made on search effort (Figure 7); however, only nine were paired with acoustic detections and had perpendicular distances < 350 m along systematic transect lines (Table 4). An additional 24 acoustic detections occurred along systematic transect lines during acoustic single platform effort, for a total of 33 detections used to estimate density and abundance (Table 4). Most visual and acoustic detections of Heaviside’s dolphin occurred on non-systematic transect lines and were clustered close to the coastline (Figure 7).
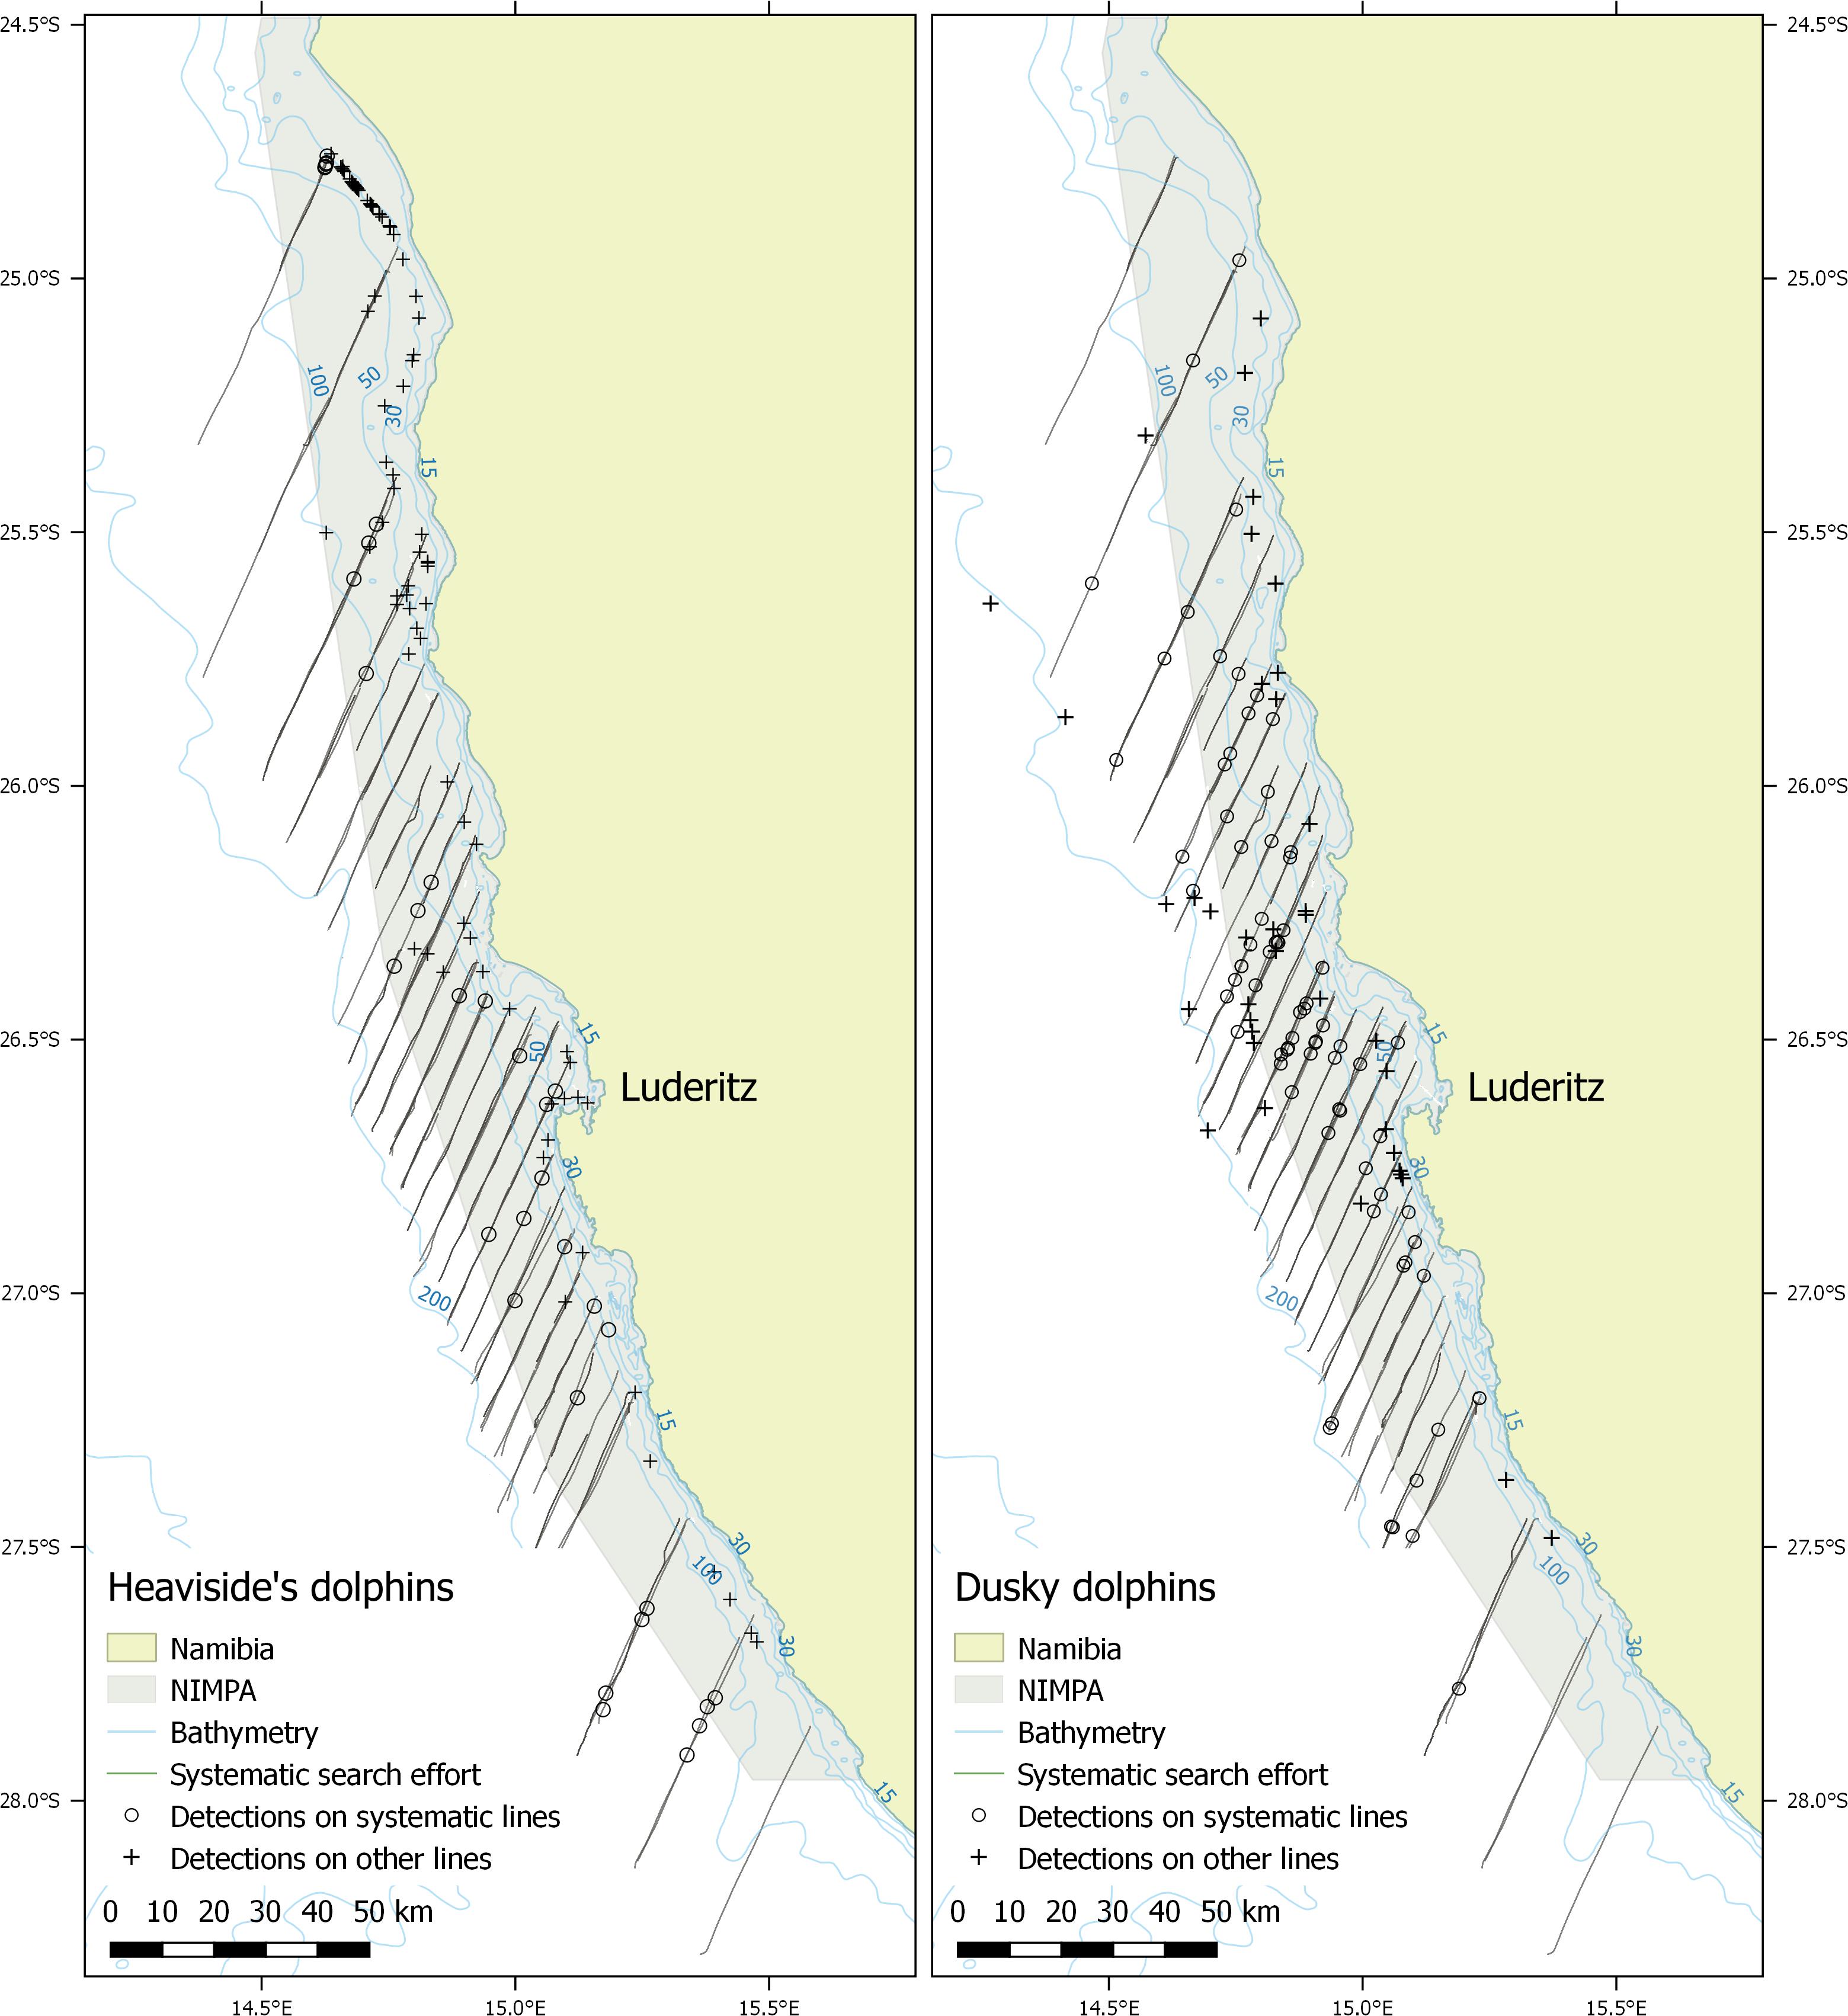
Figure 7. Systematic line transect survey effort by the combined platform and acoustic single platform (dark lines) with Heaviside’s and dusky dolphin systematic detections (circles) used to estimate density and abundance during 2012-2014. Detections made on survey effort but on non-systematic lines are shown as ‘+’ symbols. There is evidence of coastal clustering of Heaviside’s dolphin detections primarily in the northern and central strata. The most northern and southern individual transect lines were not surveyed.
There were 51 visual sightings of dusky dolphins made on search effort (Figure 7), of which 30 were paired with acoustic detections and had perpendicular distances < 450 m along systematic transect lines (Table 4). An additional 38 acoustic detections occurred along systematic transect lines during acoustic single platform effort, for a total of 68 detections used to estimate density and abundance (Table 4). Density and abundance estimates derived from these data are given in Table 5.
Effective Strip Half-Width (ESW)
For Heaviside’s dolphins, the model derived estimate of the primary platform’s ESW was 0.342 km (f(0) = 1/ESW = 2.92 km–1), and the average detection function, p = ESW/W = 0.978 (CV = 1.6%). For dusky dolphins, the model derived estimate of the primary platform’s ESW was 0.367 km (f(0) = 2.72 km–1), and the average detection function, p = ESW/W = 0.816 (CV = 11.8%).
Mean Group Size
Visual observer estimates of group size ranged from 1 to 40 for Heaviside’s dolphins and 2 to 500 for dusky dolphins. There was no significant relationship between group size and the detection probability within the truncation distance for either species (p-values > 0.150). Thus, the arithmetic mean of the observed group sizes for Heaviside’s dolphins ( = 3.5, CV = 23.0%) and dusky dolphins ( = 8.7, CV = 15.7%) was applied as the expected group size for abundance estimation.
Comparing Abundance Estimates Assuming Full Independence (FI) vs. Point Independence (PI)
The overall abundance estimate for Heaviside’s dolphins under the FI assumption was 1,594 (CV = 28.6%) dolphins on average in the NIMPA study region (Table 6). The abundance estimate for Heaviside’s dolphins under the PI assumption using a hazard rate key function was 65.2 times higher than the true estimate assuming FI (Table 6). The abundance estimate under the PI assumption using a half normal key function was 3.2 times higher than the true estimate assuming FI (Table 6). We compare the chosen Heaviside’s dolphin FI model to the PI model fitted with a half normal key function in Figure 5.
The overall abundance estimate for dusky dolphins under the FI assumption was 3,493 (CV = 26.2%) dolphins on average in the NIMPA study region (Table 6). The abundance estimate for dusky dolphins under the PI assumption using a hazard rate key function was 88.4 times higher than the true estimate assuming FI (Table 6). The abundance estimate under the PI assumption using a half normal key function was 3.0 times higher than the true estimate assuming FI (Table 6). We compare the chosen dusky dolphin FI model to the PI model fitted with a half normal key function in Figure 6.
Water Depth of Detections
The water depth (m) at time of detection was significantly deeper for visual sightings of dusky dolphins ( = 106.3 ± SD 49.9) than Heaviside’s dolphins ( = 35.2 ± 23.5) (t-test two-sample assuming unequal variances: t(66) = −9.35, p < 0.001). In addition, water depth was significantly deeper for acoustic detections of dusky dolphins ( = 119.4 ± SD 47.2) than Heaviside’s dolphins ( = 72.7 ± SD 41.3) (t-test two-sample assuming equal variances: t(177) = −6.98, p < 0.001). The difference in water depth between the visual and acoustic platforms for Heaviside’s dolphin detections was primarily due to the minimum ocean depth requirement of 30 m to use the hydrophone array. The deepest water depths associated with dolphin detections occurred in the central stratum in 158 and 216 m for Heaviside’s and dusky dolphins, respectively.
Discussion
This is the first study to generate density and abundance estimates for Heaviside’s and dusky dolphins within Namibia, which incorporates the novel approach of using acoustic line transect methodology for this region. Estimates represent the average number of animals using the study area during the study period (austral autumn, 2012-2014). The resulting density and abundance estimates for both species using the MR-FI model are realistic for the study region, based on mark-recapture photo-ID estimates of Heaviside’s dolphins over smaller study areas (Elwen and Gopal, 2018) and aerial line transect surveys to estimate density of Patagonian dusky dolphins (Degrati et al., 2020). Furthermore, the variances of both species (Heaviside’s dolphin = 28.6%, dusky dolphin = 26.2%) are comparable to many other small cetacean line transect surveys (e.g., Dawson et al., 2000; Williams and Thomas, 2007; Hammond et al., 2013; CV range 20% – 42%). Perrin (1999) suggested that abundance estimates on the right order of magnitude, even with high variance, would represent a useful starting point for informing conservation strategies of understudied species. This is particularly true for coastal small cetacean species such as Heaviside’s and dusky dolphins. These data are not only invaluable as the first baseline abundance estimates for Namibia’s only MPA, but also serve as a model for the remaining Benguela ecosystem. The estimates generated here will be valuable to conservation efforts in Namibia such as updating their regional IUCN Red List status from ‘Data Deficient’ to a more useful category. However, these results represent only a first step and an ongoing assessment of their population status and trends is recommended.
From a conservation point of view, our findings for Heaviside’s dolphins indicate a relatively small population, with a patchy distribution along the coastline. This form of patchy distribution appears to be characteristic of the Cephalorhynchus genus (Dawson et al., 2004; Elwen et al., 2009; Heinrich et al., 2010). A recent genetic study of Heaviside’s dolphins using a large sample size from seven geographic regions ranging from Walvis Bay, Namibia, to Cape Town, South Africa; revealed clear population structure across the studied area (Gopal et al., 2019). In addition, genetic studies have shown clear population differences across spatial scales between groups of: Chilean dolphins (C. eutropia) off Chile (Pérez-Alvarez et al., 2015), Hector’s dolphins (C. hectori) off New Zealand (Hamner et al., 2012) and Commerson’s dolphins (C. commersonii) off Argentina (Cipriano et al., 2011), suggesting genetic population structure is influenced by the patchy distributions characteristic of the Cephalorhynchus genus. The combination of genetic population information (Gopal et al., 2019) and information from this study could serve to identify potentially important Heaviside’s dolphin areas to be included in local marine spatial planning and conservation zoning initiatives (e.g., Vila et al., 2016).
Heaviside’s dolphins are facing increasing anthropogenic impacts in both the coastal and shelf regions of their habitat as both Namibian ports (Walvis Bay and Lüderitz) are undergoing or planning major expansion, and there is continued exploration and mining for hydrocarbons, diamonds and marine phosphates at sea. The strong site fidelity of Heaviside’s dolphins (Elwen et al., 2006; Davis et al., 2014) makes them more vulnerable to localized impacts compared to a more widely ranging species like dusky dolphins, and this needs to be considered for effective population management (Heinrich et al., 2019). Studies of satellite tagged Heaviside’s dolphins off South Africa show that the home ranges of individuals lie adjacent to the coast, with maximum recorded offshore distances up to 33 km (Elwen et al., 2006; Davis et al., 2014). A study of Heaviside’s dolphin habitat use patterns in the nearshore environment of Lüderitz Bay used static acoustic data loggers (C-PODs6) and showed a diurnal pattern of a movement offshore at night as observed in South Africa (Elwen et al., 2006; Davis et al., 2014), but also showed a continuous nearshore presence of dolphins at some high-density sites (notably Diaz Point, Lüderitz; Golaski, 2016). This suggests a more variable foraging strategy than observed in the above South African studies. Our combined findings emphasize the importance of nearshore habitat for this species.
Data from our survey also supports the proposed gap in dusky dolphin distribution around the border between South Africa and Namibia (Findlay et al., 1992), with very few detections of dusky dolphins in the southern NIMPA in contrast to a continued presence of Heaviside’s dolphins throughout the NIMPA (Figure 7). However, survey effort was lower in this region compared to the central strata, which also could be a factor in the low number of detections in the area. Improved knowledge of the dusky dolphin population structure to determine if northern and southern Benguela populations are distinct would be informative for the species conservation management. If subpopulations are found to exist, the abundance estimates from this study will be highly useful in the regional assessment for the dusky dolphin population.
This study confirmed the use of different average water depths by the two species supporting earlier observations that dusky dolphins range further from shore and deeper than Heaviside’s dolphins (Findlay et al., 1992; Best, 2007; Elwen et al., 2010). De Rock et al.’s (2019) recent study of habitat suitability for cetaceans in Namibian waters using presence only data showed that most sightings of Heaviside’s dolphins (n = 1600) were observed in water less than 125 m deep, and ‘distance from shore’ (which correlates strongly to water depth) was the most important predictor of habitat suitability in all seasons. Dusky dolphin year-round habitat suitability was primarily influenced by water depth; however, during autumn, sea surface temperature (∼14°C) was the most important predictor (De Rock et al., 2019). This supports the predicted water temperature preference for a suitable habitat for dusky dolphins and corroborates the concern of rising SST for this species (Macleod, 2009). Combined, these findings provide insight into how these sympatric species may use different depth gradients to avoid competition for resources within the coastal environment of the Benguela Current ecosystem (Elwen et al., 2010; Heinrich et al., 2010). A similar pattern in habitat partitioning has been reported off Chile between Chilean and Peale’s dolphins (Lagenorhynchus australis), another sympatric Cephalorhynchus and Lagenorhynchus combination (Heinrich et al., 2010, 2019).
Although this study was subject to certain logistical pitfalls during data collection and unavoidable issues with responsive movement, care was taken to follow the strict methods required to model these data as precisely as possible. Here, we address potential biases and provide recommendations for future studies. One recommendation is that error may be introduced and rounding issues may occur through a lack of precision from estimating distance by eye. In this study, binoculars with reticles or similar horizon-based distance estimation methods were not implemented as the ship rolled excessively at times, especially on inshore line segments. Although a potential source of error, radial distance estimation by eye was deemed the most effective for this situation; however, future surveys should consider the use of stationary ‘big-eye’ binoculars to alleviate this issue. Another recommendation is that care should be taken to record the time dolphin groups spend bow riding until they have passed abeam, such that the distance window by Richman et al. (2014) can be applied for a more stringent analysis of duplicate detections between the visual and acoustic platforms. Attractive responsive movement to vessels has been reported in multiple additional species from both the Cephalorhynchus and Lagenorhynchus genera (Dawson et al., 2000; Iñíguez and Tossenberger, 2007; Williams and Thomas, 2007). Future vessel-derived abundance assessments of species included in these genera should account for the necessity to properly assess the impact of responsive movement.
In addition, small sample sizes used to fit the detection function can result in biased estimates if underlying biases within the data cannot be identified and simpler than necessary models must be fit (Williams and Thomas, 2009). A useful indicator of unmodelled heterogeneity in detections is a discrepancy between the shape of the MR-FI model and the MRDS-PI model. For Heaviside’s and dusky dolphins, there is a difference between these model shapes (Figures 5, 6). The lack of fit evident in the MR-FI models (Figures 5, 6) may be due to violation of the FI assumption, inferring that dolphins had begun to respond to the vessel before the tracker platform recorded the sightings information (Cañadas et al., 2004; Laake and Borchers, 2004). It is possible the FI assumption was violated because vessel noise alerted dolphins to its presence at distances beyond those in which the tracker platform first detected the group. However, after FI has been applied, it is impossible to determine if the effect was caused by responsive movement or combined with unmodelled heterogeneity. Nevertheless, Burt et al. (2014) recommend the FI assumption should be used if responsive movement is anticipated to be the main issue. It was apparent this was a major problem for both species; therefore, the MR-FI model was selected to estimate density and abundance for both species (Table 6).
Detectability bias can occur due to increasing Beaufort sea state which decreases detectability of surfacing cetaceans, particularly for ‘cryptic’ species such as Heaviside’s dolphins which have a small body size and small average group sizes. Sighting rates during higher sea states are likely to be biased downward by missed groups. To obtain precise abundance estimates, surveys conducted in sea states above BF 2 should account for this bias (e.g., Barlow, 2015). We were unable to exclude effort and sightings made in higher sea states as the sample size of available detections was already small. Sea states are generally high in the NIMPA region due to the persistent winds driving the Lüderitz upwelling cell and surveys were conducted during the time of year when wind is typically weakest (austral autumn; Peard, 2007). However, estimates from surveys where responsive movement is toward the survey vessel are typically biased upwards if not accounted for due to additional animals entering the vessel’s strip width. Although we attempted to account for both issues analytically, these two biases act in opposite directions, and to some extent may balance each other.
For Heaviside’s dolphins, the positive coefficient for BF in the detection function model (Table 3), may suggest responsive movement has surpassed the effect of reduced detectability in higher sea states. However, sample size was likely insufficient to statistically detect this possible relationship. Further, BF was not selected as an important covariate when modeling the detection function for dusky dolphins. Again, this may be related to sample size, or possibly related to the larger average group sizes of dusky dolphins ( = 8.7 ± SD 9.3) compared to Heaviside’s dolphins ( = 3.5 ± SD 6.3) coupled with attractive responsive movement (78.4% and 66.7% of visual sightings, respectively; Table 1), resulting in easier detection across the surveyed sea states. Regardless, it appears that at least for Heaviside’s dolphins, our detection function could be improved with further research.
The effect of sea state on detectability from a PAM platform is a less well studied subject which varies by species and area (Verfuss et al., 2018). Implementing PAM has shown promise for reducing bias in detectability and monitoring in higher sea states and swell (see Mellinger et al., 2007 for a review, Rankin et al., 2020). However, there are complications related to PAM towed array methods such that detectability is highly dependent upon species, physical characteristics of the region and background noise. Higher sea state conditions increase ambient noise which can reduce the detection range for certain species, and towed arrays are at a disadvantage for detecting directly ahead of the ship due to propeller cavitation and acoustic shadowing from the ship (Rankin et al., 2008). In this study, the acoustic platform slightly augmented the visual platform in detections when on combined effort for both species. Gridley et al. (in press) investigated variability in the group encounter rate of Heaviside’s dolphins per survey platform as a function of sea state. There was a substantial increase in the visual platform’s encounter rate during BF 1-2 compared to BF 3-5; however, acoustic encounter rates were much less variable across sea states (Gridley et al., in press). In this study, only acoustic detections were used to estimate abundance, either from combined platform effort or acoustic single platform effort. This may have assisted in reducing the detectability bias introduced by including detections made in higher sea states.
Most Heaviside’s dolphin detections occurred on non-systematic transect lines located along the coastline (Figure 7). While the systematic parallel line survey design was appropriate for our study area, it resulted in a low sample size used to estimate Heaviside’s dolphin abundance for the NIMPA region. Our data match reports of Hector’s dolphin distributions with coastal, patchy clusters of sightings observed during line transect surveys (Dawson and Slooten, 1988; Dawson et al., 2004). Dawson et al. (2008) suggest ideas for line transect surveys designed for coastal cetacean species and advise that aerial surveys are useful due to time efficiency, no responsive movement, and lower sensitivity to issues with swell and detectability. The ability to cover a large area in a short time with a small crew may provide a less expensive alternative to vessel-based surveys (Dawson et al., 2008); however, this is a potentially dangerous method and logistically difficult to implement in regions like Namibia which have few airfields separated by long distances. Future survey effort should focus on key areas such as along the coast of the central and northern NIMPA stratum to provide repeatable assessments of high-density areas. Consideration should be given to implementing a newer method of acoustic monitoring that uses bottom-moored recording devices which can provide data on relative abundance and population trends over time (e.g., Leeney et al., 2011; Castellote et al., 2012; Golaski, 2016; Jaramillo-Legorreta et al., 2017). Although logistically difficult and expensive to achieve large spatial coverage, bottom-moored recording devices can provide high temporal resolution sampling in key locations. This has the potential to be more cost effective for monitoring cetaceans, and less dangerous than aerial surveys.
Despite the limitations of this study, our results suggest that passive acoustic detection can be implemented as an independent platform in mark-recapture distance sampling to estimate the probability of detection for vessel-based cetacean line transect surveys. The acoustic and visual double platform approach may greatly improve the precision of abundance estimates, including species that exhibit attractive responsive movement. Further research is needed to address potential sources of unmodeled heterogeneity in our data, including identifying covariates to better model acoustic detections. This study has generated novel information on coastal habitats, density and abundance estimates for Heaviside’s and dusky dolphins within one of the largest Marine Protected Areas around southern Africa. This information is highly relevant for coastal and marine spatial planning off Namibia, providing a reliable baseline from which future changes can be assessed and contributing to updates of national and global conservation assessments such as the IUCN Red list.
Data Availability Statement
The data and code supporting the conclusions of this manuscript will be made available by the authors, without undue reservation, to any qualified researcher.
Ethics Statement
The animal study was reviewed and approved by University of Pretoria’s Animal Use and Care Committee (Reference: ec061-09 AUCC).
Author Contributions
SE, TG, and J-PR contributed to the conception, design and data collection of the study. SE, TG, and MM organized the database. MM performed the statistical analysis and wrote the first draft of the manuscript. All authors contributed to manuscript revision, read and approved the submitted version.
Funding
The Namibian Ministry of Fisheries and Marine Resources (MFMR) division in Lüderitz provided the means to survey the NIMPA during 2012-2014. Surveys of the NIMPA were supported through funding from the Nedbank Go Green Fund to SE, J-PR, and TG (2011-2014), the Rufford Small Grants Foundation to SE and TG (2012) and a SCOR Visiting Scholar Fund to Dr. Rene Swift, SE and TG. Survey data were analyzed as part of MJM’s doctoral degree which was funded through a Fulbright U.S. Research Fellowship, a National Geographic Society Explorers Grant in conjunction with the Waitt Foundation (#38115) and a bursary from the University of Pretoria’s Zoology Department. The University of Pretoria also provided a travel grant for MJM to attend an intermediate distance sampling workshop at the University of St. Andrews, Scotland, to assist with the survey analysis. Support was also provided by Stellenbosch University.
Conflict of Interest
The authors declare that the research was conducted in the absence of any commercial or financial relationships that could be construed as a potential conflict of interest.
Acknowledgments
We thank the Namibian Government’s Ministry of Fisheries and Marine Resources division in Lüderitz for allowing this survey to be conducted. Thank you to Kolette Grobler, Captain Sacky Jason, the crew of the RV !Anichab, Heiko Metzger, Dr. Ricardo Antunes, Dr. Rene Swift, Jeff Slater and Dr. Jamie McCauley. We thank the Namibian Dolphin Project volunteers and visual observers who contributed to data collection during the survey: Bridget James, Sara Golaski, Shannon Hampton, Hannah Kriesell, Edith Mertz, Victor Mukena, Lindsey Nielsen, Titus Shaanika, Xela Indurkhya and Luis Goncalves. We also thank the leaders of the Intermediate Distance Sampling Course through CREEM at the University of St. Andrews, as well as Daniel Pike, Dr. Dave Miller, Dr. Eric Rexstad and Dr. Jeff Laake for their analysis expertise.
Footnotes
- ^ www.ifaw.org
- ^ www.ni.com
- ^ www.rme-audio.de
- ^ www.pamguard.org
- ^ www.gebco.net
- ^ www.chelonia.co.uk
References
Akaike, H. (1973). “Information theory and an extension of the maximum likelihood principle,” in Second International Symposium on Information Theory, eds B. N. Petrov and F. Csaki (Budapest: Akademiai Kiado), 267–281.
Alfaro-Shigueto, J., Crespo, E. A., Elwen, S., Lundquist, D., and Mangel, J. (2019). Lagenorhynchus Obscurus. The IUCN Red List of Threatened Species 2019. e.T11146A50362028. Available online at: https://dx.doi.org/10.2305/IUCN.UK.2019-1.RLTS.T11146A160698904.en (accessed April 27, 2020).
Au, W. W. L., Lammers, M. O., and Yin, S. (2010). “Acoustics of dusky dolphins,” in The Dusky Dolphin: Master Acrobat of Different Shores, eds B. Würsig and M. Würsig (London: Academic Press).
Au, W. W. L., and Würsig, B. (2004). Echolocation signals of dusky dolphins (Lagenorhynchus obscurus) in Kaikoura, New Zealand. J. Acoust. Soc. Am. 115, 2307–2313. doi: 10.1121/1.1690082
Bakun, A. (1996). Patterns in the Ocean: Ocean Processes and Marine Population Dynamics. La Paz: Centro de Investigaciones Biologicas del Noroeste.
Barlow, J. (2015). Inferring trackline detection probabilities, g(0), for cetaceans from apparent densities in different survey conditions. Mar. Mamm. Sci. 31, 923–943. doi: 10.1111/mms.12205
Barlow, J., and Taylor, B. (2005). Estimates of sperm whale abundance in the northeastern temperate pacific from a combined acoustic and visual survey. Mar. Mamm. Sci. 21, 429–445. doi: 10.1111/j.1748-7692.2005.tb01242.x
Best, P. B. (2007). Whales and Dolphins of the Southern African Subregion. Cambridge: Cambridge University Press.
Best, P. B., and Meÿer, M. A. (2010). “Neglected but not forgotten – Southern Africa’s Dusky Dolphins,” in Dusky dolphins: Master Acrobats off Different Shores, eds B. Würsig and M. Würsig (San Diego, CA: Academic Press), 291–312. doi: 10.1016/b978-0-12-373723-6.00014-x
Borchers, D. L., Buckland, S. T., Goedhart, P. W., Clarke, E. D., and Hedley, S. L. (1998). Horvitz-Thompson estimators for double-platform line transect surveys. Biometrics 54, 1221–1237. doi: 10.2307/2533652
Brownell, R. L. Jr., and Cipriano, F. (1999). “Dusky dolphin Lagenorhynchus obscurus (Gray, 1828),” in Handbook of Marine Mammals: The Second Book of Dolphins and the Porpoises, Vol. 6, eds S. H. Ridgway and R. Harrison (San Diego, CA: Academic Press), 85–104.
Buckland, S., Anderson, D., Burnham, K., and Laake, J. (1993). Distance Sampling: Estimating Abundance of Biological Populations. Berlin: Springer.
Buckland, S. T., Anderson, D. R., Burnham, K. P., Laake, J. L., Borchers, D. L., and Thomas, L. (2001). Introduction to Distance Sampling: Estimating Abundance of Biological Populations. Oxford: Oxford University Press.
Buckland, S. T., Anderson, D. R., Burnham, K. P., Laake, J. L., Borchers, D. L., and Thomas, L. (2004). Advanced Distance Sampling. Oxford: Oxford University Press.
Buckland, S. T., Rexstad, E. A., Marques, T. A., and Oedekoven, C. S. (2015). Distance Sampling: Methods and Applications. Berlin: Springer. doi: 10.1007/978-3-319-19219-2
Buckland, S. T., and Turnock, B. J. (1992). A robust line transect method. Biometrics 48, 901–909. doi: 10.2307/2532356
Burt, M. L., Borchers, D. L., Jenkins, K. J., Marques, T. A., and Isaac, N. (2014). Using mark-recapture distance sampling methods on line transect surveys. Methods Ecol. Evol. 5, 1180–1191. doi: 10.1111/2041-210x.12294
Cañadas, A., Desportes, G., and Borchers, D. (2004). The estimation of the detection function and g(0) for short-beaked common dolphins (Delphinus delphis), using double-platform data collected during the NASS-95 Faroese survey. J. Cetacean Res. Manage. 6, 191–198.
Carr, M.-E. (2001). Estimation of potential productivity in Eastern Boundary Currents using remote sensing. Deep Sea Res. Part II Top. Stud. Oceanogr. 49, 59–80. doi: 10.1016/s0967-0645(01)00094-7
Castellote, M., Leeney, R. H., O’Corry-Crowe, G., Lauhakangas, R., Kovacs, K., Lucey, W., et al. (2012). Monitoring white whales (Delphinapterus leucas) with echolocation loggers. Polar Biol. 36, 493–509. doi: 10.1007/s00300-012-1276-2
Cipriano, F., Hevia, M., and Iñíguez, M. (2011). Genetic divergence over small geographic scales and conservation implications for Commerson’s dolphins (Cephalorhynchus commersonii) in southern Argentina. Mar. Mamm. Sci. 27, 701–718. doi: 10.1111/j.1748-7692.2010.00434.x
Coetzee, J. C., Van der Lingen, C. D., Hutchings, L., and Fairweather, T. P. (2008). Has the fishery contributed to a major shift in the distribution of South African sardine? ICES J. Mar. Sci. 65, 1676–1688. doi: 10.1093/icesjms/fsn184
Committee on Taxonomy (2018). List of Marine Mammal Species and Subspecies. Society for Marine Mammalogy. Available online at: www.marinemammalscience.org (accessed January 20, 2020).
Currie, H., Grobler, K., and Kemper, J. (eds) (2009). Namibian Islands’ Marine Protected Area. Windhoek: Ministry of Fisheries and Marine Resources.
Davis, R., David, J., Meÿer, M., Sekiguchi, K., Best, P. B., Dassis, M., et al. (2014). Home range and diving behaviour of Heaviside’s dolphins monitored by satellite off the west coast of South Africa. Afr. J. Mar. Sci. 36, 455–466. doi: 10.2989/1814232x.2014.973903
Dawson, S., DuFresne, S., Slooten, E., and Wade, P. (2000). Line-Transect Survey of Hector’s Dolphin Abundance between Motunau and Timaru. (Wellington: Department of Conservation), 1–17.
Dawson, S., and Slooten, E. (1988). Hector’s Dolphin, Cephalorhynchus hectori: Distribution and Abundance. Report of the International Whaling Commission, (Special Issue 9). (Cambridge: International Whaling Commission), 315–324.
Dawson, S., Slooten, E., Dufresne, S., Wade, P., and Clement, D. (2004). Small-boat surveys for coastal dolphins: line-transect surveys of Hector’s dolphins (Cephalorhynchus hectori). Fish. Bull. 102, 441–451.
Dawson, S., Wade, P., Slooten, E., and Barlow, J. (2008). Design and field methods for sighting surveys of cetaceans in coastal and riverine habitats. Mamm. Rev. 38, 19–49. doi: 10.1111/j.1365-2907.2008.00119.x
De Rock, P., Elwen, S. H., Roux, J. P., Leeney, R., James, B., Visser, V., et al. (2019). Predicting large-scale habitat suitability for cetaceans off Namibia using MinxENT. Mar. Ecol. Prog. Ser. 619, 149–167. doi: 10.3354/meps12934
Degrati, M., Loizaga, R., Coscarella, M. A., Sueyro, N., Crespo, E. A., and Dans, S. L. (2020). Integrating multiple techniques to estimate population size of an impacted dusky dolphin’s population in Patagonia, Argentina. Front. Mar. Sci. 7:289. doi: 10.3389/fmars.2020.00289
Elwen, S., and Gopal, K. (2018). Cephalorhynchus heavisidii. The IUCN Red List of Threatened Species 2018. e.T4161A50352086. Available online at: https://www.iucnredlist.org/species/4161/50352086 (accessed January 1, 2019).
Elwen, S., Meÿer, M. A., Best, P. B., Kotze, P. G. H., Thornton, M., and Swanson, S. (2006). Range and movements of female Heaviside’s dolphins (Cephalorhynchus heavisidii), as determined by satellite-linked telemetry. J. Mammal. 87, 866–877. doi: 10.1644/05-mamm-a-307r2.1
Elwen, S., Relton, C., and Plön, S. (2016). “A conservation assessment of Lagenorhynchus obscurus,” in The Red List of Mammals of South Africa, Swaziland and Lesotho, eds M. F. Child, L. Roxburgh, E. Do Linh San, D. Raimondo, and H. T. Davies-Mostert (Midrand: Endangered Wildlife Trust).
Elwen, S. H., Reeb, D., Thornton, M., and Best, P. B. (2009). A population estimate of Heaviside’s dolphins, Cephalorhynchus heavisidii, at the southern end of their range. Mar. Mamm. Sci. 25, 107–124. doi: 10.1111/j.1748-7692.2008.00246.x
Elwen, S. H., Thornton, M., Reeb, D., and Best, P. B. (2010). Near-shore distribution of Heaviside’s (Cephalorhynchus heavisidii) and dusky dolphins (Lagenorhynchus obscurus) at the southern limit of their range in South Africa. Afr. Zool. 45, 78–91. doi: 10.1080/15627020.2010.11657256
Fewster, R. M., Buckland, S. T., Burnham, K. P., Borchers, D. L., Jupp, P. E., Laake, J. L., et al. (2009). Estimating the encounter rate variance in distance sampling. Biometrics 65, 225–236. doi: 10.1111/j.1541-0420.2008.01018.x
Findlay, K. P., Best, P. B., Ross, G. J. B., and Cockcroft, V. G. (1992). The distribution of small odontocete cetaceans off the coasts of South Africa and Namibia. S. Afr. J. Mar. Sci. 12, 237–270. doi: 10.2989/02577619209504706
Gerrodette, T., Taylor, B. L., Swift, R., Rankin, S., Jaramillo-Legorreta, A. M., and Rojas-Bracho, L. (2011). A combined visual and acoustic estimate of 2008 abundance, and change in abundance since 1997, for the vaquita, Phocoena sinus. Mar. Mamm. Sci. 27, E79–E100. doi: 10.1111/j.1748-7692.2010.00438.x
Gillespie, D., and Chappell, O. (2002). An automatic system for detecting and classifying the vocalisations of harbour porpoises. Bioacoustics 13, 37–61. doi: 10.1080/09524622.2002.9753485
Gillespie, D., and Chappell, O. P. (1998). “Automated cetacean detection and monitoring,” in Proceedings of the Seismic and Marine Mammals Workshop, London, 23–25.
Golaski, S. (2016). Spatial and Temporal Patterns of Habitat Use of Heaviside’s Dolphins in Namibia. Master’s thesis, University of Pretoria, Pretoria.
Gopal, K., Elwen, S., and Plön, S. (2016). A Conservation Assessment of Cephalorhynchus heavisidii. Midrand: Endangered Wildlife Trust.
Gopal, K., Karczmarski, L., and Tolley, K. A. (2019). Patterns of geographic variation between mitochondrial and nuclear markers in Heaviside’s (Benguela) dolphins (Cephalorhynchus heavisidii). Integr. Zool. 14, 506–526. doi: 10.1111/1749-4877.12380
Gridley, T., Martin, M. J., Slater, J., Roux, J.-P., Swift, R. J., and Elwen, S. H. (in press). Towed passive acoustic monitoring complements visual survey methods for Heaviside’s dolphins (Cephalorhynchus heavisidii) in the Namibian Islands’ Marine Protected Area. Afr. J. Mar. Sci.
Hammond, P. S., Benke, H., Breggren, P., Collet, A., Heide-Jørgensen, M. P., Heimlich-Boran, S., et al. (1995). The Distribution and Abundance of Harbour Porpoises and Other Small Cetaceans in the North Sea and Adjacent Waters. Available online at: https://pdfs.semanticscholar.org/c19b/5b6a1039a651785b1c6a1921a116fc5314a0.pdf (accessed November 15, 2018).
Hammond, P. S., Macleod, K., Berggren, P., Borchers, D. L., Burt, L., Cañadas, A., et al. (2013). Cetacean abundance and distribution in European Atlantic shelf waters to inform conservation and management. Biol. Conserv. 164, 107–122. doi: 10.1016/j.biocon.2013.04.010
Hamner, R. M., Pichler, F. B., Heimeier, D., Constantine, R., and Baker, C. S. (2012). Genetic differentiation and limited gene flow among fragmented populations of New Zealand endemic Hector’s and Maui’s dolphins. Conserv. Genet. 13, 987–1002. doi: 10.1007/s10592-012-0347-9
Heinrich, S., Elwen, S., and Bräger, S. (2010). “Patterns of sympatry in Lagenorhynchus and Cephalorhynchus: dolphins in different habitats,” in The Dusky Dolphin: Master Acrobat off Different Shores, eds B. Würsig and M. Würsig (Amsterdam: Elsevier), 313–332. doi: 10.1016/b978-0-12-373723-6.00015-1
Heinrich, S., Genov, T., Fuentes Riquelme, M., and Hammond, P. S. (2019). Fine-scale habitat partitioning of Chilean and Peale’s dolphins and their overlap with aquaculture. Aquat. Conserv. Mar. Freshw. Ecosyst. 29, 212–226. doi: 10.1002/aqc.3153
Henderson, E., Hildebrand, J., Smith, M., and Falcone, E. (2012). The behavioral context of common dolphin (Delphinus sp.) vocalizations. Mar. Mamm. Sci. 28, 439–460. doi: 10.1111/j.1748-7692.2011.00498.x
Huggins, R. M. (1989). On the statistical analysis of capture experiments. Biometrika 76, 133–140. doi: 10.1093/biomet/76.1.133
Hutchings, L., Van Der Lingen, C. D., Shannon, L. J., Crawford, R. J. M., Verheye, H. M. S., Bartholomae, C. H., et al. (2009). The Benguela Current: an ecosystem of four components. Prog. Oceanogr. 83, 15–32. doi: 10.1016/j.pocean.2009.07.046
Iñíguez, M. A., and Tossenberger, V. P. (2007). Commerson’s dolphins (Cephalorhynchus commersonii) off Ría Deseado, Patagonia, Argentina. Aquat. Mamm. 33, 276–285. doi: 10.1578/am.33.3.2007.276
Innes, S., Heide-Jørgensen, M., Laake, J. L., Laidre, K. L., Cleator, H. J., Richard, P., et al. (2002). Surveys of belugas and narwhals in the Canadian high Arctic in 1996. NAMMCO Sci. Publ. 4, 169–190. doi: 10.7557/3.2843
Jaramillo-Legorreta, A., Cardenas-Hinojosa, G., Nieto-Garcia, E., Rojas-Bracho, L., Ver Hoef, J., Moore, J., et al. (2017). Passive acoustic monitoring of the decline of Mexico’s critically endangered vaquita. Conserv. Biol. 31, 183–191. doi: 10.1111/cobi.12789
Jefferson, T. A. (2019). “Endangered odontocetes and the social connection: selected examples of species at risk,” in Ethology and Behavioral Ecology of Odontocetes, ed. B. Würsig (Cham: Springer), 465–481. doi: 10.1007/978-3-030-16663-2_22
Jewell, R., Thomas, L., Harris, C. M., Kaschner, K., Wiff, R., Hammond, P. S., et al. (2012). Global analysis of cetacean line-transect surveys: detecting trends in cetacean density. Mar. Ecol. Prog. Ser. 453, 227–240. doi: 10.3354/meps09636
Kimura, S., Akamatsu, T., Wang, K., Li, S., Dong, S., and Wang, D. (2009). “Small-scale towing survey combined acoustical and visual observation for finless porpoise in the Yangtze River,” in Proceedings of the 4th International Symposium on SEASTAR2000 and Asian Bio-logging Science Graduate school of Informatics, Kyoto.
Kyhn, L. A., Tougaard, J., Beedholm, K., Jensen, F. H., Ashe, E., Williams, R., et al. (2013). Clicking in a killer whale habitat: narrow-band, high-frequency biosonar clicks of harbour porpoise (Phocoena phocoena) and Dall’s porpoise (Phocoenoides dalli). PLoS One 8:e63763. doi: 10.1371/journal.pone.0063763
Laake, J., and Borchers, D. (2004). “Methods for incomplete detection at distance zero,” in Advanced Distance Sampling, eds S. T. Buckland, D. R. Andersen, K. P. Burnham, J. L. Laake, and L. Thomas (Oxford: Oxford University Press), 108–189.
Laake, J., Borchers, D., Thomas, L., Miller, D., and Bishop, J. (2013). mrds: Mark–Recapture Distance Sampling. R package version 2.1.4. Available online at: https://cran.r-project.org/web/packages/mrds/index.html (accessed December 2, 2018).
Leeney, R. H. (2014). The marine wildlife-watching tourism industry in Namibia: an overview. J. Namibian Sci. Soc. 62, 9–33.
Leeney, R. H., Carslake, D., and Elwen, S. H. (2011). Using static acoustic monitoring to describe echolocation behaviour of Heaviside’s dolphins (Cephalorhynchus heavisidii) in Namibia. Aquat. Mamm. 37, 151–160. doi: 10.1578/am.37.2.2011.151
Ludynia, K., Kemper, J., and Roux, J.-P. (2012). The Namibian Islands’ marine protected area: using seabird tracking data to define boundaries and assess their adequacy. Biol. Conserv. 156, 136–145. doi: 10.1016/j.biocon.2011.11.014
Macleod, C. D. (2009). Global climate change, range changes and potential implications for the conservation of marine cetaceans: a review and synthesis. Endanger. Species Res. 7, 125–136. doi: 10.3354/esr00197
Madsen, P. T., Carder, D. A., Bedholm, K., and Ridgway, S. H. (2005). Porpoise clicks from a sperm whale nose—Convergent evolution of 130 kHz pulses in toothed whale sonars? Bioacoustics 15, 195–206. doi: 10.1080/09524622.2005.9753547
Marques, T. A., Thomas, L., Martin, S. W., Mellinger, D. K., Ward, J., Moretti, D. J., et al. (2013). Estimating animal population density using passive acoustics. Biol. Rev. 88, 287–309. doi: 10.1111/brv.12001
Martin, M. J. (2019). Describing the Vocalisations of Heaviside’s Dolphins (Cephalorhynchus heavisidii) and Estimating Dolphin Abundance in the Namibian Islands’ Marine Protected Area. Ph.D. thesis, University of Pretoria, Pretoria.
Martin, M. J., Elwen, S. H., Kassenjee, R., and Gridley, T. (2019). To buzz or burst-pulse? The functional role of Heaviside’s dolphin (Cephalorhynchus heavisidii) rapidly pulsed signals. Anim. Behav. 150, 273–284. doi: 10.1016/j.anbehav.2019.01.007
Martin, M. J., Gridley, T., Elwen, S. H., and Jensen, F. H. (2018). Heaviside’s dolphins (Cephalorhynchus heavisidii) relax acoustic crypsis to increase communication range. Proc. Biol. Sci. 285:20181178. doi: 10.1098/rspb.2018.1178
Mellinger, D. K., Stafford, K. M., Moore, S. E., Dziak, R. P., and Matsumoto, H. (2007). An overview of fixed passive acoustic observation methods for cetaceans. Oceanography 20, 36–45. doi: 10.5670/oceanog.2007.03
Møhl, B., Wahlberg, M., Madsen, P. T., Miller, L. A., and Surlykke, A. (2000). Sperm whale clicks: directionality and source level revisited. J. Acoust. Soc. Am. 107, 638–648. doi: 10.1121/1.428329
Morisaka, T., Karczmarski, L., Akamatsu, T., Sakai, M., Dawson, S., and Thornton, M. (2011). Echolocation signals of Heaviside’s dolphins (Cephalorhynchus heavisidii). J. Acoust. Soc. Am. 129, 449–457. doi: 10.1121/1.3519401
Palka, D. (1996). Effects of Beaufort Sea state on the sightability of harbor porpoises in the Gulf of Maine. Rep. Int. Whaling Comm. 46, 575–582.
Palka, D. L., and Hammond, P. S. (2001). Accounting for responsive movement in line transect estimates of abundance. Can. J. Fish. Aquat. Sci. 58, 777–787. doi: 10.1139/f01-024
Peard, K. (2007). Seasonal and Interannual Variability of Wind-Driven Upwelling at Lüderitz, Namibia. Master’s thesis, University of Cape Town, Cape Town.
Pérez-Alvarez, M. J., Olavarría, C., Moraga, R., Baker, C. S., Hamner, R. M., and Poulin, E. (2015). Microsatellite markers reveal strong genetic structure in the endemic Chilean dolphin. PLoS One 10:e0123956. doi: 10.1371/journal.pone.0123956
Perrin, W. F. (1999). “Selected examples of small cetaceans at risk,” in Conservation and Management of Marine Mammals, eds J. R. Twiss, R. R. Reeves, and S. Montgomery (Washington, D.C: Smithsonian), 296–310.
R Core Team (2013). R: A Language and Environment for Statistical Computing. Vienna: R Foundation for Statistical Computing.
Rankin, S., Barlow, J., and Oswald, J. (2008). An Assessment of the Accuracy and Precision of Localization of a Stationary Sound Source Using a Two-Element Towed Hydrophone Array. National Marine Fisheries Service Center Technical Memorandum NOAA-TM-NMFS-SWFSC-416. (La Jolla, CA: NOAA Southwest Fisheries Science Center), 29.
Rankin, S., Norris, T. F., Smultea, M. A., Oedekoven, C., Zoidis, A. M., Silva, E., et al. (2007a). A visual sighting and acoustic detections of minke whales, Balaenoptera acutorostrata (Cetacea: Balaenopteridae), in nearshore Hawaiian waters. Pac. Sci. 61, 395–398. doi: 10.2984/1534-6188(2007)61[395:avsaad]2.0.co;2
Rankin, S., Oedekoven, C., and Archer, F. (2020). Mark recapture distance sampling: using acoustics to estimate the fraction of dolphins missed by observers during shipboard line-transect surveys. Environ. Ecol. Stat. 27, 233–251. doi: 10.1007/s10651-020-00443-7
Rankin, S., Oswald, J., Barlow, J., and Lammers, M. (2007b). Patterned burst-pulse vocalizations of the northern right whale dolphin, Lissodelphis borealis. J. Acoust. Soc. Am. 121, 1213–1218. doi: 10.1121/1.2404919
Rayment, W., Dawson, S., and Slooten, L. (2009). Trialling an automated passive acoustic detector (T-POD) with Hector’s dolphins (Cephalorhyncus hectori). J. Mar. Biol. Assoc. U.K. 89, 1015–1022. doi: 10.1017/s0025315409003129
Richman, N. I., Gibbons, J. M., Turvey, S. T., Akamatsu, T., Ahmed, B., Mahabub, E., et al. (2014). To see or not to see: investigating detectability of Ganges River dolphins using a combined visual-acoustic survey. PLoS One 9:e96811. doi: 10.1371/journal.pone.0096811
Roux, J. P., Braby, R. J., and Best, P. B. (2015). Does disappearance mean extirpation? The case of right whales off Namibia. Mar. Mamm. Sci. 31, 1132–1152. doi: 10.1111/mms.12213
Roux, J. P., van der Lingen, C. D., Gibbons, M. J., Moroff, N. E., Shannon, L. J., Smith, A. D., et al. (2013). Jellyfication of marine ecosystems as a likely consequence of overfishing small pelagic fishes: lessons from the Benguela. Bull. Mar. Sci. 89, 249–284. doi: 10.5343/bms.2011.1145
Southall, B. L., Finneran, J. J., Reichmuth, C., Nachtigall, P. E., Ketten, D. R., Bowles, A. E., et al. (2019). Marine mammal noise exposure criteria: updated scientific recommendations for residual hearing effects. Aquat. Mamm. 45, 125–232. doi: 10.1578/am.45.2.2019.125
Thomas, L., Buckland, S. T., Rexstad, E. A., Laake, J. L., Strindberg, S., Hedley, S. L., et al. (2010). Distance software: design and analysis of distance sampling surveys for estimating population size. J. Appl. Ecol. 47, 5–14. doi: 10.1111/j.1365-2664.2009.01737.x
Van Parijs, S. M., Clark, C. W., Sousa-Lima, R. S., Parks, S. E., Rankin, S., Risch, D., et al. (2009). Management and research applications of real-time and archival passive acoustic sensors over varying temporal and spatial scales. Mar. Ecol. Prog. Ser. 395, 21–36. doi: 10.3354/meps08123
Verfuss, U. K., Gillespie, D., Gordon, J., Marques, T. A., Miller, B., Plunkett, R., et al. (2018). Comparing methods suitable for monitoring marine mammals in low visibility conditions during seismic surveys. Mar. Pollut. Bull. 126, 1–18. doi: 10.1016/j.marpolbul.2017.10.034
Vila, A. R., Falabella, V., Gálvez, M., Farías, A., Droguett, D., and Saavedra, B. (2016). Identifying high-value areas to strengthen marine conservation in the channels and fjords of the southern Chile ecoregion. Oryx 50, 308–316. doi: 10.1017/s0030605314000908
Wang, K., Wang, D., Akamatsu, T., Fujita, K., and Shiraki, R. (2006). Estimated detection distance of a baiji’s (Chinese river dolphin, Lipotes vexillifer) whistles using a passive acoustic survey method. J. Acoust. Soc. Am. 120, 1361–1365. doi: 10.1121/1.2221416
Williams, R., and Thomas, L. (2007). Distribution and abundance of marine mammals in the coastal waters of British Columbia, Canada. J. Cetacean Res. Manage. 9, 15–28.
Williams, R., and Thomas, L. (2009). Cost-effective abundance estimation of rare animals: testing performance of small-boat surveys for killer whales in British Columbia. Biol. Conserv. 142, 1542–1547. doi: 10.1016/j.biocon.2008.12.028
Würsig, B., and Würsig, M. (1980). Behavior and ecology of the dusky dolphin, Lagenorhynchus obscurus, in the South Atlantic. Fish. Bull. 77, 871–890.
Keywords: abundance, conservation, double-platform line transect survey, marine protected area (MPA), mark-recapture distance sampling (MRDS), near threatened species, passive acoustic monitoring, small cetacean
Citation: Martin MJ, Gridley T, Roux J-P and Elwen SH (2020) First Abundance Estimates of Heaviside’s (Cephalorhynchus heavisidii) and Dusky (Lagenorhynchus obscurus) Dolphins Off Namibia Using a Novel Visual and Acoustic Line Transect Survey. Front. Mar. Sci. 7:555659. doi: 10.3389/fmars.2020.555659
Received: 25 April 2020; Accepted: 01 September 2020;
Published: 18 September 2020.
Edited by:
Lars Bejder, University of Hawaii at Manoa, United StatesReviewed by:
Tilen Genov, Morigenos - Slovenian Marine Mammal Society, SloveniaJoshua Nathan Smith, Murdoch University, Australia
Chandra Paulina Salgado Kent, Edith Cowan University, Australia
Copyright © 2020 Martin, Gridley, Roux and Elwen. This is an open-access article distributed under the terms of the Creative Commons Attribution License (CC BY). The use, distribution or reproduction in other forums is permitted, provided the original author(s) and the copyright owner(s) are credited and that the original publication in this journal is cited, in accordance with accepted academic practice. No use, distribution or reproduction is permitted which does not comply with these terms.
*Correspondence: Morgan Jennifer Martin, bWptYXJ0aW5Ac2FuZGllZ28uZWR1