
94% of researchers rate our articles as excellent or good
Learn more about the work of our research integrity team to safeguard the quality of each article we publish.
Find out more
ORIGINAL RESEARCH article
Front. Mar. Sci., 08 October 2020
Sec. Marine Ecosystem Ecology
Volume 7 - 2020 | https://doi.org/10.3389/fmars.2020.547829
This article is part of the Research TopicClimate Change and Light in Aquatic Ecosystems: Variability & Ecological ConsequencesView all 10 articles
 Nur Ili Hamizah Mustaffa*†
 Liisa Kallajoki
 Johanna Biederbick
 Franziska Isabell Binder
 Alexandra Schlenker†
 Maren Striebel
Human activities, increasing precipitation, and changes in land run-off deliver a large input of allochthonous nutrients into coastal waters including terrigenous dissolved organic matter (tDOM). Increased subsidies of tDOM into the coastal water are expected to reduce light availability and thus might be one of the factors causing coastal ocean darkening. To investigate the effect of increased tDOM input and thus limitation in light availability on primary production as well as the transfer to higher trophic levels (zooplankton), we conducted a large-scale indoor mesocosm “Planktotrons” experiment with natural (pelagic and benthic) plankton communities from the North Sea. We simulated a coastal ocean system with daily light and tidal cycles for 35 days. The experimental treatments included a light gradient consisting of three levels of tDOM addition (i.e., low tDOM, medium tDOM, and high tDOM) and a control without tDOM addition. Results showed that tDOM addition reduced the light availability by 27% (low tDOM addition), 62% (medium tDOM addition) and 86% (high tDOM addition). Light reduction through tDOM addition negatively influenced phytoplankton biomass during the first half of the experiment (<18 days) mainly in the “medium tDOM” and “high tDOM” treatments. The tDOM addition changed the phytoplankton community composition, potentially due to adaptations to different light conditions. Neither phytobenthos biomass nor composition was significantly affected by tDOM addition, probably because the tidal cycle assured sufficient light availability during low tide. Overall, our results indicate that the tDOM addition negatively influenced phytoplankton biomass and composition via light availability and tDOM effects were also observed on the zooplankton level (biomass and C:N ratio). Our experiment demonstrates possible implications of coastal darkening under climate-driven environmental changes on primary producers and their interactions in the aquatic food web.
Ongoing and future predicted climate change will not only increase sea surface temperature but also cause intensified run-off into coastal ecosystems due to an increase in precipitation (Evans et al., 2006; Roulet and Moore, 2006; Monteith et al., 2007). Moreover, human activities, changes in land use, and changes in the frequency of short and heavy rainfall events can result in large pulses of soil and sediment into coastal systems (Nunes et al., 2009) consequently affecting the light climate by reducing the level of water clarity and depth of light penetration. Changes in light climate have strong implications for primary productivity and interactions in aquatic food webs. For instance, observations of the last 100 years show a global decrease in phytoplankton biomass with a decline of approximately 1% of the global median biomass per year (Boyce et al., 2010) while regional greening of the water column in the open ocean was reported (Wernand et al., 2013). However, these studies mostly exclude coastal regions even though they are the most productive ocean areas, hot spots for terrigenous dissolved organic matter (tDOM) cycling, and highly sensitive to abiotic changes and human activities. Indeed, previous studies reported a reduction in the light availability in coastal waters (Fleming-Lehtinen and Laamanen, 2012; Capuzzo et al., 2015) as well as bays (Kemp et al., 2005) and fjords (Aksnes et al., 2009) as a consequence of large nutrient inputs from land. Increasing terrestrial run-off, glacier melting, storms in coastal areas, and agriculture accompanied by tDOM input alters nutrient concentration in the water column and is expected to reduce light availability, a so-called (ocean) darkening (Aksnes et al., 2009). The negative effect of tDOM on water quality and ecosystem health is recognized (de Wit et al., 2016) and tDOM has been suggested to be included as a proxy in coastal monitoring programs and management policies (Deininger and Frigstad, 2019).
Terrigenous dissolved organic matter is a complex mixture of organic compounds that play an important role in marine biogeochemical cycling (Anderson et al., 2015; Carlson and Hansell, 2015). Chromophoric DOM (CDOM) is the light-adsorbing component of DOM, capable of absorbing the light in the range of visible and ultraviolet (UV) wavelengths (Coble, 2007). High concentrations of CDOM in the water column leads to brownification, decreases penetration of UV light and thus decreases the water transparency (Coble, 2007). The effect of tDOM addition has been predicted to affect primary production and community composition (Jones, 1992; Klug, 2002; Deininger et al., 2017b). Delivery of labile tDOM and inorganic nutrients through run-off can stimulate planktonic food webs (i.e., primary production and bacterial growth). For instance, increasing inorganic nutrients through terrestrial run-off provides excess nutrients to support fast-growing diatom species (Deininger et al., 2016; Paczkowska et al., 2020), and bacterial growth can be triggered by increasing dissolved organic nutrients (Kissman et al., 2013) and dissolved organic carbon (DOC) availability (Cole et al., 2011). However, excessive inorganic nutrient load can lead to harmful algal blooms, increase light attenuation (Klug, 2002), and decrease light availability in the water column thus leading to a tipping point where primary production decreases. On the other hand, bacteria production might be favored as tDOM provides a carbon food source and thus the system may shift from autotrophic toward heterotrophic production (Wikner and Andersson, 2012; Andersson et al., 2018). The lability of tDOM is influenced by heterotrophic bacterial utilization which may affect tDOM shading properties (Tranvik, 1988; Wikner and Andersson, 2012). Moreover, heterotrophic bacteria can also remineralize dissolved organic nitrogen (DON) and organic phosphorus (DOP), part of tDOM, to inorganic nutrients. Overall, this underlying process may affect phytoplankton production by shaping both light penetration and nutrient availability with consequences for the pelagic food structure and overall coastal productivity.
Phytoplankton and phytobenthos form the basis of aquatic food webs and act as an energy source for higher trophic levels, such as zooplankton and fish (Lefebure et al., 2013). Besides living in different habitats, phytoplankton, and phytobenthos are different in their taxonomic compositions which results in a difference in their photosynthetic and photo-protective strategies (Bonilla et al., 2005, 2009). It is known that high nutrient concentrations increase phytoplankton biomass which feeds back to an increase in light attenuation. If the light attenuation increases, phytoplankton biomass will affect the light intensity that reaches benthic microalgae and light becomes a limiting resource for phytobenthos (Hansson, 1988). The nutrient uptake of phytobenthos is generally subjected to boundary-layer kinetics, thus uptake velocities are considered lower as thus of phytoplankton (Riber and Wetzel, 1987). However, phytobenthos can utilize nutrients from the sediments and thus may reduce nutrient availability for phytoplankton (Blumenshine et al., 1997). The competition for nutrients between phytoplankton and phytobenthos link benthic and pelagic food webs at the primary trophic level (Vadeboncoeur et al., 2003). Therefore, it is essential to study the factors that influence this competition.
Furthermore, light or substrate availability through tDOM addition potentially affects food quantity and quality with consequences for zooplankton (Kissman et al., 2013; Lefebure et al., 2013). The addition of tDOM reduces light availability and thus lowers phytoplankton photosynthesis and carbon fixation rates while providing additional nutrients (if the DOM substrate can be utilized) resulting in decreasing carbon:nutrient ratios. This may result in a decrease of food quantity but increase food quality for zooplankton (Elser and Urabe, 1999). Bartels et al. (2012) demonstrated that the light reduction due to tDOM addition further decreases primary production and affects autotrophic resource availability for zooplankton. tDOM also has been shown to indirectly affect zooplankton biomass via enhanced bacterial production (Faithfull et al., 2012), consequently altering zooplankton grazing intensity and selectivity on phytoplankton (Kissman et al., 2013). Furthermore, Deininger et al. (2017a) observed that the inorganic nutrient-enriched system from DOC increases zooplankton growth by causing a marginal change in primary productivity to bacterial production ratio as well as phytoplankton food quality. Finally, the addition of tDOM and the associated dissolved organic nutrient (labile substrate) addition have been shown to reduce zooplankton richness with a profound effect on biodiversity (Shurin et al., 2010). In higher trophic levels, reduction in light availability has also been documented to trigger pronounced restraints in photic habitat, reducing visibility for visual predators (Capuzzo et al., 2018).
Overall, the effects of tDOM addition on whole plankton communities can be various and the complex relations are poorly understood. Hence, this study aims to test these possible aspects of darkening in coastal systems by investigating the effect of tDOM addition on primary producers and the food web in a coastal system. We, therefore, hypothesize that:
H1: Increasing tDOM concentrations will reduce light availability. We expect that decreased light availability will reduce the total phytoplankton biomass. Furthermore, tDOM addition will shift the light spectrum due to the properties of CDOM and thus will cause a change in the phytoplankton species composition.
H2: In a light-limited system, we expect that the light reduction via tDOM addition will negatively affect the phytobenthos even more than the phytoplankton. As tDOM addition is accompanied by organic nutrient availability, i.e., dissolved organic molecules containing nitrogen (DON) and phosphorous (DOP) (Klug, 2002), it will stimulate pelagic phytoplankton growth (particularly in the nutrient-limited system) more than the phytobenthos growth. Additionally, we expect a significant interaction between phytoplankton and phytobenthos as both are affected by light and nutrient availability.
H3: The effects of tDOM addition via light and nutrients on phytoplankton will transfer to higher trophic levels, i.e., zooplankton. As we expect nutrient availability via tDOM addition will influence phytoplankton biomass, it is reasonable to expect that the food quantity will directly affect the zooplankton biomass and composition. In terms of stoichiometry, reduced light availability via tDOM addition will decrease the carbon:nitrogen (C:N) ratio of phytoplankton, increase food quality for zooplankton, and thus enhance zooplankton growth.
The experiment was conducted in 12 fully controllable indoor-mesocosms, so-called Planktotrons (Gall et al., 2017), in August 2017 for 35 days. Tidal flat sediment (including benthos) was collected from the Jade Bay, Wilhelmshaven, Germany (53.512945 N, 8.144166 E). 50 L of wet sediment (height approximately 0.05 m) was added to each Planktotron and filled with 600 L of seawater containing plankton from the North Sea resulting in a 1.15-m water column. The temperature was constantly held at 18.9 ± 0.9°C for the whole duration of the experiment. We programmed a natural tidal cycle with two high tide and low tide occurrences per day, each lasting 6:15 h leading to a shift of 1 h per day. To achieve a low tide condition (0.10 m of seawater height), approximately 470 L of seawater was pumped out of the Planktotron (within 5 h) into a 500 L tidal-exchange container, respectively. After 6:15 h, the seawater was restored achieve high tide conditions (1.10 m of seawater height). A light:dark cycle was set for 18:6 h with two controllable LED lighting units (IT 2040 Evergrow). The lighting units were off during the night and then run for 1 h each at 60 μmol m–2 s–1 and 180 μmol m–2 s–1 light intensity respectively to simulate sunrise (light intensity measured as photon flux integrated over the range of the photosynthetic active radiation of 400–700 nm). During the day the lighting units ran at 300 μmol m–2 s–1 light intensity for 14 h. Sunset was simulated by applying 1 h of 180 μmol m–2 s–1 light intensity followed by 1 h of 60 μmol m–2 s–1 light intensity (Supplementary Figure 1). The average of light intensity (measured as lux) per day and the relative light intensity (%) using control treatment as reference during the first half of the experiment are in Supplementary Figure 2. Meanwhile, light intensity (measured as lux) directly above the sediment was measured with data loggers (HOBO UA-002-064 Pendant Datenlogger, Germany) during the whole experiment (Supplementary Figure 3).
The treatment was simulated through the addition of terrigenous dissolved organic matter (tDOM) that was extracted by alkaline extraction from commercial peat (Torfhumus Floragard®) (Riedel et al., 2012; Gall et al., 2017). The peat was filtered through a series of 3, 1, and 0.2 μm large-volume filter cartridges (Causa-filter system, Infiltec GmbH, Germany) to remove bacteria and other particles (Gall et al., 2017). We set up four levels consisting of control (without tDOM addition, ambient DOC concentrations of 322 μmolL–1), “low tDOM,” “medium tDOM” and “high tDOM” with the addition of 100, 150, and 350 μmol DOC L–1 resulting in a decrease in absorbance (at 254 nm, Supplementary Figure 4) of 27, 62, and 86%, respectively. Absorbance was measured from day 0 to day 35 and absorbance coefficient at wavelengths of 254 and 440 nm was calculated (Figure 1). To compensate the nutrient addition in terms of the limiting nutrient in the system (phosphorus), we amended corresponding amounts of phosphorus to the control, “low tDOM” and “medium tDOM” treatments (Figure 2B). Each treatment was replicated three times, resulting in a total of 12 units.
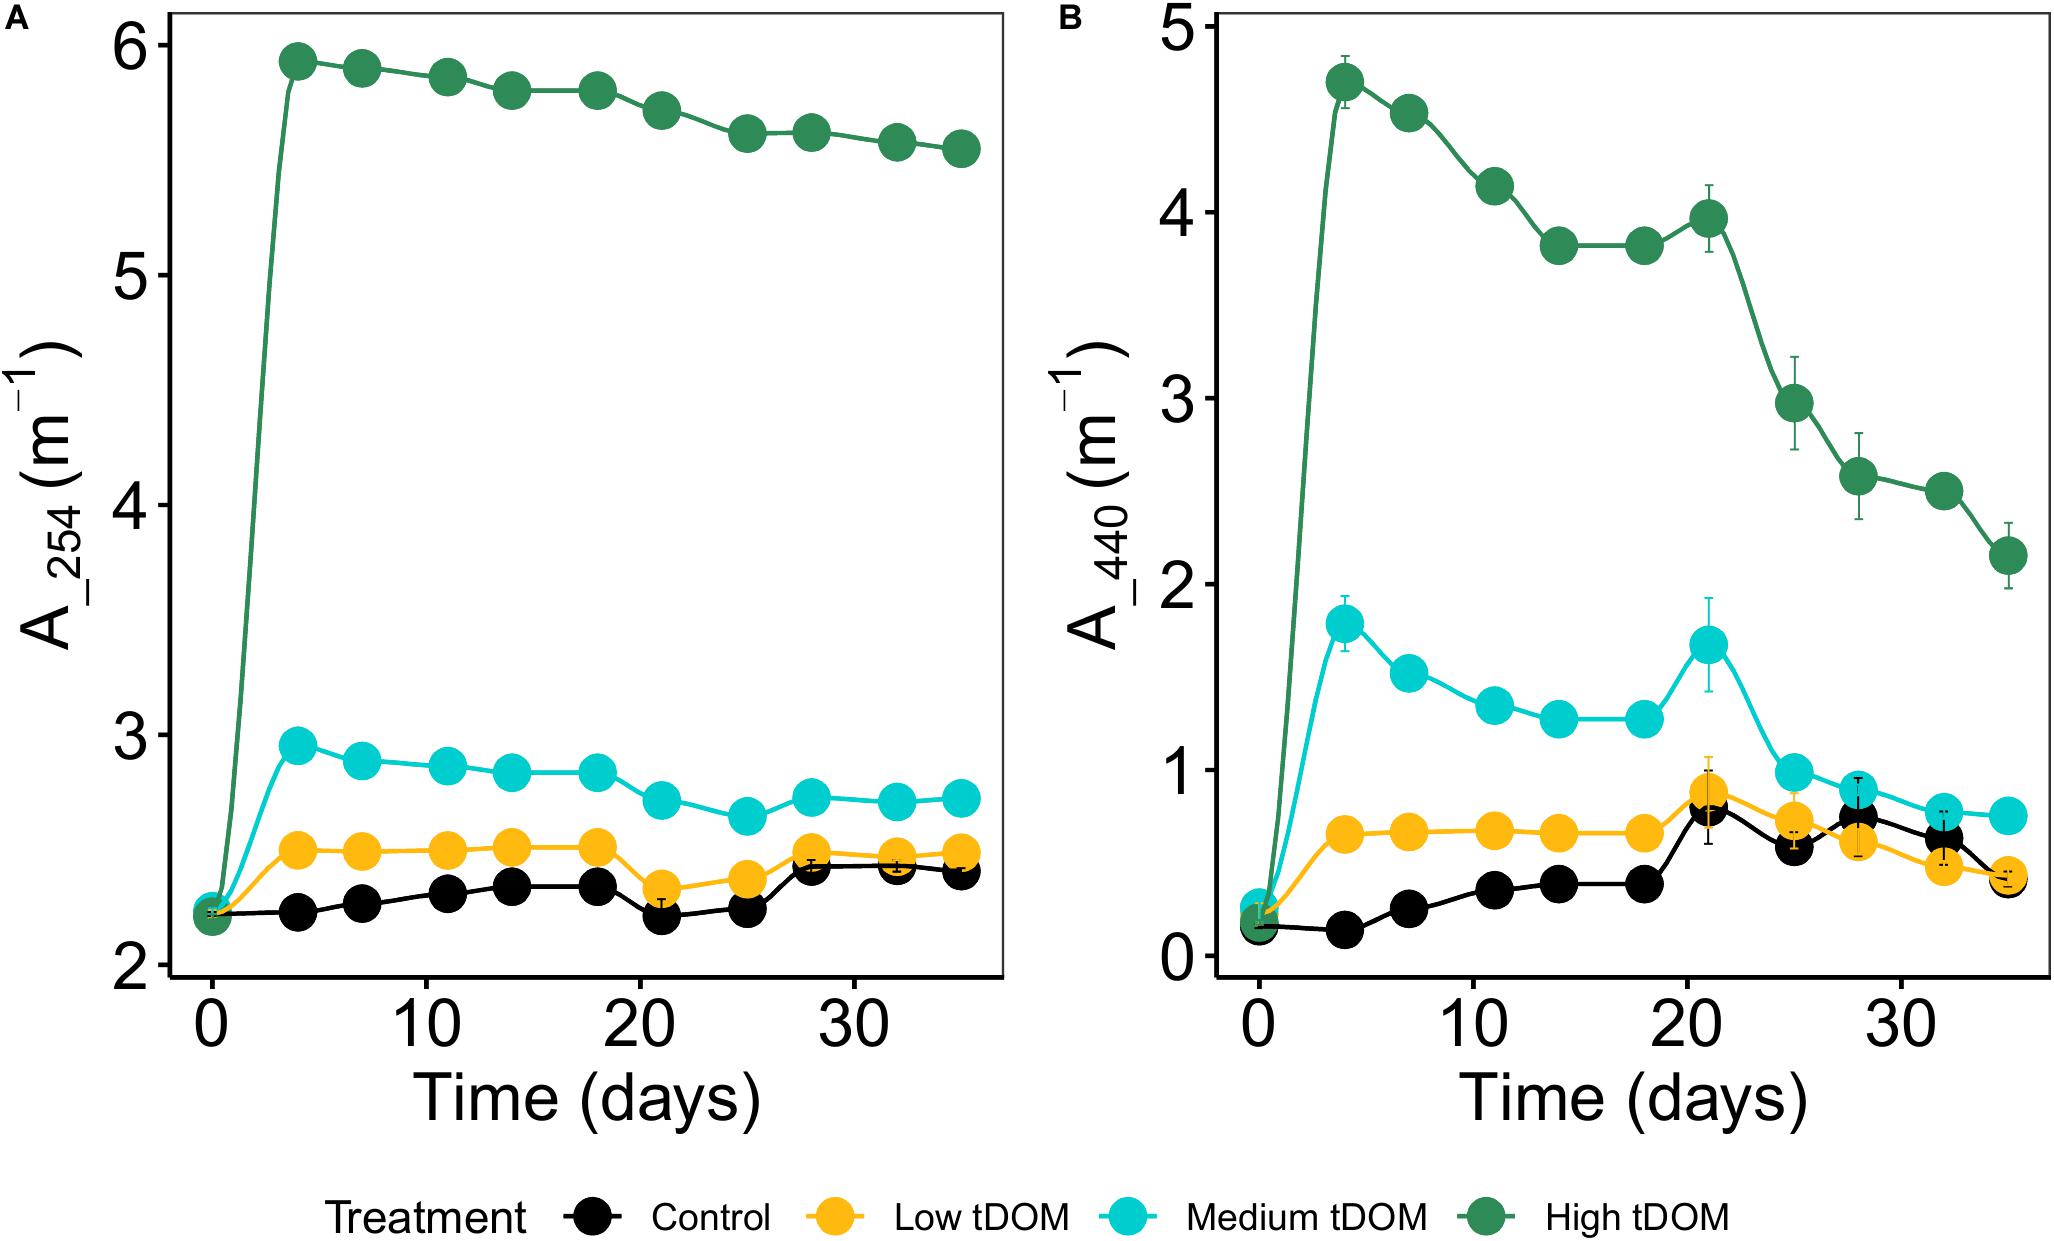
Figure 1. Absorbance coefficient of tDOM (A) at 254 nm and (B) at 440 nm (shown as decadal (log 10) absorption coefficient) over 35 days of the experiments. Error bars represent standard deviation within treatment replicates. Colors represent tDOM addition: control (black), low tDOM (yellow), medium tDOM (blue), and high tDOM (green) treatments.
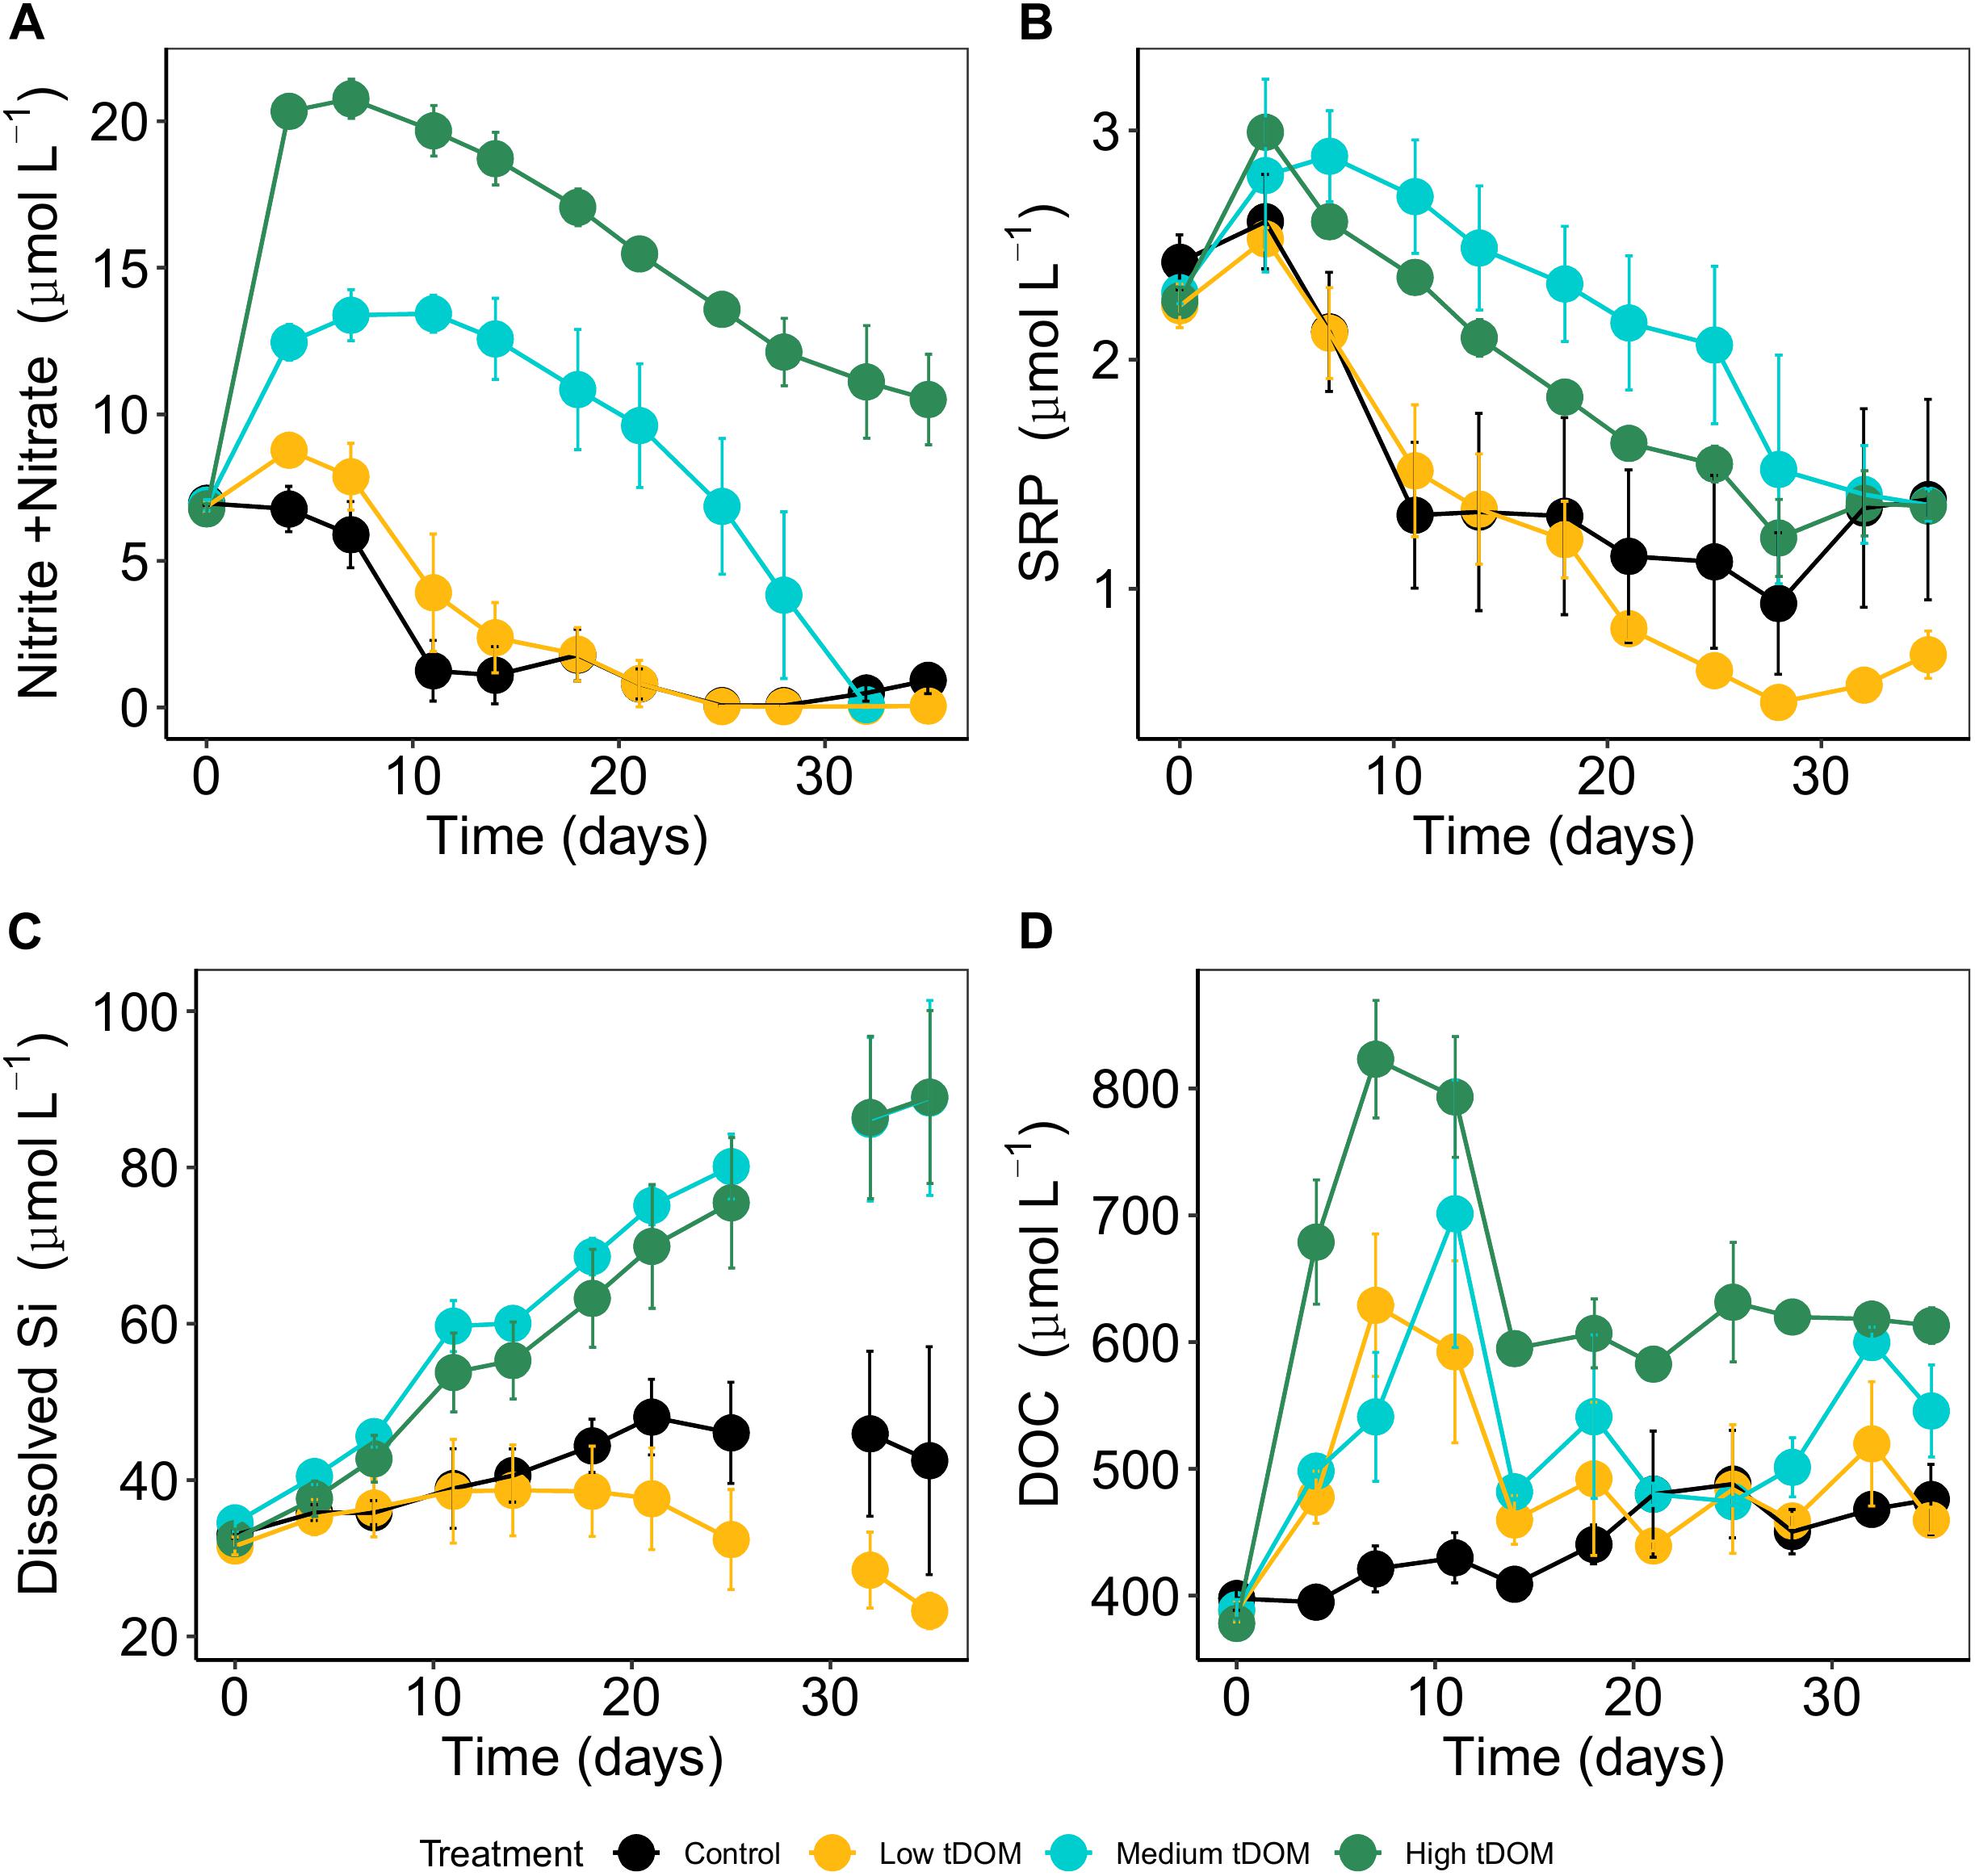
Figure 2. Inorganic nutrient concentrations over 35 days of the experiments: (A) dissolved inorganic nitrogen (nitrate + nitrite), (B) soluble reactive phosphorus (SRP), and (C) dissolved silicate. Panel (D) represents the concentration of dissolved organic carbon (DOC). Error bars represent standard deviation. Color plots represent tDOM addition in the control (black), low tDOM (yellow), medium tDOM (blue), and high tDOM (green) treatments.
Samples were generally collected twice a week with a sampling bottle (2 L) from the surface of the tidal-exchange container during low tide condition (highest water column in the tidal-exchange container) after homogenizing the water column with a disc (Striebel et al., 2013). In vivo chlorophyll a concentration was measured daily using a hand-held fluorometer (AquaFluor, Turner Designs, United States) as a proxy for phytoplankton biomass using an external standard calibration. Samples for pigment concentrations, particulate organic carbon (POC), nitrate (PON), and phosphorous (POP) concentrations were collected twice a week, filtered onto acid-washed and pre-combusted GF/C filters (Whatman, United Kingdom), and stored at −80°C until analyses. Filters for POC and PON were oven-dried at 58°C, placed in tin capsules, and measured using an elemental analyzer (Thermo Fischer Scientific, Flash EA 1112, United States). Particulate organic phosphorus (POP, using the filter samples) and total phosphorus (TP, using unfiltered water samples) concentrations were determined spectrophotometrically using molybdate reaction after sulfuric acid digestion (Grasshoff et al., 1999). For soluble reactive phosphorus (SRP), dissolved nutrient (nitrate and nitrite), and dissolved silicate (Si), 10 mL of the filtrates were analyzed using a continuous flow analyzer (Skalar, Netherlands). Samples for DOC were filtered with double layer pre-combusted and acid-washed glass-fiber filters (Whatman GF/F). DOC samples were acidified to pH 2.0 with 32% HCl and analyzed by Shimadzu TOC-VCPH/CPN with TNM-1 Modul (TDN) ASI-V Autosampler. Filters for pigment analysis were stored at −80°C until analysis, treated with 10 mL of 90 vol% ethanol solution, sonicated on ice for 30 min (GT SONIC, Germany), and left in the dark at 4°C for 24 h for further extraction. The extract was measured at a wavelength range between 400 and 700 nm using a photometer (Aqua Mate Plus UV-VIS, Thermo Fischer Scientific, United States), and absorption values were converted into concentration (μg L–1) using the spectral deconvolution method according to Thrane et al. (2015).
Phytobenthos samples were taken during low tide from the Planktotrons using a self-made benthos stick (length: 1 m). The sampling was done by sticking the tip with the cylindrical opening (2.8 cm diameter, 3 cm height) into the sediment perpendicular to the sediment surface. By pulling the stick’s plunger, suction was created that held the sample inside the tip and through pushing was transferred into a vial for storing. The inner part of the tip was then rinsed with water to ensure that all remaining phytobenthos was collected. Phytobenthos pigments were extracted using 20 mL of 90% ethanol solution similar to phytoplankton samples. Concentrations of pigment were related to the sampling area (cm3) for phytobenthos. Zooplankton samples were collected from the tidal-exchange container during low tide condition (highest water column in the tidal-exchange container) by lowering and lifting a zooplankton net. Thus, 7 L of the water was filtered with a 100 μm plankton net, and the collected zooplankton sample was divided into subsamples for CN analysis, fixed with Lugol’s iodine (1% final concentration), and counted with a binocular (Zeiss®, Germany). At the beginning of the experiment the whole samples were counted, and from day 21 onward subsamples of only 30% (three times 10%) of the samples were counted.
All statistical procedures and graphs were performed using R version 3.5.3 (R Core Team, 2019). Repeated measures ANOVA were used to test for treatment (“control,” “low tDOM,” “medium tDOM,” and “high tDOM”) and time (“day”) effects as well as for interactive effects of treatment and time. p-values were obtained by pairwise analysis comparison of “tDOM addition” and “day” model (to account for interaction between tDOM addition and day). Resource use efficiency (RUE) is a proxy for ecosystem function to track the functional change in relation or reaction to species change (Ptacnik et al., 2008; Hodapp et al., 2019). RUE was defined as unit biomass production in chlorophyll a (μg L–1) per unit TP (μg L–1). Diagnostic pigments can be used as both qualitative and quantitative indicators of the respective phytoplankton group (Schlüter and Havskum, 1997). Therefore, phytoplankton and phytobenthos taxonomic pigment signatures (μg L–1 and μg cm–3, respectively) were calculated based on pigment compositions according to Jeffrey et al. (2011) based on the following formulae:
Adding tDOM to the respective treatments increased the light absorption coefficient (determined for 254 and 440 nm, Figure 1) and thus, decreased the available light intensity by 27% in “low tDOM,” 61% in “medium tDOM,” and 86% in “high tDOM” compared to the control treatment (see also Supplementary Figures 2, 3). DIN concentrations (nitrate and nitrite), SRP, and DOC increased in all treatments with tDOM addition and were higher in the “medium tDOM” and “high tDOM” treatments but generally decreased over time (Table 1 and Figure 2). Si concentrations increased over time in the “medium tDOM” and “high tDOM” treatments but not in the “low tDOM” treatment and control (Figure 2 and Table 1).
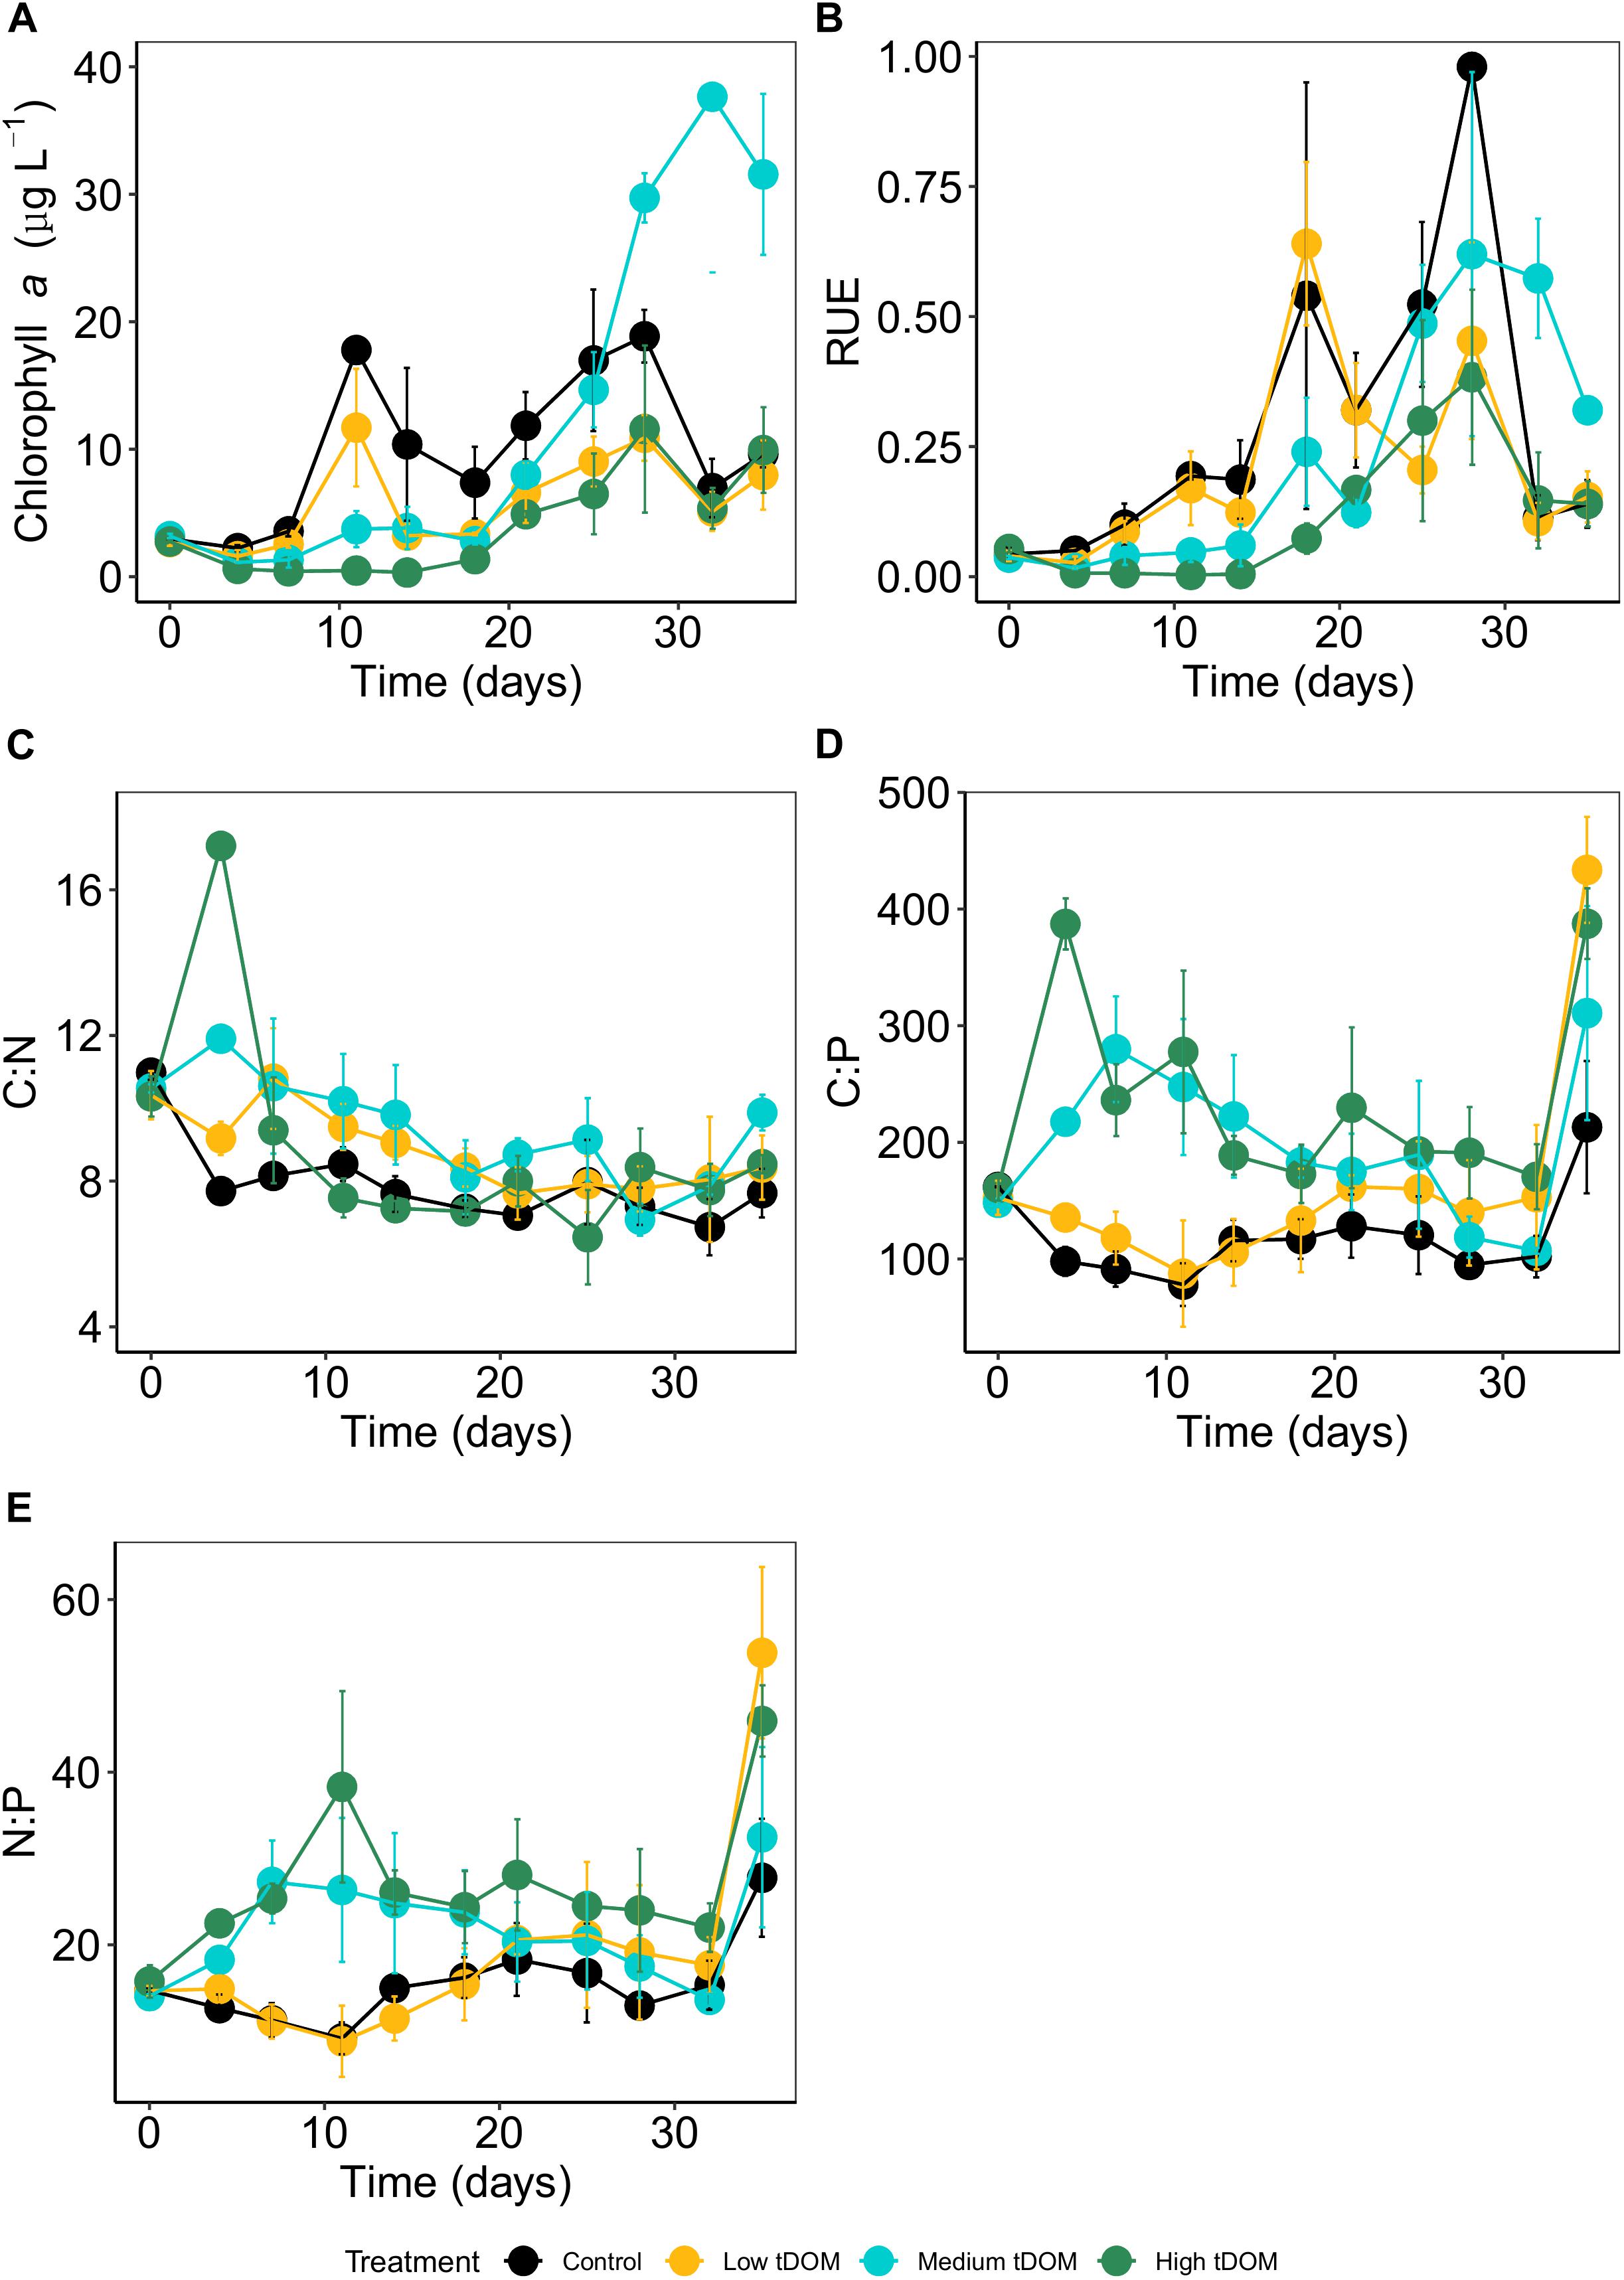
Figure 3. Phytoplankton (A) biomass (Chl a in μg L–1), (B) resource use efficiency (RUE), and molar particulate (C) C:N, (D) C:P, and (E) N:P ratios over 35 days of the experiments. Data are given as mean values with standard deviation. Colors indicate treatments: control (black), low tDOM addition (yellow), medium tDOM addition (blue), and high tDOM addition (green).
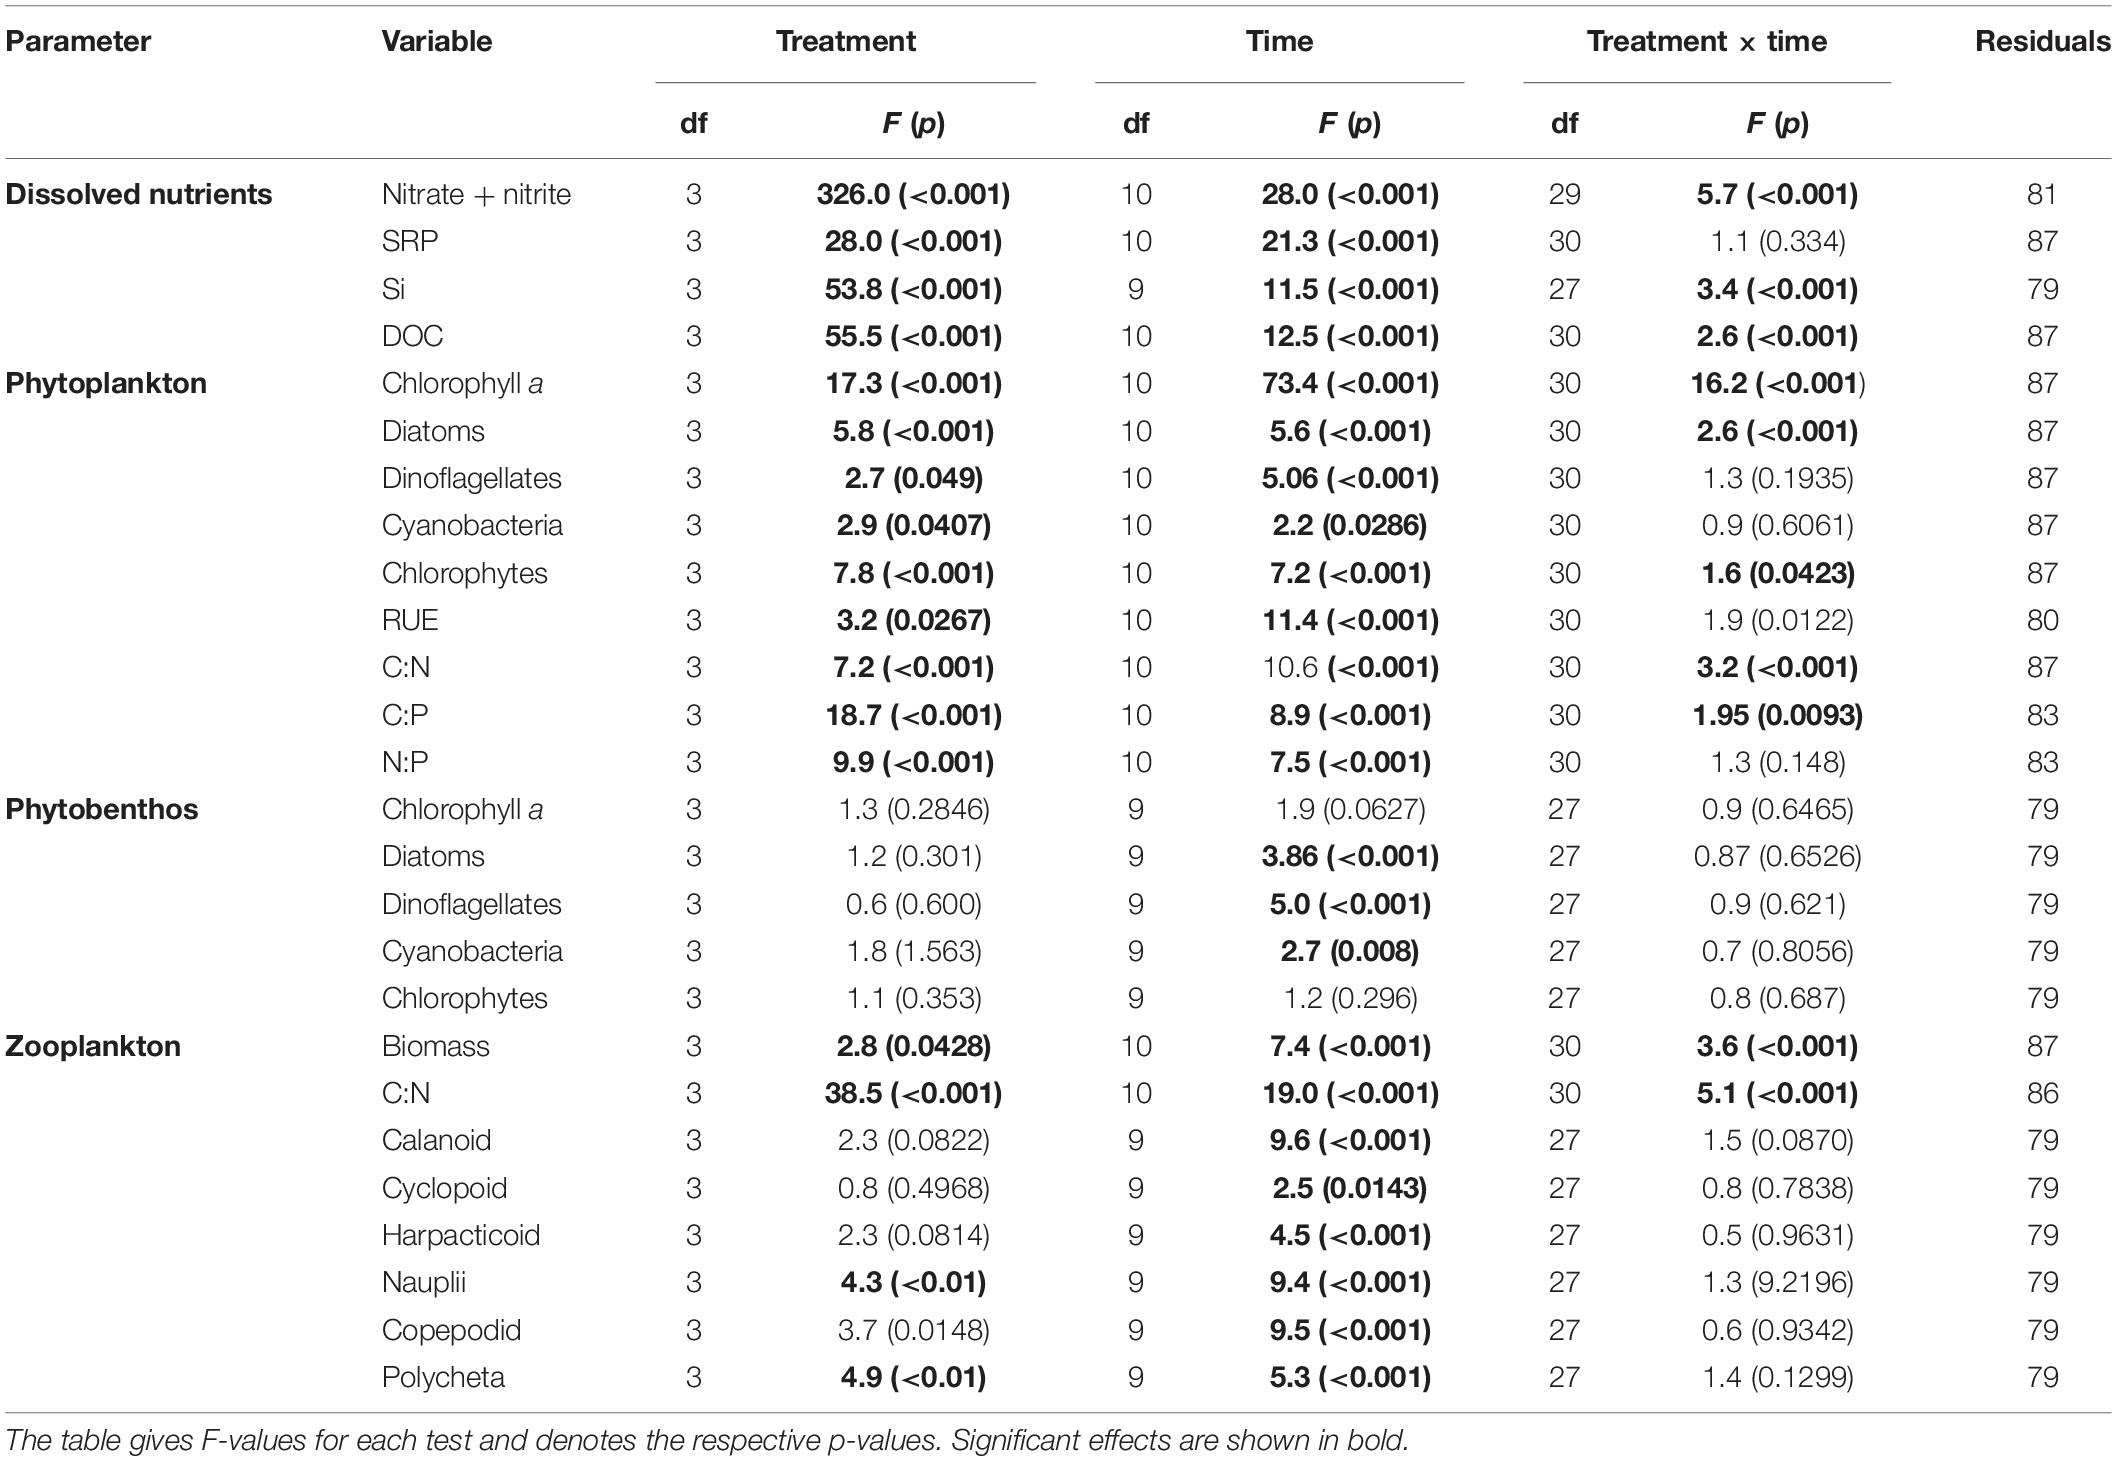
Table 1. Summary of repeated measures ANOVA model, showing the effect of treatment (tDOM addition), time (using “day”) and their interaction.
Phytoplankton biomass (here as chlorophyll a concentration) was significantly affected by tDOM addition and this effect changes over time (treatment × time interaction, Table 1 and Figure 3A). While chlorophyll a concentrations were highest in the control and the “low tDOM” treatment in the first half of the experiment (days 4–11, see Table 2 for comparison of treatments), chlorophyll a concentrations were higher in the “medium tDOM” treatment in the second half (days 28–35) while the “high tDOM” treatment generally showed the lowest chlorophyll a concentrations (Figure 3A and Table 2).
Treatment effects could also be observed for RUE (Table 1), whereby the “high tDOM” showed the lowest RUE (Figure 3B). In general, the RUE increased during the experiment (Table 1, significant effect of time) except for the last 2 days. In terms of stoichiometry, the C:N ratios decreased significantly over time (Table 1 and Figure 3C) and were lower in the control (Table 1 and Figure 3C). Meanwhile, C:P and N:P ratios (Figures 3D,E) were higher in the “medium tDOM” and “high tDOM” treatments (especially in the first half of the experiment) and generally higher with higher tDOM addition (treatment effect, Table 1 and Figure 3). Both ratios decreased over time but were highest on the last day (Table 1 and Figures 3D,E).
The effect of tDOM addition and time were observed for all phytoplankton groups (Table 1). Initially, diatoms and chrysophytes were dominant based on the relative pigment amounts in all treatments (Figure 4A). Diatoms were negatively affected by tDOM addition (treatment effect, Table 1) and their relative amount decreased over time (effect of time, Table 1 and Figure 4). By contrast, chlorophytes (Figure 4C) increased over time (effect of time, Table 1). While dinoflagellates and cryptophytes (Figure 4B) were lowest in the control, chlorophytes were lowest in the “high tDOM” treatment. Cyanobacteria (Figure 4D) relative pigment concentrations were low in all treatments (<5%) and but were higher in the control treatment (Figure 4D and Table 1).
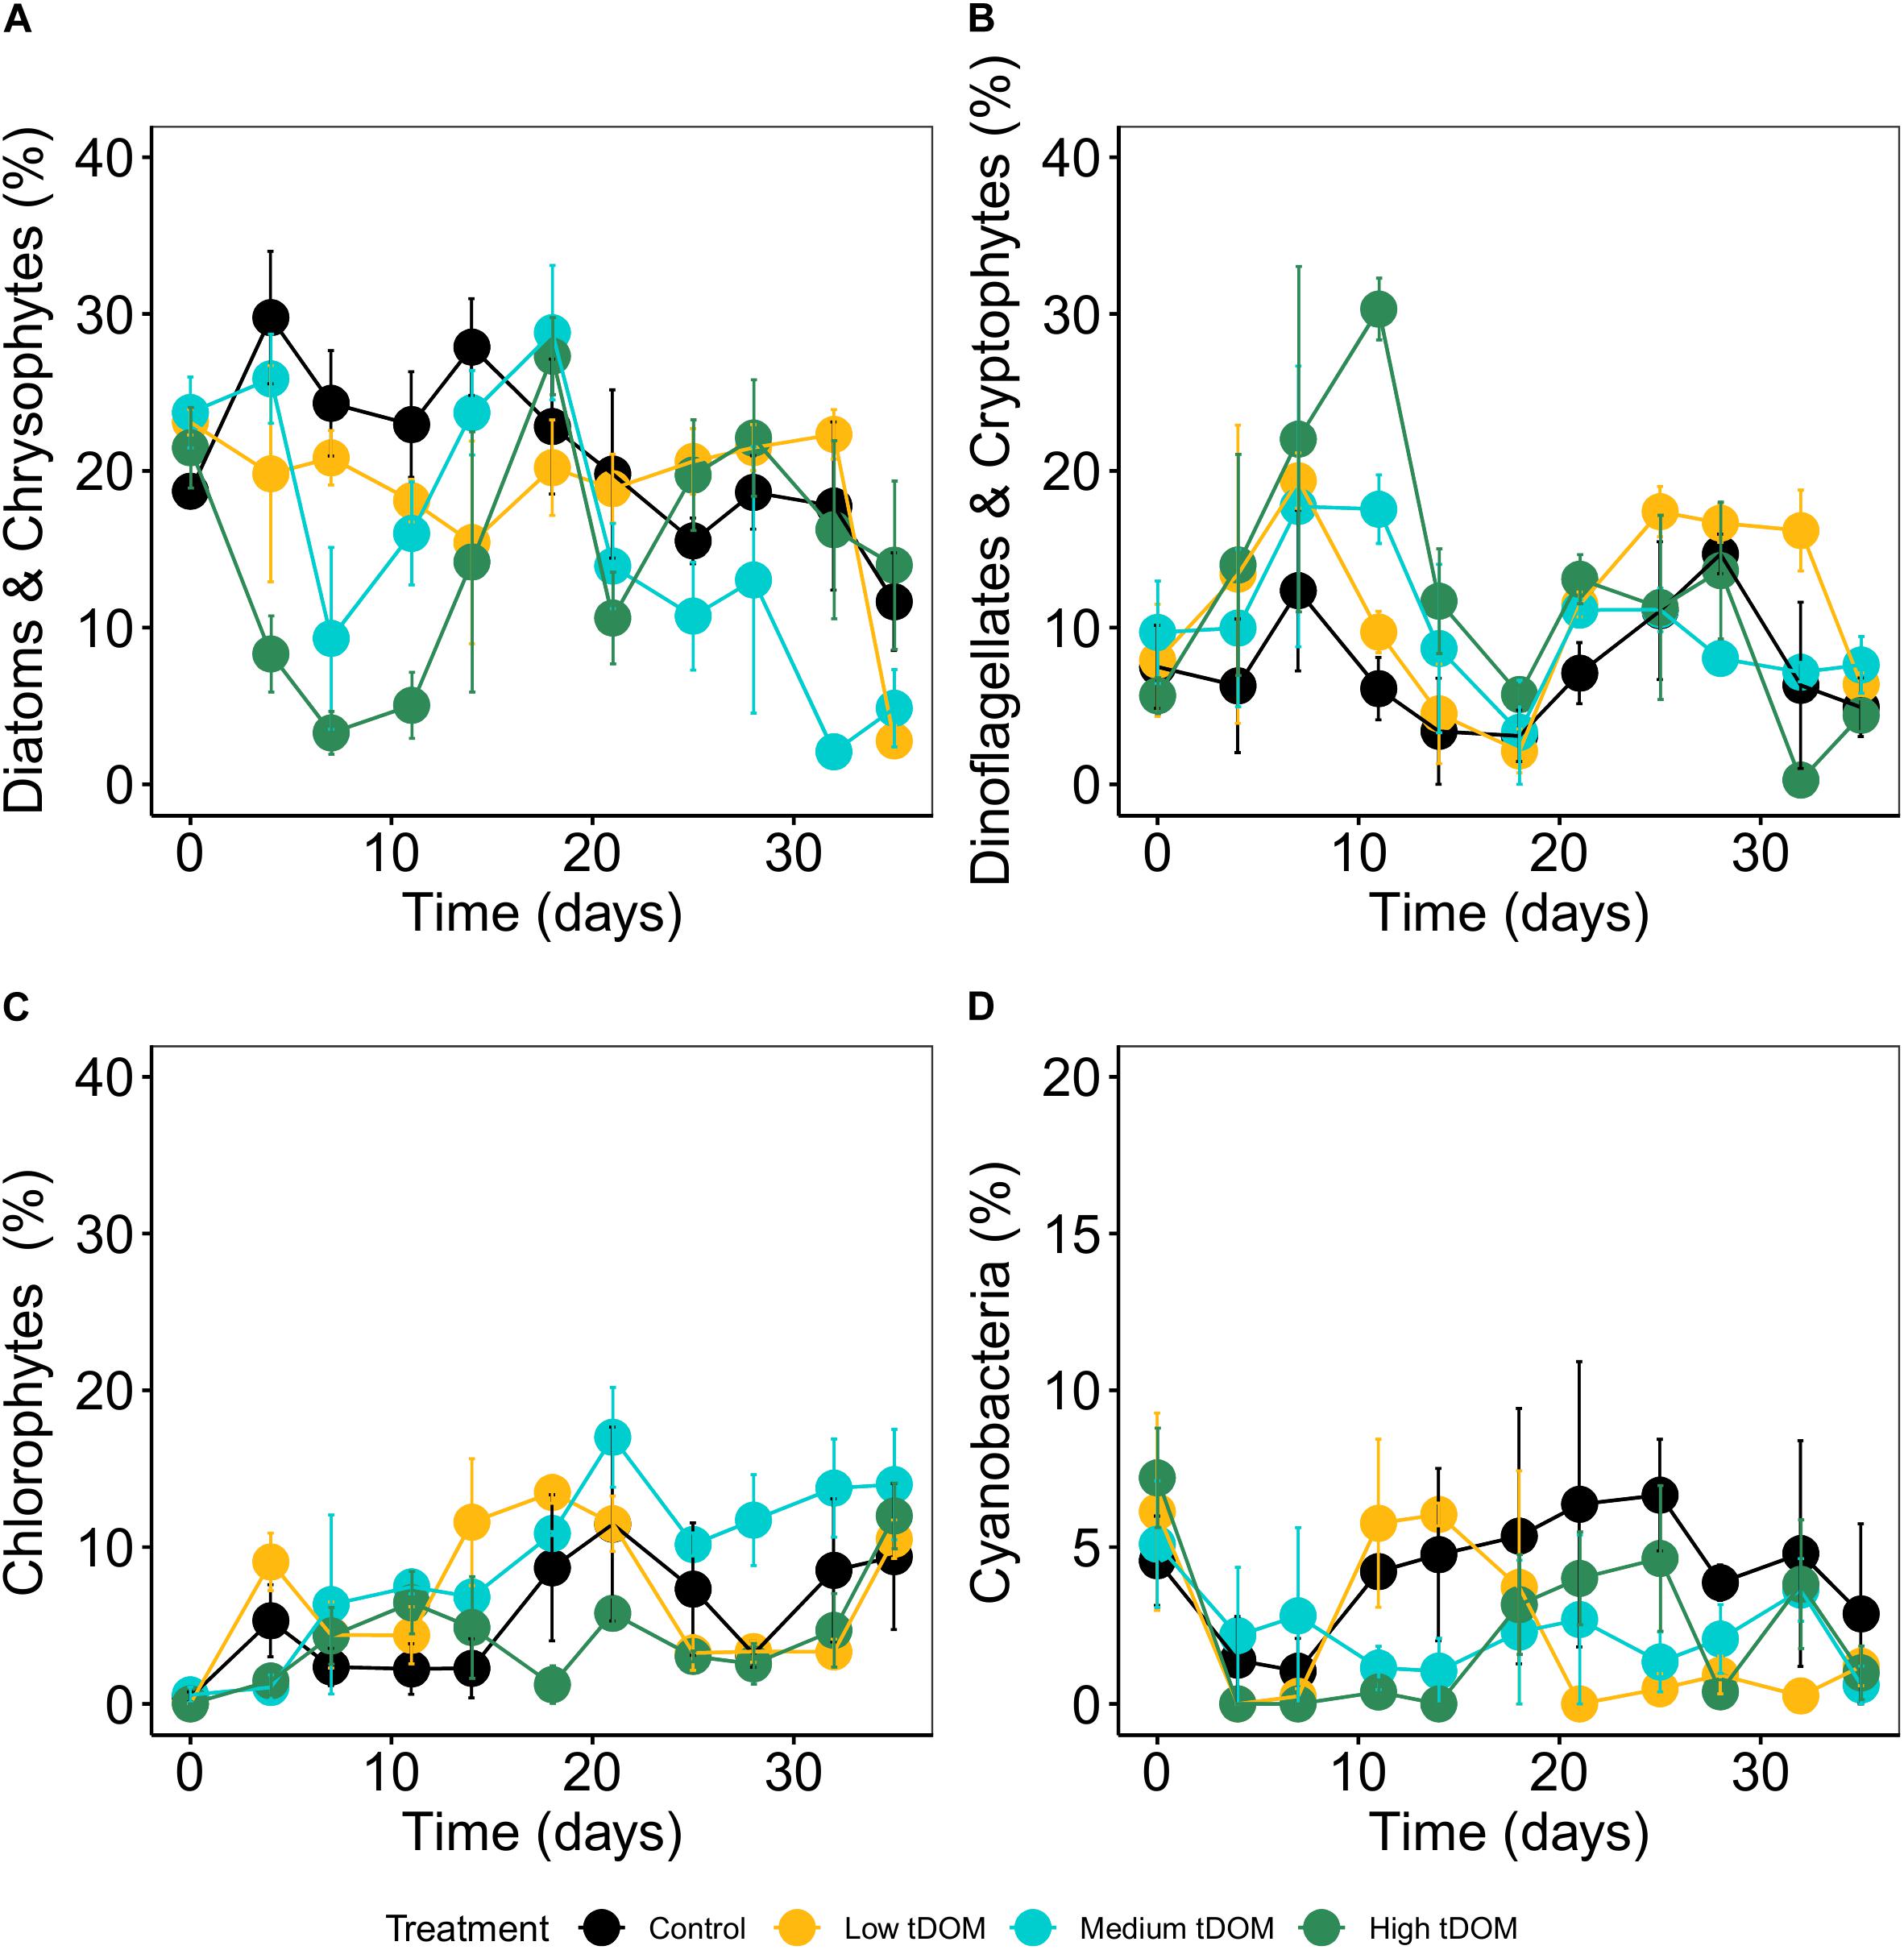
Figure 4. Relative abundance of phytoplankton (%) specific pigment signature compositions over 35 days of the experiment. (A) Diatom and chrysophytes, (B) dinoflagellates and cryptophytes, (C) chlorophytes and (D) cyanobacteria. Error bars represent standard deviation. Color plots represent tDOM addition in the control (black), low tDOM (yellow), medium tDOM (blue), and high tDOM (green) treatments.
Phytoplankton biomass in all treatments was not significantly correlated with phytobenthos biomass which, could have indicated a direct interaction (Supplementary Figure 5). Neither phytobenthos biomass (Figure 5) nor its composition was significantly affected by tDOM addition (Table 1) but the effects of “time” were observed. The concentrations measured for benthic pigments were low in most samples and highly variable between replicates and over time (Figure 6).
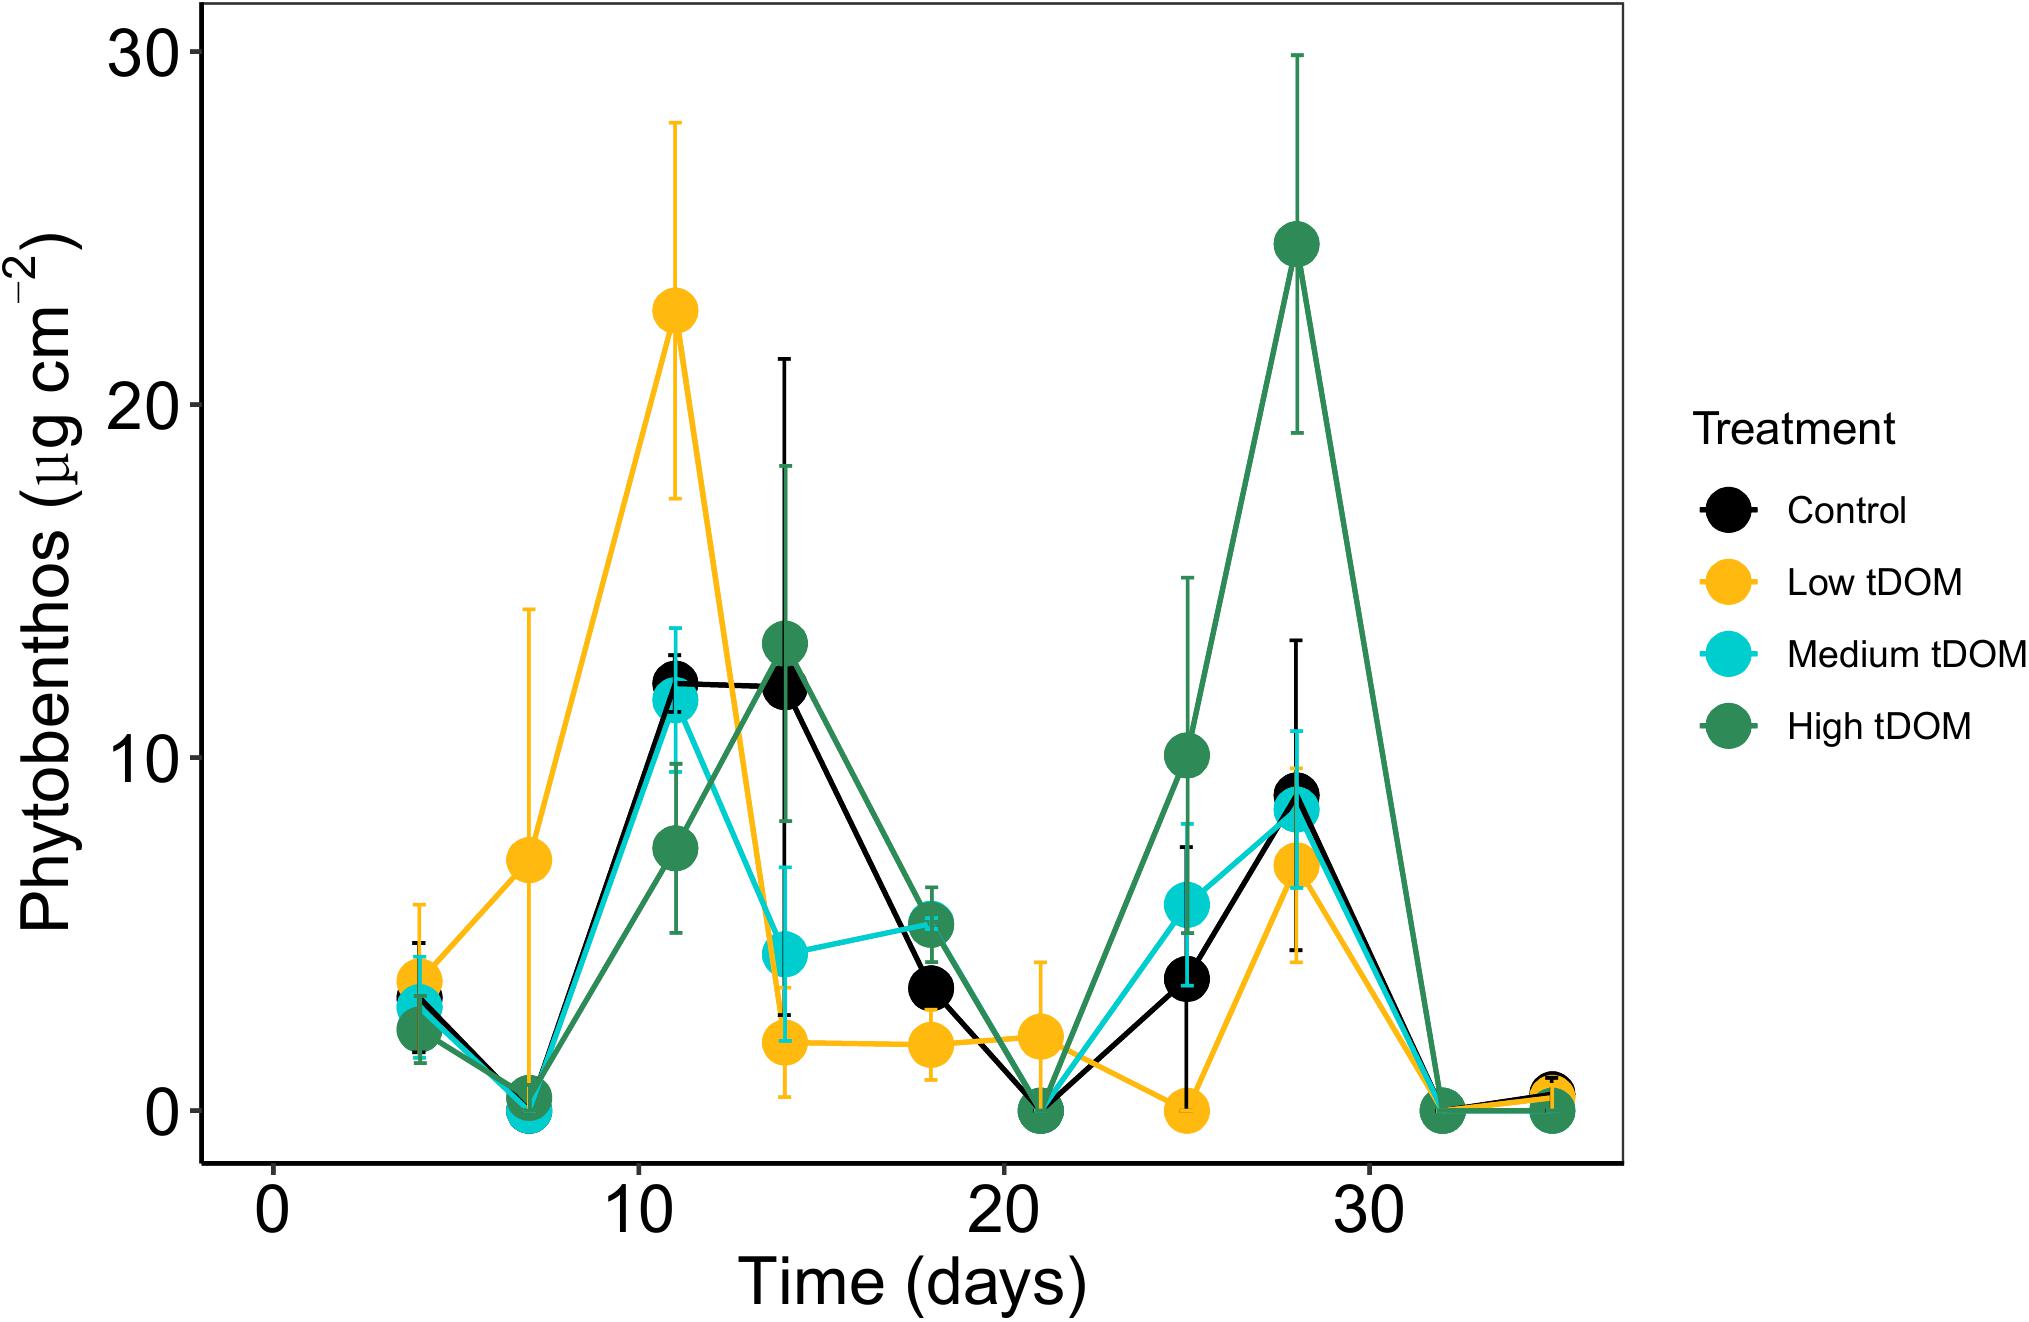
Figure 5. Average of phytobenthos biomass (Chl a in μg cm–2) over 35 days of the experiment. Error bars represent standard deviation. Color plots represent tDOM addition in the control (black), low tDOM (yellow), medium tDOM (blue), and high tDOM (green) treatments.
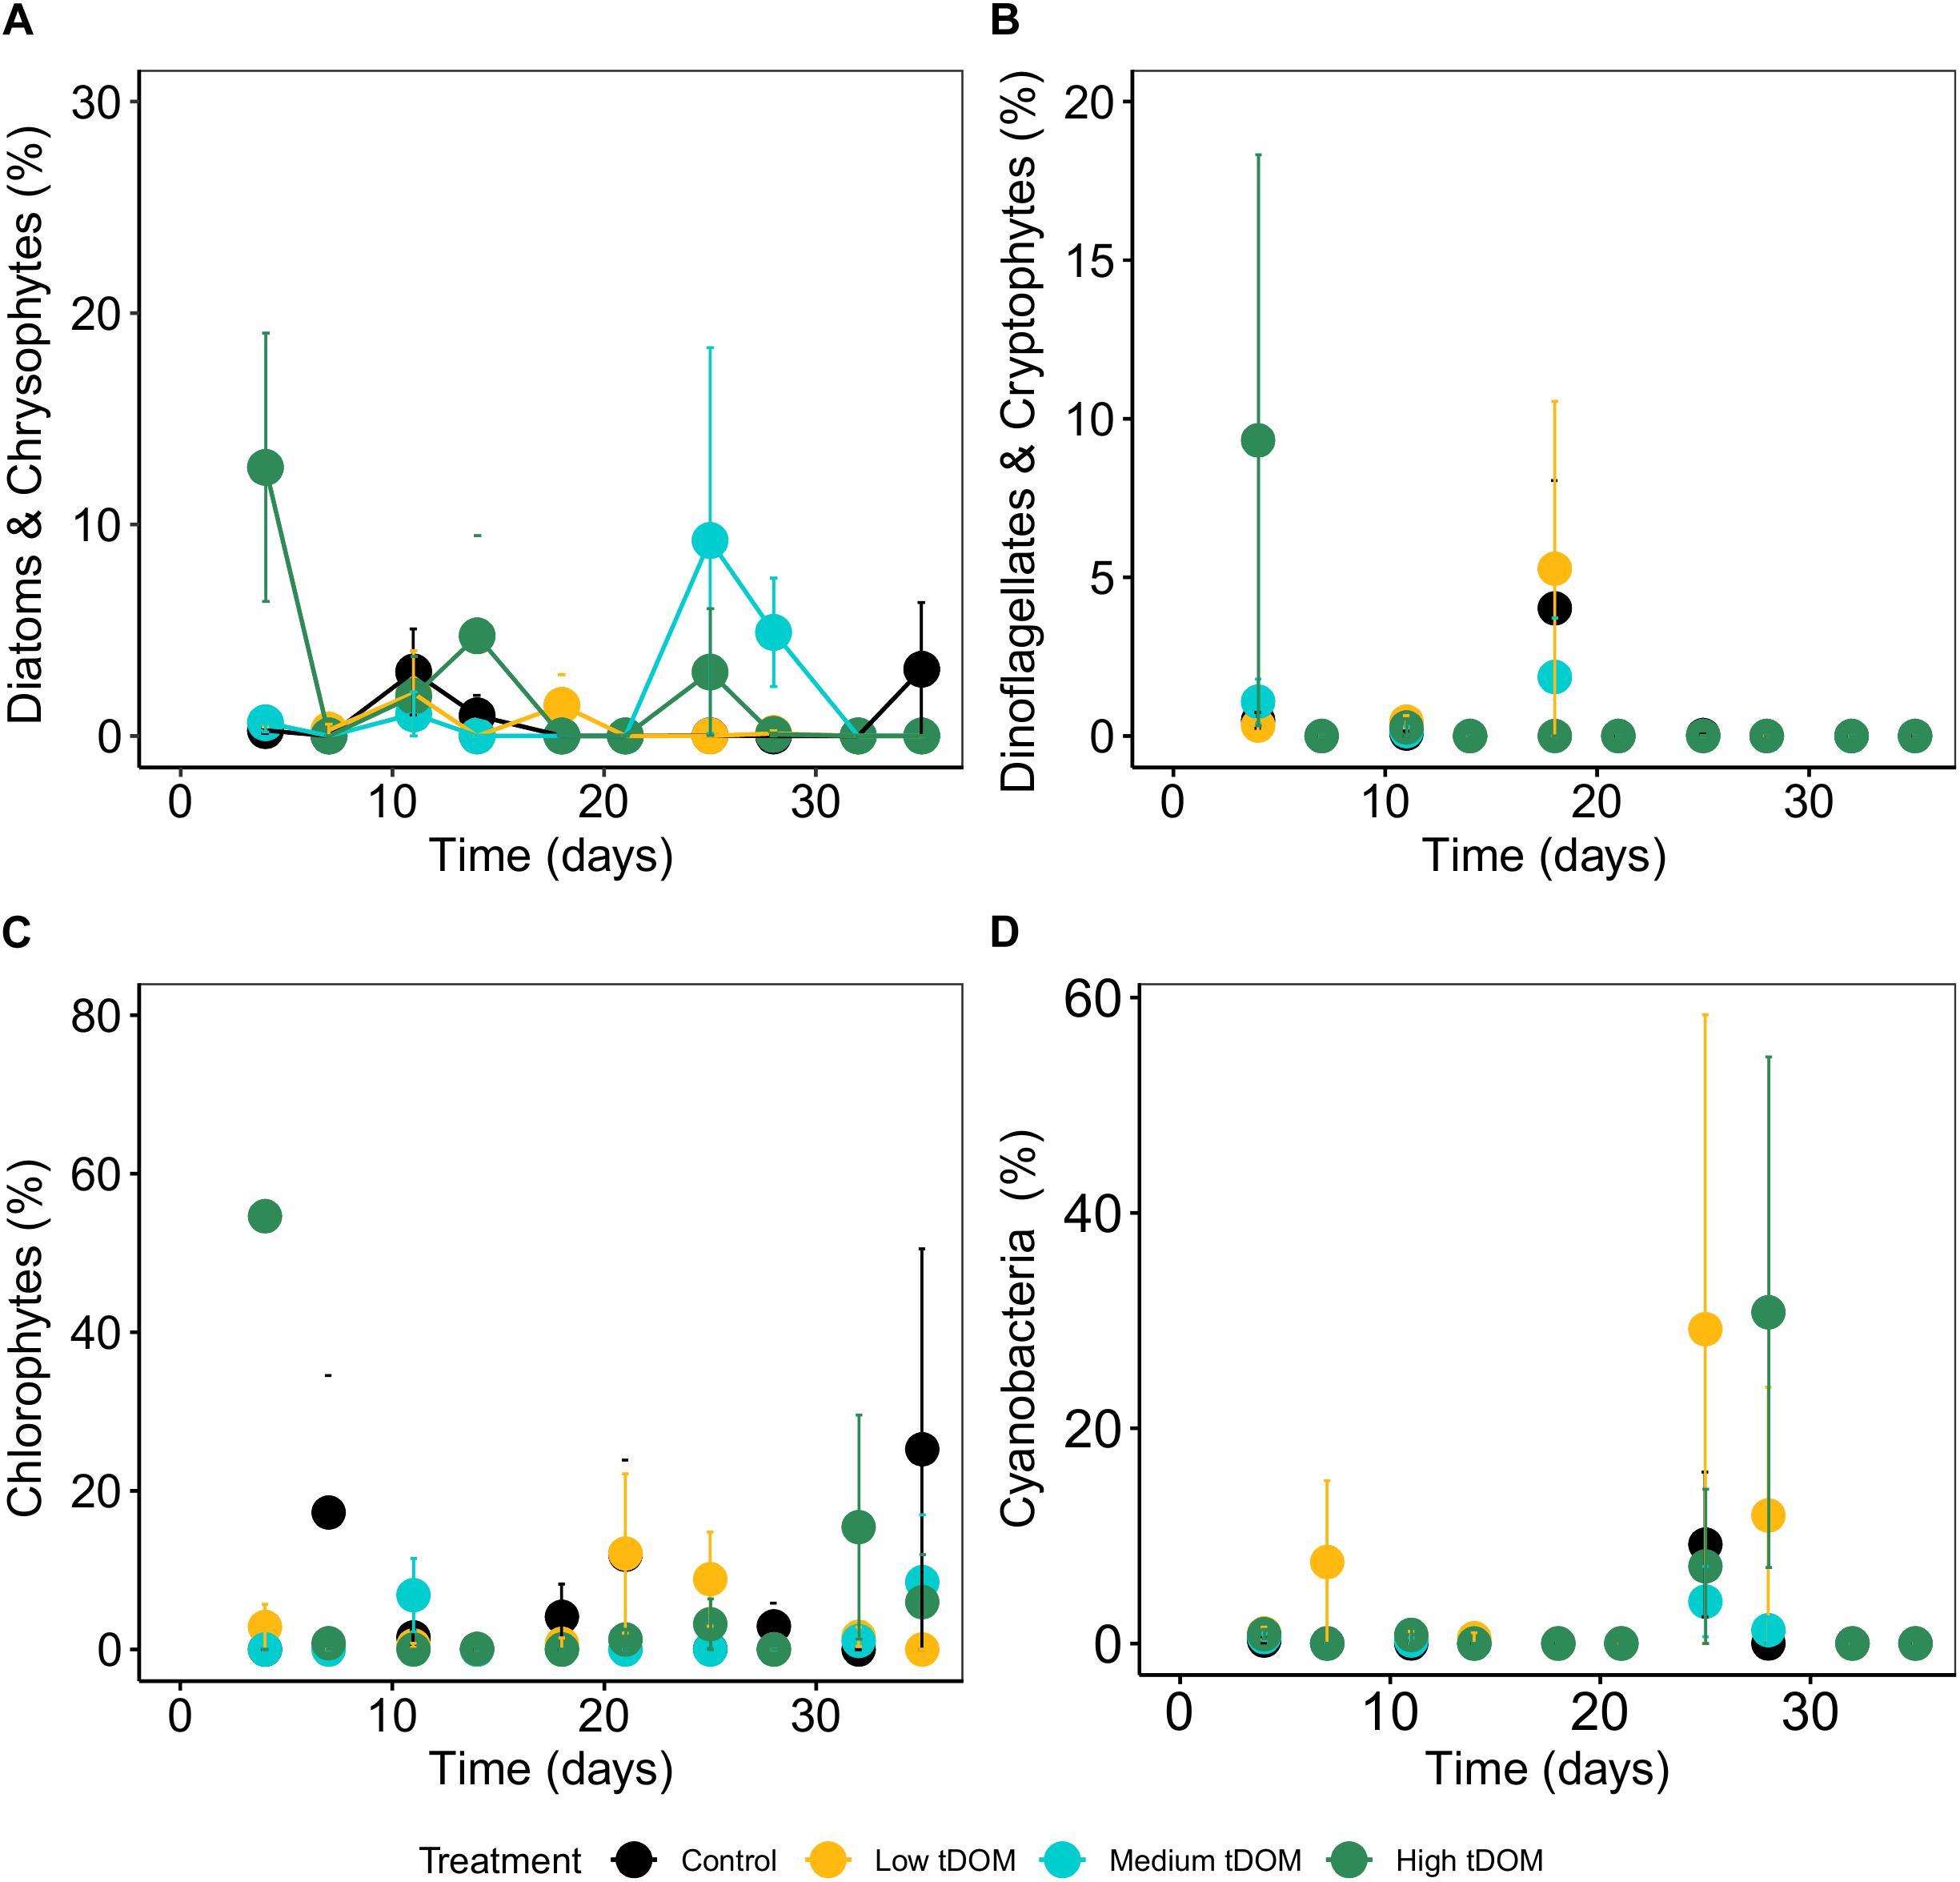
Figure 6. Relative abundance of phytobenthos specific pigment signature composition (%) over 35 days of the experiment. (A) Diatom and chrysophytes, (B) dinoflagellates and cryptophytes, (C) chlorophytes and (D) cyanobacteria. Error bars represent standard deviation. Color plots represent tDOM addition in the control (black), low tDOM (yellow), medium tDOM (blue), and high tDOM (green) treatments.
Zooplankton biomass (C μmol L–1) and molar C:N ratios were affected by tDOM addition and time (Table 1 and Figure 7). Zooplankton biomass was lowest in the “low tDOM” treatment while C:N ratios were lowest in the control and increased with higher tDOM addition (Table 1 and Figure 7). In terms of zooplankton community composition, microscopic analysis revealed that the community consisted mainly of calanoid copepods, polychetes, and cyclopoid copepods, while the abundance of juvenile copepods (copepodites) remained low throughout the experiment (Figure 8). Copepod nauplii were highly abundant in all treatments during the whole experiment and showed a treatment effect (Table 1). Most zooplankton groups, except Nauplii and Polycheta (Table 1), did not show significant treatment effects, but their relative abundance changed over time (significant effect of time, Table 1). The copepodites significantly decreased in all treatments during the second half of the experiment (significant effect of time, Table 1). By the end of the experiment, calanoids copepods dominated in both the “low tDOM” and “high tDOM” treatments, meanwhile, nauplii larvae dominated in the “medium tDOM” and “high tDOM” treatments.
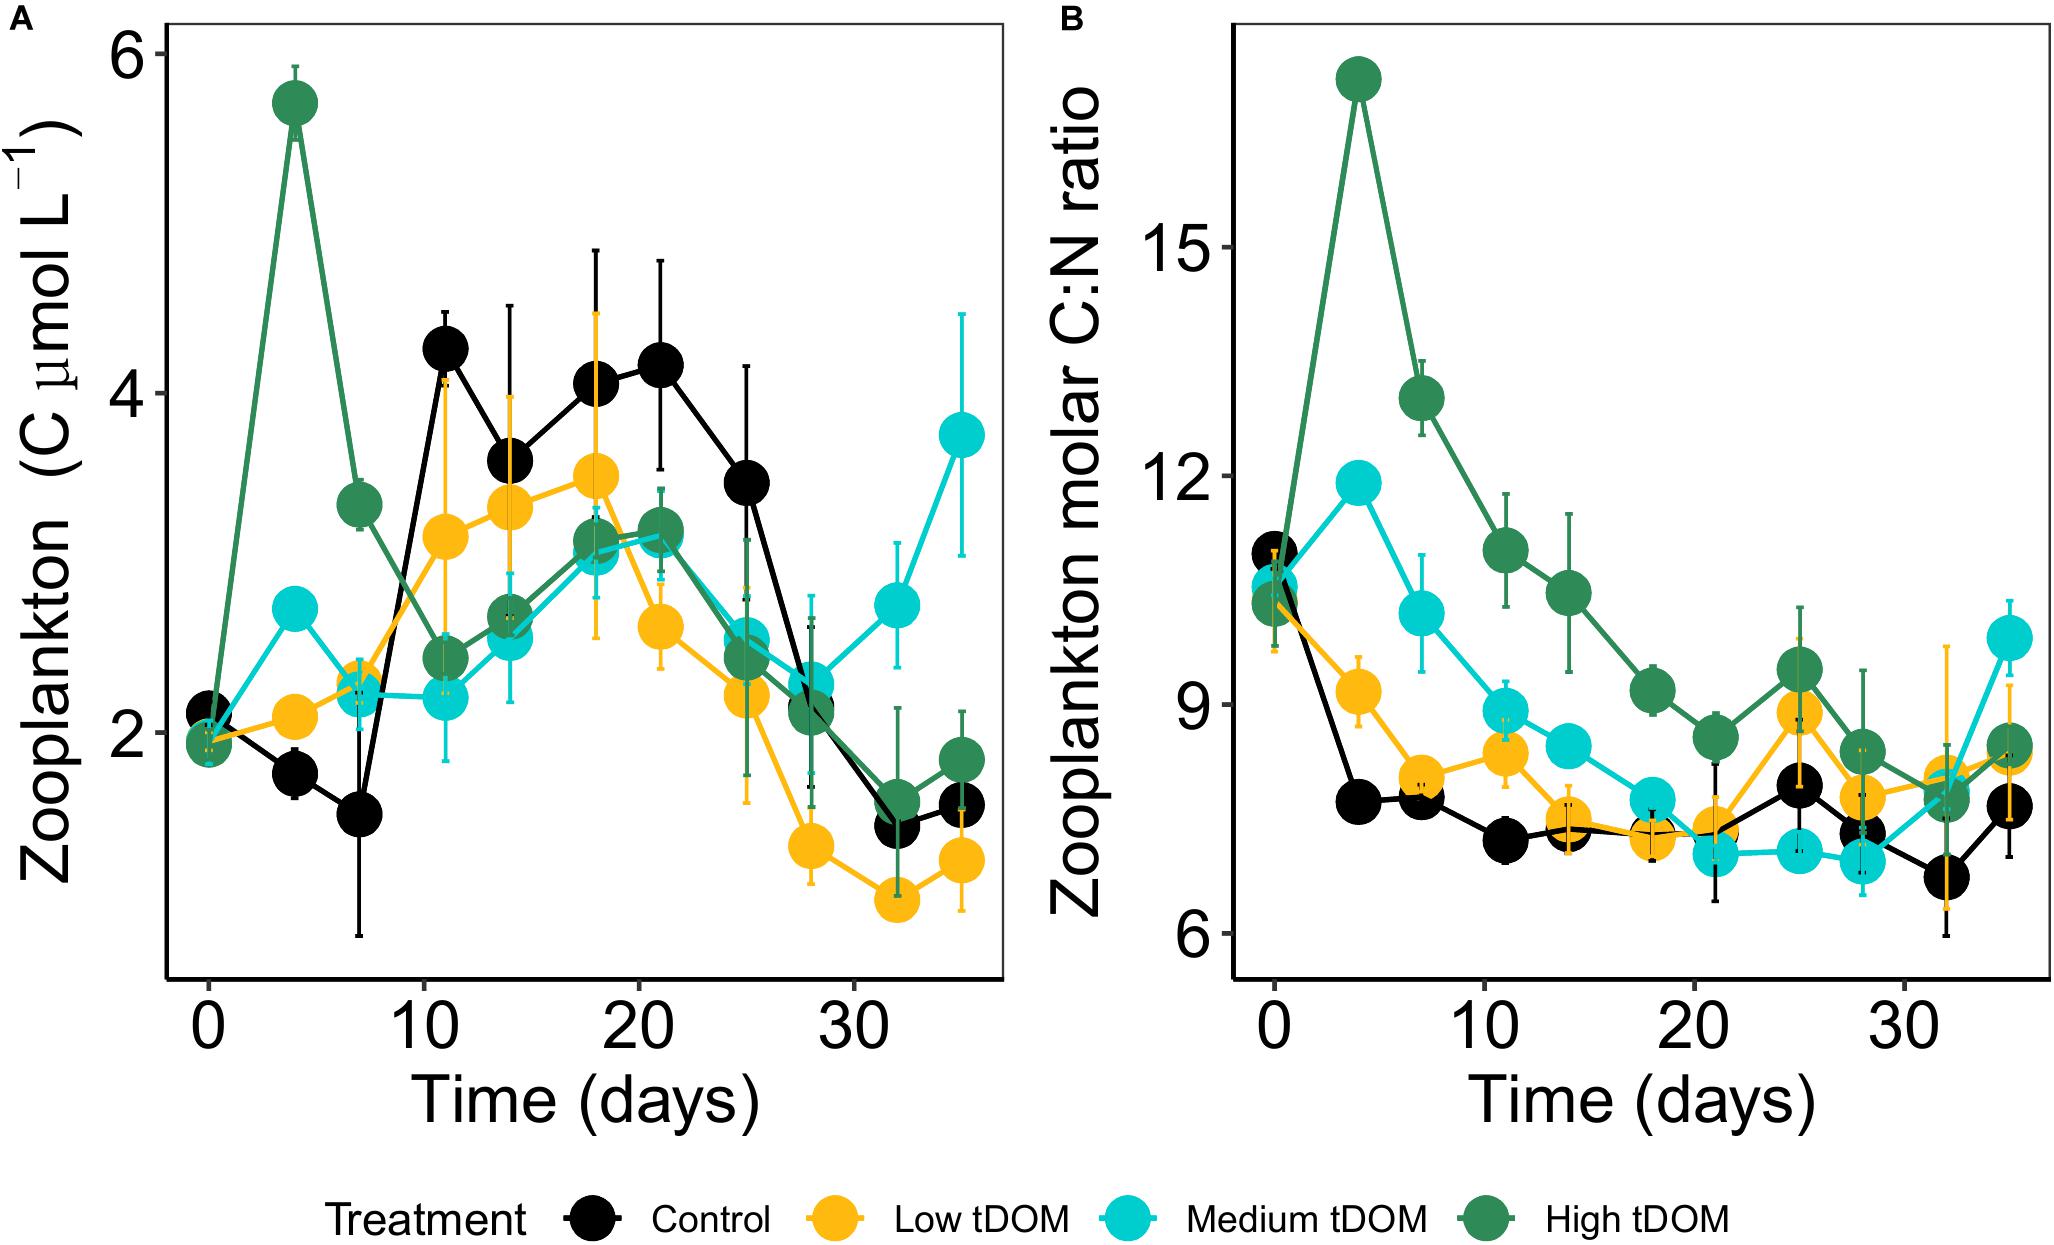
Figure 7. (A) Average dry zooplankton biomass (C μmol L–1) and (B) zooplankton C:N ratio over 35 days of the experiment. Error bars represent standard deviation. Color plots represent tDOM addition in the control (black), low tDOM (yellow), medium tDOM (blue), and high tDOM (green) treatments.
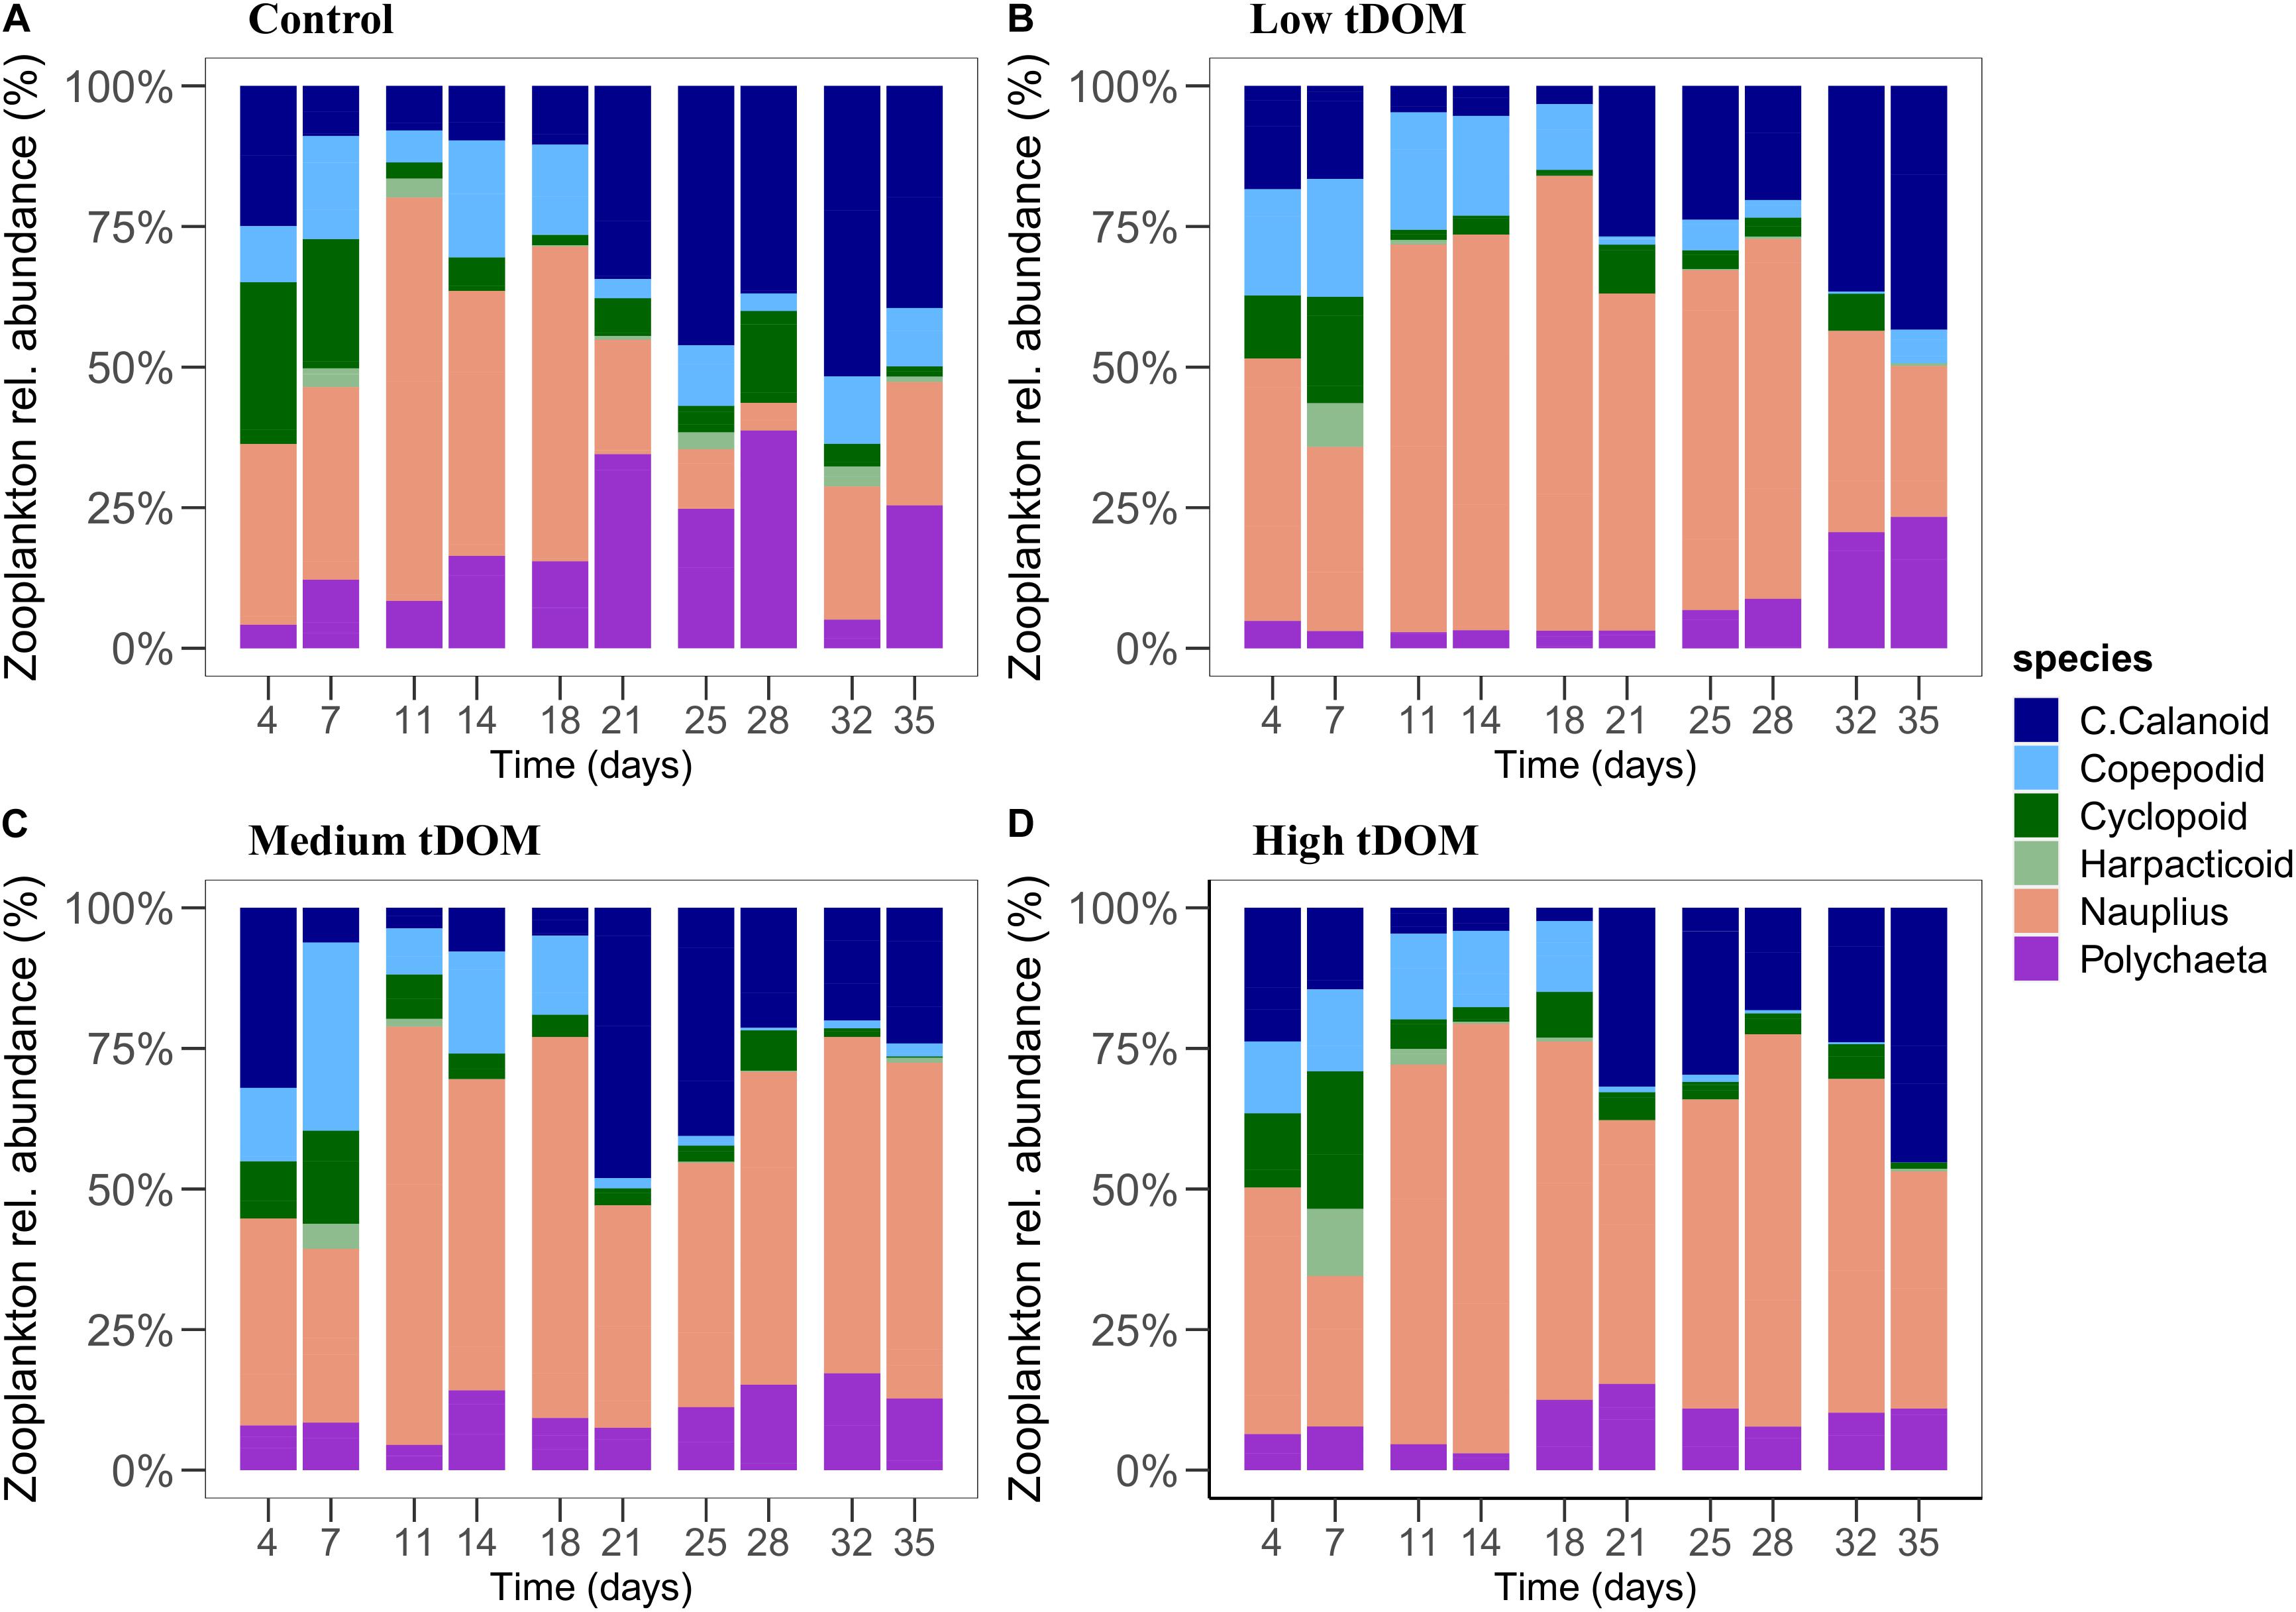
Figure 8. Zooplankton relative abundance (%) of the different treatments over 35 days of the experiment. Panels (A–D) represent control, low tDOM, medium tDOM, and high tDOM treatments, respectively.
Light reduction was achieved by adding tDOM which reduced light availability between 27% and 86%. Results showed that phytoplankton biomass increased in all treatments during the experiment, while the biomass was slightly higher in the control and “low tDOM” treatments during the first half of the experiment and lowest in the “high tDOM” treatment. Reduced light availability due to tDOM addition in the “medium tDOM” and “high tDOM” treatments might have limited the phytoplankton growth via shading while the higher light availability, as well as the supply of directly bioavailable dissolved nutrients, might have favored phytoplankton growth in the control and “low tDOM” treatment. Klug (2002) suggested that the net effect on phytoplankton biomass depends on the concentration and availability of nutrients associated with tDOM as well as the physiological status of the phytoplankton community. Overall, our results are consistent with other studies (Bartels et al., 2012; Gall et al., 2017) where different tDOM concentrations affected phytoplankton biomass over time and phytoplankton biomass was significantly lower in higher tDOM treatments (supporting H1) (Jones, 1992; Thrane et al., 2014). However, phytoplankton biomass in the “medium tDOM” treatment increased from day 18 until the end of the experiment, potentially due to the high dissolved nutrient concentration available in the “medium tDOM” and the comparably lower shading effect (Figure 3; Traving et al., 2017). In general, we conclude that the shading effect of tDOM was stronger during the first half (<18 days) of the experiment (supporting H1) and was reduced over time potentially due to degradation of tDOM in the water column as shown by decreased absorption coefficient in all tDOM treatments (Figure 1B). Degradation of tDOM in the water column could be due to microbial utilization and flocculation followed by sedimentation (Tranvik, 1998). Limited data on bacterial abundance is available in Supplementary Figure 6. Previous studies showed that tDOM addition can stimulate bacterial production especially when nutrients are scarce (Tranvik, 1998; Gall et al., 2017). Moreover, lability of tDOM changes through bacterial utilization and thus may affect tDOM shading properties (Tranvik, 1988; Wikner and Andersson, 2012). In general, the presence of heterotrophic bacteria plays an important role in this process.
We found lower RUE in the “high tDOM” treatment during the first half of the experiment (significant effect treatment × time). The cellular and individual RUE are mainly characterized by the functional response of resource uptake to resource supply, dependent on an increase in uptake as well as luxury consumption and storage of resource supply (Hodapp et al., 2019). Therefore, increasing RUE indicates decreasing resource supply (Niu et al., 2011) as shown by the decrease in SRP concentration in our study. Our results are in agreement with previous studies that found increasing RUE was due to the decrease in nutrient availability (Bridgham et al., 1995). In contrast, Verbeek et al. (2018) showed that high nutrient availability led to an increase in RUE.
tDOM addition can change the water color to yellow or brown and potentially shift the light spectrum away from the blue wavelengths that are most useful to algae toward a predominance of yellow to red wavelengths (Suthers and Rissik, 2009) which in turn affects community composition. Changes in phytoplankton composition were observed in most treatments (treatment effects on all phytoplankton groups), especially over time. However, as these changes in community composition predominantly occurred over time, we could not clearly distinguish between “time” and “tDOM” effects. Thus, our finding generally supports the hypothesis (H1) that different tDOM concentrations could lead to shifts in species composition due to species-specific growth-irradiance curves and pigment composition (Kirk, 2011). While clear effects of tDOM on chrysophytes were observed by Lefebure et al. (2013), our results indicate an effect of tDOM on diatoms that is dependent on time (treatment × time). It is known that diatoms and dinoflagellates are able to adapt and grow at low light condition by increasing their content of Peridinin-Chlorophyll α-Proteins to maintain their cellular photosynthetic capacity (Prézelin, 1976; Falkowski and Owens, 1980) which might have occurred in this experiment. Chlorophytes showed an increase in the “medium tDOM” over time, particularly after half of the experiment (treatment × time interaction). However, our result is contrary to Deininger et al. (2016) as they observed a decreasing trend of chlorophytes concentration over time and the chlorophytes were not affected by nutrient enrichment through soil addition. This could be due to the different composition of soil than the tDOM used in our experiment. As for cyanobacteria, the concentration was relatively low during the whole experiment and tDOM addition tended to decrease their concentrations (highest amounts in control compared to other treatments). Lefebure et al. (2013) observed there was no significant effect of tDOM addition on cyanobacteria concentrations collected from the Baltic Sea. Thus, our results suggested that there is a potential of interactive effect between nutrients, light intensity, and spectrum that affect the species in a specific way and thus shifts the community composition. However, more detailed species-specific investigations are needed here.
Despite assuming that phytoplankton and phytobenthos would compete for light and nutrients and thus interactively affect each other, we did not find a significant correlation between phytoplankton and phytobenthos biomass to support their direct interaction (rejecting H2). The lack of interaction between phytoplankton and phytobenthos could be due to zooplankton species found in our study which are phytoplankton feeders. However, we only sampled the pelagic zooplankton and did not determine the benthic habitat for an herbivore to support this assumption. Another reason that there was no clear effect of tDOM addition via nutrient or light on phytobenthos biomass (rejecting H2) could be the tidal cycle during our experiment. We expected that phytobenthos biomass would be negatively affected as tDOM-contained water would increase the shading effect. However, by reducing the water column during low tide, light availability increased and might have been sufficient for phytobenthos. Furthermore, phytobenthos has been reported to be tolerant toward shading (Barranguet et al., 1998; Gattuso et al., 2006). Besides, the primary production of benthic algae in intertidal systems is also dependent on the coarse size of the sediment (Billerbeck et al., 2007). The missing significant correlation between phytoplankton and phytobenthos biomass could also be because their response toward nutrient and light changes are in different time scales. For instance, Bonilla et al. (2005) observed phytoplankton biomass increased by 19-fold after 2 weeks of the nutrient-enriched experiment, but phytobenthos biomass did not respond to nutrient enrichment at least over timescales of days to weeks.
Phytobenthos composition indicates the ecological status in the aquatic ecosystem. Bergamasco et al. (2003) showed that the hydrodynamics of the tidal current can stimulate benthic diatom production and affect the flux of nutrients from the sediment through resuspension of the topmost layer and consequent release of pore water. Benthic dinoflagellates and cryptophytes were rarely detected, probably due to their movement to the water column during low tide stimulation. Changes in the composition over time were not detected, and these data should be interpreted by keeping in mind the generally low and variable concentrations. It was suggested that the benthic cyanobacteria could have moved into the water column and become a part of phytoplankton when suspended by tidal currents (MacIntyre et al., 1996). Overall, the nutritional status of phytobenthos and phytoplankton showed different responses toward tDOM addition in terms of their biomass and community composition. The results imply that the phytobenthos and phytoplankton may have different strategies toward environmental changes, particularly in terms of nutrient and light changes. Regarding the complex system of coastal environments, more investigations are needed to explore the phytoplankton and phytobenthos interaction to further understand their response toward future eutrophication or coastal darkening.
Changes in phytoplankton biomass consequently modify the zooplankton grazing intensities and selectivity on phytoplankton which in turn may alter phytoplankton species assemblages (Kissman et al., 2013). Similar to phytoplankton biomass, light availability reduction via tDOM addition significantly affected zooplankton biomass (supporting H3). This observation supports our hypothesis that changes in phytoplankton biomass with increasing tDOM concentration directly link to the next trophic level, and food availability appears to be an important factor for copepod abundance. For instance, the trend of phytoplankton biomass was similar to an increase of zooplankton biomass particularly during the first half of the experiment. This observation might be an effect of the bottom-up process due to the transfer of energy and nutrients from phytoplankton to zooplankton. The bottom-up effect should dominate if primary producers receive nutrient subsidies meanwhile top-down grazing processes dominate if high trophic levels received nutrient subsidies (Polis and Strong, 1996). Therefore, increasing food availability during the first half of the experiment may have increased the abundance of zooplankton. This result partly supports H3. In terms of phytoplankton quality as a food resource (here C:N, C:P, and N:P ratios), we observed a decrease in phytoplankton C:N ratios over time reflecting that more particulate N per phytoplankton biomass was available. Zooplankton C:N ratios increased with tDOM addition. tDOM addition resulted in higher phytoplankton C:P and N:P ratios in “medium tDOM” and “high tDOM” treatments, thus indicating lower amounts of P in relation to carbon biomass or N, respectively.
Lower phytoplankton biomass in the control, “low tDOM,” and “high tDOM” treatments were measured after day 28 of the experiment, possibly due to increasing top-down grazing processes of zooplankton. This is supported by an increase in the relative abundance of larger zooplankton (e.g., calanoid copepods instead of smaller development stages) in those treatments. In contrast, increased phytoplankton biomass in the “medium tDOM” treatment after day 28 could be due to a delay (compared to other treatments) of calanoid grazing pressure (Sommer et al., 2003). Although phytoplankton composition changes with tDOM addition, zooplankton composition changed over time but was not directly affected by tDOM driven changes in food availability or quality. It could be that zooplankton composition would have needed more time to respond to the treatment or changes in food sources (Lebret et al., 2018). Overall, we found no clear effect of tDOM addition on zooplankton biomass but changes in zooplankton biomass and composition occurred over time. Given the increasing tDOM input into the water column particularly in the coastal system, our study does support previous observations (Kissman et al., 2013; Lefebure et al., 2013) where the effect of darkening showed strong implications for the higher trophic level. However, stronger effects on zooplankton might occur over longer periods than tested in our experiment or after multiple tDOM additions. As zooplankton constitutes an important connection to the next tropic levels, determining how energy will be transferred via zooplankton will provide further insights to how coastal darkening affects the coastal ecosystem functions.
Our study showed that the shading effect of tDOM addition limited the phytoplankton biomass due to enhanced light absorption by tDOM. Moreover, different tDOM concentrations resulted in differences in the community’s composition potentially due to species-specific light demands and pigment composition. There was no significant treatment effect on the phytobenthos biomass and composition which might be a result of the tidal cycle allowing sufficient light penetration to the sediment surface during low tide. Although tDOM effects on phytoplankton and zooplankton were found, no direct bottom-up effect of tDOM addition via phytoplankton on zooplankton could be observed. With a predicted increase of tDOM input (concentrations and frequency) into the water column leading to further darkening of coastal waters, we propose that darkening of coastal waters will have negative effects on primary producer’s biomass and composition with a consequence to the next trophic level, i.e., zooplankton. However, those tDOM effects are highly dependent on the characteristics of DOM itself (i.e., light attenuation properties, substrate lability, and bio-degradability). Furthermore, multiple disturbance effects via tDOM addition could have more severe and long-lasting effects on aquatic systems than just a single tDOM input as investigated in this study. This highlights the need for more experiments in order to assess the specific effects in each coastal ecosystem.
The raw data supporting the conclusions of this article will be made available by the authors, without undue reservation.
LK and MS designed the experiment in discussion with Oliver Zielinski. NIHM drafted the manuscript. MS, JB, FB, LK, and AS participated in the Planktotron experiment, samples collection, and laboratory analyses. NIHM and MS analyzed the data. All authors contributed significantly to the manuscript.
This research was funded by the Lower Saxony Ministry of Science and Culture (MWK) through the COD project (Coastal Ocean Darkening – Light availability in the past and future marine environment) (grant number VWZN3175).
The authors declare that the research was conducted in the absence of any commercial or financial relationships that could be construed as a potential conflict of interest.
The Supplementary Material for this article can be found online at: https://www.frontiersin.org/articles/10.3389/fmars.2020.547829/full#supplementary-material
Aksnes, D. L., Dupont, N., Staby, A., Fiksen, Ø, Kaartvedt, S., and Aure, J. (2009). Coastal water darkening and implications for mesopelagic regime shifts in Norwegian fjords. Mar. Ecol. Prog. Ser. 387, 39–49. doi: 10.3354/meps08120
Anderson, T. R., Christian, J. R., and Flynn, K. J. (2015). “Chapter 15 - modeling DOM biogeochemistry,” in Biogeochemistry of Marine Dissolved Organic Matter (Second Edition), eds D. A. Hansell and C. A. Carlson (Boston: Academic Press), 635–667. doi: 10.1016/b978-0-12-405940-5.00015-7
Andersson, A., Brugel, S., Paczkowska, J., Rowe, O. F., Figueroa, D., Kratzer, S., et al. (2018). Influence of allochthonous dissolved organic matter on pelagic basal production in a northerly estuary. Estuar. Coast. Shelf Sci. 204, 225–235. doi: 10.1016/j.ecss.2018.02.032
Barranguet, C., Kromkamp, J., and Peene, J. (1998). Factors controlling primary production and photosynthetic characteristics of intertidal microphytobenthos. Mar. Ecol. Prog. Ser. 173, 117–126. doi: 10.3354/meps173117
Bartels, P., Cucherousset, J., Gudasz, C., Jansson, M., Karlsson, J., Persson, L., et al. (2012). Terrestrial subsidies to lake food webs: an experimental approach. Oecologia 168, 807–818. doi: 10.1007/s00442-011-2141-7
Bergamasco, A., De Nat, L., Flindt, M., and Amos, C. (2003). Interactions and feedbacks among phytobenthos, hydrodynamics, nutrient cycling and sediment transport in estuarine ecosystems. Continent. Shelf Res. 23, 1715–1741. doi: 10.1016/j.csr.2003.06.014
Billerbeck, M., Røy, H., Bosselmann, K., and Huettel, M. (2007). Benthic photosynthesis in submerged Wadden Sea intertidal flats. Estuar. Coast. Shelf Sci. 71, 704–716. doi: 10.1016/j.ecss.2006.09.019
Blumenshine, S., Vadeboncoeur, Y., Lodge, D., Cottingham, K., and Knight, S. (1997). Benthic-pelagic links: responses of benthos to water-column nutrient enrichment. J. N. Am. Benthol. Soc. 16, 466–479. doi: 10.2307/1468138
Bonilla, S., Rautio, M., and Vincent, W. F. (2009). Phytoplankton and phytobenthos pigment strategies: implications for algal survival in the changing Arctic. Polar Biol. 32, 1293–1303. doi: 10.1007/s00300-009-0626-1
Bonilla, S., Villeneuve, V., and Vincent, W. F. (2005). Benthic and planktonic algal communities in a high arctic lake: Pigment structure and contrasting responses to nutrient enrichment. J. Phycol. 41, 1120–1130. doi: 10.1111/j.1529-8817.2005.00154.x
Boyce, D. G., Lewis, M. R., and Worm, B. (2010). Global phytoplankton decline over the past century. Nature 466:591. doi: 10.1038/nature09268
Bridgham, S. D., Pastor, J., Mcclaugherty, C. A., and Richardson, C. J. (1995). Nutrient-use efficiency: a litterfall index, a model, and a test along a nutrient-availability gradient in North Carolina peatlands. Am. Nat. 145, 1–21. doi: 10.1086/285725
Capuzzo, E., Lynam, C. P., Barry, J., Stephens, D., Forster, R. M., Greenwood, N., et al. (2018). A decline in primary production in the North Sea over 25 years, associated with reductions in zooplankton abundance and fish stock recruitment. Glob. Change Biol. 24, e352–e364.
Capuzzo, E., Stephens, D., Silva, T., Barry, J., and Forster, R. M. (2015). Decrease in water clarity of the southern and central North Sea during the 20th century. Glob. Change Biol. 21, 2206–2214. doi: 10.1111/gcb.12854
Carlson, C. A., and Hansell, D. A. (2015). “Chapter 3 - DOM sources, sinks, reactivity, and budgets,” in Biogeochemistry of Marine Dissolved Organic Matter (Second Edition), eds D. A. Hansell and C. A. Carlson (Boston: Academic Press), 65–126. doi: 10.1016/b978-0-12-405940-5.00003-0
Coble, P. G. (2007). Marine optical biogeochemistry: the chemistry of ocean color. Chem. Rev. 107, 402–418. doi: 10.1021/cr0503502B
Cole, J. J., Carpenter, S. R., Kitchell, J., Pace, M. L., Solomon, C. T., and Weidel, B. (2011). Strong evidence for terrestrial support of zooplankton in small lakes based on stable isotopes of carbon, nitrogen, and hydrogen. Proc. Natl. Acad. Sci. U.S.A. 108, 1975–1980. doi: 10.1073/pnas.1012807108
de Wit, H. A., Valinia, S., Weyhenmeyer, G. A., Futter, M. N., Kortelainen, P., Austnes, K., et al. (2016). Current browning of surface waters will be further promoted by wetter climate. Environ. Sci. Technol. Lett. 3, 430–435. doi: 10.1021/acs.estlett.6b00396
Deininger, A., Faithfull, C. L., and Bergström, A.-K. (2017a). Nitrogen effects on the pelagic food web are modified by dissolved organic carbon. Oecologia 184, 901–916. doi: 10.1007/s00442-017-3921-5
Deininger, A., Faithfull, C. L., and Bergström, A. K. (2017b). Phytoplankton response to whole lake inorganic N fertilization along a gradient in dissolved organic carbon. Ecology 98, 982–994. doi: 10.1002/ecy.1758
Deininger, A., Faithfull, C. L., Lange, K., Bayer, T., Vidussi, F., and Liess, A. (2016). Simulated terrestrial runoff triggered a phytoplankton succession and changed seston stoichiometry in coastal lagoon mesocosms. Mar. Environ. Res. 119, 40–50. doi: 10.1016/j.marenvres.2016.05.001
Deininger, A., and Frigstad, H. (2019). Reevaluating the role of organic matter sources for coastal eutrophication, oligotrophication, and ecosystem health. Front. Mar. Sci. 6:210. doi: 10.3389/fmars.2019.00210
Elser, J. J., and Urabe, J. (1999). The stoichiometry of consumer-driven nutrient recycling: theory, observations, and consequences. Ecology 80, 735–751. doi: 10.1890/0012-9658(1999)080[0735:tsocdn]2.0.co;2
Evans, C. D., Chapman, P. J., Clark, J. M., Monteith, D. T., and Cresser, M. S. (2006). Alternative explanations for rising dissolved organic carbon export from organic soils. Glob. Change Biol. 12, 2044–2053. doi: 10.1111/j.1365-2486.2006.01241.x
Faithfull, C., Huss, M., Vrede, T., Karlsson, J., and Bergström, A.-K. (2012). Transfer of bacterial production based on labile carbon to higher trophic levels in an oligotrophic pelagic system. Can. J. Fish. Aquat. Sci. 69, 85–93. doi: 10.1139/f2011-142
Falkowski, P. G., and Owens, T. G. (1980). Light—Shade Adaptation : two strategies in marine phytoplankton. Plant Physiol. 66, 592–595. doi: 10.1104/pp.66.4.592
Fleming-Lehtinen, V., and Laamanen, M. (2012). Long-term changes in Secchi depth and the role of phytoplankton in explaining light attenuation in the Baltic Sea. Estuar. Coast. Shelf Sci. 102, 1–10. doi: 10.1016/j.ecss.2012.02.015
Gall, A., Uebel, U., Ebensen, U., Hillebrand, H., Meier, S., Singer, G., et al. (2017). Planktotrons: a novel indoor mesocosm facility for aquatic biodiversity and food web research. Limnol. Oceanogr. Methods 15, 663–677. doi: 10.1002/lom3.10196
Gattuso, J. P., Gentili, B., Duarte, C. M., Kleypas, J. A., Middelburg, J. J., and Antoine, D. (2006). Light availability in the coastal ocean: impact on the distribution of benthic photosynthetic organisms and their contribution to primary production. Biogeosciences 3, 489–513. doi: 10.5194/bg-3-489-2006
Grasshoff, K., Kremling, K., and Ehrhardt, M. (1999). Methods of Seawater Analysis. Hoboken, NJ: John Wiley & Sons.
Hansson, L. A. (1988). Effects of competitive interactions on the biomass development of planktonic and periphytic algae in lakes 1. Limnol. Oceanogr. 33, 121–128. doi: 10.4319/lo.1988.33.1.0121
Hodapp, D., Hillebrand, H., and Striebel, M. (2019). “Unifying” the concept of resource use efficiency in ecology. Front. Ecol. Evol. 6:233. doi: 10.3389/fevo.2018.00233
Jeffrey, S. W., Wright, S. W., and Zapata, M. (2011). “Microalgal classes and their signature pigments,” in Phytoplankton Pigments: Characterization, Chemotaxonomy and Applications in Oceanography, eds C. A. Llewellyn, E. S. Egeland, G. Johnsen, and S. Roy (Cambridge, MA: Cambridge University Press), 3–77. doi: 10.1017/cbo9780511732263.004
Jones, R. I. (1992). The influence of humic substances on lacustrine planktonic food chains. Hydrobiologia 229, 73–91. doi: 10.1007/bf00006992
Kemp, W. M., Boynton, W. R., Adolf, J. E., Boesch, D. F., Boicourt, W. C., Brush, G., et al. (2005). Eutrophication of Chesapeake Bay: historical trends and ecological interactions. Mar. Ecol. Prog. Ser. 303, 1–29. doi: 10.3354/meps303001
Kirk, J. T. (2011). Light and Photosynthesis in Aquatic Ecosystems. Cambridge, MA: Cambridge University Press.
Kissman, C. E., Williamson, C. E., Rose, K. C., and Saros, J. E. (2013). Response of phytoplankton in an alpine lake to inputs of dissolved organic matter through nutrient enrichment and trophic forcing. Limnol. Oceanogr. 58, 867–880. doi: 10.4319/lo.2013.58.3.0867
Klug, J. L. (2002). Positive and negative effects of allochthonous dissolved organic matter and inorganic nutrients on phytoplankton growth. Can. J. Fish. Aquat. Sci. 59, 85–95. doi: 10.1139/f01-194
Lebret, K., Langenheder, S., Colinas, N., Östman, Ö, and Lindström, E. S. (2018). Increased water colour affects freshwater plankton communities in a mesocosm study. Aquat. Microb. Ecol. 81, 1–17. doi: 10.3354/ame01858
Lefebure, R., Degerman, R., Andersson, A., Larsson, S., Eriksson, L. O., Båmstedt, U., et al. (2013). Impacts of elevated terrestrial nutrient loads and temperature on pelagic food-web efficiency and fish production. Glob. Change Biol. 19, 1358–1372. doi: 10.1111/gcb.12134
MacIntyre, H. L., Geider, R. J., and Miller, D. C. (1996). Microphytobenthos: the ecological role of the “secret garden” of unvegetated, shallow-water marine habitats. I. Distribution, abundance and primary production. Estuaries 19, 186–201. doi: 10.2307/1352224
Monteith, D. T., Stoddard, J. L., Evans, C. D., De Wit, H. A., Forsius, M., Høgåsen, T., et al. (2007). Dissolved organic carbon trends resulting from changes in atmospheric deposition chemistry. Nature 450:537. doi: 10.1038/nature06316
Niu, S., Xing, X., Zhang, Z., Xia, J., Zhou, X., Song, B., et al. (2011). Water-use efficiency in response to climate change: from leaf to ecosystem in a temperate steppe. Glob. Change Biol. 17, 1073–1082. doi: 10.1111/j.1365-2486.2010.02280.x
Nunes, J. P., Seixas, J., Keizer, J. J., and Ferreira, A. J. D. (2009). Sensitivity of runoff and soil erosion to climate change in two Mediterranean watersheds. Part I: model parameterization and evaluation. Hydrol. Process. 23, 1202–1211. doi: 10.1002/hyp.7247
Paczkowska, J., Brugel, S., Rowe, O., Lefébure, R., Brutemark, A., and Andersson, A. (2020). Response of coastal phytoplankton to high inflows of terrestrial matter. Front. Mar. Sci. 7:80. doi: 10.3389/fmars.2020.00080
Polis, G. A., and Strong, D. R. (1996). Food web complexity and community dynamics. Am. Nat. 147, 813–846. doi: 10.1086/285880
Prézelin, B. B. (1976). The role of peridinin-chlorophyll a-proteins in the photosynthetic light adaption of the marine dinoflagellate, Glenodinium sp. Planta 130, 225–233. doi: 10.1007/bf00387826
Ptacnik, R., Solimini, A. G., Andersen, T., Tamminen, T., Brettum, P., Lepistö, L., et al. (2008). Diversity predicts stability and resource use efficiency in natural phytoplankton communities. Proc. Natl. Acad. Sci. U.S.A. 105, 5134–5138. doi: 10.1073/pnas.0708328105
R Core Team (2019). R: A languagE and Environmental Statistical Computing. Vienna: R Foundation for Statistical Computing.
Riber, H. H., and Wetzel, R. G. (1987). Boundary-layer and internal diffusion effects on phosphorus fluxes in lake periphyton1. Limnol. Oceanogr. 32, 1181–1194. doi: 10.4319/lo.1987.32.6.1181
Riedel, T., Biester, H., and Dittmar, T. (2012). Molecular fractionation of dissolved organic matter with metal salts. Environ. Sci. Technol. 46, 4419–4426. doi: 10.1021/es203901u
Schlüter, L., and Havskum, H. (1997). Phytoplankton pigments in relation to carbon content in phytoplankton communities. Mar. Ecol. Prog. Ser. 155, 55–65. doi: 10.3354/meps155055
Shurin, J. B., Winder, M., Adrian, R., Keller, W., Matthews, B., Paterson, A. M., et al. (2010). Environmental stability and lake zooplankton diversity – contrasting effects of chemical and thermal variability. Ecol. Lett. 13, 453–463. doi: 10.1111/j.1461-0248.2009.01438.x
Sommer, U., Sommer, F., Santer, B., Zöllner, E., Jürgens, K., Jamieson, C., et al. (2003). Daphnia versus copepod impact on summer phytoplankton: functional compensation at both trophic levels. Oecologia 135, 639–647. doi: 10.1007/s00442-003-1214-7
Striebel, M., Kirchmaier, L., and Hingsamer, P. (2013). Different mixing techniques in experimental mesocosms—does mixing affect plankton biomass and community composition? Limnol. Oceanogr. Methods 11, 176–186. doi: 10.4319/lom.2013.11.176
Suthers, I. M., and Rissik, D. (2009). Plankton : A Guide to Their Ecology and Monitoring for Water Quality. Collingwood: CSIRO.
Thrane, J.-E., Hessen, D. O., and Andersen, T. (2014). The absorption of light in lakes: negative impact of dissolved organic carbon on primary productivity. Ecosystems 17, 1040–1052. doi: 10.1007/s10021-014-9776-2
Thrane, J.-E., Kyle, M., Striebel, M., Haande, S., Grung, M., Rohrlack, T., et al. (2015). Spectrophotometric analysis of pigments: a critical assessment of a high-throughput method for analysis of algal pigment mixtures by spectral deconvolution. PLoS One 10:e0137645. doi: 10.1371/journal.pone.0137645
Tranvik, L. J. (1988). Availability of dissolved organic carbon for planktonic bacteria in oligotrophic lakes of differing humic content. Microb. Ecol. 16, 311–322. doi: 10.1007/bf02011702
Tranvik, L. J. (1998). “Degradation of dissolved organic matter in humic waters by bacteria,” in Aquatic Humic Substances, eds D.O. Hessen and L. J. Tranvik (Berlin: Springer), 259–283. doi: 10.1007/978-3-662-03736-2_11
Traving, S. J., Rowe, O., Jakobsen, N. M., Sørensen, H., Dinasquet, J., Stedmon, C. A., et al. (2017). The effect of increased loads of dissolved organic matter on estuarine microbial community composition and function. Front. Microbiol. 8:351. doi: 10.3389/fmicb.2017.00351
Vadeboncoeur, Y., Jeppesen, E., Zanden, M. J. V., Schierup, H.-H., Christoffersen, K., and Lodge, D. M. (2003). From Greenland to green lakes: cultural eutrophication and the loss of benthic pathways in lakes. Limnol. Oceanogr. 48, 1408–1418. doi: 10.4319/lo.2003.48.4.1408
Verbeek, L., Gall, A., Hillebrand, H., and Striebel, M. (2018). Warming and oligotrophication cause shifts in freshwater phytoplankton communities. Glob. Change Biol. 24, 4532–4543. doi: 10.1111/gcb.14337
Wernand, M. R., Hommersom, A., and Van Der Woerd, H. J. (2013). MERIS-based ocean colour classification with the discrete Forel–Ule scale. Ocean Sci. 9, 477–487. doi: 10.5194/os-9-477-2013
Keywords: phytoplankton, phytobenthos, terrigenous dissolved organic matter, coastal darkening, zooplankton, top-down, bottom-up, tidal cycle
Citation: Mustaffa NIH, Kallajoki L, Biederbick J, Binder FI, Schlenker A and Striebel M (2020) Coastal Ocean Darkening Effects via Terrigenous DOM Addition on Plankton: An Indoor Mesocosm Experiment. Front. Mar. Sci. 7:547829. doi: 10.3389/fmars.2020.547829
Received: 31 March 2020; Accepted: 15 September 2020;
Published: 08 October 2020.
Edited by:
Xosé Anxelu G. Morán, King Abdullah University of Science and Technology, Saudi ArabiaReviewed by:
Tzong-Yueh Chen, National Taiwan Ocean University, TaiwanCopyright © 2020 Mustaffa, Kallajoki, Biederbick, Binder, Schlenker and Striebel. This is an open-access article distributed under the terms of the Creative Commons Attribution License (CC BY). The use, distribution or reproduction in other forums is permitted, provided the original author(s) and the copyright owner(s) are credited and that the original publication in this journal is cited, in accordance with accepted academic practice. No use, distribution or reproduction is permitted which does not comply with these terms.
*Correspondence: Nur Ili Hamizah Mustaffa, aWxpZWhhbWl6YWhAZ21haWwuY29t; bnVyLmlsaS5oYW1pemFoLm11c3RhZmZhQHVvbC5kZQ==
†Present address: Nur Ili Hamizah Mustaffa, Department of Earth Sciences and Environment, Faculty of Science and Technology, Universiti Kebangsaan Malaysia, Bangi, Malaysia; Alexandra Schlenker, Department of River Ecology, Helmholtz Centre for Environmental Research (UFZ), Magdeburg, Germany; Institute for Hydrobiology, Technical University of Dresden, Dresden, Germany
Disclaimer: All claims expressed in this article are solely those of the authors and do not necessarily represent those of their affiliated organizations, or those of the publisher, the editors and the reviewers. Any product that may be evaluated in this article or claim that may be made by its manufacturer is not guaranteed or endorsed by the publisher.
Research integrity at Frontiers

Learn more about the work of our research integrity team to safeguard the quality of each article we publish.