 Xuehui Wang
 Yinglin He2
 Feiyan Du
 Yancong Cai
 Yongsong Qiu
- 1South China Sea Fisheries Research Institute, Chinese Academy of Fishery Sciences, Guangzhou, China
- 2China Blue Sustainability Institute, Haikou, China
- 3Guangdong Provincial Key Laboratory of Fishery Ecology and Environment, Guangzhou, China
- 4College of Marine Sciences, Shanghai Ocean University, Shanghai, China
- 5Key Laboratory of Open-Sea Fishery Development, Ministry of Agriculture and Rural Affairs, Guangzhou, China
Based on length frequency data of miter squid (Uroteuthis chinensis) collected in the northeastern South China Sea in 1975–1977, 1997–1999, and 2018–2019, asymptotic length, optimal length at first capture, relative mortality, and relative biomass of the stock were estimated using length-based Bayesian biomass estimation (LBB). The LBB-estimated asymptotic length for 2018–2019 was smaller. Optimal lengths at first capture for the later far exceeded average lengths in catches because of a major increase in fishing intensity. Between 1975 and 1977, relative total mortality (Z/K) was low, but it increased in the latter two periods, while relative natural mortality (M/K) showed a downward trend. Relative biomasses (B/B0 and B/Bmsy) indicated that the stock was close to unexploited between 1975 and 1977, but they declined to the levels of 6% and 4% in the later periods, which correspond to growth in fishing horsepower. Indeed, by 2018, fishing horsepower increased by nearly four times the optimal level. The analysis suggests that the stock of miter squid has been overfished since the mid-1980s and is now under heavy fishing pressure. To recover the stock, it is imperative to reduce fishing intensity and enforce size-at-first-capture regulations.
Introduction
Fishing activity dates back many centuries in coastal waters, but the exploitation of virtually all coastal stocks started to occur around 1990 (Brander, 2013). Increased fishing intensity affects the life histories of fishes and marine invertebrates (henceforth: fish), leading to rapid declines in fish stocks, and it also impacts entire marine ecosystems (Vincent and Hall, 1996; Pauly et al., 1998; Hutchings, 2000; Kuparinen and Merilä, 2007). Due to the over-exploitation of fish stocks, many governments and non-government organizations (NGOs) agree there is a need for science-based management. Science-based fishery management requires evaluation of sustainable fishery catches based on the existing yield, survey, or life history data of target fish (Dick and MacCall, 2011; Costello et al., 2012; Thorson et al., 2013; Froese et al., 2017). However, most fishery stock assessment methods require numerous parameters to be input for estimation, which limits their broad application. Therefore, fishery stock assessment methods that require inputs of simple parameters or variables are beneficial for the development of fishery stock assessments (Froese et al., 2018).
The size composition or length frequency distribution of a fish population has long been used as a data source with which to assess stock status for fishery management (Beverton and Holt, 1957; Pauly and Morgan, 1987; Gulland and Rosenberg, 1992; Wang et al., 2012; Froese et al., 2018), and it has also been used as a major (if not the only) data source to assess fisheries in data-limited situations (Dick and MacCall, 2011; Costello et al., 2012; Martell and Froese, 2013; Thorson et al., 2013; Free et al., 2017; Froese et al., 2017, 2018; Zhou et al., 2017). The length-based Bayesian biomass estimation method (LBB) differs from other methods of fishery stock assessment, as it does not require data on age, maturity, recruitment, growth, mortality, catch per unit effort (CPUE), or effort. Instead, the LBB only requires data that represents the length frequency distribution of the evaluated population (Froese et al., 2018). Thus, it is considered a suitable method for stock assessment of the data-limited miter squid fishery in the northeastern South China Sea (neSCS).
Using the LBB method, Baldé et al. (2019) successfully estimated optimal lengths at first capture for two Sardinella stocks in the Senegal waters. Pons et al. (2020) evaluated the performance of three length-only assessment methods in data-limited fisheries, the Length-Based Spawning Potential Ratio (LBSPR, Hordyk et al., 2015), the Length-Based Integrated Mixed Effects (LIME, Rudd and Thorson, 2018), and the LBB. They concluded that, compared with the other two methods, LBB performed better in estimating the depletion levels of heavily and moderately fished stocks, especially for the short-lived species. Estimations using both the LBB and LIME for long-lived species exposed to low fishing mortality generally resulted in biased estimates (Pons et al., 2020; see also ICCAT, 2019). This suggests that LBB would be a suitable method for the assessment of the short-lived, heavily-fished miter squid stock in the neSCS.
The neSCS (also known as the Shantou-Taiwan bank fishing ground or Minnan-Taiwan bank fishing ground) is located in the southwest of the Taiwan Strait (21°50′–23°30′N, 116°00′–119°30′E) at the junction of the East China Sea and the SCS, and it covers an area of about 50 × 103 km2 (Figure 1). The fishing ground is located in a unique geographical location with complex influences from current systems, such as the Zhejiang-Fujian Coastal Current, the Eastern Guangdong Coastal Current, the Kuroshio Current’s SCS Branch, and the SCS Warm Current (Jan et al., 2002; Tang et al., 2002; Hu et al., 2003, 2010; Jiang et al., 2011). The convergence of these currents, the topographic upwellings they induced (Hu et al., 2003), and the influence of tropical cyclones (Qiu et al., 2010) create favorable feeding conditions for marine organisms. Cephalopods are the dominant taxon caught there, and the miter squid Uroteuthis chinensis (Gray) is the major target species of the fishery.
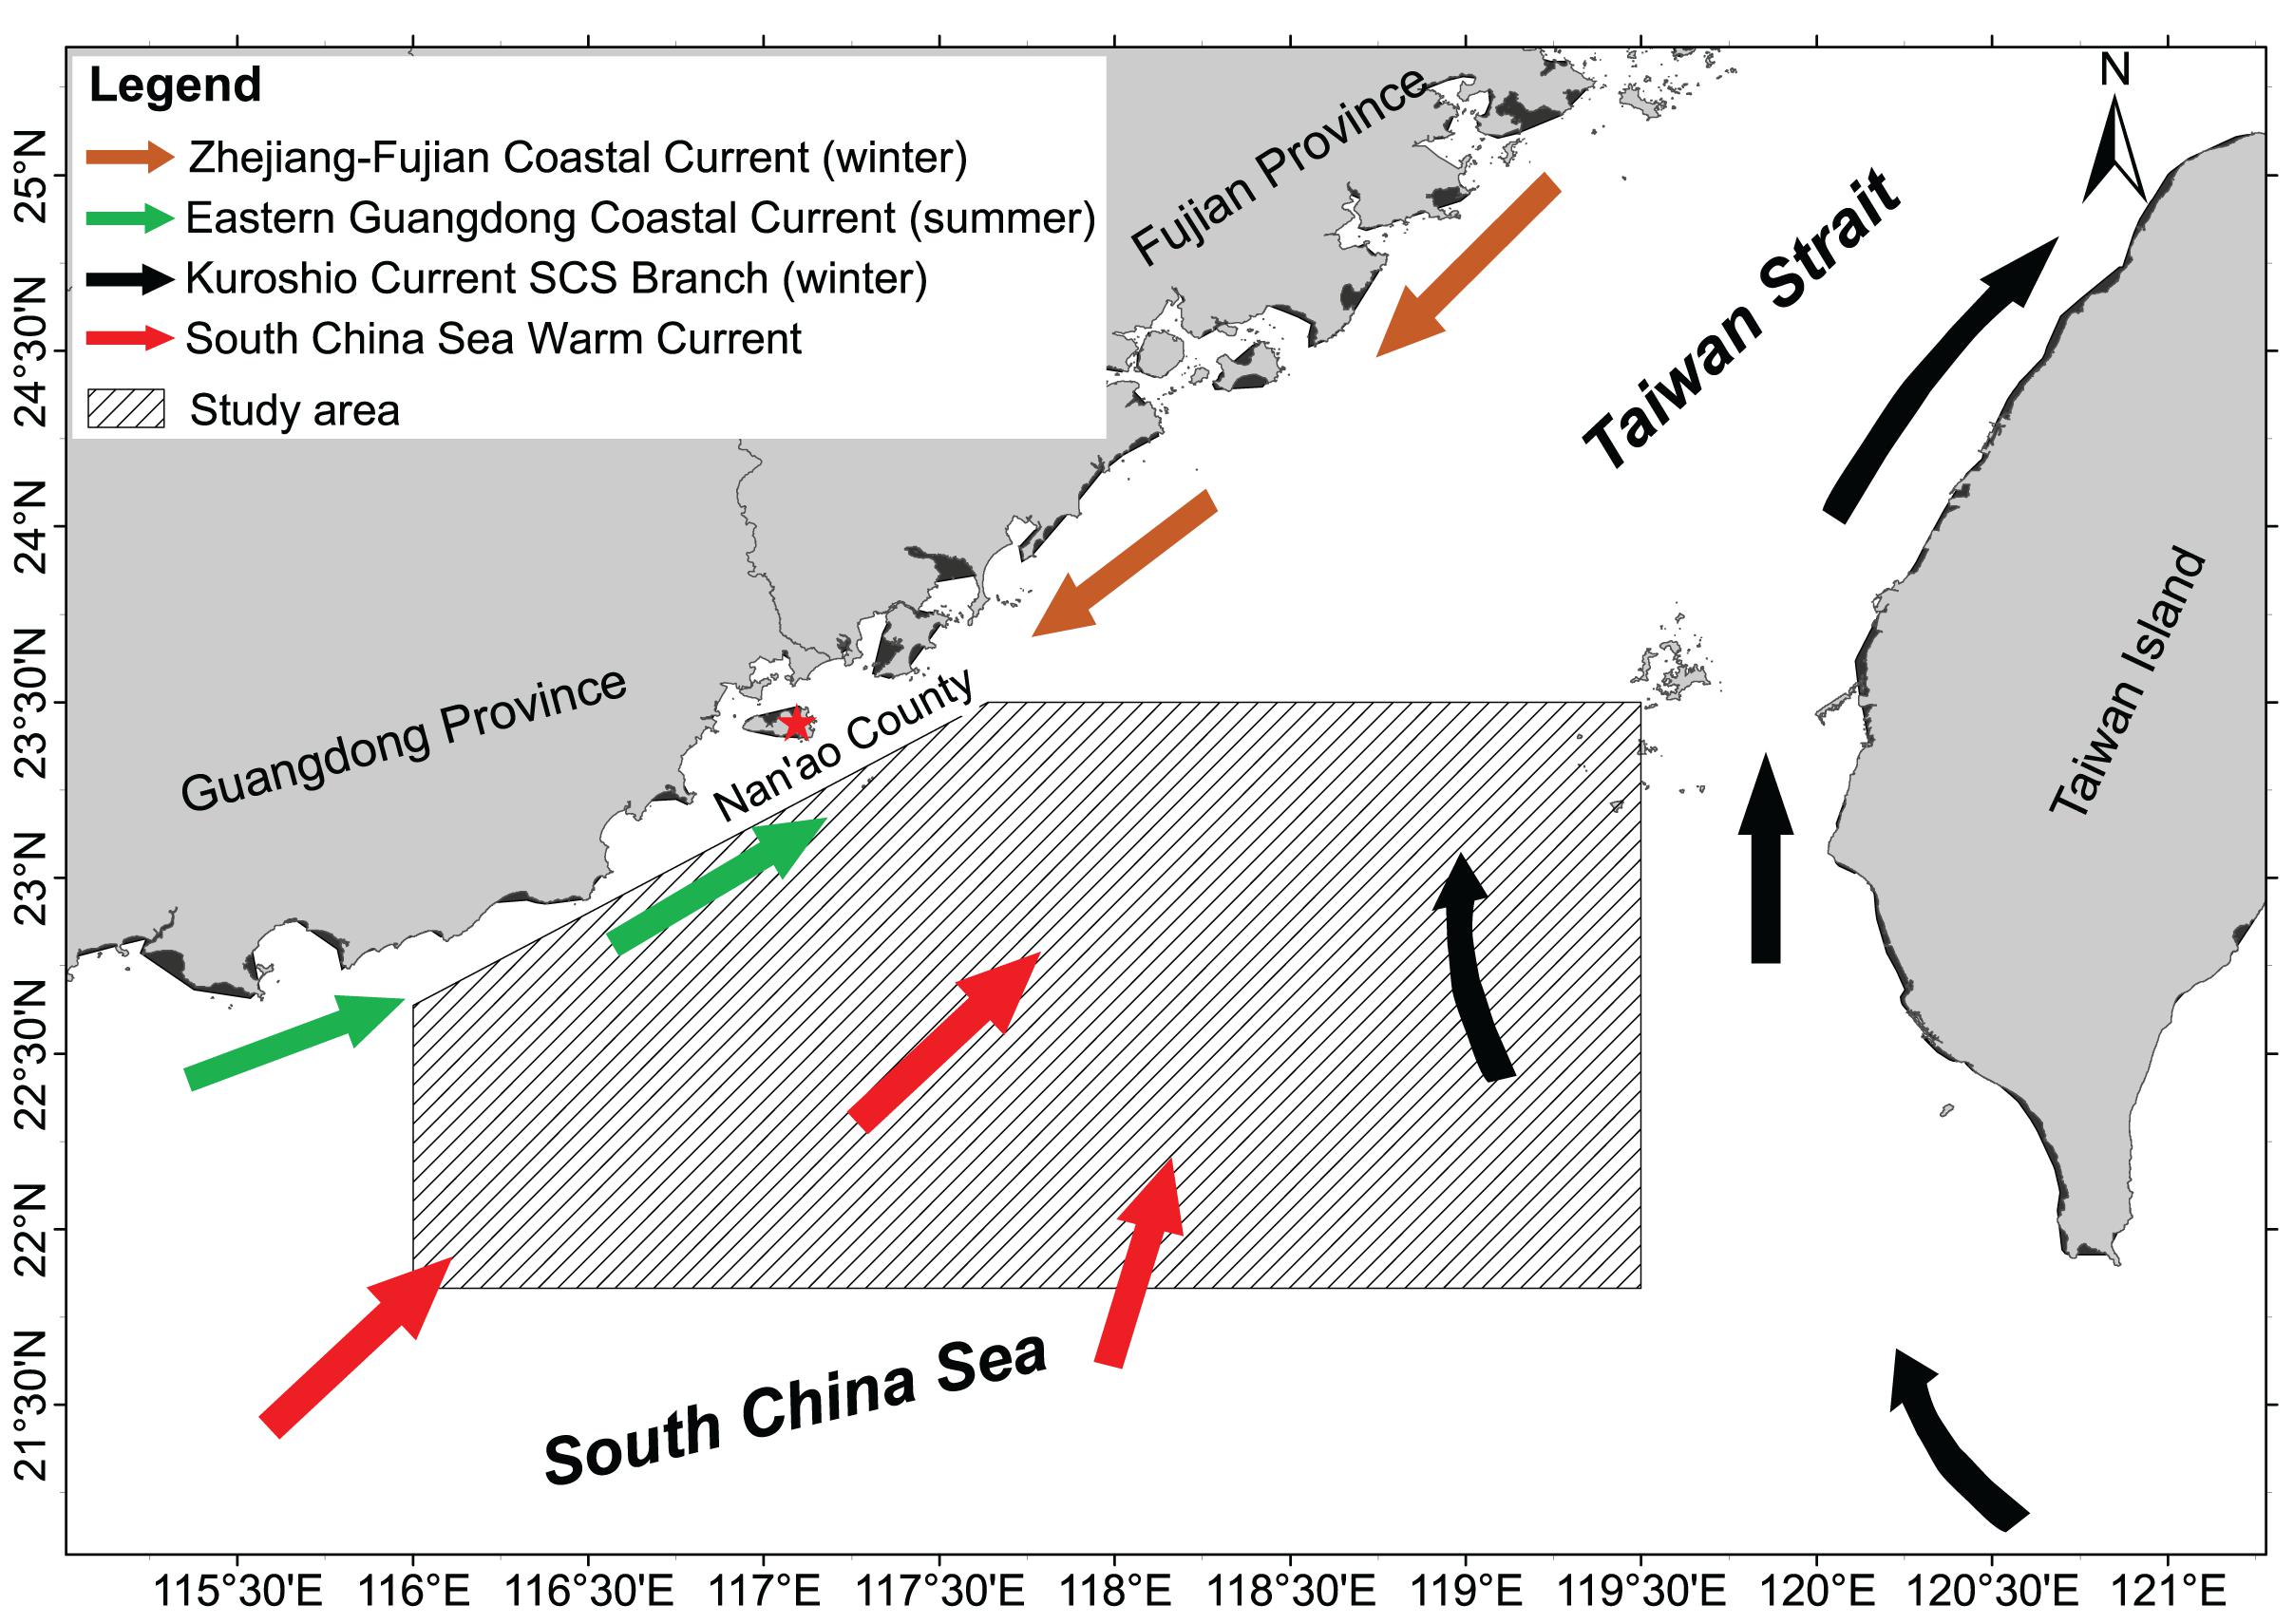
Figure 1. Study area in the northeast South China Sea and the current systems [Redrawn from Cai and Shi (2009) and Hu et al. (2010)].
The miter squid belongs to the phylum Mollusca, class Cephalopoda, order Teuthoidea, and family Loliginidae1. It is mainly distributed in the continental shelf of the SCS and south-central Taiwan Strait. The miter squid in the Taiwan bank fishing ground is the most abundant, and it supports the largest squid fishery in coastal China. The squids are harvested by jigging, trawl, light purse seine, and light lift net operations. Before and during the 1980s, they were mainly harvested by fishing boats from the Nan’ao County (Figure 1), and the highest landing reached 5.1 × 10⁴ tons in 1985 (Li and Wu, 1988). However, landings have since dropped, and annual landings from this fishing ground were estimated at 2.0–2.5 × 10⁴ tons by the 2000s (Zhang et al., 2008). Studies on miter squid in the neSCS ever involved its biology, stock status, and fishery management (Ou, 1981, 1983; Lan, 1985; Zhang et al., 2008; Chen, 2016), but a few studies focused on its population parameters and stock assessment. Based on length frequency data collected during the periods 1975–1977, 1997–1999, and 2018–2019 in the neSCS, this study estimates the population parameters of the squid and assesses its stock status using the LBB method. The analysis may provide useful information for the management of the fishery and help toward its sustainable exploitation.
Materials and Methods
Data Collection
We analyzed length frequency data from the neSCS to assess the stock status of the miter squid in the periods from 1975 to 1977, 1997 to 1999, and 2018 to 2019, respectively. Data for 1975–1977 came from trawl surveys conducted in spring–autumn months and were digitized from a survey report (Investigation Team of Marine Fish Resources of Southern Fujian Fishing Ground (ITMFRSFFG), 1980). The L/F data from 1997 to 1999 were collected in a quarterly trawl survey. Data for 2018–2019 were collected during the implementation of a fishery improvement project (FIP), and the squid samples from commercial catches were supplied by a fish processing factory as coordinated by the China Blue Sustainability Institute; these samples were also collected from trawl fishing. The cod-end meshes of the trawl gears were 6.0 cm, 2.0 cm, and 1.8 cm, respectively, for samples from 1975 to 1977, 1997 to 1999, and 2018 to 2019. The sampling frequency and sample sizes are summarized in Table 1, and details are provided in the Supplementary Material.

Table 1. Sampling areas, sample sizes, and sampling frequency in different years.
During sample collection in 1997–1999 and 2018–2019, all the squids were retained for measurement when <50 squids were captured in any trawl haul; otherwise, 50 squids were collected randomly for subsequent lab measurement. Squids were frozen immediately and stored upon collection, and they were then defrosted and measured in the lab. The mantle length and wet weight were measured to the nearest 0.1 cm and 0.1 g, respectively.
The LBB Method
LBB is a method for assessing the status of a fishery based on relative length. The principle of the LBB method is that the absolute values of age and biomass can be replaced by their relative values. The key formulas of the LBB method in the present analysis are shown here, but details of the specific framework and a full array of formulas of LBB are given in Froese et al. (2018).
Growth in length is expressed by the von Bertalanffy growth function (von Bertalanffy, 1938).
where Lt is the mantle length at age t, Linf is the asymptotic mantle length, k is the rate by which Linf is approached, and t0 is the theoretical age at zero mantle length.
The number of squids surviving to a specific length is estimated by the following formula:
where NL is the number of survivors to length L, NLstart is the number at length Lstart with full selection, i.e., the length at which all individuals entering the gear are retained by it and Z/K is the ratio of the total mortality rate (Z) to the growth coefficient (K), M is the natural mortality, F is the fishing mortality, and Z = M + F (Froese et al., 2018).
The optimal length at first capture Lc_opt for a specific fishing mortality (F) can be obtained from,
The Y’/R, yield per recruitment equation is expressed by indexes of Lc/Linf, F/K, M/K, and F/M (Beverton and Holt, 1966; Froese et al., 2018), where Lc is the mean length at first capture. Assuming that fishing mortality F is proportional to fishing effort, the index of CPUE’/R can be obtained from Y’/R dividing F/M (Beverton and Holt, 1966; Froese et al., 2018):
When the stock is unexploited, the relative biomass in the potentially exploited phase of the population can be expressed:
where, B0 ′ > Lc denotes the exploitable fraction (>Lc) of the unexploited biomass (B0). The ratio B/B0 is obtained from formulas (4) and (5) (Beverton and Holt, 1966; Froese et al., 2018):
The present data analysis was performed using the R-code LBB_20.R, which was obtained from http://oceanrep.geomar.de/44832/. In this study, we hypothesized that the squid stock in 1975–1977 represented the unexploited biomass (B0) when the fishery has not yet been developed because Chinese offshore fishing was relatively undeveloped in the 1970s.
Results
The population parameters and relative biomass of the squid estimated by LBB are shown in Table 2 and Figure 2. The results indicated a slight difference in the estimated asymptotic mantle length (Linf) of the squid during the periods 1975–1977, 1997–1999, and 2018–2019 (41.1 cm, 41.8 cm, and 36.6 cm, respectively). The optimal mantle length at first capture (Lc_opt) estimated by LBB increased from 17 cm (41% of Linf) in 1975–1977 to 25 cm (60% of Linf) in 1997–1999 and 23 cm (63% of Linf) in 2018–2019. Relative total mortality (Z/K) showed an upward trend over the three periods, i.e., 2.1, 4.6, and 6.0, respectively. In the period 1975–1977, the estimated relative fishing mortality was F/M = 0.02 ≈ 0, but increased in the later two periods, while the relative natural mortality M/K showed a downward trend. The estimated relative biomass B/B0 = 0.96 ≈ 1 and B/Bmsy = 2.8 in 1975–1977 were much higher than those in 1997–1999 and in 2018–2019.
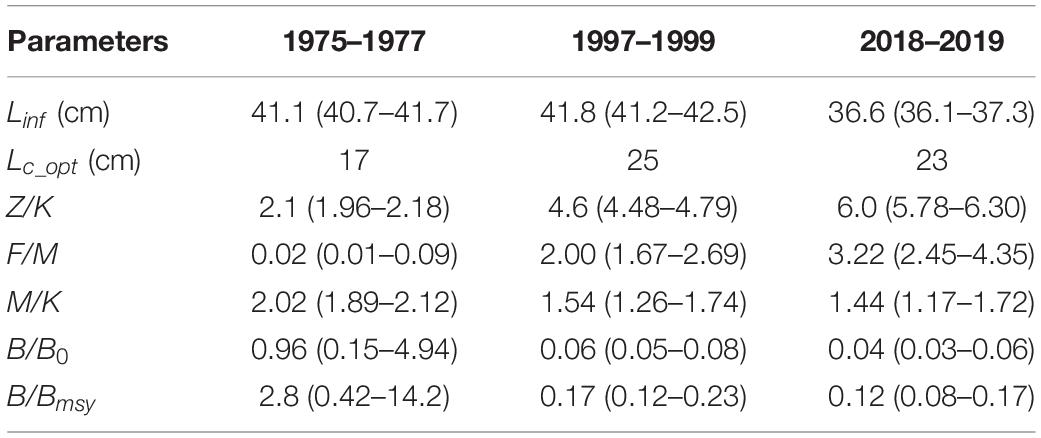
Table 2. Population parameters of miter squid estimated by LBB.
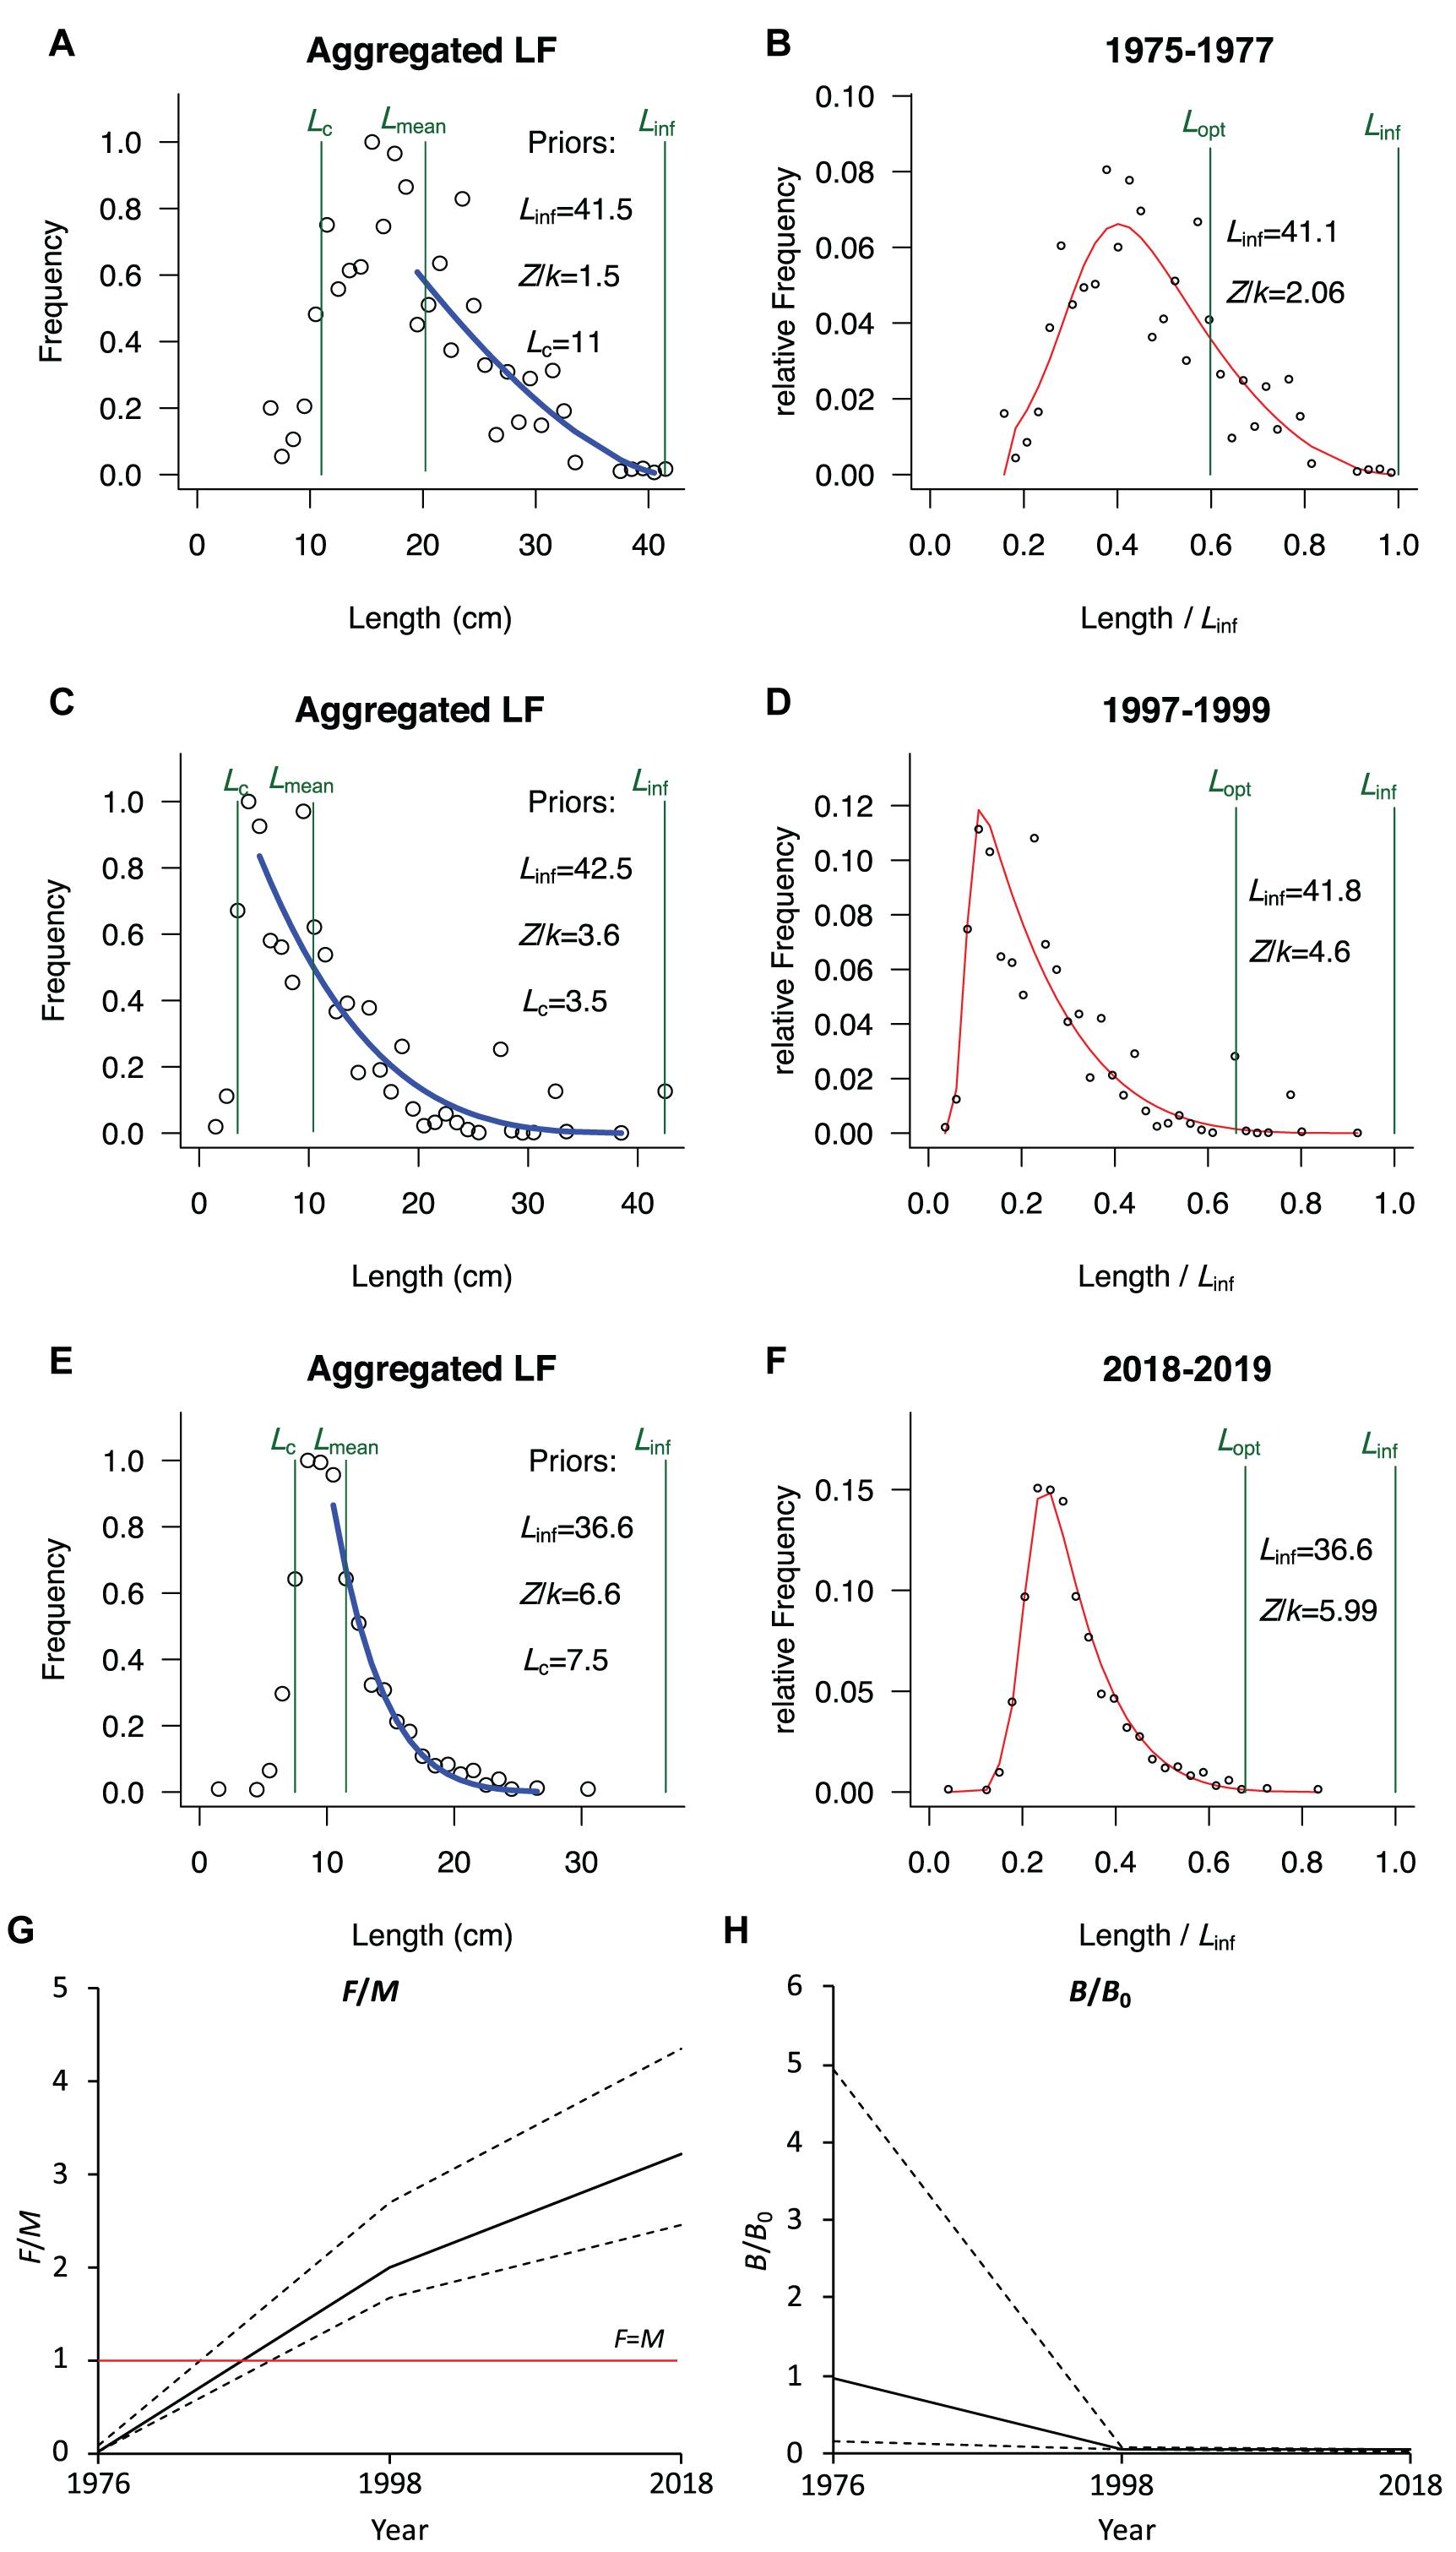
Figure 2. Trends of population parameters and relative biomass of the miter squid in the neSCS based on LBB estimation. (A,C,E) The accumulated length frequency data used to estimate priors Linf, Lc, Lmean, and Z/k, respectively, from 1975 to 1977, 1997 to 1999, and 2018 to 2019. (B,D,F) The relative length frequency data used to fit the red curves which are in turn used to estimate Z/k, M/k, F/k, Lc, and Linf. The Lopt is calculated based on Linf and M/k. (G) Changes in relative fishing intensity F/M, and (H) changes in relative biomass B/B0.
The mean length (Lmean; Figure 2A) and relative biomass (B/B0; Figure 2H) of the squid were above the levels of moderate exploitation in the period of 1975–1977, which indicated that the squid was underexploited. However, in the periods of 1997–1999 and 2018–2019, with the apparent increase in relative fishing intensity (F/M; Figure 2G), Lmean and B/B0 showed a sharp decline and remained in very low levels.
The apparent increases in Z/K and F/M and decreases in Lmean, B/B0, and B/Bmsy well correspond to the growth in horsepower of marine motorized fishing boats from the nearby Fujian and Guangdong Provinces, an indicator of overall fishing intensity. Here, we use horsepower of marine motorized fishing boats as a general indicator of increasing fishing pressure and assume that fishing pressure on miter squid shows parallel changes, because fishing horsepower specific to miter squid fishery is not available. In particular, both B/B0 and B/Bmsy showed an inversed decline with increasing horsepower of the fishing boats (Figure 3; both R2 = 1.00, P < 0.01), and the level of B/Bmsy = 1 corresponds to a horsepower level of 1.24 × 10⁶ kW and B/B0 = 34%. If we consider the horsepower level in 1984 as optimal, the horsepower level of 4.87 × 10⁶ kW in 2018 would be nearly four times the optimal level. This indicates that the squid stock has long been overexploited since the mid-1980s and is now strongly over-fished.
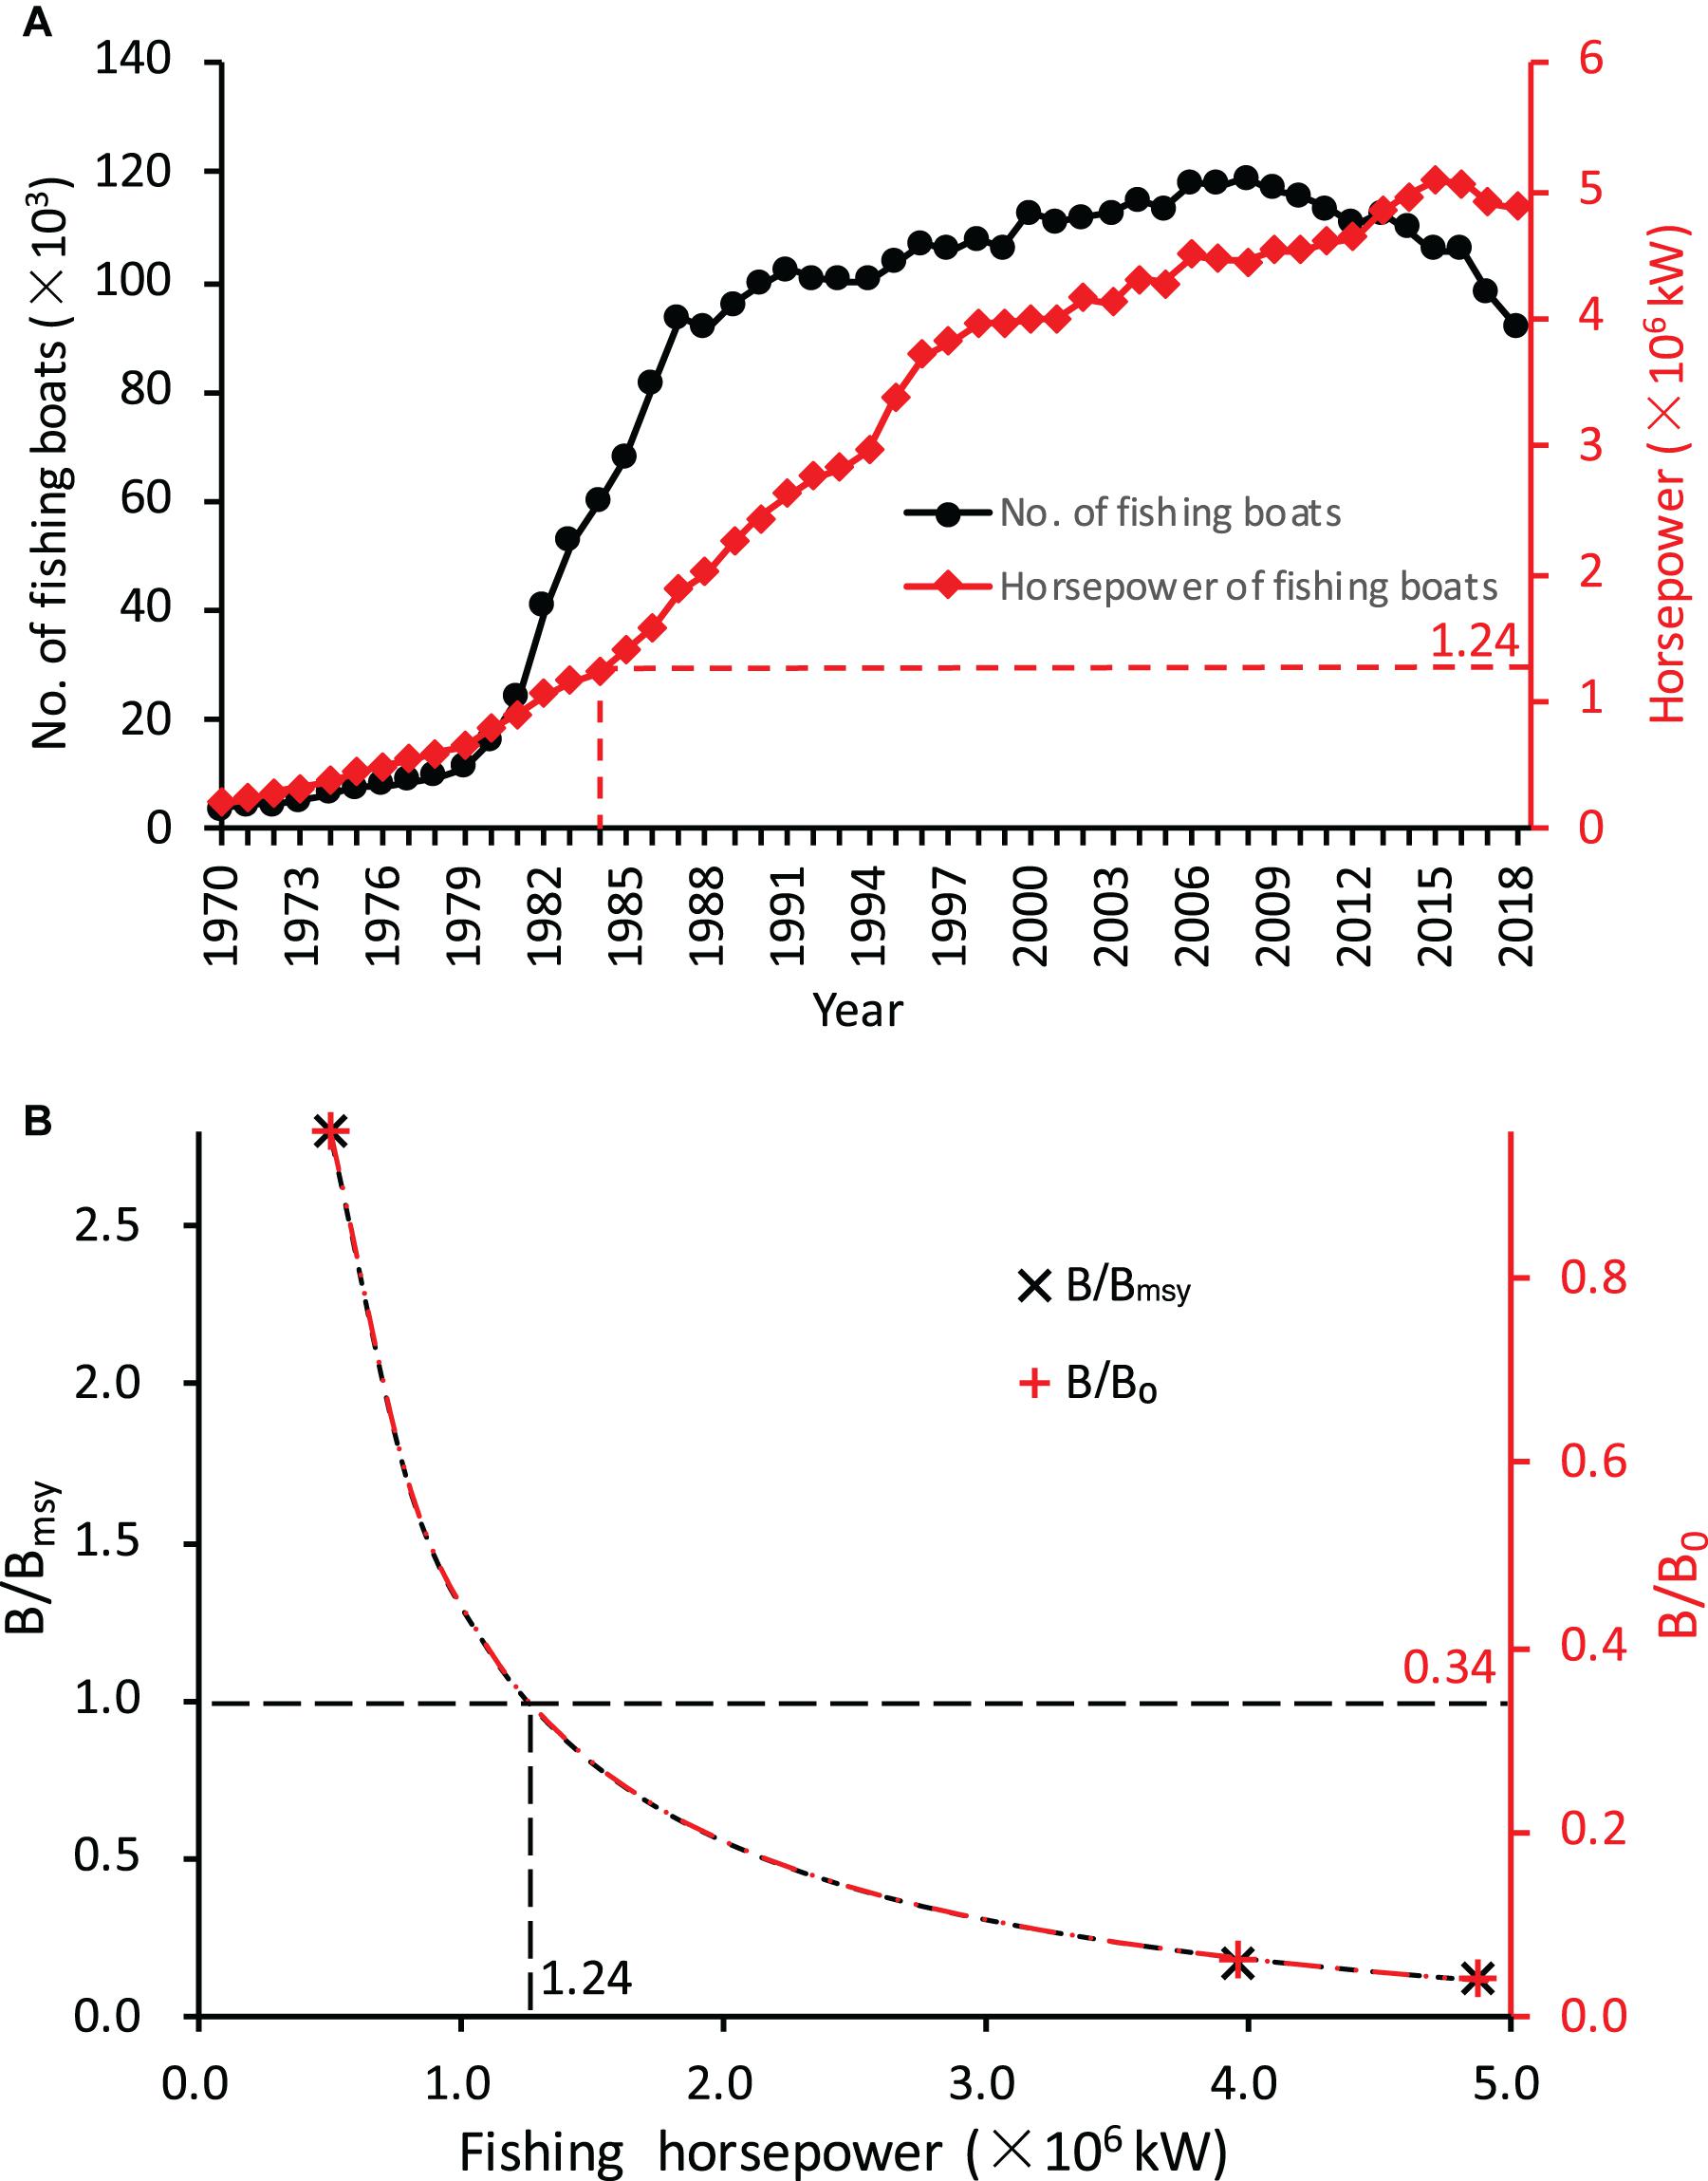
Figure 3. Growth in fishing intensity and its impact on relative biomass of the miter squid stock. (A) Growth in marine motorized fishing boats from the Fujian and Guangdong Provinces from 1970 to 2018 [data from China Fishery Statistical Yearbook (Fishery Management Bureau of Ministry of Agriculture and Rural Affair (FMBMARA), 1970–2018)]. (B) Decline of relative biomass (B/Bmsy and B/B0) with increasing fishing horsepower; B = Bmsy corresponds to B = 0.34B0 and fishing horsepower level of 1.24 × 10⁶ kW in 1984.
Discussion
The LBB method provides a new tool for stock assessment in a data-limited fishery. Compared with other methods of fish stock assessment, the advantage of the LBB method is that it only needs length-frequency data (Froese et al., 2018). Length frequency data are also the most readily available and are not affected by weighting difficulties on unstable vessels or the sampled fish or squid having been gutted. Thus, they have a low incidence of error (Wang et al., 2011). Another advantage of the LBB method is that it can estimate the relative standing biomass B/B0 and B/Bmsy, both of which are important indicators of stock status and fishing intensity, and their trends can be related to that of fishing effort.
The LBB method and the software developed on the basis is capable of determining the length at first capture (Lc) with the only input of aggregated length frequency and use the portion of the aggregated frequency of length >Lc (full selected length) for the estimation of stock parameters. This ensures that the estimation of stock parameters will not be biased by changes in selectivity of the sampling gears. The use of less-selective trawl fishing methods and replicate samples collected from different seasons in the present study also ensures wide coverage of the length-frequency spectrum, including length data from the small-size juvenile squids, meeting the only requirement that the collection of samples can represent the length frequency of the evaluated fishery population (Froese et al., 2018). The LBB-estimated Lc were 11 cm, 3.5 cm, and 7.5 cm, respectively, for the periods 1975–1977, 1997–1999, and 2018–2019 (Figures 2A,C,E), entailing that >90% of the length frequency samples was be used for the estimation of stock parameters.
The estimated asymptotic mantle lengths (Linf) of the miter squid from the LBB were similar in the 1970s (41.1 cm) and 1990s (41.8 cm) but was only 36.6 cm by the period 2018–2019. The apparent decrease in the estimated asymptotic length might be attributed to fishing-induced miniaturization. Zhang et al. (2008) and Chen (2016) also suggested that there was a tendency for miniaturization of squid in the neSCS, with the average mantle length decreasing from 21.0 cm in the 1970s to 10.4 cm in the 1990s, and the average mantle length was 11.5 cm in 2018–2019 (Figure 2). In addition to being a clear indication of growth overfishing, this also suggests a genetic selection toward smaller sizes.
LBB can estimate optimal length at first capture (Lc_opt) according to length frequency distribution that reflects the stock status. The squid’s mantle length frequency data from the 1970s were collected during a period when most of the fishing boats were not motorized and fishing intensity was low, and the LBB estimation recommended a lower Lc_opt of 17.0 cm (41% of Linf). With the increase in fishing intensity, the Lc_opt estimated for the periods 1997–1999 and 2018–2019 increased to 25.0 cm (60% of Linf) and 23.0 cm (63% of Linf), respectively, both of which are much larger than the average mantle length of 10.4 cm between 1997 and 1999 and 11.5 cm between 2018 and 2019. This indicates that, in addition to high fishing intensity since the mid-1980s, the capture of undersized juveniles is another major problem in the fishery.
Simulation of the squid fishery development using LBB method showed that the standing stock was close to the virgin stock (B/B0 = 0.96 ≈ 1) in the 1970s, which verified our assumption. The standing stock (B) at that time was the largest, at 2.8 times Bmsy. The increase in fishing intensity was the major factor leading to a decline in the stock biomass. Base on the LBB simulation, the fishing intensity was relatively low (F/M = 0.02 ≈ 0) in the 1970s. Then, with the increase in fishing intensity, the F/M increased, reaching 2.00 between 1997 and 1999 and 3.22 between 2018 and 2019. Consequently, the standing stock biomass (B) between 1997 and 1999 and between 2018 and 2019 has decreased to 6 and 4%, respectively, of the unexploited stock (B0) level (Figure 2 and Table 2), indicating that the stock has been under severe overexploitation. The overfishing has also resulted in the decline of catches. With rapid increases in the number of marine motorized fishing boats and their horsepower in Fujian and Guangdong provinces since the 1980s (Figure 3), the annual yield of the squid increased rapidly to culminated (>5 × 10⁴ tons) in 1985 (Figure 4), but it since decreased to about 2.0–2.5 × 10⁴ tons by the 2000s (Zhang et al., 2008).
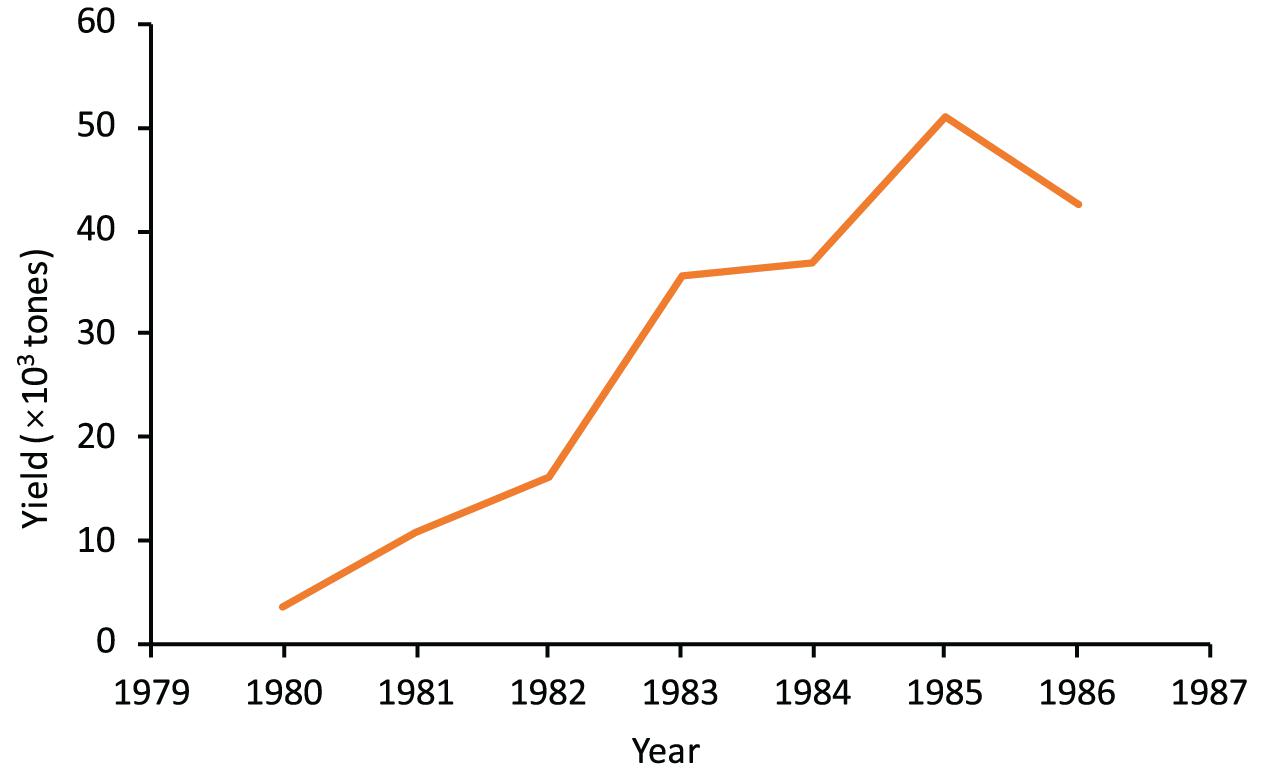
Figure 4. Yield of miter squid in the Shantou-Taiwan Bank fishing ground by Nan’ao County during 1980–1986 (Li and Wu, 1988). The location of Nan’ao County is indicated in Figure 1.
The LBB simulation confirms that the squid stock is strongly overexploited. To recover the squid stock, it is imperative to reduce the fishing intensity and to stipulate and enforce the regulation of size at first capture.
Data Availability Statement
All datasets generated for this study are included in the article/Supplementary Material.
Ethics Statement
Ethical review and approval was not required for the animal study because the research species belongs to the commercial animal, and does not involve ethical experiments, and complies with relevant laws.
Author Contributions
XW: data collecting, formal analysis, and writing the original draft. YH and WB: squid specimens coordinator in 2018–2019 and founder. FD and YQ: frame design and review and editing. ML: data collecting and squid specimens measuring. YC: Figure 1 redrawing. All authors contributed to the article and approved the submitted version.
Funding
This work was supported by the China Blue Sustainability Institute, Science and Technology Basic Resources Investigation Program of China (2017FY201405 and 218FY100105) and Central Public-interest Scientific Institution Basal Research Fund, CAFS (Nos. 2019HY-JC0203, 2019HY-XKQ03, and 2019GH02).
Conflict of Interest
The authors declare that the research was conducted in the absence of any commercial or financial relationships that could be construed as a potential conflict of interest.
Acknowledgments
We are grateful to Dr. Daniel Pauly, Dr. Maria Lourdes D. Palomares, Dr. WeiWei Xian, Dr. Rainer Froese, Dr. Cui Liang, and Dr. Lu Zhai for their help in applying the LBB method. We thank Yu Liu, Mengji Chen, Lanxiang Ke, Liya Fu, Shouxin Wang, Hong Li, and Miaodi Wang for their participation in biological measurement during the period 2018–2019. We acknowledge Shantou Wanchengxin Aquatic Products Co., Ltd. for providing the squid samples. We also thank two reviewers for their useful comments on this study.
Supplementary Material
The Supplementary Material for this article can be found online at: https://www.frontiersin.org/articles/10.3389/fmars.2020.518627/full#supplementary-material
Footnotes
References
Baldé, B. S., Fall, M., Kantoussan, J., Sow, F. N., Diouf, M., and Brehmer, P. (2019). Fish-length based indicators for improved management of the sardinella fisheries in Senegal. Reg. Stud. Mar. Sci. 31:100801. doi: 10.1016/j.rsma.2019.100801
Beverton, R. J. H., and Holt, S. J. (1957). On the Dynamics of Exploited Fish Populations: Series II, Vol. XIX. London: Fishery Investigations, 533.
Beverton, R. J. H., and Holt, S. J. (1966). Manual of Methods for Fish Stock Assessment, Part II – Tables of Yield Functions. FAO Fisheries Technical Paper No. 38 (Rev. 1). Rome: FAO, 10.
Brander, K. (2013). Climate and current anthropogenic impacts on fisheries. Clim. Change 119, 9–21. doi: 10.1007/s10584-012-0541-2
Cai, Z., and Shi, Q. (2009). Preliminary Study on the Origin of Taiwan Strait. Xiamen: Xiamen University Press, 13–32 (in Chinese).
Chen, F. (2016). Survey of mitre squid resource in Minnan-Taiwan Bank fishing ground and suggestions for sustainable utilization. Fish. Inform. Strategy 31, 270–277 (in Chinese).
Costello, C., Ovando, D., Hilborn, R., Gaines, S. D., Deschenes, O., and Lester, S. E. (2012). Status and solutions for the world’s unassessed fisheries. Science 338, 517–520. doi: 10.1126/science.1223389
Dick, E. J., and MacCall, A. D. (2011). Depletion-based stock reduction analysis: a catch-based method for determining sustainable yields for data-poor fish stocks. Fish. Res. 110, 331–341. doi: 10.1016/j.fishres.2011.05.007
Fishery Management Bureau of Ministry of Agriculture and Rural Affair (FMBMARA) (1970–2018). Fishery Statisticcal Yearbook of China. Beijing: FMBMARA (in Chinese).
Free, C. M., Jensen, O. P., Wiedenmann, J., and Deroba, J. J. (2017). The refined ORCS approach: a catch-based method for estimating stock status and catch limits for data-poor fish stocks. Fish. Res. 193, 60–70.
Froese, R., Demirel, N., Coro, G., Kleisner, K. M., and Winker, H. (2017). Estimating fisheries reference points from catch and resilience. Fish Fish. 18, 506–526. doi: 10.1111/faf.12190
Froese, R., Winker, H., Coro, G., Demirel, N., Tsikliras, A. C., Dimarchopoulou, D., et al. (2018). A new approach for estimating stock status from length frequency data. ICES J. Mar. Sci. 76, 350–351. doi: 10.1093/icesjms/fsy139
Gulland, J. A., and Rosenberg, A. A. (1992). A Review of Length-Based Approaches to Assessing Fish Stocks. FAO Fisheries Technical Paper, No. 323. Rome: FAO, 100.
Hordyk, A., Ono, K., Valencia, S., Loneragan, N., and Prince, J. (2015). A novel length-based empirical estimation method of spawning potential ratio (SPR), and tests of its performance, for small-scale, data-poor fisherie. ICES J. Mar. Sci. 72, 217–231. doi: 10.4135/9781412953924.n678
Hu, J., Kawamura, H., Hong, H., and Pan, W. (2003). A review of research on the upwelling in the Taiwan Strait. Bull. Mar. Sci. 73, 605–628.
Hu, J., Kawamura, H., Li, C., Hong, H., and Jiang, Y. (2010). Review on current and seawater volume transport through the Taiwan Strait. J. Oceanogr. 66, 591–610. doi: 10.1007/s10872-010-0049-1
Hutchings, J. A. (2000). Collapse and recovery of marine fishes. Nature 406, 882–885. doi: 10.1038/35022565
ICCAT (2019). Report of the 2019 ICCAT Working Group on Stock Assessment Methods Meeting (WGSAM). Available online at: https://iccat.int/Documents/Meetings/Docs/2019/REPORTS/2019_WGSAM_ENG.pdf (accessed December 2, 2019).
Investigation Team of Marine Fish Resources of Southern Fujian Fishing Ground (ITMFRSFFG) (1980). Investigation Report of Fish Resources of Minnan-Taiwan Bank. Xiamen: ITMFRSFFG, 398–410 (in Chinese).
Jan, S., Wang, J., Chern, C., and Chao, S. (2002). Seasonal variation of the circulation in the Taiwan Strait. J. Mar. Syst. 35, 249–268. doi: 10.1016/s0924-7963(02)00130-6
Jiang, Y., Chai, F., Wan, Z., Zhang, X., and Hong, H. (2011). Characteristics and mechanisms of the upwelling in the southern Taiwan Strait: a three-dimensional numerical model study. J. Oceanogr. 67, 699–708. doi: 10.1007/s10872-011-0080-x
Kuparinen, A., and Merilä, J. (2007). Detecting and managing fisheries-induced evolution. Trends Ecol. Evol. 22, 652–659. doi: 10.1016/j.tree.2007.08.011
Lan, X. (1985). Squid stocks in the coastal waters of southern Fujian and eastern Guangdong Provinces. Mar. Fish. 7, 208–209 (in Chinese).
Li, Q., and Wu, K. (1988). Production status and prospect of squid in fishing season in the Taiwan Bank fishing ground. Mar. Fish. 6, 257–259 (in Chinese).
Martell, S., and Froese, R. (2013). A simple method for estimating MSY from catch and resilience. Fish Fish. 14, 504–514. doi: 10.1111/j.1467-2979.2012.00485.x
Ou, R. (1981). Preliminary observations on the embryonic development of the squid, Loligo chenensis Gray. Transact. Oceanol. Limnol. 3, 51–59 (in Chinese).
Ou, R. (1983). Preliminary study on the stages of gonad maturity of the squid, Loligo chinensis Gray. Mar. Sci. 1, 44–46 (in Chinese).
Pauly, D., Christensen, V., Dalsgaard, J., Froese, R., and Torres, F. (1998). Fishing down marine food webs. Science 279, 860–863. doi: 10.1126/science.279.5352.860
Pauly, D., and Morgan, G. R. (1987). Length-based methods in fisheries research. ICLARM Conf. Proc. 13:486.
Pons, M., Cope, J. M., and Kell, L. T. (2020). Comparing performance of catch-based and length-based stock assessment methods in data-limited fisheries. Canad. J. Fish. Aquat. Sci. 77, 1026–1037. doi: 10.1139/cjfas-2019-0276
Qiu, Y., Lin, Z., and Wang, Y. (2010). Responses of fish production to fishing and climate variability in the northern South China Sea. Prog. Oceanogr. 85, 197–212. doi: 10.1016/j.pocean.2010.02.011
Rudd, M. B., and Thorson, J. T. (2018). Accounting for variable recruitment and fishing mortality in length-based stock assessments for data-limited fisheries. Canad. J. Fish. Aquat. Sci. 75, 1019–1035. doi: 10.1139/cjfas-2017-0143
Tang, D., Kester, D. R., Ni, I. H., Kawamura, H., and Hong, H. (2002). Upwelling in the Taiwan Strait during the summer monsoon detected by satellite and shipboard measurements. Remote Sens. Environ. 83, 457–471. doi: 10.1016/s0034-4257(02)00062-7
Thorson, J. T., Minto, C., Minte-Vera, C. V., Kleisner, K. M., and Longo, C. (2013). A new role for effort dynamics in the theory of harvested populations and data-poor stock assessment. Canad. J. Fish. Aquat. Sci. 70, 1829–1844. doi: 10.1139/cjfas-2013-0280
Vincent, A. C. J., and Hall, H. J. (1996). The threatened status of marine fishes. Trends Ecol. Evol. 11, 360–361. doi: 10.1016/0169-5347(96)30041-4
von Bertalanffy, L. (1938). A quantitative theory of organic growth (inquiries on growth laws. II). Hum. Biol. 10, 181–213.
Wang, X., Qiu, Y., Du, F., Lin, Z., Sun, D., and Huang, S. (2012). Population parameters and dynamic pool models of commercial fishes in the Beibu Gulf, northern South China Sea. Chin. J. Oceanol. Limnol. 30, 105–117. doi: 10.1007/s00343-012-1017-y
Wang, X., Qiu, Y., Zhu, G., Du, F., Sun, D., and Huang, S. (2011). Length-weight relationships of 69 fish species in the Beibu Gulf, northern South China Sea. J. Appl. Ichthyol. 27, 959–961. doi: 10.1111/j.1439-0426.2010.01624.x
Zhang, Z., Ye, S., Hong, M., Shen, C., and Su, X. (2008). Biological characteristics of the Chinese squid (Loligo chinensis) in minnan-taiwan shallow fishing ground. J. Fuj. Fish. 3, 1–5 (in Chinese). doi: 10.37828/em.2020.27.1
Keywords: length frequency, LBB, data-limitation, stock status, Uroteuthis chinensis, northeastern South China Sea
Citation: Wang X, He Y, Du F, Liu M, Bei W, Cai Y and Qiu Y (2021) Using LBB Tools to Assess Miter Squid Stock in the Northeastern South China Sea. Front. Mar. Sci. 7:518627. doi: 10.3389/fmars.2020.518627
Received: 09 December 2019; Accepted: 11 December 2020;
Published: 12 January 2021.
Edited by:
Daniel Pauly, Sea Around Us, CanadaReviewed by:
Nazli Demirel, Istanbul University, TurkeyCui Liang, Institute of Oceanology (CAS), China
Copyright © 2021 Wang, He, Du, Liu, Bei, Cai and Qiu. This is an open-access article distributed under the terms of the Creative Commons Attribution License (CC BY). The use, distribution or reproduction in other forums is permitted, provided the original author(s) and the copyright owner(s) are credited and that the original publication in this journal is cited, in accordance with accepted academic practice. No use, distribution or reproduction is permitted which does not comply with these terms.
*Correspondence: Xuehui Wang, d3hoc2NzQDE2My5jb20=