
95% of researchers rate our articles as excellent or good
Learn more about the work of our research integrity team to safeguard the quality of each article we publish.
Find out more
ORIGINAL RESEARCH article
Front. Mar. Sci. , 28 August 2020
Sec. Marine Fisheries, Aquaculture and Living Resources
Volume 7 - 2020 | https://doi.org/10.3389/fmars.2020.00680
This article is part of the Research Topic North Pacific Climate and Ecosystem Predictability on Seasonal to Decadal Timescales View all 15 articles
Recent observational and numerical studies have suggested that the decadal modulation of the Kuroshio Extension system, driven by mesoscale eddies, profoundly affect the basin scale physical and biogeochemical oceanography. However, it remains unclear how these decadal changes affect distribution and abundance of fish species in this region. In this study, 26,964 swordfish catch data obtained by longliners during 2004–2010 in the western North Pacific are analyzed with an eddy-resolving ocean reanalysis by using mesoscale dynamic parameters and an eddy detection technique, to clarify the effects of mesoscale eddies and their variabilities on the swordfish relative abundance. During this period, the Kuroshio Extension underwent two different dynamic phases: stable path state in 2004, 2005, and 2010; and unstable path state during 2006–2009. Based on our analyses, we show here that swordfish are more concentrated in and near the anticyclonic warm-core eddies in the northern site, 36–45°N, of the Kuroshio Extension system, especially during the unstable path phase. This is found to be caused by the interannual modulation of mesoscale eddy activities due to more warm-core rings generated from the unstable Kuroshio Extension, making it easier for fishermen to target swordfish in this region.
Ocean accommodates variety of marine life from small plankton to large migratory fish species, including swordfish. Within this marine ecosystem, phytoplankton are the most important primary producers of the vital energy source for most of the marine life, forming the foundation of the food web. These marine primary producers are nearly passive to the flow, and their abundance depends strongly on the availability of nutrients and light. The enhanced nutrient injection near ocean fronts (Mahadevan and Archer, 2000; Lévy et al., 2001) and active restratification of the mixed layer eddies (Mahadevan et al., 2012) may sustain primary producers and their grazers. So, the enhanced primary and secondary productions near fronts and eddies not only provide controls over biogeochemical flows but also attract large migratory fish species (Braun et al., 2019). In addition to this bottom-up influence through the trophic supply, physical structures in the ocean, such as fronts and eddies, have been known to influence the distributions of marine organisms. They may act as barriers or migration routes, giving greater feeding opportunities and a preferred thermal habitat, thus influencing the behavior and distribution of various marine species (Seki et al., 2002; Watanabe et al., 2009). To this regard, using satellite tracking of shark movements, satellite remote sensing and a numerical forecasting model, Braun et al. (2019) have recently shown that the blue sharks in the Gulf Stream regions prefer warm swirls or warm-core rings, which has been believed to be oligotrophic ocean desert. For swordfish, Bigelow et al. (1999) have reported, using Hawaii based swordfish longline fishery data, that important factors to model catch-per-unit-effort (CPUE) include latitude, time, longitude, sea surface temperature (SST), and frontal energy. However, the detailed mechanisms of how the mesoscale frontal processes affect these factors are not discussed. Also, Hsu et al. (2015) recently reported high swordfish catch found outside of eddies, by using satellite altimeter data in the surroundings of the Gulf Stream. Although the direct comparison of fishery catch data with the mesoscale eddies detected using satellite altimeter data is pioneering, the study region was limited to the western North Atlantic. In the western North Pacific, previous studies using limited short-term physical and fishery data have shown the influence of mesoscale eddies on the distributions of pelagic fish (Sugimoto and Tameishi, 1992). However, it is still unclear how evolving mesoscale flows with interannual timescale affect distributions and relative abundance of fish species, including the swordfish. In the Pacific Ocean, the swordfish Xiphias gladius has a distribution between the latitudes 50°N–50°S (Bedford and Hagerman, 1983), with areas of apparent concentrations in the western North Pacific within the latitudes 20–45°N. The main habitat of the swordfish in this area is the subtropical region (Watanabe et al., 2009), where the Kuroshio Extension flows along its northern boundary.
The Kuroshio Extension (KE) is a western boundary current of the subtropical gyre in the North Pacific. It is one of the most dynamic regions of the world ocean, rich in mesoscale eddies and with the largest heat loss from the ocean to the atmosphere (Qiu et al., 2004). It presents two dynamic states: “stable” and “unstable” driven by the Aleutian low variation and associated westward propagating mesoscale eddies (Qiu and Chen, 2005; Taguchi et al., 2007; Sugimoto and Hanawa, 2009; Qiu et al., 2014). During the stable period, the KE flows steadily along relatively stable paths, while during the unstable period, it flows more convoluted paths evolving with timescales of weeks to months. Due to this interannual variation, it has been shown that ecosystem in the KE region can be influenced from its lowest trophic level (Lin et al., 2014).
However, it has still been unclear how the KE interannual modulation affects the distributions and the relative abundance of higher trophic levels such as secondary producers, migrating fish species including swordfish, in relation to the mesoscale eddies.
In this study, by using a state-of-the-art ocean reanalysis product and available pelagic longline swordfish fishery data from 2004 through 2010 in the KE region, it becomes possible to investigate the effects of the spatiotemporal variations in the mesoscale eddies on the relative abundance of swordfish. The objective of this study is to assess the influence of mesoscale eddies over the swordfish X. gladius relative abundance, represented as the catch-per-unit-effort (CPUE) in the KE region. Section 2 includes data and methods, section 3 presents the results of the analysis using dynamic parameters for the mesoscale flow with the swordfish CPUE and their modulations in response to the KE state. Section 4 provides discussion, and finally, conclusions are presented in section 5.
The fishery data used in this study consist of catch and effort data collected in the region 25–45°N, 138°E–160°W from 2004 through 2010 by Japanese offshore surface longliners based on the Kesennuma fishing port. This operational data contains information of time (year, month, and day), fishing locations, number of swordfish catches, and effort in number of hooks deployed. A total of 26,964 catch data were collected and summarized by the National Research Institute for Far Seas Fisheries (Table 1). Since our focus is the swordfish abundance in the mesoscale-eddy-rich KE system, the swordfish catch data in the region 140–175°E, 25–45°N are used in this study.
The catch-per-unit-effort (CPUE) of a specie can be used to estimate the relative abundance, generally under the assumption that there is a linear relationship between these two (Skalski et al., 2010), or that both of these values are proportional (Cushing, 1981). For the analysis of the relative abundance of swordfish in this study, we use a nominally defined CPUE calculated by the following equation
expressing the catch and effort as the total number of fish catch per 100 hooks. Although this non-standardized CPUE may bias the abundance depending on the environmental factors, such as temperature, salinity and/or specifications of fishing gears (Bigelow et al., 1999; Bellido et al., 2001), important factors revealed by this study in the following sections, such as mesoscale dynamic parameters, can be useful to improve the standardization.
For the respective analysis of the oceanographic conditions in the KE, we used the Four-dimensional Variational Ocean Re-Analysis for the western North Pacific over 30 years (FORA-WNP30) provided by the Japan Agency for Marine-Earth Science and Technology (JAMSTEC) and the Japan Meteorological Research Institute (Usui et al., 2017). We worked with data of sea surface height, temperature, salinity and lateral velocity with a resolution of 1/10° in the western North Pacific during the time corresponding to the period of the fishery data.
To characterize the mesoscale flow field, several dynamic parameters are computed using the reanalysis data. For the mesoscale eddy detection, the Okubo-Weiss parameter (OW) is computed, since it can distinguish two-dimensional flow of rotating regime (OW <0) from that of deformation regime (OW > 0) (Okubo, 1979; Weiss, 1991). The OW is defined as
where u and v are zonal and meridional velocities, respectively, and x and y represent the respective zonal and meridional directions.
In a region where the rotation dominates over the deformation flow (OW <0), it is typically inside the isolated eddies. The directions of the rotating flows of the detected mesoscale eddies are determined by computing the vertical component of the relative vorticity, ζ. The sign convention for direction is that the vorticity is positive (negative) when rotation is anticlockwise (clockwise),
The available reanalysis data do not include vertical velocity, and the exact discretized form for the continuity equation of the model is not provided. Therefore, to deduce the tendency of the adiabatic subinertial vertical water movement, the divergence of the Q-vector, ∇h·Q is computed. Positive and negative signs of ∇h·Q have been shown to correspond to the tendency of downwelling and upwelling, respectively (Gill, 1982; Nagai et al., 2015). ∇h·Q is defined as,
where b = −gρ/ρo is buoyancy with water density ρ and its reference value ρo, gravitational acceleration g, and ∇h = (∂/∂x, ∂/∂y) is the horizontal derivative operator. In addition to the divergence of the Q-vector, a frontogenetical function is also computed using upper 100 m average horizontal flow. The frontogenetical function F is equated as,
When the frontogenetical function F is positive, it is equivalent to the increase trend of the lateral buoyancy gradient of the front under the frontogenesis, while a negative value means decrease in the lateral buoyancy gradient caused by the frontolysis (Pettersen, 1956; Bluestein, 1993). To investigate the relationships between the swordfish CPUE and these mesoscale dynamic parameters, the CPUEs are computed as a function of these parameters with the following resolutions, every 0.02f for ζ/f (where f is the Coriolis parameter); 2 ×10⁻¹⁰ s−2 for OW; 2 ×10⁻¹⁷ ms−3 for ∇h·Q.
To analyze the swordfish CPUE distributions with respect to mesoscale eddies, and to investigate their temporal variations in the Kuroshio Extension system, an eddy detection technique is used. The eddy detection method is based on the closed contours of the OW-parameter (2) at a value of −5 ×10⁻¹¹ s−2. The OW parameter for the eddy detection is computed from upper 100 m average lateral flow data. Only eddies with equivalent radius from 15 to 200 km are considered to detect mesoscale eddies of (100 km) under the limit of available resolution of the reanalysis ~10 km. Whether a detected eddy is a cyclonic or an anticyclonic ring is determined by averaging the vertical component of relative vorticity ζ (3) within the eddy.
To understand the effects of eddies on the swordfish CPUE, the geographically closest eddy to each fishing position is determined by computing the distance between each fishing location and all the positions of eddy center, which is defined as the average longitudes and latitudes inside an eddy. The maps of the mean CPUE as a function of zonal and meridional distance from the eddy center are then obtained by averaging each CPUE, computed for each fishing point, on the grid over 500 km centered at the eddy with the resolution of 10 km for both zonal and meridional directions. Lastly, to investigate the spatiotemporal modulations in eddy activities, the upper 100 m average eddy kinetic energy (EKE) is computed as,
where and are fluctuating (eddy) components of the zonal and meridional upper 100 m average velocities obtained by subtracting long-term (1982–2014) mean velocities from each component of daily velocity u, i.e., before averaging them over upper 100 m.
The latitudinal positions of longline fishing reflect a seasonal feeding migration pattern of swordfish moving over the latitudes 25°N-45°N (Figure 1). From autumn to winter seasons the surface longliners chase swordfish migrating southward more than 2,000 km, meanwhile from spring to summer seasons, they migrate northward from the center of the subtropical gyre at 25°N to the northern edge of the KE system, the Kuroshio-Oyashio mixed water region at 42–43°N.
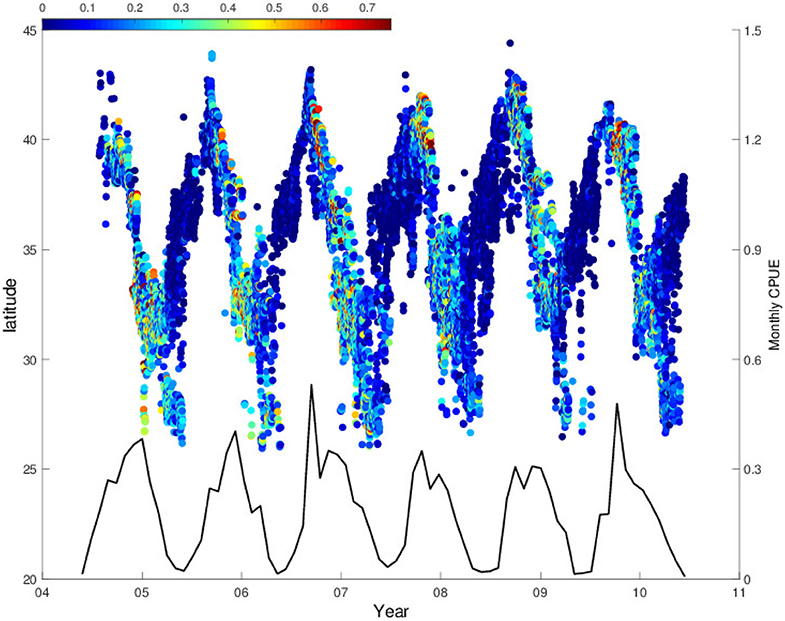
Figure 1. Time series of daily average latitudinal fishing position with swordfish CPUE in color (n/100 hooks, where n is a number of catch) from 2004 to 2010 and the black line shows monthly CPUE.
During this swordfish migration, CPUE values recorded on the daily basis show seasonal variations which can be clearer after computing them monthly (black line in Figure 1). When the fishing positions reach northernmost regions, and reverse to the south in late autumn, the values of CPUE start increasing significantly which is followed by a rapid decrease in early winter. After this, there is also a CPUE increase when the southward migration reaches around 33–35°N. The monthly CPUE shows a repeated seasonal pattern that coincides with this migration previously described. Accordingly, the monthly CPUE exhibits two peaks in most of the years analyzed, due to CPUE increases in the northern and southern fishing sites in different seasons. The high CPUE values are observed during late autumn in the northern fishing site, whereas they appear during winter season in the southern site. These two seasonal CPUE peaks could be demonstrated clearly by separating the CPUE data into two groups according to the fishing site: southern region, 25–36°N and northern region, 36–45°N (Figure 2A). In the southern region, CPUE peaks occur mostly in winter season (Dec-Jan, red line in Figure 2A), while they appear mostly during autumn to winter season (Oct–Dec) in the northern region except early 2009 (blue line in Figure 2A).
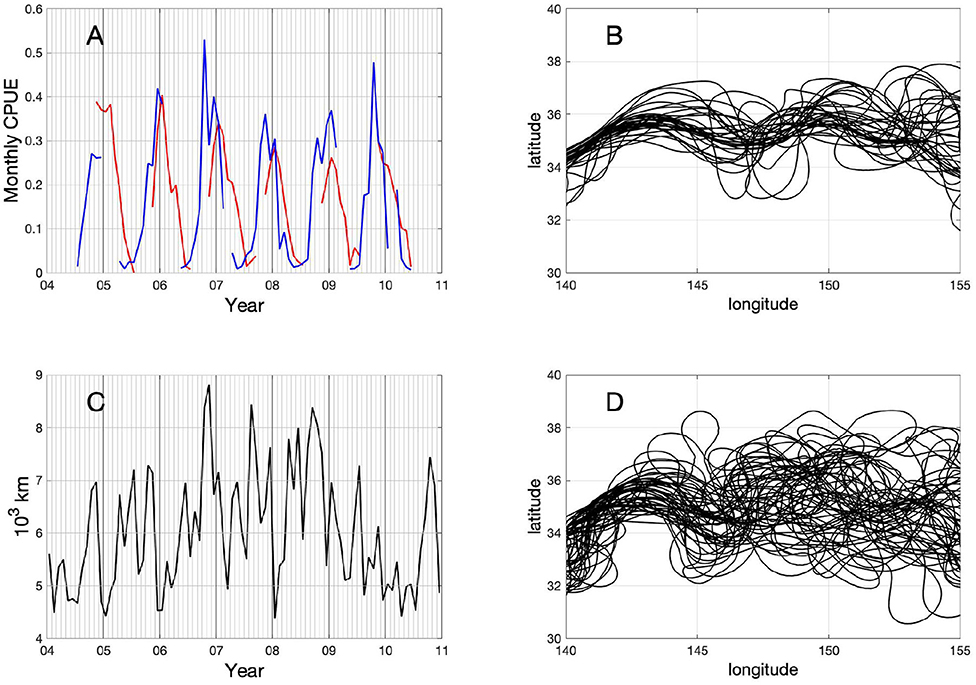
Figure 2. Time series of (A) the monthly CPUE from 2004 to 2010 in the range 140–175°E for (red) southern region 25–36°N and (blue) northern region 36–45°N and of (C) monthly Kuroshio Extension path length (103 km) between 140 and 175°E. Monthly averaged paths of the Kuroshio Extension defined by the longest contour of sea surface height (SSH) at 0 m using FORA-WNP30 data for (B) stable paths for the years 2004, 2005, and 2010, and (D) unstable paths during the period 2006–2009. The abscissa is longitude (°E) and the ordinate is latitude (°N).
Besides the seasonal variations presented in the previous section, both regions also display interannual variations in their CPUE values during the study period 2004–2010, which could be attributed to the decadal modulations of the Kuroshio Extension reported extensively in the previous studies (Qiu and Chen, 2005; Lin et al., 2014). Swordfish CPUE presents a decreasing trend from 2006 through 2009 in the southern (red curve in Figure 2A), and an increasing trend from 2004 through 2007 followed by a decreasing trend after 2007 in the northern fishing site (blue line in Figure 2A). In order to illustrate the interannual transitions of the Kuroshio Extension system, we computed the KE path defined as the longest contour at SSH = 0 in the region 30–40°N, 140–155°E. The obtained KE paths present the interannual phase transitions between stable and unstable period (Figures 2B,D). Since this result is consistent with a previous study by Qiu and Chen (2010) showing the same path transitions, our study period was divided into two, i.e., stable phase which includes the years of 2004, 2005, and 2010, and the unstable phase from 2006 through 2009.
During the stable phase (2004, 2005, 2010), the KE shows relatively straight paths, defining clearly two quasi-stationary meander crests located at 144 and 150°E (Figure 2B). On the contrary, during the unstable phase (2006–2009), apparently more convoluted paths are observed (Figure 2D). At the same time, during the latter described unstable phase, the KE paths become longer reaching up to 9,000 km of their length in late 2006, whereas path lengths are relatively shorter during the stable phase (Figure 2C).
By comparing the path length of the KE with the swordfish CPUE in each region (southern region, 25–36°N and northern region, 36–45°N) separately, it is observed that the swordfish CPUE in the northern region modulates similarly to the KE path length with the longer path length resulting in the higher CPUE, although there is an exceptional CPUE peak in late 2009 with a shorter path length (blue line in Figure 2A and black line in Figure 2C). The CPUE in the northern region shows a distinct peak in late 2006, which coincides well with the peak in the KE path length at the same time. On the other hand, the CPUE in the southern region shows an opposite trend to that of the KE path length and CPUE in the northern region with a largest CPUE value in early 2006 followed by a decreasing trend until middle of 2009 (red line in Figure 2A).
Despite these interannual changes in the CPUE, seasonal north-south migration shows the periodic annual cycle, i.e., the northward migration during spring to summer and the southward migration during autumn to winter (Figure 1). In contrast, longitudinal CPUE distributions are found to exhibit interannual transitions (Figure 3). In the northern region (36–45°N), the CPUE in the western region, 143–155°E shows relatively high values in autumn to winter season during the unstable period (Figure 3A). Note that during autumn to winter, swordfish migrate from north to south. On the other hand, during most of the stable years, 2004–2005, the CPUE values in the western part are relatively low. In the southern region, the longitudinal transitions in CPUE distributions are not as clear as that in the northern region. However, during most of the stable years, 2004–2005, relatively high CPUE values are found also in the western region 143–155°E during winter to spring season (Figure 3B). In the latter season, swordfish start migrating northward. Thus, the CPUE in the western region 143–155°E is most likely to be a key to induce observed interannual modulations both in the northern and the southern regions. The CPUE-weighted-mean zonal positions of longliners, shown as black lines in Figure 3, reflect the pattern of zonal seasonal migration of the swordfish. In the northern region, it moves mostly eastward during spring to summer, while it turns westward during autumn to winter (Figure 3A). During the unstable period, it can approach to the western region 143–155°E in winter where the high CPUE values appear in the same period, while it does not reach to the western region during the stable period. On the contrary, the CPUE-weighted-mean zonal positions are relatively stationary in the southern region (Figure 3B). This suggests that in the northern region, swordfish distribute more heterogeneously in the zonal direction, depending on seasons and years than the southern region. Because smooth and convoluted KE paths, during the respective stable and unstable phase in the same western part 143–155°E (Figures 2B,D), are caused by less and more active mesoscale eddies, these results imply that the KE stability state and associated mesoscale variabilities in the western region affect largely on the swordfish CPUE values hence also on their relative abundance.
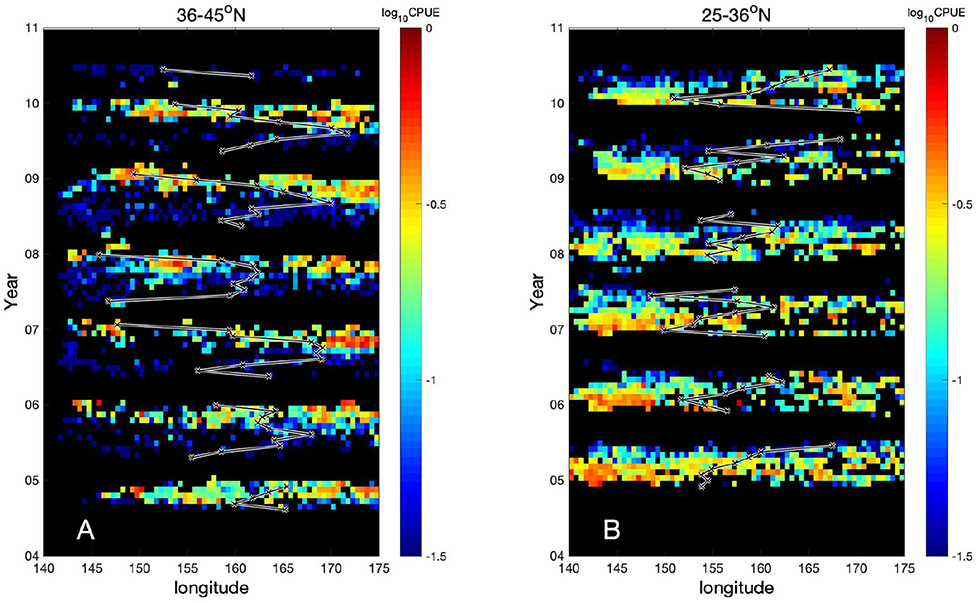
Figure 3. CPUE as a function of longitude and time for (A) northern region 36–45°N and for (B) southern region 25–36°N. Black lines are the CPUE-weighted-mean zonal positions of longliners, which is computed by Σlong[longitude × CPUE/ΣlongCPUE], where Σlong is sum along longitude every month so that sum of CPUE/ΣlongCPUE is 1.
The results in the previous section suggest that the decadal KE variability causes the interannual modulations in the swordfish CPUE. To investigate the CPUE dependency on the water property and its interannual changes, time series of CPUE is computed as a function of temperature and salinity averaged over upper 200 m. In the southern region, high CPUE values (>0.3) are found with high temperature (>18°C) and salinity (>34.7) throughout the study period (Figures S1C,D). On the other hand, in the northern region, high CPUE values are found with wide ranges of temperature (8–23°C) and salinity (33.4–34.9) during the unstable period, 2006–2009 (Figures S1A,B). On the contrary, during the stable phase, these high CPUE values are found only with high temperature and salinity in both regions. Similarly, the CPUE computed on the Temperature-Salinity (T-S) diagram during the unstable period in the northern region shows higher values in the widest ranges of temperature and salinity amongst the regions and periods (Figure S2). These high CPUE values in the northern region, during the unstable phase, are found in higher temperature ranges if compared with those of the same salinity, and in relatively lower salinity ranges at the same temperature (Figure S2A). On the other hand, during the stable period in the northern region, the ranges of temperature and salinity with high CPUE are narrowed and the CPUE values are lower than those in unstable period (Figure S2B). Meanwhile, for southern region, there is no clear difference between unstable and stable period, concentrating high CPUE values at high temperature and salinity ranges (Figures S2C,D), similar to Figures S1C,D.
Since the KE modulation is known to be driven by mesoscale eddies, it is suspected that the swordfish CPUE can also be influenced by the mesoscale flows, leading to the observed interannual CPUE modulations. To understand the role of mesoscale eddies in driving the interannual variations of the CPUE, several dynamic parameters to characterize the mesoscale flows are examined. Figure 4A indicates that, in the northern region, higher CPUE values are mostly associated with negative values of OW (rotating regime) and with negative values of vorticity (anticyclonic vorticity, clockwise rotating flow in the northern hemisphere), suggesting that some physical structures and biological conditions associated with anticyclonic warm-core eddies lead to the high swordfish CPUE. Besides that, CPUE values are higher with slightly positive values of divergence of Q-vector, ∇h·Q (convergence zones), i.e., downwelling motions (Figures 4B,C). The results of these dynamic parameter analyses suggest that the higher CPUE in the northern region is found with negative OW, negative vorticity and positive ∇h·Q (downwelling motions). On the other hand, this tendency (negative vorticity, negative OW and positive ∇h·Q) is subtle in the southern region. This indicates that here these parameters are not useful as in the northern region (Figures 4D–F).
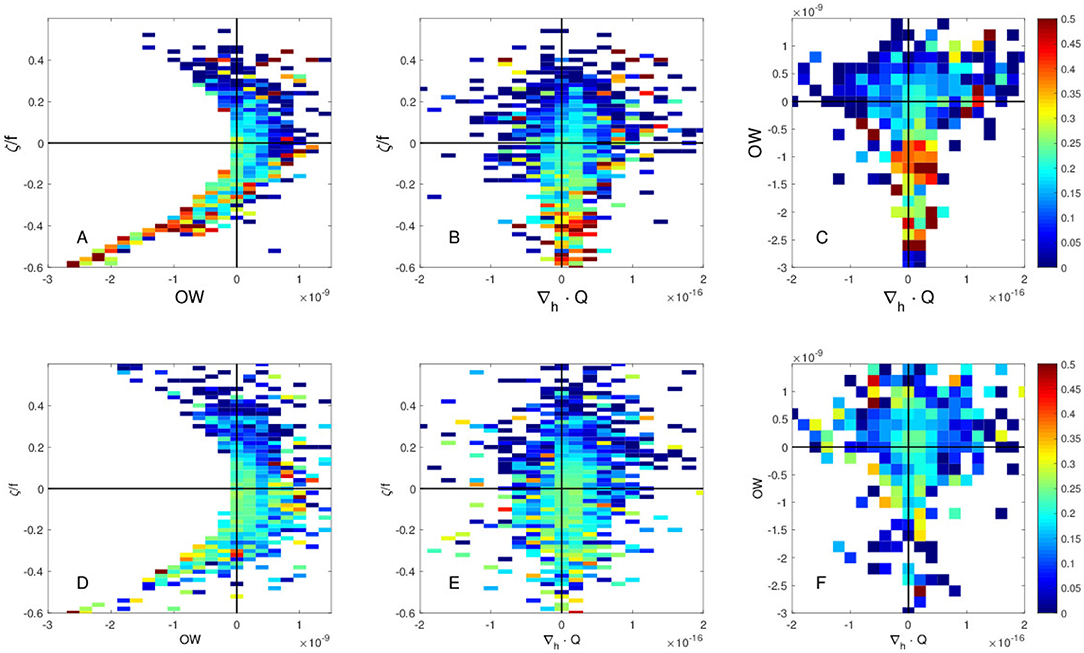
Figure 4. Swordfish CPUE as a function of (A,D) Okubo-Weiss (OW) parameter (2) and vorticity (3) normalized by f Coriolis parameter, ζ/f, (B,E) divergence of Q-vector, ∇h·Q (4) and normalized vorticity ζ/f, and (C,F) divergence of Q-vector and OW for (A–C) the northern region 36–45°N, and for (D–F) the southern region 25–36°N.
To investigate the effects of the KE path modulations on the relationships between above physical parameters and the CPUE, the same analyses are conducted separately for the unstable and the stable KE phases. The results for the unstable phase are found to be very similar to that for the entire period, in which higher CPUE values are found with negative vorticity, negative OW, and slightly positive ∇h·Q in the northern region (Figures 5A–C). It should be noted that these high CPUE values in the unstable phase are even higher compared to that computed for the entire period (Figures 4A–C, 5A–C). In contrast, high CPUE values associated with these parameter ranges are absent in the northern region during the stable phase (Figures 6A–C), being clearly distinguishable in comparison to the unstable phase (Figures 5A–C). In the southern region, no clear trend is found with these parameters regardless of stable or unstable states of the KE (Figures 5D–F, 6D–F).
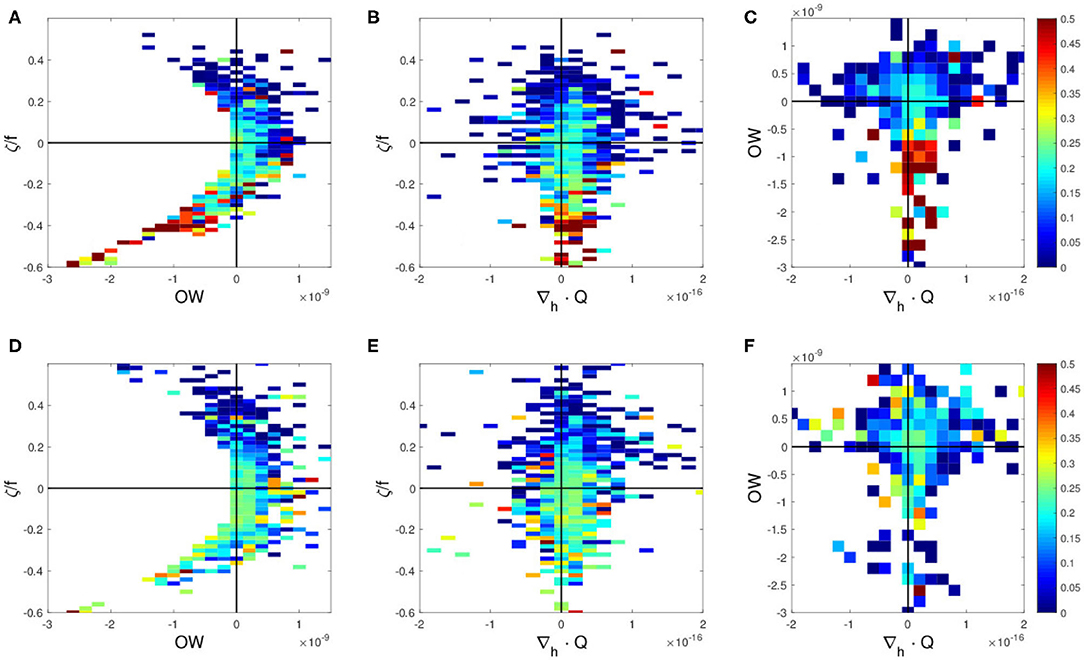
Figure 5. Swordfish CPUE during the unstable period 2006–2009 as a function of (A,D) Okubo-Weiss (OW) parameter (2) and vorticity (3) normalized by f Coriolis parameter, ζ/f, (B,E) divergence of Q-vector, ∇h·Q (4) and normalized vorticity ζ/f, and (C,F) divergence of Q-vector and OW for (A–C) the northern region 36–45°N, and for (D–F) the southern region 25–36°N.
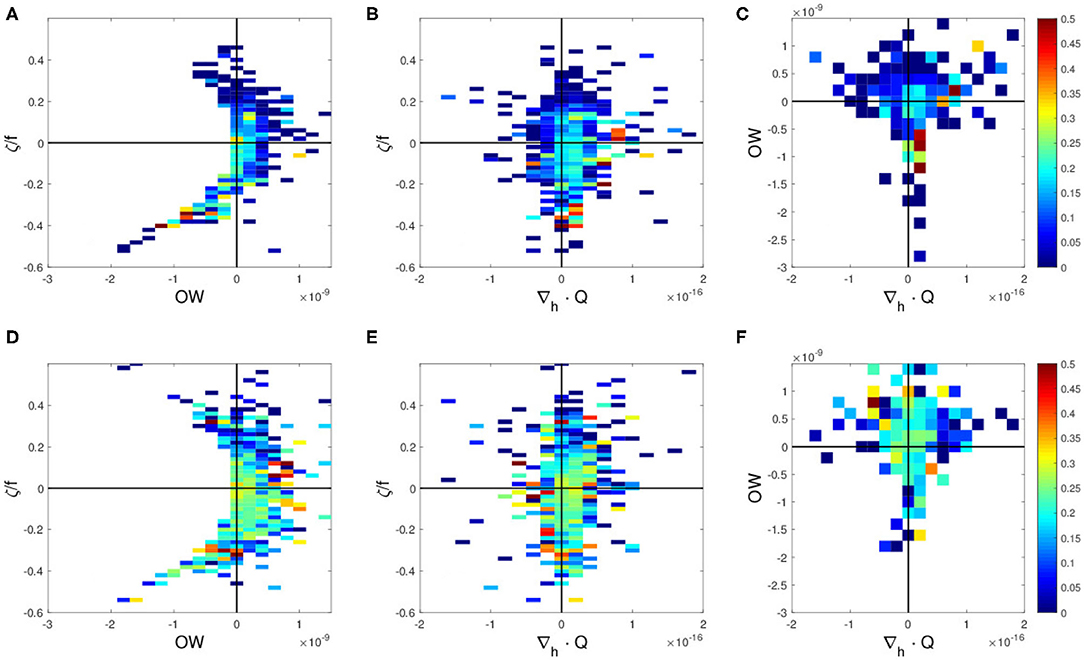
Figure 6. Swordfish CPUE during the stable years 2004–2005 and 2010 as a function of (A,D) Okubo-Weiss (OW) parameter (2) and vorticity (3) normalized by f Coriolis parameter, ζ/f, (B,E) divergence of Q-vector, ∇h·Q (4) and normalized vorticity ζ/f, and (C,F) divergence of Q-vector and OW for (A–C) the northern region 36–45°N, and for (D–F) the southern region 25–36°N.
So far, the results indicate that the higher values of CPUE are formed within anticyclonic eddies with downwelling motion. However, these analyses have not considered eddies explicitly. For this reason, the eddy detection analysis is conducted in order to determine if mesoscale eddies do affect the swordfish CPUE.
The mean CPUE computed for anticyclone (warm-core eddies) (Figure 7A) and cyclone (cold-core eddies) as a function of zonal and meridional distance from the closest detected mesoscale eddy (Figure 7B) shows clearly that the CPUEs in and near the anticyclonic eddies are higher than in cyclonic eddies roughly by a factor of 2–3. It should be noted that, in the anticyclonic eddies, higher CPUEs are found on the northeastern side of the warm-core eddies within the regions of 100 km from the eddy center (Figure 7A). From the mesoscale dynamic parameter analyses presented in the previous section, it is found that the high CPUE values are associated with negative OW, negative relative vorticity, and positive ∇h·Q, which can be interpreted as anticyclonic warm-core eddies with downwelling tendency. This is further supported explicitly by the eddy detection analysis, in which the high CPUE values are found more in and near the anticyclonic warm-core eddies.
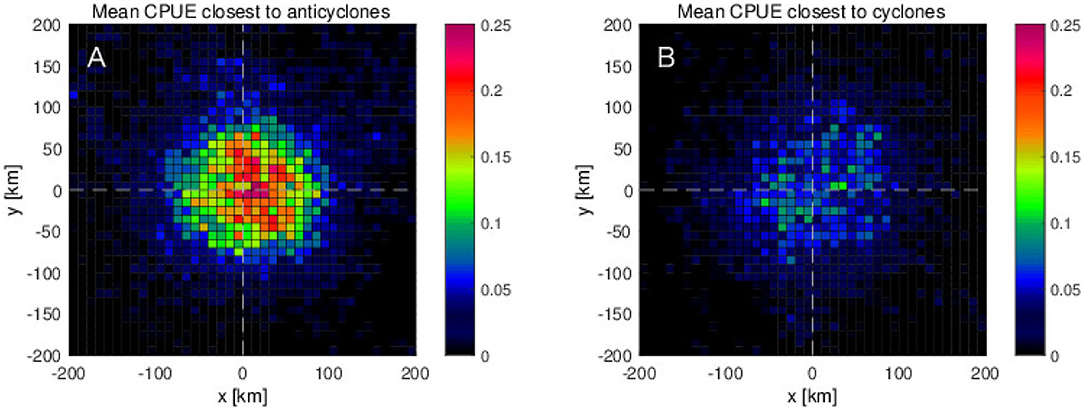
Figure 7. Mean CPUE as a function of distances from the center of eddies along zonal and meridional directions for (A) anticyclonic eddies (or warm-core rings: WCR) and (B) cyclonic eddies (or cold-core rings: CCR), which are closest to each swordfish fishing position.
To clarify where this downwelling tendency accompanied by the higher CPUE occurs with respect to the warm-core eddies, the divergence of Q-vector (∇h·Q) is averaged as a function of distance from the closest eddy for each fishing location regardless of the CPUE values. In the northern region, the average ∇h·Q shows positive values on the eastern side and negative ones on the western side, suggesting that the downwelling and upwelling occur on the eastern and western side of the anticyclones, respectively (Figures 8A,B). On the other hand, for cyclones, downwelling tendency (∇h·Q > 0) is found on the western side, and upwelling (∇h·Q <0) is observed on the eastern side.
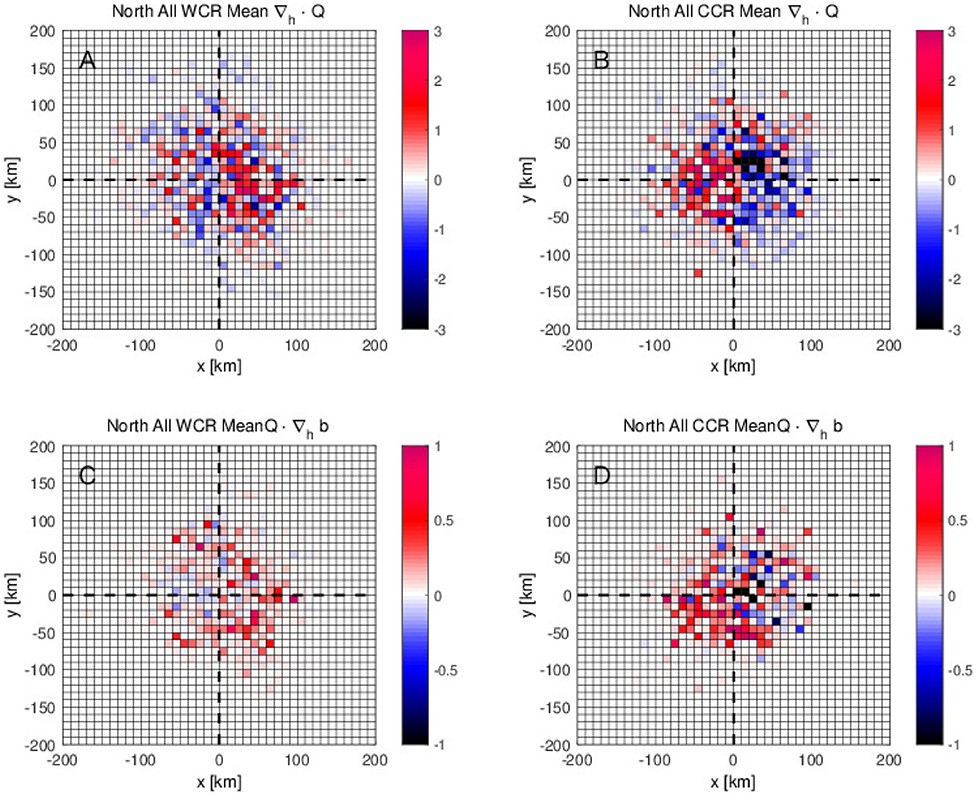
Figure 8. (A,B) Average divergence of Q-vector ∇h·Q (4) and (C,D) average frontogenetical function Q·∇hb (5) as a function of zonal and meridional distance from the center of the closest eddy to the fishing location for (A,C) warm-core rings (WCR) and for (B,D) cold-core rings (CCR) in the northern fishing site.
In addition to the ∇h·Q, the frontogenetical function, Q·∇hb is averaged similarly as a function of zonal and meridional distance from the closest detected mesoscale eddy. In the northern fishing region, anticyclonic eddies present a trend to increase the lateral buoyancy gradient with Q·∇hb > 0 on the eastern edge of the warm-core eddies (Figure 8C). Meanwhile, for cyclones Q·∇hb > 0 is found near the center but on the southwestern side (Figure 8D). Both positive values of Q·∇hb are found in the region of the downwelling tendency, reflecting the typical downwelling (Q·∇hb) expected on the dense side of the front under the frontogenesis (Q·∇hb > 0) (Hoskins, 1971).
To investigate how the interannual variabilities, shown in the previous section, are related with the detected mesoscale eddies, the eddy detection results are analyzed further for the stable and the unstable phases separately. During the unstable phase, the mean CPUE in and near the mesoscale anticyclonic warm-core eddies shows roughly two times higher values than those during the stable phase (Figures 9A,C). The same tendency of higher CPUE during the unstable phase than the stable phase is found for the cyclonic cold-core eddies, although the values of CPUE are about three times smaller than those for the anticyclonic warm-core eddies (Figures 9B,D). Results of the same eddy detection analysis, but limited for the northern region, 36 - 45°N, show the same tendency that the higher CPUEs are found more on the northeastern side of the anticyclonic warm-core rings during the unstable phase (Figure 10). However, this tendency is much weaker in the southern region, 25–36°N where the difference of the CPUEs between stable and unstable phases decreases to about a half of that in the northern region (Figures 10, 11). What is more, in the southern region, the peak of CPUE formed on the northeastern side of the anticyclonic warm-core eddies found in the northern region disappears (Figures 10A, 11A).
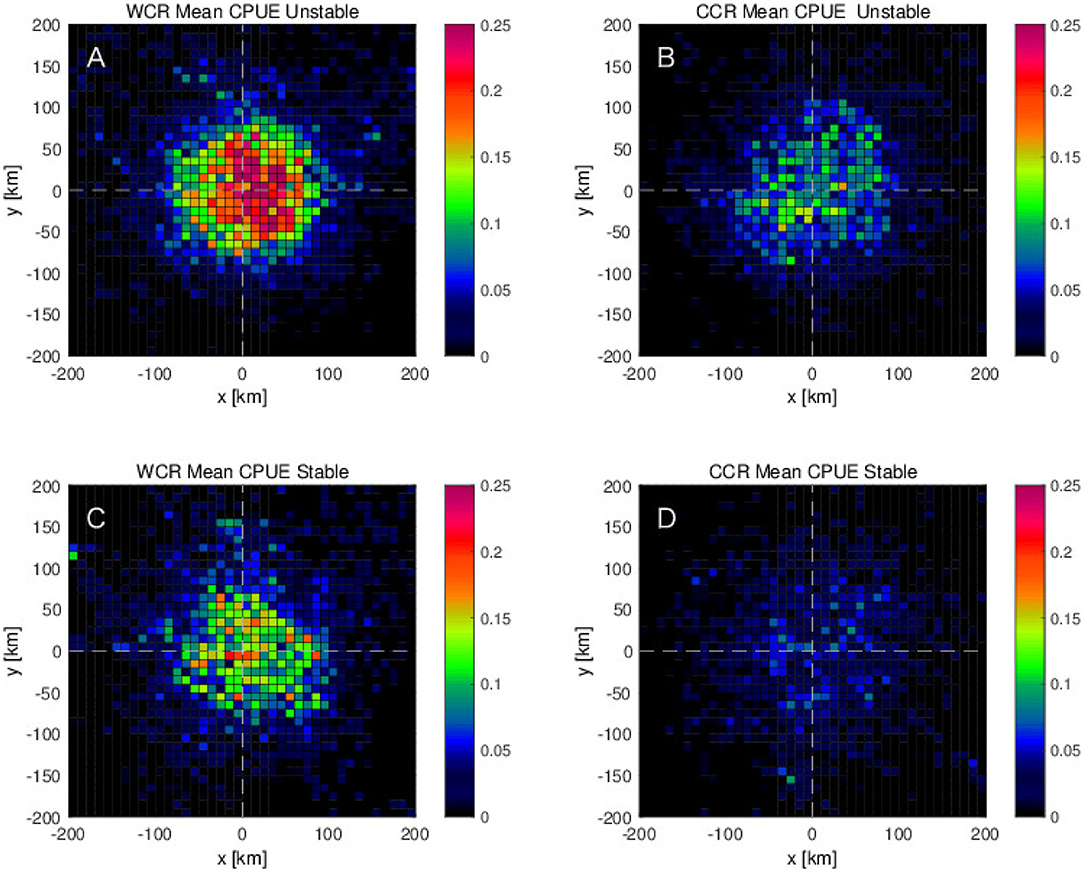
Figure 9. Mean CPUE as a function of distances from the center of eddies along zonal and meridional directions for (A,C) anticyclonic eddies (or warm-core rings: WCR) and (B,D) cyclonic eddies (or cold-core rings: CCR), which are closest to each swordfish fishing position in (A,B) unstable period 2006–2009 and in (C,D) stable period for years 2004, 2005, and 2010.
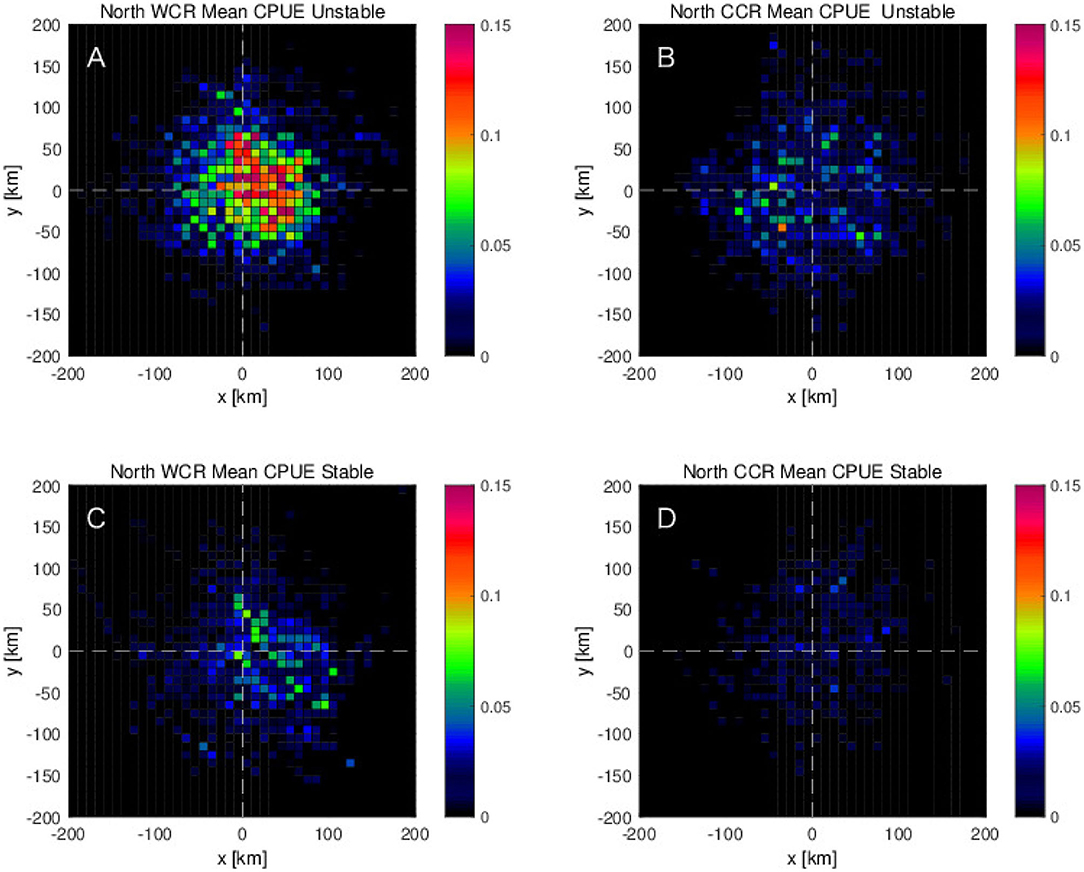
Figure 10. Mean CPUE for the northern region, 140–175°E and 36–45°N as a function of distances from the center of eddies along zonal and meridional directions for (A,C) anticyclonic eddies (or warm-core rings: WCR) and (B,D) cyclonic eddies (or cold-core rings: CCR), which are closest to each swordfish fishing position in (A,B) unstable period 2006–2009 and in (C,D) stable period for years 2004, 2005, and 2010.
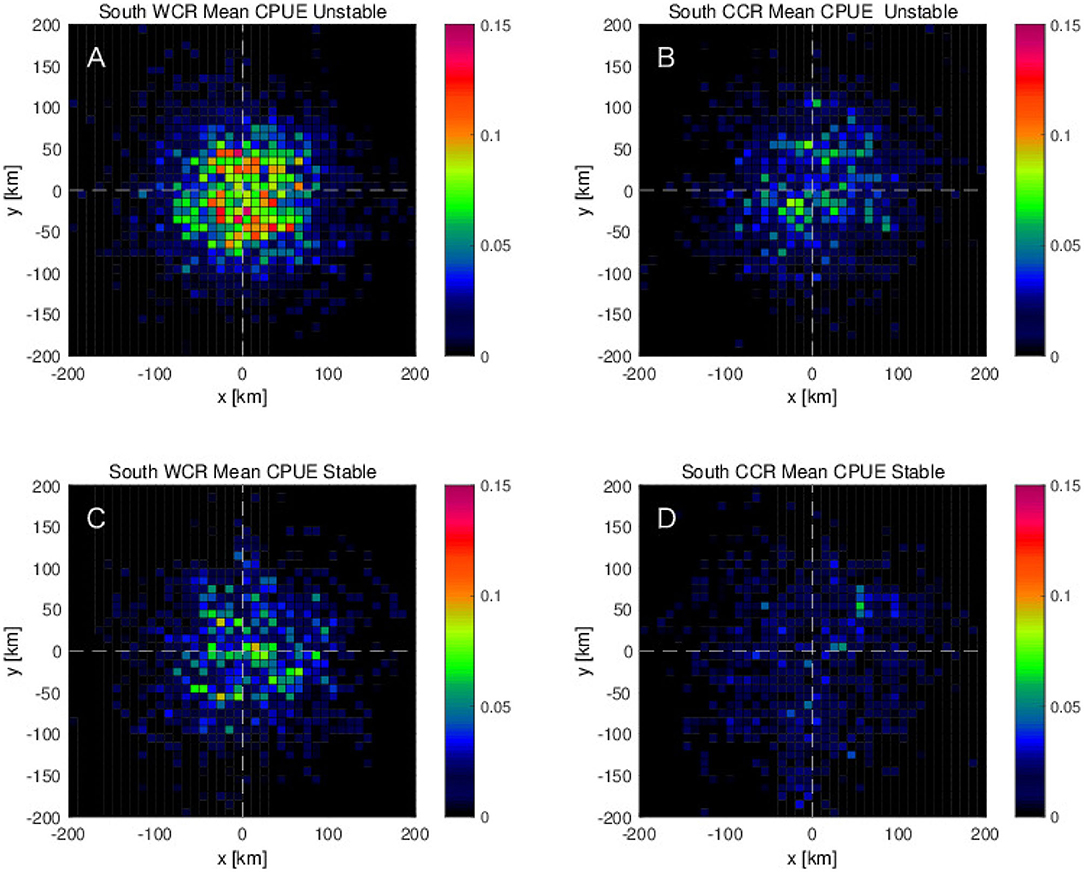
Figure 11. Mean CPUE for the southern region, 140–175°E and 25–36°N as a function of distances from the center of eddies along zonal and meridional directions for (A,C) anticyclonic eddies (or warm-core rings: WCR) and (B,D) cyclonic eddies (or cold-core rings: CCR), which are closest to each swordfish fishing position in (A,B) unstable period 2006–2009 and in (C,D) stable period for years 2004, 2005, and 2010.
These results from the eddy detection analyses suggest that the interannual changes of the swordfish CPUE in the northern region are caused by environmental changes associated with the mesoscale anticyclonic warm-core eddies. Therefore, the number of detected warm-core eddies in the northern region are counted. During the unstable phase in the northern region, 36–45°N, the number of anticyclonic warm-core eddies increases by 15% in comparison to those formed in the stable period. Also, this number exhibits distinct high-frequency seasonal changes with higher values in spring to summer for most of the years except late 2008 (Figure 12).
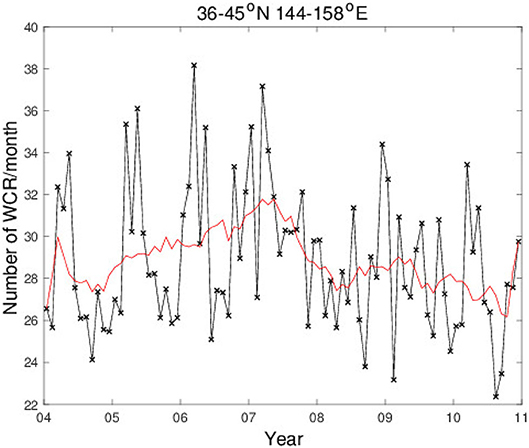
Figure 12. Temporal variation of number of detected warm-core eddies per month, from 2004 through 2010 in the western North Pacific region 144–158°E and 36–45°N, is represented by black cross and line. The red curve shows moving average with a period of a year.
The Eddy Kinetic Energy (EKE), averaged in the upper 100 m depth in the KE region, also shows interannual modulations in response to the variation of the KE states (Figure 13), which is consistent with that in the number of detected mesoscale anticyclonic warm-core rings. During the stable phase (2004–2005, 2010), high EKE values (>0.3 m2s−2) are confined in the relatively narrow region along the straight path with the two meander crests at 144 and 150°E (similar to Figure 2B). On the other hand, during the unstable phase of 2006–2009, the high EKE is more accumulated in the western region, where the Kuroshio Current separates from the Japanese coast. At the same time, the latitudinal extent of the high EKE (>0.3 m2s−2) becomes wider, covering more area in the northern latitudes. These results suggest that the wider high EKE latitudinal extent to the northern region during the unstable phase is caused by more mesoscale eddies including anticyclonic warm-core rings in the same region and period.
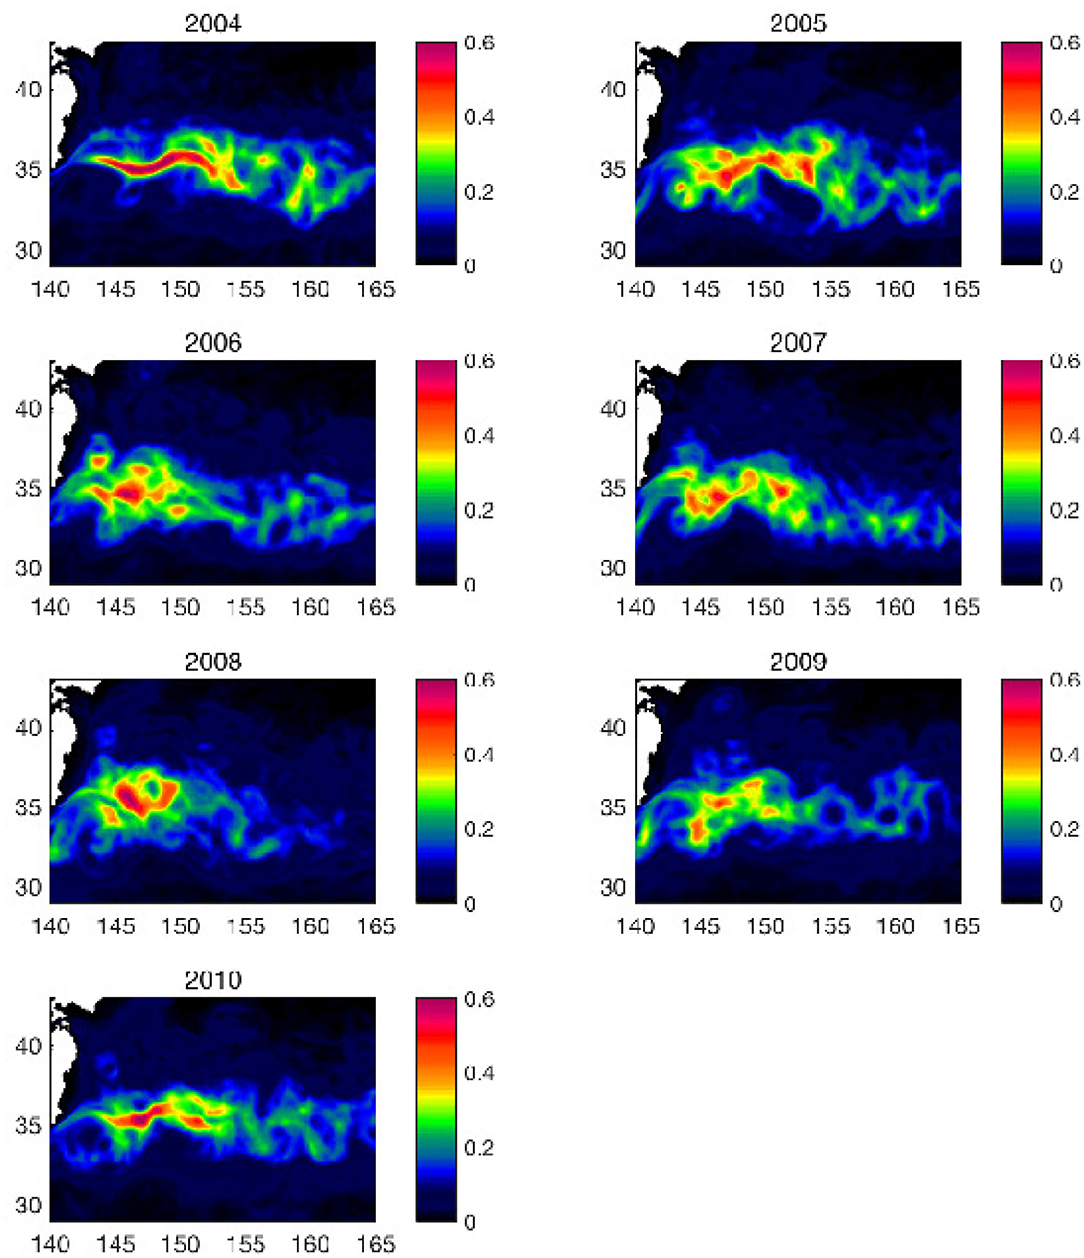
Figure 13. Top 100-m annual mean eddy kinetic energy m2s−2 from 2004 through 2010 obtained from FORA-WNP30 data using (6). The abscissa is longitude (°E) and the ordinate is latitude (°N).
Although several previous studies have found effects of mesoscale physical features, such as the formation of meanders, eddies, and filaments on the distribution of marine species (Sugimoto and Tameishi, 1992; Correa-Ramírez et al., 2007; Vásquez et al., 2013; Hsu et al., 2015; Braun et al., 2019), some of their analyses were limited only to short-term fishery data with a few mesoscale events. Therefore, it has been unclear how the reported results are robust under seasonal and interannual variabilities. Even with intensive dataset over a longer period of time, studies on the interannual changes of pelagic fish distributions and abundance in relation to the mesoscale processes are still very limited. In contrast, the results of this study using relatively long-term (7 years) fishery data with eddy-resolving ocean reanalysis clearly indicate that high swordfish CPUEs are found in and near the anticyclonic eddies. The results are contradictory comparing to the previous study made by Hsu et al. (2015) in the western North Atlantic, in which the high swordfish relative abundance was negatively correlated with presence of mesoscale eddies. It should be noted that these effects on the catch may differ depending on the swordfish stock behavior. Also, the clear tendency of more swordfish in anticyclones, warm-core eddies in the western North Pacific in this study would be the result of the absence of topographic features in the upstream KE region. In contrast, it has been reported in the North Atlantic that swordfish appear to be attracted to complex high-relief bottom structures and complex thermal structures, such as the topography relief of the Charleston Bump (Sedberry, 2001; Sedberry and Loefer, 2001).
In this study, the period for the analyses is divided into two phases based on the interannual KE path modulation, the stable phase for years 2004, 2005, and 2010, and the unstable phase from 2006 through 2009. The results of our analyses using several dynamic parameters, the eddy detection technique, and the eddy kinetic energy in relation to the swordfish CPUE reveal also that the well-known variation in the KE system (Qiu and Chen, 2005; Jiang et al., 2017) could have large influences on the swordfish relative abundance. The swordfish CPUE in the northern region (36–45°N) increases proportionally to the KE path length with higher values during the unstable KE phase, whereas that in the southern region (25–36°N) exhibits an opposite tendency with low values during the unstable phase. These opposite interannual CPUE trends in the northern and southern regions are reminiscent of the north-south seesaw decadal variability found in the surface chlorophyll concentration by Lin et al. (2014). However, while phytoplankton are mostly passive to the flow, swordfish migrates seasonally between subtropical region and the Kuroshio-Oyashio confluent region over several thousands of kilometers.
According to Watanabe et al. (2009), south-north swordfish migrations in the western North Pacific are strongly affected by their feeding ecology, i.e., prey distributions. More presence in the subtropical region (29–34°N) from winter to spring seasons and in the transition zone (35–41°N) from summer to autumn is because of the better feeding conditions. Their defined subtropical region corresponds to the southern region, and the transition zone to the northern region of this study. Therefore, the CPUE peak in late autumn in the northern region, just before the southward migration, and the other peak during winter in the southern region, are due to more presence of swordfish prey in each region. Our results of the north-south seasonal transitions in the CPUE are strikingly similar and consistent with the reported patterns of the swordfish feeding migration (Watanabe et al., 2009), suggesting that seasonal distribution of swordfish in the study area is mainly controlled by the zoogeographical distribution patterns of their prey species.
Besides this feeding migration, it should be noted that swordfish are distributed relative to preferred thermal habitats, i.e., temperature fronts, for energetic gains by riding currents and enhanced feeding regime (Seki et al., 2002). Swordfish migrates toward more favorable areas for their feeding and physical conditions. Even though it is known that this species can be found within the temperature range of 5–27°C and it is frequently found in surface waters at 13°C (Nakamura, 1985), swordfish prefer warm temperatures within the range of 18–22°C (Uda, 1960). This condition is consistent with our results shown in Figures S1C,D, S2C,D, highlighting their preferred warm (18–22°C) and high salinity (>34.7) conditions in the southern region, regardless of the KE stability. Note that temperature and salinity for this analysis were averaged over upper 200 m, which could be deeper than the warm layers at the edges of warm-core eddies and streamers in the northern region, but thinner than the warm salty mode water in the recirculation gyre south of the KE. Therefore, the high CPUE values associated with much wider temperature and salinity ranges in the northern region, especially during the unstable KE phase (Figures S1A,B, S2A), suggest that swordfish can distribute following the surface trapped warm-salty waters of the streamers and warm-core eddies which are more frequently seen during the unstable phase in the region north of the KE.
The most important agents to drive the interannual modulations of CPUE in this northern region are found to be anticyclonic warm-core eddies, especially in the western region 143–155°E (Figures 3A, 6, 12). The high EKE values (>0.3 m2s−2) in the western KE region during unstable phase, with its wider latitudinal extent toward north (Figure 13), are consistent with the increasing number of anticyclonic warm-core eddies in the unstable period (Figure 12). While these anticyclonic eddies move westward as the first baroclinic mode Rossby waves, the warm streamers that are more abundant during the unstable phase, can fuel warm-salty water to the warm-core eddies (Sugimoto et al., 1992; Yasuda et al., 1992). At the same time, near the Japanese coast, these rings move generally northward (Mizuno and White, 1983; Tomosada, 1986; Yasuda et al., 1992), providing more suitable conditions that swordfish can distribute in the northern region. For migrating swordfish, it becomes easier to find warm-salty water due to more warm-core eddies during unstable phase, which the swordfish can utilize during their migrations to the northern feeding sites or to the southern warm-salty habitats and spawning sites.
According to the eddy detection analysis, high CPUE values are found on the northeastern side of the closest anticyclonic warm-core eddies (Figure 9A), especially in the northern region, 36–45°N during the unstable phase (Figure 10A). The high CPUE values on the northeastern side of these anticyclonic warm-core eddies are found to coincide with the positive divergence of Q-vector (∇h·Q > 0), suggesting that swordfish high CPUE values are accompanied by adiabatic downward flow. The result also shows upwelling tendency (∇h·Q <0) on the western side of the warm-core eddies with relatively lower CPUE values. The reasons of upwelling and downwelling on the western and eastern sides of the anticyclonic eddy is, however, unclear. Although recent numerical studies have reported that the dipole pattern of the vertical velocity arises in mesoscale eddies, similar to the patterns shown in Figures 8A,B, adiabatic up- and downwelling do not necessarily occur on the western and eastern side, respectively, of an anticyclone. Their orientation with respect to an eddy depends on how the eddy is detached from a main current (Pilo et al., 2018), and how the Q-vector distributes (Estrada-Allis et al., 2018). Before an anticyclonic ring is detached from the anticyclonic meander of the KE, the upwelling and the downwelling are seen from the meander trough to the crest, and from the crest to the trough, respectively (Bower and Rossby, 1989). The former is on the western side and the latter on the eastern side of the meander crest, where the anticyclonic meander leads respective northward and southward flow on the western and eastern side, while the background isopycnal shoals northward. This implies that the anticyclonic eddies which accommodate swordfish are relatively young, and close to the generation sites keeping the aforementioned up- and downwelling tendencies associated with the meandering patterns. This could be the reason why downwelling tendency is found on the eastern side of the anticyclonic warm-core eddies, where the high CPUE values coincide (Figure 8A).
By extracting the divergence of Q-vector ∇h·Q at each fishing point located only on the northeastern side of the warm-core eddies (a green shape in Figure S3B), it is observed that higher values of ∇h·Q appear in the western regions at 143°E, 148°E, and 152–155°E in the northern fishing site (black line in Figure S3). Furthermore, number of these eddies accompanied by fishing activities on their northeastern side is larger in the same region (red line in Figure S3). This indicates that the warm-core eddies, in the western region, are the main contributors to increase the divergence of Q-vector on the northeastern side of the warm-core eddies. In this western region, the Kuroshio Extension has its meander crests, where many warm-core eddies are generated, supporting our prior speculations that high CPUEs associated with downwelling tendency (∇h·Q >0) on the northeastern side are caused by swordfish being attracted to the young warm-core eddies in the western region.
However, the vertical velocity, induced by the subinertial deformation flow is very small (10−4–10−3 ms−1) in comparison to the typical swimming speed of swordfish, that goes from (1 ms−1) as sustainable cruising speeds for saving energetic costs (Block and Booth, 1992) to the maximum speed (10 ms−1) (He, 2011). Therefore, the downwelling tendency is unlikely to be a controlling factor of swordfish distributions, but some other conditions that coincide with the downwelling tendency should affect them.
Further analysis, using the eddy detection technique with frontogenetical function Q·∇hb, shows that high swordfish CPUEs on the northeastern side of the anticyclonic eddies coincide with the Q·∇hb > 0 (Figure 8C), i.e., frontogenesis or sharpening of the front. The sharp thermal or environmental front generated by the frontogenesis on the eastern side of the young anticylones may act as a lateral environmental barrier. At the same time, sharpened front on the eastern side of a warm-core eddy increases the southward flow. Based on the above analysis, the high CPUEs found in the northern region during unstable KE phase are associated with the young warm-core eddies in the western region 143–155°E (Figure 3A, Figure S3). Note that these high CPUE values occur during autumn to winter seasons, when swordfish migrate north to south. During these returning migrations to the subtropical region, they most likely can encounter the warm-salty water on the northern edge of the warm-core eddies. Following the current of these warm-core eddies, swordfish could use strong southward flows along their eastern side to migrate further south. Although the swordfish can swim against the eddy flow, the strong current of the young anticyclones could induce a net advection effect with their relatively slow cruising swimming speed (1 ms−1).
In addition to these physical structures of the young warm-core eddies, bottom-up biological processes may also attract swordfish. The isothermal shoaling on the western side of the anticyclones could induce upwelling of nutrients, which triggers phytoplankton bloom (Flierl and Davis, 1993) and zooplankton accumulations in the downstream, presumably at the northeastern side of the warm-core eddies. Since swordfish feed on small fish and squids attracted by plankton, these bottom-up mechanisms would also boost the CPUE of the swordfish migrating southward on the northeastern side of the young warm-core eddies. For instance, the neon flying squid Ommastrephes bartramii is one of the swordfish main preys (Watanabe et al., 2009), which presents a similar seasonal latitudinal migration with preference of slightly colder and fresher waters (Tian et al., 2009). The neon flying squid are often found at the edges of warm-core rings for better feeding conditions (Igarashi et al., 2018). When the Oyashio Current reaches to the northern edge of these young warm-core eddies, just north of the KE, it is reported that the abundance of the neon flying squid increases there (Igarashi et al., 2011). This situation would allow the swordfish to feed on the neon flying squid on the northeastern edges, while keeping themselves still inside the preferred thermal habitat near the warm-core eddies. These interpretations for the results in this study can be synthesized into one hypothesis that top-down physical and bottom-up biological processes may sustain high CPUE on the northeastern side of the young warm-core eddies, making swordfish inside the eddies even more easily targeted (Figure 14C).
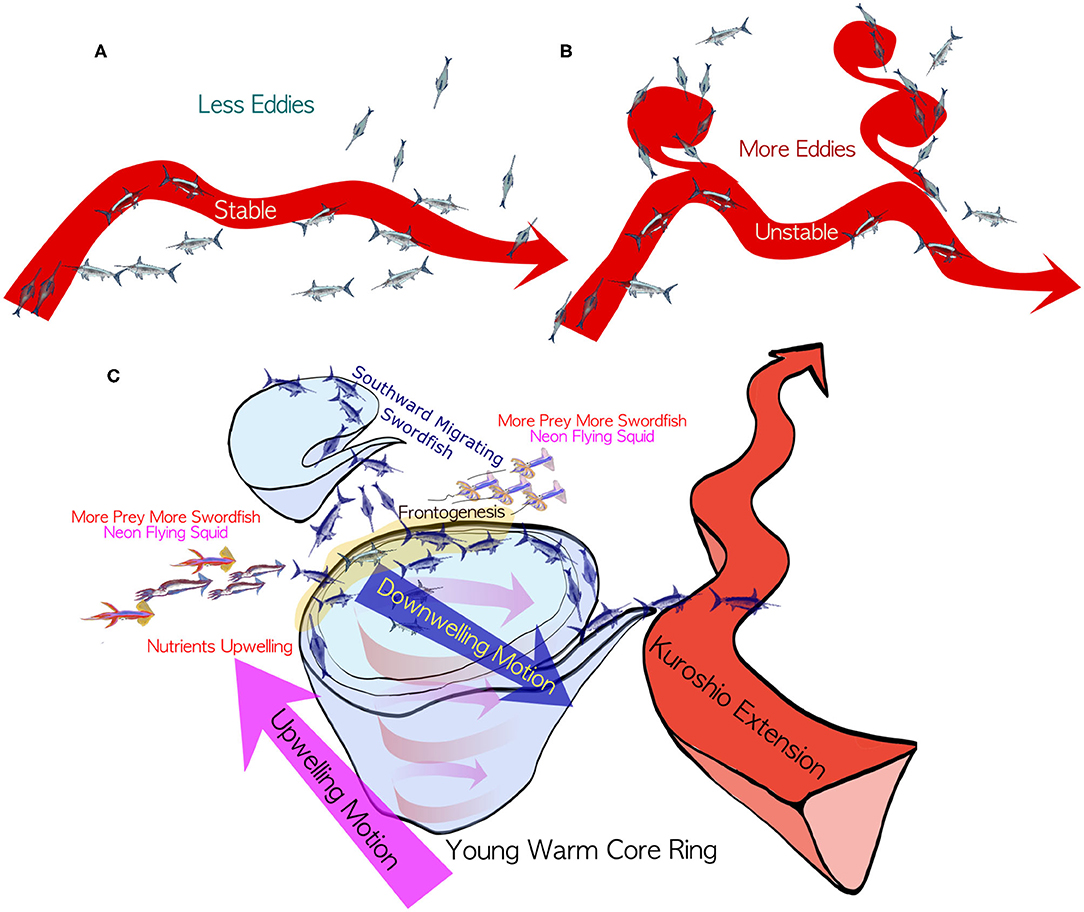
Figure 14. Summary of this study. Schematics for the modulations of the swordfish distributions associated with the Kuroshio Extension path states for (A) stable period in which Kuroshio Extension takes relatively straight path without many warm-core rings and with less northward spreading of swordfish population and for (B) unstable period in which the Kuroshio Extension path exhibits meandering with more warm-core eddies and more swordfish are caught on their northeastern side during southward swordfish migration. The latter (B) unstable period can be characterized by the higher and lower swordfish CPUE in the northern and the southern regions, respectively. The situation reverses during (A) stable period with the lower and higher swordfish CPUE in the northern and the southern regions, respectively. (C) Hypothesis to form high swordfish CPUE on the northeastern side of an anticyclonic warm-core ring. During their southward migration in autumn to winter, they can encounter their favorable warm-salty environment on the north side of the warm-core eddies. Following the flow of the eddies they might be able to migrate south efficiently with the southward flow on the eastern side of the warm-core eddies. When they reach just north of the Kuroshio Extension, they might be attracted by prey enhanced on the northeastern side of the young warm-core eddies by the upwelling on the western side. Note that there is a downwelling tendency on the northeastern side of the young warm-core eddies. See also a supplementary animation at https://doi.org/10.6084/m9.figshare.12818846.v2.
The above hypothesis is partially supported by the CPUE distributions from autumn to winter season in 2006 to 2007 (see Movie S1). In this movie, a warm-core eddy is pinched off from the KE in the middle of October 2006, followed by an appearance of a moderate value of CPUE on the northern edge of this war-core ring in the middle of November. Then, early in December, high CPUE values are seen on the northeastern side of this eddy, which persist until end of December 2006. After this, high CPUE values appear in the recirculation gyre south of the KE without clear associations with the mesoscale eddies until middle of January 2007. It should be noted that the high CPUE values are found along the warm streamer connecting between this warm-core eddy and the meander crest of the KE in the end of January, which are probably due to the southward migrating swordfish using the streamer connected to the subtropical region.
Also, this tendency of higher CPUEs on the northeastern side of the warm-core eddies accompanied by ∇h·Q> 0 are clearer during the unstable period (Figures 9A,C), suggesting that more young warm-core eddies in the western region during the unstable period attract more swordfish. Moreover, as shown in the results, the higher CPUE values during unstable phase in the northern region (Figure 2A) are caused by the higher CPUE in the same western region, 143–155°E (Figure 3A). Therefore, there is clearly an importance of young warm-core eddies in the western region just north of the KE as the drivers of the interannual changes of the swordfish CPUE.
Although the Kuroshio has been known to be nutrient poor near the surface, recent studies have pointed out that the Kuroshio in its subsurface layer is a nutrient stream, similar to the Gulf Stream, transporting a large amount of nutrients from south to the subpolar region, and that the concentrations of nitrate within the nutrient stream is relatively higher compared to ambient water of the same density (Saito, 2019). The higher nutrient concentrations along the Kuroshio nutrient stream is found to persist even in the downstream, the Kuroshio Extension (Nagai et al., 2019). Therefore, warm-core eddies originated from the KE could maintain the positive anomaly in the nutrient concentrations in the subsurface layer, which may enhance the nutrient supply with other physical processes near eddies (Yoshimori et al., 1995; McGillicuddy Jr and Robinson, 1997; Mahadevan and Tandon, 2006; McGillicuddy et al., 2007). These bottom-up processes could possibly sustain relatively better food availability for warm water favorite pelagic fish species within warm-core eddies.
Our analyses using the mesoscale dynamic parameters shown above illustrate that the swordfish CPUE in the northern region is higher when the OW <0, vorticity ζ <0, and ∇h·Q> 0, within the anticyclonic eddies with downwelling flow. However, these parameters do not show any clear trend for the CPUE in the southern region. In the subtropical region, it has been reported that the surface mixed layer eddies generate submesoscale frontal structures, so called submesoscale soup (McWilliams, 2019), which are enhanced during the winter season (Sasaki et al., 2014) when swordfish migrates back to this region. How these submesoscale fronts influence on the distributions of the migrating fish species are currently unknown due to the coarse resolutions of the observation data. While the resolution of the reanalysis data in this study is eddy resolving ~10 km, it is still too coarse to reproduce these submesoscale processes. Also, despite the typical lengths of the lines for the longline fishing exceed several tens of kilometers, the locations of the catches were represented by the ship position when they recovered the gear, that most likely limits the accuracy of the fishing positions. Nevertheless, the results show a clear dependency of the swordfish relative abundance on the mesoscale parameters and anticyclonic eddies, which would have even finer structures to reveal with the improved accuracy and resolutions in future studies.
In this study, using mesoscale parameters derived from FORA-WNP30 dataset and swordfish catch records from pelagic longline fishery data from 2004 through 2010, the swordfish relative abundance in association with the mesoscale physical parameters and their interannual modulations were investigated, with a special emphasis on the mesoscale eddies in the Kuroshio Extension system.
For a clearer understanding of the effects of the KE modulations on the swordfish CPUE, the study area is separated into two regions, the northern region that is between 36 and 45°N, and the southern region between 25 and 36°N, reflecting the seasonal feeding migration of the swordfish (Figure 1). Besides this seasonal variation, interannual changes in the swordfish CPUE are also observed in both regions, which depend strongly on the mesoscale dynamic parameters such as the vorticity, the Okubo-Weiss parameter, and the divergence of Q-vector (Figures 4–6). When the Kuroshio Extension is stable for the years 2004, 2005, and 2010, the eddy kinetic energy shows high values in limited regions along the narrow and stable Kuroshio Extension axis, and the annual swordfish CPUE shows low and high values in the northern and the southern region, respectively. In contrast, when the Kuroshio Extension is unstable for the years 2006 through 2009, the high values of EKE (> 0.3 m2s−2) are more concentrated in the western Kuroshio Extension region, and the annual swordfish CPUE tends to be high and low in the northern and the southern region, respectively, opposite to the stable phase.
The CPUE as a function of the mesoscale dynamic parameters suggests that higher CPUE values are clearly associated with the negative vorticity and the negative Okubo-Weiss parameter (i.e., anticyclonic rotating flows, Figure 4). Consistently, the eddy detection analysis with the CPUE data shows explicitly that the high CPUE values are found in and near the anticyclonic warm-core eddies, especially on their northeastern side (Figure 9). This is probably because, during the southward migration, swordfish encounter the warm-salty waters at the northern edge of the warm-core eddies, and uses the southward flow on their eastern side to migrate south keeping themselves within their preferred warm-salty water environment. Another ecological reason for this is that their main prey, neon flying squid O. bartramii are known to prefer to stay at the edges of warm-core eddies (Figure 14). The further analyses suggest that, in the northern region, the CPUE values in and near the detected anticyclonic eddies are higher during unstable phase than in the stable phase by several factors (Figure 10). These results indicate that the spatiotemporal variabilities in the mesoscale warm-core eddies have a large impact on the swordfish CPUE in the northern fishing site, with more warm-core eddies accompanied by the higher CPUE values during the unstable phase.
In conclusion, more swordfish can be found efficiently on the northeastern side of the warm-core rings emanated from the Kuroshio Extension jet during its unstable phase. It should be noted that, for the first time, the clear interannual modulations in the swordfish CPUE, which can be tightly correlated with the mesoscale warm-core eddies, are shown in the northern Kuroshio Extension region in this study. In the southern region, however, no clear relationship is found between the same set of mesoscale parameters and the swordfish CPUE, despite the clear interannual modulation of CPUE, suggesting that unresolved physical and biological structures, such as those associated with submesoscale processes (Tandon and Nagai, 2019) are more important to control the swordfish relative abundance in this subtropical southern regions. These results and remaining issues call for more studies to correlate more detailed oceanographic parameters with relative abundance of many fish species in the KE system, which has been long-known as one of the richest fishing grounds in the world ocean.
The fishery datasets for this article are not publicly available because the swordfish catch and effort data were collected by cooperation with the captains and crews of commercial longline fisheries vessels in Kesennuma port, Japan, with a legal contract to protect their privacy. Requests to access the datasets should be directed to Fisheries Agency of Japan. However, all the codes to analyze data are available upon request to the corresponding author. The ocean reanalysis data, Four-dimensional Variational Ocean Reanalysis for the western North Pacific (FORA-WNP30), is available from (http://synthesis.jamstec.go.jp/FORA/e/index.html).
KY summarized the fishery data. GD and TN analyzed fishery data and ocean reanalysis data, and provided the figures of the paper. TN conducted eddy-detection analysis. GD provided the first draft of the manuscript. GD, TN, and KY edited the manuscripts. All authors contributed to the article and approved the submitted version.
The authors declare that the research was conducted in the absence of any commercial or financial relationships that could be construed as a potential conflict of interest.
GD and TN thank JASSO (Japan Student Services Organization) for providing support for GD's exchange student program in the academic year 2018 at TUMSAT, PICES for support to let GD give the FIS committee award winning talk on this study in Victoria Canada at PICES 2019, Dr. Akiko Okamoto (Robinson Farm, Amami Island, https://www.robinson-ikka.com/), FRA, Captains, and crew members of fishing vessels at Kesennuma port for the swordfish data. GD thanks continuous supports from parents and Prof. Icochea at UNALM, Peru. This study is supported by Fishery Agency of Japan (JV-Project), and partially supported by SKED (JPMXD0511102330). This study utilized the dataset Four-dimensional Variational Ocean Reanalysis for the western North Pacific (FORA-WNP30), which was produced by Japan Agency for Marine-Science and Technology (JAMSTEC) and Meteorological Research Institute of Japan Meteorological Agency (JMA/MRI).
The Supplementary Material for this article can be found online at: https://www.frontiersin.org/articles/10.3389/fmars.2020.00680/full#supplementary-material
Bedford, D. W., and Hagerman, F. B. (1983). The billfish fishery resource of the California Current. Calif. Coop. Ocean. Fish. Invest. Rep. 24, 70–78.
Bellido, J., Pierce, G., and Wang, J. (2001). Modelling intra-annual variation in abundance of squid Loligo forbesi in Scottish waters using generalised additive models. Fish. Res. 52, 23–39. doi: 10.1016/S0165-7836(01)00228-4
Bigelow, K. A., Boggs, C. H., and He, X. (1999). Environmental effects on swordfish and blue shark catch rates in the US North Pacific longline fishery. Fish. Oceanogr. 8, 178–198. doi: 10.1046/j.1365-2419.1999.00105.x
Block, B. A., and Booth, D. (1992). Direct measurement of swimming speeds and depth of blue marlin. J. Exp. Biol. 166, 267–284.
Bluestein, H. B. (1993). Synoptic-dynamic Meteorology in Midlatitudes. Volume II: Observations and Theory of Weather Systems. New York, NY: Oxford University Press.
Bower, A. S., and Rossby, T. (1989). Evidence of cross-frontal exchange processes in the Gulf Stream based on isopycnal rafos float data. J. Phys. Oceanogr. 19, 1177–1190. doi: 10.1175/1520-0485(1989)019<1177:EOCFEP>2.0.CO;2
Braun, C. D., Gaube, P., Sinclair-Taylor, T. H., Skomal, G. B., and Thorrold, S. R. (2019). Mesoscale eddies release pelagic sharks from thermal constraints to foraging in the ocean twilight zone. Proc. Natl. Acad. Sci. U.S.A. 116, 17187–17192. doi: 10.1073/pnas.1903067116
Correa-Ramírez, M., Hormazabal, S., and Yuras, G. (2007). Mesoscale eddies and high chlorophyll concentrations off central Chile (29°”39°S). Geophys. Res. Lett. 34:L12604. doi: 10.1029/2007GL029541
Cushing, D. H. (1981). Fisheries Biology: A Study in Population Dynamics. Madison, WI: University of Wisconsin Press.
Estrada-Allis, S. N., Barceló-Llull, B., Pallás-Sanz, E., Rodríguez-Santana, A., Souza, J. M. A. C., Mason, E., et al. (2018). Vertical velocity dynamics and mixing in an anticyclone near the Canary Islands. J. Phys. Oceanogr. 49, 431–451. doi: 10.1175/JPO-D-17-0156.1
Flierl, G. R., and Davis, C. S. (1993). Biological effects of Gulf Stream meandering. J. Mar. Res. 51, 529–560. doi: 10.1357/0022240933224016
He, P. (2011). Behavior of Marine Fishes: Capture Processes and Conservation Challenges. Iowa, IA: John Wiley & Sons. doi: 10.1002/9780813810966
Hoskins, B. J. (1971). Atmospheric frontogenesis models: some solutions. Q. J. R. Meteorol. Soc. 97, 139–153. doi: 10.1002/qj.49709741202
Hsu, A. C., Boustany, A. M., Roberts, J. J., Chang, J.-H., and Halpin, P. N. (2015). Tuna and swordfish catch in the US northwest Atlantic longline fishery in relation to mesoscale eddies. Fish. Oceanogr. 24, 508–520. doi: 10.1111/fog.12125
Igarashi, H., Awaji, T., Kamachi, M., Ishikawa, Y., Usui, N., Fujii, Y., et al. (2011). “A statistical approach to identify optimal habitat suitability of neon flying squid in Northwestern North Pacific by using satellite datasets and 3-D ocean data assimilation product,” in North Pacific Marine Science Organization (PICES)-2011 Meeting (Khabarovsk).
Igarashi, H., Saitoh, S.-I., Ishikawa, Y., Kamachi, M., Usui, N., Sakai, M., and Imamura, Y. (2018). Identifying potential habitat distribution of the neon flying squid (Ommastrephes bartramii) off the eastern coast of Japan in winter. Fish. Oceanogr. 27, 16–27. doi: 10.1111/fog.12230
Jiang, W., Peng, L., Jin, T., and Zhang, S. (2017). Variability of the Kuroshio Extension system in 1992-2013 from satellite altimetry data. Geodesy Geodyn. 8, 103–110. doi: 10.1016/j.geog.2016.12.004
Lévy, M., Klein, P., and Treguier, A.-M. (2001). Impact of sub-mesoscale physics on production and subduction of phytoplankton in an oligotrophic regime. J. Mar. Res. 59, 535–565. doi: 10.1357/002224001762842181
Lin, P., Chai, F., Xue, H., and Xiu, P. (2014). Modulation of decadal oscillation on surface chlorophyll in the Kuroshio Extension. J. Geophys. Res. 119, 187–199. doi: 10.1002/2013JC009359
Mahadevan, A., and Archer, D. (2000). Modeling the impact of fronts and mesoscale circulation on the nutrient supply and biogeochemistry of the upper ocean. J. Geophys. Res. 105, 1209–1225. doi: 10.1029/1999JC900216
Mahadevan, A., D'Asaro, E., Lee, C., and Perry, M. J. (2012). Eddy-driven stratification initiates North Atlantic spring phytoplankton blooms. Science 337, 54–58. doi: 10.1126/science.1218740
Mahadevan, A., and Tandon, A. (2006). An analysis of mechanisms for submesoscale vertical motion at ocean fronts. Ocean Model. 14, 241–256. doi: 10.1016/j.ocemod.2006.05.006
McGillicuddy, D. J., Anderson, L. A., Bates, N. R., Bibby, T., Buesseler, K. O., Carlson, C. A., et al. (2007). Eddy/wind interactions stimulate extraordinary mid-ocean plankton blooms. Science 316, 1021–1026. doi: 10.1126/science.1136256
McGillicuddy, D. Jr, and Robinson, A. (1997). Eddy-induced nutrient supply and new production in the Sargasso Sea. Deep-Sea Res. Part I 44, 1427–1450. doi: 10.1016/S0967-0637(97)00024-1
McWilliams, J. C. (2019). A survey of submesoscale currents. Geosci. Lett. 6, 1–15. doi: 10.1186/s40562-019-0133-3
Mizuno, K., and White, W. B. (1983). Annual and interannual variability in the Kuroshio Current system. J. Phys. Oceanogr. 13, 1847–1867. doi: 10.1175/1520-0485(1983)013<1847:AAIVIT>2.0.CO;2
Nagai, T., Clayton, S., and Uchiyama, Y. (2019). “Multiscale routes to supply nutrients through the Kuroshio nutrient stream,” in Kuroshio Current: Physical, Biogeochemical and Ecosystem Dynamics, eds T. Nagai, H. Saito, K, Suzuki, M. Takahashi (Washington, DC: AGU-Wiley), 105–125. doi: 10.1002/9781119428428.ch6
Nagai, T., Gruber, N., Frenzel, H., Lachkar, Z., McWilliams, J. C., and Plattner, G.-K. (2015). Dominant role of eddies and filaments in the offshore transport of carbon and nutrients in the California Current System. J. Geophys. Res. 120, 5318–5341. doi: 10.1002/2015JC010889
Nakamura, I. (1985). FAO Species Catalogue: Vol. 5. Billfishes of the World. FAO Fisheries Synopsis. 125:65.
Okubo, A. (1979). Horizontal dispersion of floatable particles in the vicinity of velocity singularities such as convergences. Deep Sea Research and Oceanographic Abstracts, 17, 445–454.
Pettersen, S. (1956). Weather Analysis and Forecasting: Volume I: Motion and Motion Systems. New York, NY: McGraw-Hill.
Pilo, G. S., Oke, P. R., Coleman, R., Rykova, T., and Ridgway, K. (2018). Patterns of vertical velocity induced by eddy distortion in an ocean model. J. Geophys. Res. 123, 2274–2292. doi: 10.1002/2017JC013298
Qiu, B., and Chen, S. (2005). Variability of the Kuroshio Extension jet, recirculation gyre, and mesoscale eddies on decadal time scales. J. Phys. Oceanogr. 35, 2090–2103. doi: 10.1175/JPO2807.1
Qiu, B., and Chen, S. (2010). Eddy-mean flow interaction in the decadally modulating Kuroshio Extension system. Deep-Sea Res. Part II 57, 1098–1110. doi: 10.1016/j.dsr2.2008.11.036
Qiu, B., Chen, S., and Hacker, P. (2004). Synoptic-scale air-sea flux forcing in the western North Pacific: observations and their impact on SST and the mixed layer. J. Phys. Oceanogr. 34, 2148–2159. doi: 10.1175/1520-0485(2004)034<2148:SAFFIT>2.0.CO;2
Qiu, B., Chen, S., Schneider, N., and Taguchi, B. (2014). A coupled decadal prediction of the dynamic state of the Kuroshio Extension system. J. Clim. 27, 1751–1764. doi: 10.1175/JCLI-D-13-00318.1
Saito, H. (2019). “The Kuroshio: its recognition, scientific activities and emerging issues,” in Kuroshio Current: Physical, Biogeochemical and Ecosystem Dynamics, eds T. Nagai, H. Saito, K, Suzuki, M. Takahashi (Washington, DC, AGU-Wiley), 1–11. doi: 10.1002/9781119428428.ch1
Sasaki, H., Klein, P., Qiu, B., and Sasai, Y. (2014). Impact of oceanic-scale interactions on the seasonal modulation of ocean dynamics by the atmosphere. Nat. Commun. 5:5636. doi: 10.1038/ncomms6636
Sedberry, G., and Loefer, J. (2001). Satellite telemetry tracking of swordfish, Xiphias gladius, off the eastern United States. Mar. Biol. 139, 355–360. doi: 10.1007/s002270100593
Sedberry, G. R. (2001). The Charleston Bump: An Island of Essential Fish Habitat in the Gulf Stream. Island in the stream: Oceanography and fisheries of the Charleston Bump, 3–24.
Seki, M. P., Polovina, J. J., Kobayashi, D. R., Bidigare, R. R., and Mitchum, G. T. (2002). An oceanographic characterization of swordfish (Xiphias gladius) longline fishing grounds in the springtime subtropical North Pacific. Fish. Oceanogr. 11, 251–266. doi: 10.1046/j.1365-2419.2002.00207.x
Skalski, J. R., Ryding, K. E., and Millspaugh, J. (2010). Wildlife Demography: Analysis of Sex, Age, and Count Data. Elsevier.
Sugimoto, S., and Hanawa, K. (2009). Decadal and interdecadal variations of the Aleutian low activity and their relation to upper oceanic variations over the North Pacific. J. Meteorol. Soc. Jpn. Ser. II 87, 601–614. doi: 10.2151/jmsj.87.601
Sugimoto, T., Kawasaki, Y., and Li, J. (1992). A description of the time-dependent hydrographic structure of the warm streamer around the Kuroshio warm-core ring 86B. Deep-Sea Res. Part A 39, S77–S96. doi: 10.1016/S0198-0149(11)80006-3
Sugimoto, T., and Tameishi, H. (1992). Warm-core rings, streamers and their role on the fishing ground formation around Japan. Deep-Sea Res. Part A 39, S183–S201. doi: 10.1016/S0198-0149(11)80011-7
Taguchi, B., Xie, S.-P., Schneider, N., Nonaka, M., Sasaki, H., and Sasai, Y. (2007). Decadal variability of the Kuroshio Extension: observations and an eddy-resolving model hindcast. J. Clim. 20, 2357–2377. doi: 10.1175/JCLI4142.1
Tandon, A., and Nagai, T. (2019). “Mixing associated with submesoscale processes,” in Encyclopedia of Ocean Sciences, 3rd Edition, eds H. K. Cochran, H. J. Bokuniewicz, and P. L. Yger (Amsterdam: Elsevier). doi: 10.1016/B978-0-12-409548-9.10952-2
Tian, S., Chen, X., Chen, Y., Xu, L., and Dai, X. (2009). Evaluating habitat suitability indices derived from CPUE and fishing effort data for Ommatrephes bratramii in the northwestern Pacific Ocean. Fish. Res. 95, 181–188. doi: 10.1016/j.fishres.2008.08.012
Tomosada, A. (1986). Generation and decay of Kuroshio warm-core rings. Deep-Sea Res. Part A 33, 1475–1486. doi: 10.1016/0198-0149(86)90063-4
Uda, M. (1960). Fisheries oceanography in Japan, especially on the principles of fish distribution, concentration, dispersal and fluctuation. CalCOFI Reports 8, 25–31.
Usui, N., Wakamatsu, T., Tanaka, Y., Hirose, N., Toyoda, T., Nishikawa, S., et al. (2017). Four-dimensional variational ocean reanalysis: a 30-year high-resolution dataset in the western North Pacific (FORA-WNP30). J. Oceanogr. 73, 205–233. doi: 10.1007/s10872-016-0398-5
Vásquez, S., c, M., Parada, C., and Sepúlveda, A. (2013). The influence of oceanographic processes on jack mackerel (Trachurus murphyi) larval distribution and population structure in the southeastern Pacific Ocean. ICES J. Mar. Sci. 70, 1097–1107. doi: 10.1093/icesjms/fst065
Watanabe, H., Kubodera, T., and Yokawa, K. (2009). Feeding ecology of the swordfish Xiphias gladius in the subtropical region and transition zone of the western North Pacific. Mar. Ecol. Prog. Ser. 396, 111–122. doi: 10.3354/meps08330
Weiss, J. (1991). The dynamics of enstrophy transfer in two-dimensional hydrodynamics. Phys. D 48, 273–294. doi: 10.1016/0167-2789(91)90088-Q
Yasuda, I., Okuda, K., and Hirai, M. (1992). Evolution of a Kuroshio warm-core ring–variability of the hydrographic structure. Deep-Sea Res. Part A 39, S131–S161. doi: 10.1016/S0198-0149(11)80009-9
Keywords: interannual modulation, mesoscale eddies, Kuroshio Extension decadal modulation, eddy detection technique, swordfish fishery, CPUE
Citation: Durán Gómez GS, Nagai T and Yokawa K (2020) Mesoscale Warm-Core Eddies Drive Interannual Modulations of Swordfish Catch in the Kuroshio Extension System. Front. Mar. Sci. 7:680. doi: 10.3389/fmars.2020.00680
Received: 27 March 2020; Accepted: 27 July 2020;
Published: 28 August 2020.
Edited by:
Shoshiro Minobe, Hokkaido University, JapanReviewed by:
Yasumasa Miyazawa, Japan Agency for Marine-Earth Science and Technology (JAMSTEC), JapanCopyright © 2020 Durán Gómez, Nagai and Yokawa. This is an open-access article distributed under the terms of the Creative Commons Attribution License (CC BY). The use, distribution or reproduction in other forums is permitted, provided the original author(s) and the copyright owner(s) are credited and that the original publication in this journal is cited, in accordance with accepted academic practice. No use, distribution or reproduction is permitted which does not comply with these terms.
*Correspondence: Gloria Silvana Durán Gómez, c2lsdmFuYWRnMjBAaG90bWFpbC5jb20=
Disclaimer: All claims expressed in this article are solely those of the authors and do not necessarily represent those of their affiliated organizations, or those of the publisher, the editors and the reviewers. Any product that may be evaluated in this article or claim that may be made by its manufacturer is not guaranteed or endorsed by the publisher.
Research integrity at Frontiers

Learn more about the work of our research integrity team to safeguard the quality of each article we publish.