 Taylor Goelz
 Troy Hartley1,3
 Inga Carboni
- 1Department of Fisheries Science, Virginia Institute of Marine Science, Gloucester Point, VA, United States
- 2NOAA Oceanic and Atmospheric Research, Silver Spring, MD, United States
- 3Virginia Sea Grant, Gloucester Point, VA, United States
- 4William & Mary, Mason School of Business, Williamsburg, VA, United States
Scientific models are increasingly being used to support participatory natural resources management decision making processes. These models allow stakeholders and scientists to explore potential policy and management options and can help facilitate discussion surrounding concerning uncertainty and different sources of knowledge. The unique benefits of participatory modeling processes, however, are contingent upon stakeholders understanding of, engagement with, and willingness to use the scientific models as sources of knowledge and information. Little is known, however, about how stakeholders view scientific models within these processes. We examined changes in stakeholders’ attitudes toward scientific models over the course of OysterFutures, a 2-year, facilitated participatory modeling process that aimed to create consensus recommendations for oyster management in the Choptank River Complex, MD, United States. Five ordered logistic regression models were used to test hypotheses concerning the impact of social network measures, factors related to the participatory modeling process itself, and stakeholder characteristics on salience, credibility and legitimacy (SCL) attitudes toward models. Results suggested that stakeholders’ ways of knowing was a significant driver of salience, credibility and legitimacy elements of attitudes toward models. Additionally, acting as a gatekeeper within the social network resulted in significantly lower attitudes toward model credibility. These results indicate that the scientific model acted as a boundary object that facilitated discussion during the participatory modeling process. By better understanding the factors that influence model attitude formation, these processes can adjust their design and function to better take advantage of these models. Additionally, practitioners can have more realistic expectations concerning the role of models within participatory, collaborative natural resources decision-making processes.
Introduction
The growing complexity of natural resources management problems has necessitated the involvement of a wider scope and variety of knowledge in decision-making processes. This bypasses the narrower focus utilized in more “traditional” decision making (Rouwette et al., 2011). Obtaining a wider scope of knowledge is accomplished through the involvement of a range of stakeholders into decision-making processes (Armitage et al., 2008). The diversity of knowledge and values that stakeholders bring to the table has been suggested to led to more effective, higher quality, more inclusive, and longer lasting policies (Reed, 2008; Allen et al., 2013).
The manner in which stakeholders participate in the decision-making process varies. Recently, scientific models have been increasingly used to facilitate participation in decision-making processes. Modeling in this context, where scientific modeling is linked with some form of stakeholder participation is called “participatory modeling” (Dreyer and Renn, 2011). Decision-making processes incorporate models into their process because of the theorized enhanced ability of scientific models to conceptualize “the inherent complexity of natural systems” (Robles-Morua et al., 2014, p. 274). This is especially important as problems in natural resources management today are increasingly “wicked”; they are more complex, have high levels of uncertainty, lack structure and have ambiguous solutions (Rittel and Weber, 1973).
Participatory modeling processes have advantages when addressing wicked problems because they are flexible instruments that can help “facilitate and structure discussions between scientists and stakeholders” concerning uncertainty and different sources of knowledge (White et al., 2010; Röckmann et al., 2012, p. 1,072). The ability of participatory modeling processes to address complex natural resources questions has led to its growing application in natural resource management contexts, ranging from farming and agriculture (Podestá et al., 2013), to watershed management (Voinov and Gaddis, 2008) to fisheries (Haapasaari et al., 2012).
In addition to management and system-wide impacts, participatory modeling processes are suggested to influence the participating stakeholders (Pahl-Wostl, 2002; Rouwette et al., 2002). Through the act of model building and discussions, participatory modeling processes can facilitate social learning, form or strengthen stakeholder connections and create similar attitudes through consensus-building (Gray et al., 2014; Henly-Shepard et al., 2015). However, the unique benefits of participatory modeling processes are contingent upon stakeholders’ understanding of, engagement with, and willingness to use the scientific models as sources of knowledge and information. Liu et al. (2008) argue that knowledge sources, like scientific models, must meet various stakeholder expectations for the model to be utilized. Cash et al. (2003) framed these knowledge (and therefore model) expectations into three categories, salience, credibility, and legitimacy (SCL). Stakeholders will see models as more effective and will be more likely to use models, if models meet their expectations for salience, credibility and legitimacy.
A combination of social network analysis statistical methods and ordered logistic regressions were used to test hypotheses related to how stakeholders formed their attitudes toward models during OysterFutures. The hypotheses can be divided into those concerning the participatory modeling process and stakeholder characteristics (PM) and those concerning the impact of social network factors (SN). Within these hypotheses, and throughout the manuscript, the use of the phrase “higher attitudes” means more positive attitudes and the phrase “lower attitudes” means more negative attitudes.
1. PMH1 – Stakeholder group membership (stakeholder groups) in OysterFutures will impact SCL attitudes toward models and
2. PMH1b – Not all Stakeholder Groups will have the same attitudes toward models.
3. PMH2 – Increased participation in the workshops over time will positively impact stakeholders’ SCL attitudes toward models.
4. PMH3 – More years of experience will increase attitudes toward models and
5. PMH3b – Differences in Stakeholder Groups ways of knowing will result in different impacts of years of experience.
6. SNH1 – An actor’s type and extent of brokerage function in the social network (gatekeeper and liaison) will positively relate to attitudes toward models – the more of a broker an actor is, the higher SCL attitudes toward models will be.
7. SNH2 – Lower degree centrality scores will result in lower SCL attitudes; the less connected an individual is in the network, the more capable they are of being influenced to change their attitudes toward models because the pull of group norms is weaker.
We are examining longitudinal changes in stakeholder’s attitudes toward models due to factors related to participation in participatory modeling processes, stakeholder characteristics, and elements of social network structure. The work presented here addresses a knowledge gap in the literature concerning the impacts of participatory modeling processes on participants, focusing on changes in attitudes toward models. Measuring stakeholder’s attitudes throughout a participatory modeling process, not just at the beginning and end, is crucial due to their dynamic nature (Sarkki et al., 2015). Assessing attitudes over time allows us to better understand the nature of attitude formation and better attribute any attitude changes to the process itself. For further discussion on factors impacting attitude formation, background on participatory modeling processes, and the social network analysis concept of brokerage, see the Supplementary Material.
Materials and Methods
Data Collection
We used survey instruments, observations and interviews to examine changes in stakeholders’ attitudes toward scientific models over the course of OysterFutures, the participatory modeling process which was the setting for the study. All work was approved by William & Mary’s IRB Board. Twenty-nine stakeholders representing eight stakeholder groups (scientists, facilitators, seafood buyers, aquaculturists, watermen, environmental groups, recreational fishers, and state and federal government officials) participated in nine workshops over the course of 25 months. The aim of the OysterFutures process was to use a scientific model (focused on the Choptank River Complex) to inform the creation of consensus recommendations for the Maryland oyster fishery. A questionnaire distributed at the beginning of each of the nine workshops was used to gather data on stakeholders’ communication networks and their attitudes toward models. Timing of the questionnaires immediately before a workshop captured changes in networks since the previous workshop, acting as a lagged response. The questionnaire took between 15 and 30 min to complete.
The communication social network question examined the frequency of communication between the stakeholders participating in the OysterFutures process. The stakeholder communication network was examined because of the role of communication in creating motivations and influencing attitudes (Hartley, 2010; Rantala et al., 2017). Networks were measured over time to examine changes in network structure and node position. In addition to detecting changes, longitudinal analysis of networks allows any changes to be assessed “as a consequence of certain [network] structures and not others” (Berardo, 2014, p. 218).
Stakeholders were presented with a roster of OysterFutures participants and asked to report their frequency of communication since the previous workshop. For this study, any form of information or resources exchange within and beyond the scope of the OysterFutures process were considered equal instances of communication. Choices for communication frequency ranged from “Never” to “1 or more times per day,” creating a 0–5 Likert scale (Likert, 1932; Boone and Boone, 2012). Instances where no level of communication frequency was reported were recorded as 0, no communication existing between the stakeholders during that period. The frequency of communication for Workshop 1 acted as a baseline, providing the initial level of communication between stakeholders before the OysterFutures process.
Within the same questionnaire, stakeholders were asked to report their attitudes toward scientific models. Scientific models were defined as an approach commonly used in science to better understand and illustrate how the world works. Stakeholders’ attitudes toward the salience, credibility, and legitimacy of models were measured with five questions examining the accuracy, reliability, fairness, and usefulness of models and if models made oyster management easier (termed easier management). Questions on easier management and usefulness measured salience, questions on accuracy and reliability measured credibility, and fairness measured legitimacy (Table 1).
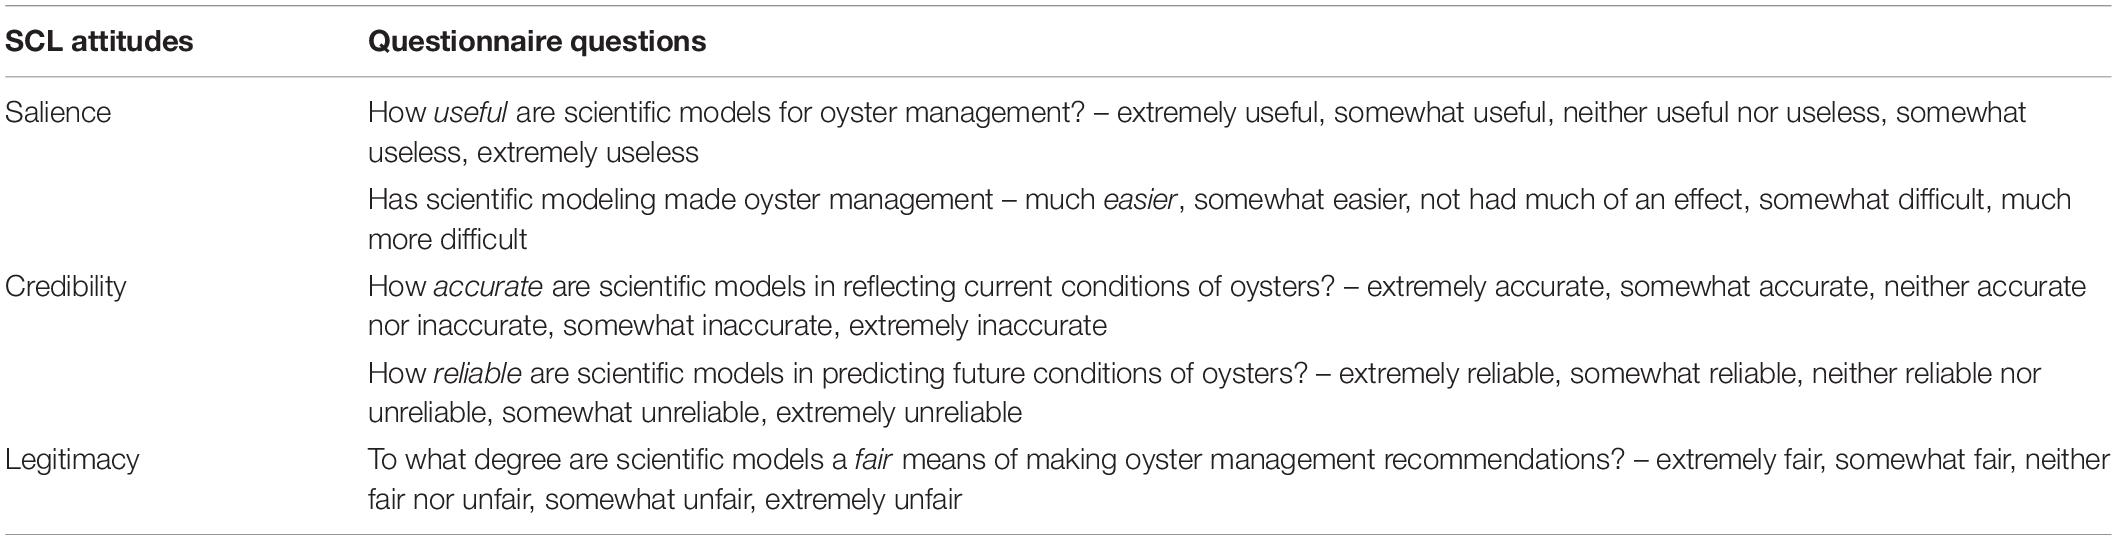
Table 1. OysterFutures questionnaire attitude questions.
Stakeholders were asked to rank their attitudes toward scientific models on a Likert scale from 1 to 5, with 1 representing the most negative attitude and five representing the most positive for each question. Stakeholders were also allowed to answer, “Do not know,” suggesting they do not have enough information to determine their attitude toward scientific modeling in that context. Stakeholders’ attitudes toward models were assessed at each workshop. Their communication networks were assessed at all workshops except Workshop 8. On average, the workshops occurred every 2.7 months (range: 1–7 month gap). The small gap in time between Workshop 7 and Workshop 8 (less than 4 weeks) limited variability in communication between stakeholders; data gathered from this period would not have been informative of overall communication trends. Response rates varied across meetings due to stakeholder absence or not completely filling out the survey but remained high (response rates: average – 85%, range: 73–100%). Attitude data was compiled into a Workshop-specific document after each workshop with stakeholders’ other attitude questions (toward science and local ecological knowledge) and demographic information (e.g., years of experience, level of education). Attitude data was analyzed on its own to examine trends and as attribute data (data that describes the actors’ nodes in the social network) in examining the changes in the communication network.
After each workshop, communication network data was imported into UCINet, a social network analysis software (Borgatti et al., 2002). The communication network was symmetrized to account for different reported levels of communication. Between two individuals, there can only be one true frequency of communication number. However, at times, stakeholder pairs would report different levels of communication frequency. Symmetrizing the network selects one value of communication frequency to represent the level of communication between the pair. To not overestimate the frequency of communication, the communication network was symmetrized to the minimum reported value. That is, the lower communication frequency reported between node A and Node B was selected as the strength of the tie or link between them (Valente et al., 2008). In the case of a missing value, the non-missing value was used to represent communication frequency.
Ordered Logistic Regression Model for Attitudes Toward Models
Five ordered logistic regression models (McCullagh, 1980; Fullerton, 2009) were constructed using the polr function in R (Venables and Ripley, 2002; R Core Team, 2015) to test the impact of social network measures, factors related to the participatory modeling process, and stakeholder characteristics on SCL attitudes toward models. The use of the polr function allowed the attitude responses to be represented as ordered categorical dependent variables, reflecting the ordered nature of the Likert scale measurement tool. Each model’s dependent variable captured a single dimension of stakeholders’ attitudes toward models (two dimensions of both salience and credibility and one dimension of legitimacy).
The same independent variables were used across all five models for comparability. Variables (explained below) were selected based on previous literature on factors that have been suggested to impact the formation of attitudes (Erickson, 1988; Gould and Fernandez, 1989; Yuan and Gay, 2006; Reed, 2008; Lejano and Ingram, 2009; Moser and Dilling, 2010; Valente and Fujimoto, 2010; Rouwette et al., 2011; Duncan, 2016). Table 2 reports the summary statistics for the variables. Collinearity issues necessitated excluding participants from the model who were members of smaller stakeholder groups (n < 3, facilitators, seafood buyers, and recreational fishers) (Mason and Perreault, 1991; Crona and Bodin, 2006). This also helped maintain the anonymity of individuals within these smaller stakeholder groups. As a result, twenty-five stakeholders representing five stakeholder groups (scientists, watermen, aquaculturists, environmental groups, and government officials) were included in the model. For further information on the model, see the Supplementary Material.
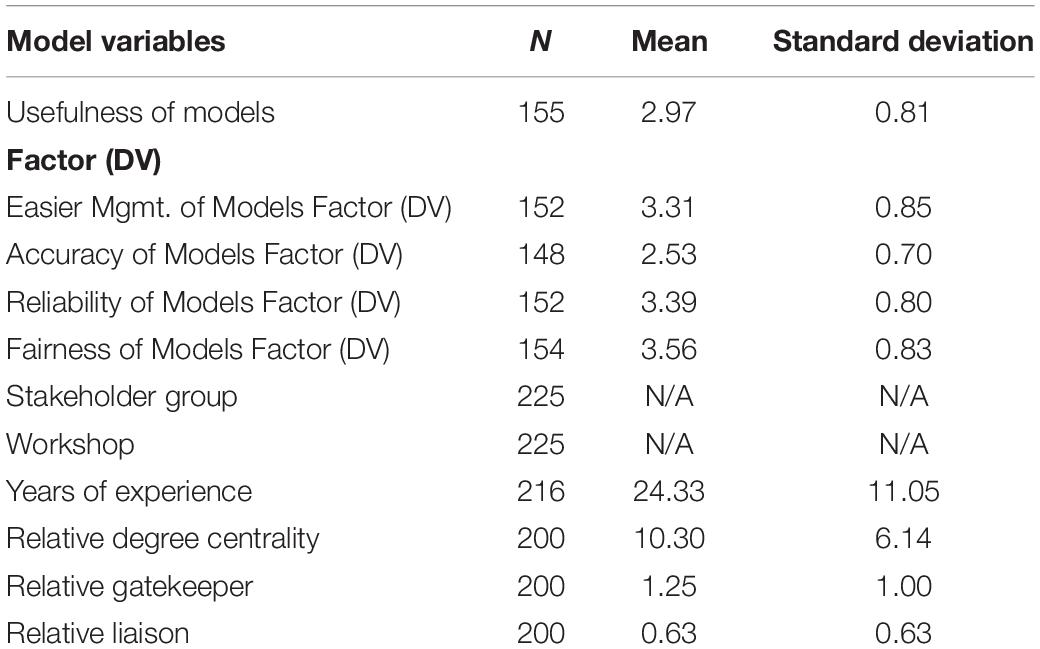
Table 2. Summary statistics for ordered logistic regression attitude models.
Participatory Modeling Process and Stakeholder Characteristic Variables
The Stakeholder Group, Workshop, and Years of Experience variables captured elements of the participatory modeling process and the OysterFutures stakeholders. The Workshop variable captured the progression of workshops, and a significant result for this variable suggests a temporal change in stakeholders’ attitudes i.e., was there a change in attitudes over the course of the process?
The Stakeholder Group and Years of Experience variables captured characteristics of the stakeholders participating in OysterFutures that could impact attitude formation. The Stakeholder Group variable captured the different group associations of stakeholders participating in OysterFutures. The Years of Experience variable captured the varying lengths of time (e.g., number of years) that stakeholders had been working in their respective fields. To further explore the impact of stakeholder characteristics, ordinal logistic regression model were also run with individual stakeholder as a fixed variable, allowing us to understand individual development of attitudes toward models.
Social Network Variables
The importance of networks in the formation of attitudes led to the inclusion of social network variables from the communication network. Node level indices (network measures at the nodal level) can be included as independent variables in models where the dependent variable is not a network; no issues of autocorrelation exist (see Robins et al., 2007 for a discussion on node level indices as dependent variables – exponential random graph models – ERGMs).
Social network measures related to brokerage (gatekeeper and liaison) and actor centrality (degree centrality) were used to understand the role that network position and structure plays in attitude formation. The groups used to define the gatekeeper and liaison positions were the OysterFutures stakeholder groups. To account for different stakeholder group sizes, the relative values of the gatekeeper and liaison variables were used, i.e., to determine if brokerage is impacted by group membership (Gould and Fernandez, 1989; Everton, 2012).
The network values represent stakeholders’ role in the network since the previous workshop; this makes the nature of these questions lagged. Lagged variables have been commonly used to investigate and attribute causation to economic, demographic or government policy variables (Bellemare et al., 2017). Consideration of the social network variables as lagged allows us to make causal inferences, e.g., a more central network position decreased attitudes toward models. However, we also ran the ordered logistic regression models with network variables altered to be lagged by one workshop to test the validity of our assumptions. For further information, see the Supplementary Material.
McFadden’s Pseudo R2 values were calculated for each model to provide an estimate of goodness of fit (McFadden, 1979). The categorical nature of the dependent variable did not allow us to obtain estimate of residual variance from traditional methods, and thus necessitated the use of a pseudo R2 value.
Results
Results show that elements of the participatory modeling process and stakeholder characteristics significantly impacted stakeholders’ attitudes toward the salience, credibility, and legitimacy of scientific models. Communication social network variables only significantly impacted credibility attitudes. This suggests different impacts of the OysterFutures process and communication network position on attitudes (Table 3).
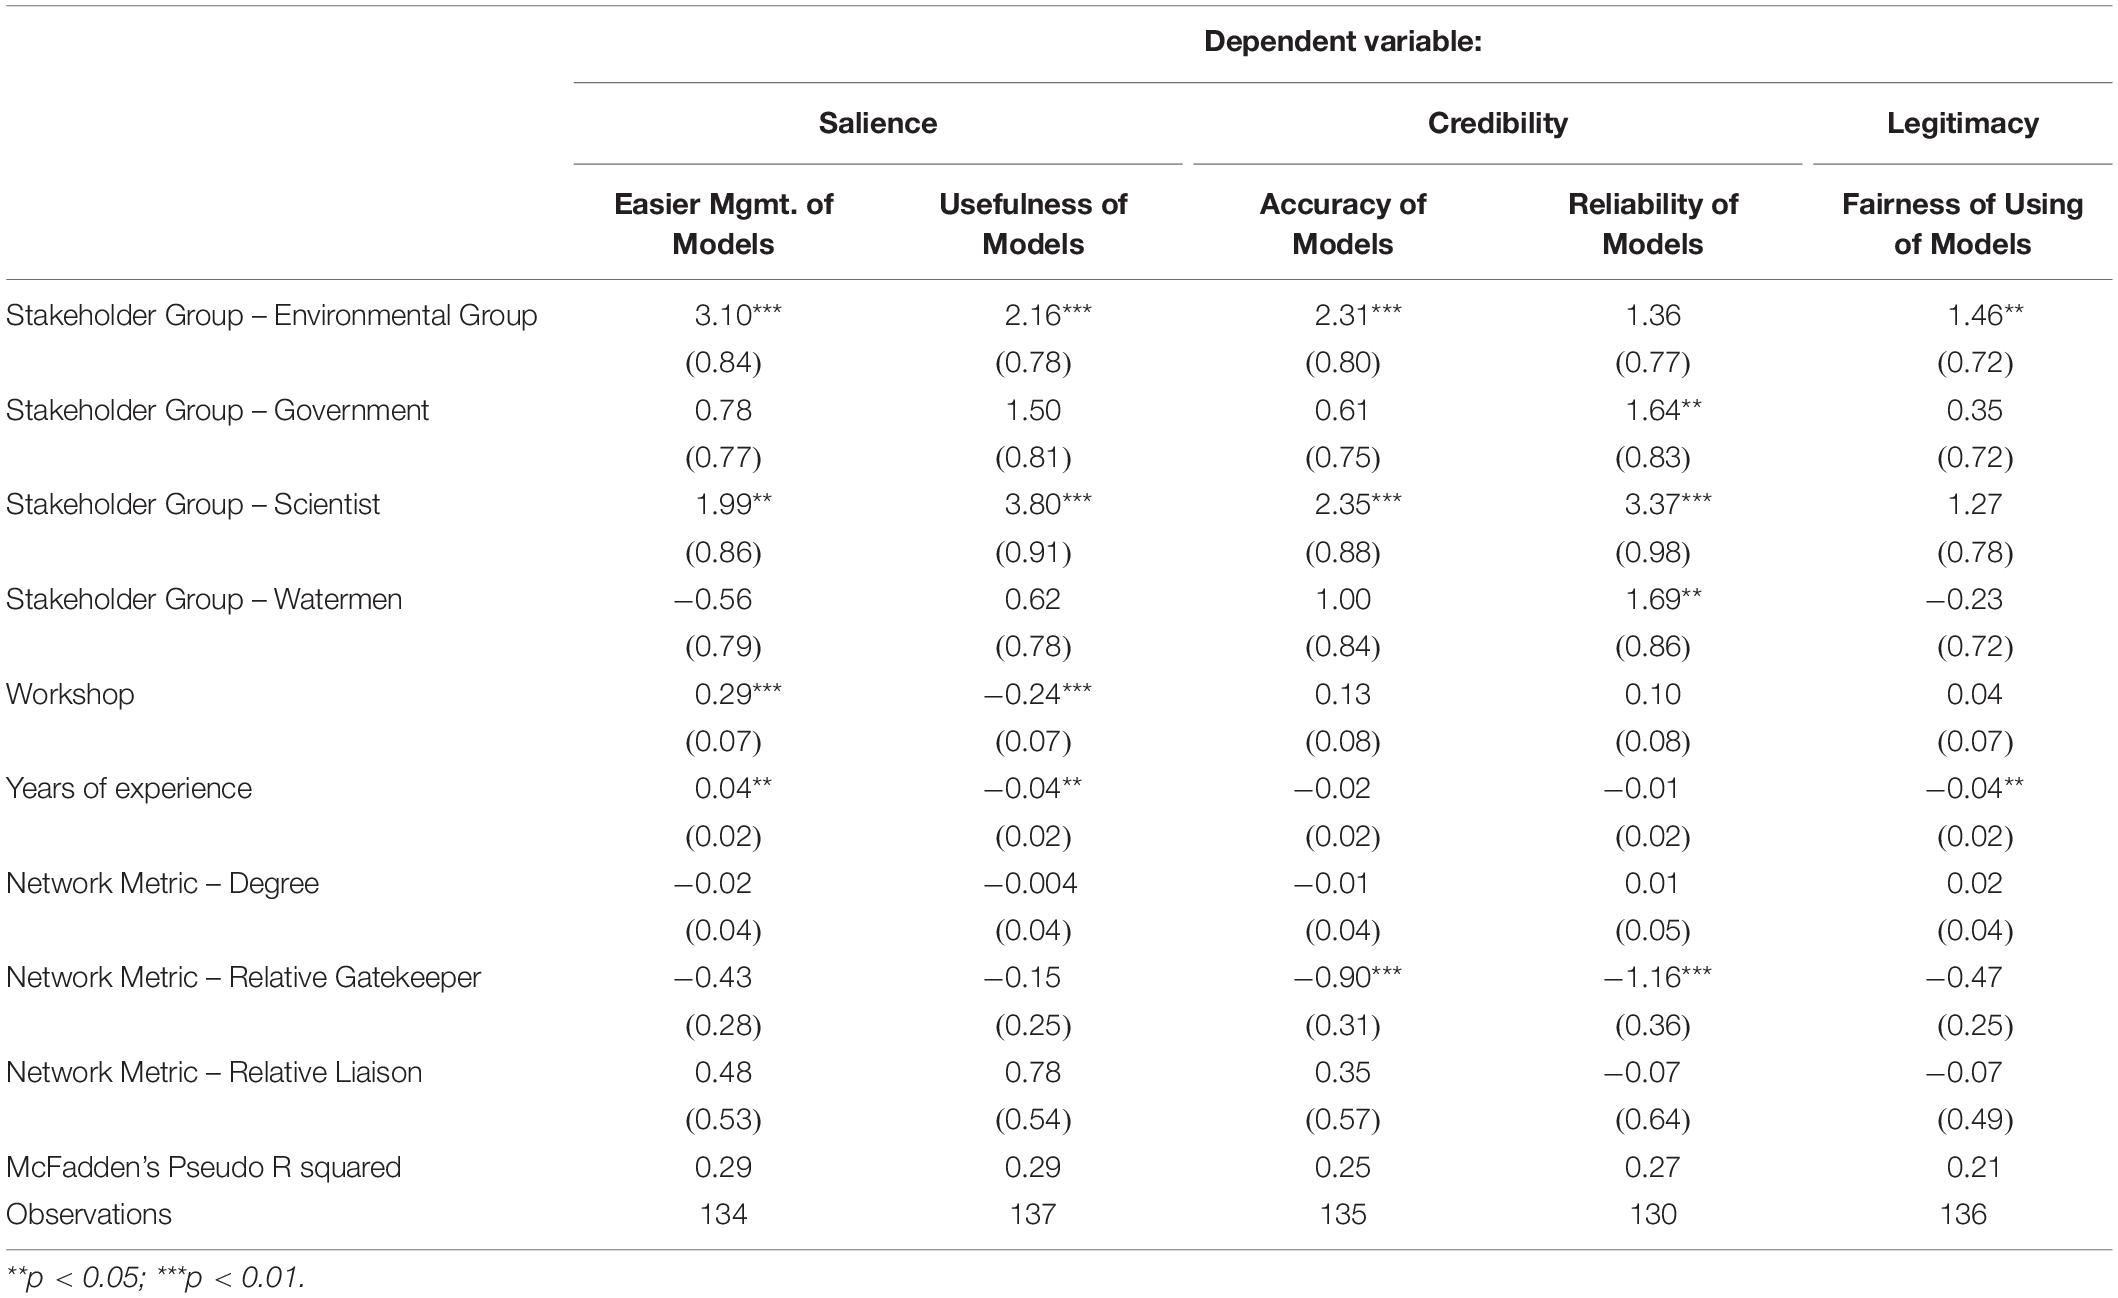
Table 3. Summary of the ordered logistic regression model results for all attitude toward models’ questions.
Participatory Process and Stakeholder Characteristic Variables
Stakeholder Group membership was a significant predictor of all elements of salience, credibility and legitimacy attitudes toward models. Membership in the Environmental Group resulted in significantly higher attitudes toward salience (usefulness: p < 0.01, easier management: p < 0.01), credibility (accuracy: p < 0.01) and legitimacy (fairness: p < 0.05) of models than membership in other stakeholder groups, except Scientists. Membership in the Scientist stakeholder group significantly impacted elements of salience and credibility attitudes toward models, similar to the Environmental Group members in the case of model usefulness and accuracy (usefulness: p < 0.01, easier management: p < 0.05, accuracy: p < 0.01, reliability: p < 0.01).
The coefficients of the polr model are scaled in terms of logs. These log odds can be converted into more easily interpreted probabilities, or the likelihood that the variable significantly impacts attitudes toward models. For example, members of the Environmental Group stakeholder group have a 0.81 probability of viewing models as a legitimate way to make oyster management decisions compared to other stakeholder groups. For the Scientist stakeholder group, there was a 0.46 probability that scientists would have higher attitudes toward the accuracy of models for reflecting current conditions of oysters. There was a 0.65 probability that Government stakeholders viewed the models as highly credible for predicting future conditions of oysters (reliability: p < 0.05).
Lastly, being a member of the Watermen stakeholder group significantly impacted attitudes toward the reliability of models for predicting future conditions of oysters (p < 0.05). When an individual is a waterman, there was a 0.23 estimated probability of a higher attitude toward the reliability of models. In other words, there is a significantly higher probability watermen view models as more reliable for predicting future conditions of oysters.
The Workshop variable was only a significant variable for determining attitudes toward the salience of models (easier management: p < 0.01, usefulness: p < 0.01). As the workshops progressed, there was a higher probability of stakeholders viewing the models as a significantly easier way to make oyster management decisions (Figure 1). However, over the course of the workshops, there was a significant decrease in attitudes toward the usefulness of models (Figure 2). As the workshops progressed, there was a higher probability that stakeholders didn’t view the models as a useful way to make oyster management decisions. Figure 3 demonstrates that the differences in stakeholder groups attitudes demonstrated in the variables above also apply when considering the workshops over time; there were persistent differences in stakeholder groups attitudes toward models throughout OysterFutures.
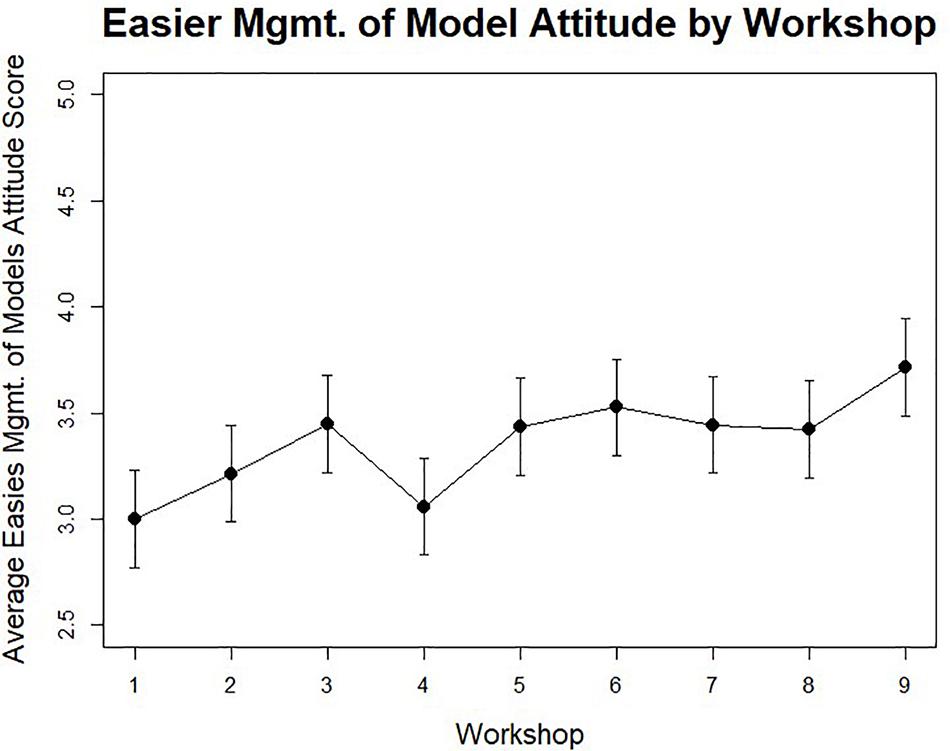
Figure 1. Average ease of using models for management attitude score over the course of 9 OysterFutures workshops with standard deviation.
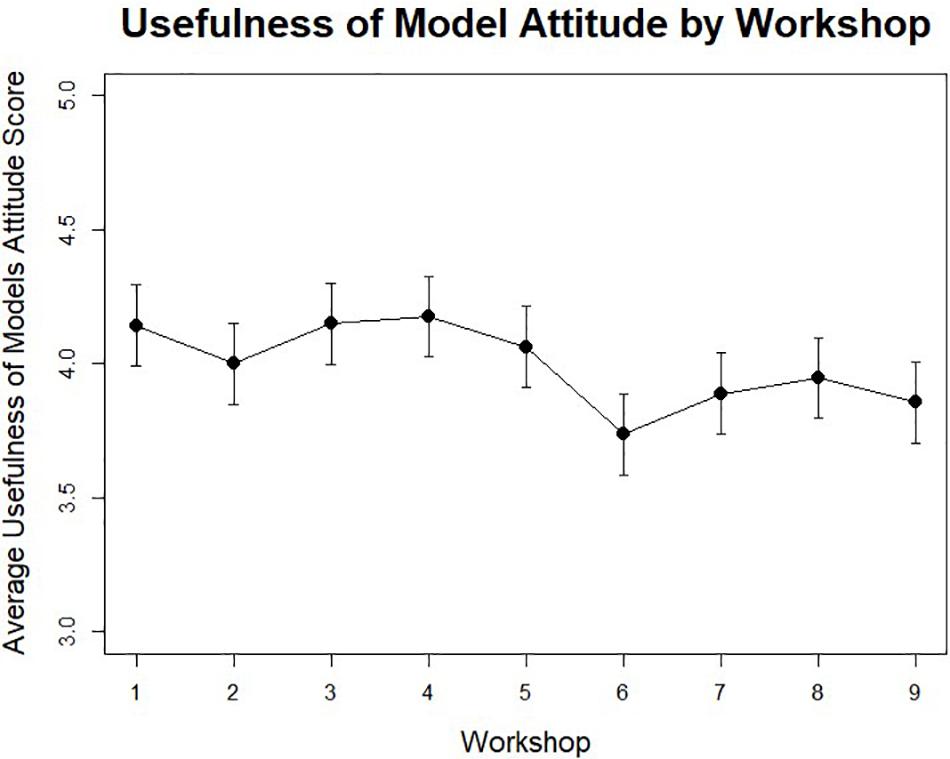
Figure 2. Average usefulness of models over the course of 9 OysterFutures workshops with standard deviation.
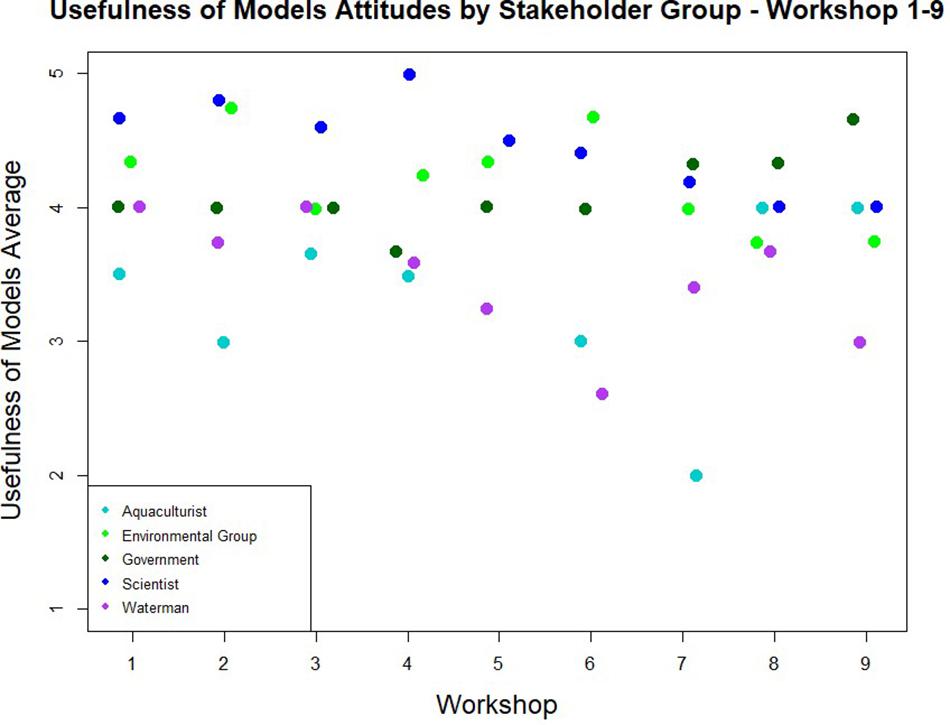
Figure 3. Example of the persistence of stakeholder groups’ different attitudes toward models – here with the usefulness of models – over the course of nine OysterFutures workshops. Smaller stakeholder groups (facilitators, seafood buyers, and recreational fishers, each n < 3) were excluded to protect privacy of individual stakeholders. Jitter() function used to provide visual separation of points.
Results for the polr models accounting for the individual variation in stakeholder attitude formation demonstrated significant individual differences in attitude formation during OysterFutures. Adding a fixed variable accounting for individual stakeholders resulted in higher McFadden’s pseudo R2 values than the main model. The individual-stakeholder models resulted in shifting instances of significance for the Workshop variable, with elements of both salience and credible attitudes changing significantly. No network variables were significant in these model runs (see Supplementary Material for Individual stakeholder model results).
Stakeholder group differences also existed when analyzing the high-frequency communication (strength of 4 or 5) during OysterFutures. The solid lines in Figures 4–6 represent high-frequency communication within a single stakeholder group, e.g., stakeholders within the same stakeholder group spoke most frequently. We also saw, however, high-frequency communication between likeminded individuals who were in different stakeholder groups (e.g., represented by individuals within the dashed lines, these individuals shared similar attitudes according to the model, despite being members of different stakeholder groups).
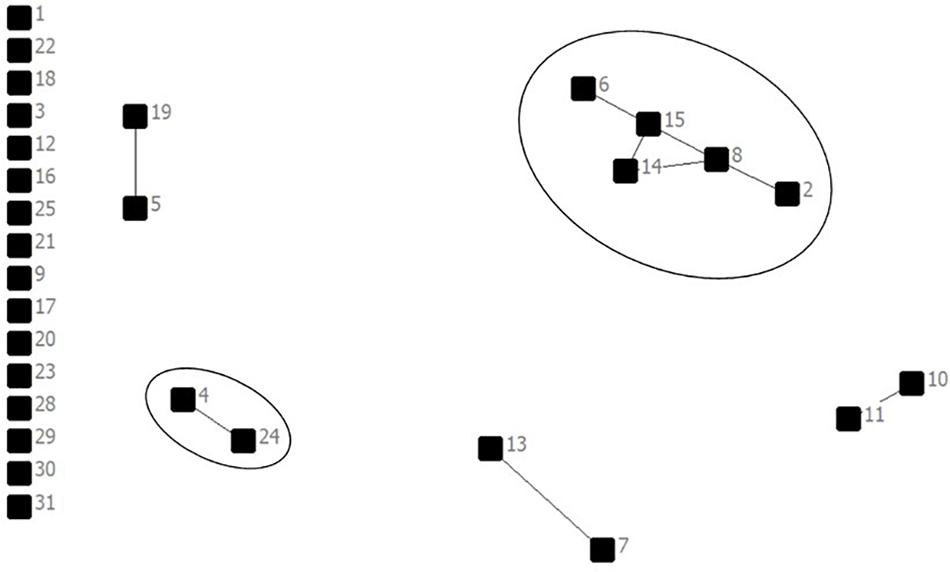
Figure 4. Workshop 1 high frequency communication network – links representing communication paths with a strength of 4 or 5. Solid circles represent silos of communication between a single stakeholder group, e.g., all of the individuals within the solid circle are members of the same stakeholder group.
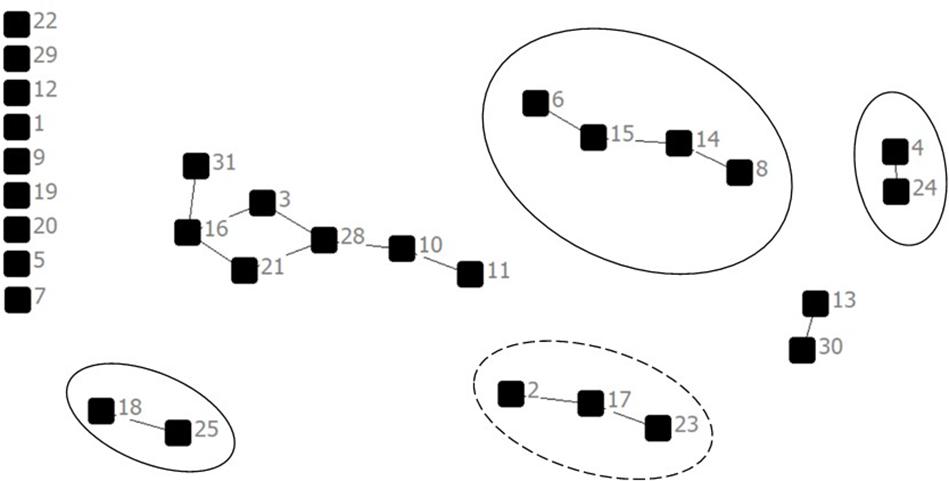
Figure 5. Workshop 4 high frequency communication network – links representing communication paths between individuals with a strength of 4 or 5. Solid circles represent silos of communication between a single stakeholder group, e.g., all of the individuals within the solid circle are members of the same stakeholder group. Dashed circles represent silos of communication between individuals in different stakeholder groups, but who have similar attitudes as described by the ordered logistic regression model, e.g., there are individuals from multiple stakeholder groups represented within the dashed circles, but the model suggested that all of their respective stakeholder groups had similar attitudes.
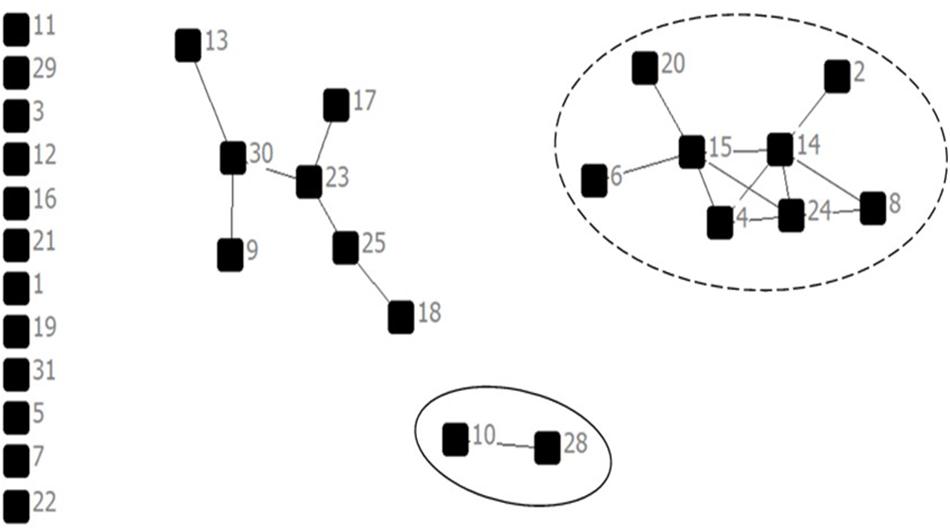
Figure 6. Workshop 9 high frequency communication network – links representing communication paths between individuals with a strength of 4 or 5. e.g., all of the individuals within the solid circle are members of the same stakeholder group. Dashed circles represent silos of communication between individuals in different stakeholder groups, but who have similar attitudes as described by the ordered logistic regression model, e.g., there are individuals from multiple stakeholder groups represented within the dashed circles, but the model suggested that all of their respective stakeholder groups had similar attitudes.
The impact of Years of Experience was significant and negative for elements of model salience (usefulness: p < 0.05) and legitimacy (fairness: p < 0.05). More experienced stakeholders had a slightly higher probability of viewing the models as less useful or fair (0.004 and 0.002 respectively). Despite the negative impacts of years of experience on the usefulness dimension of salience, there was a slightly higher probability that more experienced stakeholders saw the models as a significantly easier way to manage oysters (salience: p < 0.01). Thus, for more experienced stakeholders, models may make the process of managing oysters easier (e.g., easier to justify management decisions, include relevant variables in decision-making), but the stakeholders did not think the models are useful (e.g., they should not be used to make management decisions).
Social Network Variables
The Gatekeeper variable was the only significant network variable for determining attitudes toward models; the liaison brokerage role and degree centrality were not significant. The more an individual played a gatekeeping role in the network, the estimated probability of a higher attitude toward the credibility (accuracy and reliability) of models decreased by 0.25 and 0.22 respectively (accuracy: p < 0.01, reliability: p < 0.01). By acting as more of a gatekeeper (i.e., by connecting members of your group to individuals in other stakeholder groups), stakeholders viewed the accuracy and reliability of the models more negatively, thus, less credible. Results from the Lagged models for communication social network variables did not drastically differ from the non-Lagged model results, although McFadden’s pseudo R2 values show the lagged model had a better fit. Results from these models reported less significant network and participatory modeling process variables, but none of the findings contradicted the non-lagged model findings. This supports our assumptions about the lagged nature of the original network question. The Supplementary Material shows model results and significant variables from these lagged models.
Discussion
Findings from this work offer insights into factors that impact stakeholders’ attitudes toward scientific models during a participatory modeling process, OysterFutures. Stakeholder group association had a strong, persistent impact on salience, credibility, and legitimacy attitude formation; individuals reflected and reinforced the views of their stakeholder group. In addition, by examining stakeholder’s communication networks, we identified elements of network structure that influenced attitudes. Acting in a gatekeeping capacity was connected to changes in perceived model credibility.
By better understanding what influences model attitude formation, participatory modeling processes can adjust their design and function to better take advantage of these models. Additionally, practitioners can have more realistic expectations concerning the role of models within participatory, collaborative natural resources decision-making processes.
Impact of Stakeholder Group Membership: Indicator of the Impact of Divergent Ways of Knowing on Attitude Formation
The most prevalent factor influencing attitudes toward scientific models was Stakeholder Group membership. There were persistent differences in stakeholder groups attitudes toward models throughout OysterFutures. Although model results demonstrate instances of all stakeholder groups having significantly positive attitudes toward models, individuals consistently reflected and reinforced the views of their stakeholder group. These differences weren’t abated during OysterFutures. Within collaborative processes, shared ideology found through stakeholder group association can be a strong polarizing force (Calanni et al., 2014). A common ideology is built due to shared beliefs (Yuan and Gay, 2006; Henry et al., 2010). This foundation of similarity eases communication by reducing unknowns and lowering transaction costs. Communication within these groups can then influence the creation of group-specific attitudes; separate, distinctive framings of the problem at hand (Hovland et al., 1957; Sherif and Hovland, 1961). Stern and Coleman (2015) refer to this as the reference group theory. People use reference groups of individuals they trust and feel have similar ideas to themselves to develop their own attitudes. Individuals may be members of multiple reference groups, but individuals typically identify most strongly with only one or two groups (Stern and Coleman, 2015). While this increases intra-group reliance and trust, it can hinder the development of wider understanding in collaborative, participatory processes. The lack of group cohesion in terms of attitudes toward models could result in different levels of willingness to apply the model within the larger decision-making process.
The eased communication within stakeholder groups created the opportunity to solidify like-attitudes (Gerber et al., 2013). However, it was the frequency of communication that was most influential, not simply the occurrence of communication. Within the whole OysterFutures network, we saw an overall increase in communication, demonstrated through increases in network density and degree scores (Workshop 1 Density: 22.8%, Degree: 8.4, Workshop 9 Density: 38.9%, Degree: 11.67) (Opsahl et al., 2010). But the highest frequencies of communication remained confined within stakeholder groups. Within the communication network, ties that represent more frequent communication are known as “strong ties” (Granovetter, 1973). Strong ties are thought to have the most significant impact on actors. This suggests that attitude formation would most likely occur through strong tie connections (Visser and Mirabile, 2004). Strong ties persisted within stakeholder groups throughout OysterFutures. This suggests that stakeholder groups were strong drivers of attitudes because they represented attitudinally congruent networks, which are more resistant to change and exhibit more stability (Levitan and Visser, 2009). Frequent communication overall, however, also had a role to play despite stakeholder group differences; individuals who communicated more, even considering differences in stakeholder group, shared more similar attitude. The persistent divisions between stakeholder groups suggests that the different attitudes stem from different ways of knowing. Duncan (2016) links different epistemologies (i.e., how we know) to different ontologies (i.e., what we know). The manner in which individuals frame and interpret the world impacts their levels of understanding and their ability to comprehend different pieces of knowledge (Lejano and Ingram, 2009; Duncan, 2016). Experiential-based knowledge, like watermen learning about oysters based on years of direct observation on the water, has often been termed local or traditional knowledge (Berkes, 2009). Scientific “knowing practices,” on the other hand, are based on techniques that “standardize, aggregate, quantify” and give predictions (Duncan, 2016, p. 153). The nature of scientific models stems from their ability to standardize, aggregate, quantify, and give predictions about systems, lining them up well with a more scientific way of knowing. Watermen were more skeptical of the model during OysterFutures and their comments illustrate that scientific models are not the way in which watermen come to “know” information; they are not how watermen typically formulate and acquire knowledge. Often during the process, watermen expressed concern over model results because the runs did not line up with what they knew from time on the water. Regarding the larval transport model, one older waterman said “what the model says is not what I see in the river. [I’m] not seeing [the larvae] land in all the places [the model] says it’s going.” Watermen were more hesitant about the usefulness of the model for making decisions about oyster management when it did not reflect watermen’s knowledge and understanding.
Multi-Faceted Nature of Salience – Impact of Increased Experience
The stakeholders participating in OysterFutures were chosen because of their ability to represent and speak for their stakeholder groups. This is a common practice for participatory processes (Voinov and Gaddis, 2008). The ability of a stakeholder to be seen as an opinion leader and accurately speak for their group is often associated with years of experience (Miller et al., 2008). As a result, stakeholders in participatory processes are usually older and have high levels of experience. Despite the efforts of OysterFutures to recruit both younger and older participants, especially within the watermen stakeholder group which is largely older individuals, the overall average experience for the entire OysterFutures group was just over 24 years (range: 1–42 years). Thus, based on our original hypotheses, since OysterFutures had more experienced stakeholders, their attitudes toward models would be higher given that they had worked with and seen models used for natural resources management in the past. In addition, Van Voorn et al. (2016) hypothesized that stakeholders views on model salience, credibility, and legitimacy could shift over the course of a participatory modeling process. This shift, we hypothesized, was due to participation, with stakeholders having the opportunity to better understand the strengths and weaknesses of the model. Both of these variables, then, speak to levels of stakeholder experience with and time spent working with and learning about the models.
The Years of Experience and Workshop variables responded in similar ways, impacting the development of salience attitudes toward the models. However, there was a conflicting impact of both variables on salience. Across all stakeholder groups, increasing experience with the model, through workshops and years of experience, resulted in higher probabilities of stakeholders viewing models as making oyster management significantly easier. The impact of increasing experience on attitudes toward the usefulness of models, on the other hand, was negative – more experience and participation in the workshops led to a higher probability of stakeholders viewing the models as less useful. This implies that for individuals with more experience, the models made oyster management overall easier, but the models weren’t perceived as relevant for the decisions at hand.
The positive impact of experience on model salience was evident during the OysterFutures process. Stakeholders were actively engaged during the framing of the scientific model. Framing the model included elements of model design (e.g., spatial extent and time horizons), the intended role and expectations of the model, inputs and scenarios, and uncertainty (Liu et al., 2008; Van Voorn et al., 2016). Engaging stakeholders in model framing occurred via iterative communication, which allowed modelers to hone in on stakeholders’ ideas and suggestions, and a ranking system that permitted stakeholders to express their preferences for model scenarios. Van Voorn et al. (2016, p. 232) emphasized how “active dialogue reduces the risk of a loss of model salience” where stakeholders and modelers aren’t on the same page. Discussion allowed for the establishment of common model perceptions by continually reviewing and revising model criteria (Van Voorn et al., 2016). However, despite the benefits of dialogue and the impact of participation, there were still significant differences between stakeholder groups in terms of model salience. This supports the hypothesis that the impact of participation and engagement in the model building process could not overcome the fundamental differences in ways of knowing between stakeholder groups.
Instead of experience universally increasing attitudes toward models, it resulted in stakeholders viewing the models more realistically, recognizing both their benefits and limitations. This difference in attitudes toward models could speak to experienced stakeholder’s recognition concerning the difficult social and political context surrounding the OysterFutures process, and therefore the model. The setting of a scientific model, the larger context in which it is formed, can have an impact on model salience (Van Voorn et al., 2016). The oyster fishery within Maryland presents a historically contentious setting that continues today (Kennedy and Breisch, 1983). Many of the issues under discussion during OysterFutures have been frequently debated since the beginning of the public fishery. In the face of these long-standing issues, more experienced individuals doubted the efficacy of the recommendations from the model. For example, when discussing shell availability, the topic of Man O’ War Shoals, one of the largest remaining oyster shell deposits within the Chesapeake Bay, was raised during the final OysterFutures workshop. Watermen and other industry groups have advocated harvesting shell from this deposit to supplement oyster bars in the public fishery. Many environmental groups oppose harvesting due to concerns over habitat degradation (Cuthbertson, 1988; Prost, 2018). OysterFutures facilitators attempted to lead the group through discussions over these tensions, but these attempts resulted in overall discontent. Stakeholders possessing a range of levels of experience (from one to 42 years) argued that this “20-year-old divisive issue” was “bigger than this room,” suggesting that they saw current discussions and modeling efforts as less useful regarding shell availability.
In addition, many stakeholders noted that the limited geographic scope of the model also impacted its usefulness. The OysterFutures model was focused on the oyster fishery within the Choptank River Complex, not in Maryland overall. This limited scope frustrated stakeholders, primarily four to five of the older watermen (those with over 30 years’ experience), as they attempted to use the model to create management scenarios during the OysterFutures process. Stakeholders expressed concern that recommendations resulting from the model would not be useful in a statewide fishery. This was especially evident in the discussion surrounding limited entry (i.e., a limited number of permits or licenses to harvest the resource are issued to reduce or maintain capacity and fishing effort). Most stakeholders, but especially watermen and aquaculturists, expressed an interest in a limited entry recommendation. “We are a professional group and industry,” one aquaculturist member said, speaking on behalf of both aquaculturists and watermen, “we deserve an exclusive right – like a licensed electrician or plumber” or else the industry “cannot move forward.” At the end of workshop 4, the idea of the spatial mismatch was first raised. Experienced watermen expressed that the “biggest problem” with the proposed recommendations was the regional focus of the model when the public fishery is a state license. The modelers had “no good answers” to address these concerns. As a result, no concrete recommendation on limited entry was included in the final recommendations because the model scope reduced its usefulness (OysterFutures Stakeholder Workgroup, 2018).
The highly focused nature of the OysterFutures model made the model locally useful, but less relevant for state-wide management as the experience level of stakeholders increased. This finding suggests that participatory modeling processes need to consider the broader geographic, social, economic and political context and limitations in which their model is based in order to create useful and realistic recommendations that meet stakeholder expectations (Jones et al., 2009).
Salience, credibility, and legitimacy have the potential to counteract each other (Cash et al., 2003; Van Voorn et al., 2016). Efforts to promote salience, credibility or legitimacy of a model can result in unavoidable tradeoffs during the modeling process where one criterion is given precedence (Van Voorn et al., 2016). Ginger (2014) found these tradeoffs can also occur within a single criterion during a participatory modeling process. Our results support this finding, demonstrating the importance of considering the multi-faceted nature of salience, e.g., that a modeling product can make management easier in a general sense, but not be useful within a particular setting.
Social Network Variables
Results suggest that social network position played a significant role for gatekeepers in the determination of attitudes toward models. However, the direction of the network variable was opposite to what was hypothesized. The significant, negative Gatekeeper variable suggests that the more an individual plays a gatekeeping role, viewing models as credible decreases for both accuracy and reliability (p < 0.01). Model credibility results from the scientific logic of the model and the perceived soundness of the knowledge and information used within the model (Van Voorn et al., 2016). Assessing the credibility of the model is done, in large parts, through communication and discussion about the model (Schmolke et al., 2010). Communication with likeminded others is thought to have the greatest impact on attitude formation (Gerber et al., 2013). Thus, while both gatekeeper and liaison brokerage roles represent powerful positions of communication, only gatekeepers are in positions where they are communicating with those most like them, individuals in their own stakeholder group.
The communication within stakeholder groups acts as the foundation for the gatekeepers’ attitudes toward models. However, the gatekeeper position is not built solely on these connections. Gatekeeping provides access to multiple ways of knowing through connections to other stakeholder groups. Specifically, the impact of communication on gatekeepers is due to the targeted nature of the communication (Valente and Fujimoto, 2010). Through this targeted communication, gatekeepers learned about new sources of knowledge that could give additional meaning to their pre-existing knowledge, allowing gatekeepers to frame their attitudes toward models within a new context (Gick and Holyoak, 1980; Beach, 1997; Hargadon, 2002).
The benefit of participatory modeling processes is in the discussions that model building fosters between individuals with diverse sets of knowledge. By comparing the inter and intra group knowledge, gatekeepers realized that models are “only one of several possible descriptions of any situation” (Hargadon, 2002, p. 59). Exposure to other ways of knowing may have allowed gatekeepers to resist the “dogma” of any one way of knowing, lessening the overall credibility of any one technique or source of knowledge (Hargadon, 2002, p.77).
Although gatekeepers’ attitudes toward models are influenced by their position within the network, they were not able to influence the attitudes of their fellow group members; stakeholder group remains a powerful driver of attitudes. Gatekeepers lack influence because these individuals are not necessarily the opinion leaders of stakeholder groups. Gatekeepers’ power comes from their access to and control over information, not their ability to influence and drive group attitudes’. Individuals with high degree centrality, high numbers of links or ties within a network or group, are considered influential actors within a network (Rogers, 2003). However, contrary to our hypothesis, overall connectedness of actors did not impact their attitude formation. Individuals with high degree centrality are opinion leaders who are expected to uphold the status quo (Becker, 1970; Rogers, 2003; Valente and Fujimoto, 2010). These are individuals who influence attitudes, not who are influenced by others’ attitudes. Network structure did influence attitude formation, but attitudes were primarily driven by individuals reflecting and reinforcing the views and ways of knowing of their stakeholder group.
Conclusion
Participatory modeling has become an increasingly common technique in collaborative natural resources management decision-making processes because of its perceived enhanced ability to address complex natural resource policy issues (Barreteau et al., 2007; Jones et al., 2009). The foundation of these benefits rests upon the willingness of stakeholders to use and engage with the model. Measuring stakeholders’ attitudes toward models can provide information on their willingness to use the information provided in the model. By better understanding the role that models play within the decision-making process, participatory modeling processes can design more targeted models, selecting features to enhance the models’ salience, credibility and legitimacy.
Fundamental differences in ways of knowing between stakeholder groups contributed to group specific attitudes toward models. As participatory modeling processes continue to be used in natural resources management, process organizers should acknowledge that the integration of these divergent ways of knowing may not be possible (Turnhout et al., 2013; Duncan, 2016). Instead, these processes should embrace the multiplicity of knowledge and allow models to act as boundary objects to facilitate discussions (White et al., 2010). Participatory models have the unique ability to facilitate discussion between stakeholders during natural resource decision making processes because the models can make prospective management or policy recommendations more concrete, can allow stakeholders to better recognize their implicit assumptions (Andersen et al., 1997), refine and alter their mental models (Rouwette et al., 2011), and generalize knowledge that can be used or applied later or in a different scenario (Lane, 1994). Promoting knowledge sharing using the model could enhance the ability of these processes to make innovative solutions to complex problems rather than a consensus around a suite of existing ideas through trade-offs (Fischer and Jasny, 2017). Within a participatory modeling process, this discussion and sharing could be purposefully facilitated, allocating specific time and space for knowledge sharing between stakeholder groups prior to model construction. Participatory modeling processes can work toward innovative solutions by making sharing of diverse knowledge a priority.
Using the OysterFutures case, we were able to understand the nature and factors impacting longitudinal changes to stakeholder’s attitudes toward models over the course of a participatory modeling process. This represents the first application of a social network approach to study a participatory modeling process. Future work should continue to study the human dimensions of these process to make them more effective tools for natural resources decision-making.
Data Availability Statement
All datasets generated for this study are included in the article/Supplementary Material.
Ethics Statement
The studies involving human participants were reviewed and approved by William & Mary’s Protection of Human Subjects Committee. The participants provided their written informed consent to participate in this study.
Author Contributions
TG and TH devised the research question and collected the data. TG, AS, and IC conducted the data analysis. TG, TH, AS, and IC wrote and edited the manuscript. All authors contributed to the article and approved the submitted version.
Funding
This work was supported by the National Science Foundation (grant number 1427125).
Conflict of Interest
The authors declare that the research was conducted in the absence of any commercial or financial relationships that could be construed as a potential conflict of interest.
Acknowledgments
The authors would like to thank the stakeholders of OysterFutures for giving their time and effort to the survey instruments, the other OysterFutures primary investigators for their interest in human dimensions research and Dr. Mark Brush for comments on early versions of this manuscript.
Supplementary Material
The Supplementary Material for this article can be found online at: https://www.frontiersin.org/articles/10.3389/fmars.2020.00644/full#supplementary-material
References
Allen, E., Kruger, C., Leung, F. Y., and Stephens, J. C. (2013). Diverse perceptions of stakeholder engagement within an environmental modeling research team. J. Environ. Stud. Sci. 3, 343–356. doi: 10.1007/s13412-013-0136-x
Andersen, D. F., Richardson, G. P., and Vennix, J. A. M. (1997). Group model building: adding more science to the craft. Syst. Dynam. Rev. 13, 187–201. doi: 10.1002/(SICI)1099-1727(199722)13:2<187::AID-SDR124>3.0.CO;2-O
Armitage, D. R., Plummer, R., Berkes, F., Arthur, A. I., Charles, A. T., Davidson-Hunt, I. J., et al. (2008). Adaptive co-management for social-ecological complexity. Front. Ecol. Environ. 7:95–102. doi: 10.1890/070089
Barreteau, P., Le Page, C., and Perez, P. (2007). Contribution of simulation and gaming to natural resource management issues: an introduction. Simul. Gaming 38:185. doi: 10.1177/1046878107300660
Beach, L. R. (1997). The Psychology of Decision Making: People in Organizations. Thousand Oaks, CA: Sage.
Becker, M. H. (1970). Sociometric location and innovativeness: reformulation and extension of the diffusion model. Am. Sociol. Rev. 35, 267–282.
Bellemare, M. F., Masaki, T., and Pepinsky, T. B. (2017). Lagged explanatory variables and the estimation of causal effect. J. Politics 79, 949–963. doi: 10.1086/690946
Berardo, R. (2014). Bridging and bonding capital in two-mode collaboration networks. Policy Stud. J. 42, 197–225. doi: 10.1111/psj.12056
Berkes, F. (2009). Indigenous ways of knowing and the study of environmental change. J. R. Soc. New Zeal. 39, 151–156. doi: 10.1080/03014220909510568
Borgatti, S., Everett, M. G., and Freeman, L. C. (2002). UCINet 6 for Windows: Software for Social Network Analysis. Chennai: Analytic Technologies, Inc.
Calanni, J. C., Siddiki, S. N., Weible, C. M., and Leach, W. D. (2014). Explaining coordination in collaborative partnerships and clarifying the scope of the belief homophily hypothesis. J. Public Adm. Res. Theory 25, 1–27.
Cash, D. W., Clark, W. C., Alcock, F., Dickson, N. M., Eckley, N., Guston, D. H., et al. (2003). Knowledge systems for sustainable development. Proc. Natl. Acad. Sci. U.S.A. 11, 8086–8091.
Crona, B., and Bodin, O. (2006). WHAT you know is WHO you know? Communication patterns among resource users as a prerequisite for co-management. Ecol. Soc. 15:18.
Cuthbertson, R. (1988). Occurrence and density of shell in the vicinity of Seven Foot Knoll, Man O’War Shoal, Six Foot Knoll, and Area B. Maryland Geological Survey, Coastal and Estuarine Geology Program. File No. 56. Available online at: http://dnr.maryland.gov/fisheries/Documents/MGS_MOW_Cuthbertson_1988A_shell%20deposits.pdf (accessed 25 October 2018).
Dreyer, M., and Renn, O. (2011). Participatory approaches to modelling for improved learning and decision making in natural resources governance: an editorial. Environ. Policy Gov. 21, 379–385. doi: 10.1002/eet.584
Duncan, R. (2016). Ways of knowing – out-of-sync or incompatible? Framing water quality and farmers’ encounters with science in the regulation of non-point source pollution in the Canterbury region of New Zealand. Environ. Sci. Policy 55, 151–157. doi: 10.1016/j.envsci.2015.10.004
Erickson, B. (1988). “The relational basis of attitudes,” in Social Structures: A Network Approach, eds C. Wellman and S. D. Berkowitz (Cambridge: Cambridge University Press), 99–121.
Fischer, A. P., and Jasny, L. (2017). Capacity to adapt to environmental change: evidence from a network of organizations concerned with increasing wildfire rick. Ecol. Soc. 22:23.
Fullerton, A. S. (2009). A Conceptual Framework for Ordered Logistic Regression Models. Sociol. Methods Res. 38, 306–347. doi: 10.1177/0049124109346162
Gerber, E. R., Henry, A. D., and Lubell, M. (2013). Political Homophily and Collaboration in Regional Planning Networks. Am. J. Pol. Sci. 57, 598–610. doi: 10.1111/ajps.12011
Ginger, C. (2014). Integrating knowledge, interests, and values through participatory modelling: dimensions of legitimacy. J. Environ. Plan. Man. 57, 643–659. doi: 10.1080/09640568.2012.761132
Gould, R. V., and Fernandez, R. M. (1989). Structures of mediation: a formal approach to brokerage in transaction networks. Soc. Methodol. 19, 89–126.
Gray, S. A., Zanre, E., and Gray, S. R. J. (2014). “Fuzzy cognitive maps as representations of mental models and group beliefs,” in Fuzzy Cognitive Maps for Applied Sciences and Engineering – From Fundamentals to Extensions and Learning Algorithms, ed. E. I. Papageorgiou (Berlin: Springer), 29–48. doi: 10.1007/978-3-642-39739-4_2
Haapasaari, P., Mantyniemi, S., and Kuikka, S. (2012). Baltic Herring fisheries management: stakeholder views to frame the problem. Ecol. Soc. 17:3.
Hargadon, A. B. (2002). Brokering knowledge: linking learning and innovation. Res. Organ. Behav. 24, 41–85. doi: 10.1016/s0191-3085(02)24003-4
Hartley, T. W. (2010). Fishery management as a governance network: examples from the Gulf of Maine and the potential for communication network analysis research in fisheries. Mar. Policy 34, 1060–1067. doi: 10.1016/j.marpol.2010.03.005
Henly-Shepard, S., Gray, S. A., and Cox, L. J. (2015). The use of participatory modeling to promote social learning and facilitate community disaster planning. Environ. Sci. Policy 45, 109–122. doi: 10.1016/j.envsci.2014.10.004
Henry, A., Lubell, M., and McCoy, M. (2010). Belief systems and social capital as drivers of policy network structure: the case of california regional planning. J. Public Adm. Res. Theory 21 419–444. doi: 10.1093/jopart/muq042
Hovland, C. I., Harvey, O. J., and Sherif, M. (1957). Assimilation and contrast effects in reactions to communication and attitude change. J. Abnorm. Soc. Psychol. 55, 244–252. doi: 10.1037/h0048480
Jones, N. A., Perez, P., Measham, T. G., Kelly, G. J., d’Aquino, P., Daniell, K. A., et al. (2009). Evaluating participatory modeling: developing a framework for cross-case analysis. Environ. Manag. 44, 1180–1195. doi: 10.1007/s00267-009-9391-8
Kennedy, V. S., and Breisch, L. L. (1983). Sixteen decades of political management of the oyster fishery in maryland’s chesapeake bay. J. Environ. Manag. 164, 153–171.
Lane, D. C. (1994). Modeling as learning: a consultancy methodology for enhancing learning in management teams,” in Modeling for Learning Organisations, eds J. D. W. Morecroft and J. D. Sterman (Portland, OR: Productivity Press).
Lejano, R. P., and Ingram, H. (2009). Collaborative networks and new ways of knowing. Environ. Sci. Policy 12, 653–662. doi: 10.1016/j.envsci.2008.09.005
Levitan, L. C., and Visser, P. S. (2009). Social network composition and attitude strength: exploring the dynamics within newly formed social networks. J. Exp. Soc. Psychol. 45, 1057–1067. doi: 10.1016/j.jesp.2009.06.001
Liu, Y., Gupta, H., Springer, E., and Wagener, T. (2008). Linking science with environmental decision making: experiences from an integrated modeling approach to supporting sustainable water resources management. Environ. Model. Softw. 23, 846–858. doi: 10.1016/j.envsoft.2007.10.007
Mason, C. H., and Perreault, W. D. (1991). Collinearity, power and interpretations of multiple regression analysis. J. Mark. Res. 28, 268–280. doi: 10.1177/002224379102800302
McFadden, D. (1979). “Quantitative methods for analysing travel behavior of individuals: some recent 630 developments,” in Behavioural Travel Modelling, eds D. A. Hensher and P. R. Stopher (London: Croom Helm), 279–318.
Miller, T. R., Baird, T. D., Littlefield, C. M., Kofinas, G., Stuart Chapin, F. III, and Redman, C. L. (2008). Epistemological pluralism: reorganizing interdisciplinary research. Ecol. Soc. 13:46.
Moser, S. C., and Dilling, L. (2010). “Communicating climate change: opportunities and challenges for closing the science-action gap,” in The Oxford Handbook of Climate Change and Society, eds R. Norgaard, D. Schlosberg, and J. Dryzek (Oxford: Oxford University Press), 161–174.
Opsahl, T., Agneessens, F., and Skvoretz, J. (2010). Node centrality in weighted networks: generalizing degree and shortest path. Soc. Netw. 32, 245–251. doi: 10.1016/j.socnet.2010.03.006
OysterFutures Stakeholder Workgroup (2018). Recommendations for Oyster Management and Restoration in the Choptank and Little Choptank Rivers - A Report Submitted to Secretary Belton. Maryland: OysterFutures Stakeholder Workgroup.
Pahl-Wostl, C. (2002). Participative and stakeholder-based policy design, evaluation and modeling processes. Integr. Assess. 3, 3–14. doi: 10.1076/iaij.3.1.3.7409
Podestá, G. P., Natenzon, C. E., Hidalgo, C., and Toranzo, F. R. (2013). Interdisciplinary production of knowledge with participation of stakeholders: a case study of a collaborative project on climate variability, human decisions, and agricultural ecosystems in the Argentine Pampas. Environ. Sci. Policy 26, 40–48. doi: 10.1016/j.envsci.2012.07.008
Prost, A. (2018). Dredging Man-O-War Shoal Could Deplete Oyster Restoration Budget, with Uncertain Benefits. Available online at: http://www.cbf.org/news-media/newsroom/2018/maryland/dredging-man-o-war-shoal.html (accessed 12 January 2019).
R Core Team (2015). R: A Language and Environmental for Statistical Computing. Vienna: R Foundation for Statistical Computing.
Rantala, L., Sarkki, S., Karjalainen, T. P., and Rossi, P. M. (2017). How to earn the status of honest Broker? Scientists’ roles facilitating the political water supply decision-making process. Soc. Nat. Resour. 30, 1288–1298. doi: 10.1080/08941920.2017.1331484
Reed, M. S. (2008). Stakeholder participation for environmental management: a literature review. Biol. Conserv. 141, 2417–2431. doi: 10.1016/j.biocon.2008.07.014
Rittel, H., and Weber, M. (1973). Dilemmas in a general theory of planning. Policy Sci. 4, 155–169. doi: 10.1007/bf01405730
Robins, G., Pattison, P., Kalish, Y., and Lusher, D. (2007). An introduction to exponential random graph 662 (p∗) models for social networks. Soc. Netw. 29, 173–191. doi: 10.1016/j.socnet.2006.08.002
Robles-Morua, A., Halvorsen, K. E., Mayer, A. S., and Vivoni, E. R. (2014). Exploring the application of 659 participatory modeling approaches in the Sonora River Basin. Mexico. Environ. Model. Softw. 52, 273–282. doi: 10.1016/j.envsoft.2013.10.006
Röckmann, C., Ulrich, C., Dreyer, M., Bell, M., Borodzicz, E., Haapasaari, P., et al. (2012). The added value of participatory modelling in fisheries management - what has been learnt? Mar. Policy 36, 1072–1085. doi: 10.1016/j.marpol.2012.02.027
Rouwette, E., Korzilius, J., Vennix, J., and Jacobs, E. (2002). Group model building effectiveness: a review of assessment studies. Syst. Dynam. Rev. 18, 5–45. doi: 10.1002/sdr.229
Rouwette, E., Vennix, J., and van Mullekom, T. (2011). Modeling as persuasion: the impact of group model building on attitudes and behavior. Syst. Dynam. Rev. 27, 1–21.
Sarkki, S., Tinch, R., Niemela, J., Heink, U., Waylen, K., Timaeus, J., et al. (2015). Adding ‘iterativity’ to the credibility, relevance, legitimacy: a 673 novel scheme to highlight dynamicc aspects of science-policy interfaces. Environ. Sci. Policy 54, 505–512. doi: 10.1016/j.envsci.2015.02.016
Schmolke, A., Thorbek, P., DeAngelis, D. L., and Grimm, V. (2010). Ecological models supporting environmental decision making: a strategy for the future. Trends Ecol. Evol. 25, 479–486. doi: 10.1016/j.tree.2010.05.001
Sherif, M., and Hovland, C. I. (1961). Social Judgement: Assimilation and Contrast Effects in Communication and Attitude Change. Oxford: Yale University Press.
Stern, M. J., and Coleman, K. J. (2015). The multidimensionality of trust: applications in collaborative 680 natural resources management. Soc. Nat. Resour. 28, 117–132. doi: 10.1080/08941920.2014.945062
Turnhout, E., Stuiver, M., Klostermann, J., Harms, B., and Leeuwis, C. (2013). New roles of science in society: different repertoires of knowledge brokering. Sci. Public Policy 40, 354–365. doi: 10.1093/scipol/scs114
Valente, T. W., Coronges, K., Lakon, C., and Costenbader, E. (2008). How correlated are network centrality measures? Connect 28, 16–26.
Valente, T. W., and Fujimoto, K. (2010). Bridging: locating critical connectors in a network. Soc. Netw. 32, 212–220. doi: 10.1016/j.socnet.2010.03.003
Van Voorn, G. A. K., Verburg, R. W., Kunseler, E. M., Vader, J., and Janssen, P. H. M. (2016). A checklist for model credibility, salience, and legitimacy to improve information transfer in environmental policy assessments. Environ. Model. Softw. 83, 224–236. doi: 10.1016/j.envsoft.2016.06.003
Venables, W. N., and Ripley, B. D. (2002). Modern Applied Statistics with S, fourth ed. New York, NY: Springer.
Visser, P. S., and Mirabile, R. R. (2004). Attitudes in the social context: the impact of social network composition on individual-level attitude strength. J. Pers. Soc. Psychol. 87, 779–795. doi: 10.1037/0022-3514.87.6.779
Voinov, A., and Gaddis, E. (2008). Lessons for successful participatory watershed modeling: a perspective from modeling practitioners. Ecol. Modell. 216, 197–207. doi: 10.1016/j.ecolmodel.2008.03.010
White, D. D., Wutich, A., Larson, K. L., Gober, P., Lant, T., and Senneville, C. (2010). Credibility, salience, and legitimacy of boundary objects: water managers’ assessment of a simulation model in an immersive decision theater. Sci. Public Policy 37, 219–232. doi: 10.3152/030234210x497726
Keywords: participatory modeling, scientific models, stakeholders, attitudes, salience, credibility, legitimacy, social network analysis
Citation: Goelz T, Hartley T, Scheld A and Carboni I (2020) The Development of Attitudes Toward Scientific Models During a Participatory Modeling Process – The Impact of Participation and Social Network Structure. Front. Mar. Sci. 7:644. doi: 10.3389/fmars.2020.00644
Received: 13 March 2020; Accepted: 14 July 2020;
Published: 11 August 2020.
Edited by:
Di Jin, Woods Hole Oceanographic Institution, United StatesReviewed by:
Jennifer Leigh Bailey, Norwegian University of Science and Technology, NorwayChristian T. K.-H. Stadtlander, Independent Researcher, St. Paul, United States
Copyright © 2020 Goelz, Hartley, Scheld and Carboni. This is an open-access article distributed under the terms of the Creative Commons Attribution License (CC BY). The use, distribution or reproduction in other forums is permitted, provided the original author(s) and the copyright owner(s) are credited and that the original publication in this journal is cited, in accordance with accepted academic practice. No use, distribution or reproduction is permitted which does not comply with these terms.
*Correspondence: Taylor Goelz, dGF5bG9yZ29lbHpAZ21haWwuY29t