 Yuanchao Wang
 Cui Liang
 Yibang Wang
 Weiwei Xian
 Maria Lourdes Palomares
95% of researchers rate our articles as excellent or good
Learn more about the work of our research integrity team to safeguard the quality of each article we publish.
Find out more
ORIGINAL RESEARCH article
Front. Mar. Sci. , 21 August 2020
Sec. Marine Fisheries, Aquaculture and Living Resources
Volume 7 - 2020 | https://doi.org/10.3389/fmars.2020.00640
This article is part of the Research Topic The Status of Marine Fisheries in East Asia View all 16 articles
This contribution presented stock assessments for 10 fish and 2 squid populations exploited by Chinese, South Korean, and Japanese fishing fleets in the Tsushima Warm Current region, i.e., Southwest Japan and East China. The methods used were a Monte Carlo method (CMSY) and a Bayesian state-space implementation of the Schaefer model (BSM), based on published time series of catch and abundance data (SSB and CPUE). Results showed that 2 fish stocks, Japanese jack mackerel (Trachurus japonicus) and yellowback sea-bream (Dentex hypselosomus), had a healthy status, while daggertooth pike conger (Muraenesox cinereus) appeared to have collapsed. The other 9 stocks showed varying degrees of overfishing. The cooperation of several countries would be required to recover the fishery resources in the Tsushima Warm Current region.
The capture production (FAO catalog: Fish, crustaceans, molluscs, etc.) in the Northwest Pacific Ocean (No. 61 fishing area, FAO) accounted for 20.2% of the world total marine capture in 2017 (FAO, 2019). The management of exploited fishery stocks in this region requires a knowledge of stock status and relevant reference points that can be used in formulating fishery management policies. However, this kind of information is usually deficient or inadequate, especially for data-limited stocks (Froese et al., 2012). In recent years, in order to resolve this dilemma, there have been attempts targeting research effort on data-limited stocks to support newly released fishery management policies (DAFF, 2007; MSA, 2007; MFNZ, 2008; CFP, 2013).
In response to severe depletions of fishery resources, neighboring countries of the Northwest Pacific Ocean, such as Japan, South Korea, and China, have intervened with a series of fishery management strategies. In Japan, a total allowable catch (TAC) system was introduced by the Fisheries Agency of Japan (FAJ) in 1997, in addition to existing management strategies, to deal with overfishing problems. The FAJ raised the Resource Recovery Plan system in 2001, which is mainly based on the co-management concept (Makino, 2018; Yatsu, 2019). In 2018, the FAJ started to adopt the MSY as an explicit fishery target for efficient managements. In South Korea, to promote the recovery of overexploited stocks, a buyback program was initiated in 1994 and a fish stock rebuilding plan was instituted in 2004. “Jayul Community Fisheries Management” was a program carried out in 2001 to increase accountabilities and instill “a sense of ownership” among local stakeholders. Lee and Rahimi Midani (2014) suggested that the fishery productivity had increased in the coastal area of South Korea, but more vessels needed to be removed. In China, most fisheries are multi-species, and there are certain difficulties in determining the sustainable total catch. Overall, input control and technical measures are the common and main strategies of these countries. These measures have achieved certain effects on fishery managements. However, the problem is that the prerequisite, namely, fishery stock status, is often neglected in the implementation of these managements.
There are 2 main kinds of models for assessments of fishery stock status: one is the age-structured models when age and/or length data are available, and the other is surplus production models when only catch and/or abundance data are available. Ecosystem-based fishery strategy is identified as a key to improve fishery managements, and there is a demand for all exploited fishery stock assessments, including the data-limited stocks. However, efficient and compatible methods, particularly for the data-limited stocks, are always necessary and deficient.
A Monte Carlo-type method (CMSY) and a Bayesian state-space implementation of the Schaefer model (BSM) were developed for data-limited fishery stock assessments (Froese et al., 2017). CMSY can be used to perform assessments based on the time series of catch and resilience data. It is a notable improvement over the Catch-MSY method of Martell and Froese (2013) with the inclusion of decrease for the reproduction when a stock is severely depleted. It is an advanced implementation of a surplus production model. Froese et al. (2018) provided CMSY estimates for 397 European stocks and results showed that 69% of the 397 stocks were in the state of overfishing, while sustainably exploited stocks in the Mediterranean were no more than 20%. Palomares et al. (2018) implied that 73.4% of 1,320 assessed stocks were under the MSY level in biomass all over the world. The BSM method was developed for cases in which abundance data are available in addition to time series of catch (Froese et al., 2017), such as catch per unit effort (CPUE) and spawning stock biomass (SSB). The main advantages of the BSM method are the highly flexible and steerable priors, and the data mining possibilities from uncompleted abundance data.
In this contribution, the CMSY and BSM methods were used to assess the status and essential reference points for 12 fishery stocks distributed in the Tsushima Warm Current region of the Northwest Pacific Ocean, and 9 stocks among them were evaluated by the BSM method with time series of catch and the relevant abundance data (SSB or CPUE). The other 3 stocks, for which only catch data were available, were assessed by the CMSY method. Based on these results, the relative stock status and essential reference points were given and the application of CMSY and BSM methods was discussed, as required for management of the fisheries and further research.
The Tsushima Warm Current is one of the complex current system in the Northwest Pacific Ocean, supporting the main fisheries of neighboring countries. Its main marginal seas include the East China Sea, Yellow Sea, and the Sea of Japan. A whole life history stage of a target fishery stock would be affected by surrounding countries. The 12 stocks in question accounted for about 19.48% of the total capture production in the Northwest Pacific Ocean in 2017 (FAO, 2019). In recent decades, the severe depletions of fishery resources and the substantial environmental fluctuations suggest that the ecosystem structure is underlying rapid change. The annual average sea surface temperature (SST) around Japan has increased by +1.11°C over the last 100 years, and increasing blooms of harmful algae and jellyfish are prominent and common problems in the coastal area of surrounding countries (Yatsu, 2019). These urgent situations have attracted global attention.
The datasets for the 12 stocks in question were obtained from the FAJ and Japan Fisheries Research and Education Agency1 (abbreviated as FAJ) as is shown in the Supplementary Material (time series of catch and standard CPUE and SSB in Supplementary Table S1; the distribution areas, spawning, and fishing grounds of these stocks are shown in Supplementary Figure S1). The basic information for each stock is shown in Table 1, and their relative priors for CMSY and BSM are shown in Table 2. Black scraper (Thamnaconus modestus), daggertooth pike conger (Muraenesox cinereus), and swordtip squid (Uroteuthis edulis) had only time series of catch, while the other 9 stocks had both catch and relative abundance data. The prior ranges for intrinsic rate of population increase (r) were obtained from FishBase (Froese et al., 2000; Froese and Pauly, 2019), where they were referred to as “resilience” (Musick, 1999). The priors of relative biomass for the first year (Bstart), the intermediate year (Bint), and the end year of the time series of catch (Bend) were based on the relative FAJ reports of these stocks. The CMSY and BSM methods were implemented in R language (R Core Team, 2013) and relative R code can be found from http://oeanrep.geomar.de/33076/.
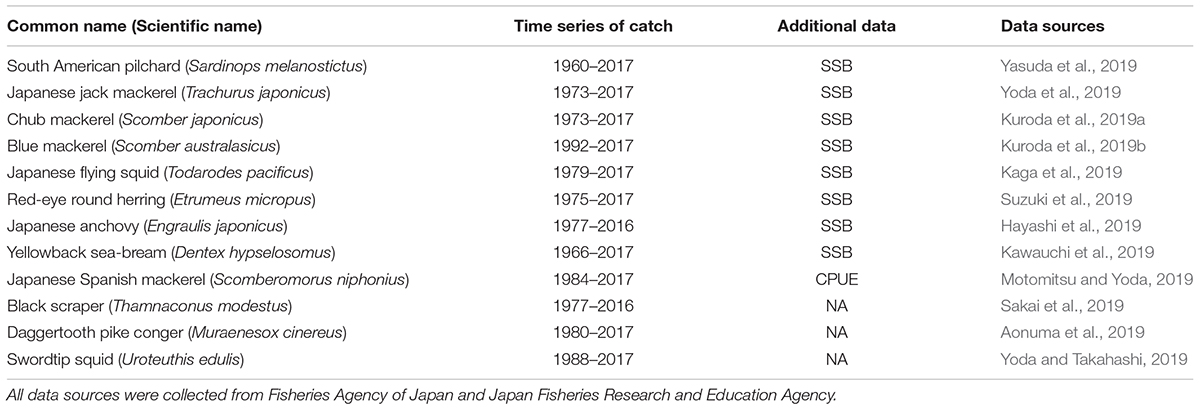
Table 1. Basic information of the 12 fishery stocks in question.
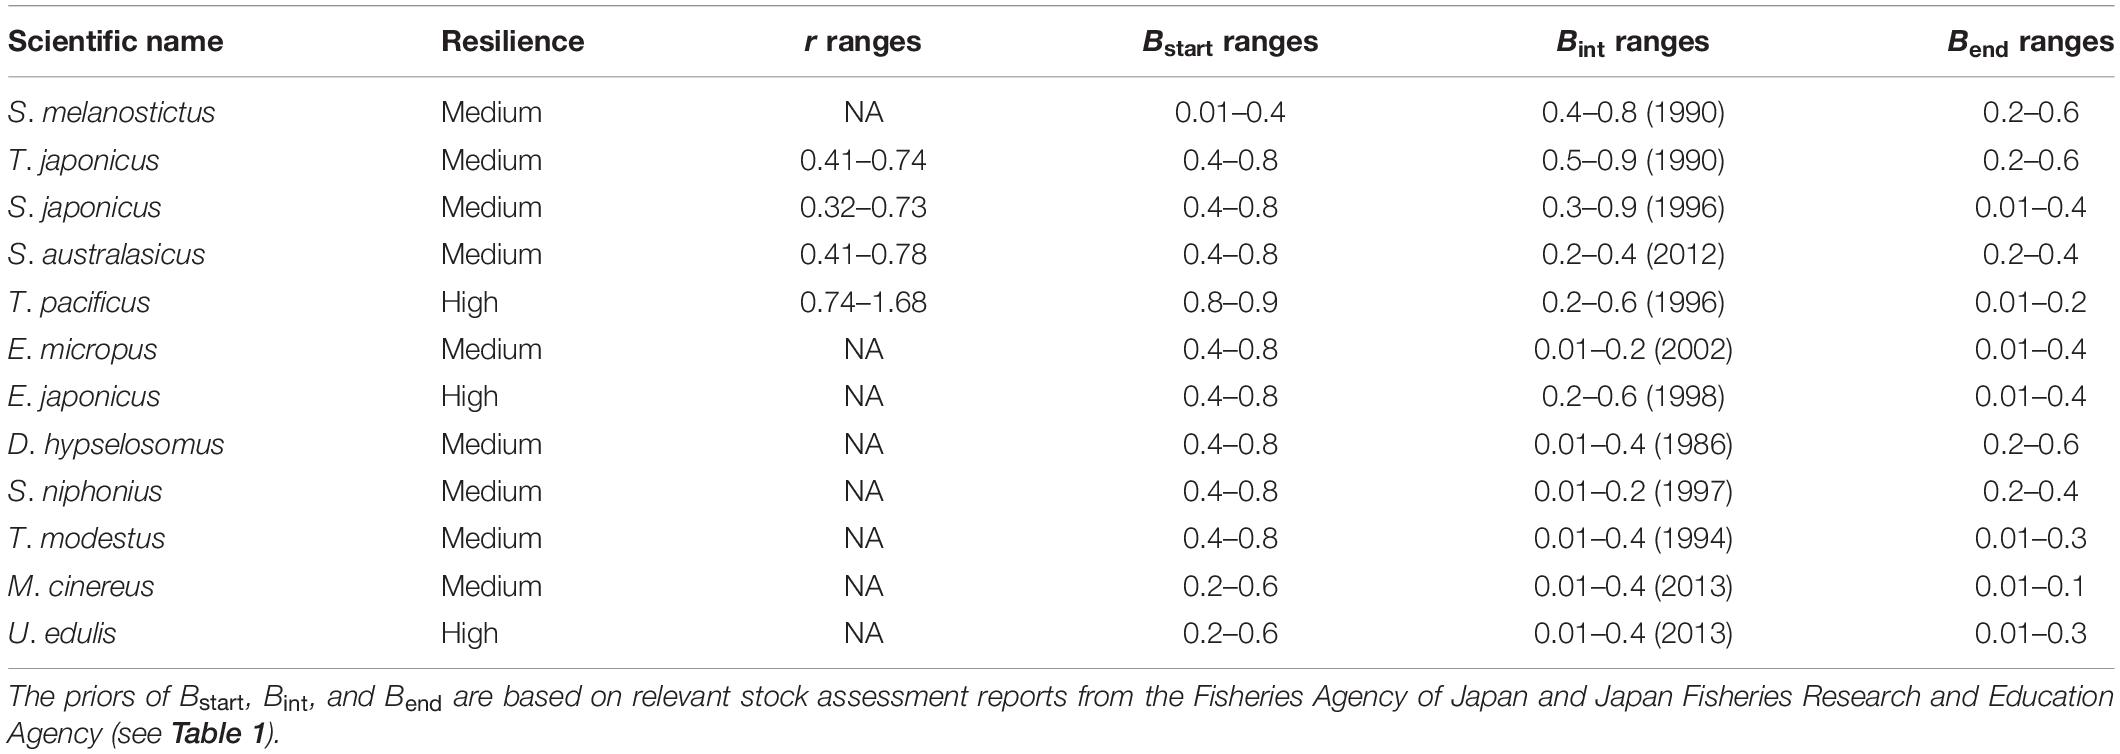
Table 2. Prior ranges used for CMSY and BSM; the resilience ranges were from FishBase (Froese and Pauly, 2019).
The CMSY method filters the suitable r–k pairs using a Monte Carlo approach with the priors of the intrinsic rate of population increase (r), unexploited population size or carrying capacity (k), and the relative biomass for the first year of the time series of catch (Bstart) (Table 2). The range of the prior k is calculated in the R code by Eqs 1 and 2, i.e.,
where klow and khigh are the lower and higher boundary priors for k, respectively, max(C) is the maximum catch value of the time series of catch, rlow and rhigh are the lower and higher boundary priors of r, and endbmean is the mean of relative prior biomass range for the end of the time series.
In the filter process, a pair of r–k values are randomly selected in prior ranges of r and k, and then a biomass (Bt) is selected from the Bstart ranges for the start year of time series of catch. If Bt/k is greater than 0.25, this randomly selected r–k–Bstart combination will be used to calculate the predicted biomass in subsequent years according to Eq. 3 (Schaefer, 1954, 1957), i.e.,
where Bt+1 is the predicted biomass in the subsequent year t + 1, and Ct is the catch in the year of t.
If Bt/k is smaller than 0.25, Eq. 4 will be used to calculate the relevant biomass in the subsequent years:
where the term 4 assumes a linear decline of recruitment below half of the biomass that is capable of producing MSY to account for “depensation”, i.e., to simulate the reduction of productivity that tends to occur at very low stock sizes (Hutchings, 2000).
These randomly selected r–k pairs will be accepted if they meet all the following three conditions: (1) the predicted biomass is not smaller than 0.01 k; (2) the predicted biomass falls inside the prior biomass range of the intermediate year (Bint); and (3) the predicted biomass falls inside the prior biomass range of the final year (Bend). The process will be terminated once 1,000 suitable r–k pairs are found. These suitable r–k pairs will form a triangle pattern with a thin tip as is shown in the Supplementary Figure S2. In contrast to the Catch-MSY method, the best r–k pair of the CMSY method is chosen not in the center, but in the tip region of the triangle (Froese et al., 2017).
The Bayesian state-space implementation of the Schaefer model (i.e., the BSM method) provides more precise estimates of r, k, and MSY (Millar and Meyer, 1999; Froese et al., 2017) for stocks for which additional abundance data, such as (at least 2 estimates of) relative biomass or CPUE, are available. This method is included in the CMSY R code.
In the BSM method, the prior ranges of r and k are converted to prior density distributions. Meanwhile, a new prior, the catchability coefficient q, is added to establish the relationship between the biomass trajectory that is inferred from r–k pairs and the abundance (or relative biomass) data that are available externally. Herein, r is log-normally distributed based on a chi-square test of the density of the suitable r values resulting from CMSY analysis of simulated data against several standard distributions, while k and q are assumed to have log-normal distributions (Froese et al., 2017).
The abundance index, catchability coefficient q, is obtained from Eq. 5, i.e.,
where CPUEt is the catch per unit effort in the year t and q is the catchability coefficient.
The basic dynamics of the corresponding Schaefer production model for abundance can therefore be expressed in the form of Eq. 6, i.e.,
whose parameters are defined in Eqs 3 and 5.
In this method, the prior q is calculated by the several settings and based on the Schaefer equilibrium equation. q at the MSY level of biomass,
q at half MSY level of biomass,
The low and high q priors are calculated by the following equations:
where qlow is the lower prior for the catchability coefficient q, rpgm is the geometric mean of the r prior range, CPUEmean and Cmean are the mean of the CPUE and catch, respectively, taken over the last 5 years for species with medium and high resilience or over the last 10 years for species with low or very low resilience, endbmean is defined in Eqs 1 and 2.
where qhigh is the upper prior for the catchability coefficient q, rhigh is the upper prior range for r, and other parameters are defined in Eq. 9.
The JAGS software (Plummer, 2003) is used for sampling the probability distributions of the parameters with the Markov Chain Monte Carlo method (Froese et al., 2017).
In this contribution, we applied the CMSY and BSM methods to 12 fishery stocks distributed in the Tsushima Warm Current region. The main results of CMSY and BSM are shown in Table 3, including assessments for r (0.37–1.05 year–1), k (7.75–6723 tonnes), relative biomass of the end year of time series of catch Bend/k (0.0333–0.578), related fishery reference points, i.e., MSY (0.985–1049 tonnes⋅year–1), BMSY (3.87–3362 tonnes), B/BMSY (0.0666–1.16), and exploitation rates (0.00362–1.35). The estimates of relative biomass B/k trajectories depicted the fluctuations of population sizes for 12 stocks and a significant decline of relative biomass in 1990s was observed in Figure 1. Figure 2 shows the B/BMSY and F/FMSY curves for each stock.
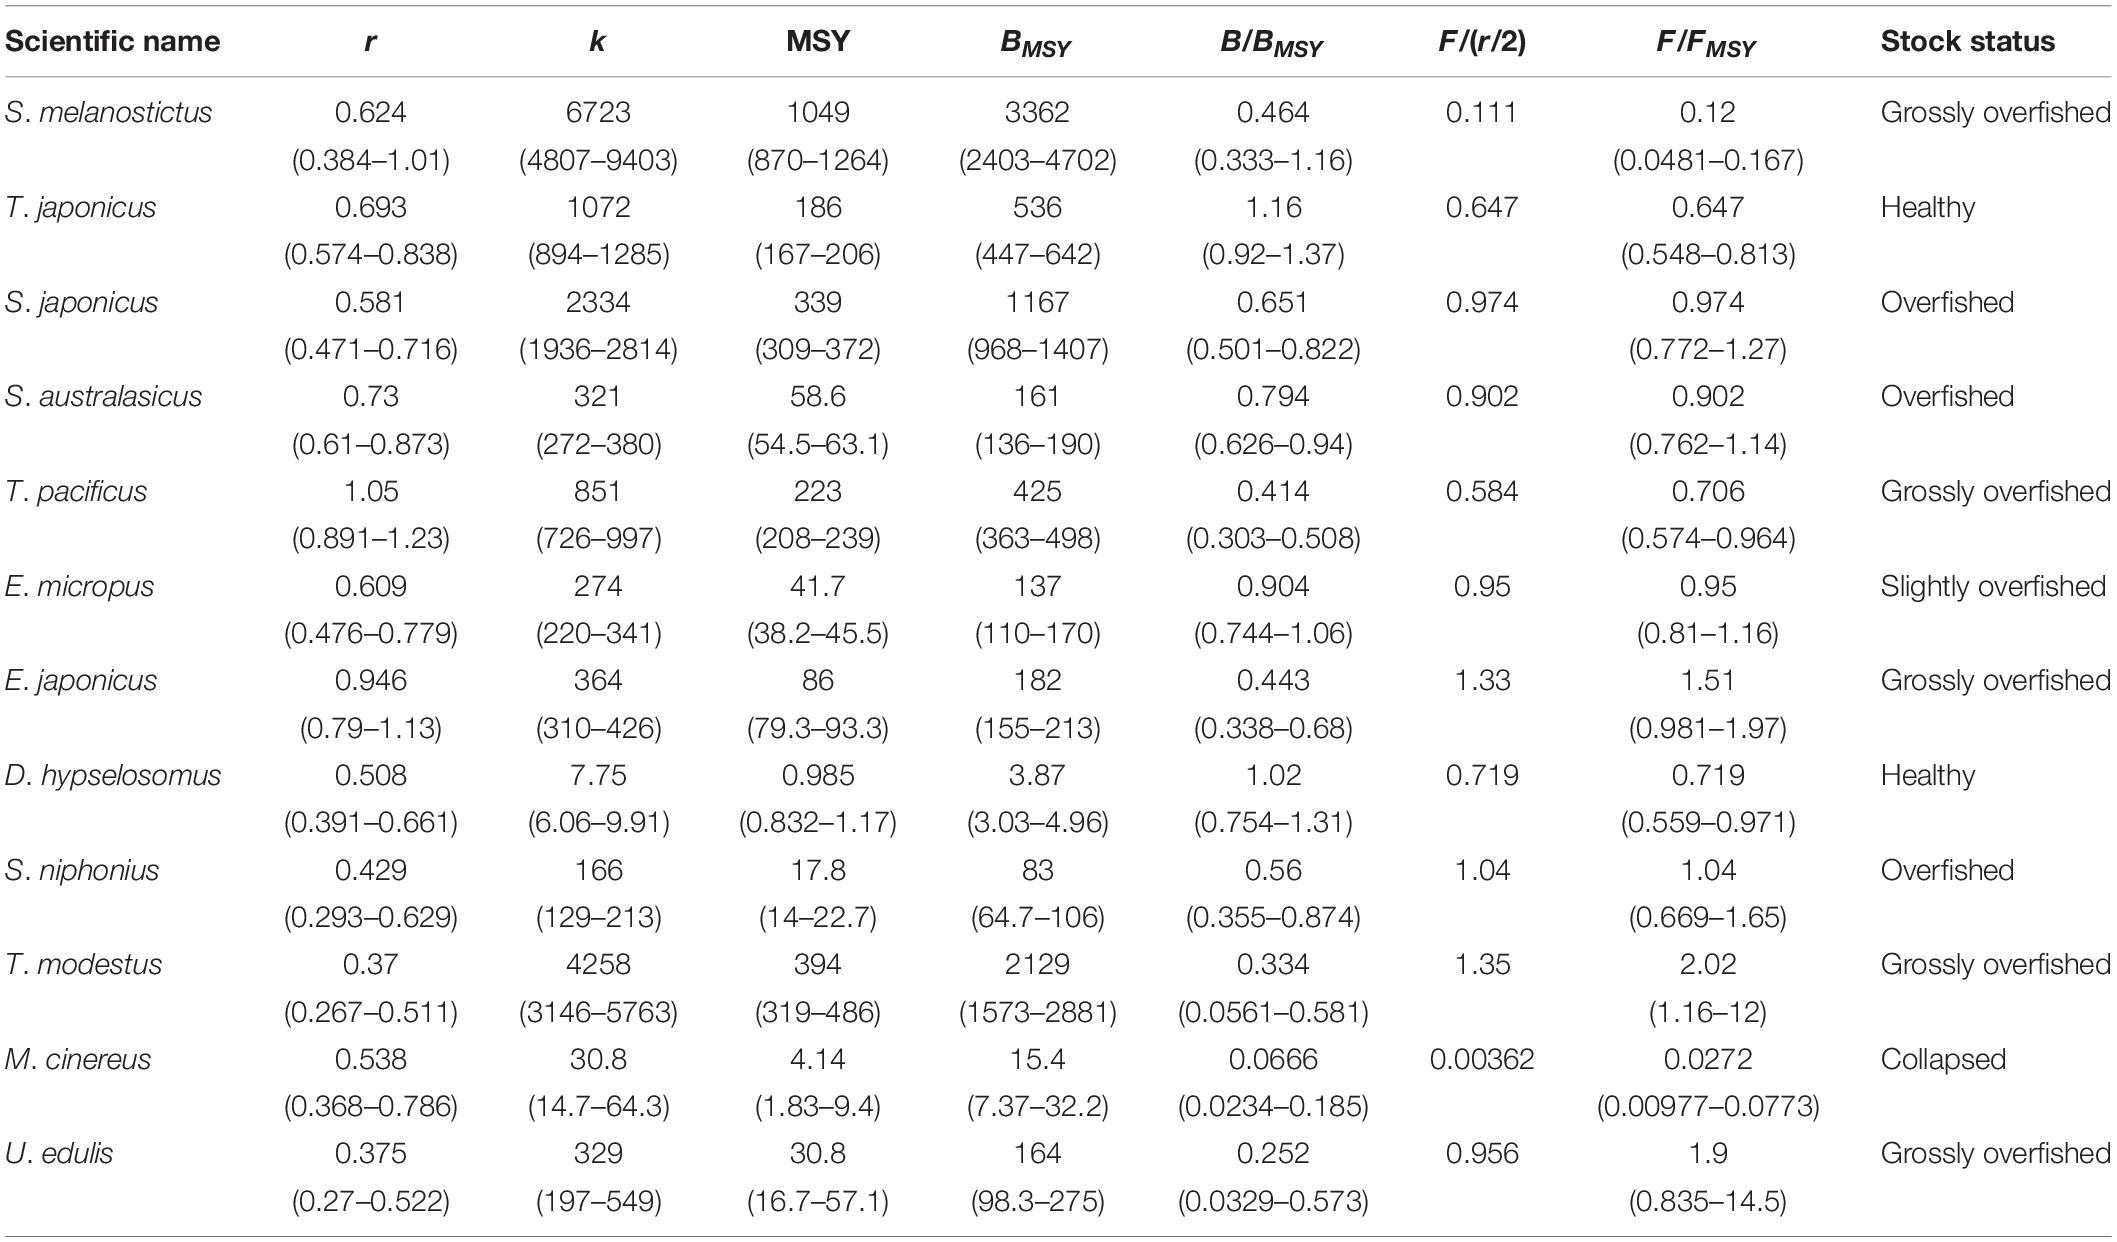
Table 3. Results of the CMSY and BSM analyses with 95% confidence interval in relative brackets (k, MSY, and BMSY in tonnes).
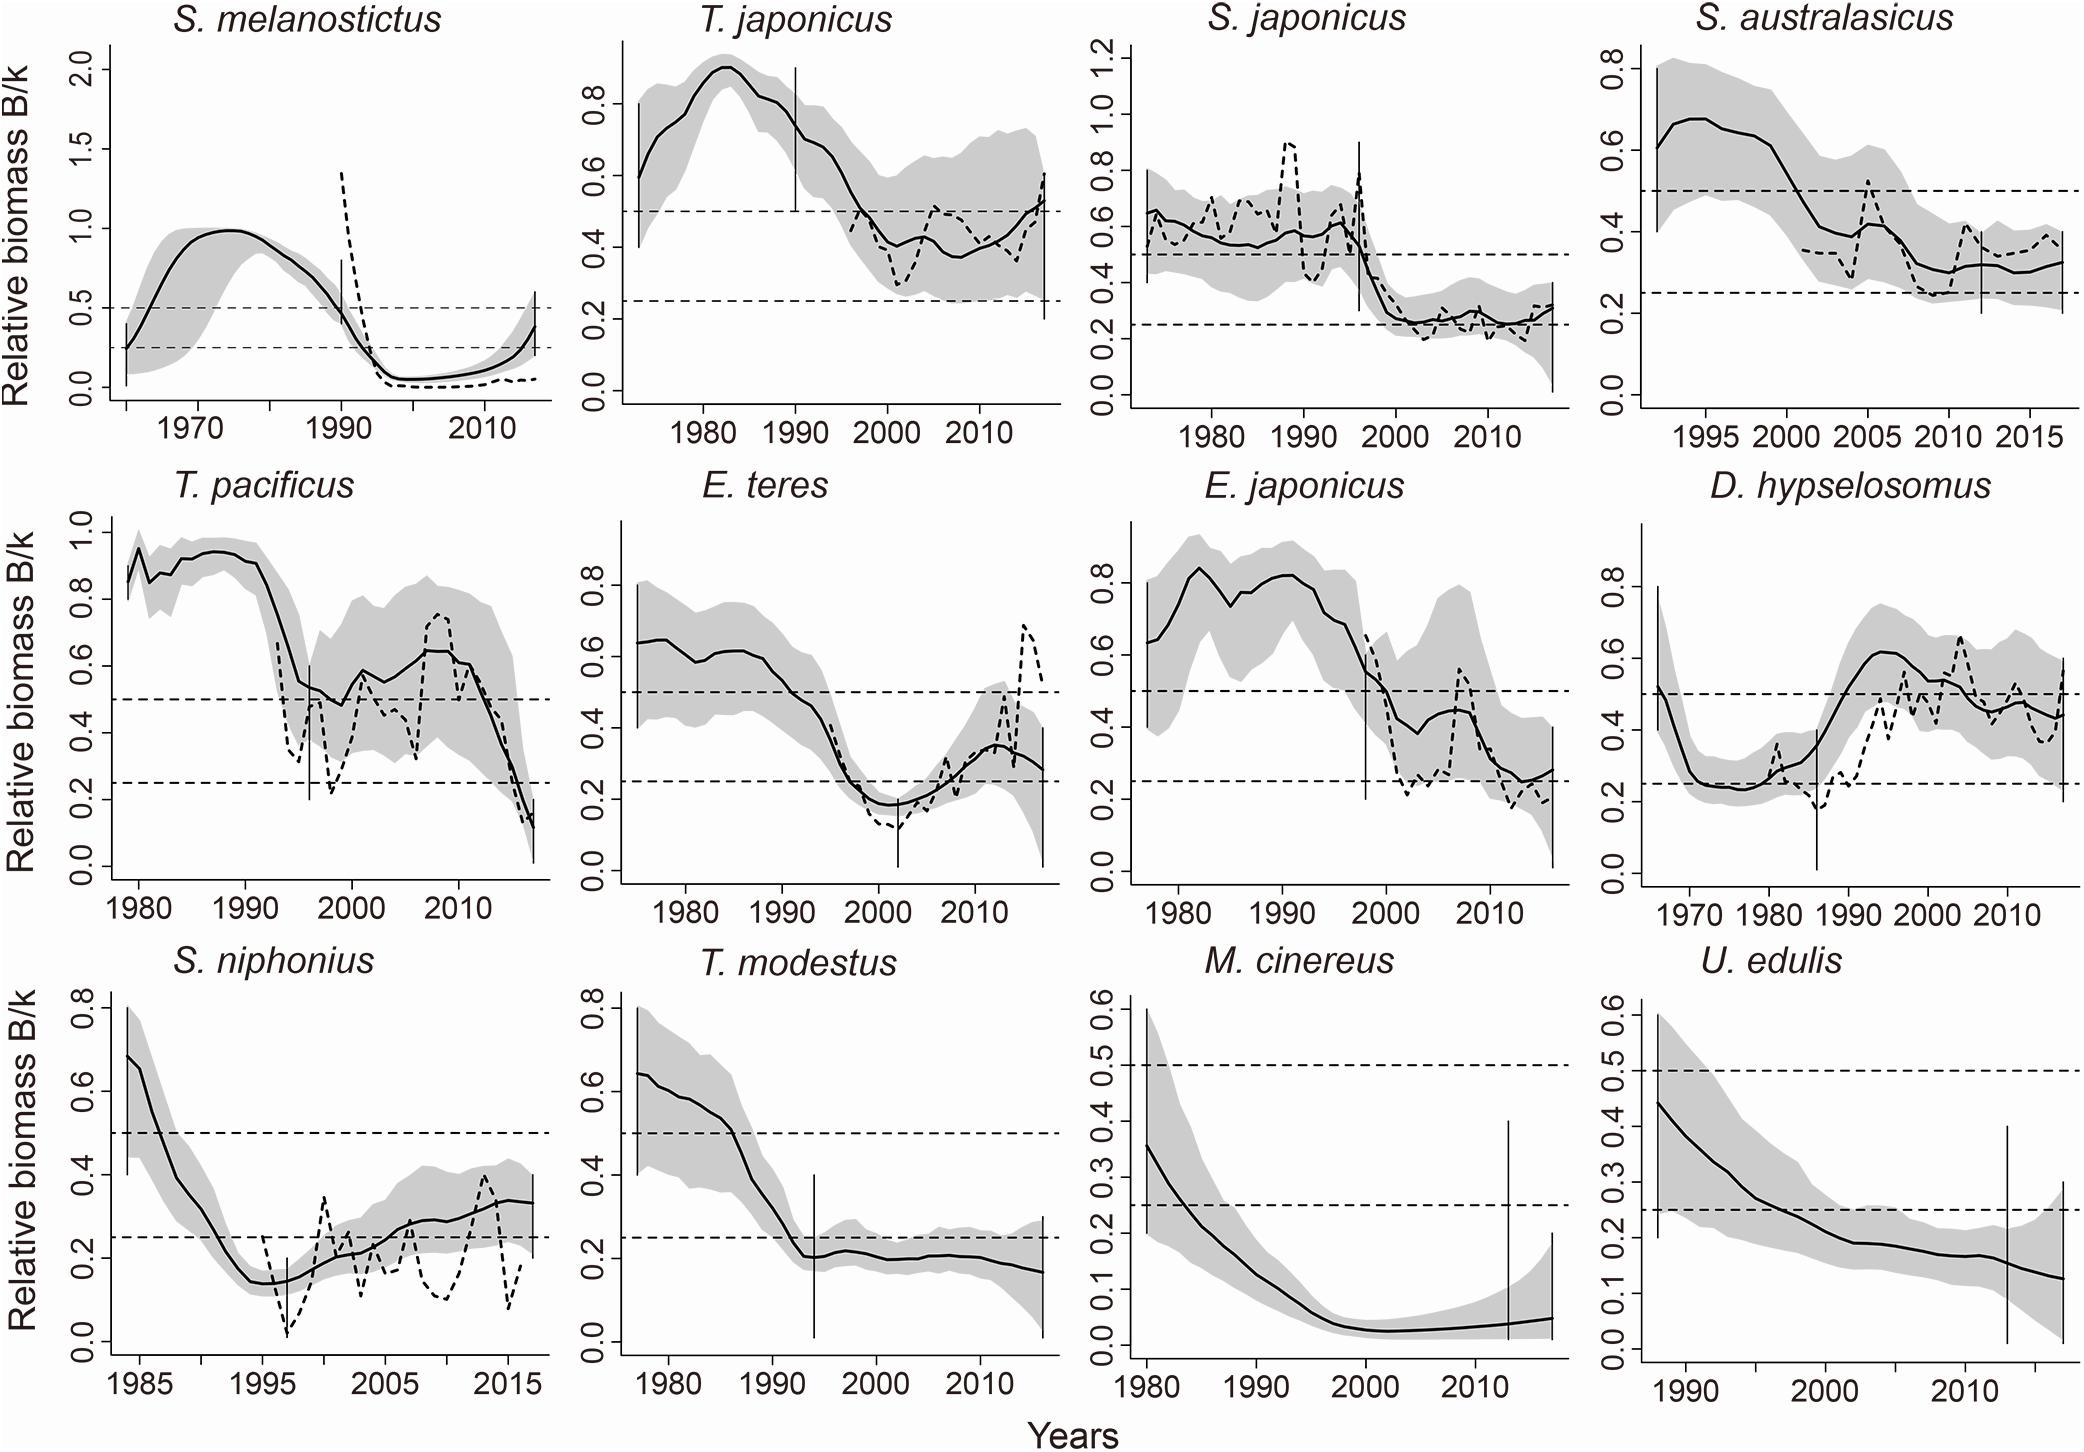
Figure 1. Biomass trajectories (solid line) estimated by CMSY for 12 species in question. The gray areas showed the 95% confidence intervals of the biomass, and the dotted lines showed additional information (CPUE or SSB) when available. The three vertical lines indicated the prior biomass ranges, and two horizontal dotted lines indicated the 2.5th and 97.5th percentiles.
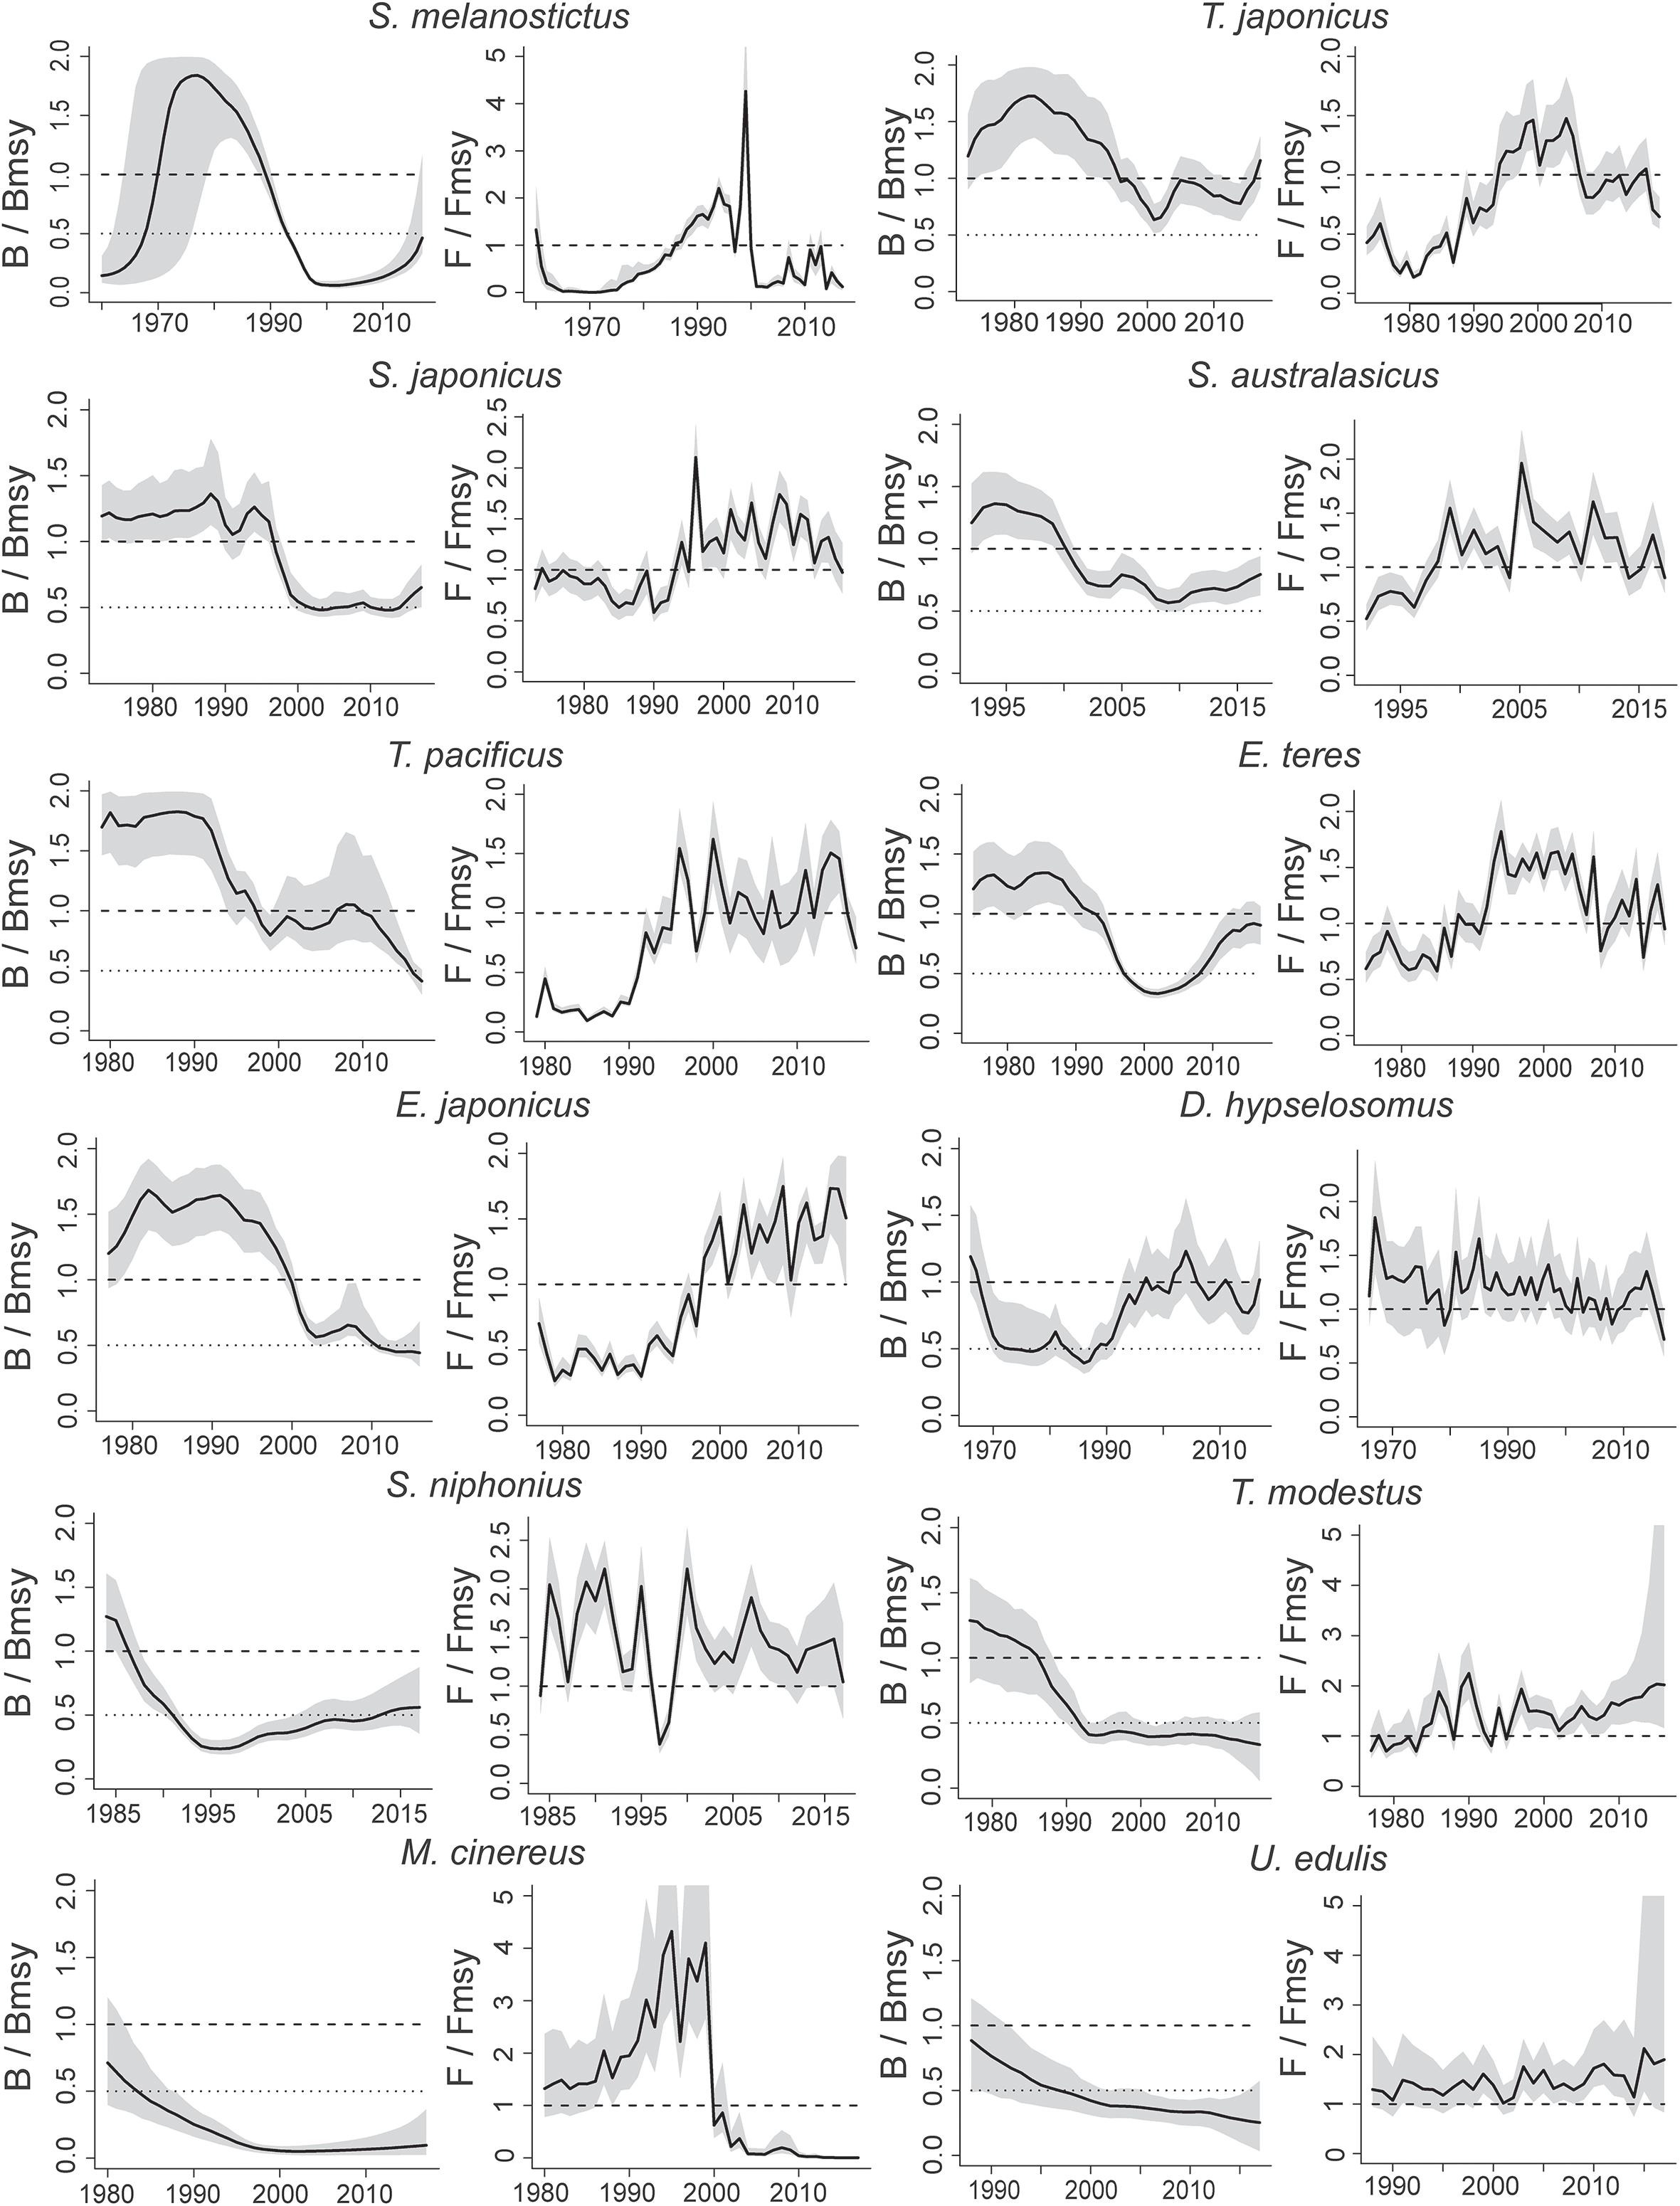
Figure 2. For each stock, the left graph shows the trajectory of relative total biomass (B/BMSY), and the gray area indicated 95% confidence intervals; the right graph shows relative exploitation (F/FMSY), with FMSY corrected for reduced recruitment below 0.5BMSY.
Among the 12 stocks, the B/BMSY estimates of Japanese jack mackerel (T. japonicus) and yellowback sea-bream (D. hypselosomus) were both above 1.0, which meant that they had a healthy status according to the criteria in Palomares et al. (2018). The B/BMSY of daggertooth pike conger (M. cinereus) was 0.067 in the last year, which corresponded to a collapsed status. The other 9 stocks exhibited different degrees of overfishing. The BMSY of T. japonicus was above 500,000 tonnes, and the stocks with BMSY > 1,000,000 tonnes included chub mackerel (S. japonicus) (overfished), South American pilchard (S. melanostictus) (grossly overfished), and back scraper (T. modestus) (grossly overfished). These stocks with large capacities were long-term targets of fishing activities and in different degrees of overfishing.
The biomass levels estimated from the BSM method were depicted and compared with re-estimated biomass “true values” collected from FAJ reports (Figure 3), which implied a relative larger uncertainty of the BSM method estimated for South American pilchard (S. melanostictus). For the diagnostic tests of BSM fits, predicted versus observed catch and abundance data are provided in Supplementary Figures S3A–I, which showed that the autocorrelations of residuals of the abundance data of South American pilchard (S. melanostictus) and Japanese anchovy (E. japonicus) were both deemed not negligible.
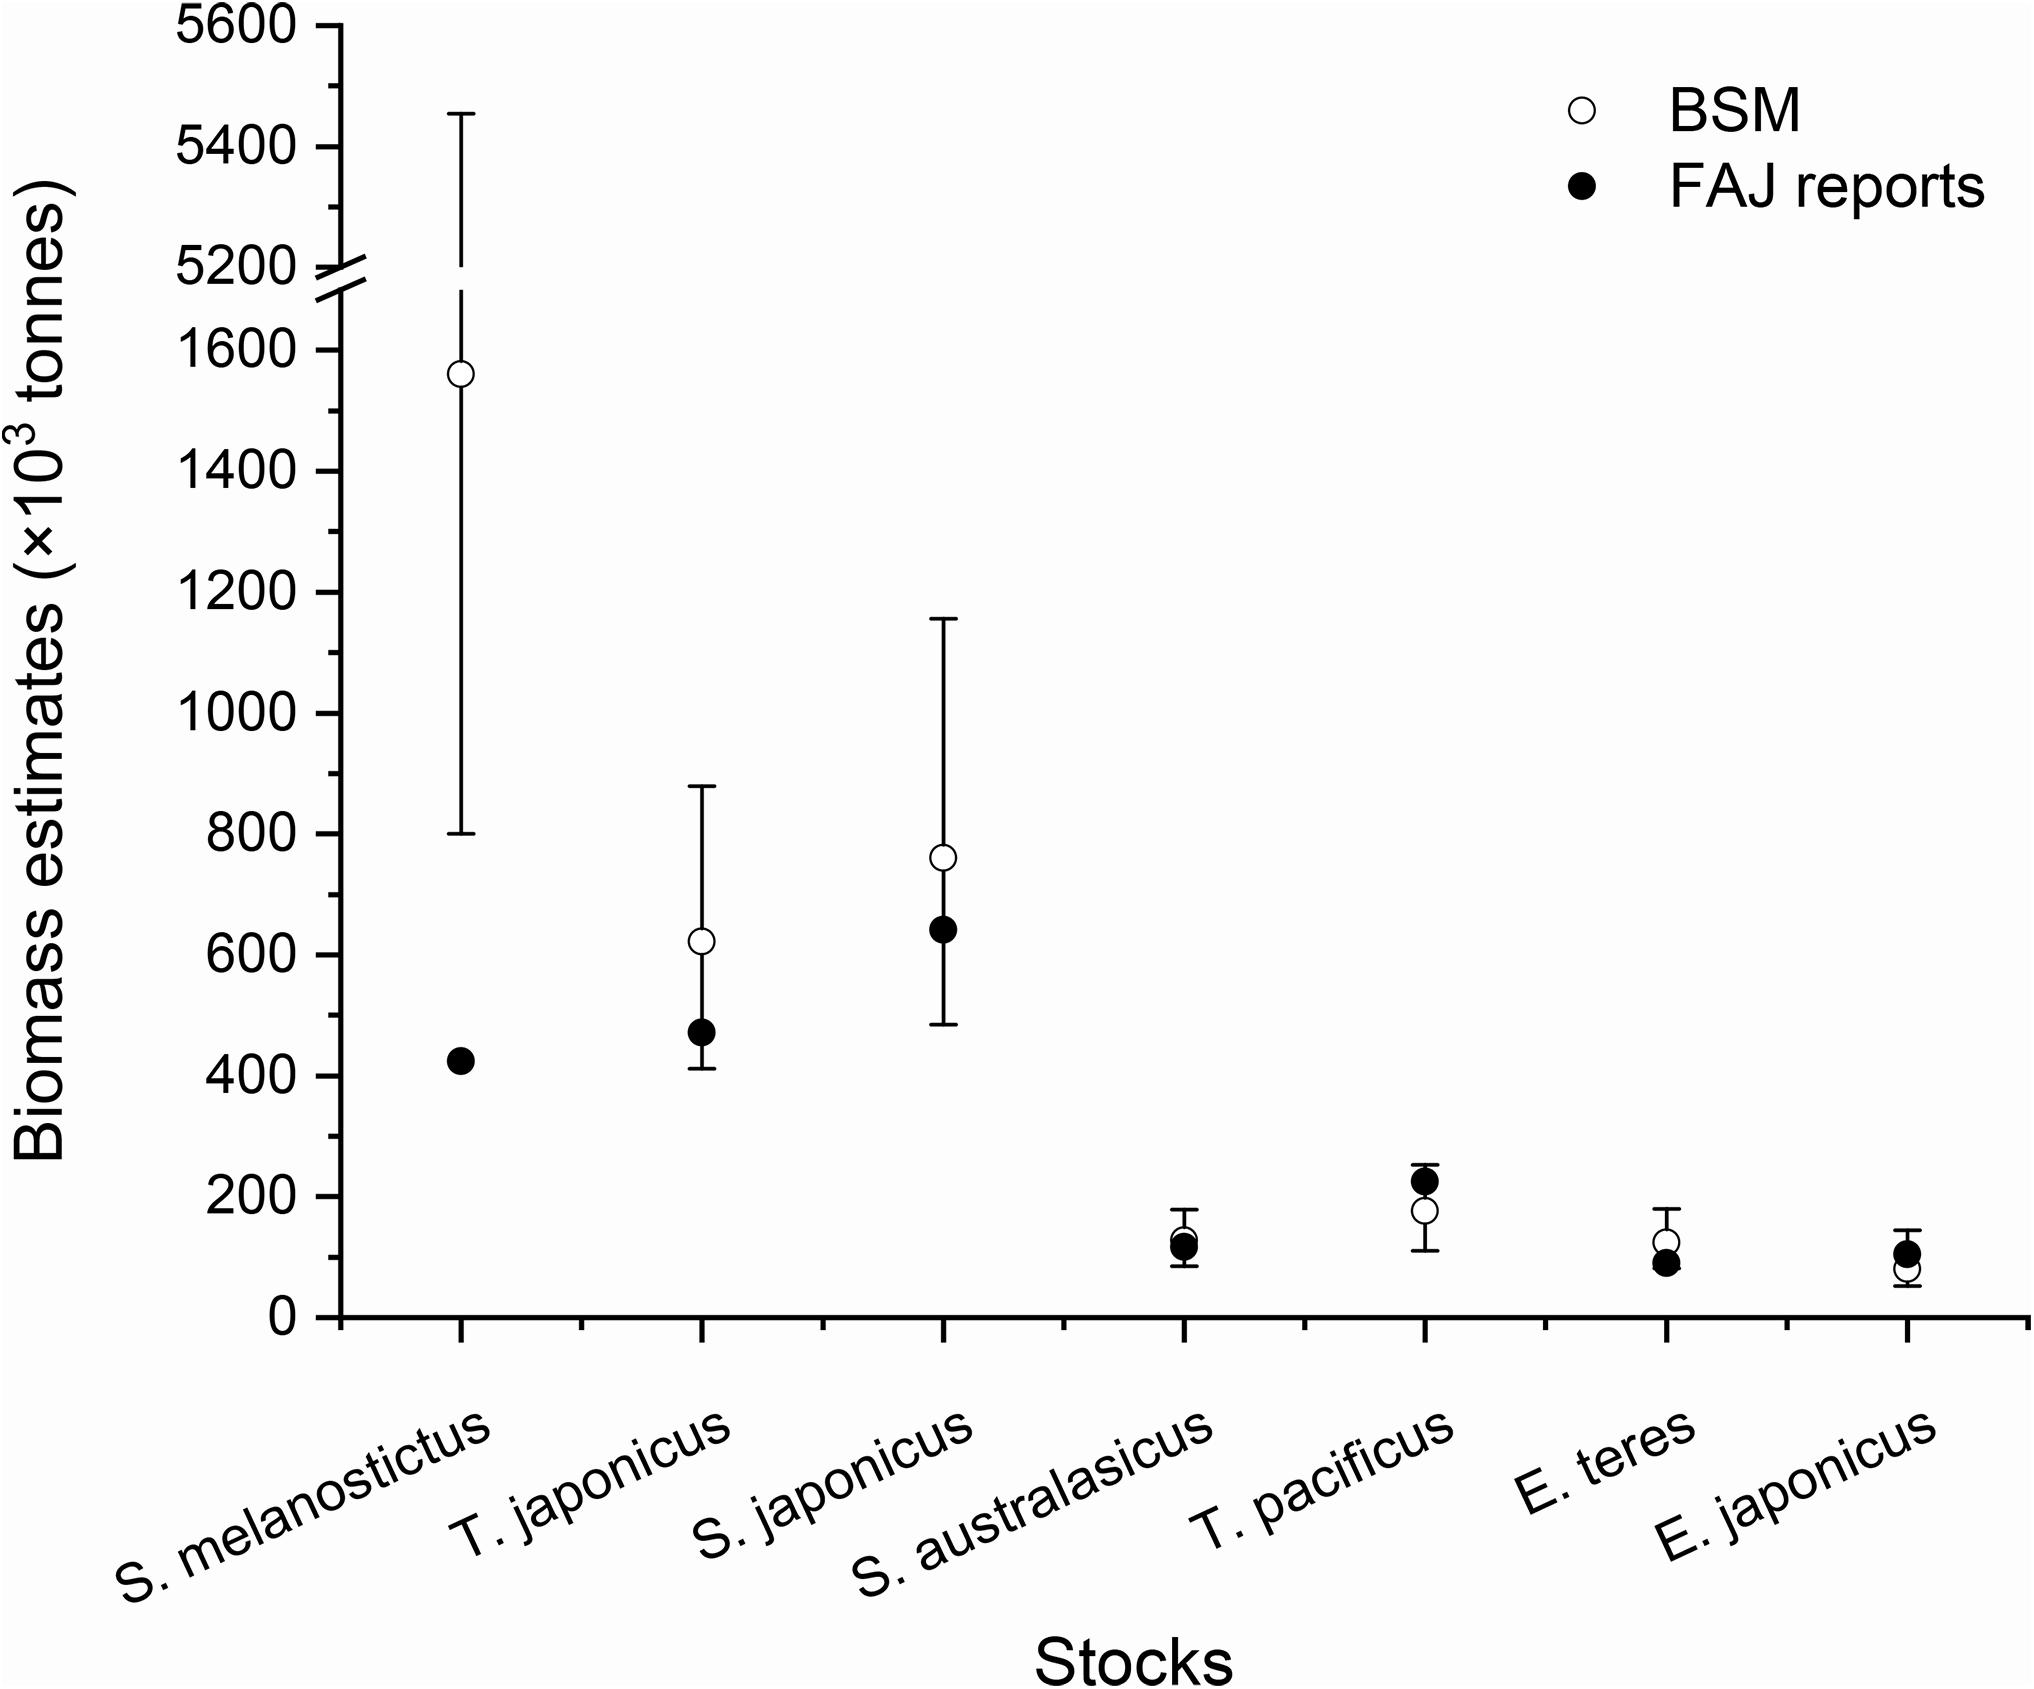
Figure 3. Comparisons of biomass estimates between BSM results (dots with error bars) obtained in this study and FAJ reports. The biomass estimates based on FAJ were re-assessed values treated as “true values”. The other five stocks in question (D. hypselosomus, S. niphonius, T. modestus, M. cinereus, and U. edulis) did not have biomass data in the FAJ reports.
The South American pilchard (S. melanostictus), also known as Pacific sardine, is a pelagic–neritic fish species belonging to the Clupeidae family (Froese and Pauly, 2019). The stock around Japan is one of the three lineages of this species, as established by cluster and parsimony analyses of haplotypic divergences (Grant et al., 1998). The ratio Bend/k and B/BMSY value suggested that this stock was grossly overfished in 2017. The biomass trajectory of this stock was consistent with the results of Yasuda et al. (2019), and the biomass size was increasing in recent years (Figure 2). The low fishing pressure (F/FMSY = 0.12) may not change the natural law of climate effects on this stock. The biomass fluctuation of this stock may be related to climate change, and the stock would change drastically even though a reliable and constant MSY or FMSY was given and implemented (Katsukawa, 2002).
Figure 3 shows that the biomass level estimated by the BSM method in this study had a larger deviation for this stock, compared with that of FAJ reports. This could be mainly due to the significant correlation between the population dynamics and environmental elements. Nishikawa (2018) presented that water temperature and/or its relevant elements affected the recruitment through larval survival, and lower temperature conditions increased larval survival rate (Takasuka et al., 2007; Nishikawa et al., 2013). What’s more, the combination of strong MOI (Monsoon Index) and weak AO (Arctic Oscillation) could improve the supplement of this stock by increasing the biomass of phytoplankton and zooplankton (Ohshimo et al., 2009). Many factors were related to the stock status, such as climate changes, spawning season and location, and fishing activities (Nishikawa, 2018). This implied that the fishery management should not only be based on the results of models; the knowledge of environmental variables and life histories would be necessary for a credible judgment.
Japanese jack mackerel (T. japonicus) is a pelagic–neritic marine fish. It is distributed in southern Japan, Korean Peninsula, to the East China Sea (Froese and Pauly, 2019; Supplementary Figure S1). The biomass of this stock increased from the 1980s to the early 1990s and had been around 400,000 tonnes since 2005 (Yoda et al., 2019). This contribution showed that the relative biomass B/k value (Figure 1) of this stock was already declining in the early 1980s. The fishing pressure (F/FMSY) and the stock status (B/BMSY) had been both around the MSY level since 2010. This species is a salinity-sensitive species (Tashiro and Iwatsuki, 1995). Salinity and zooplankton biomass in its habitat were significantly correlated with the recruitment of this species (Zhang and Lee, 2001). The uncertainty of the stock status would be interpreted by integrating the relevant environmental factors.
Chub mackerel (S. japonicus) is a pelagic–neritic fish ranging from the southern East China Sea to the northern Sea of Japan, and also occurring in the Yellow Sea and Bohai Sea of China (Limbong et al., 1991; Yamada et al., 2007, Yasuda et al., 2014). The fishing effort of the large and medium purse seine fishery in the Tsushima Warm basin was relatively low, but increased along the Pacific Ocean coast of Japan since 2016 (Kuroda et al., 2019a). Hiyama et al. (2002) found that the increase of fishing effort targeting this species at the end of 1990s implied abundance recovery, and it may be related to the SST. The biomass of this stock required to generate the maximum sustainable yield was around 1,170,000 tonnes, higher than the current biomass (760,000 tonnes) estimated here. The gradually increased fishing intensity since 1990 reduced its biomass, and the B/BMSY ration of 0.651 in 2017 suggests that this stock was already overfished.
Blue mackerel (S. australasicus) is a pelagic–neritic fish whose adults migrate from the southern East China Sea or the Sea of Japan to the west coast of Kyushu (Kuroda et al., 2019b). The results obtained here suggested that the biomass of this stock was at a high level in the early 1990s, strongly declined around 2000, and increased again after 2010. The terminal B/BMSY (0.794) and F/FMSY (0.902) were close to the level that could produce MSY. However, the biomass level was still relatively low, and hence the stock must still be considered overfished. Sogawa et al. (2019) indicated that several factors (the location, the specific water characteristic, and copepod community) could determine the spawning process, which could be related to the low biomass level.
Japanese flying squid (T. pacificus) is a pelagic cephalopod whose recruitment rate has generally been low since 2002 (Kaga et al., 2019). The exploited stock in this contribution is a winter group, and its spawning ground is on the Pacific side of Japan. Ji et al. (2020) studied the effects of global warming on the stock recruitment, which indicated that the increased temperature would increase the survival rate of spawning cohorts in autumn and winter. Figure 1 shows that there were two periods of decline in its biomass: one was after the early 1990s, and the other was after 2010. The B/BMSY ratio close to 1 from the middle of 1990s to 2010, suggests a healthy stock status in this period. High fishing pressure might be the reason of biomass declining after 2010 and this was consistent with Kaga et al. (2019).
Red-eye round herring (E. micropus) (previously misidentified as E. teres, an Atlantic congeneric) is a pelagic–neritic fish distributed mainly in the Tsushima Warm Current basin. Figure 1 shows that its biomass had been at a very low level since the 1990s, which might result from the high fishing pressure since the early 1990s (Figure 2). After 2010, with the decrease of fishing pressure, its biomass showed a recovery trend. The ratio B/BMSY was slightly lower than the MSY level in 2017, indicating that a slight overfishing occurred for this stock.
Japanese anchovy (E. japonicus) is a pelagic–neritic fish distributed mainly in the coastal areas of Japan, Korea, and China (Iversen et al., 1993; Ohshimo, 1996). The biomass of this stock had been at a low level since the late 1990s (Figure 1), owing to a high fishing pressure (Figure 2). Its MSY was estimated at 86,000 tonnes (Table 3), larger than that for the period of 1987–2000, namely, the low-level biomass period (Wang et al., 2006: MSY = 55,000 tonnes). The relative biomass (B/BMSY = 0.443) in 2017 suggested that the stock was grossly overfished.
Yellowback sea-bream (D. hypselosomus) is a marine demersal fish species, distributed in warm water areas with a depth of 100–200 m, and ranging from Honshu in Japan to Hainan Island in Southern China (Kawauchi et al., 2019). Yoda and Yoneda (2009) presented that this species had a very large reproduction potential, which may imply its strong anti-interference ability. Its biomass had increased to an MSY level since the late 1990s due to a decrease of fishing pressure (Figure 2). Its estimated relative biomass (B/BMSY) in the final year of the time series represented a healthy status for this stock.
Japanese Spanish mackerel (S. niphonius) is a marine, pelagic–neritic fish that was mainly caught by large and medium seines in the East China Sea before the mid-1990s. Fixed net catches in the Sea of Japan had increased since 2000, accounting for more than half of Japan’s total catch of this species. Its biomass had been recovering from the low levels since 1995 (Figure 1). The series of F/FMSY (Figure 2) showed that the fishing pressure had been overall higher than required to generate MSY. Yun and Nam (2017) presented the estimation of MSY as 26,761 tonnes of South Korea. The MSY value in this study was 17,800 tonnes, which excluded part of South Korea relative biomass B/BMSY (0.56) of this stock suggested that it was in an overfished state.
Black scraper (T. modestus) is a marine, reef-associated fish whose catches by China and South Korea have been at low level since the mid-1990s. However, the long-term fluctuations of this stock render judgment difficult (Sakai et al., 2019). The results of this contribution suggested that the biomass of this stock was declining before the 1990s, and had kept at a low level since then. The fishing pressure had been above the MSY level since the mid-1980s and tended to further increase in recent years. The carrying capacity of this stock was estimated at 4,260,000 tonnes; however, the ratio B/BMSY (0.334) in 2017 indicated that it was grossly overfished.
Daggertooth pike conger (M. cinereus) is a demersal fish whose stock has been at a low level since 2000 (Figure 1), due to the high fishing pressure from 1990 to 2000 (Figure 2). The ratio B/BMSY (0.067) indicated that the stock was collapsed. The rebuilding of this stock requires the efforts of the surrounding countries that have exploited it.
Swordtip squid (U. edulis) is a demersal cephalopod whose catch exceeded 35,000 tonnes in 1988, decreased to about 10,000 tonnes after 2001, and was 7,400 tonnes in 2017 (Yoda and Takahashi, 2019). This stock presented a large part of revenue for many fishers especially in the eastern Tsushima Strait (Yoda and Takahashi, 2018). Similar with Japanese flying squid (T. pacificus), this stock seemed to benefit from warmer environment (Liao et al., 2018). The results of this study showed that the biomass of this stock had been declining since the beginning of the catch time series, and the fishing pressure increased in recent years (Figure 2). The carrying capacity k was 329,000 tonnes, and the ratio B/BMSY (0.252) in 2017 indicated that the stock was grossly overfished.
Recruitment is highly variable for most fish stocks (Maunder and Thorson, 2018), which should be integrated into the assessment process to account for the uncertainties in the spawning biomass (Ludwig and Walters, 1981). Haltuch et al. (2019) indicated that assessments including the environmental drivers would be more appropriate for species with short pre-recruit survival windows. In this study, the biomass level of South American pilchard (S. melanostictus) from BSM was significantly different from that of the FAJ report. This suggests that the CMSY and BSM method is not appropriate for stocks that are affected by environmental factors that might lead to a regime shift that have the tendency to change a stock’s population structure and thus, the evolution of its biomass.
The attempts of ecosystem-based fishery management factors have made significant progress to expand single-species stock assessments with available science and data, and good inclusion of ecosystem interactions could help to avoid the overoptimistic assessments (Marshall et al., 2018). The consequence is that the complexity of stock assessments is continuing to increase, such as much more data sources and more types of stock assessment models. The cost of this trend is the increased technical skill requirements for model selections and assessments of data sources (Dichmont et al., 2016). For some fishery stocks, the reliable information is usually insufficient, such as age and length structures and natural mortality. In contrast, time series of catch and fishing efforts are easier to be collected. Usually, these species are not the main targets of fishery industries, but they are indispensable in the trophic structure of an ecosystem. The assessment methods applied in this study just focus on these data-limited stock assessments. In general, the stock status is always overestimated at very low stock sizes because the decrease of recruitment potential is not included in these production models; the CMSY and BSM methods give the solution as stated in Eq. 4. For the management, the control rules should not be made only based on the results of assessment models, and indexes that are robust to variations in recruitment should be developed (Maunder and Thorson, 2018).
In this contribution, the CMSY and BSM were applied in the assessments for 12 fishery stocks exploited in the Tsushima Warm Current region. Most of them were exploited mainly by the fleets of three surrounding countries (Japan, South Korea, and China). Japanese jack mackerel (T. japonicus) and yellowback sea-bream (D. hypselosomus) had a healthy status, while the stock of daggertooth pike conger (M. cinereus) appeared to have collapsed. The other 9 stocks experienced different degrees of overfishing. These results underscored the need for better management of the fishery resources in this area, which requires international cooperation in the formulation and implementation of resources rebuilding in the Tsushima Warm Current area.
It is a trend to all exploited stocks assessments, including the data-limited stocks. The CMSY and BSM method performed good overall in this study and presented reliable results except the South American pilchard (S. melanostictus), which indicated that the modeling process should be prudent and experienced. The users should have technical skills and professional trains in order to give sufficient judgments on the model selections and weights of multiple data sources (Dichmont et al., 2016). The management rules need to base on multi-source datasets, not only the results from the efficient modeling, but also variables outside the stock itself. This requires the close cooperations among surrounding countries to piece the information of stocks themselves and bio- and non-bio environs together. Future research could pay attention to the inclusion of time series of variables and more explicit rules and restrictions in determining relative biomass levels.
All datasets generated for this study are included in the article/Supplementary Material.
Ethical review and approval was not required for the animal study because our manuscript was based on survey cruise data, and no live vertebrates or cephalopods were involved, thus we believe an ethical review process was not required for our study.
YCW and WX conceived and designed the study. YCW performed data collection and analysis, and wrote the first draft of the manuscript, with the insights from CL, YBW, WX, and MP. All authors contributed to the article and approved the submitted version.
This research was funded by grants for Creative Team Project of the Laboratory for Marine Ecology and Environmental Science, Qingdao National Laboratory for Marine Science and Technology (LMEES-CTSP-2018-1), National Natural Science Foundation of China (31872568 and 41976094), and Natural Science Foundation of China-Shandong Joint Fund for Marine Ecology and Environmental Sciences (U1606404).
The authors declare that the research was conducted in the absence of any commercial or financial relationships that could be construed as a potential conflict of interest.
We acknowledge Dr. Daniel Pauly from Sea Around Us, University of British Columbia, Canada, for his contribution in the stock assessment workshop held in Qingdao, China, and his valuable comments on our first draft.
The Supplementary Material for this article can be found online at: https://www.frontiersin.org/articles/10.3389/fmars.2020.00640/full#supplementary-material
Aonuma, Y., Sakai, T., and Kawauchi, Y. (2019). Stock Assessment and Evaluation for Daggertooth Pike Conger Muraenesox cinereus (fiscal year 2018) in Marine Fisheries Stock Assessment and Evaluation for Japanese waters (fiscal year 2018/2019). Kanagawa: Fisheries Agency and Fisheries Research and Education Agency of Japan, 2126–2142.
CFP (2013). Regulation (EU) No 1380/2013 of the European Parliament and of the Council of 11 December 2013 on the Common Fisheries Policy, amending Council Regulations (EC) No 1954/2003 and (EC) No 1224/2009 and repealing Council Regulations (EC) No 2371/2002 and (EC) No 639/2004 and Council Decision 2004/585/EC. Off. J. Eur. Union L 354, 22–61.
DAFF (2007). Commonwealth Fisheries Harvest Strategy: Policy and Guidelines. Australian Government, Department of Agriculture, Fisheries and Forestry. Available online at: http://www.agriculture.gov.au/SiteCollectionDocuments/fisheries/domestic/hsp.pdf (accessed December 19, 2014).
Dichmont, C. M., Deng, R. A., Punt, A. E., Brodziak, J., Chang, Y. J., Cope, J. M., et al. (2016). A review of stock assessment packages in the United States. Fish. Res. 183, 447–460. doi: 10.1016/j.fishres.2016.07.001
Froese, R., Demirel, N., Coro, G., Kleisner, K. M., and Winker, H. (2017). Estimating fisheries reference points from catch and resilience. Fish 18, 506–526. doi: 10.1111/faf.12190
Froese, R., Palomares, M. L. D., and Pauly, D. (2000). “Estimation of life-history key facts,” in FishBase 2000: Concepts, Design and Data Sources, eds R. Froese and D. Pauly (Philippines: ICLARM), 167–175.
Froese, R., Winker, H., Coro, G., Demirel, N., Tsikliras, A. C., Dimarchopoulou, D., et al. (2018). Status and rebuilding of European fisheries. Mar. Policy 93, 159–170. doi: 10.1016/j.marpol.2018.04.018
Froese, R., Zeller, D., Kleisner, K., and Pauly, D. (2012). What catch data can tell us about the status of global fisheries. Mar. Biol. 159, 1283–1292. doi: 10.1007/s00227-012-1909-6
Grant, W. S., Clark, A. M., and Bowen, B. W. (1998). Why restriction fragment length polymorphism analysis of mitochondrial DNA failed to resolve sardine (Sardinops) biogeography: insights from mitochondrial DNA cytochrome b sequences. Can. J. Fish. Aquat. Sci. 55, 2539–2547. doi: 10.1139/f98-127
Haltuch, M. A., Brooks, E. N., Brodziak, J., Devine, J. A., Johnson, K. F., Klibansky, N., et al. (2019). Unraveling the recruitment problem: a review of environmentally-informed forecasting and management strategy evaluation. Fish. Res. 217, 198–216. doi: 10.1016/j.fishres.2018.12.016
Hayashi, A., Yasuda, T., Kuroda, H., and Takahashi, M. (2019). Stock assessment and evaluation for Japanese anchovy Engraulis japonicus (fiscal year 2018) in Marine fisheries stock assessment and evaluation for Japanese waters (fiscal year 2018/2019). Kanagawa: Fisheries Agency and Fisheries Research and Education Agency of Japan, 971–1001.
Hiyama, Y., Yoda, M., and Ohshimo, S. (2002). Stock size fluctuations in chub mackerel (Scomber japonicus) in the East China Sea and the Japan/East Sea. Fish. Oceanogr. 11, 347–353. doi: 10.1046/j.1365-2419.2002.00217.x
Hutchings, J. (2000). Collapse and recovery of marine fishes. Nature 406, 882–885. doi: 10.1038/35022565
Iversen, S. A., Zhu, D., Johannessen, A., and Toresen, R. (1993). Stock size, distribution and biology of anchovy in the Yellow Sea and East China Sea. Fish. Res. 16, 147–163. doi: 10.1016/0165-7836(93)90049-d
Ji, F., Guo, X., Wang, Y., and Takayama, K. (2020). Response of the Japanese flying squid (Todarodes pacificus) in the Japan Sea to future climate warming scenarios. Clim. Change 159, 601–618. doi: 10.1007/s10584-020-02689-3
Kaga, T., Yamashita, N., Okamoto, S., and Hamatsu, Y. (2019). Stock Assessment and Evaluation for Japanese Flying Squid Todarodes pacificus (fiscal year 2018) in Marine fisheries stock assessment and evaluation for Japanese waters (fiscal year 2018/2019). Kanagawa: Fisheries Agency and Fisheries Research and Education Agency of Japan, 652–697.
Katsukawa, T. (2002). Switching fishes for non-equilibrium bioresorces. Fish. Sci. 68, 162–165. doi: 10.2331/fishsci.68.sup1_162
Kawauchi, Y., Yoda, M., and Aonuma, Y. (2019). Stock Assessment and Evaluation for Yellowback Sea-Bream Dentex hypselosomus (fiscal year 2018) in Marine fisheries stock assessment and evaluation for Japanese waters (fiscal year 2018/2019). Kanagawa: Fisheries Agency and Fisheries Research and Education Agency of Japan, 1531–1553.
Kuroda, H., Yoda, M., Hayashi, A., Takegaki, S., Sasaki, C., and Takahashi, M. (2019b). Stock Assessment and Evaluation for Blue Mackerel Scomber Australasicus (Fiscal Year 2018) in Marine Fisheries Stock Assessment and Evaluation for Japanese Waters (Fiscal Year 2018/2019). Kanagawa: Fisheries Agency and Fisheries Research and Education Agency of Japan, 279–309.
Kuroda, H., Yoda, M., Yasuda, T., Suzuki, K., Sosei, T., Sasa, C., et al. (2019a). Stock Assessment and Evaluation for Chub Mackerel Scomber Japonicus (Fiscal Year 2018) in Marine Fisheries Stock Assessment and Evaluation for Japanese Waters (Fiscal Year 2018/2019). Kanagawa: Fisheries Agency and Fisheries Research and Education Agency of Japan, 209–247.
Lee, S. G., and Rahimi Midani, A. (2014). Productivity change under the vessel buyback program in Korean fisheries. Fish. Sci. 81, 21–28. doi: 10.1007/s12562-014-0829-4
Liao, C. H., Lan, K. W., Ho, H. Y., Wang, K. Y., and Wu, Y. L. (2018). Variation in the Catch Rate and Distribution of Swordtip Squid Uroteuthis edulis Associated with Factors of the Oceanic Environment in the Southern East China Sea. Mar. Coastal Fish. 10, 452–464. doi: 10.1002/mcf2.10039
Limbong, D., Hayashi, K., and Shirakihara, K. (1991). Seasonal distribution and migration of thecommon mackerel in the southwestern Japan Sea and the East China Sea. Nippon Suisan Gakkaishi 57, 63–68. doi: 10.2331/suisan.57.63
Ludwig, D., and Walters, C. J. (1981). Measurement errors and uncertainty in parameter estimates for stock and recruitment. Can. J. Fish. Aquat. Sci. 38, 711–720. doi: 10.1139/f81-094
Makino, M. (2018). Rebuilding and full utilization of alternating pelagic species around Japan: a social-ecological approach. FAO Fish. Aquac. Tech. Pap 630, 61–73.
Marshall, K. N., Koehn, L. E., Levin, P. S., Essington, T. E., and Jensen, O. P. (2018). Inclusion of ecosystem information in US fish stock assessments suggests progress toward ecosystem-based fisheries management. ICES J. Mar. Sci. 76, 1–9. doi: 10.1093/icesjms/fsy152
Martell, S., and Froese, R. (2013). A simple method for estimating MSY from catch and resilience. Fish Fish. 14, 504–514. doi: 10.1111/j.1467-2979.2012.00485.x
Maunder, M. N., and Thorson, J. T. (2018). Modeling temporal variation in recruitment in fisheries stock assessment: a review of theory and practice. Fish. Res. 217, 71–86. doi: 10.1016/j.fishres.2018.12.014
MFNZ (2008). Harvest Strategy Standard for New Zealand Fisheries. Wellington: Ministry of Fisheries.
Millar, R. B., and Meyer, R. (1999). “Nonlinear State-space Modeling of Fisheries Biomass Dynamics using Metropolis-Hastings within Gibbs Sampling,” in Technical Report STAT9901, (Auckland: University of Auckland), 33.
Motomitsu, T., and Yoda, M. (2019). Stock Assessment and Evaluation for Japanese Spanish Mackerel Scomberomorus niphonius (fiscal year 2018) in Marine fisheries stock assessment and evaluation for Japanese waters (fiscal year 2018/2019). Kanagawa: Fisheries Agency and Fisheries Research and Education Agency of Japan, 1708–1723.
MSA (2007). Magnuson-Stevens Fishery Conservation and Management Act, Public Law 94–265. As amended by the Magnuson-Stevens Fishery Conservation and Management Reauthorization Act (P.L. 109-479). Available online at: http://www.nmfs.noaa.gov/msa2005/docs/MSA_amended_msa%20_20070112_FINAL.pdf (accessed December 19, 2014).
Musick, J. A. (1999). Criteria to define extinction risk in marine fishes. Fish 24, 6–14. doi: 10.1577/1548-8446(1999)024<0006:ctderi>2.0.co;2
Nishikawa, H. (2018). Relationship between recruitment of Japanese sardine (Sardinops melanostictus) and environment of larval habitat in the low-stock period (1995-2010). Fish. Oceanogr. 28, 131–142. doi: 10.1111/fog.12397
Nishikawa, H., Yasuda, I., Komatsu, K., Sasaki, H., Sasai, Y., Setou, T., et al. (2013). Winter mixed layer depth and spring bloom along the Kuroshio front: implications for the Japanese sardine stock. Mar. Ecol. 487, 217–229. doi: 10.3354/meps10201
Ohshimo, S. (1996). Acoustic estimation of biomass and school character of the Japanese anchovy Engraulis japonicus in the East China Sea and the Yellow Sea. Fish. Sci. 62, 344–349. doi: 10.2331/fishsci.62.344
Ohshimo, S., Tanaka, H., and Hiyama, Y. (2009). Long-term stock assessment and growth changes of the Japanese sardine (Sardinops melanostictus) in the Sea of Japan and East China Sea from 1953 to 2006. Fish. Oceanogr. 18, 346–358. doi: 10.1111/j.1365-2419.2009.00516.x
Palomares, M. L. D., Froese, R., Derrick, B., Nöel, S.-L., Tsui, G., Woroniak, J., et al. (2018). “A preliminary global assessment of the status of exploited marine fish and invertebrate populations,” in A Report Prepared by the Sea Around US for OCEANA, (Vancouver: The University of British Columbia), 64.
Plummer, M. (2003). “JAGS: a program for analysis of Bayesian graphical models using Gibbs sampling,” in Proceedings of the 3rd International Workshop on Distributed Statistical Computing (DSC 2003) March 20-22, Vienna, 2003, eds K. Hornik, F. Leisch, and A. Zeileis (Vienna: Vienna Technical University), 20–22.
R Core Team (2013). R: A Language and Environment for Statistical Computing. Vienna: R Foundation for Statistical Computing.
Sakai, T., Kawauchi, Y., and Aonuma, Y. (2019). Stock Assessment and Evaluation for Black Scraper Thamnaconus modestus (fiscal year 2018) in Marine Fisheries Stock Assessment and Evaluation for Japanese waters (fiscal year 2018/2019). Kanagawa: Fisheries Agency and Fisheries Research and Education Agency of Japan, 2047–2061.
Schaefer, M. B. (1954). Some aspects of the dynamics of populations important to the management of the commercial marine fisheries. Inter Am. Trop. Tuna Comm. Bull. 1, 23–56.
Schaefer, M. B. (1957). A study of the dynamics of the fishery for yellowfin tuna in the eastern tropical Pacific Ocean. Inter Am. Trop. Tuna Comm. Bull. 2, 243–285.
Sogawa, S., Hidaka, K., Kamimura, Y., Takahashi, M., Saito, H., Okazaki, Y., et al. (2019). Environmental characteristics of spawning and nursery grounds of Japanese sardine and mackerels in the Kuroshio and Kuroshio Extension area. Fish. Oceanogr. 28, 454–467. doi: 10.1111/fog.12423
Suzuki, K., Yasuda, T., Kuroda, H., and Takahashi, M. (2019). Stock Assessment and Evaluation for Red-Eye Round Herring Etrumeus micropus (fiscal year 2018) in Marine fisheries stock assessment and evaluation for Japanese waters (fiscal year 2018/2019). Kanagawa: Fisheries Agency and Fisheries Research and Education Agency of Japan, 805–832.
Takasuka, A., Oozeki, Y., and Aoki, I. (2007). Optimal growth temperature hypothesis: why do anchovy flourish and sardine collapse or vice versa under the same ocean regime? Can. J. Fish. Aquat. Sci. 64, 768–776. doi: 10.1139/f07-052
Tashiro, K., and Iwatsuki, I. (1995). Growth and feeding habits in reared Japanese centropomid fish Lates japonicus. Nippon Suisan Gakk. 61, 684–688. doi: 10.2331/suisan.61.684
Wang, Y., Liu, Q., and Ye, Z. (2006). A Bayesian analysis on the anchovy stock (Engraulis japonicus) in the Yellow Sea. Fish. Res. 82, 87–94. doi: 10.1016/j.fishres.2006.08.007
Yamada, U., Horikawa, H., Nakabo, T., and Tokimura, M. (2007). Scomber japonicus. Fish of the East China Sea and Yellow Sea. Kanagawa: Tokai University Press, 972–979.
Yasuda, T., Kuroda, H., Hayashi, A., Yoda, M., Suzuki, K., and Takahashi, M. (2019). Stock Assessment and Evaluation for South American Pilchard Sardinops melanostictus (fiscal year 2018) in Marine fisheries Stock Assessment and Evaluation for Japanese waters (fiscal year 2018/2019). Kanagawa: Fisheries Agency and Fisheries Research and Education Agency of Japan, 57–95.
Yasuda, T., Yukami, R., and Ohshimo, S. (2014). Fishing ground hotspots reveal long-term variation in chub mackerel Scomber japonicus habitat in the East China Sea. Mar. Ecol. Prog. Ser. 501, 239–250. doi: 10.3354/meps10679
Yatsu, A. (2019). Review of population dynamics and management of small pelagic fishes around the Japanese Archipelago. Fish. Sci. 85, 611–639. doi: 10.1007/s12562-019-01305-3
Yoda, M., Kuroda, H., Sasaki, C., and Takahashi, M. (2019). Stock Assessment and Evaluation for Japanese Jack Mackerel Trachurus japonicus (fiscal year 2018) in Marine fisheries Stock Assessment and Evaluation for Japanese waters (fiscal year 2018/2019). Kanagawa: Fisheries Agency and Fisheries Research and Education Agency of Japan, 131–162.
Yoda, M., and Takahashi, M. (2018). Stock Assessment and Evaluation for Swordtip Squid Uroteuthis edulis (Fiscal Year 2017) in Marine Fisheries Stock Assessment and Evaluation for Japanese Waters (Fiscal Year 2017/2018). Kanagawa: Fisheries Agency and Fisheries Research and Education Agency of Japan, 2110–2125.
Yoda, M., and Takahashi, M. (2019). Stock Assessment and Evaluation for Swordtip Squid Uroteuthis edulis (Fiscal Year 2018) in Marine Fisheries Stock Assessment and Evaluation for Japanese Waters (Fiscal Year 2018/2019), Kanagawa: Fisheries Agency and Fisheries Research and Education Agency of Japan. 2218–2233.
Yoda, M., and Yoneda, M. (2009). Assessment of reproductive potential in multiple-spawning fish with indeterminate fecundity: a case study of yellow sea bream Dentex hypselosomusin the East China Sea. J. Fish Biol. 74, 2338–2354. doi: 10.1111/j.1095-8649.2009.02246.x
Yun, S. D., and Nam, J. (2017). Application of a bioeconomic model to Spanish mackerel in the seas of Korea. Fish. Sci. 83, 1061–1076. doi: 10.1007/s12562-017-1131-z
Keywords: CMSY, BSM, fishery status, reference points, stock assessments
Citation: Wang Y, Liang C, Wang Y, Xian W and Palomares ML (2020) Stock Status Assessments for 12 Exploited Fishery Species in the Tsushima Warm Current Region, Southwest Japan and East China, Using the CMSY and BSM Methods. Front. Mar. Sci. 7:640. doi: 10.3389/fmars.2020.00640
Received: 04 February 2020; Accepted: 13 July 2020;
Published: 21 August 2020.
Edited by:
Violin Stoyanov Raykov, Institute of Oceanology (BAS), BulgariaReviewed by:
Gorka Merino, Technology Center Expert in Marine and Food Innovation (AZTI), SpainCopyright © 2020 Wang, Liang, Wang, Xian and Palomares. This is an open-access article distributed under the terms of the Creative Commons Attribution License (CC BY). The use, distribution or reproduction in other forums is permitted, provided the original author(s) and the copyright owner(s) are credited and that the original publication in this journal is cited, in accordance with accepted academic practice. No use, distribution or reproduction is permitted which does not comply with these terms.
*Correspondence: Cui Liang, bGlhbmdjQHFkaW8uYWMuY24=; Y3VpLWxpYW5nQGhvdG1haWwuY29t; Weiwei Xian, d3d4aWFuQHFkaW8uYWMuY24=
Disclaimer: All claims expressed in this article are solely those of the authors and do not necessarily represent those of their affiliated organizations, or those of the publisher, the editors and the reviewers. Any product that may be evaluated in this article or claim that may be made by its manufacturer is not guaranteed or endorsed by the publisher.
Research integrity at Frontiers
Learn more about the work of our research integrity team to safeguard the quality of each article we publish.