 Luisa Listmann
 Giannina S. I. Hattich3,4†
 Birte Matthiessen
 Thorsten B. H. Reusch
94% of researchers rate our articles as excellent or good
Learn more about the work of our research integrity team to safeguard the quality of each article we publish.
Find out more
ORIGINAL RESEARCH article
Front. Mar. Sci., 31 July 2020
Sec. Marine Ecosystem Ecology
Volume 7 - 2020 | https://doi.org/10.3389/fmars.2020.00634
This article is part of the Research TopicPhytoplankton Dynamics Under Climate ChangeView all 7 articles
How ecological and evolutionary processes interact and together determine species and community responses to climate change is poorly understood. We studied long-term dynamics (over approximately 200 asexual generations) in two phytoplankton species, a coccolithophore (Emiliania huxleyi), and a diatom (Chaetoceros affinis), to increased CO2 growing alone, or competing with one another in co-occurrence. To allow for rapid evolutionary responses, the experiment started with a standing genetic variation of nine genotypes in each of the species. Under co-occurrence of both species, we observed a dominance shift from C. affinis to E. huxleyi after about 120 generations in both CO2 treatments, but more pronounced under high CO2. Associated with this shift, we only found weak adaptation to high CO2 in the diatom and none in the coccolithophore in terms of species’ growth rates. In addition, no adaptation to interspecific competition could be observed by comparing the single to the two-species treatments in reciprocal assays, regardless of the CO2 treatment. Nevertheless, highly reproducible genotype sorting left only one genotype remaining for each of the species among all treatments. This strong evolutionary selection coincided with the dominance shift from C. affinis to E. huxleyi. Since all other conditions were kept constant over time, the most parsimonious explanation for the dominance shift is that the strong evolutionary selection was driven by the experimental nutrient conditions, and in turn potentially altered competitive ability of the two species. Thus, observed changes in the simplest possible two-species phytoplankton “community” demonstrated that eco-evolutionary interactions can be critical for predicting community responses to climate change in rapidly dividing organisms such as phytoplankton.
Recent studies have repeatedly shown that ecological and evolutionary processes happen on similar time scales (Carroll et al., 2007; Reznick, 2013). Understanding how both processes interact has sparked the emergence of the new field of eco-evolutionary dynamics (Fussmann et al., 2007) aiming to understand how rapid evolutionary adaptation influences ecological processes, and vice versa (Hendry, 2016). Strong ecoevolutionary coupling is particularly expected in phytoplankton species, photoautotrophic aquatic microbes that are abundant in freshwater and marine ecosystems. With one cell division per day, many species lend themselves for experimental studies allowing for appropriate replication and hundreds of generations of evolutionary change (Reusch and Boyd, 2013). Moreover, their ecological importance cannot be overemphasized, as marine phytoplankton species are responsible for half of all global photosynthesis (Falkowski et al., 2008).
Here we studied eco-evolutionary dynamics in response to increased seawater CO2 concentration, one prominent aspect of ocean global change (Doney et al., 2009). As primary producers, all phytoplankton species depend on the availability of inorganic carbon. On time scales too short for evolutionary adaptation, non-calcifying species mostly respond by enhanced growth (Schaum et al., 2012; Li et al., 2017) leading to higher abundances (Sommer et al., 2015; “ecological winners,” e.g., diatoms), while most calcifying species react negatively (“ecological losers,” e.g., coccolithophores) to CO2 enrichment (Riebesell, 2004; Doney et al., 2009). Nested within such broad functional categories of sensitivity is pronounced intraspecific variation (Schaum et al., 2012; Hattich et al., 2017; Des Roches et al., 2018), on which selection can operate (Lohbeck et al., 2012).
Within phytoplankton, competition for abiotic resources is ubiquitous (Tilman, 1977). In recent theoretical studies (de Mazancourt et al., 2008; Lancaster et al., 2017) and a long term bacterial community experiment (Lawrence et al., 2012), competition was shown to constitute one major biotic driver of adaptation. At the same time experimental evolution studies using phytoplankton and addressing the presence and absence of competition as a selection factor are largely absent (Scheinin et al., 2015).
Here, we set out to study how the evolutionary response to increased CO2 of two bloom forming and geographically co-occurring phytoplankton species, Emiliania huxleyi (a coccolithophore) and Chaetoceros affinis (a diatom), was altered by competition and assessed putative effects on ecological dynamics. Studying such eco-evolutionary processes requires that at least two species can be kept over long-term (i.e., more than 10 s of generations such that evolutionary change can happen) in co-occurring experimental settings, delaying, or preventing Gause’s principle of competitive exclusion (Hardin, 1960; Tilman, 1977). Hence, we established long-term coexistence in semi-continuous batch cycles by taking advantage of the species’ different nutrient uptake related strategies (Sommer, 1984; Riebesell, 2004; Doney et al., 2009). Diatoms have high nutrient uptake rates and are consequently characterized by high maximum growth rates (Litchman et al., 2007). At the same time, diatoms have high half saturation constants and low affinity for nutrient uptake (Litchman et al., 2007). As such they represent the “velocity-adapted” species (Sommer, 1984) and thrive in nutrient replete and fluctuating conditions, being able to rapidly monopolize nutrients. Coccolithophores in contrast, have lower maximum nutrient uptake rates. Hence, after a nutrient pulse they initially lose out against diatoms. Their lower half-saturation constants and higher affinity, however, make them the better competitors under nutrient poor conditions thriving at later successional stages (Sommer, 1984). In this system, we ran the experiment for ca. 200 asexual generations under fully factorial selection conditions of adaptation to ambient and increased CO2, in combination with and without competition, i.e., the co-occurrence of the respective other species (Figure 1A). To allow for rapid evolutionary adaptation via genotype sorting (Lohbeck et al., 2012), populations of both species were assembled using nine genotypes in equal frequencies (Figure 1A) that could be traced via microsatellite genotyping. Reciprocal adaptation assays were conducted to test for adaptation of both species to enhanced CO2 and the presence of the respective other species in the first and second half of the experiment (after ca. 50 and 200 generations; Figure 1B).
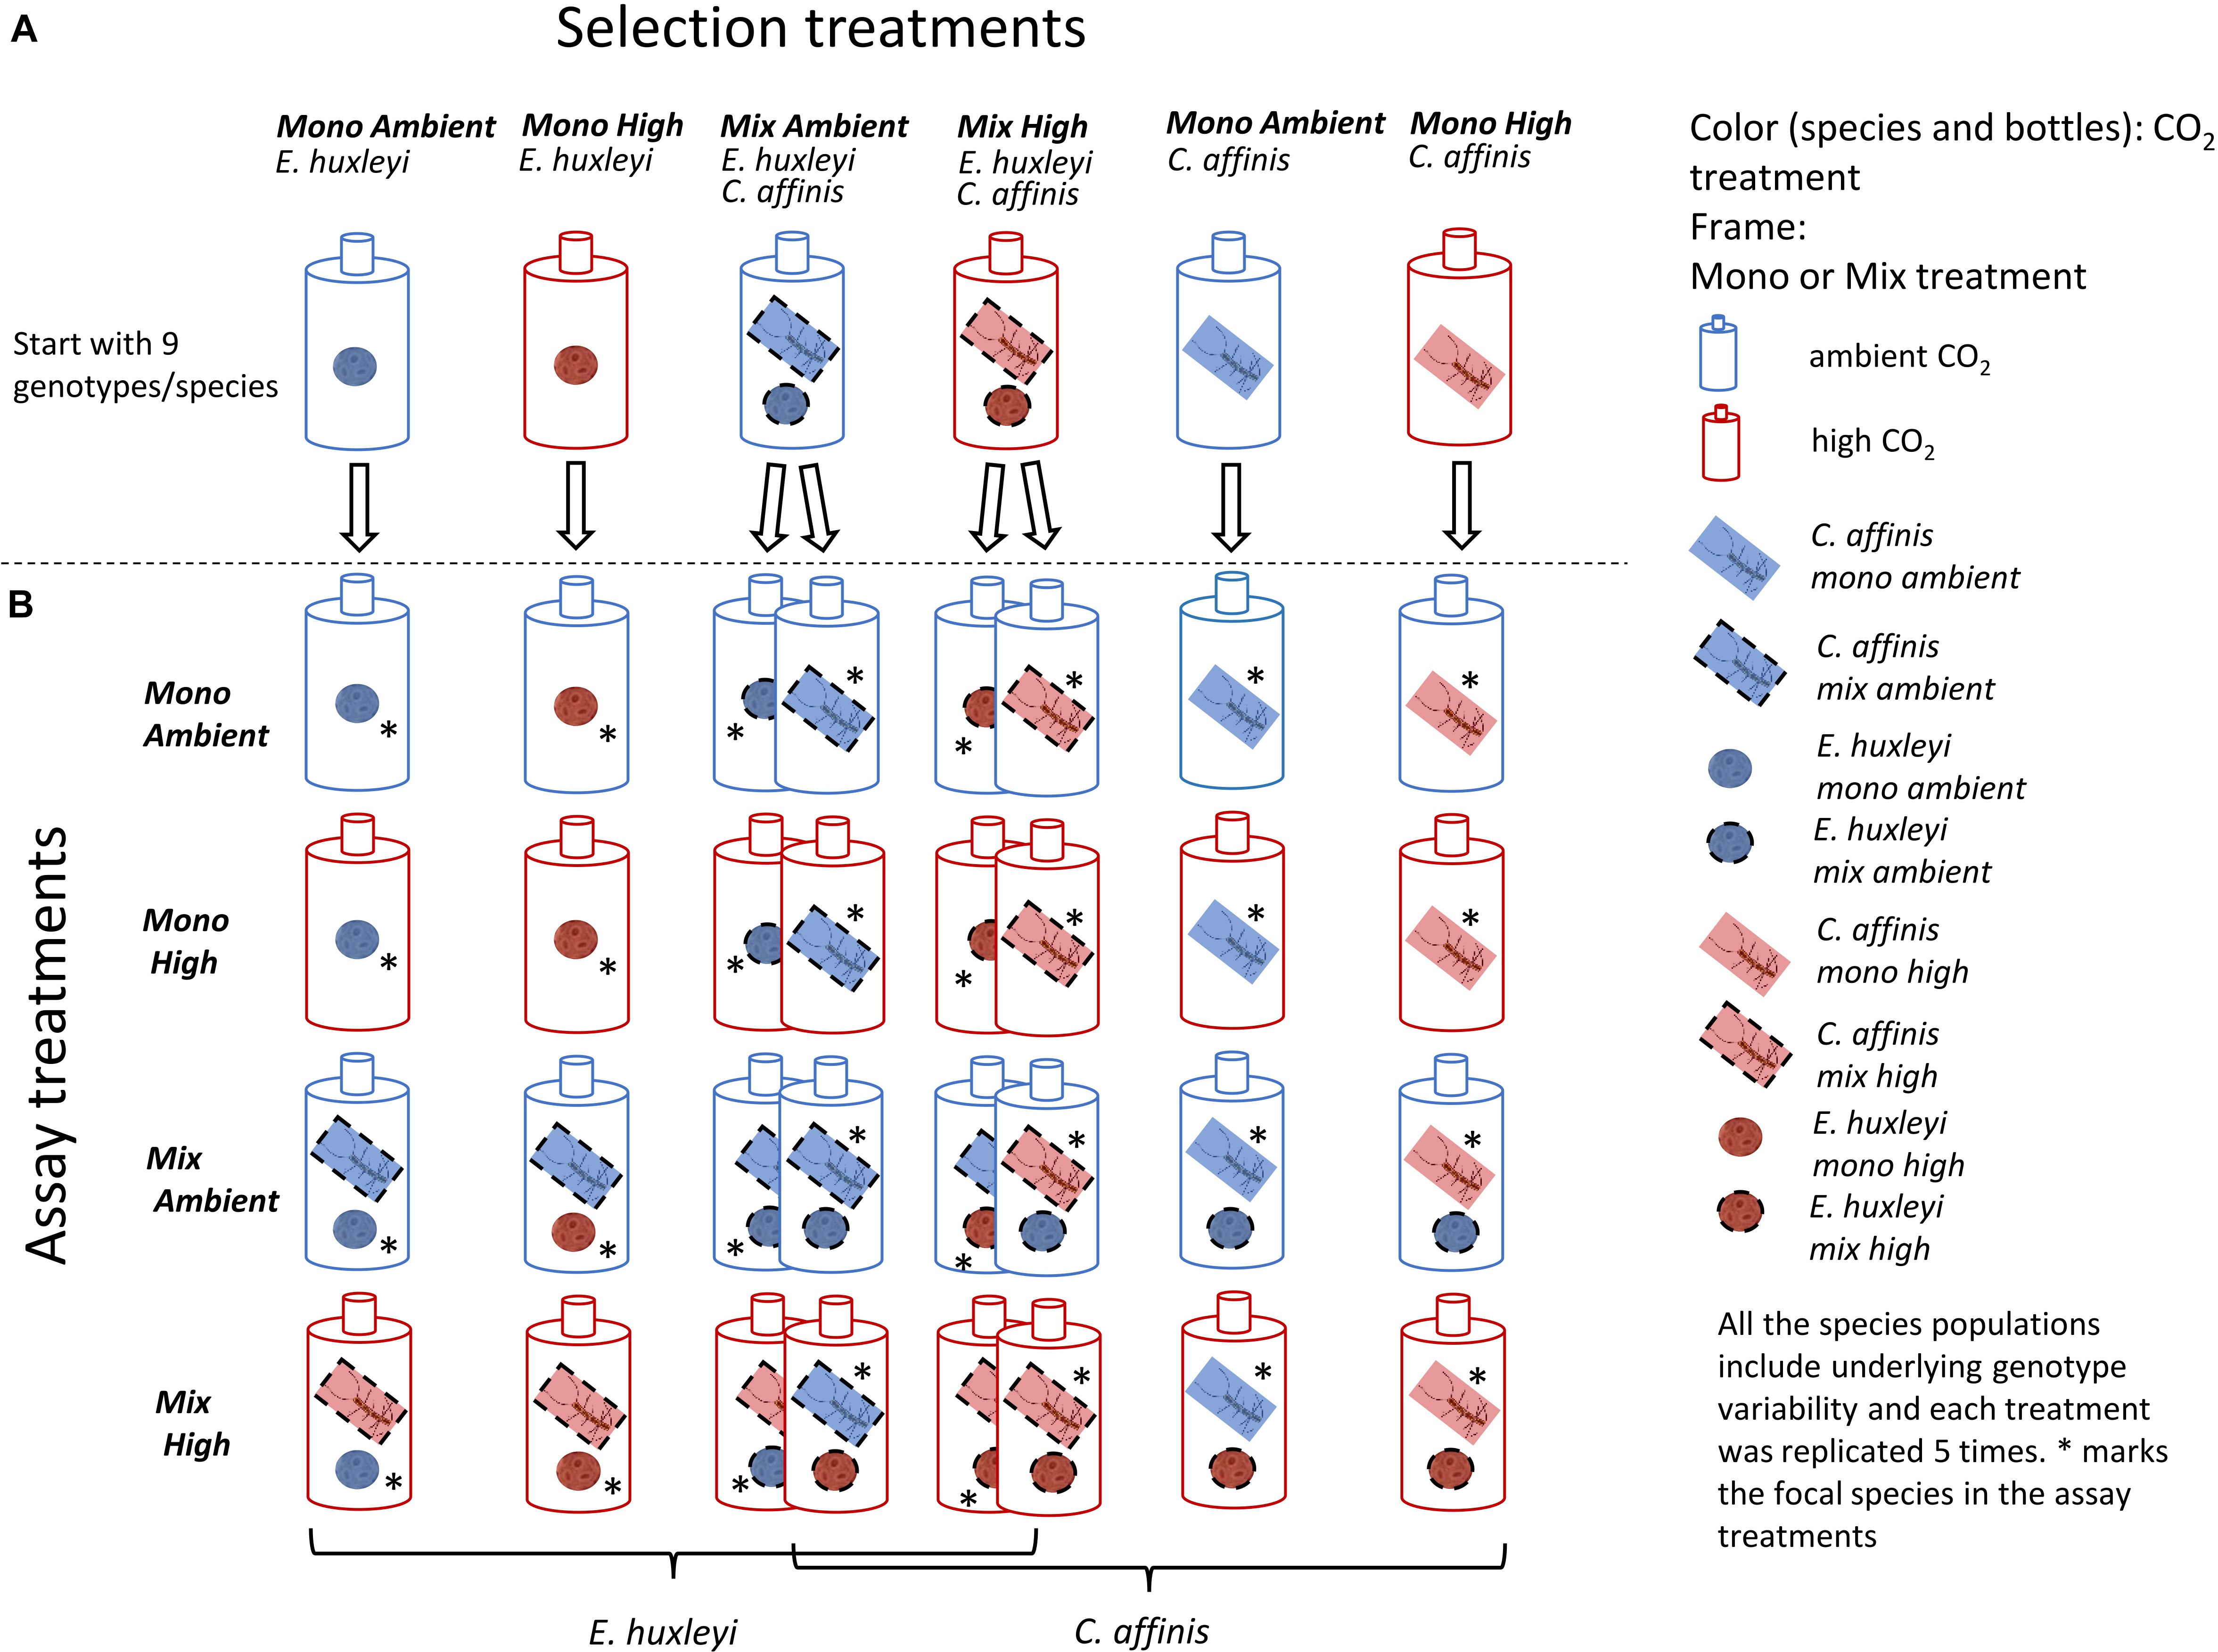
Figure 1. Set up of Selection and Assay experiments: Here the schematic setup of the selection phase of the experiment is depicted in the top row (A). The colors show the CO2 treatments, whereas the frames of the species show mono or mix treatment. All species populations were started with 9 genotypes each. Each treatment consisted of 5 replicates. In the reciprocal assays, all cultures of both species were exposed to all possible treatments (four rows below) thus resulting in a fully crossed assay set-up (B). The 16 resulting assay treatments are shown for each species. The star shows which of the species was the focal species in the mix assay treatments.
We hypothesize that on the short term, species contribution to the “community” would be diverging between CO2 treatments due to varying CO2 responses of the target species. Specifically, the relative contribution of E. huxleyi should be lower in the high CO2 compared to the ambient treatment due to potential negative or neutral effects of CO2. In contrast, the relative contribution of C. affinis should be higher in high CO2 treatment due to a potential fertilizing effect of increased CO2 in combination with the effect of CO2 on E. huxleyi. In the long-term, we hypothesize that evolutionary dynamics (i.e., genotype sorting and eventually adaptation) diverge between both target species. Specifically, the potentially negatively affected coccolithophore should be selected toward more stress tolerance, while the possible fertilizing effect on the diatom could lead to selection for the diatom’s potential to efficiently utilize increased levels of CO2 and in turn achieve higher growth rates. Moreover, any evolutionary change can feed back onto ecological processes by altering the abundance and thus contribution of the species to the community over a longer time (i.e., 50–200 generations). Overall, we hypothesize that the presence of the competitor can alter any evolutionary (genotype sorting to adaptive) response. For example, for E. huxleyi, the presence of the diatom assimilating CO2 could alleviate CO2 stress, and thus reduce selection toward tolerance, slowing down its adaptation in co-culture.
We exposed two important phytoplankton species; the coccolithophore E. huxleyi and the diatom C. affinis to increased CO2 (ambient, high) either alone or in co-culture (mono, mix) with the respective other species over 288 days (=36 batch cycles of 8 days), representing approximately 200 asexual generations. We followed absolute species biovolume at the end of each batch cycle over time to understand how the species respond to the different treatments. Each species started as a mixture of nine different genotypes to allow for rapid adaptation via genotype selection. All genotypes used were isolates originating from one geographical region (Gran Canary, 27°59’N 15°22’W, isolated 2012 and 2015) and are deposited in the culture collection in Roscoff (Table 1). In previous studies we have shown that the genotypes differed in growth, and to some extent in their response to CO2 (Hattich et al., 2017) indicating ecological variability and as such standing genetic variation. After 64 days (ca. 50 generations) and 288 days (ca. 200 generations), we conducted reciprocal adaptation experiments to test for adaptation to CO2 with and without competition. Ideally, to fully disentangle selection to inter- and intraspecific competition and the intended abiotic treatment single genotype cultures under both CO2 conditions would be required. However, this was technically not feasible for the phytoplankton species in this study as it would have required to handle another 180 bottle’s each batch cycle.
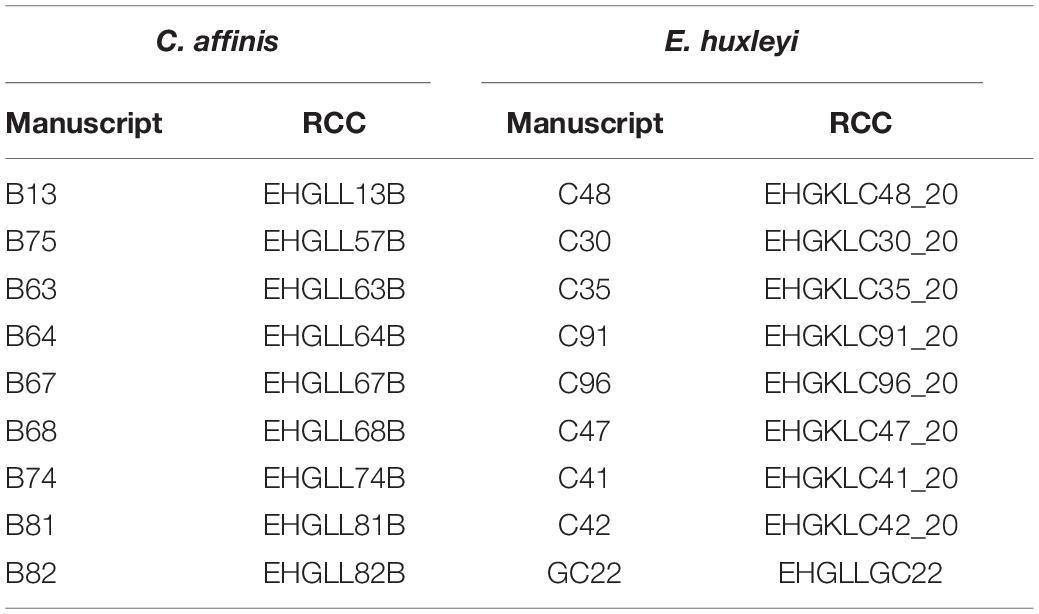
Table 1. All genotypes used are listed in the column “manuscript” under the name used in here and are deposited in the Roscoff Culture Collection (RCC) under the name shown in the “RCC” column.
The selection treatments were set-up in a fully orthogonal way with the single factors CO2 (two levels, ambient and high) and co-occurrence or absence of a 2nd species (Mono and Mix) resulting in 4 treatment combinations per species (Figure 1A). Five replicate cultures of each of the four treatment combinations were kept for 9 months (36 batch cycles, resulting in 210–230 generations in E. huxleyi and 195–210 generations in C. affinis) in semi-continuous batch cultures. However, after ca. 28–30 batch cycles one replicate culture per treatment combination was lost in E. huxleyi and one in 3 out of 4 treatment combinations in C. affinis. The ambient and high CO2-treatments were manipulated by aerating the artificial-seawater [35 PSU salinity; after (Kester et al., 1967)] for 24 h with ambient or CO2-enriched air (400 and 1250 ppm, respectively) prior to two batch cycles. The dissolved inorganic carbon (Hansen et al., 2013) varied between 2052.39 ± 34.49 and 2202 ± 8.19 μmol × kg–1 with a total alkalinity [following (Matthiessen et al., 2012)] of 2272.56 ± 11.24 and 2273.12 ± 11.43 μmol × kg–1 for ambient and high CO2, respectively. Nutrients were added to the final concentrations of 19.61 ± 0.09 μmol × L–1 nitrate, 0.99 ± 0.02 μmol × L–1 phosphate, and 4.34 ± 0.14 μmol × L–1 silicate. We chose these comparably (to other long-term selection experiments) low nutrient concentrations to mirror natural conditions in the ocean. In addition, to simulate a bloom situation with resource competition under depleted nutrients (Paulton, 1991), we ran the study as semi-continuous batch cultures with both species reaching the stationary phase (Supplementary Figure S1 growth graphs of the different species; Supplementary Figure S2). Here the natural nutrient concentrations allowed this in a feasible time frame of 8 days per batch cycle. At the onset of the experiment each experimental unit (500 mL Nalgene® bottle) was inoculated with an initial total biovolume of 8280 μm3 × mL–1 of non-axenic, exponentially growing cultures, resulting in an inoculation of the communities with both species (mix-culture) in a 1:1 ratio of E. huxleyi and C. affinis (4140 μm3 × mL–1 each). Genotypes in each species were assembled in equal abundance for the nine genotypes of each species. For every following batch cycle 8280 μm3 × mL–1 of each replicate was transferred into replete media (prepared as described above). In order to calculate the contribution of each species to the total biovolume/mL and the amount needed to transfer to the next batch cycle, cell numbers, and cell volume (after Hillebrand et al., 2002) were determined using microscopy (Zeiss Axiovert Observer) at the end of each batch cycle. The experiment was carried out under constant rotation (0.75 min–1) at ∼22°C and a 17:7 day:night cycle reaching a maximum light intensity of 350 μmol × m–2 × s–1 3 h after dusk and dawn.
In order to follow genotype frequencies, we re-isolated cells of both species after 8, 32, 64, 160, and 288 days. Genotypes of both species could be unambiguously identified via microsatellite genotyping [see (Hattich et al., 2017), for detailed information on E. huxleyi and for C. affinis genotype identification see Supplementary Material]. For the quantification of E. huxleyi and C. affinis genotypes a maximum of 20 cells per culture were re-isolated by dilution in 48 well plates. This provided a theoretical detection limit of 5% difference between the contributions of the genotypes to both species’ populations. A lower detection limit could in theory have been achieved via isolation and identification of more cells but was not the goal of this study. Details on the reisolation and quantification via microsatellite analysis are given in Supplementary Material. For the genotype composition of C. affinis we only had enough data for analysis two time points in the mixed cultures.
We carried out reciprocal adaptation assays to test for adaptation in both species to enhanced CO2, the competition of the respective other species, and both factors in combination (Figure 1B). The assays on day 64 and 288 assessed how adaptation played out over time. Those adaptation assays compared evolved populations in control and new environments rather than evolved and ancestral populations because methods such as cryopreservation are not readily available for our target study species (Collins, 2011b). Specifically, every evolved culture was tested in all four treatment combinations in a full factorial way. For example, E. huxleyi that were long-term treated with high CO2 conditions (treatment combination Mono High), were in the assay exposed to both ambient and high CO2 concentrations and then also to the co-occurring diatom (already long-term exposed to ambient and high CO2 and competition to avoid confounding responses) in ambient and high CO2 concentrations. Thus, each treatment combination from the selection leads to 4 assay treatment combinations. This resulted in a total of 16 assay treatment combinations per species (Figure 1B; for the details of the reciprocal assay set up see Supplementary Material). Using a full factorial adaptation assay allowed us to test on the one hand for the adaptation of the single factor CO2 [i.e., in the statistical analysis, this could be identified as significant interactions of the respective selection and assay treatment factors (e.g., selection CO2 x assay CO2)]. On the other hand, we were able to additionally test for the adaption to increased CO2 in combination with competition, but then also how competition itself affected adaptive responses. This allowed disentangling the single and combined treatment factors at the same time. Here we focused on growth rates because this response is directly related to Darwinian fitness in an asexual population (Elena and Lenski, 2003) and is independent of nutrient availability due to the presence of another species (Tilman, 1977). The cultures for the assay treatments were inoculated in the same way as the long-term experiment, i.e., with a biovolume of 8280 μm3 × mL–1 (see Supplementary Material for details) in 500 ml Nalgene® bottles. After one batch cycle of acclimation to assay treatments the assay responses were measured. We took daily samples for microscopy to determine growth rates over the course of the assay batch cycle. The growth rates (μ) were determined using a linear-fit approach of the “growthrates” (Petzoldt, 2016) package on log transformed cell count data.
In all treatments with co-occurring species, the relative species contribution of E. huxleyi to total biovolume (Mix) over time was analyzed using a generalized least squares (GLS) model [m0 < -gls (relative Biovolume ∼ Selection CO2 × Time)]. Differences in variance structure were adjusted for the factor “Selection CO2,” and accounted for autocorrelation over time. For the statistical analysis, we only considered the relative contribution of one of the two species, as their respective contribution to the community was complementary. For the analysis of the absolute biovolume of each species in all cultures we used the same GLS model. The analysis was done for each species separately and started with the following full model: m0 < -gls (Biovolume ∼ Selection CO2 × Selection Culture × Time). After reduction and analysis of the model structure we accounted for autocorrelation over time and differences in variance structure (varIDENT) for the “Selection Culture” in E. huxleyi and “Selection CO2” and “Selection Culture” in C. affinis. There was a strong change around 160 days of experiment and we found significant interactions with “Time” for all factors in the GLS model. In order to investigate the effects of the different treatments on both species before and after this time point, we divided the time series data into two parts – BC1-BC20 or BC21-BC36 on which we repeated the described GLS model [BC1-20 or BC21-36, respectively, <-gls (Biovolume∼Selection CO2 × Selection Culture)]. A permutational multivariate analysis of variance [permanova, with 999 permutations (using the package “vegan”)] was used to test for the differences in genotype compositional change between the treatments.
To analyze the reciprocal assay data we used repeated measure analysis of variance (rmANOVA). Since during the experiment, 4 and 3 cultures were lost, we had to omit the data of the “lost” replicates from all statistical analyses of the assays. Before starting the analyses we tested for the homogeneity of variance using a Fligner Killeen Test (Fligner and Killeen, 1976) and for the normality of the residuals using a Shapiro–Wilk Normality Test (Shapiro and Wilk, 1965). The assumption of sphericity was not violated because we only had one repeated measure (Field, 2018). All assumptions were met such that we could continue with the analysis without data transformation. The growth rate was first assessed for the overall effects of “Time” (between the two assays), “CO2” and “Culture” in both selection and assay environment and thus we started with a complete data set analysis [aov((muExp)∼(Selection CO2 × Selection Culture × Assay CO2 × Assay Culture × Time) + Error(Replicate/Time))] followed by a separate analysis of each assay. Here, interactions of selection treatment × assay treatment would indicate evolutionary adaptation over the course of the experiment.
All modeling and statistical analyses were done using the software R (R Core Team, 2016). The following packages were used for the analyses, plotting, and modeling: “ggplot2,” “deSolve,” “vegan,” and “ez” (Oksanen et al., 2007; Wickham, 2009; Soetaert et al., 2010; Lawrence, 2016).
The outcome of interspecific competition in ambient and high CO2 was mirrored in relative biovolume shifts: In the first half of the experiment the diatom dominated the two-species community with a relative biovolume (mean over first 20 batch cycles) of ca. 95 ± 7% (mean ± SD) in high compared to ambient CO2 condition with 80 ± 13% (mean ± SD; Figure 2; and Supplementary Table S4 BC1-20 “Selection CO2” F1,186 = 164.039, p < 0.0001). From ca. 160 days onward there was not only a dominance reversal from C. affinis to E. huxleyi (Figure 2 and Supplementary Table S4 Full Model “Time” F1,337 = 613.093, p < 0.0001,“Selection CO2 × Time” F1,337 = 26.036, and p < 0.0001), but also a different reaction of both species to CO2, with E. huxleyi being favored by high CO2 in the second phase of the experiment. The reversal of dominance was reflected in decreased final relative contribution of C. affinis of 43 ± 24% and 37 ± 26% in ambient and high CO2 conditions, respectively, without a statistically significant difference between the CO2 treatments (Figure 2, and Supplementary Table S4 BC21-36 “Selection CO2” F1,142 = 3.266, and p = 0.072).
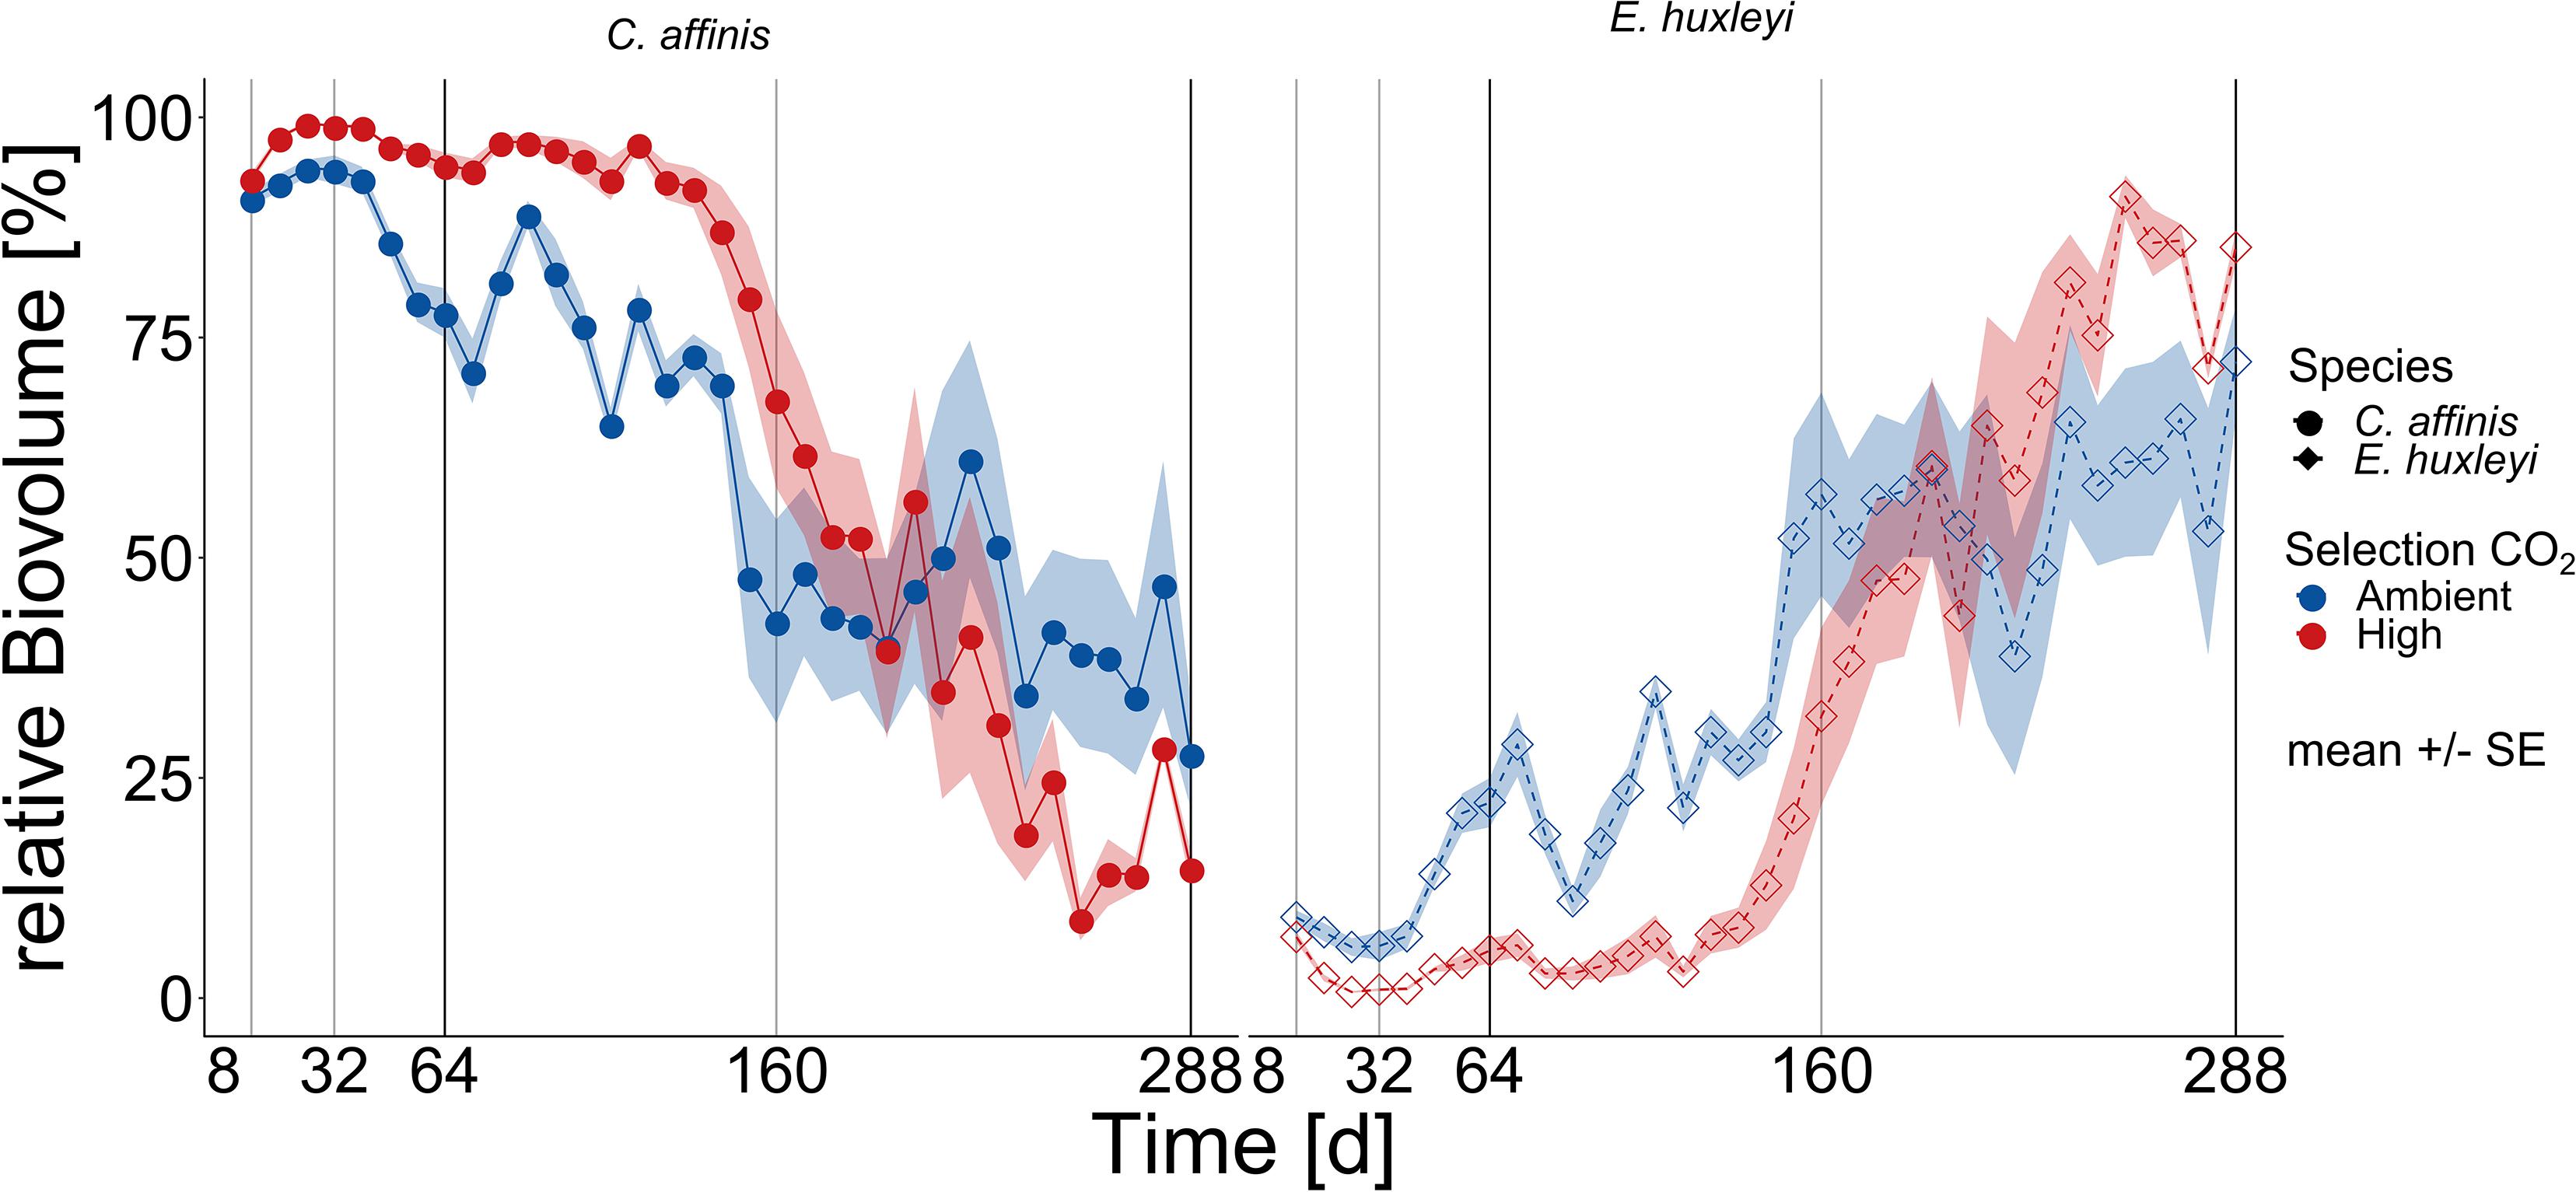
Figure 2. Community biovolume composition over time. The relative contribution based on biovolume of E. huxleyi and C. affinis (right and left panel, respectively) measured at the end of each batch cycle over 36 batch cycles in the mix cultures (i.e., co-occurrence of both species) in ambient and high CO2 is shown here (mean ± SE; n = 5 for days 1–200, and n = 4 for days 200–288 per time point). The light and dark gray lines show the time points where samples were taken for genotype reisolation. The dark gray lines show when the cultures were additionally tested for adaptation in the reciprocal assay.
Similar to the dynamics of relative species contributions, the time course of absolute biovolume of both species was characterized by two distinct phases that changed around 160 days of the experiment (Figures 3A–D and Supplementary Table S5 E. huxleyi and C. affinis single and interactive effects of “Time” in Full model).
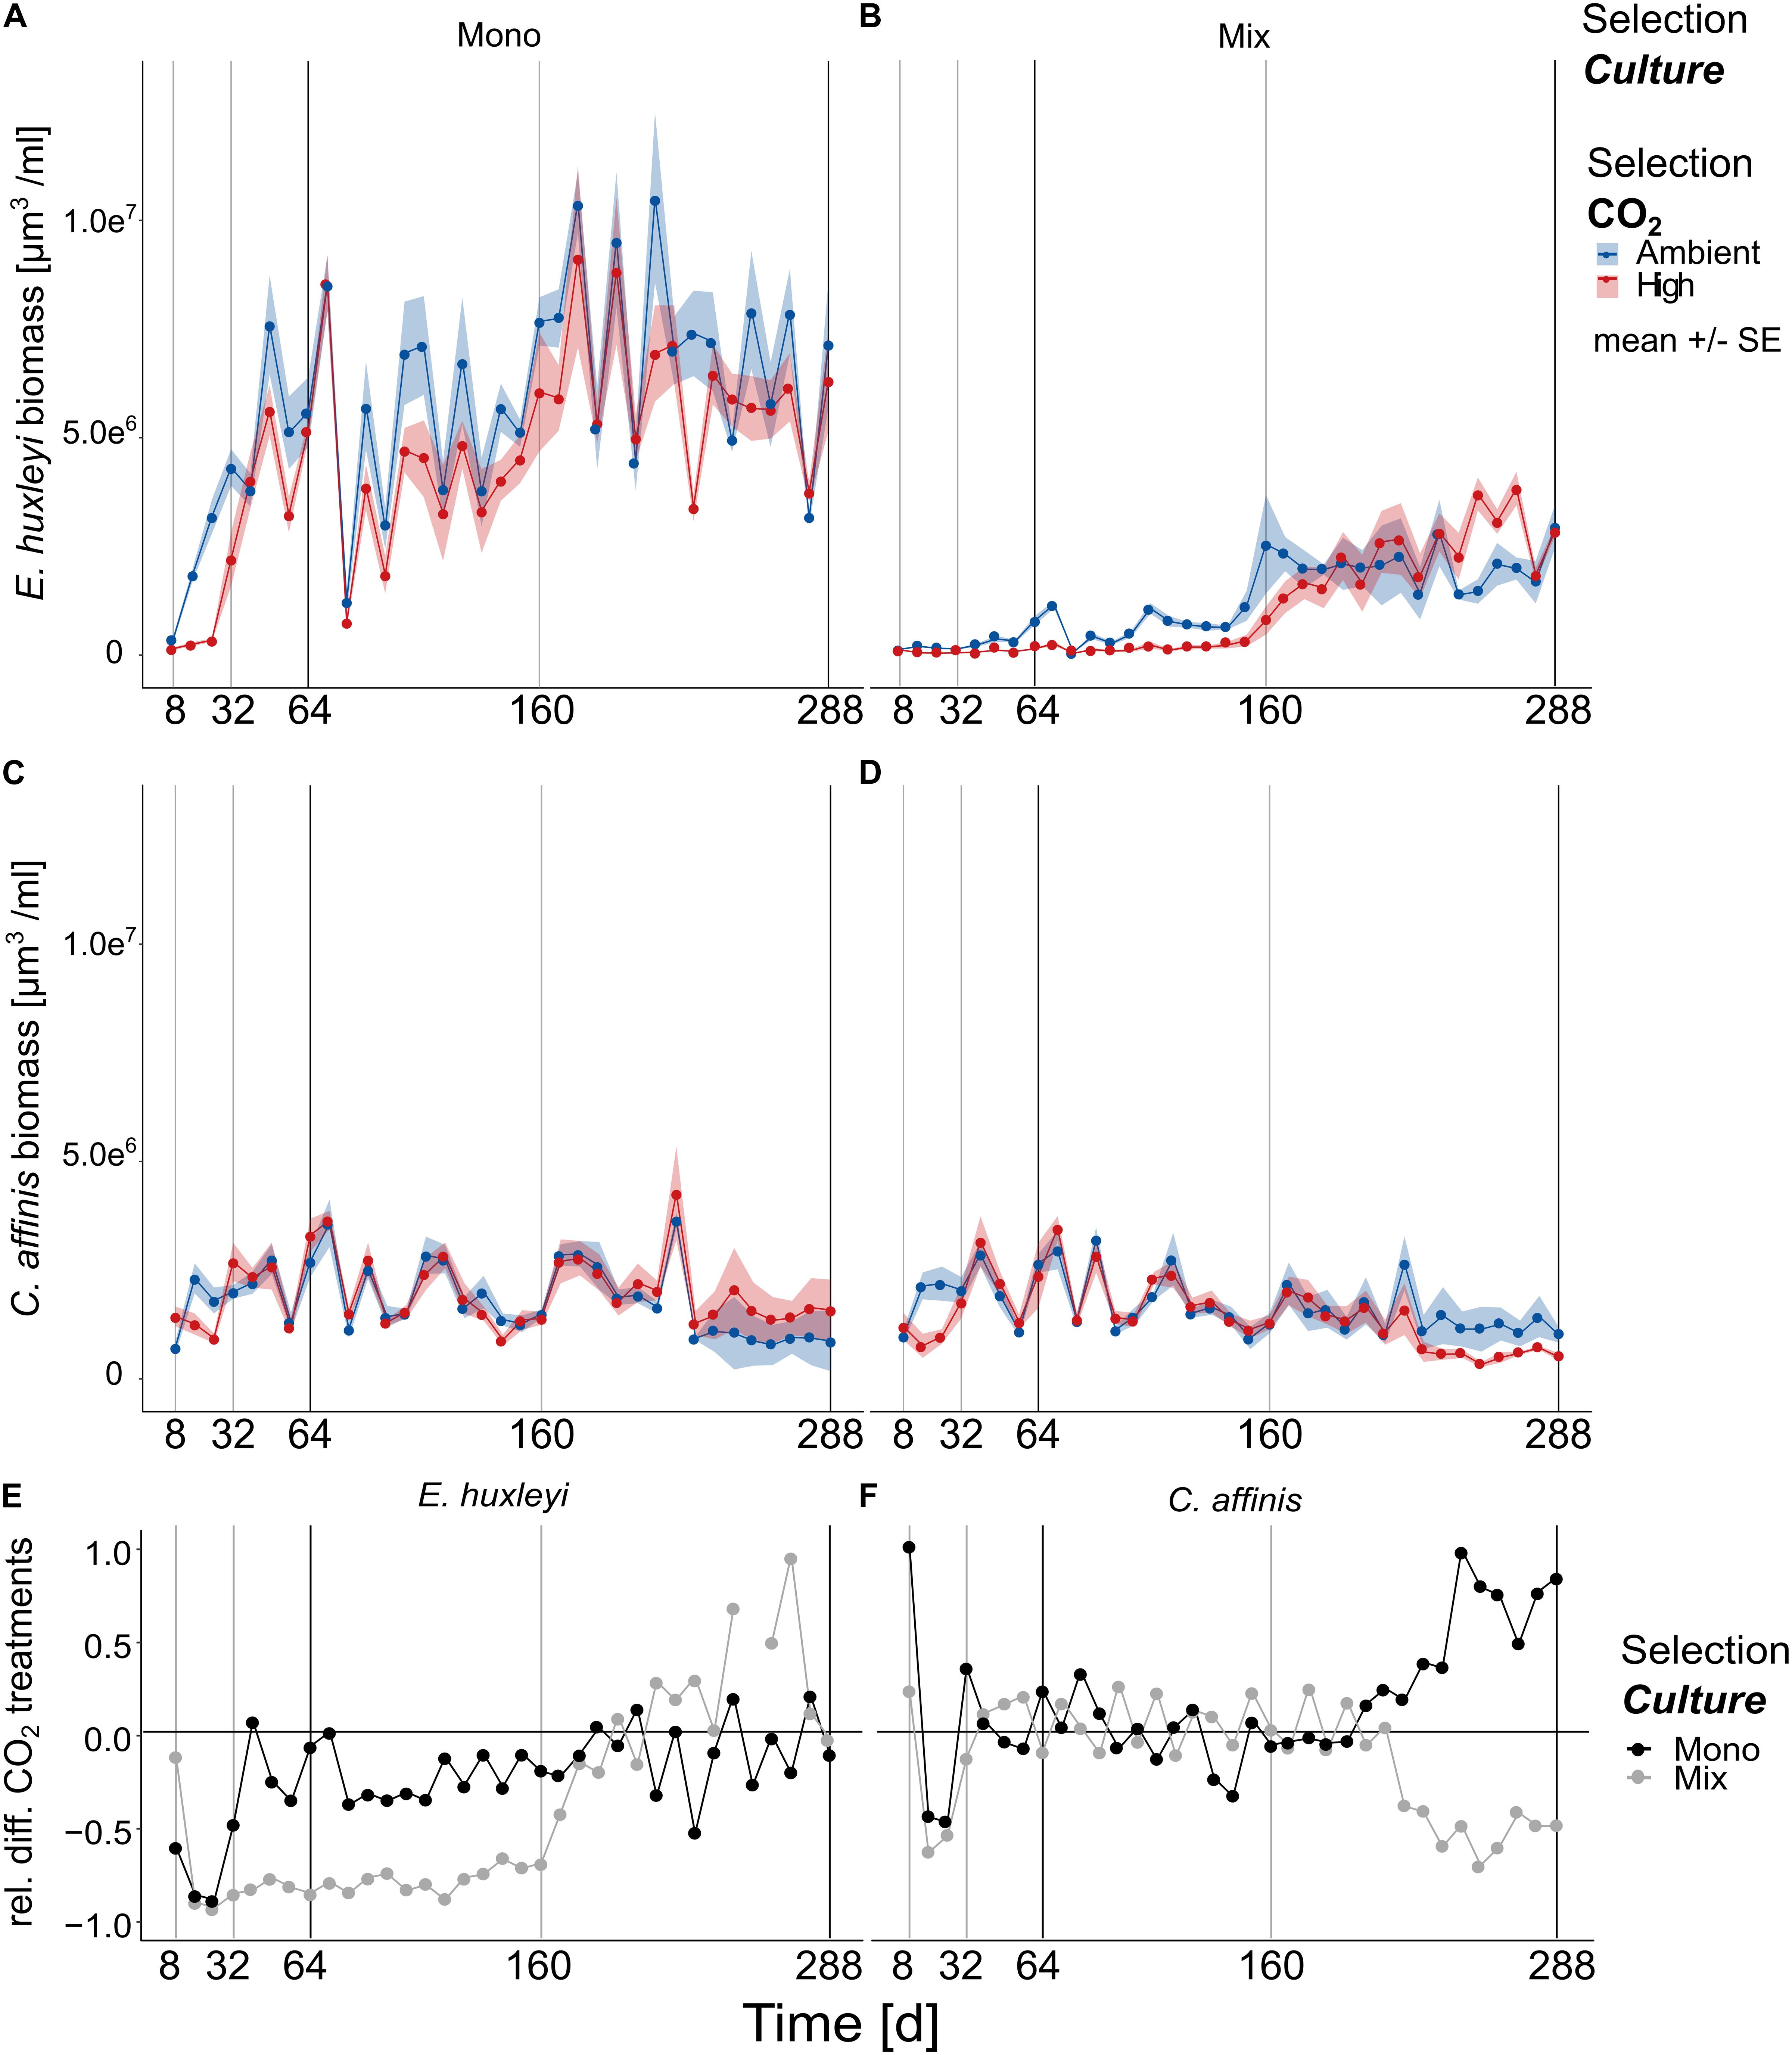
Figure 3. Biovolume changes over approx. 200 generations. The biovolume of E. huxleyi (A,B) and C. affinis (C,D) measured at the end of each batch cycle over 36 batch cycles in the four selection treatments is shown here [mean ± SE; n = 5 (5 replicates/treatment) for days 1–200; and n = 4 (4 replicates/treatment) for days 200–288 per time point]. The light gray and black lines show the time points where samples were taken for genotype reisolation. The black lines show when the cultures were additionally tested for adaptation in the reciprocal assay test. Panels (E,F) show the relative difference between the ambient and high CO2 treatments for E. huxleyi (E) and C. affinis (F) when grown alone (black points) and with the respective other species (gray points) for better understanding how the responses to increased CO2 concentrations changed over time.
Overall E. huxleyi biovolume increased over time about one order of magnitude with an average 30-fold increase across all treatments (Figures 3A,B, and Supplementary Table S5 Full model, “Time” F1,660 = 122.726, and p < 0.0001). During the first half of the experiment high CO2 reduced the biovolume of E. huxleyi by a third in the mono-cultures (Figures 3A–E, Supplementary Table S5 E. huxleyi BC1-20 “Selection CO2” F1,372 = 113.818, and p < 0.0001). The effect of high CO2 was, with a biovolume reduction of almost 4 times compared to the ambient treatment, even more negative in E. huxleyi in mix-cultures (Figures 3A–E, Supplementary Table S5 E. huxleyi BC1-20 “Selection CO2 × Selection Culture” F1,372 = 8.313, and p = 0.0042). This suggested that interspecific competition had an additive negative effect at first. In the second half of the experiment the effect of competition reversed and E. huxleyi biovolume was only slightly reduced in high CO2 in the mono-cultures whereas in mix-culture increased CO2 even had a slightly positive effect (Figures 3A–E, and Supplementary Table S5 E. huxleyi BC21-36 “Selection CO2 × Selection Culture” F1,280 = 7.156, p = 0.0079).
In contrast to E. huxleyi the biovolume of C. affinis varied markedly between batch cycles with only a slight decrease of biovolume over time (Figures 3C,D, and Supplementary Table S5 C. affinis Full model, “Time” F1,671 = 25.538, and p < 0.0001). Specifically, the biovolume of C. affinis was not affected by increased CO2 in the first half of the experiment, neither in mix- or mono-culture (Figures 3C,D, and Supplementary Table S5 C. affinis BC1-20, “Selection CO2” F1,372 = 0.534, and p = 0.465). This pattern changed toward the end of the experiment where C. affinis biovolume declined to half in the high CO2 treatment in the mix-cultures (Figures 3D–F) while it doubled in the mono-cultures (Figures 3C–F, and Supplementary Table S5 C. affinis BC21-36, “Selection CO2 × Selection Culture” F1,352 = 15.986, and p < 0.0001). This suggests that, over time, the diatoms in mix-culture were affected by the competing coccolithophores: in high CO2 treatments biovolume of E. huxleyi increased more than in ambient CO2 conditions leading to potentially stronger depletion of nutrient and consequently reduced growth of competing C. affinis (Supplementary Table S5 C. affinis Full model, three-way interaction F1,671 = 12.225, and p = 0.0005).
The genotype composition changed uniformly over time in both species (Figure 4, and Supplementary Table S6, E. huxleyi “Time” R2 = 0.999, p = 0.001, permutations = 999, C. affinis “Time” R2 = 0.999, p = 0.001, and permutations = 999) with only a single genotype left for all cultures of E. huxleyi and C. affinis (C41 and B57, respectively). In E. huxleyi there was no effect of CO2 on the genotype sorting (Figure 4, and Supplementary Table S6, “Selection CO2” R2 = 0, p = 0.401, and permutations = 999) and only a small difference between the single and co-occurring cultures (Figure 4, and Supplementary Table S6 “Selection culture” R2 = 0, p = 0.085, and permutations = 999). The small difference likely came about due to slightly slower sorting to the dominant genotype C41 in the mix-culture (Figures 4A,B). For C. affinis we could not analyze the effect of either treatment on the genotype composition.
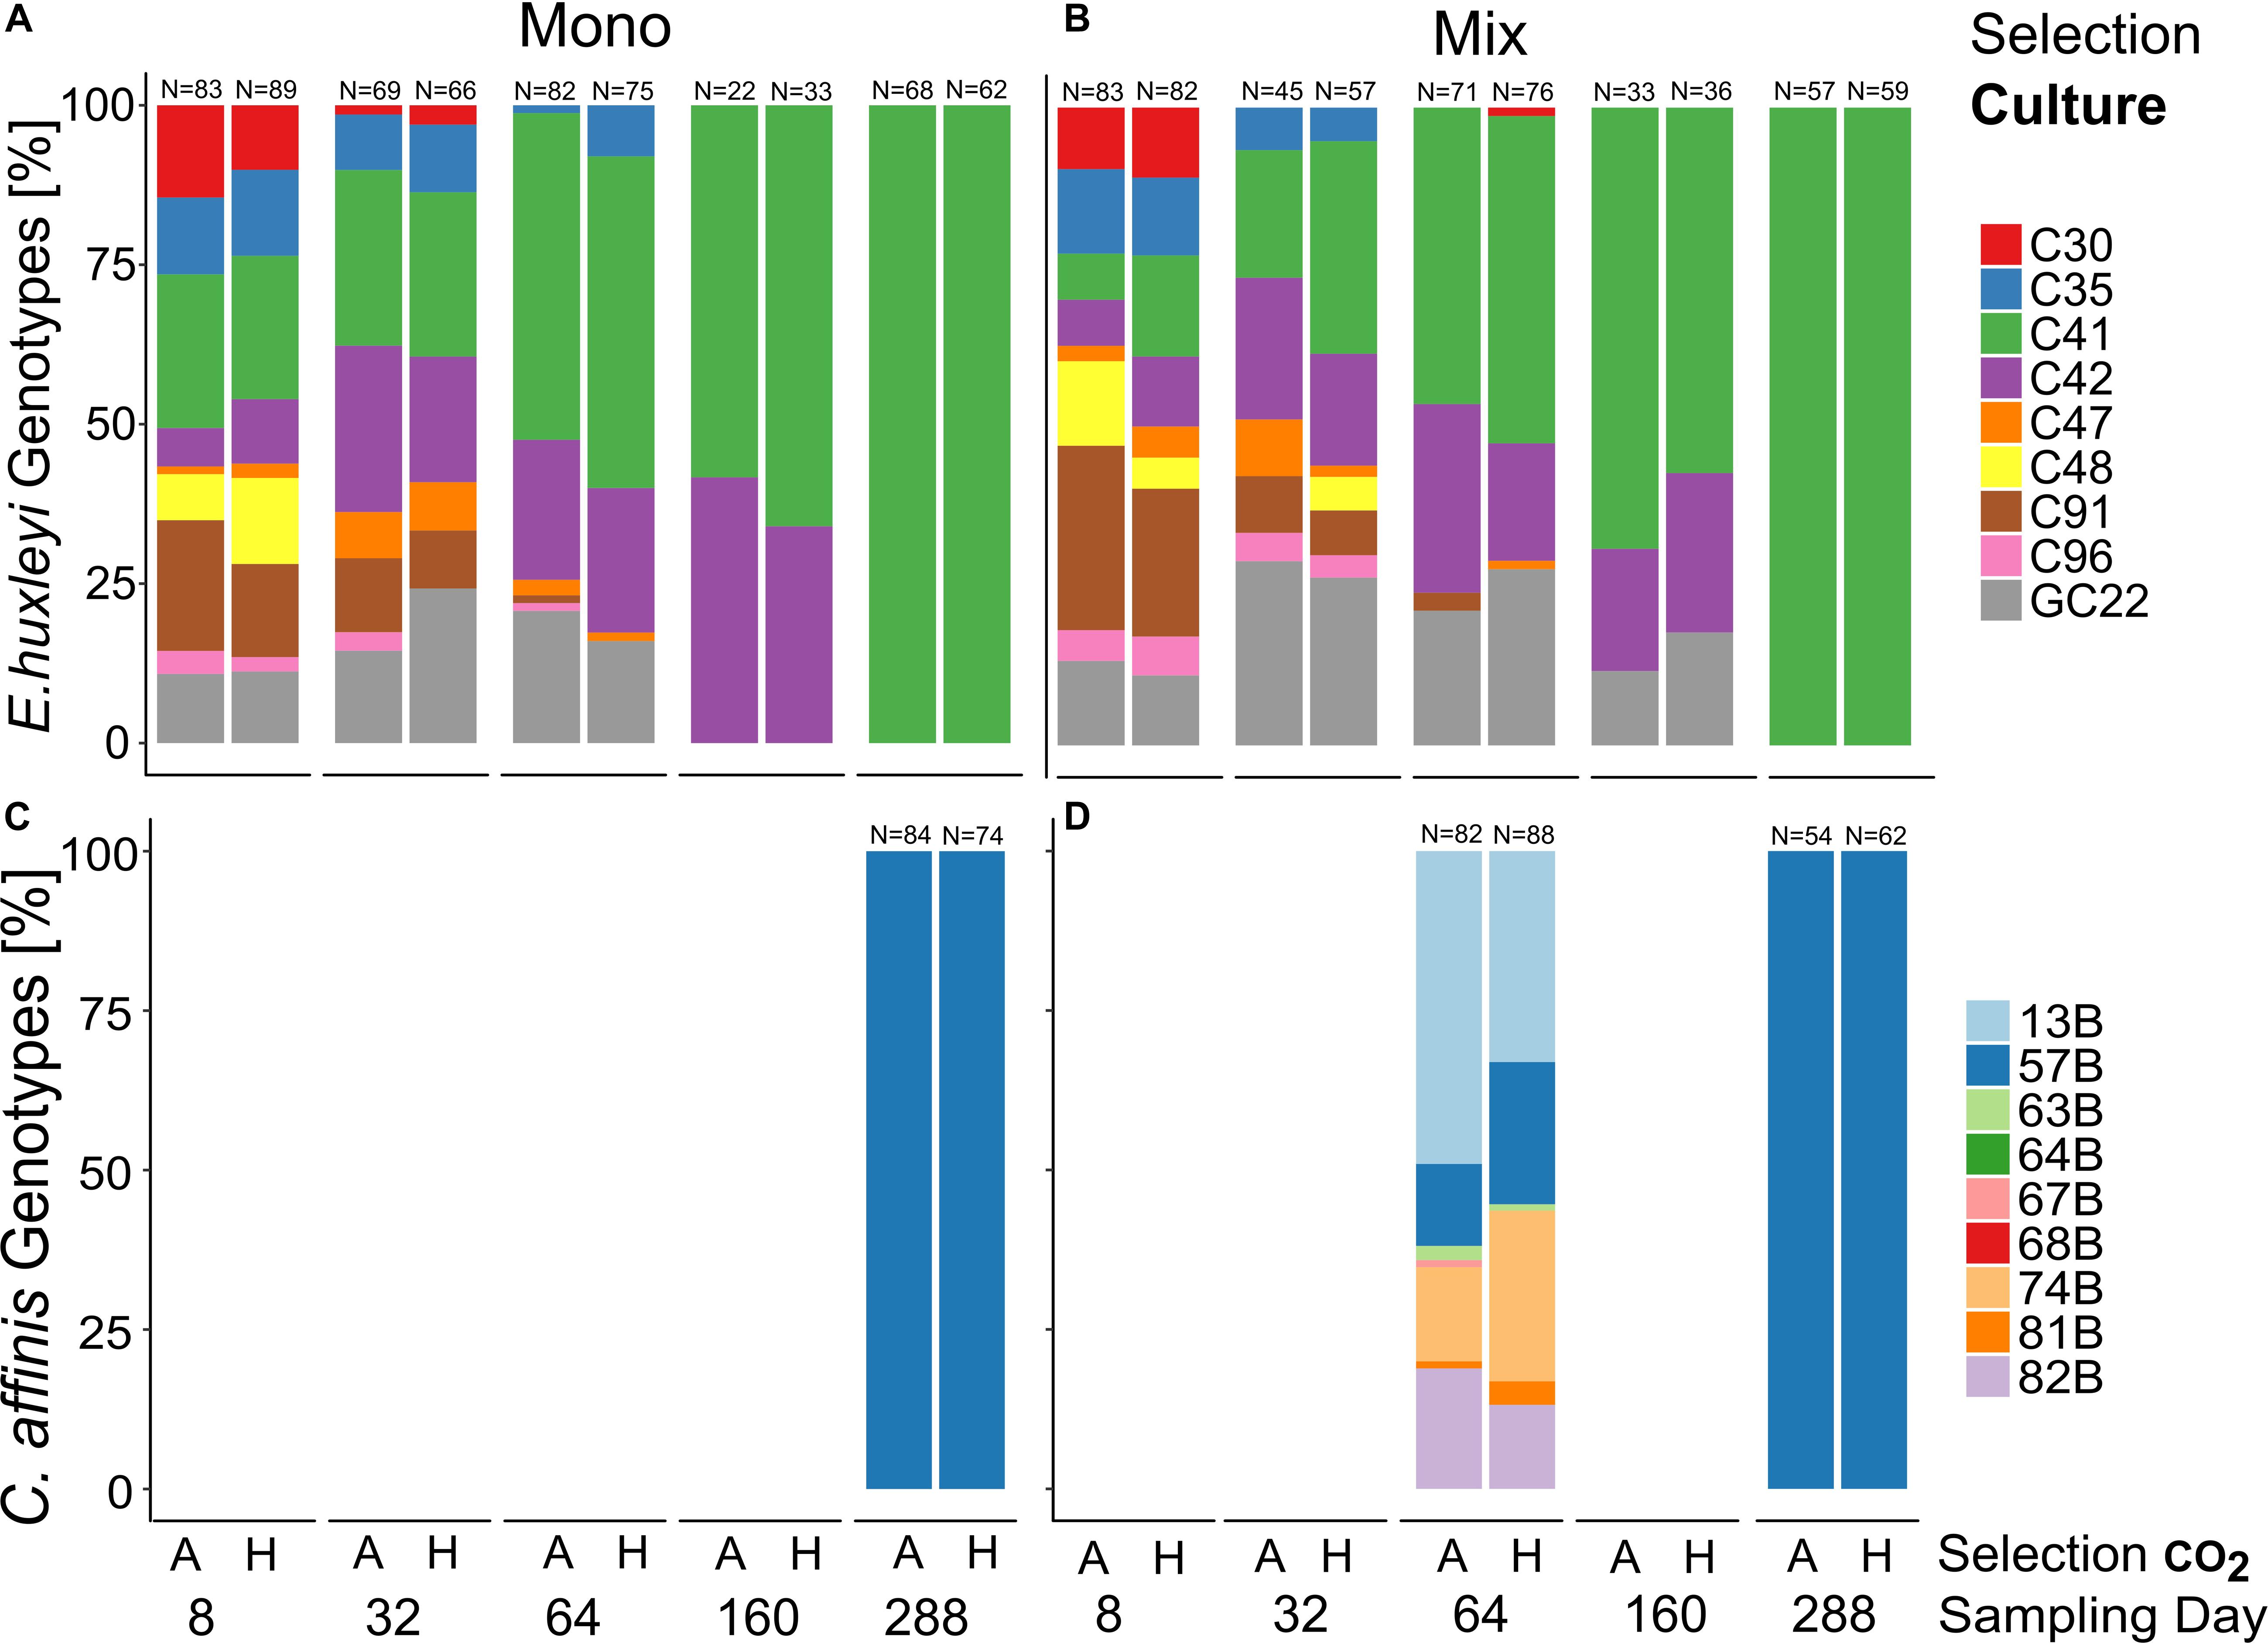
Figure 4. Genotype sorting over approx. 200 generations. Relative genotype contributions in E. huxleyi (A,B) and C. affinis (C,D) experimental populations at 5 and 2 timepoints, respectively, over the course of the experiment in ambient (A) and high (H) CO2 concentrations. Both panels on the left show the genotype contribution to the population without the second species (mono-culture) whereas the panels on the right show the contribution to the population with the respective other species (mix-culture). Re-isolation and DNA extraction of C. affinis genotypes proved difficult and we did not obtain usable data. However, the overall picture of strong genotype sorting remained.
In E. huxleyi we found no significant interaction of selection with the assay treatment in neither of the two assays which would indicate evolutionary adaptation (Supplementary Table S7, E. huxleyi). Specifically, long-term selection to high CO2 did not result in increased growth in the high CO2 assay condition compared to ambient selected populations (Figures 5A,B). However, there were non-adaptive effects of CO2 and culture selection and assay treatments that varied between the two assay experiments: After 64 days, selection under high CO2 had a negative effect on the growth rates of E. huxleyi when measured in the presence of the diatom (”mix” assay treatment), while “mix” assay conditions led to a decline in growth rates in general (Figures 5A,B and Supplementary Table S7 E. huxleyi Assay 64 days “Selection CO2 × Assay Culture” F1,47 = 10.511, p = 0.002, “Assay Culture” F1,47 = 254.708, and p < 0.0001). These effects were largely absent in the second assay after 288 days where growth rates were only affected by the assay CO2 treatment (Supplementary Table S7 E. huxleyi Assay 64 days, F1,47 = 8.066, and p = 0.007). There was a significant increase in growth rates of ca. 10–45% over time in all selection treatments (Figure 5A and Supplementary Table S7 E. huxleyi, “Time” F1,47 = 391.511, and p < 0.0001), with the strongest increase in cultures that had been selected in high CO2 in the presence of the diatom.
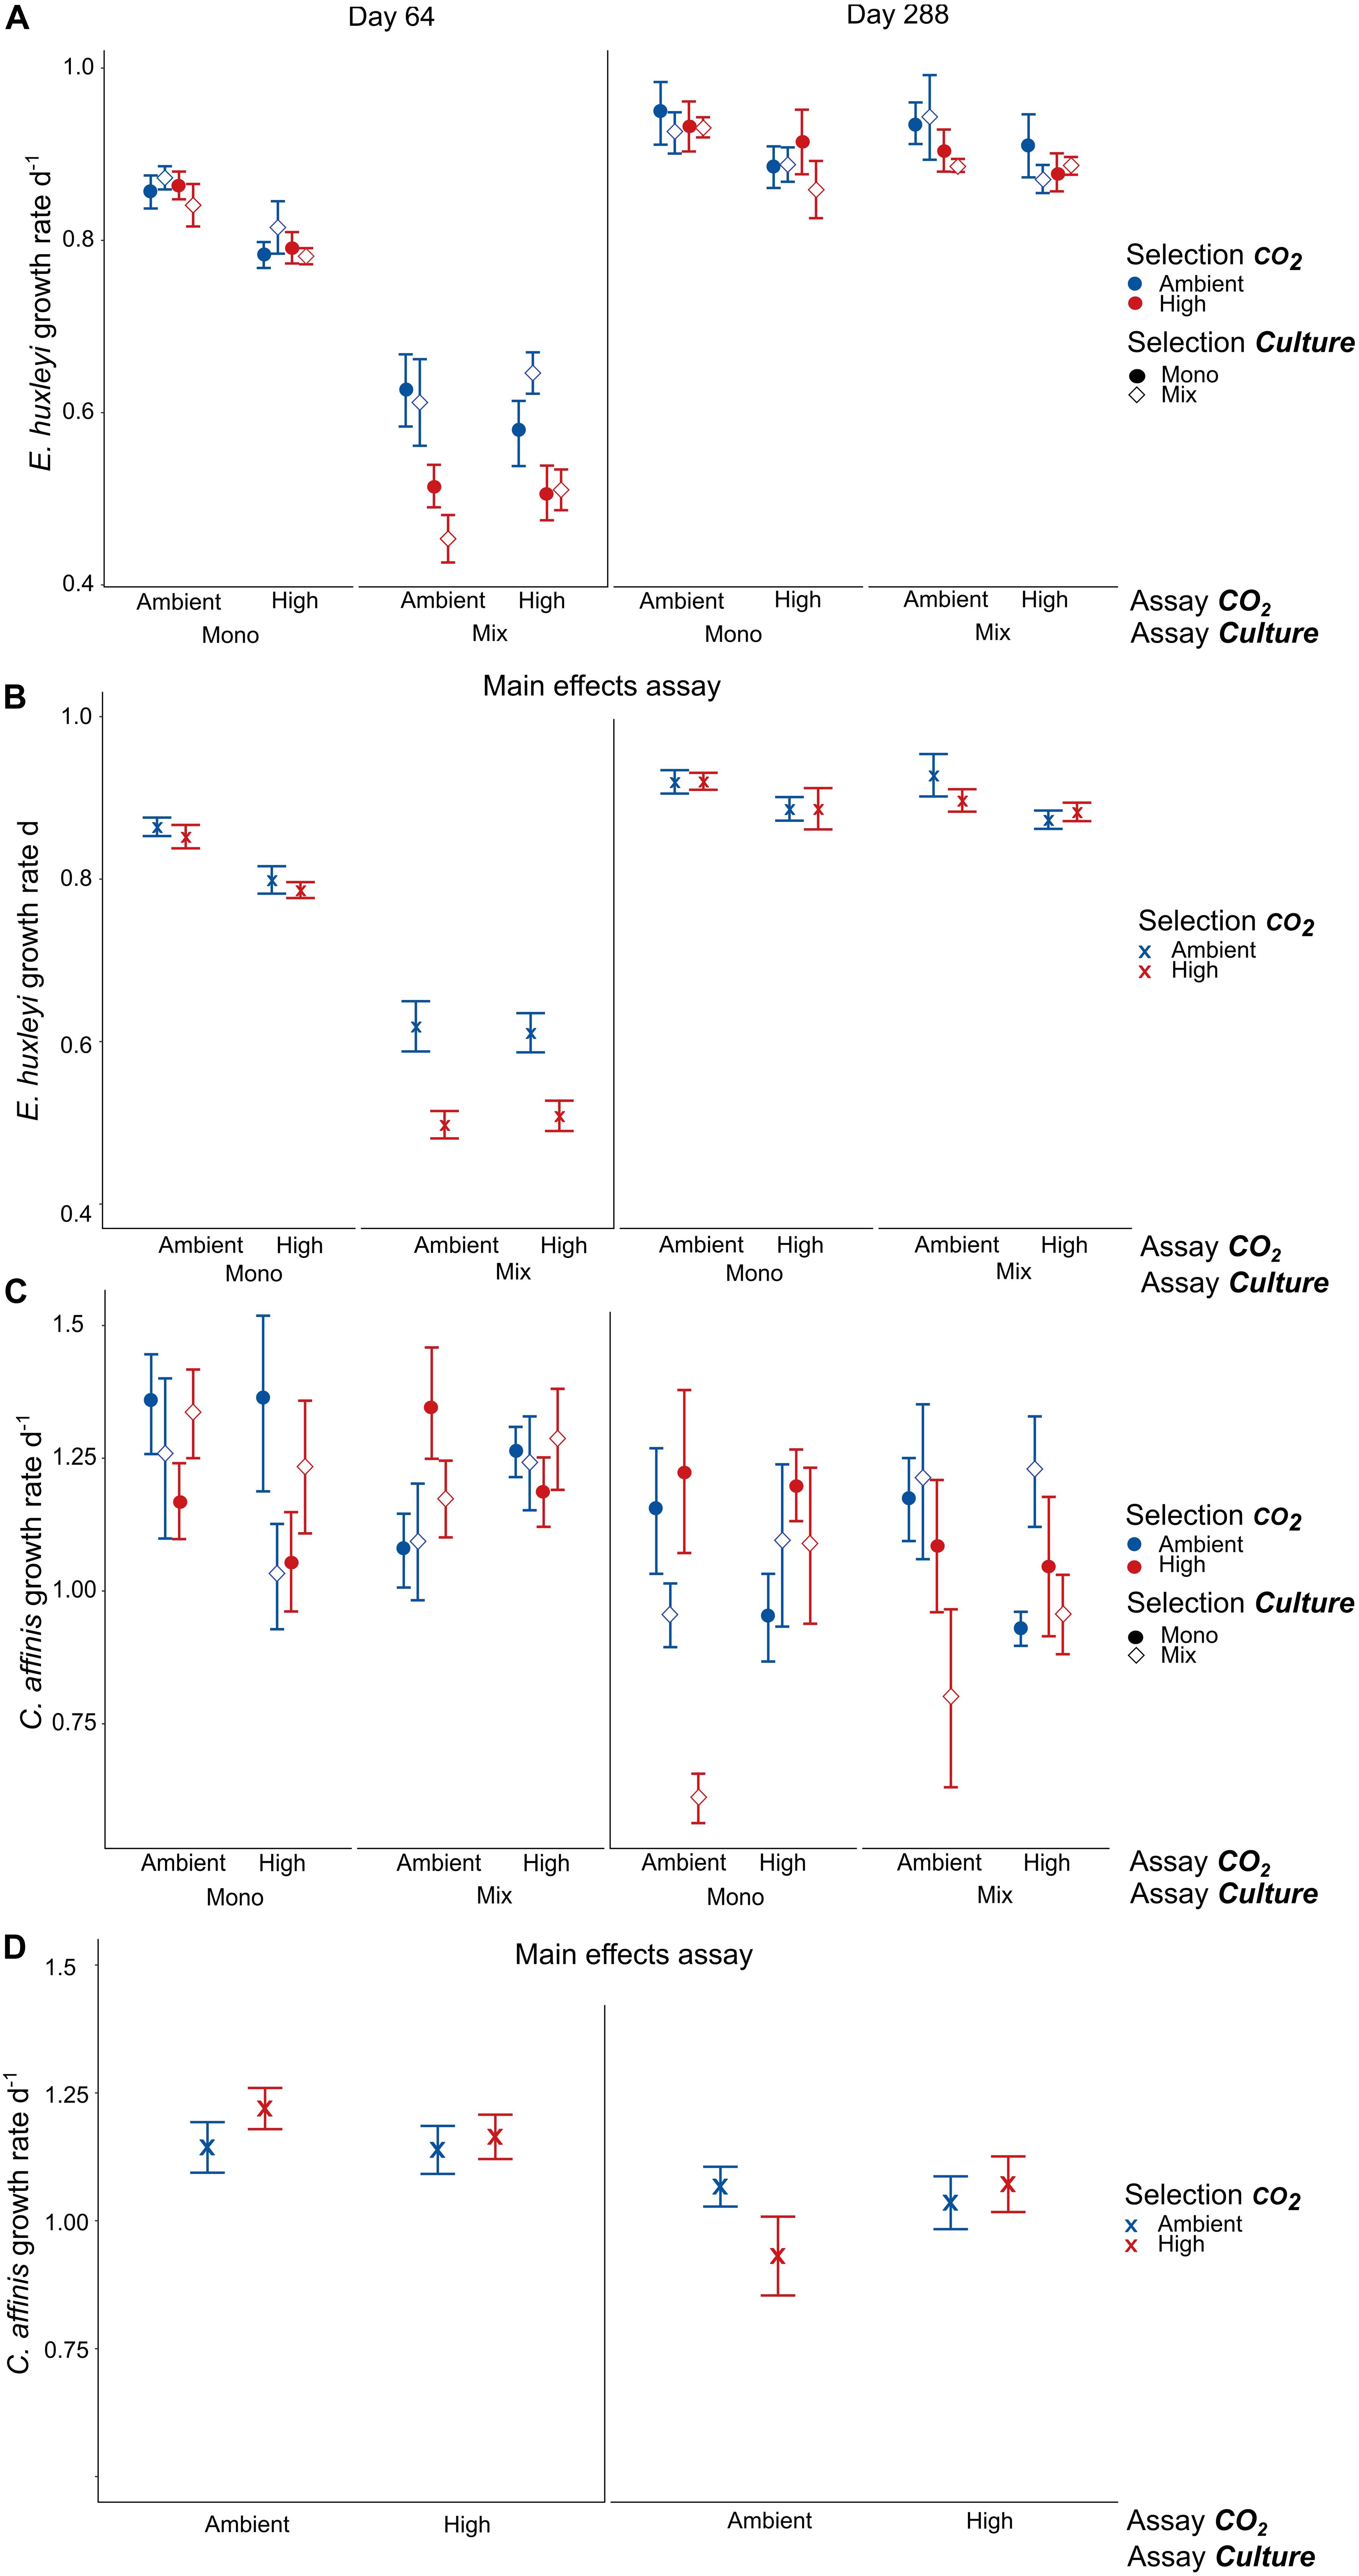
Figure 5. Growth rates in reciprocal assay experiments. Panels (A,C) show the full results of adaptation assay experiments on growth rates of E. huxleyi and C. affinis, respectively, after 64 and 288 days (mean ± SE, n = 4). Panels (B,D) show the significant and interactive results of the assays where we pooled the growth rates of the mono and mix selection culture treatments for both E. huxleyi and C. affinis and additionally the assay mono and mix culture treatment for C. affinis because these treatments did not have a significant effect (mean ± SE, n = 16 and n = 8, respectively). How to look for adaptive response: To see an adaptive response to the single factor CO2 it is necessary to compare all points with closed circles in Mono. For the adaptation to CO2 in a community context all points with open diamonds in Mix have to be compared. For the combined effect of adaption to CO2 and competition the comparison of the red diamond and blue circle in Mix-High and Mono-Ambient have to be compared.
No selection for higher growth rates to exposure to increased CO2 could be observed in C. affinis. In contrast to this expectation the growth rates decreased by a tenth over time throughout all treatments (Figure 5C and Supplementary Table S7 C. affinis “Time” F1,46 = 14.843, p < 0.001). Nevertheless, we found different responses to CO2 with and without competition that even resulted in an seemingly adaptive effect to increased CO2 in the second assay after 288 days, evident as a significant interaction of selection and assay treatment (Figure 5D “u-shape” pattern in pooled data, Supplementary Table S7 C. affinis Assay 288 days “Selection CO2” × “Assay CO2” F1,47 = 17.807, and p = 0.0001). However, this “adaptive” response was mainly driven by very low growth rates of C. affinis that have been selected in mix-cultures to high CO2 as well as low growth rates of C. affinis selected under ambient CO2 in mono-cultures. This result showed that disentangling the effects of both abiotic and biotic factors is crucial to avoid overestimation of adaptive responses to abiotic factors alone.
Our results show that long-term selection to an abiotic stressor in communities growing into stationary phase can drastically diverge from the predicted outcomes of (i) short term experiments with the same abiotic driver and (ii) selection experiments where species are held under exponential growth (Riebesell, 2004; Lohbeck et al., 2012; Schlüter et al., 2014; Hattich et al., 2017). We here show that the divergence in the community response potentially arises from the effect of evolutionary on ecological processes, as previously shown in other systems (Hairston et al., 2005; Schoener, 2011). During the first half of the experiment our initial expectations (for biovolume) with respect to species being an ecological “loser” and “winner” in response to enhanced CO2 were met for E. huxleyi but not C. affinis. This led to the expected dominance of C. affinis, which was more pronounced under increased CO2 conditions. However, over time, the observed effects of increased CO2 on biovolume changed for both species so as to revert our predicted ecological “loser” and “winner” outcome. Consequently, the relative contributions in the communities flipped and E. huxleyi became dominant under both CO2 conditions. This change in community composition was reflected in a strong increase in biovolume of E. huxleyi and a weak decrease in biovolume of C. affinis. However, these changes in species’ biovolume over time were the result of different drivers: While the E. huxleyi biovolume correlated mainly with cell numbers (Supplementary Figures S3A, S4A), C. affinis biovolume correlated mainly with cell volume (Supplementary Figures S3B, S4B). We note that the “dominance-flip” coincided with strong genotype selection in both species, which was unexpectedly not driven by CO2 or species competition treatment. Likewise, neither species showed adaptation to CO2 or competition in the reciprocal assays. We can only speculate why this “dominance flip” occurred at the specific point in the experiment: Coinciding with the flip the winning genotype C41 in E. huxleyi became dominant, suggesting a feedback from evolutionary changes on ecology. Potentially a critical abundance threshold was reached by E. huxleyi that was necessary to become competitively superior over C. affinis. Characteristics and traits of this winning genotype likely have played a role when competing with C. affinis, but could not be characterized herein.
For the coccolithophore, the absence of CO2 adaptation found here is in contrast to several previous studies (Lohbeck et al., 2012; Schlüter et al., 2014), while there is conflicting prior evidence on the diatom species (Scheinin et al., 2015; Li et al., 2017). The contrasting finding of no adaption or differential genotype sorting to increased CO2 for E. huxleyi could potentially be explained by differences in the experimental setups concerning the CO2 manipulation, batch cycle length, experimental duration, light, temperature, and nutrient availability (Rost et al., 2008; Gao and Campbell, 2014; Meyer and Riebesell, 2015). A marked difference of our experimental setup compared to other experimental evolution studies was that our species were not kept under constant exponential growth (Lohbeck et al., 2012; Li et al., 2017; Pardew et al., 2018) but ran into stationary phase. The resulting recurrent nutrient repletion and limitation at the start and end of each batch cycle, respectively, could likely have overridden CO2 effects on growth rate as observed herein (or f.e. in Aranguren-Gassis et al., 2019), because selection on other traits, e.g., important for nutrient acquisition, might have been more important. For C. affinis, however, it remains uncertain if nutrient limitation has likewise overwritten the expected adaptive response to CO2 or if the species was really unaffected by this driver. There is no directly comparable study with the same species, which does not run into nutrient limitation. Moreover the two long-term studies existing for diatoms do show diverging adaptive responses, which might depend on different experimental set-ups as well as species identity, as largely diverging short-term responses have already been described between diatom species (Gao and Campbell, 2014; Bach and Taucher, 2019).
It is well accepted that a more complex ecological context allowing for competition can affect evolutionary dynamics (de Mazancourt et al., 2008; Barraclough, 2015; Lancaster et al., 2017) but we did not find a significant effect in this study. Although not demonstrated to date, it is quite likely that interspecific competition has the potential to affect evolution in phytoplankton, as already intraspecific competition was shown to alter adaptive responses to CO2 (Collins, 2011a). In this study, the dominant C. affinis strongly reduced the biovolume (throughout the experiment) and growth rate (in both reciprocal assays) of E. huxleyi, demonstrating the strong effect of competition, especially in the first half of the experiment. In addition, we found a further reduction of growth rates to increased CO2 with the co-occurrence of the diatom indicating that the ecological context did play a role albeit not affecting the evolutionary change. That no effect of interspecific competition on species’ evolution, or adaptation could be observed potentially depends on how coexistence was allowed in our experiment. Owing to the species’ different nutrient uptake kinetics (Sommer, 1984) niche partitioning likely appeared temporary over the course of a batch cycle. Whereas the diatom had an advantage during the first batch cycle days with replete nutrients, the coccolithophore with higher affinity was favored and could grow longer toward the end of each batch cycle when nutrients became limiting (Sommer, 1984; Supplementary Figures S1-1, S1-2). As such selection on standing genotype composition likely took place within these two niche spaces of both coexisting species, unaffected by the presence of the interspecific competitor.
Although adaptive responses to either increased CO2 or competition were absent, we still observed strong evolutionary change as very reproducible, directional sorting of genotypes across all treatments. Interestingly, these evolutionary dynamics selected for one single genotype of each species that became dominant already after approximately 64–160 days of the experiment. While we know that evolution was independent of the intended CO2 and species competition treatments, non-intended laboratory selection was the most likely driver in our study. Laboratory selection is inevitable and often strong and has been previously demonstrated over very long time scales by comparing ancestral bacterial populations to laboratory evolved populations (Lenski and Travisano, 1994). Here, selection became apparent when looking at different responses in both species over time: We found an overall change in E. huxleyi and C. affinis biovolume and growth over time (Supplementary Figure S5). Interestingly, changes in traits of E. huxleyi (e.g., growth rate, cell size) were also observed in another long-term laboratory selection study (Schlüter et al., 2016). In these experiments, however, laboratory adaptation was only a “background” signal, whereas in our experiments the chosen treatments were too weak to impose a selection force to overcome laboratory selection. Schlüter et al. (2016) started their experiment with one single genotype, implying that observed changes in growth rate were a result of novel mutations, while in our study, observed changes in biovolume and growth rate could be the result of both selection on genotypic diversity and mutations. Among the single remaining genotype it is possible that within the 200 generations of experimentation new mutations occurred (Elena and Lenski, 2003) that may contribute to phenotypic divergence in genotypes solely characterized by microsatellite marker alleles. With the caveat of not having ancestral populations of genotypes as a comparison we cannot say how laboratory selection played out in our species. Certain is, however, that changes in species’ characteristic as observed in changed biovolume growth rate responses to the treatments throughout the experiment were strong.
When studying eco-evolutionary dynamics, complex ecological conditions can evidently impinge upon evolutionary dynamics, while the complementary question asks how evolutionary change affects ecological processes (for example Fussmann et al., 2007; Ellner et al., 2011; Koch et al., 2014). In our study, the genotype compositional change (i.e., strong evolutionary change) coincided or rather preceded reversal in community composition (i.e., ecological change). That this dominance shift and underlying genotype selection also occurred in an earlier attempt of the experiment, suggests that the eco-evolutionary dynamics observed are reproducible (Supplementary Figures S6, S7). We, however, propose that selection by nutrient limitation on standing variability in genotype’s competitive abilities was the most likely driver resulting in the eco-evolutionary interaction. However, necessary experimental characterization of the genotypes’ nutrient uptake associated traits is (currently) missing. Other studies reported nutrient uptake related traits in marine protists to vary between genotypes to the same extent as growth rates (Brandenburg et al., 2018). Since we have shown that the variability in growth rates among the genotypes used in this study is even larger than that of the response to increased CO2 (Hattich et al., 2017), we postulate that their nutrient uptake related traits vary as well on which selection can take place. Just recently evolution in nutrient related competitive traits in phytoplankton has been demonstrated (Bernhardt et al., 2020). Another indication that nutrients were driving the change in our system is the observed shift away from C. affinis toward E. huxleyi, the favored species by nutrient limitation (Tyrrell and Merico, 2004). While studies on natural phytoplankton communities (i.e., in mesocosm studies; see for example Peter and Sommer, 2015) and nutrient dependent seasonal successions within phytoplankton populations (Sommer, 1984) are well understood, the underlying eco-evolutionary mechanisms driving nutrient associated changes are less well studied. Most previous studies were not run over sufficient generations to permit genotypic selection, the simplest form of evolution to occur in phytoplankton communities. Consequently, future experimental eco-evolutionary studies should focus more on the consequences on how nutrients select to predict phytoplankton change (Thomas et al., 2017; Bernhardt et al., 2020). This will become particularly relevant as nutrient uptake related traits explain competitive ability under different nutrient conditions (Sommer, 1984; Litchman et al., 2007) and there will be more nutrient limitation on phytoplankton in the future ocean (Boyd et al., 2013; Moore et al., 2013).
To conclude, the most parsimonious explanation for the observed dominance flip among the two globally important phytoplankton species E. huxleyi and C. affinis, is rapid evolutionary feedback to the ecology. Rapid evolutionary change as genotype sorting driven by experimental selection (potentially via nutrient limitation) and not CO2 environment turned an ecological “loser” (with respect to biovolume contribution to the community) into a “winner” and vice versa. As such, this flip demonstrates for the first time that eco-evolutionary interactions play out in competing phytoplankton communities. Such interactions can drastically alter the effect of environmental drivers and lead to diverging predictions of future changes compared to such resulting of short-term studies. Considering the role that phytoplankton play in biogeochemical cycles as primary producers, changes in biovolume composition and/or in size within populations owing to evolutionary change due to the combination of abiotic and biotic interactions identified here could have far reaching effects on ecosystem dynamics (Falkowski et al., 2008). Our results call for an inclusion of more realistic experimental evolution conditions in future studies, not only using realistic nutrient regimes, but more importantly also including multi-species settings and their underlying mechanisms allowing for stable coexistence to simultaneously investigate ecological and evolutionary processes in phytoplankton.
The datasets presented in this study can be found in online repositories. The names of the repository/repositories and accession number(s) can be found below: PANGAEA (https://doi.org/10.1594/PANGAEA.887780).
The basic grant proposal supporting this work was written by BM and TR. The experiment was developed by GH and then the experiments further designed by LL and GH. Lab work carried out by LL and GH and data analyses by LL. LL, GH, BM, and TR drafted the manuscript. All authors revised the manuscript and gave final approval for publication.
LL, GH and this project were funded by the DFG priority program 1704 Dynatrait: TR RE1708/17-1 and 2 and BM MA5058/2-1 and 2.
The authors declare that the research was conducted in the absence of any commercial or financial relationships that could be construed as a potential conflict of interest.
We thank Thomas Hansen, Bente Gardeler, Cordula Meyer, Jens Wemhöner, and Kastriot Qelai for their laboratory assistance. As well as our student assistants Nele Rex, Julia Raab, Julia Romberg, Miriam Beck, Sophia Antoniella, and Gabriela Escobar for their support. We thank Till Bayer for his support with the development of C. affinis microsatellite assays. We also thank KIMOCC for technical support and quality management of the Kiel CO2 manipulation experimental facility (KICO2) at GEOMAR. We thank Elisa Schaum for her comments to improve this manuscript.
The Supplementary Material for this article can be found online at: https://www.frontiersin.org/articles/10.3389/fmars.2020.00634/full#supplementary-material
Further methodological explanations on reciprocal assay experiments and genotype identification
FIGURE S1 | Semi continuous batch cycle growth curves.
FIGURE S2 | Dissolved inorganic nutrients in one batch cycle.
FIGURE S3 | Estimated growth rates over the course of the experiment.
FIGURE S4 | Correlation of cell numbers and biovolume.
FIGURE S5 | Correlation of cell volume and biovolume.
FIGURE S6 | Relative species contribution to biovolume from a first attempt at the experiment presented here.
FIGURE S7 | Relative genotype contribution to biovolume from a first attempt at the experiment presented here.
Aranguren-Gassis, M., Kremer, C. T., Klausmeier, C. A., and Litchman, E. (2019). Nitrogen limitation inhibits marine diatom adaptation to high temperatures. Ecol. Lett. 22, 1860–1869. doi: 10.1111/ele.13378
Bach, L., and Taucher, J. (2019). CO2 effects on diatoms: a synthesis of more than a decade of ocean acidification experiments with natural communities. Ocean Sci. Discuss. 15, 1159–1175. doi: 10.5194/os-2019-47
Barraclough, T. G. (2015). How do species interactions affect evolutionary dynamics across whole communities? Annu. Rev. Ecol. Evol. Syst. 46, 25–48. doi: 10.1146/annurev-ecolsys-112414-054030
Bernhardt, J. R., Kratina, P., Pereira, A. L., Tamminen, M., Thomas, M. K., and Narwani, A. (2020). The evolution of competitive ability for essential resources. Philos. Trans. R. Soc. B Biol. Sci. 375:20190247. doi: 10.1098/rstb.2019.0247
Boyd, P. W., Rynearson, T. A., Armstrong, E. A., Fu, F., Hayashi, K., Hu, Z., et al. (2013). Marine phytoplankton temperature versus growth responses from polar to tropical waters–outcome of a scientific community-wide study. PLoS One 8:e63091. doi: 10.1371/journal.pone.0063091
Brandenburg, K. M., Wohlrab, S., John, U., Kremp, A., Jerney, J., Krock, B., et al. (2018). Intraspecific trait variation and trade-offs within and across populations of a toxic dinoflagellate. Ecol. Lett. 21, 1561–1571. doi: 10.1111/ele.13138
Carroll, S. P., Hendry, A. P., Reznick, D. N., and Fox, C. W. (2007). Evolution on ecological time-scales. Funct. Ecol. 21, 387–393. doi: 10.1111/j.1365-2435.2007.01289.x
Collins, S. (2011a). Competition limits adaptation and productivity in a photosynthetic alga at elevated CO2. Proc. Biol. Sci. 278, 247–255. doi: 10.1098/rspb.2010.1173
Collins, S. (2011b). Many possible worlds: expanding the ecological scenarios in experimental evolution. Evol. Biol. 38, 3–14. doi: 10.1007/s11692-010-9106-3
de Mazancourt, C., Johnson, E., and Barraclough, T. G. (2008). Biodiversity inhibits species’ evolutionary responses to changing environments. Ecol. Lett. 11, 380–388. doi: 10.1111/j.1461-0248.2008.01152.x
Des Roches, S., Post, D. M., Turley, N. E., Bailey, J. K., Hendry, A. P., Kinnison, M. T., et al. (2018). The ecological importance of intraspecific variation. Nat. Ecol. Evol. 2, 57–64. doi: 10.1038/s41559-017-0402-5
Doney, S. C., Fabry, V. J., Feely, R. A., and Kleypas, J. A. (2009). Ocean acidification: the other CO2 problem. Annu. Rev. 1, 169–194.
Elena, S. F., and Lenski, R. E. (2003). Evolution experiments with microorganisms: The dynamics and genetic bases of adaptation. Nat. Rev. Genet. 4, 457–469. doi: 10.1038/nrg1088
Ellner, S. P., Geber, M. A., and Hairston, N. G. (2011). Does rapid evolution matter? Measuring the rate of contemporary evolution and its impacts on ecological dynamics. Ecol. Lett. 14, 603–614. doi: 10.1111/j.1461-0248.2011.01616.x
Falkowski, P. G., Fenchel, T., and Delong, E. F. (2008). The microbial engines that drive earth ’s biogeochemical cycles. Science 320, 1034–1039. doi: 10.1126/science.1153213
Field, A. (2018). A Bluffer’s Guide to… Sphericity. Available online at: http://citeseerx.ist.psu.edu/viewdoc/summary?doi=10.1.1.161.3892 (accessed April 11, 2018).
Fligner, M. A., and Killeen, T. J. (1976). Distribution-free two-sample tests for scale. J. Am. Stat. Assoc. 71, 210–213. doi: 10.1080/01621459.1976.10481517
Fussmann, G. F., Loreau, M., and Abrams, P. A. (2007). Eco-evolutionary dynamics of communities and ecosystems. Funct. Ecol. 21, 465–477. doi: 10.1111/j.1365-2435.2007.01275.x
Gao, K., and Campbell, D. A. (2014). Photophysiological responses of marine diatoms to elevated CO 2 and decreased pH: a review. Funct. Plant Biol. 41, 449–459.
Hairston, N. G., Ellner, S. P., Geber, M. A., Yoshida, T., and Fox, J. A. (2005). Rapid evolution and the convergence of ecological and evolutionary time. Ecol. Lett. 8, 1114–1127. doi: 10.1111/j.1461-0248.2005.00812.x
Hansen, T., Gardeler, B., and Matthiessen, B. (2013). Technical note: precise quantitative measurements of total dissolved inorganic carbon from small amounts of seawater using a gas chromatographic system. Biogeosciences 10, 6601–6608. doi: 10.5194/bg-10-6601-2013
Hardin, G. (1960). The competitive exclusion principle. Science 131, 1292–1297. doi: 10.1126/science.131.3409.1292
Hattich, G. S. I., Listmann, L., Raab, J., Ozod-Seradj, D., Reusch, T. B. H., and Matthiessen, B. (2017). Inter-and intraspecific phenotypic plasticity of three phytoplankton species in response to ocean acidification. Biol. Lett. 13:774. doi: 10.1098/rsbl.2016.0774
Hillebrand, H., Dürselen, C.-H., Kirschtel, D., Pollingher, U., and Zohary, T. (2002). Biovolume calculation for pelagic and benthic microalgae. J. Phycol. 35, 403–424. doi: 10.1046/j.1529-8817.1999.3520403.x
Kester, D. R., Duedall, I. W., Connors, D. N., and Pytkowicz, R. M. (1967). Preparation of artificial seawarter. Limnol. Oceanogr. 12, 176–179. doi: 10.4319/lo.1967.12.1.0176
Koch, H., Frickel, J., Valiadi, M., and Becks, L. (2014). Why rapid, adaptive evolution matters for community dynamics. Front. Ecol. Evol. 2:17. doi: 10.3389/fevo.2014.00017
Lancaster, L. T., Morrison, G., and Fitt, R. N. (2017). Life history trade-offs, the intensity of competition, and coexistence in novel and evolving communities under climate change. Philos. Trans. R. Soc. B Biol. Sci. 372:20160046. doi: 10.1098/rstb.2016.0046
Lawrence, D., Fiegna, F., Behrends, V., Bundy, J. G., Phillimore, A. B., Bell, T., et al. (2012). Species interactions alter evolutionary responses to a novel environment. PLoS Biol. 10:e1001330. doi: 10.1371/journal.pbio.1001330
Lawrence, M. A. (2016). Ez: Easy Analysis and Visualization of Factorial Experiments. Available online at: https://cran.r-project.org/package=ez
Lenski, R. E., and Travisano, M. (1994). Dynamics of adaptation and diversification: a 10,000-generation experiment with bacterial populations. Proc. Natl. Acad. Sci. U.S.A. 91, 6808–6814. doi: 10.1073/PNAS.91.15.6808
Li, F., Beardall, J., Collins, S., and Gao, K. (2017). Decreased photosynthesis and growth with reduced respiration in the model diatom Phaeodactylum tricornutum grown under elevated CO2 over 1800 generations. Glob. Chang. Biol. 23, 127–137. doi: 10.1111/gcb.13501
Litchman, E., Klausmeier, C. A., Schofield, O. M., and Falkowski, P. G. (2007). The role of functional traits and trade-offs in structuring phytoplankton communities: Scaling from cellular to ecosystem level. Ecol. Lett. 10, 1170–1181. doi: 10.1111/j.1461-0248.2007.01117.x
Lohbeck, K. T., Riebesell, U., and Reusch, T. B. H. (2012). Adaptive evolution of a key phytoplankton species to ocean acidification. Nat. Geosci. 5, 346–351. doi: 10.1038/ngeo1441
Matthiessen, B., Eggers, S. L., and Krug, S. A. (2012). High nitrate to phosphorus regime attenuates negative effects of rising pCO 2 on total population carbon accumulation. Biogeosciences 95194, 1195–1203. doi: 10.5194/bg-9-1195-2012
Meyer, J., and Riebesell, U. (2015). Reviews and Syntheses: responses of coccolithophores to ocean acidification?: a meta-analysis. Biogeosciences 12, 1671–1682. doi: 10.5194/bg-12-1671-2015
Moore, C. M., Mills, M. M., Arrigo, K. R., Berman-Frank, I., Bopp, L., Boyd, P. W., et al. (2013). Processes and patterns of oceanic nutrient limitation. Nat. Geosci. 6, 1765. doi: 10.1038/ngeo1765
Oksanen, J., Kindt, R., Legendre, P., Ohara, B., Henry, M., and Maintainer, H. S. (2007). The vegan Package Title Community Ecology Package. Available online at: http://ftp.uni-bayreuth.de/math/statlib/R/CRAN/doc/packages/vegan.pdf (accessed April 17, 2018).
Pardew, J., Blanco Pimentel, M., and Low-Decarie, E. (2018). Predictable ecological response to rising CO 2 of a community of marine phytoplankton. Ecol. Evol. 8, 4292–4302. doi: 10.1002/ece3.3971
Paulton, R. J. L. (1991). The bacterial growth curve. J. Biol. Educ. 25, 92–94. doi: 10.1080/00219266.1991.9655183
Peter, K. H., and Sommer, U. (2015). Interactive effect of warming, nitrogen and phosphorus limitation on phytoplankton cell size. Ecol. Evol. 5, 1011–1024. doi: 10.1002/ece3.1241
Petzoldt, T. (2016). Growthrates: Estimate Growth Rates From Experimental Data. Available online at: https://CRAN.R-project.org/package=growthrates (accessed March 10, 2016).
Reusch, T. B. H., and Boyd, P. W. (2013). Experimental evolution meets marine phytoplankton. Evolution 67, 1849–1859. doi: 10.1111/evo.12035
Reznick, D. N. (2013). A critical look at reciprocity in ecology and evolution: introduction to the symposium. Am. Nat. 181, S1–S8. doi: 10.1086/670030
Riebesell, U. (2004). Effects of CO2 enrichment on marine phytoplankton. J. Oceanogr. 60, 719–729. doi: 10.1007/s10872-004-5764-z
Rost, B., Zondervan, I., and Wolf-Gladrow, D. (2008). Sensitivity of phytoplankton to future changes in ocean carbonate chemistry: current knowledge, contradictions and research directions. Mar. Ecol. Prog. Ser. 373, 227–237. doi: 10.3354/meps07776
Schaum, E., Rost, B., Millar, A. J., and Collins, S. (2012). Variation in plastic responses of a globally distributed picoplankton species to ocean acidification. Nat. Clim. Chang. 3, 298–302. doi: 10.1038/nclimate1774
Scheinin, M., Riebesell, U., Rynearson, T. A., Lohbeck, K. T., and Collins, S. (2015). Experimental evolution gone wild. J. R. Soc. Interf. 12, 1–5. doi: 10.1098/rsif.2015.0056
Schlüter, L., Lohbeck, K. T., Gröger, J. P., Riebesell, U., and Reusch, T. B. H. (2016). Long-term dynamics of adaptive evolution in a globally important phytoplankton species to ocean acidification. Sci. Adv. 2:e1501660. doi: 10.1126/sciadv.1501660
Schlüter, L., Lohbeck, K. T., Gutowska, M. A., Gröger, J. P., Riebesell, U., and Reusch, T. B. H. (2014). Adaptation of a globally important coccolithophore to ocean warming and acidification. Nat. Clim. Chang. 4, 1024–1030. doi: 10.1038/nclimate2379
Schoener, T. W. (2011). The newest synthesis: understanding the interplay of evolutionary and ecological dynamics. Science 331, 426–429. doi: 10.1126/science.1193954
Shapiro, S. S., and Wilk, M. B. (1965). An analysis of variance test for normality (Complete Samples). Biometrika 52:591. doi: 10.2307/2333709
Soetaert, K., Petzoldt, T., and Setzer, R. W. (2010). Solving differential equations in R: package desolve. J. Stat. Softw. 33, 1–25. doi: 10.18637/jss.v033.i09
Sommer, U. (1984). The paradox of the plankton: Fluctuations of phosphorus availability maintain diversity of phytoplankton in flow-through cultures. Limnol. Oceanogr. 29, 633–636. doi: 10.4319/lo.1984.29.3.0633
Sommer, U., Paul, C., and Moustaka-Gouni, M. (2015). Warming and ocean acidification effects on phytoplankton - From species shifts to size shifts within species in a mesocosm experiment. PLoS One 10:125239. doi: 10.1371/journal.pone.0125239
Thomas, M. K., Aranguren-Gassis, M., Kremer, C. T., Gould, M. R., Anderson, K., Klausmeier, C. A., et al. (2017). Temperature-nutrient interactions exacerbate sensitivity to warming in phytoplankton. Glob. Chang. Biol. 23, 3269–3280. doi: 10.1111/gcb.13641
Tilman, D. (1977). Resource competition between plankton algae: an experimental and theoretical approach. Ecology 58, 338–348. doi: 10.2307/1935608
Tyrrell, T., and Merico, A. (2004). “Emiliania huxleyi: bloom observations and the conditions that induce them,” in Coccolithophores, eds H. R. Thierstein and J. R. Young (Berlin: Springer), 75–97. doi: 10.1007/978-3-662-06278-4_4
Keywords: eco-evolutionary interaction, CO2, ocean acidification, competition, phytoplankton, C. affinis, E. huxleyi, species interaction
Citation: Listmann L, Hattich GSI, Matthiessen B and Reusch TBH (2020) Eco-Evolutionary Interaction in Competing Phytoplankton: Nutrient Driven Genotype Sorting Likely Explains Dominance Shift and Species Responses to CO2. Front. Mar. Sci. 7:634. doi: 10.3389/fmars.2020.00634
Received: 27 March 2020; Accepted: 10 July 2020;
Published: 31 July 2020.
Edited by:
Alexander Mikaelyan, P.P. Shirshov Institute of Oceanology (RAS), RussiaReviewed by:
Sven Alexander Kranz, Florida State University, United StatesCopyright © 2020 Listmann, Hattich, Matthiessen and Reusch. This is an open-access article distributed under the terms of the Creative Commons Attribution License (CC BY). The use, distribution or reproduction in other forums is permitted, provided the original author(s) and the copyright owner(s) are credited and that the original publication in this journal is cited, in accordance with accepted academic practice. No use, distribution or reproduction is permitted which does not comply with these terms.
*Correspondence: Luisa Listmann, bHVpc2EubGlzdG1hbm5AdW5pLWhhbWJ1cmcuZGU=
†These authors share first authorship
‡These authors share last authorship
Disclaimer: All claims expressed in this article are solely those of the authors and do not necessarily represent those of their affiliated organizations, or those of the publisher, the editors and the reviewers. Any product that may be evaluated in this article or claim that may be made by its manufacturer is not guaranteed or endorsed by the publisher.
Research integrity at Frontiers
Learn more about the work of our research integrity team to safeguard the quality of each article we publish.