 Marine Fourrier1*
 Laurent Coppola1,2
 Hervé Claustre1
 Fabrizio D’Ortenzio1
 Raphaëlle Sauzède2
 Jean-Pierre Gattuso1,3
- 1Sorbonne Université, CNRS, Laboratoire d’Océanographie de Villefranche, Villefranche-sur-Mer, France
- 2Sorbonne Université, CNRS, Institut de la Mer de Villefranche, Villefranche-sur-Mer, France
- 3Institute for Sustainable Development and International Relations, Sciences Po, Paris, France
A regional neural network-based method, “CANYON-MED” is developed to estimate nutrients and carbonate system variables specifically in the Mediterranean Sea over the water column from pressure, temperature, salinity, and oxygen together with geolocation and date of sampling. Six neural network ensembles were developed, one for each variable (i.e., three macronutrients: nitrates (NO), phosphates (PO) and silicates (SiOH4), and three carbonate system variables: pH on the total scale (pHT), total alkalinity (AT), and dissolved inorganic carbon or total carbon (CT), trained using a specific quality-controlled dataset of reference “bottle” data in the Mediterranean Sea. This dataset is representative of the peculiar conditions of this semi-enclosed sea, as opposed to the global ocean. For each variable, the neural networks were trained on 80% of the data chosen randomly and validated using the remaining 20%. CANYON-MED retrieved the variables with good accuracies (Root Mean Squared Error): 0.78 μmol.kg–1 for NO, 0.043 μmol.kg–1 for PO and 0.71 μmol.kg–1 for Si(OH)4, 0.014 units for pHT, 13 μmol.kg–1 for AT and 12 μmol.kg–1 for CT. A second validation on the ANTARES independent time series confirmed the method’s applicability in the Mediterranean Sea. After comparison to other existing methods to estimate nutrients and carbonate system variables, CANYON-MED stood out as the most robust, using the aforementioned inputs. The application of CANYON-MED on the Mediterranean Sea data from autonomous observing systems (integrated network of Biogeochemical-Argo floats, Eulerian moorings and ocean gliders measuring hydrological properties together with oxygen concentration) could have a wide range of applications. These include data quality control or filling gaps in time series, as well as biogeochemical data assimilation and/or the initialization and validation of regional biogeochemical models still lacking crucial reference data. Matlab and R code are available at https:// github.com/MarineFou/CANYON-MED/.
Introduction
The global ocean currently absorbs around 25% of anthropogenic carbon dioxide (CO2) from the atmosphere, therefore playing a crucial role in buffering the effects of climate change (Le Quéré et al., 2018). This role is likely to be modified by ocean warming and acidification, having complex impacts on marine ecosystems and organisms (Gattuso and Hansson, 2011). To better understand the underlying processes and anticipate changes, a large number of variables have to be observed in order to gain a more accurate overall picture. In this context, the “Framework for Ocean Observing” (FOO, Lindstrom et al., 2012) was designed to coordinate the ocean observing community’s efforts and maintain a sustained Global Ocean Observing System (GOOS) (Tanhua et al., 2019). This framework is organized around Essential Ocean Variables (EOVs; GOOS, 2018), chosen to balance the feasibility of their measurement with their societal and scientific relevances. The sustained measurement of key EOVs helps fill the gaps in our understanding of the ocean.
Historically, measurements have come from oceanographic cruises and from continuous measurements at fixed stations (buoys and moorings) (Chai et al., 2020). However, the low spatial and temporal resolutions of these sampling platforms have resulted in chronic under-sampling of biogeochemical variables, creating “observational gaps” (Tanhua et al., 2019; Weller et al., 2019; Chai et al., 2020). Today, technological advances (miniaturization of sensors, automation of measurements) have made it possible to develop a network of autonomous platforms such as profiling floats (Riser et al., 2016; Roemmich et al., 2019; Claustre et al., 2020) and ocean gliders (Testor et al., 2019). These platforms provide measurements of physical and biogeochemical variables at much higher spatial and temporal resolutions in regions or seasons otherwise difficult to access. These active autonomous networks have thus contributed to the progressive densification of databases of key variables at global scale (Abram et al., 2019). Some variables are presently almost systematically measured regardless of the acquisition platform, for instance physical data (temperature, salinity, pressure) and dissolved oxygen concentration (O2). However, measurements from these autonomous platforms remain limited to a small type of biogeochemical variables, owing to the high cost of some sensors and technological limitations (Bittig et al., 2019; Chai et al., 2020).
Machine learning methods represent a promising way to fill these “observational gaps”. They have the potential to predict, from variables systematically measured by autonomous platforms, variables still difficult to measure accurately and cost-effectively with these platforms (e.g., Gregor et al., 2019). Transfer functions such as multiple linear regressions (e.g., Velo et al., 2013; Carter et al., 2018) have therefore been developed to estimate biogeochemical variables. Neural network methods, known to be universal substitutes for any differentiable and continuous function (Hornik et al., 1989), have been also applied to complex data sets in oceanography (e.g., estimation of the variability of the global ocean carbon sink (Landschützer et al., 2014), detection of phytoplankton groups in open ocean waters (Ben Mustapha et al., 2014).
O2 is a key EOV in oceanography (GOOS, 2018). It is widely and increasingly measured on autonomous platforms, with measurement accuracies close to those obtained by Winkler titration of discrete samples (Bittig and Körtzinger, 2015). The O2 concentration results from the balance between exchanges at the ocean-atmosphere interface, mixing and ventilation (Körtzinger et al., 2004; Piron et al., 2016, 2017; Coppola et al., 2018), solubility (dependent on temperature and salinity), and biological processes such as primary production and respiration (Robinson, 2019). Furthermore, O2 is linked to nutrients and inorganic carbon via Redfield’s stoichiometric ratios (Redfield, 1934). Therefore, based on the role of O2 in remineralization and carbon fixation, Sauzède et al. (2017) have developed neural network-based methods to retrieve carbon and nutrient variables in the global ocean. They use O2, temperature, salinity, pressure, longitude and latitude, day of the year and year as input variables to predict the concentrations of three macronutrients [nitrates (NO), phosphates (PO), silicates (SiOH4)] as well as carbonate system variables [total alkalinity (AT), total dissolved inorganic carbon (CT), pH on the total scale (pHT), and CO2 partial pressure (pCO2)]. This method referred to as CANYON for “CArbonate system and Nutrients concentration from hYdrological properties and Oxygen using a Neural network” predicts these key oceanographic variables, which cannot be measured independently or with sufficient accuracy, with much improved temporal and spatial resolution (Chai et al., 2020). This method as well as its subsequent improvement, CANYON-B (Bittig et al., 2018), were trained on high-quality data collected over the past thirty years (the GLODAPv2 for Global Ocean Data Analysis Project version 2 database; Olsen et al., 2016). One of its potential applications is to generate virtual carbon and nutrients estimates from the large amount of data acquired by the Biogeochemical-Argo float array (BGC-Argo; Johnson and Claustre, 2016; Claustre et al., 2020).
The Mediterranean Sea is a semi-enclosed marginal sea characterized by high salinities and a rapid overturning circulation, rendering it capable of absorbing more CO2 than adjacent oceanic regions (Schneider et al., 2010; Lee et al., 2011; Touratier and Goyet, 2011; Álvarez et al., 2014). Machine learning methods produce better results when trained on datasets representative of the considered case study. Therefore, both CANYON and CANYON-B approaches may underperform in this specific oceanic region making a regionalization of this approach highly desirable. Furthermore, the Mediterranean Sea is also a low nutrient concentration basin (McGill, 1966; Krom et al., 1991) with an eastward-increasing oligotrophy gradient. Nutrients are particularly important as tracers of biological cycles, biomass production, and natural and anthropogenic inputs (Béthoux, 1989; Béthoux et al., 1992). Through its rapid response to external conditions relative to other oceans (Crispi et al., 2001), the Mediterranean Sea is considered as a good indicator of global shorter-scale ocean processes and is therefore defined as a “hot spot” for climate change (Giorgi, 2006; Diffenbaugh et al., 2007). This “miniature ocean” (Millot and Taupier-Letage, 2005) is particularly relevant for the study of biogeochemical cycles because of its molar ratios of nutrients very distinct from those of other oceanic regions (Ribera d’Alcalà et al., 2003; Krom et al., 2005; Pujo-Pay et al., 2011; Pasqueron de Fommervault et al., 2015). Additionally, the high amount of data from BGC-Argo floats and observing programs (e.g., MOOSE, NAOS) emphasize the need for a regionalized approach, specific to the Mediterranean Sea, to fully take advantage of these observing systems and platforms (Tintoré et al., 2019).
In this paper, we present the regional downscaling of the CANYON method for the Mediterranean Sea, CANYON-MED. A database of in situ measurements has been specifically assembled to constitute a new quality-controlled dataset used to train the regional neural networks. Neural network ensembles were trained and their results are compared to single neural network architectures. The resulting optimized CANYON-MED networks are validated with an independent dataset and compared to existing methods available for nutrients and carbonate system variables prediction in the Mediterranean Sea.
Materials and Methods
Available Datasets
Training and Validation Datasets
The CARIMED (CARbon in the MEDiterranean Sea) data synthesis initiative (Sanleón-Bartolomé et al., 2017) aims to produce a consistent quality-controlled database for carbon relevant variables from hydrographic cruises covering the whole water column and the different basins of the Mediterranean Sea. As the validation of CARIMED data is still in progress, we performed secondary quality control through visual inspection of the profiles and by comparison with literature values, to remove outliers. After applying similar quality control, the data from ten other cruises were added to the database (i.e., CARBOGIB, CASCADE, DEWEX, GIFT, MOOSE_GE 2011, MOOSE_GE 2013, MOOSE_GE 2015, PACIFIC-CELEBES, SOMBA, MSM72; Table 1). The spatial coverage of the complete dataset is shown in Figure 1.
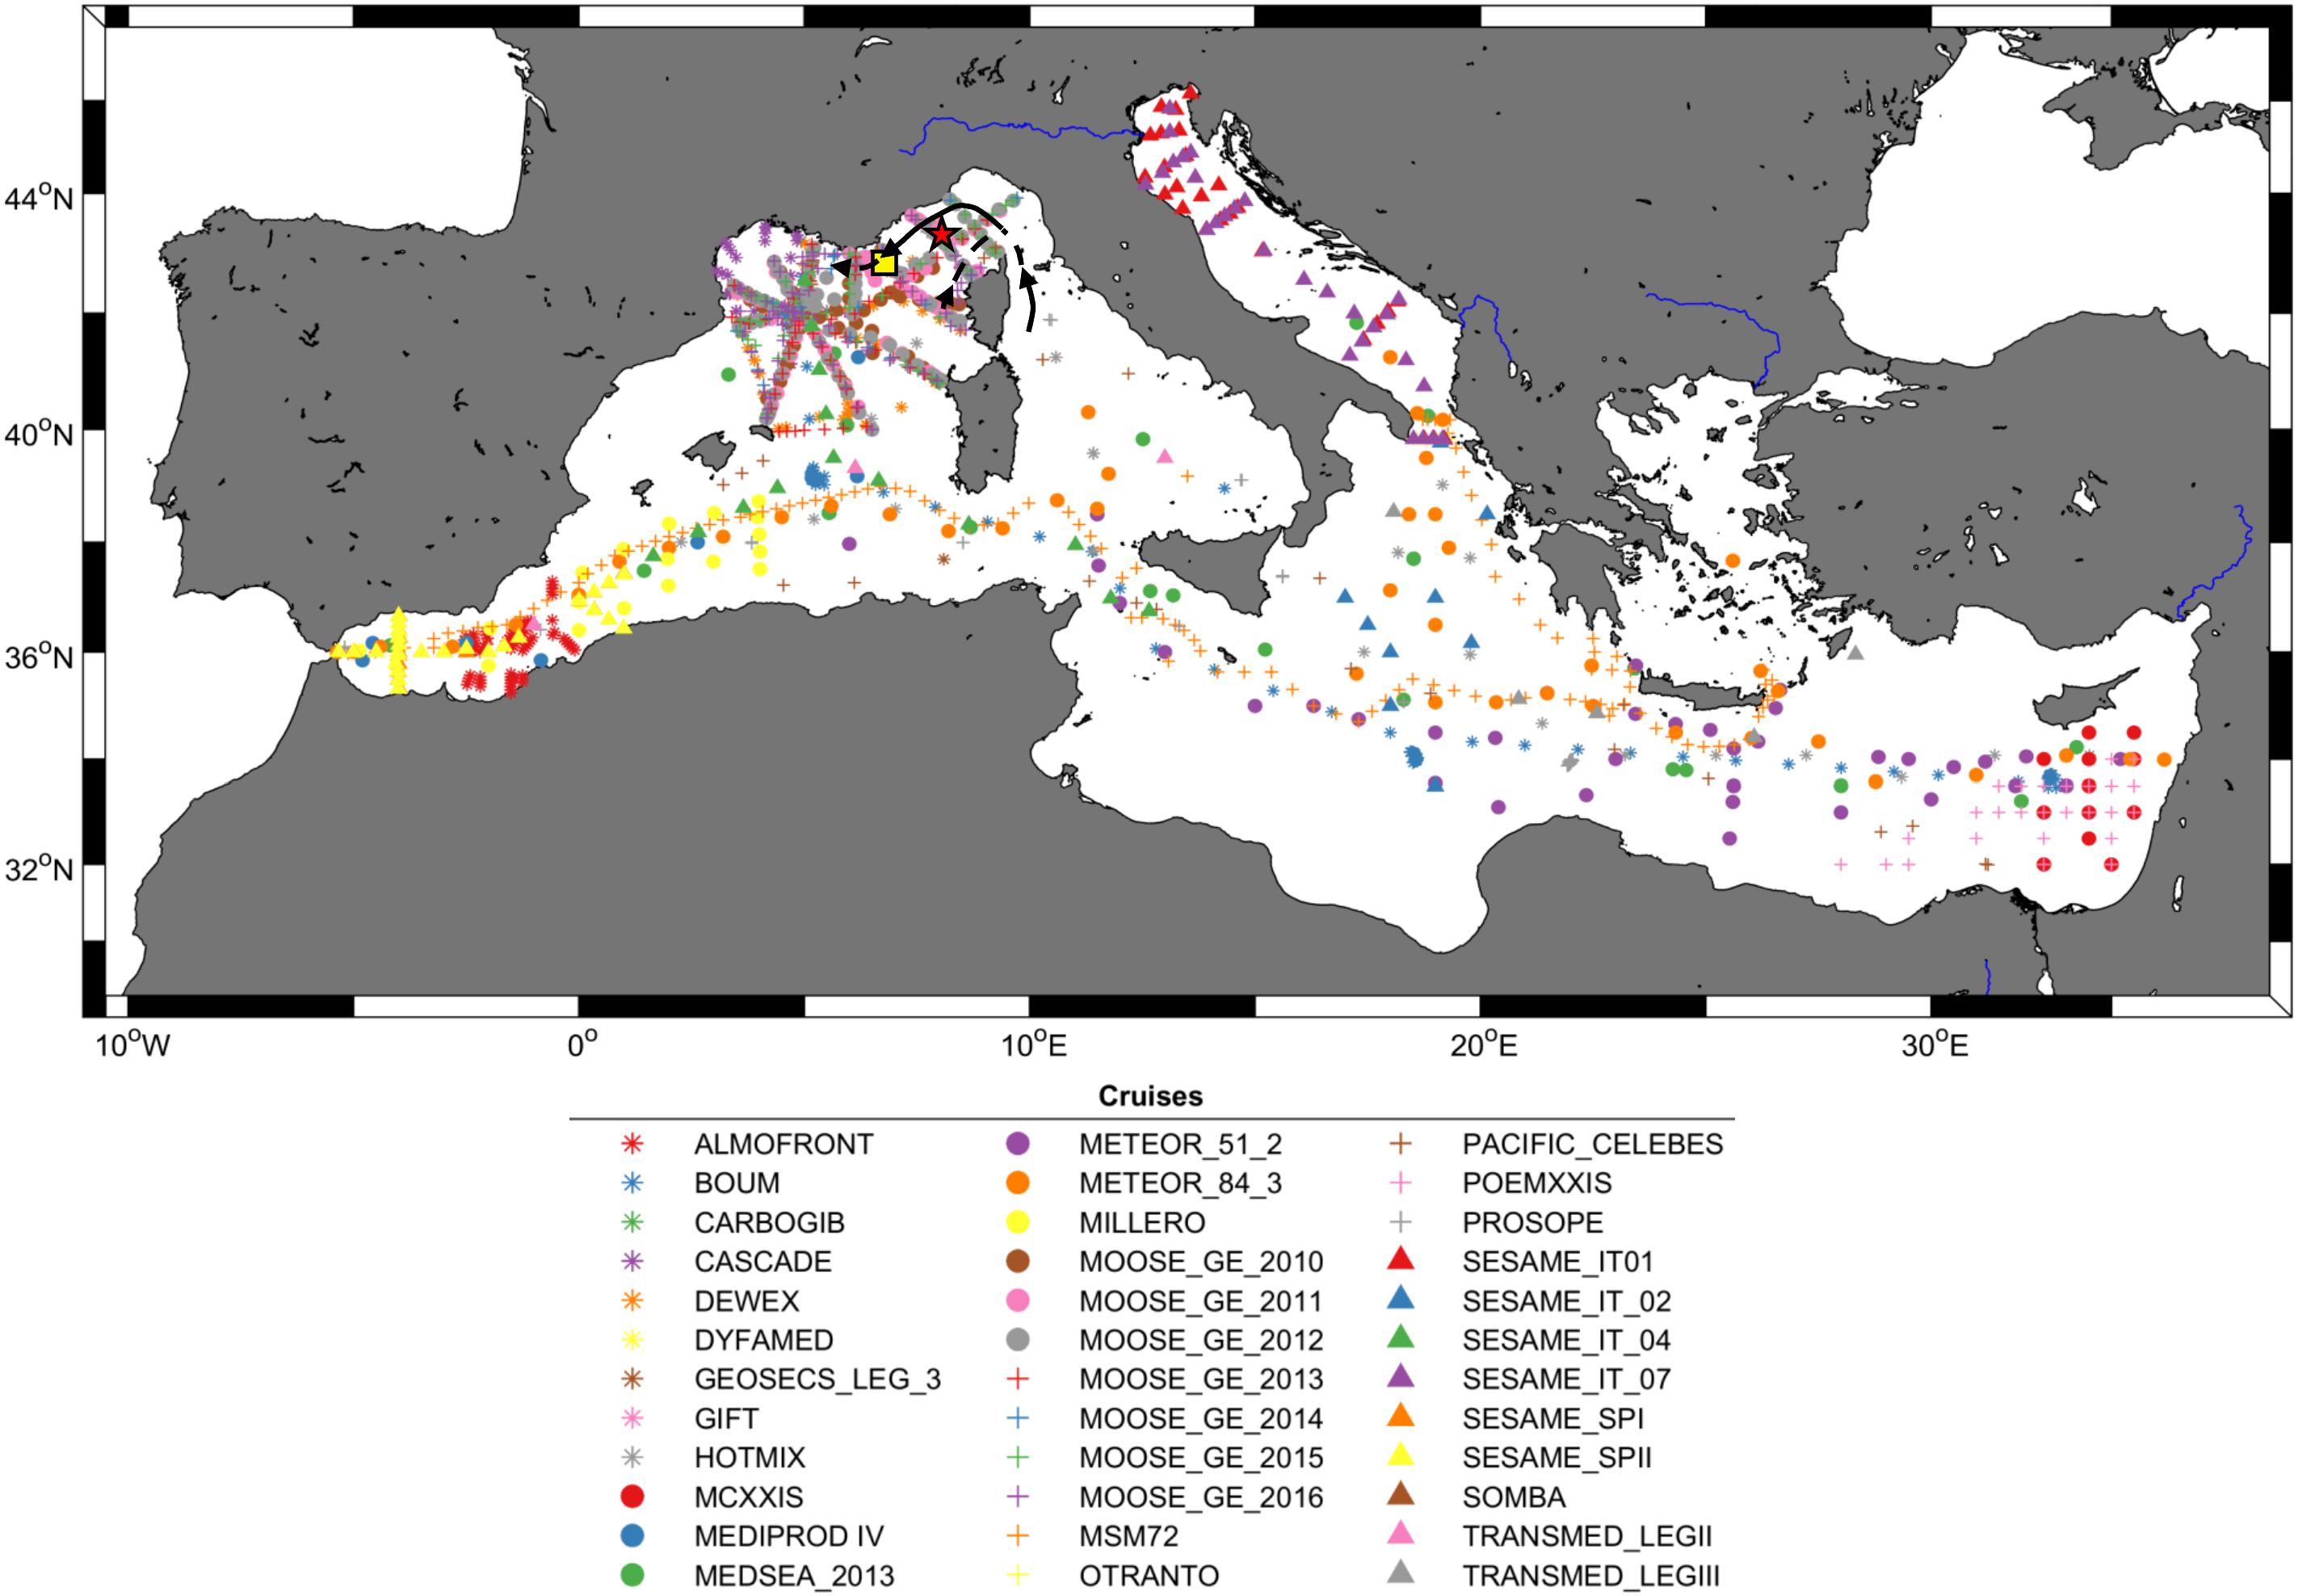
Figure 1. Location of the 35 cruises used in this study, and of the DYFAMED (red star) and ANTARES (yellow square) sites in the Ligurian Sea, Northwestern Mediterranean, with a schematic representation of the North Current circulation in surface (black arrows). The DYFAMED time series and the 35 cruises constitute the training dataset whereas the ANTARES time series is used for validation.
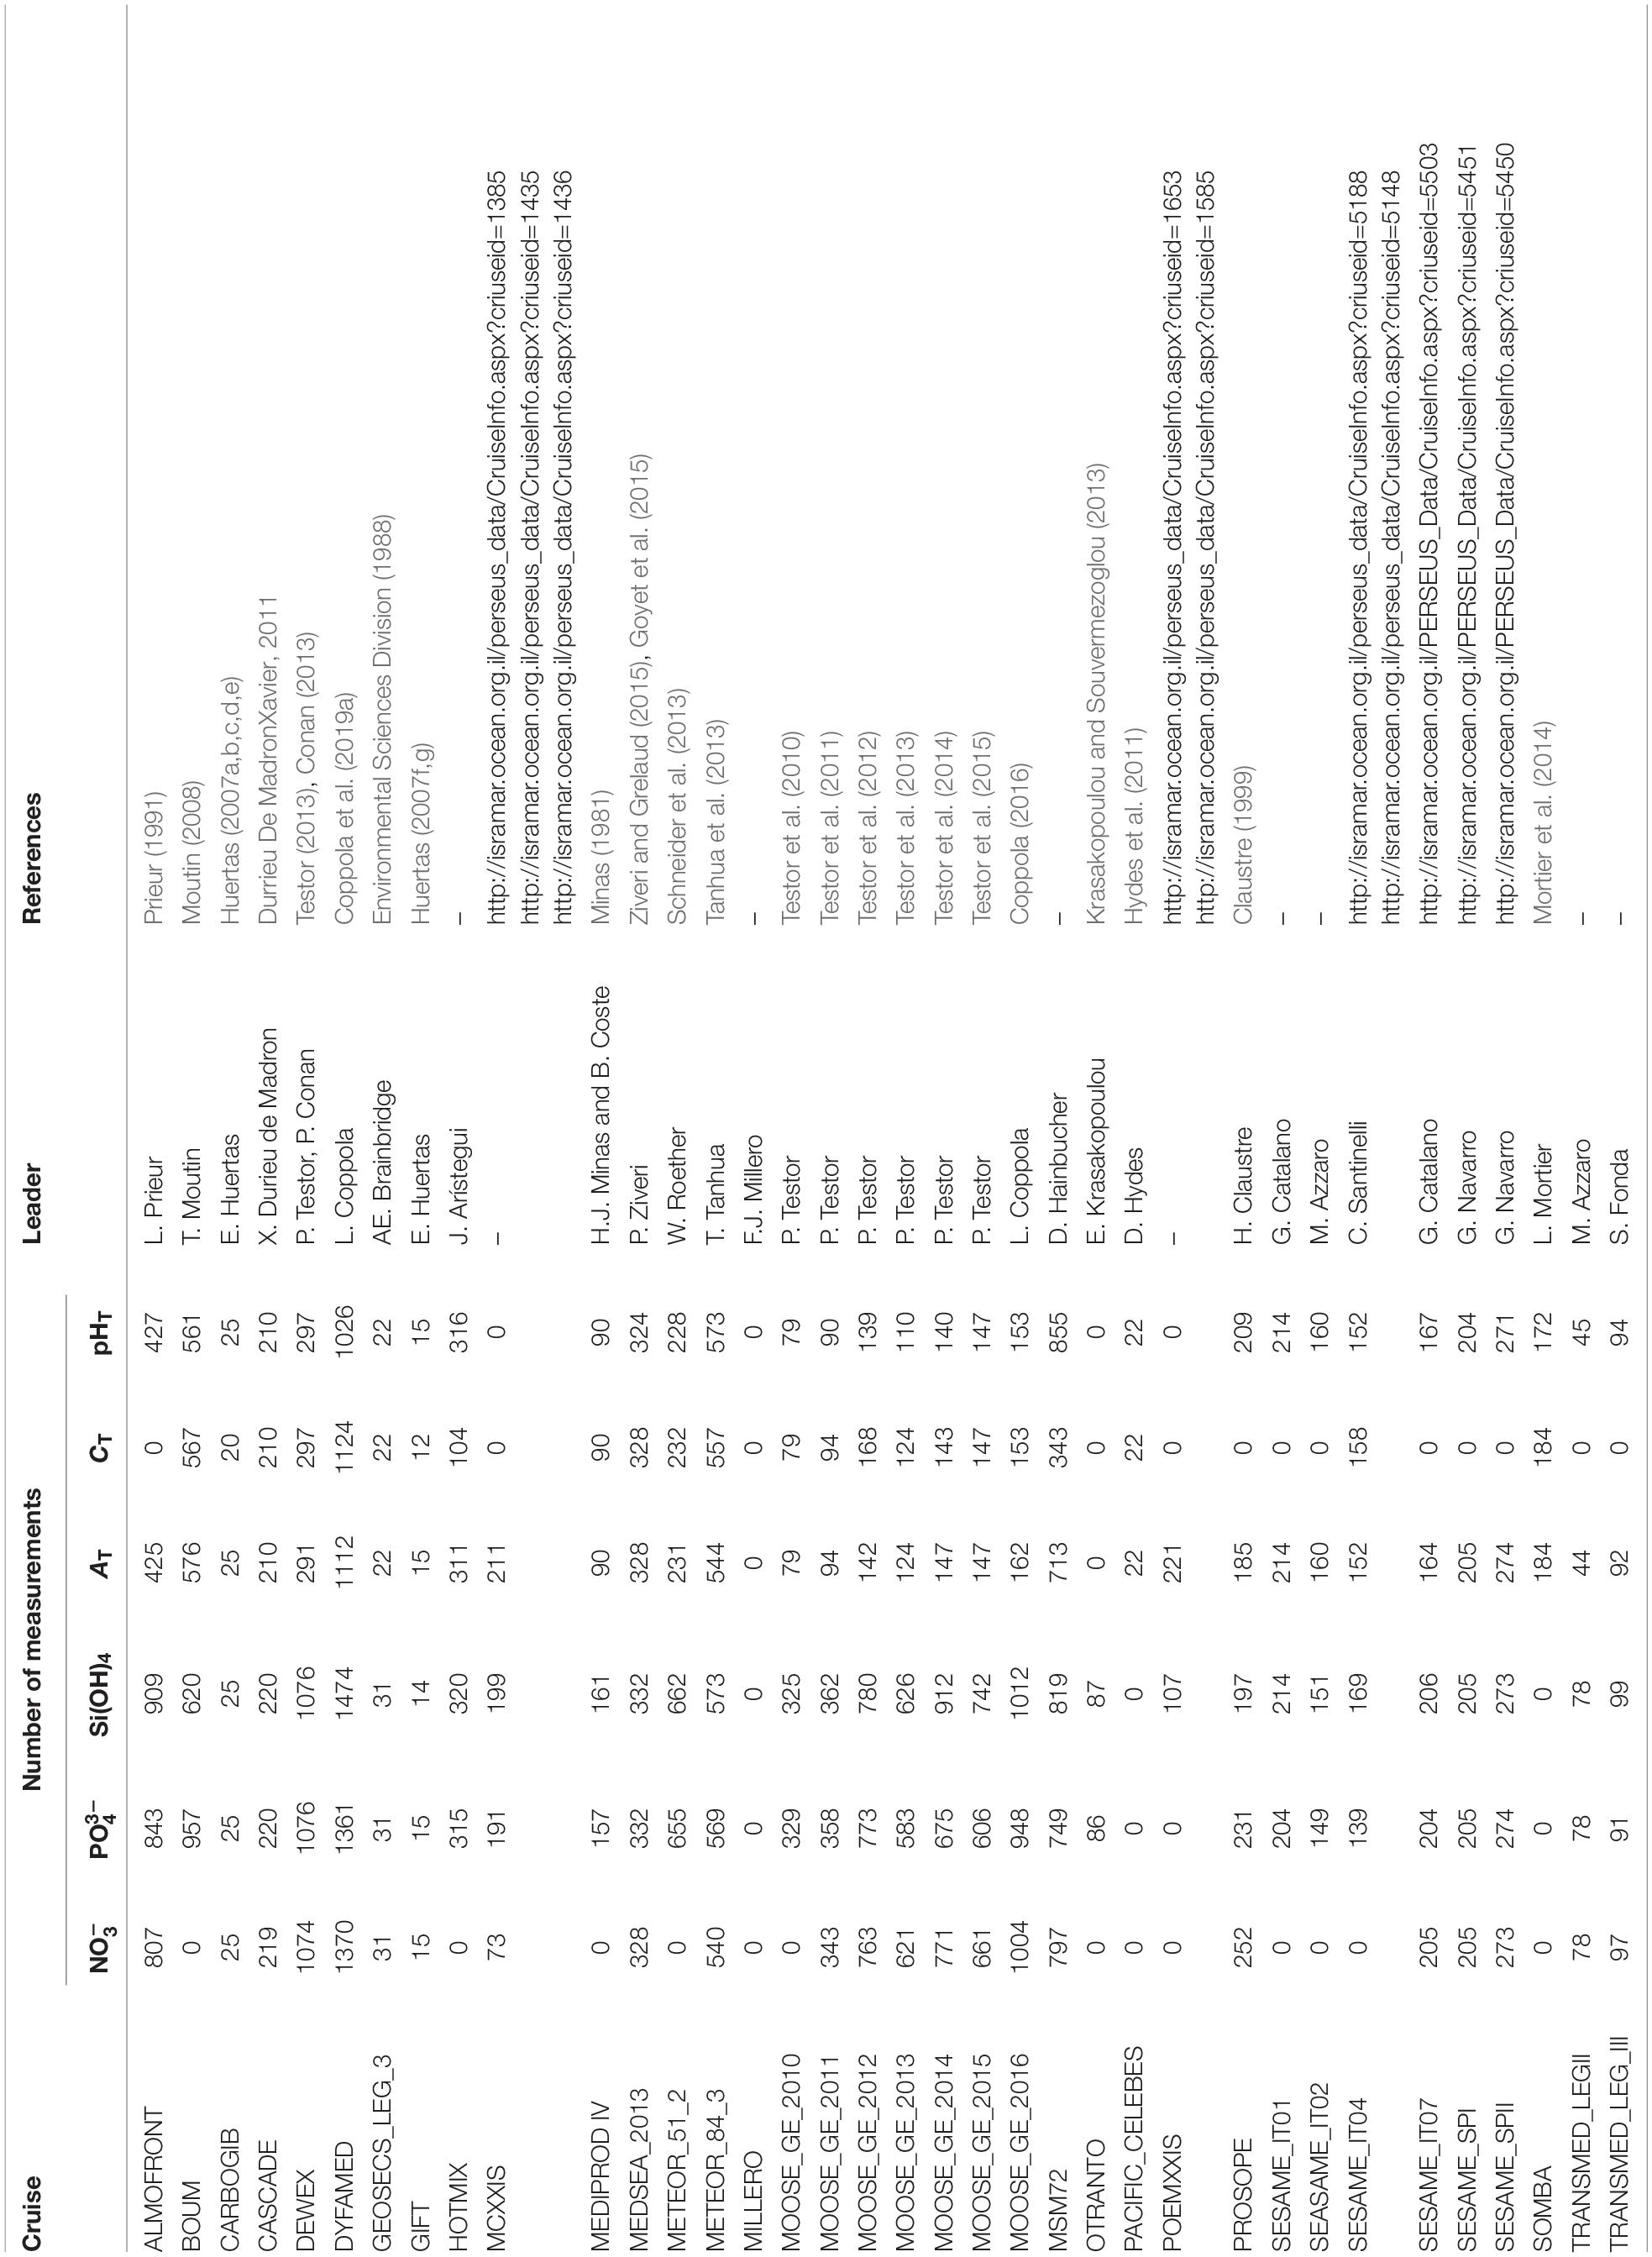
Table 1. List of cruises, principal investigators, references (when available), and the number of data for each variable of interest [NO, PO, Si(OH)4, AT, CT, pHT] in our database.
The DYFAMED site (Coppola et al., 2019a) is located in the Ligurian Sea (43°25′N, 7°52′E, water depth of 2350 m; red star in Figure 1). It is surrounded by the permanent geostrophic Ligurian frontal jet flow caused by the Northern Current’s cyclonic circulation, separating the sampling area from coastal inputs by a density gradient (Millot, 1999; Niewiadomska et al., 2008). Monthly cruises are performed over the whole water column since 1991 and included in the MOOSE network since 2010 (Marty et al., 2002; Coppola et al., 2019b). This is the longest open sea time series in the Mediterranean Sea in terms of O2, nutrients and carbonate system measurements that led to a homogeneous and calibrated data set with well-described seasonality of these variables (Copin-Montégut and Bégovic, 2002; Marty et al., 2002; Pasqueron de Fommervault et al., 2015; Coppola et al., 2018).
The dataset gathered for this study (Table 1) therefore includes 35 oceanic cruises and a time series, from 1976 to 2018 with samples from the surface to 4600 m depth of core variables such as O2, temperature, salinity as well as macronutrients [nitrates: NO, phosphates: PO, silicates: Si(OH)4] and carbonate system variables (total alkalinity: AT, total carbon or dissolved inorganic carbon: CT, and pH on the total scale: pHT). When AT and CT were available, pHT was calculated using CO2SYS-MATLAB (Lewis et al., 1998; van Heuven et al., 2011). This dataset is openly accessible (Fourrier, 2020). Thermodynamic calculations within the carbonate system used the carbonic acid dissociation constants of Mehrbach et al. (1973) as refit by Dickson and Millero (1987), the dissociation constant for bisulfate of Dickson (1990) and Uppström (1974) for the ratio of total boron to salinity. These constants were used to ensure consistency with pHT units in some of the data sets compiled.
Independent Validation Dataset
The ANTARES site is located in the Ligurian Sea (42°48′N, 06° 05′E, water depth of 2500 m; yellow square in Figure 1). It is visited monthly since 2010 and integrated into the MOOSE network (Lefevre, 2010). This time series extends from 2009 to 2018 for ancillary data, O2, nutrients, and from 2009 to 2017 for AT and CT. pHT was computed as described in section “Training and Validation Datasets.” However, O2 measurements are lacking prior to 2011, restricting the use of the data in this study to the period 2011–2018.
For the whole dataset and after quality control, the distribution of observations per year and month (Figure 2) demonstrates the systematic under-representation of winter months (which are quite exclusively sampled thanks to the DYFAMED time series), as well as the difference in coverage according to year and variable of interest, such as the lower number of CT and pHT data.
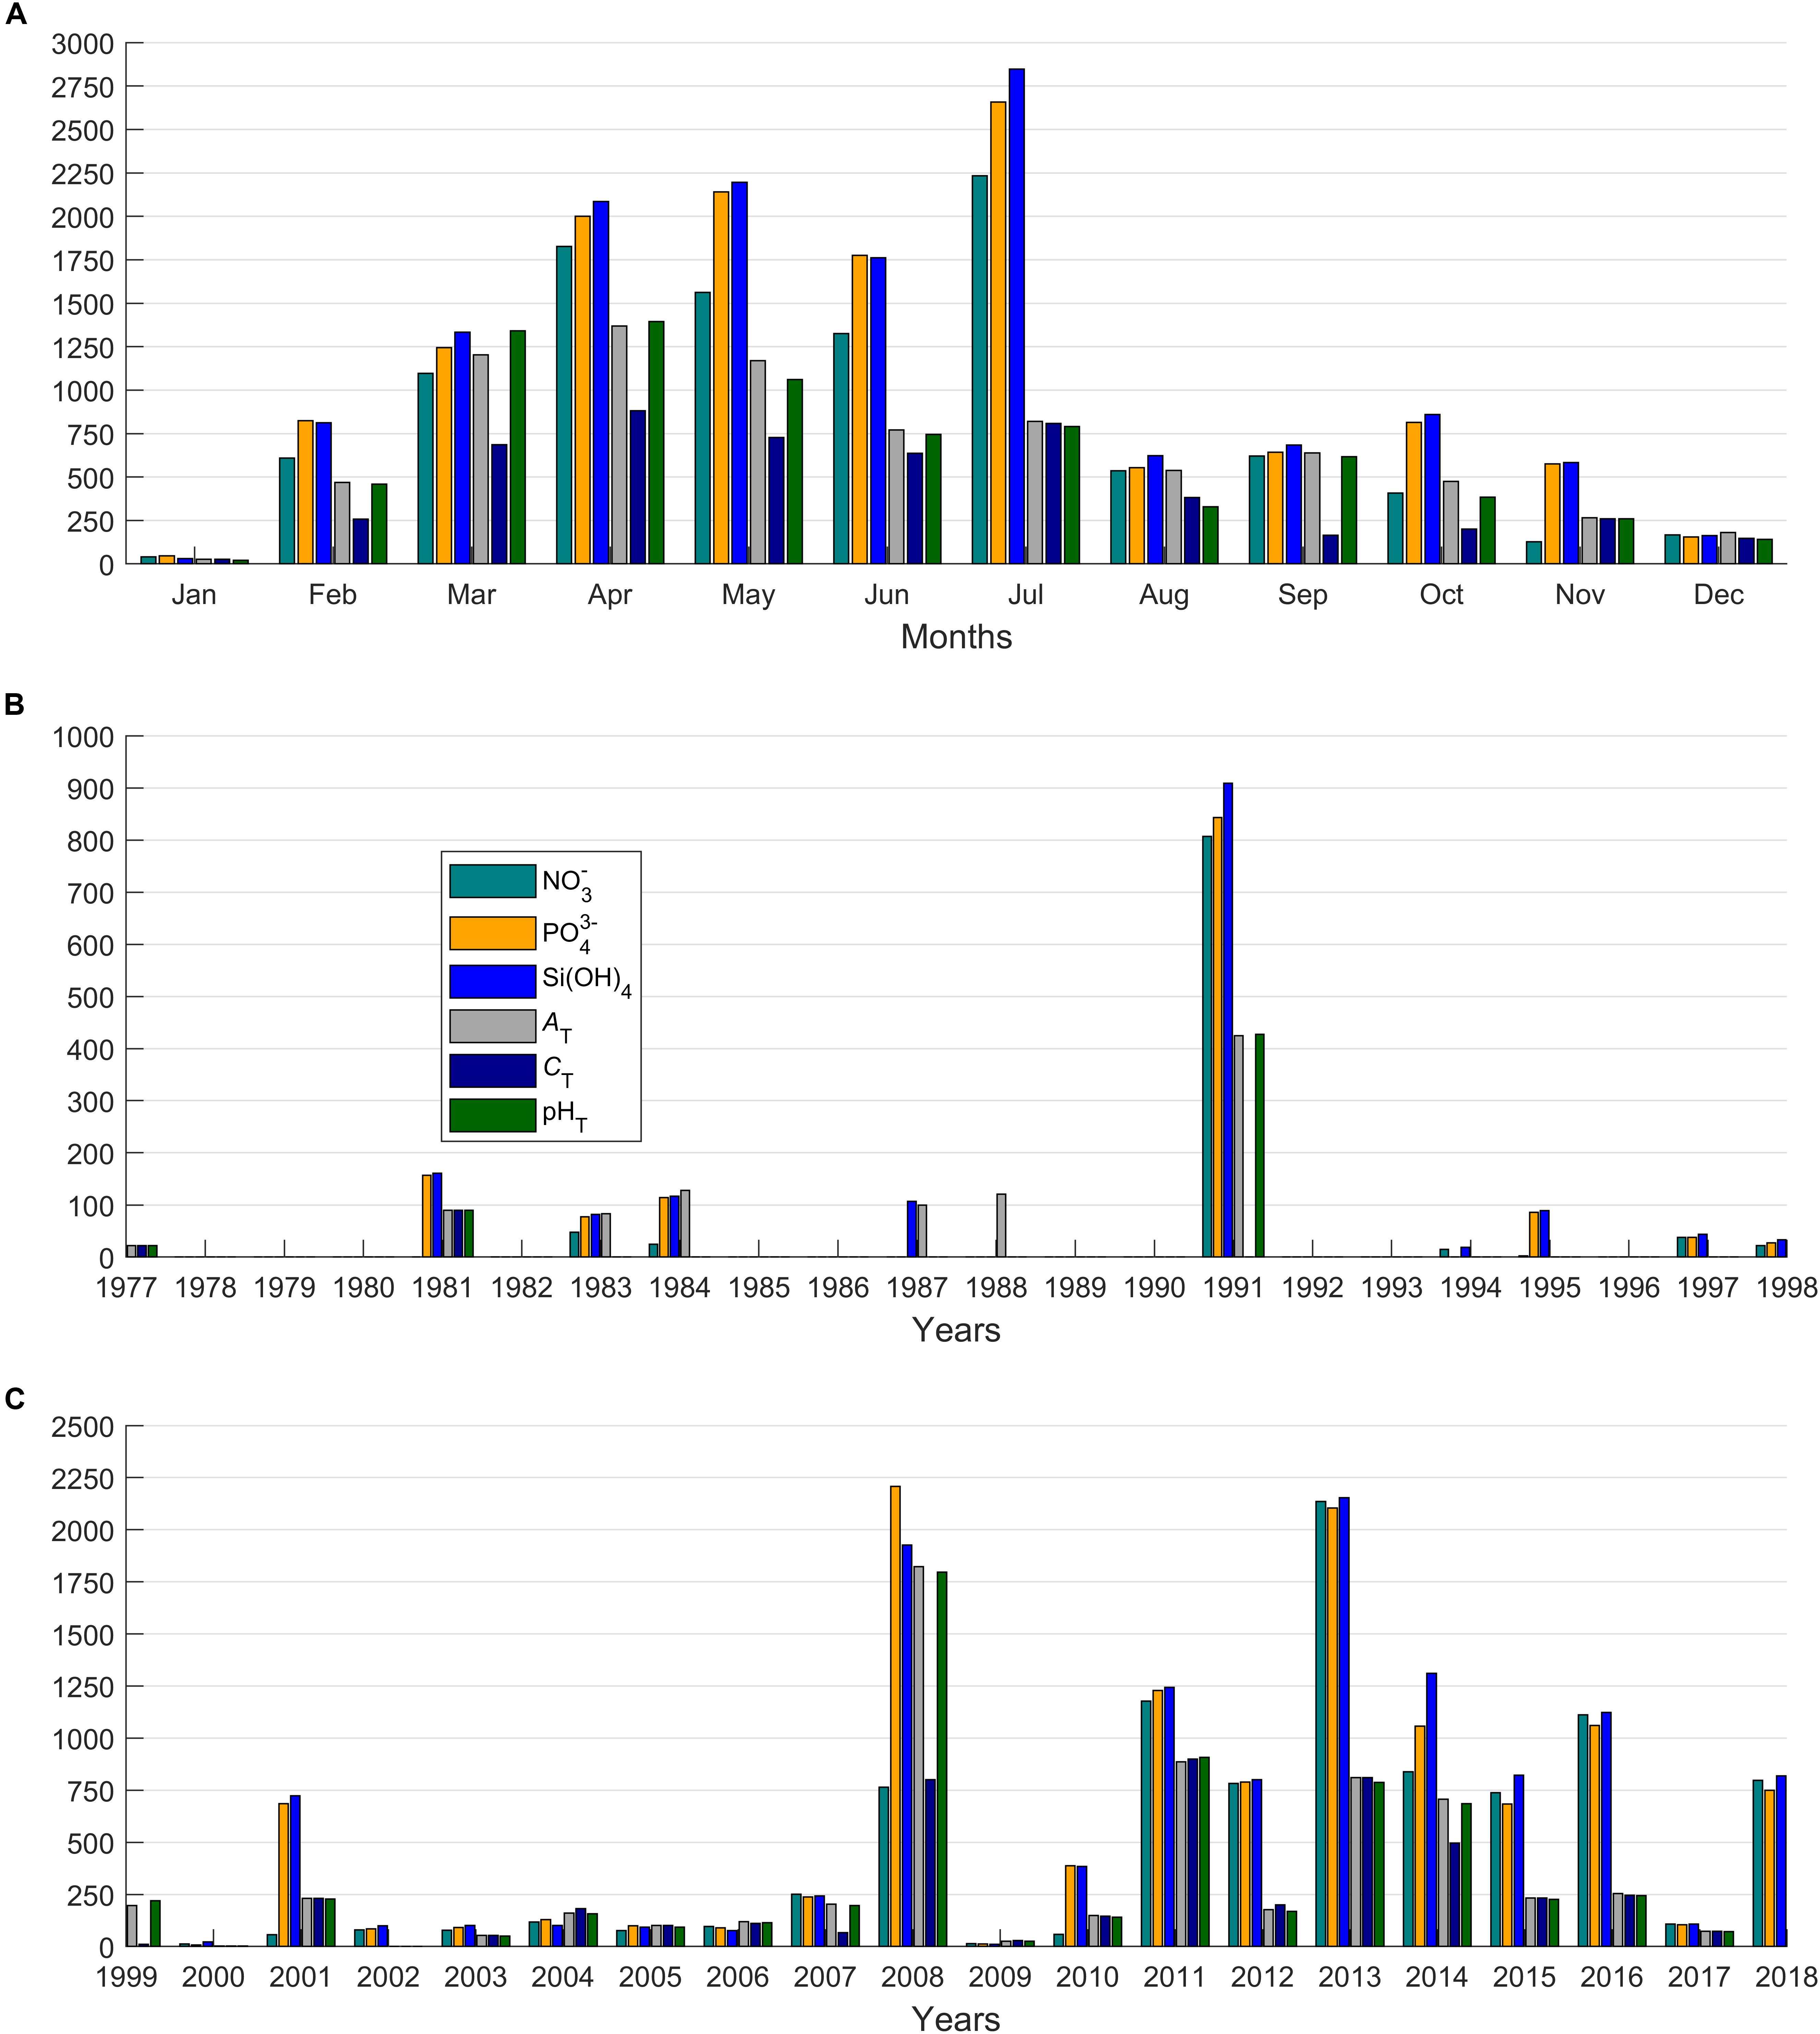
Figure 2. Distribution of sample numbers (A) per month and (B,C) per year provided by the scientific cruises, after quality control. Note the difference in the y-axis for the early distributions.
Neural Network Development
Artificial Neural Networks (ANNs) are approximate functions adapted to any dataset (Marzban, 2009). One of the main advantages of these methods is their ability to recognize and exploit relationships in data that are not predefined (unlike regression techniques) and do not need to be made explicit by equations (Marzban, 2009). This makes them particularly suitable for mapping non-linear relationships, provided that data are sufficiently available to “train” the neural network (Lefevre et al., 2005). Similarly to Sauzède et al. (2017) and Bittig et al. (2018) for CANYON and CANYON-B, respectively, an iterative statistical learning-based method, and more specifically an ANN was developed to predict carbon and nutrient variables.
Separate the learning data into a training dataset for training the machine learning method and a validation dataset used to assess the performance of the trained method is a common practice. It ensures that the model can produce reliable estimates outside the range of learning data (generalization capabilities) (Bishop, 1995). In the present paper, the dataset was randomly split according to the proportions of 80% and 20% for training and validation sets, respectively. Additionally, an external dataset was also used to further validate the ANNs.
Multi-Layered Perceptron
Among the different types of ANNs available, Multi-Layered Perceptron (MLP; Rumelhart et al., 1986; Bishop, 1995) using a backpropagation algorithm (Bishop, 1995; Hagan et al., 2014) has been chosen for its properties as universal approximator of any continuous and derivable function (Hornik et al., 1989). A MLP is an ANN organized in several layers (i.e., input, hidden and output layers) containing neurons that are connected to each other and able to exchange information through their connections (Figure 3). These connections are directional, and each connection is associated with a real number, called the “weight”. The information is transmitted from one neuron to another through the weights that are readjusted iteratively during the training phase to minimize the difference between MLP outputs and observations.
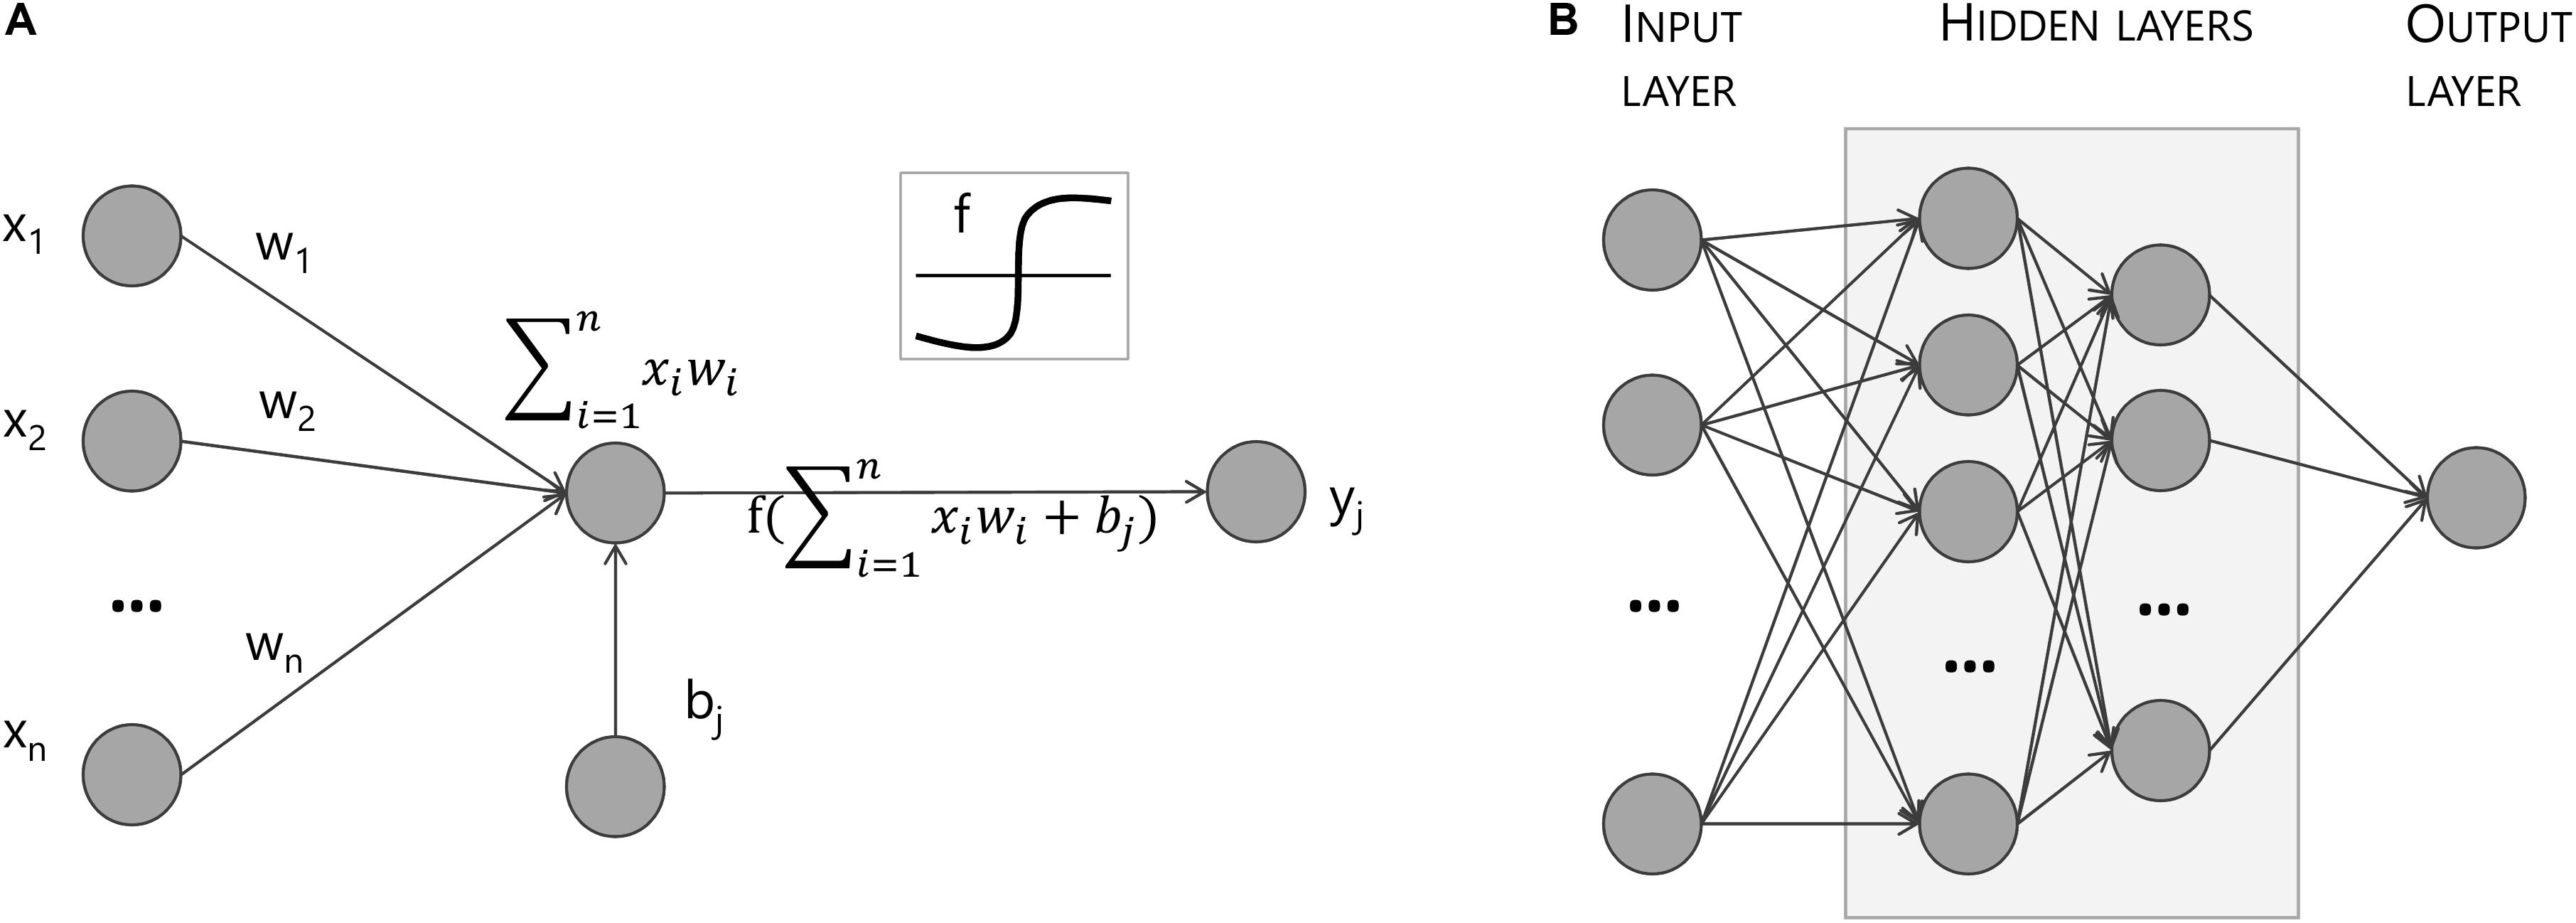
Figure 3. Schematic representation of the signal-flow of a perceptron (A) and a Multi-Layered Perceptron (B). The inputs are connected to a neuron and each connection is associated with a weight “w.” The output is produced by combining the inputs and weights and adding the neuron’s bias “bj” before going through a sigmoid activation function “f.” A Multi-Layered Perceptron is composed of multiple neurons in hidden layers combined in the same manner to produce a single output.
MLPs use an activation function between the neurons (here the sigmoid function f (Figure 3), with A and α equal to 4/3 and 1.7159, respectively) to ensure a quasi-linear behavior between −1 and 1 (Jamet, 2004; Sauzède et al., 2017):
The backpropagation algorithm used for the MLP (Bishop, 1995) can be divided into two steps. First, the forward propagation of a stimulus (from the inputs) through the MLP generates an output. Second, the errors are propagated backward from the output through the MLP to change the weights in the opposite direction to the error gradient.
The input data were normalized to have an average of zero and a standard deviation of one using the mean and standard deviation of the training data to improve convergence (Goodfellow et al., 2016) and to prevent neural networks saturation (caused by the difference in the range of the different input variables) according to:
Where x, , and σ are, respectively, the input data, their mean and their standard deviation. The factor 2/3 brings at least 80% of the data in the range [−1;1] (Jamet et al., 2012).
In order to improve the generalization capabilities of the ANNs, Bayesian regularization (Bishop, 1995) was used. This method minimizes over-fitting by considering the goodness of fit as well as the network architecture. The training algorithm used was a supervised iterative training method updating weights according to Levenberg-Marquardt optimization (Linares-Rodriguez et al., 2013). This algorithm was chosen because it is better suited for function fitting and does not require excessive computing time and power, while still appropriately generalizing (Beale et al., 2018). To avoid falling to a local minimum, a linear combination of weights and quadratic errors was minimized through gradient descent, and multiple initializations with random weights were performed. Then, to determine the appropriate combination of weights and errors, Bayesian regularization was used. This allowed the generalization of the neural network through the optimization of the linear combination of weights and errors (MacKay, 1992a, b; Foresee and Hagan, 1997; Hagan et al., 2014). The Matlab Neural Network Toolbox, and more specifically the algorithm “trainbr,” has been chosen for the ANN implementation. The ANN optimal architecture or topology (number of inputs, outputs, number of hidden layers and neurons in each hidden layer) hinges on the complexity of the relations between inputs and outputs. After testing several different configurations through a trial-and-error process, the topologies for neural networks producing the best results were determined with 2 hidden layers and a number varying between 15 and 50 neurons for the first layer and between 8 and 30 for the second hidden layer.
ANN Ensemble Model
The robustness and reliability of an ANN can be significantly improved by combining several ANNs into an ANN ensemble model (Sharkey, 1999; Linares-Rodriguez et al., 2013). The construction of an ANN ensemble is done in two main steps. First, the individual members of the model are created (as described above in section “Multi-Layered Perceptron”). Second, the combination of the outputs of these members is averaged to obtain the unique ensemble output. Thus, for each neural network [NO, PO, Si(OH)4, AT, CT, pHT], the ten best topologies were chosen according to their statistics (as defined in section “Validation Statistics Metrics”). The final output of each neural network ensemble model (ANN-E) corresponds to the mean of the outputs of these ten best ANNs (if falling less than a standard deviation from the mean). Additionally, the best topology (ANN-1) among the ten best was also selected to compare between a one ANN structure and a neural network ensemble.
CANYON-MED
Based on the CANYON networks (Sauzède et al., 2017) principle, the CANYON-MED neural networks corresponding to neural-network ensemble models (ANN-E) (as described in “ANN Ensemble Model”) were developed. Similarly to the work by Sauzède et al. (2017), the chosen input variables for the networks are in situ measurements of pressure, temperature, salinity (water mass characteristics), and oxygen together with geolocation (latitude and longitude) and date of sampling. Compared to the CANYON networks, where the year is an input only for pHT and CT, the decimal year has been chosen as an input for the six CANYON-MED networks [i.e., NO, PO, Si(OH)4, AT, CT, and pHT]. This change, namely the transformation from day of year and year to decimal year for each network, was based on the long-term increases in deep nutrients observed in the western basin by Béthoux et al. (1998, 2002), as well as the increases in temperature and salinity in the deep Mediterranean Sea over the past 40 years (Borghini et al., 2014) which demonstrate the need of a temporal component in CANYON-MED networks.
According to the work by Sauzède et al. (2017), the pressure input was transformed according to the combination of a linear and a logistic curve to limit the degrees of freedom of the ANN in deep waters and to account for the large range of pressure values (from the surface to 4000 m depth) and a non-homogeneous distribution of data within this range:
Furthermore, similarly to the aforementioned method, and due to the nature of the transfer function (a sigmoid varying in the range [−1;1]), the inputs and outputs of the neural networks have been centered and reduced to also fall into the range [−1;1] (Sauzède et al., 2016, 2017).
Moreover, also building on the CANYON networks, Bittig et al. (2018) developed CANYON-B, a Bayesian neural network improvement of CANYON. CANYON-B is constructed as a committee of neural networks and provides estimates of nutrients and carbonate system variables with a local uncertainty (whereas CANYON provides global uncertainties). Neural networks committees are composed of several neural networks and use the spread of predictions between individual members of the committee to improve the estimation of uncertainty of the committee output (Bishop, 1995). This other neural network method was also used for comparative purposes.
The Matlab and R code are available at https://github.com/MarineFou/CANYON-MED/.
Validation Statistics Metrics
Results were validated using four statistical metrics chosen to evaluate the performance of the CANYON-MED algorithms on the validation datasets: the MAE (Mean Absolute Error, Equation 4), the RMSE (Root Mean Squared Error, Equation 5), the coefficient of determination (r2, Equation 6) as well as the slope (Equation 7) of the linear regression between the CANYON-MED-retrieved values and the corresponding in situ measured values. The absolute uncertainties are expressed as concentrations for NO, PO, Si(OH)4, AT, and CT (in μmol.kg–1) and pHT (pH unit) parameters.
Results and Discussion
Neural Network Ensemble Improvement and Overall CANYON-MED Performance
For each studied variable [i.e., NO, PO, Si(OH)4, AT, CT, and pHT], a CANYON-MED ensemble neural network was created as described in section “ANN Ensemble Model.” Comparing the statistics for the case using a single neural network (ANN-1) and the ensemble neural network model (ANN-E, corresponding to CANYON-MED), the ANN-E model provides the most accurate nutrient and carbonate system estimates (Table 2). For most variables, an increase in the determination coefficient is shown (i.e., from 0.94 to 0.95, 0.90 to 0.92, 0.93 to 0.96, 0.91 to 0.94, 0.84 to 0.86 for NO, PO, AT, CT, and pHT, respectively) as well as a decrease in MAE and RMSE (up to 20% and 30% of the errors, respectively). The low MAE values suggest that the ANN-E model is not biased, although the slopes are slightly less than 1, resulting in an underestimation of neural network outputs.
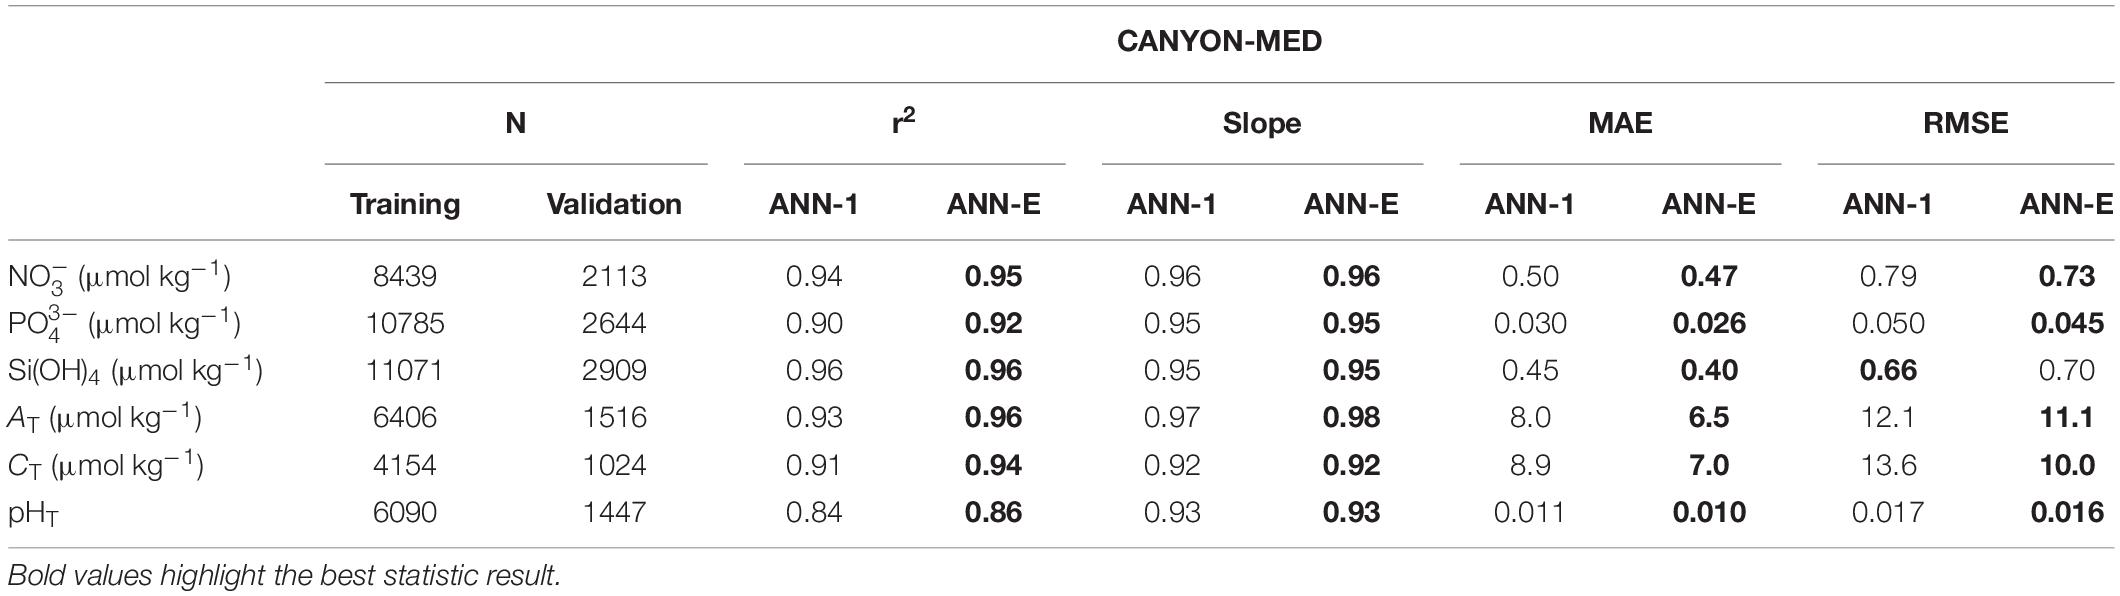
Table 2. Number of points in the training and validation datasets and statistics between in situ measurements from the validation database and the values predicted by CANYON-MED’s “best topology” (ANN-1) and CANYON-MED (ANN-E) for NO, PO, Si(OH)4, AT, CT and pHT.
Using the validation dataset, the performance of the CANYON-MED method was evaluated by comparing CANYON-MED’s results with the corresponding in situ values. Figure 4 shows these results as a function of pressure while the corresponding statistics are in Table 2. The accuracies obtained are very satisfactory with, for example, an accuracy of NO3– extracted from the neural network method (0.73 μmol.kg–1) comparable to that obtained with optical sensors such as those mounted on BGC-Argo floats (1 μmol.kg–1; Johnson et al., 2017). Owing to the lower number of data presently available in our training dataset for CT and pHT, the ability of the corresponding neural networks to generalize correctly is lowered, explaining the less robust statistics for CT and pHT with slopes around 0.9, and determination coefficients of 0.91 and 0.84, respectively (Table 2).
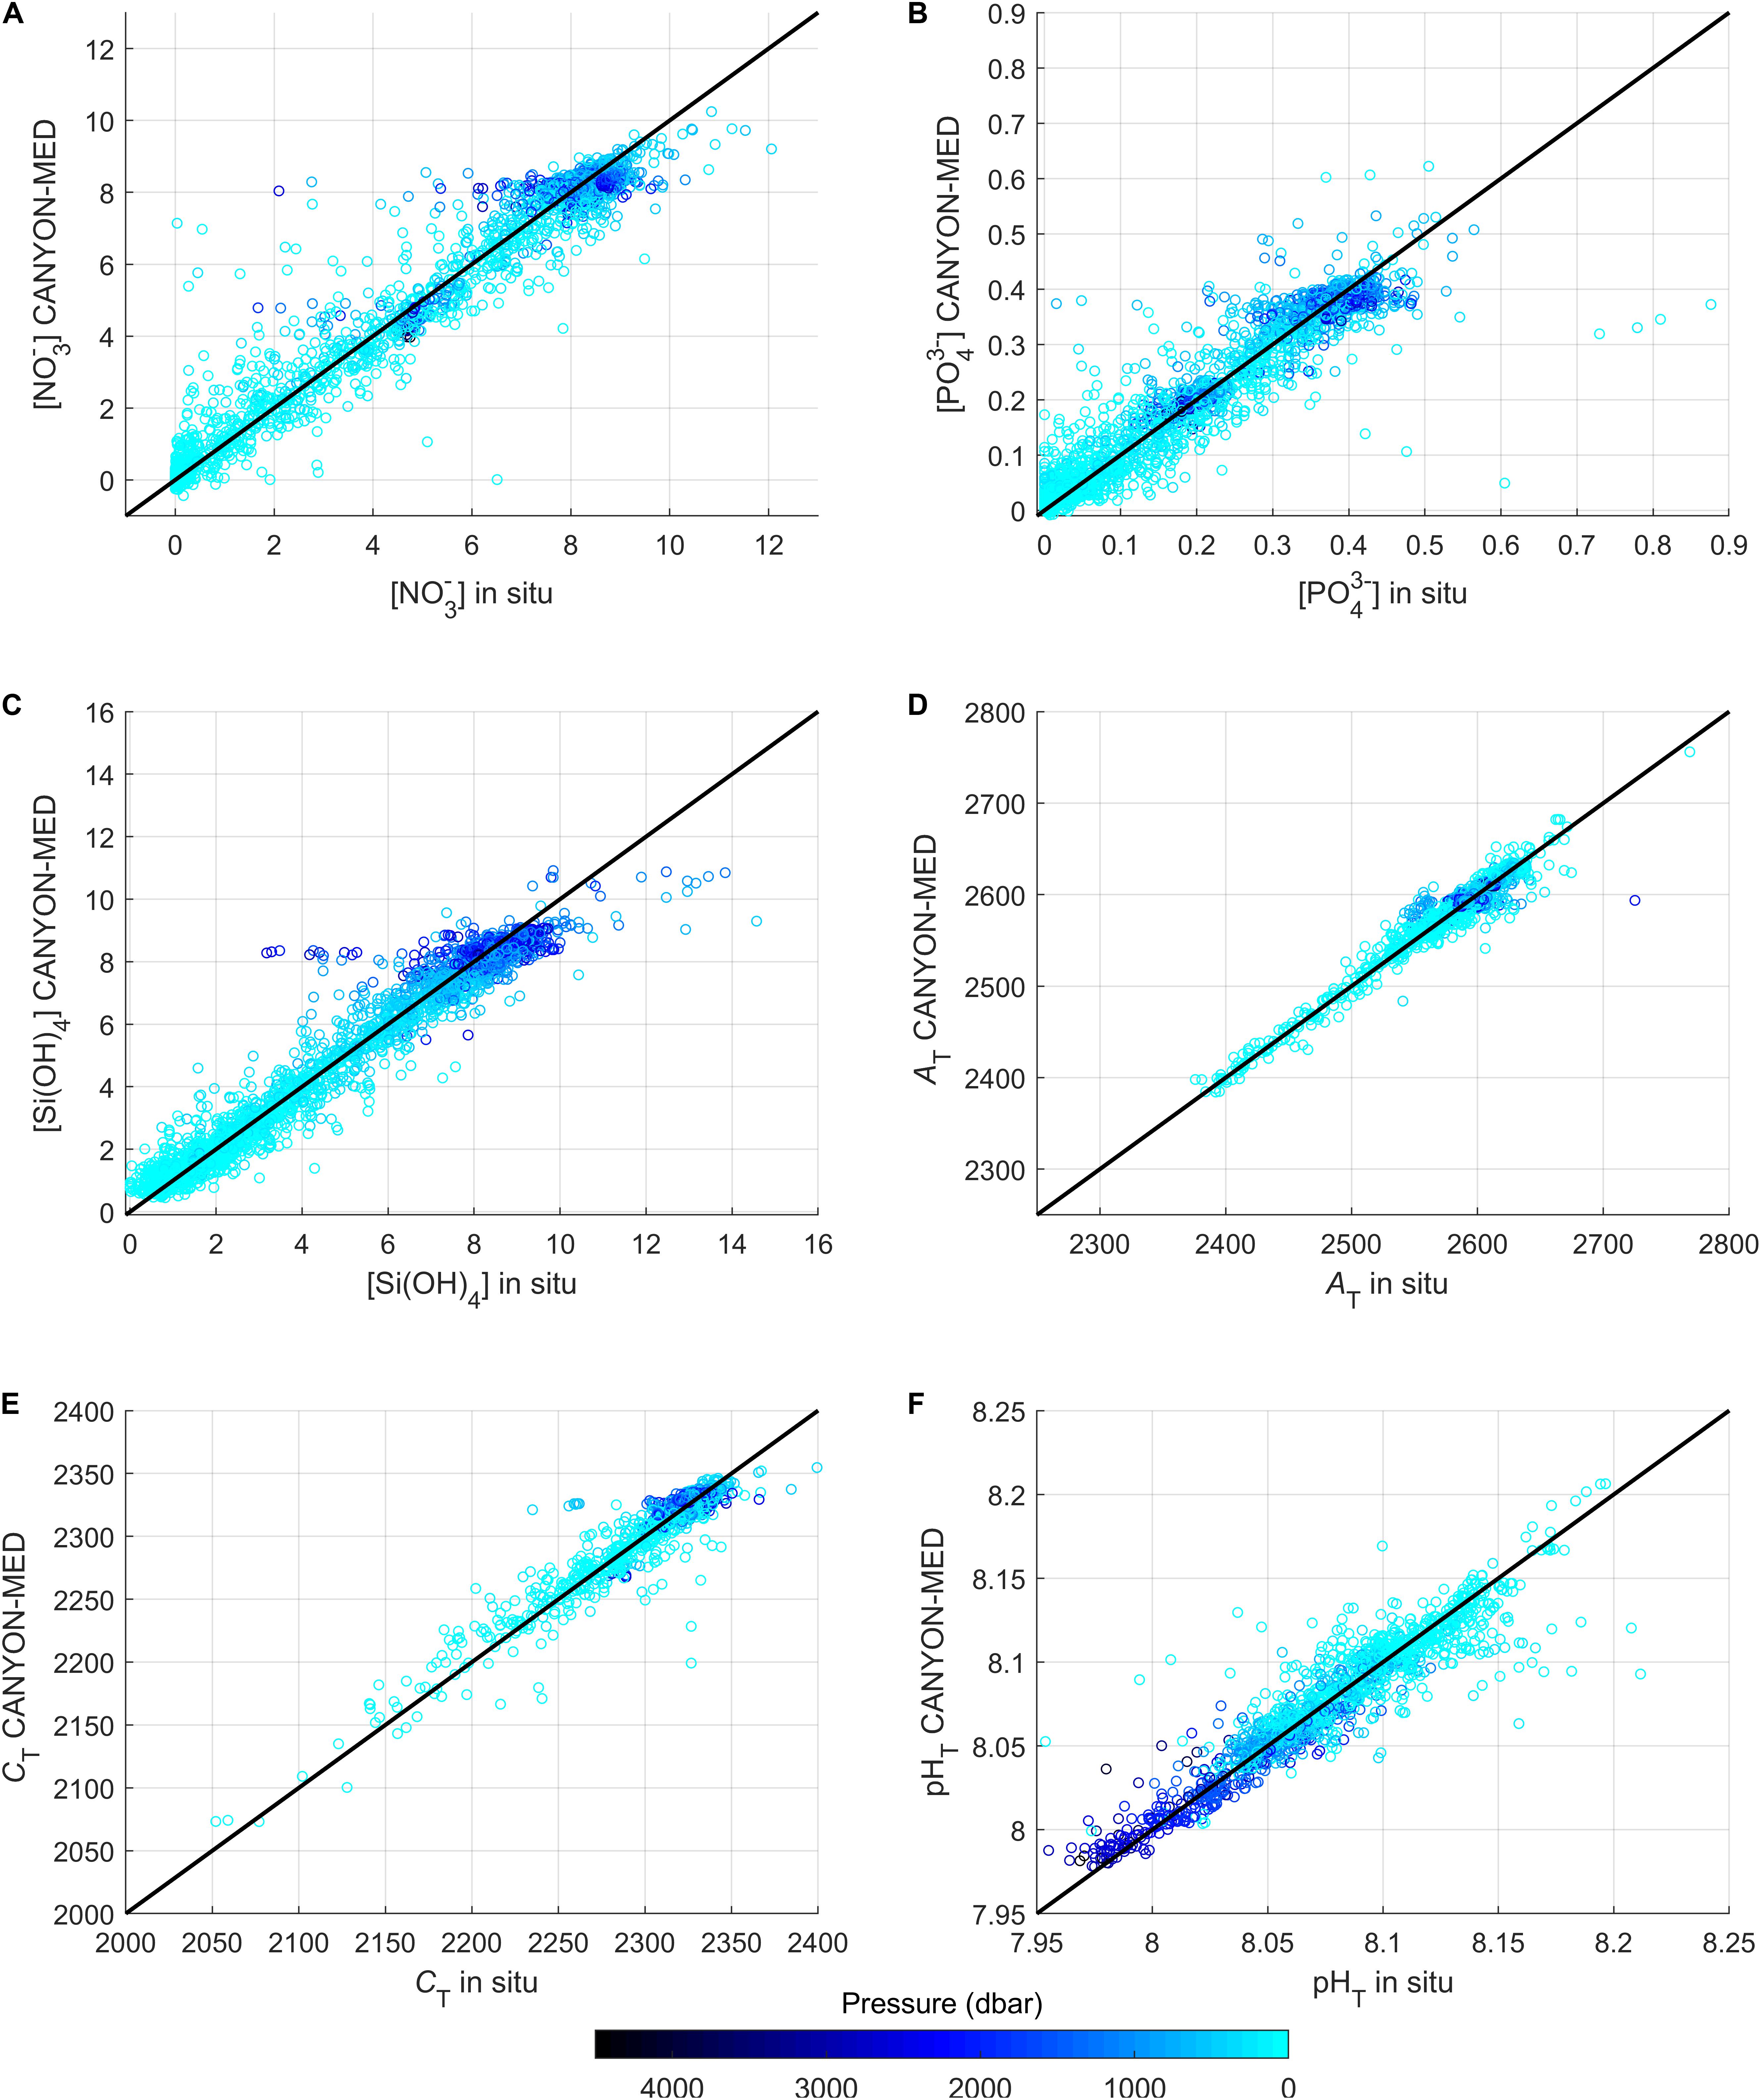
Figure 4. Comparison of the CANYON-MED-retrieved values with the corresponding in situ measurements according to pressure for (A) NO, (B) PO, (C) Si(OH)4, (D) AT, (E) CT, and (F) pHT. The darker blue points correspond to the deeper points whereas the lighter ones correspond to values closer to the surface. The 1:1 line is shown in black. The corresponding statistics are shown in Table 2.
In Figure 4, two different deep value ranges (i.e., two “patches” of dark blue points) can be distinguished for NO3– and POcorresponding to the deep values of the Western and Eastern Basins. The Eastern Mediterranean Sea is known to be more oligotrophic than its western counterpart (Ribera d’Alcalà et al., 2003; Pujo-Pay et al., 2011). Indeed, deep NO and PO values (Figures 4A,B) are lower in the ultraoligotrophic eastern Mediterranean than in the oligotrophic western Mediterranean, as evidenced by the differences in concentrations of the deep values (5 and 10 μmol.kg–1 for eastern and western NO, respectively and 0.2 and 0.4 μmol.kg–1 for PO, respectively). The deep Si(OH)4 values are quite similar between the two Mediterranean basins as it is not a limiting nutrient (Krom et al., 1991). A larger dispersion is observed for low concentrations of PO and NO (Figures 4A,B) recovered by CANYON-MED, coinciding with the low concentrations of surface nutrients in the Eastern Basin (Tanhua et al., 2013; Kress et al., 2014).
Furthermore, deep AT ranges between 2590 and 2610 μmol.kg–1 (Figure 4D) corresponding to the deep waters of the Western and Eastern Mediterranean Sea respectively. The difference between the two basins stems from an eastward increasing trend for AT mirroring the increase in salinity and an eastward increase in pHT (Hassoun et al., 2015). However, this difference is not very visible owing to the large range of AT. For CT, the difference between the two Mediterranean basins is lower (Figure 4E). CT variability is controlled by salinity, biological processes (such as photosynthesis, oxidation of organic matter, dissolution and precipitation of CaCO3), as well as air-sea CO2 exchange (Lovato and Vichi, 2015). Additionally, pHT (Figure 4F) exhibits a large range below 1500 m (7.98 to 8.1). This also stems from the difference between the two Mediterranean basins, a pattern similar to that of AT, with higher surface and deep values in the Eastern Mediterranean Sea (Rivaro et al., 2010).
Validation on Independent Time Series: ANTARES
The ANTARES time series was chosen as an additional independent validation dataset because, among the few time series in the deep offshore Mediterranean, it is one of the few where measurements of nutrients and carbonate system variables are performed semi-regularly and over the entire water column (Lefevre, 2010). The vertical profiles of the differences between in situ measurements of the ANTARES dataset and the values predicted by CANYON-MED are represented (Figure 5) along with their mean value and associated standard deviation. In general, the accuracies (Table 3) of each variable are comparable, albeit slightly worse, to those determined on the CANYON-MED validation dataset (Table 2). These accuracies are even lower for AT and CT probably due to the smaller ranges covered by the ANTARES site. The errors seem quite homogeneous over the whole water column (Figure 5), with higher errors when lacking data at specific depths [e.g., NO and Si(OH)4 at around 1250 dbar]. In addition, we can also note the clear overestimation of PO at the ANTARES time series, evident from the slope of 1.06 (Table 3) as well as from the observation of a clear shift in Figure 5B.
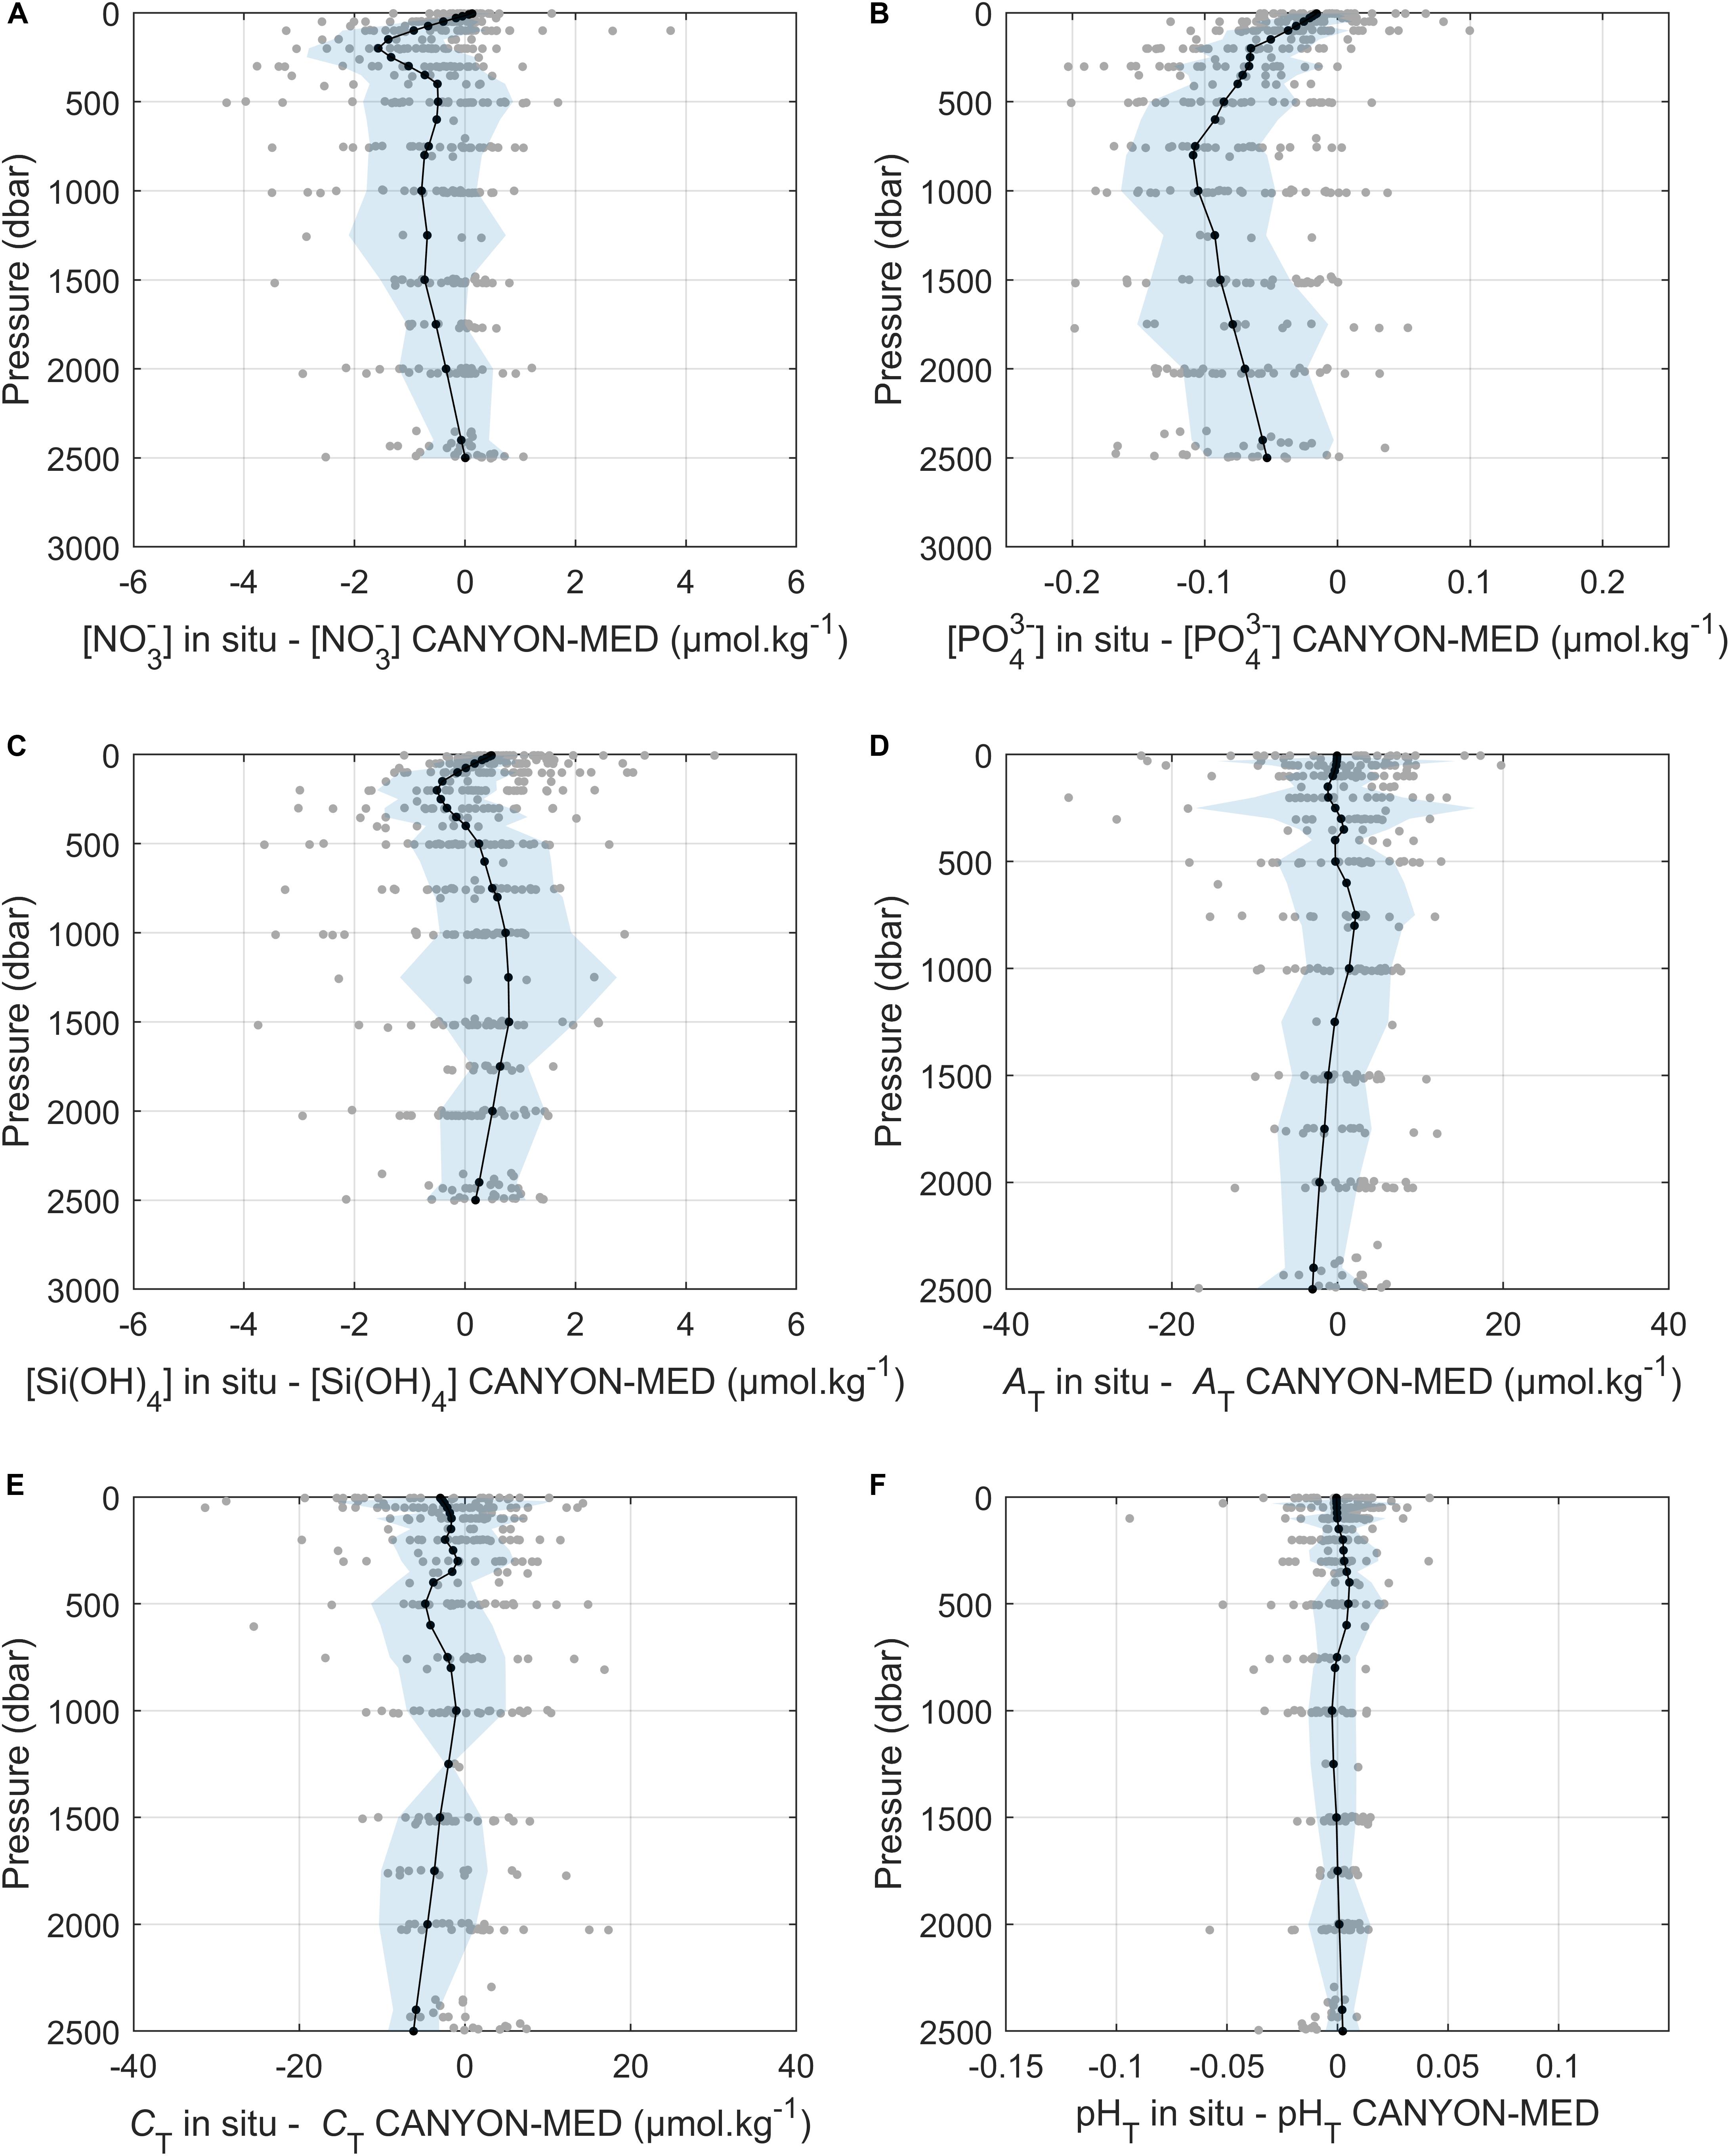
Figure 5. Vertical profiles of the differences between in situ measurements from the ANTARES time series and the values predicted by CANYON-MED for (A) NO, (B) PO, (C) Si(OH)4, (D) AT, (E) CT, and (F) pHT. The black line represents the mean value and the shaded area represents the standard deviation around this mean value. The statistics of the corresponding regression are presented in Table 3.
Table 3. Statistics between in situ measurements from the ANTARES time series and the values predicted by CANYON-MED for NO, PO, Si(OH)4, AT, CT and pHT.
However, it is important to note that the ANTARES dataset, although subject to quality control, still exhibits a high nutrient dispersion along the water column. This variability may result from natural phenomena or potential issues in the measurement accuracy (e.g., measurement uncertainty, sampling procedure, change of operator, evolution of techniques). In the latter case, it can explain the dispersion of errors found for nutrients in Figure 5.
Comparison to Other Methods Available
CANYON Methods
The performance of the CANYON, CANYON-B, and CANYON-MED methods were compared using the validation dataset (the remaining 20% of the database not used for training). The performances were computed by comparing the neural network outputs for nutrients and carbonate system parameters with the in situ measurements according to the metrics defined in section “Validation Statistics Metrics.” Scatterplots of neural network-retrieved variables against their corresponding in situ measurements (Figure 6) reveal that the CANYON-MED method gives much better results than its global counterparts (i.e., CANYON and CANYON-B). The accuracies (RMSE) have been reduced, for each variable, by more than half between CANYON-B and CANYON-MED and by a third for nutrients and AT between CANYON and CANYON-MED, as shown by statistics in Table 4. The differences are primarily due to the under-representation of Mediterranean Sea cruises in CANYON and CANYON-B’s training dataset (Mediterranean data poorly represented in the GLODAPv2), as opposed to the training dataset specifically designed for the Mediterranean Sea in CANYON-MED.
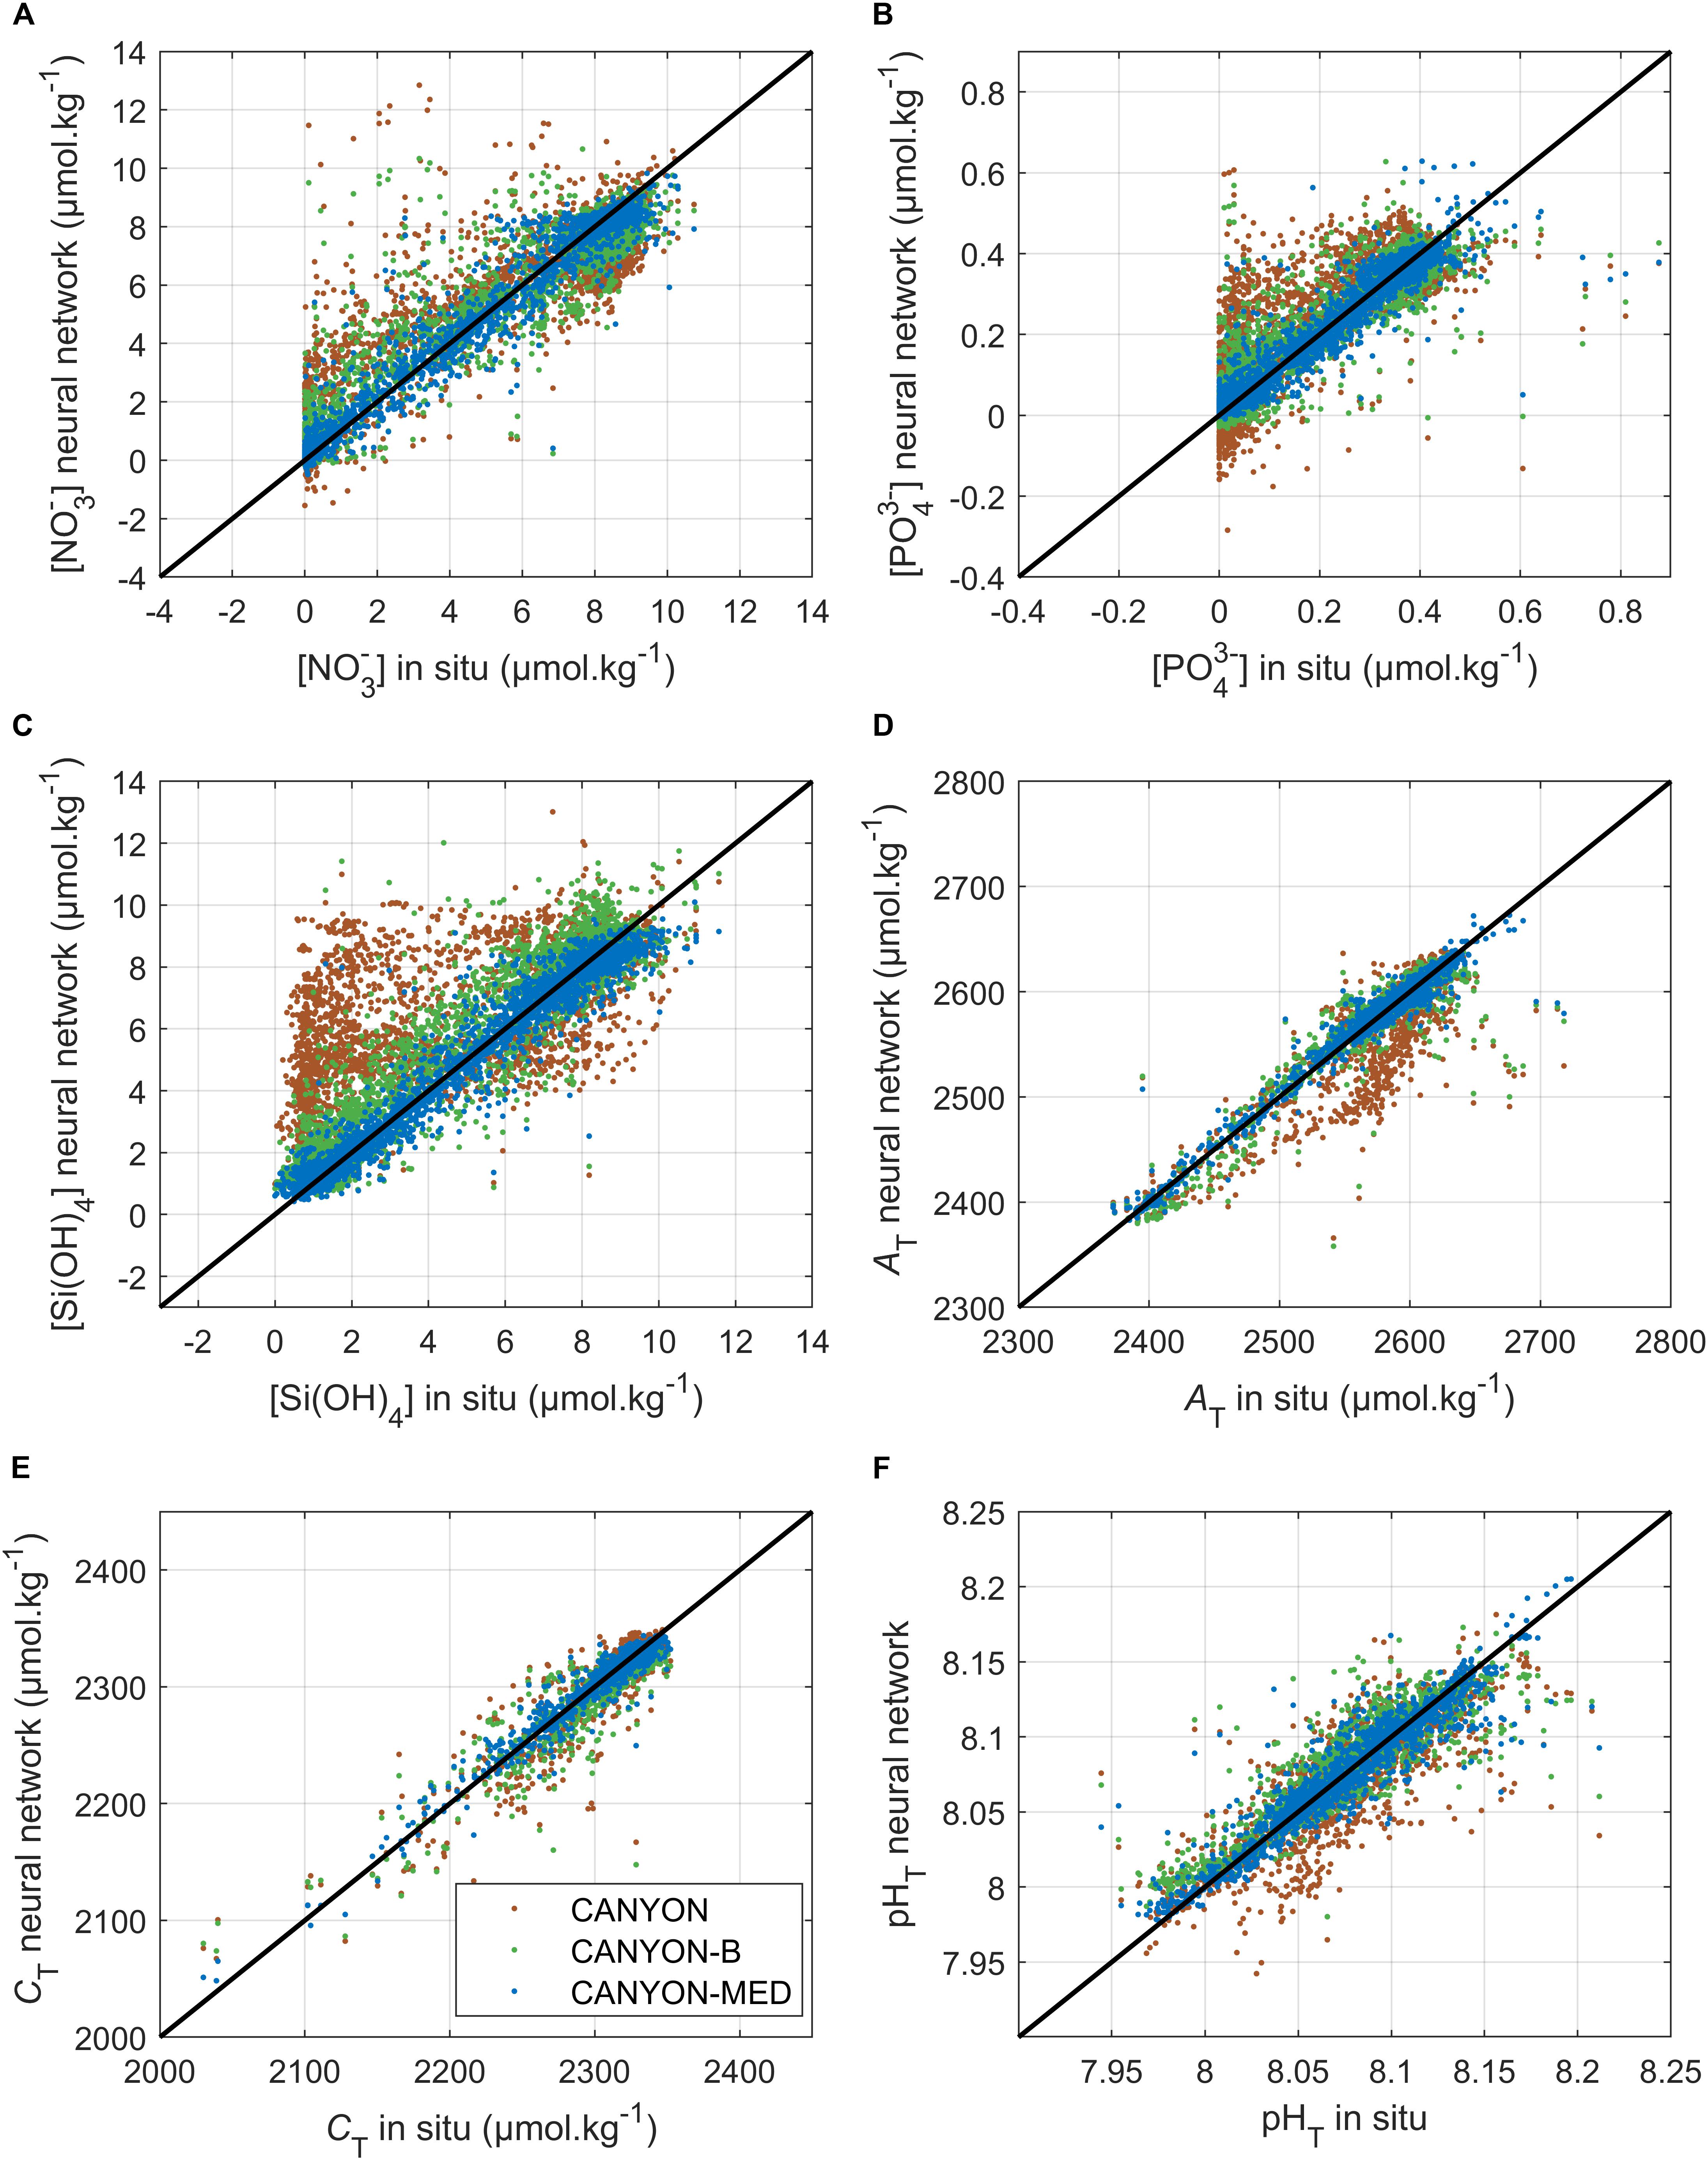
Figure 6. Comparison of the CANYON (brown dots), CANYON-B (green dots) and CANYON-MED (blue dots) -retrieved values with the corresponding in situ measurements for (A) NO, (B) PO, (C) Si(OH)4, (D) AT, (E) CT, and (F) pHT. The 1:1 line is shown in black.
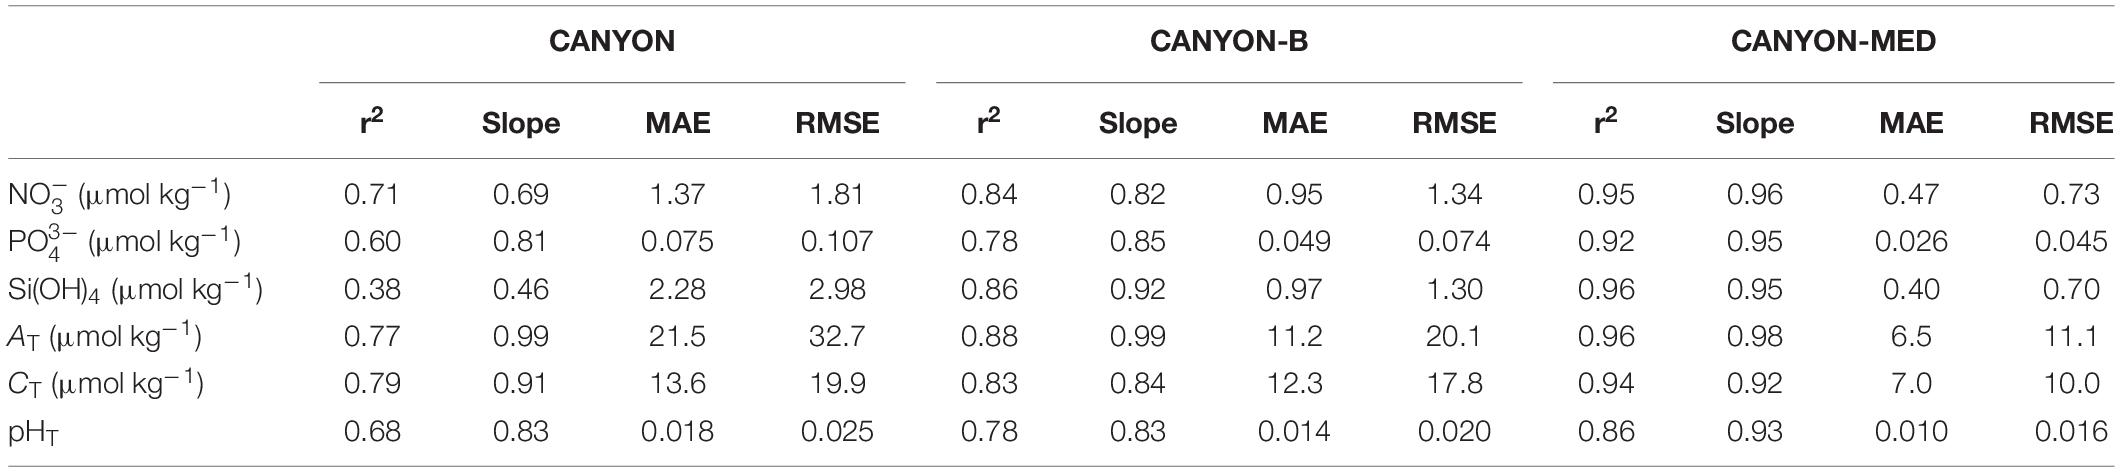
Table 4. Statistics between the CANYON, CANYON-B, and CANYON-MED -retrieved values with the corresponding in situ measurements applied on the entire database for NO, PO, Si(OH)4, AT, CT and pHT.
Specifically, for the CANYON and CANYON-B networks, a higher scatter is observed for NO and PO near-zero values (Figures 6A,B). CANYON-MED’s MAE and RMSE are halved compared to CANYON and CANYON-B’s (Table 4). In addition, a significant number of values are predicted to be negative (around −0.1 μmol.kg–1). This feature is mainly caused by the difference in the nutrient concentrations for the oligotrophic to ultra-oligotrophic Mediterranean Sea which are close to the detection limits of the nutrients analysis method (Krom et al., 1991) compared to the higher concentrations found in the global ocean (high concentrations present in GLODAPv2, CANYON, and CANYON-B training data).
A very high scatter is also present for Si(OH)4 CANYON and CANYON-B-retrieved values, especially for the lower values (i.e., <4 μmol.kg–1) (Figure 6C). In the global ocean, Si(OH)4 concentrations range from low concentrations (<10 μmol.kg–1) similar to those found in the Mediterranean Sea to very high concentrations (up to 200 μmol.kg–1) at high latitudes (Ragueneau et al., 2000; Pujo-Pay et al., 2011), thus explaining the difference in scatter between the Si(OH)4 values obtained by CANYON and CANYON-MED.
AT and CT retrieval performance appears to be relatively similar using the three methods (Figures 6D,E) due to the wide range of values of these two variables, which reduces differences between approaches. However, for AT a large spread is present in CANYON estimates. Indeed, the MAE and RMSE range to a third less than CANYON and CANYON-B (Table 4). Moreover, a larger dispersion remains perceptible in the values predicted by CANYON and CANYON-B with predicted values lower by up to 100 μmol.kg–1 than their in situ measurements.
Likewise, pHT values are comparable between the three neural network-based methods (Figure 6F), with CANYON-MED projecting pHT with the lowest spread. Compared to the global average surface ocean, the Mediterranean Sea will be subject to amplified acidification (Touratier and Goyet, 2009, 2011; Palmiéri et al., 2015). The Mediterranean Sea is known to absorb more anthropogenic CO2 per unit area (Palmiéri et al., 2015). Essentially, the Mediterranean’s high AT increases its capacity to absorb anthropogenic CO2 and the short timescales at which its deep waters are ventilated (Schneider et al., 2014) allow for deeper penetration of this CO2, thus resulting in a lower pHT.
Other Methods
A key advantage of CANYON-MED lies in the few inputs required to use it, but other methodologies exist to predict nutrients and carbonate system variables. CANYON-MED and the methods described in this section were applied to our validation dataset and their results evaluated by the MAE and RMSE (as defined in section “Validation Statistics Metrics”) are presented in Table 5.
Table 5. Performance indicators on the 20% validation dataset of CANYON (Sauzède et al., 2017), CANYON-B (Bittig et al., 2018), CANYON-MED (this paper), CONTENT (Bittig et al., 2018), AT-S and CT-S (Hassoun et al., 2015), LIARv2, LINR, and LIPHR (Carter et al., 2018) for NO, PO, Si(OH)4, AT, CT, pHT.
First of all, Carter et al. (2018) developed methods for locally interpolated estimations of NO, PO, Si(OH)4, AT, and pHT (LINR, LIPR, LISIR, LIARv2, and LIPHR, respectively). These methods base their computations on equations requiring salinity, Apparent Oxygen Utilization (derived from O2), depth, temperature, as well as nutrients concentrations. For comparability to our method and its possible application on BGC-Argo floats, these regressions were applied on our validation dataset using only the equations with similar inputs as our neural networks (i.e., temperature, depth or pressure for CANYON-MED, salinity, and O2). The computations with Locally Interpolated Regressions (LIRs) were performed using their functionality that selects, using the given inputs, the lowest-uncertainty estimate among possible estimates (Carter et al., 2018).
Furthermore, also building on the CANYON networks, and in addition to CANYON-B presented in section “CANYON-MED,” Bittig et al. (2018) developed another neural network-based method: CONTENT. This method predicts carbonate system variables. In CONTENT, CANYON-B estimates of the four carbonate system variables (i.e., AT, CT, pHT, pCO2) are combined through calculations of every pair (as the four variables can be derived from any pair of them). CONTENT therefore provides better estimates through the use of all four parameters of the carbonate system, whereas CANYON-B provides a unique direct estimate. These methods have the same inputs as CANYON-MED, except for the year which is only an input for the CT, pHT and pCO2 neural networks in CANYON-B.
In addition, specifically for the Mediterranean Sea, Hassoun et al. (2015) derived equations to calculate AT and CT from salinity hereafter referred to as AT-S and CT-S. Equations are available for the entire Mediterranean Sea as well as specific equations for each sub-basin and several depth layers. For our comparison, the global equations were used since some equations for specific depth layers and locations had low performance. Furthermore, it is possible to use a single equation over the whole Mediterranean Sea, to derive AT from salinity, if marginal seas and regions of important freshwater influence are not considered (Cossarini et al., 2015), which is relevant because CANYON-MED is not suited for coastal areas.
As shown in Table 5, CANYON-MED has lower errors for all predicted variables than the methods presented above. CONTENT has very similar errors in the prediction of carbonate system parameters compared to CANYON-B. The equations from Hassoun et al. (2015), predict AT and CT with errors up to four times the errors of CANYON-MED. Moreover, the LIRs clearly stand out, with errors up to ten times higher than the other methods. However, it should be stressed that the results from the LIRs would have been more robust (errors 10% lower but still higher than the other methods, data not shown) if they had been applied using all inputs, that is including nutrients as predictors, but as mentioned before, for aims of comparability, they were not.
Generally, CANYON-MED neural networks are more accurate than other methods with the same inputs. This is not surprising as it was built specifically for the Mediterranean Sea whereas CANYON, CANYON-B, CONTENT, and the LIRs were developed for the global ocean. However, high MAE and RMSE were obtained using AT-S and CT-S from Hassoun et al. (2015). This can be explained by the fact that, while having been developed specifically for the Mediterranean Sea, these equations were derived using data collected only in May whereas our validation dataset covers as much as possible the whole year. Furthermore, we only used the global equations developed for the entire Mediterranean Sea and for all depths. It is acknowledged that the equations derived for specific areas and depth layers would have produced more accurate results in targeted areas, but the aim was to compare the methods on a global basin scale. Therefore, it is suggested that, while allowing for easy computations of carbonate system variables in cases where they are lacking, the simple approximation from salinity might not always produce the best results on a varied dataset.
Overall, CANYON-MED stands out as the most robust method for the prediction of nutrients and carbonate system parameters in the Mediterranean Sea. The variables required are limited to systematically measured variables such as temperature, pressure, and salinity as well as high-quality O2 measurements as inputs which are also widely measured (Bittig and Körtzinger, 2015). Thus, with the increased densification of high-quality O2 measurements from BGC-Argo floats, as well as ocean gliders and moorings in the Mediterranean Sea (Testor et al., 2019; Tintoré et al., 2019; D’Ortenzio et al., 2020), CANYON-MED has a strong potential to support the development of new applications for marine biogeochemistry.
As is the case for all neural networks, the combination of the weights connecting the different hidden layers is not transparent, contrary to the weights obtained with linear regressions (Cortez and Embrechts, 2013). Nevertheless, a sensitivity analysis of the relative contribution showed no significant difference between the inputs of CANYON-MED, also indicating that no input parameter stands out over the others in an unrealistic manner. Thus, confirming the relevance of the chosen inputs and their balance as none is superfluous nor solely driving the neural network’s outputs.
It should be underlined that other approaches allow for the prediction of nutrients and carbonate system variables with higher accuracies than ours. But these methods are often developed for the global ocean and might therefore not be as satisfactory in the semi-enclosed Mediterranean Sea. Furthermore, they often require a larger amount of inputs to predict a single variable. For example, Broullón et al. (2019) developed a neural network method called NNGv2 to derive AT from geolocation, depth, temperature, salinity, and O2 as well as nitrate, phosphate and silicate concentrations. NNGv2 predicts AT, for the global ocean, with a RMSE of 5–6 μmol.kg–1, about half the RMSE obtained when retrieving AT using CANYON-MED. However, it is highly likely that those results would worsen in the Mediterranean Sea as NNGv2 was trained using the GLODAPv2 database (Olsen et al., 2016), similarly to CANYON, CANYON-B, and CONTENT, in which the Mediterranean Sea is poorly described. Furthermore, NNGv2 requires more predictors than CANYON-MED. The additional variables [Si(OH)4, PO, NO] are not systematically measured, which hinders the use of this method, especially with the long-term objective to be applied on BGC-Argo, which are only equipped with O2 sensors (Claustre et al., 2020 and references therein).
Example of Application: Mediterranean Deep Values
Using our 20% validation dataset, the averages of CANYON-MED outputs were calculated for each variable [i.e., NO, PO, Si(OH)4, AT, CT, and pHT] from 1000 m depth to the bottom of the water column (4000 m) and averaged. The corresponding in situ measurements were averaged in the same way. The differences between in situ values and those predicted by CANYON-MED are presented in Figure 7. The choice of deep values relies on their seasonal stability.
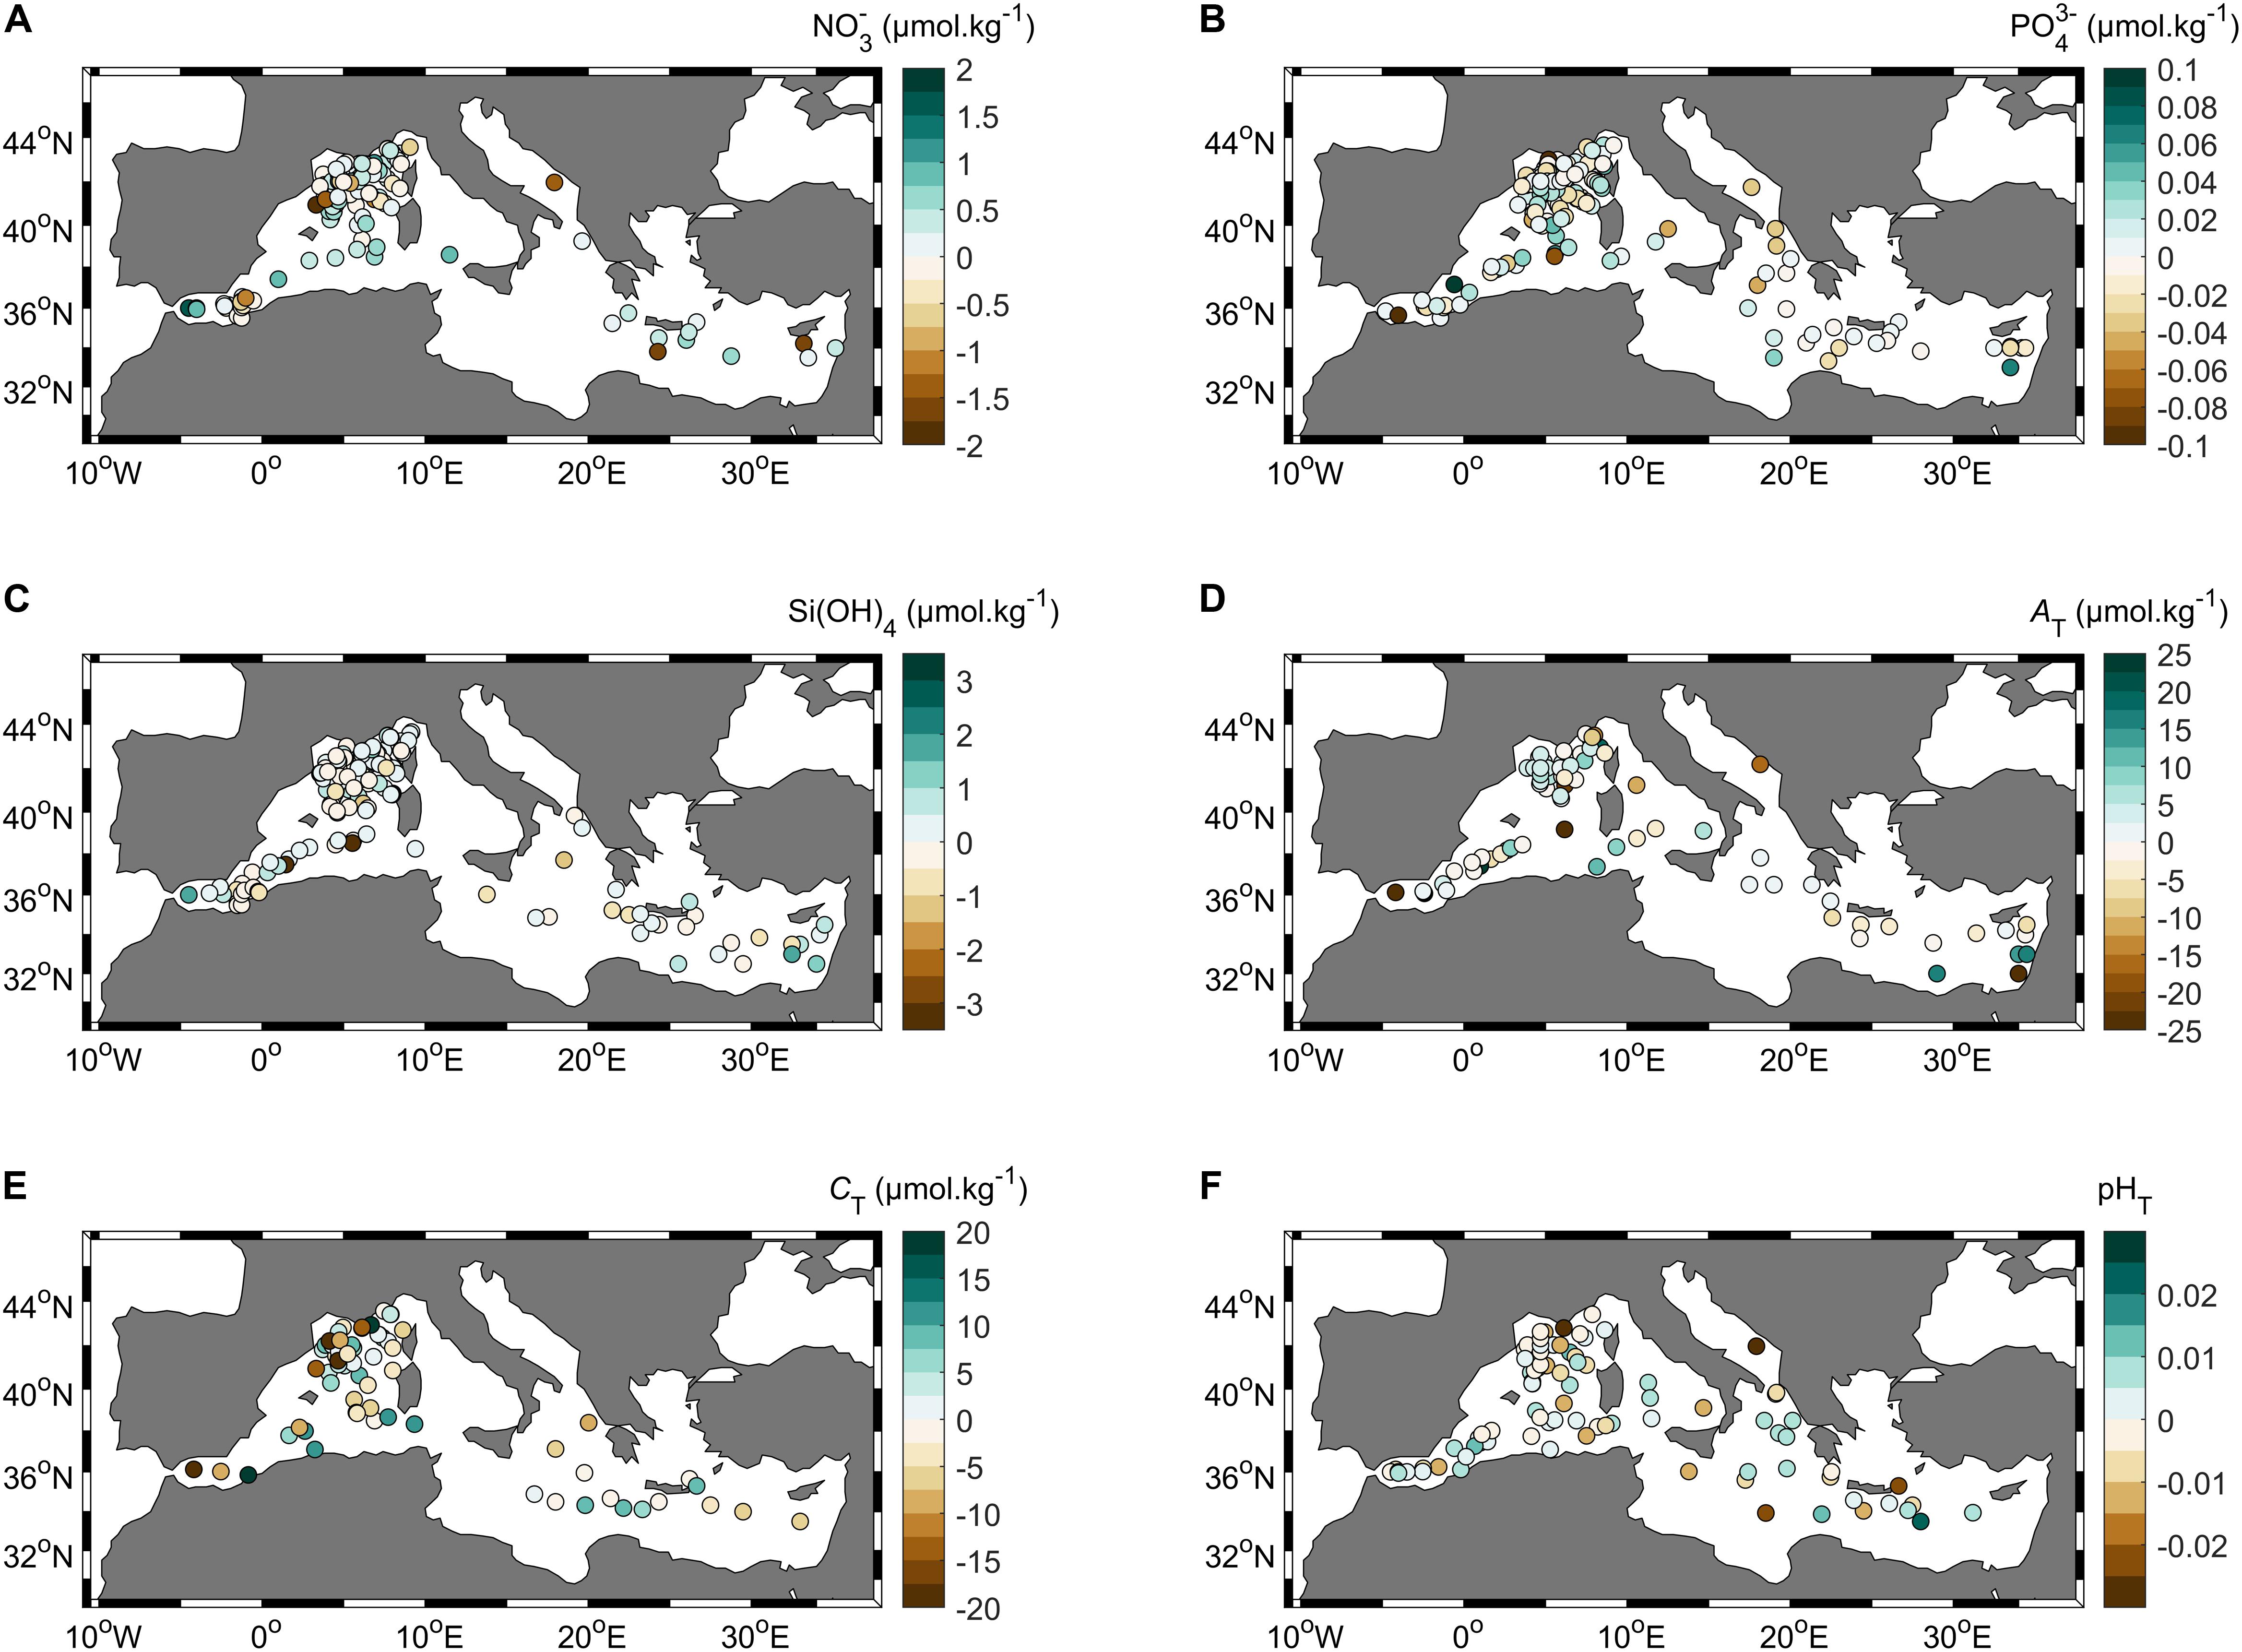
Figure 7. Difference between in situ measurements and the corresponding values predicted by CANYON-MED averaged from 1000 m to the bottom for (A) NO, (B) PO, (C) Si(OH)4, (D) AT, (E) CT, and (F) pHT.
Overall, the variables provided by CANYON-MED and the corresponding in situ measurements are in satisfactory agreement, i.e., the difference is close to zero. No spatial trend is observed in the differences between the in situ data and neural network’s outputs indicating that CANYON-MED adequately predicts without bias values along the known oligotrophy and acidity gradients between the Eastern and Western basins (Krom et al., 1991; Flecha et al., 2015). However, a few outlier points stand out for each parameter. These larger differences may be due to seasonal imprints (the data presented in Figure 7 refer to the complete validation dataset, regardless of their date and time).
In the Algero-Provencal basin, a deep AT value stands out with a high difference (Figure 7D). The same occurs for a few CT and pHT values in the Gulf of Lion (Figures 7E,F). These extreme values could be explained by local phenomena also impacting temperature, salinity and/or O2, the neural network’s inputs, consequently impacting the retrieved values. Indeed, these areas are known to be dynamic with an eddy-driven mesoscale circulation, where the anomalous biogeochemical profiles could originate from (Pessini et al., 2018). We therefore hypothesize that discrete data may not sufficiently reflect the vertical distribution of these variables in a dynamic region such as the Gulf of Lion, owing to the lack of adequate observational resolution. High differences can also stem from erroneous stations not detected by the quality controls but being highlighted in CANYON-MED’s outputs, causing the differences to deviate from zero values.
Additionally, some points standing out as high differences (exceptionally low values) for CT (and AT) in the Alboran Sea, Gulf of Lion and Algero-Provencal basin appear, after further investigation, to correspond to the first sampling campaign of the carbonate system in our database (i.e., in 1981). We, therefore, hypothesize that a difference in the quality of the measurements could explain some of the extreme deviations. Furthermore, for all variables, a larger variability can be found in the Alboran Sea than in the rest of the Mediterranean Sea. This variability can be a result of the influence of the Atlantic Ocean through the Gibraltar Strait and the strong associated mesoscale activity (Viúdez et al., 1998; Baldacci et al., 2001).
Given the disparate spatial coverage of the training data available, we expected CANYON-MED to predict nutrients and carbonate system variables with higher errors in the Eastern Basin compared to the Western Basin. As shown by the statistics for each basin, gathered in Table 6, carbonate system parameters are indeed predicted with less accuracy in the Eastern Basin. As for nutrients, the difference between Eastern and Western Basin is less marked: a slightly lower MAE and RMSE for NO and PO in the East are linked to a lower r2. The difference between basins is mainly caused by the disparity in spatial and temporal coverage in our training database, stemming from a lack of cruises in the Eastern part of the Mediterranean Sea.
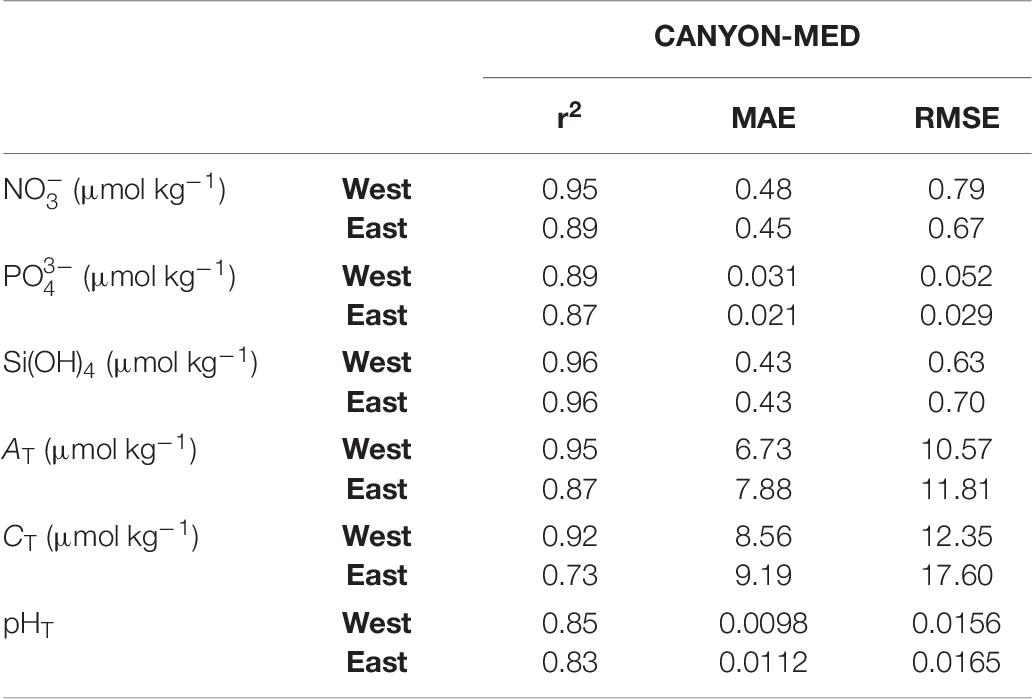
Table 6. Statistics between the CANYON-MED retrieved values and the corresponding in situ measurements on the validation database according to Basin (West and East) for NO, PO, Si(OH)4, AT, CT, pHT.
CANYON-MED remains unsatisfactory in areas where training data are too scarce (e.g., South Ionian Sea, off the Libyan coasts) and results accuracy might be lowered during anomalous events (extreme meteorological conditions impacting physical variables, such as deep convection). It should also be recalled that CANYON-MED is not suited for coastal areas.
Conclusion and Perspectives
We have demonstrated the limited performance of the CANYON and CANYON-B methods to retrieve nutrients and carbonate system variables in the Mediterranean Sea. A new approach, CANYON-MED, was subsequently created and trained using an artificial neural network ensemble model. The approach takes advantage of the accuracy of EOVs systematically measured today (Wang et al., 2019), whether during scientific cruises or by autonomous platforms. The model was built as an ensemble of 10 optimized multi-layered perceptron feed-forward neural networks. CANYON-MED inputs were in situ measurements of pressure, temperature, salinity, and O2 as well as geolocation (latitude and longitude) and sampling date (day of year and year).
The resulting ensemble model produces accurate estimates of nutrients and carbonate system variables [0.73, 0.045, and 0.70 μmol.kg–1 for NO, PO and Si(OH)4, respectively, and 0.016 units, 11 μmol.kg–1 and 10 μmol.kg–1 for pHT, AT, and CT, respectively]. With such accuracy, CANYON-MED can produce estimates of variables that are not currently measured by autonomous platforms, as is the case for PO, Si(OH)4, AT, and CT. CANYON-MED can also help identify periods and areas in the Mediterranean Sea where the data density remains too low in space and/or time, which limits the understanding of some processes and the assessment of long-term variability. Indeed, the spatial and temporal domains where the method provides the least satisfactory results are related to weaknesses in the training database that does not sufficiently capture variability in space and time. Furthermore, more dynamic regions such as deep convection zones and mesoscale eddies may be less well reproduced by CANYON-MED.
Ship-based sampling remains imperfect either because of limited ship-time or human resources or because of weather conditions that prevent sampling in specific areas or at certain times of the year such as winter. CANYON-MED has the capability to fill gaps in observations in a cost-effective way, for example by filling the gaps in time series (subject to the absence of exceptional events). It can also be applied to a large network of BGC-Argo profiling floats and underwater gliders equipped with CTD and oxygen sensors, thus increasing the flow of biogeochemical data from systematically measured basic variables. CANYON-MED can also contribute to the quality control of NO and pHT obtained from these autonomous platforms by providing data to correct for sensor drift during deployments and adjust deep values (e.g., Johnson et al., 2016, 2015; Sauzède et al., 2020). In line with this, multiple Eulerian moorings acquire and provide high-quality and high-frequency measurements of temperature, salinity, and O2 over the water column at fixed locations in the Mediterranean Sea (e.g., HYDROCHANGES, EMSO, and OceanSITES networks). CANYON-MED can be applied to data collected at these sites, complementing the measured core variables, and generating high-frequency biogeochemical datasets, hence supplementing temporally limited oceanographic cruises.
Finally, since the accuracy of the virtual data obtained for NO by this approach is comparable to that obtained with autonomous platforms, their use in oceanography would be beneficial, in particular by increasing the datasets used for the assimilation of some regional models that still lack crucial reference data (Doney et al., 2009; Cossarini et al., 2019).
Data Availability Statement
All datasets generated for this study are included in the article/supplementary material.
Author Contributions
HC, LC, FD’O, and MF initiated the study and designed the neural network configurations with the help of RS. MF collected and QCed the dataset and trained CANYON-MED. The manuscript was drafted by MF and LC. MF ran simulations and created the plots. All authors contributed to analysis and discussion of results, commented on, and contributed to the improvement of several versions of the manuscript.
Conflict of Interest
The authors declare that the research was conducted in the absence of any commercial or financial relationships that could be construed as a potential conflict of interest.
Acknowledgments
Thanks are due to Henry C. Bittig (IOW, Rostock) for helpful discussions on neural network development. We are extremely grateful to Marta Álvarez (IEO, La Coruña) and collaborators for making available to us the first version of the CARIMED database. We deeply acknowledge the work from analysts, investigators, and crew who collected the data at sea. We are thankful to the MOOSE program financially supported by CNRS-INSU, for providing annual cruises and fixed time series dataset for CANYON-MED training.
References
Abram, N., Gattuso, J.-P., Prakash, A., Cheng, L., Chidichimo, M. P., Crate, S., et al. (2019). “Framing and context of the report,” in IPCC Special Report on the Ocean and Cryosphere in a Changing Climate, ed. H.-O. Portner (Geneva: IPCC).
Álvarez, M., Sanleón-Bartolomé, H., Tanhua, T., Mintrop, L., Luchetta, A., Cantoni, C., et al. (2014). The CO2 system in the Mediterranean Sea: a basin wide perspective. Ocean Sci. 10, 69–92. doi: 10.5194/os-10-69-2014
Baldacci, A., Corsini, G., Grasso, R., Manzella, G., Allen, J. T., Cipollini, P., et al. (2001). A study of the Alboran sea mesoscale system by means of empirical orthogonal function decomposition of satellite data. J. Mar. Syst. 29, 293–311. doi: 10.1016/S0924-7963(01)00021-25
Beale, M. H., Hagan, M. T., and Demuth, H. B. (2018). Neural Network ToolboxTM User’s Guide. Natick, MA: The MathWorks Inc. Available online at: https://es.mathworks.com/help/pdf_doc/deeplearning/nnet_ug.pdf (accessed June 5, 2020).
Ben Mustapha, Z., Alvain, S., Jamet, C., Loisel, H., and Dessailly, D. (2014). Automatic classification of water-leaving radiance anomalies from global SeaWiFS imagery: application to the detection of phytoplankton groups in open ocean waters. Remote Sens. Environ. 146, 97–112. doi: 10.1016/j.rse.2013.08.046
Béthoux, J. P. (1989). Oxygen consumption, new production, vertical advection and environmental evolution in the Mediterranean Sea. Deep Sea Res. Part A Oceanogr. Res. Pap. 36, 769–781. doi: 10.1016/0198-0149(89)90150-90157
Béthoux, J. P., Morin, P., Chaumery, C., Connan, O., Gentili, B., and Ruiz-Pino, D. (1998). Nutrients in the Mediterranean Sea, mass balance and statistical analysis of concentrations with respect to environmental change. Mar. Chem. 63, 155–169. doi: 10.1016/S0304-4203(98)00059-50
Béthoux, J. P., Morin, P., Madec, C., and Gentili, B. (1992). Phosphorus and nitrogen behaviour in the Mediterranean Sea. Deep Sea Res. Part A Oceanogr. Res. Pap. 39, 1641–1654. doi: 10.1016/0198-0149(92)90053-V
Béthoux, J. P., Morin, P., and Ruiz-Pino, D. P. (2002). Temporal trends in nutrient ratios: chemical evidence of Mediterranean ecosystem changes driven by human activity. Deep Sea Res. Part II Top. Stud. Oceanogr. 49, 2007–2016. doi: 10.1016/S0967-0645(02)00024-23
Bittig, H. C., and Körtzinger, A. (2015). Tackling oxygen optode drift: near-surface and in-air oxygen optode measurements on a float provide an accurate in situ reference. J. Atmos. Ocean. Technol. 32, 1536–1543. doi: 10.1175/JTECH-D-14-00162.1
Bittig, H. C., Steinhoff, T., Claustre, H., Fiedler, B., Williams, N. L., Sauzède, R., et al. (2018). An alternative to static climatologies: robust estimation of open ocean CO2 variables and nutrient concentrations from T, S, and O2 data using bayesian neural networks. Front. Mar. Sci. 5:328. doi: 10.3389/fmars.2018.00328
Bittig, H. C., Maurer, T. L., Plant, J. N., Schmechtig, C., Wong, A. P. S., Claustre, H., et al. (2019). A BGC-Argo guide: planning, deployment, data handling and usage. Front. Mar. Sci. 6:502. doi: 10.3389/fmars.2019.00502
Borghini, M., Bryden, H., Schroeder, K., Sparnocchia, S., and Vetrano, A. (2014). The Mediterranean is becoming saltier. Ocean Sci. 10, 693–700. doi: 10.5194/os-10-693-2014
Broullón, D., Pérez, F. F., Velo, A., Hoppema, M., Olsen, A., Takahashi, T., et al. (2019). A global monthly climatology of total alkalinity: a neural network approach. Earth Syst. Sci. Data 11, 1109–1127. doi: 10.5194/essd-11-1109-2019
Carter, B. R., Feely, R. A., Williams, N. L., Dickson, A. G., Fong, M. B., and Takeshita, Y. (2018). Updated methods for global locally interpolated estimation of alkalinity, pH, and nitrate. Limnol. Oceanogr. Methods 16, 119–131. doi: 10.1002/lom3.10232
Chai, F., Johnson, K. S., Claustre, H., Xing, X., Wang, Y., Boss, E., et al. (2020). Monitoring ocean biogeochemistry with autonomous platforms. Nat. Rev. Earth Environ. 1, 315–326. doi: 10.1038/s43017-020-0053-y
Claustre, H., Johnson, K. S., and Takeshita, Y. (2020). Observing the global ocean with biogeochemical-argo. Annu. Rev. Mar. Sci. 12, 23–48. doi: 10.1146/annurev-marine-010419-010956
Copin-Montégut, C., and Bégovic, M. (2002). Distributions of carbonate properties and oxygen along the water column (0-2000m) in the central part of the NW Mediterranean Sea (Dyfamed site): influence of winter vertical mixing on air-sea CO2 and O2 exchanges. Deep Sea Res. Part II 49, 2049–2066. doi: 10.1016/S0967-0645(02)00027-29
Coppola, L., Raimbault, P., Mortier, L., and Testor, P. (2019b). Monitoring the environment in the northwestern Mediterranean Sea. EOS 100:951. doi: 10.1029/2019EO125951
Coppola, L., Legendre, L., Lefevre, D., Prieur, L., Taillandier, V., and Diamond Riquier, E. (2018). Seasonal and inter-annual variations of dissolved oxygen in the northwestern Mediterranean Sea (DYFAMED site). Prog. Oceanogr. 162, 187–201. doi: 10.1016/j.pocean.2018.03.001
Claustre, H. (1999). PROSOPE Cruise, Thalassa R/V. Available online at: https://campagnes.flotteoceanographique.fr/campagnes/99040060/
Coppola, L. (2016). MOOSE-GE 2016 Cruise, L’Atalante R/V. Available online at: https://campagnes.flotteoceanographique.fr/campagnes/16000700/
Cortez, P., and Embrechts, M. J. (2013). Using sensitivity analysis and visualization techniques to open black box data mining models. Inform. Sci. 225, 1–17. doi: 10.1016/j.ins.2012.10.039
Cossarini, G., Lazzari, P., and Solidoro, C. (2015). Spatiotemporal variability of alkalinity in the Mediterranean Sea. Biogeosciences 12, 1647–1658. doi: 10.5194/bg-12-1647-2015
Cossarini, G., Mariotti, L., Feudale, L., Mignot, A., Salon, S., Taillandier, V., et al. (2019). Towards operational 3D-Var assimilation of chlorophyll biogeochemical-argo float data into a biogeochemical model of the mediterranean Sea. Ocean Model. 133, 112–128. doi: 10.1016/j.ocemod.2018.11.005
Crispi, G., Mosetti, R., Solidoro, C., and Crise, A. (2001). Nutrients cycling in Mediterranean basins: the role of the biological pump in the trophic regime. Ecol. Model. 138, 101–114. doi: 10.1016/S0304-3800(00)00396-393
Dickson, A. G. (1990). Standard potential of the reaction: AgCl(s) + ½H2(g) = Ag(s) + HCl(aq), and the standard acidity constant of the ion HSO4- in synthetic sea water from 273.15 to 318.15 K. J. Chem. Thermodyn. 22, 113–127. doi: 10.1016/0021-9614(90)90074-z
Dickson, A. G., and Millero, F. J. (1987). A comparison of the equilibrium constants for the dissociation of carbonic acid in seawater media. Deep Sea Res. 34, 1733–1743. doi: 10.1016/0198-0149(87)90021-5
Diffenbaugh, N. S., Pal, J. S., Giorgi, F., and Gao, X. (2007). Heat stress intensification in the Mediterranean climate change hotspot. Geophys. Res. Lett. 34:GL030000. doi: 10.1029/2007GL030000
Doney, S. C., Fabry, V. J., Feely, R. A., and Kleypas, J. A. (2009). Ocean acidification: the other CO2 problem. Annu. Rev. Mar. Sci. 1, 169–192. doi: 10.1146/annurev.marine.010908.163834
D’Ortenzio, F., Taillandier, V., Claustre, H., Prieur, L. M., Leymarie, E., Mignot, A., et al. (2020). Biogeochemical Argo: the test case of the NAOS Mediterranean array. Front. Mar. Sci. 7:120. doi: 10.3389/fmars.2020.00120
Durrieu De MadronXavier (2011). CASCADE Cruise, L’Atalante R/V. Available online at: https://campagnes.flotteoceanographique.fr/campagnes/11010020/
Environmental Sciences Division, O. R. N. L. (1988). GEOSECS Atlantic, Pacific, Indian, and Mediterranean Radiocarbon Data. doi: 10.3334/CDIAC/OTG.NDP027
Flecha, S., Pérez, F. F., García-Lafuente, J., Sammartino, S., Ríos, A. F., and Huertas, I. E. (2015). Trends of pH decrease in the Mediterranean Sea through high frequency observational data: indication of ocean acidification in the basin. Sci. Rep. 5:16770. doi: 10.1038/srep16770
Foresee, F. D., and Hagan, M. T. (1997). “Gauss-newton approximation to bayesian learning,” in Proceedings of International Conference on Neural Networks (ICNN’97), Piscataway, NJ.
Fourrier, M. (2020). Dataset used for CANYON-MED training and validation. figshare. doi: 10.6084/m9.figshare.12452795.v1
GOOS (2018). Available online at: https://www.goosocean.org/index.php?option=com_content &view=article&id=14&Itemid=114 (accessed October 31, 2019).
Goyet, C., Hassoun, A. E. R., and Gemayel, E. (2015). Carbonate System During the May 2013 MedSeA Cruise. London: PANGAEA. doi: 10.1594/PANGAEA.841933
Gregor, L., Lebehot, A. D., Kok, S., and Scheel Monteiro, P. M. (2019). A comparative assessment of the uncertainties of global surface ocean CO2 estimates using a machine-learning ensemble (CSIR-ML6 version 2019a) - have we hit the wall? Geosci. Model. Dev. 12, 5113–5136. doi: 10.5194/gmd-12-5113-2019
Hagan, M. T., Demuth, H. B., Beale, M. H., and De Jesus, O. (2014). Neural Network Design, 2nd Edn. Wrocław: Martin T. Hagan.
Hassoun, A. E. R., Gemayel, E., Krasakopoulou, E., Goyet, C., Saab, M. A. A., and Ziveri, P. (2015). Modeling of the total alkalinity and the total inorganic carbon in the mediterranean Sea. J. Water Resour. and Ocean Sci. 4:24. doi: 10.11648/j.wros.20150401.14
Hornik, K., Stinchcombe, M., and White, H. (1989). Multilayer feedforward networks are universal approximators. Neural Netw. 2, 359–366. doi: 10.1016/0893-6080(89)90020-90028
Huertas, I. E. (2007a). Hydrochemistry Measured on Water Bottle Samples During Al Amir Moulay Abdallah Cruise CARBOGIB-2. London: PANGAEA. doi: 10.1594/PANGAEA.618899
Huertas, I. E. (2007b). Hydrochemistry Measured on Water Bottle Samples During Al Amir Moulay Abdallah Cruise CARBOGIB-3. London: PANGAEA. doi: 10.1594/PANGAEA.618898
Huertas, I. E. (2007c). Hydrochemistry Measured on Water Bottle Samples During Al Amir Moulay Abdallah Cruise CARBOGIB-4. London: PANGAEA. doi: 10.1594/PANGAEA.618897
Huertas, I. E. (2007d). Hydrochemistry Measured on Water Bottle Samples During Al Amir Moulay Abdallah Cruise CARBOGIB-5. London: PANGAEA. doi: 10.1594/PANGAEA.618896
Huertas, I. E. (2007e). Hydrochemistry Measured on Water Bottle Samples During Al Amir Moulay Abdallah Cruise CARBOGIB-6. London: PANGAEA. doi: 10.1594/PANGAEA.618895
Huertas, I. E. (2007f). Hydrochemistry Measured on Water Bottle Samples During Garcia del Cid Cruise GIFT-1. London: PANGAEA. doi: 10.1594/PANGAEA.618916
Huertas, I. E. (2007g). Hydrochemistry Measured on Water Bottle Samples During Garcia del Cid Cruise GIFT-2. London: PANGAEA. doi: 10.1594/PANGAEA.618915
Hydes, D., Jiang, Z.-P., Hartman, M. C., Campbell, J., Hartman, S. E., Pagnani, M., et al. (2011). Dissolved Inorganic Carbon, Alkalinity, Temperature, Salinity and DISSOLVED OXYGEN Collected From Profile and Discrete Sample Observations Using Alkalinity titrator, CTD and Other Instruments From the Pacific Celebes in the Alboran Sea, Arabian Sea and Others From 2007-06-11 to 2012-03-18 (NCEI Accession 0081040). Silver Spring, MD: NOAA. doi: 10.3334/CDIAC/OTG.VOS_PC_2007-2012
Jamet, C. (2004). Inversion Neuro-Variationnelle Des Images De La Couleur De L’océan - Restitution des Propriétés Optiques Des Aérosols Et De La Concentration En Chlorophylle-A Pour Les Eaux Du cas I. Available online at: https://tel.archives-ouvertes.fr/tel-00007377/document (accessed February 8, 2018).
Jamet, C., Loisel, H., and Dessailly, D. (2012). Retrieval of the spectral diffuse attenuation coefficient Kd in open and coastal ocean waters using a neural network inversion. J. Geophys. Res. Oceans 117:C10023. doi: 10.1029/2012JC008076
Johnson, K. S., and Claustre, H. (2016). Bringing biogeochemistry into the Argo age. EOS 97:427. doi: 10.1029/2016EO062427
Johnson, K. S., Jannasch, H. W., Coletti, L. J., Elrod, V. A., Martz, T. R., Takeshita, Y., et al. (2016). Deep-Sea DuraFET: a pressure tolerant pH sensor designed for global sensor networks. Analyt. Chem. 88, 3249–3256. doi: 10.1021/acs.analchem.5b04653
Johnson, K. S., Plant, J. N., Coletti, L. J., Jannasch, H. W., Sakamoto, C. M., Riser, S. C., et al. (2017). Biogeochemical sensor performance in the SOCCOM profiling float array. J. Geophys. Res. Oceans 122, 6416–6436. doi: 10.1002/2017JC012838
Johnson, K. S., Plant, J. N., Riser, S. C., and Gilbert, D. (2015). Air oxygen calibration of oxygen optodes on a profiling float array. J. Atmos. Ocean. Technol. 32, 2160–2172. doi: 10.1175/JTECH-D-15-0101.1
Krasakopoulou, E., and Souvermezoglou, E. (2013). Discrete measurements of carbon dioxide and other parameters in the Aegean Sea during the HCMR OTRANTO-5 cruise from February 9 to February 10, 1995 (NCEI Accession 0084544). Silver Spring, MD: NOAA. doi: 10.3334/CDIAC/OTG.HCMR_OTR5_1995
Kress, N., Gertman, I., and Herut, B. (2014). Temporal evolution of physical and chemical characteristics of the water column in the Easternmost Levantine basin (Eastern Mediterranean Sea) from 2002 to 2010. J. Mar. System 135, 6–13. doi: 10.1016/j.jmarsys.2013.11.016
Körtzinger, A., Schimanski, J., Send, U., and Wallace, D. (2004). The ocean takes a deep breath. Science 306, 1337–1337. doi: 10.1126/science.1102557
Krom, M. D., Kress, N., Brenner, S., and Gordon, L. I. (1991). Phosphorus limitation of primary productivity in the eastern Mediterranean Sea. Limnol. Oceanogr. 36, 424–432. doi: 10.4319/lo.1991.36.3.0424
Krom, M. D., Woodward, E. M. S., Herut, B., Kress, N., Carbo, P., Mantoura, R. F. C., et al. (2005). Nutrient cycling in the south east Levantine basin of the eastern Mediterranean: results from a phosphorus starved system. Deep Sea Res. Part II Top. Stud. Oceanogr. 52, 2879–2896. doi: 10.1016/j.dsr2.2005.08.009
Landschützer, P., Gruber, N., Bakker, D. C. E., and Schuster, U. (2014). Recent variability of the global ocean carbon sink. Glob. Biogeochem. Cycles 28, 927–949. doi: 10.1002/2014GB004853
Le Quéré, C., Andrew, R. M., Friedlingstein, P., Sitch, S., Pongratz, J., Manning, A. C., et al. (2018). Global carbon budget 2017. Earth Syst. Sci. Data 10, 405–448. doi: 10.5194/essd-10-405-2018
Lee, K., Sabine, C. L., Tanhua, T., Kim, T.-W., Feely, R. A., and Kim, H.-C. (2011). Roles of marginal seas in absorbing and storing fossil fuel CO2. Energy Environ. Sci. 4, 1133–1146. doi: 10.1039/C0EE00663G
Lefevre, N., Watson, A. J., and Watson, A. R. (2005). A comparison of multiple regression and neural network techniques for mapping in situ pCO2 data. Tellus B 57, 375–384. doi: 10.1111/j.1600-0889.2005.00164.x
Lewis, E., Wallace, D., and Allison, L. J. (1998). Program Developed for CO2 System Calculations. Environmental Sciences Division Publication No. 4735. Oak Ridge, TN: Carbon Dioxide Information Analysis Center.
Linares-Rodriguez, A., Ruiz-Arias, J. A., Pozo-Vazquez, D., and Tovar-Pescador, J. (2013). An artificial neural network ensemble model for estimating global solar radiation from Meteosat satellite images. Energy 61, 636–645. doi: 10.1016/j.energy.2013.09.008
Lindstrom, E., Gunn, J., Fischer, A., McCurdy, A., Glover, L. K., and Members, T. T. (2012). A Framework For Ocean Observing. Paris: UNESCO.
Lovato, T., and Vichi, M. (2015). An objective reconstruction of the Mediterranean Sea carbonate system. Deep Sea Res. Part I Oceanogr. Res. Pap. 98, 21–30. doi: 10.1016/j.dsr.2014.11.018
MacKay, D. J. C. (1992a). A practical bayesian framework for backpropagation networks. Neural Comput. 4, 448–472. doi: 10.1162/neco.1992.4.3.448
MacKay, D. J. C. (1992b). Bayesian interpolation. Neural Comput. 4, 415–447. doi: 10.1162/neco.1992.4.3.415
Marty, J.-C., Chiavérini, J., Pizay, M.-D., and Avril, B. (2002). Seasonal and interannual dynamics of nutrients and phytoplankton pigments in the western Mediterranean Sea at the DYFAMED time-series station (1991-1999). Deep Sea Res. Part II Top. Stud. Oceanogr. 49, 1965–1985. doi: 10.1016/S0967-0645(02)00022-X
Marzban, C. (2009). “Basic statistics and basic AI: neural networks,” in Artificial Intelligence Methods in the Environmental Sciences, eds S. E. Haupt, A. Pasini, and C. Marzban (Dordrecht: Springer), 15–47. doi: 10.1007/978-1-4020-9119-3_2
McGill, D. A. (1966). The Relative Supplies Of Phosphate, Nitrate And Silicate In The Mediterranean Sea. Madrid: CIESM.
Mehrbach, C., Culberson, C. H., Hawley, J. E., and Pytkowicx, R. M. (1973). Measurement of the apparent dissociation constants of carbonic acid in seawater at atmospheric pressure. Limnol. Oceanogr. 18, 897–907. doi: 10.4319/lo.1973.18.6.0897
Millot, C. (1999). Circulation in the western Mediterranean Sea. J. Mar. Syst. 20, 423–442. doi: 10.1016/S0924-7963(98)00078-75
Millot, C., and Taupier-Letage, I. (2005). “Circulation in the mediterranean Sea,” in The Mediterranean Sea, ed. A. Saliot (Berlin: Springer), 29–66. doi: 10.1007/b107143
Mortier, L., Ait Ameur, N., and Taillandier, V. (2014). SOMBA-GE-2014 Cruise, Téthys II R/V. doi: 10.17600/14007500
Niewiadomska, K., Claustre, H., Prieur, L., and d’Ortenzio, F. (2008). Submesoscale physical-biogeochemical coupling across the Ligurian current (northwestern Mediterranean) using a bio-optical glider. Limnol. Oceanogr. 53, 2210–2225. doi: 10.4319/lo.2008.53.5_part_2.2210
Olsen, A., Key, R. M., van Heuven, S., Lauvset, S. K., Velo, A., Lin, X., et al. (2016). The Global Ocean Data analysis project version 2 (GLODAPv2) - an internally consistent data product for the world ocean. Earth Syst. Sci. Data 8, 297–323. doi: 10.5194/essd-8-297-2016
Palmiéri, J., Orr, J. C., Dutay, J.-C., Béranger, K., Schneider, A., Beuvier, J., et al. (2015). Simulated anthropogenic CO2 storage and acidification of the Mediterranean Sea. Biogeosciences 12, 781–802. doi: 10.5194/bg-12-781-2015
Pasqueron de Fommervault, O., Migon, C., D×Ortenzio, F., Ribera d’Alcalà, M., and Coppola, L. (2015). Temporal variability of nutrient concentrations in the northwestern Mediterranean Sea (DYFAMED time-series station). Deep Sea Res. Part I Oceanogr. Res. Pap. 100, 1–12. doi: 10.1016/j.dsr.2015.02.006
Pessini, F., Olita, A., Cotroneo, Y., and Perilli, A. (2018). Mesoscale eddies in the Algerian Basin: do they differ as a function of their formation site? Ocean Sci. 14, 669–688. doi: 10.5194/os-14-669-2018
Piron, A., Thierry, V., Mercier, H., and Caniaux, G. (2016). Argo float observations of basin-scale deep convection in the Irminger sea during winter 2011-2012. Deep Sea Res. Part I Oceanogr. Res. Pap. 109, 76–90. doi: 10.1016/j.dsr.2015.12.012
Piron, A., Thierry, V., Mercier, H., and Caniaux, G. (2017). Gyre-scale deep convection in the subpolar North Atlantic Ocean during winter 2014-2015. Geophys. Res. Lett. 44, 1439–1447. doi: 10.1002/2016GL071895
Pujo-Pay, M., Conan, P., Oriol, L., Cornet-Barthaux, V., Falco, C., Ghiglione, J.-F., et al. (2011). Integrated survey of elemental stoichiometry (C, N, P) from the western to eastern Mediterranean Sea. Biogeosciences 8, 883–899. doi: 10.5194/bg-8-883-2011
Ragueneau, O., Tréguer, P., Leynaert, A., Anderson, R. F., Brzezinski, M. A., DeMaster, D. J., et al. (2000). A review of the Si cycle in the modern ocean: recent progress and missing gaps in the application of biogenic opal as a paleoproductivity proxy. Glob. Planet. Chang. 26, 317–365. doi: 10.1016/S0921-8181(00)00052-57
Redfield, A. C. (1934). “On the proportions of organic derivatives in sea water and their relation to the composition of plankton,” in James Johnstone Memorial Volume, ed. R. Daniel (Liverpool: University Press of Liverpool), 176–192.
Ribera d’Alcalà, M., Civitarese, G., Conversano, F., and Lavezza, R. (2003). Nutrient ratios and fluxes hint at overlooked processes in the Mediterranean Sea. J. Geophys. Res. Oceans 108, C001650. doi: 10.1029/2002JC001650
Riser, S. C., Freeland, H. J., Roemmich, D., Wijffels, S., Troisi, A., Belbéoch, M., et al. (2016). Fifteen years of ocean observations with the global argo array. Nat. Clim. Chang. 6, 145–153. doi: 10.1038/nclimate2872
Rivaro, P., Messa, R., Massolo, S., and Frache, R. (2010). Distributions of carbonate properties along the water column in the Mediterranean Sea: spatial and temporal variations. Mar. Chem. 121, 236–245. doi: 10.1016/j.marchem.2010.05.003
Robinson, C. (2019). Microbial respiration, the engine of ocean deoxygenation. Front. Mar. Sci. 5:533. doi: 10.3389/fmars.2018.00533
Roemmich, D., Alford, M. H., Claustre, H., Johnson, K., King, B., Moum, J., et al. (2019). On the future of argo: a global, full-depth, multi-disciplinary array. Front. Mar. Sci. 6:439. doi: 10.3389/fmars.2019.00439
Rumelhart, D. E., Hintont, G. E., and Williams, R. J. (1986). Learning representations by back-propagating errors. Nature 523, 533–536. doi: 10.1038/323533a0
Sanleón-Bartolomé, H., Alvarez, M., Velo, A., Tanhua, T., and Fajar, N. M. (2017). The CARIMED (CARbon In the MEDiterranean Sea) Data Synthesis Initiative: Overview And Quality Control Procedures. Available online at: http://www.repositorio.ieo.es/e-ieo/handle/10508/11313 (accessed October 31, 2019).
Sauzède, R., Bittig, H. C., Claustre, H., Pasqueron de Fommervault, O., Gattuso, J.-P., Legendre, L., et al. (2017). Estimates of water-column nutrient concentrations and carbonate system parameters in the global ocean: a novel approach based on neural networks. Front. Mar. Sci. 4:128. doi: 10.3389/fmars.2017.00128
Sauzède, R., Claustre, H., Uitz, J., Jamet, C., Dall’Olmo, G., D’Ortenzio, F., et al. (2016). A neural network-based method for merging ocean color and Argo data to extend surface bio-optical properties to depth: retrieval of the particulate backscattering coefficient: bbp vertical profile from satellite data. J. Geophys. Res. Oceans 121, 2552–2571. doi: 10.1002/2015JC011408
Sauzède, R., Martinez, E., Maes, C., Pasqueron de Fommervault, O., Poteau, A., Mignot, A., et al. (2020). Enhancement of phytoplankton biomass leeward of Tahiti as observed by Biogeochemical-Argo floats. J. Mar. Syst. 204:103284. doi: 10.1016/j.jmarsys.2019.103284
Schneider, A., Tanhua, T., Körtzinger, A., and Wallace, D. W. R. (2010). High anthropogenic carbon content in the eastern Mediterranean. J. Geophys. Res. 115:C006171. doi: 10.1029/2010JC006171
Schneider, B., and Roether, W. University Of Bremen (2013). Dissolved Inorganic Carbon, Alkalinity, Temperature, Salinity and Other Variables Collected From Discrete Sample and Profile Observations Using CTD, Bottle and Other Instruments From METEOR in the Aegean Sea, Mediterranean Sea and Others From 2001-10-18 to 2001-11-11 (NCEI Accession 0084620). Silver Spring, MD: NODC. doi: 10.3334/CDIAC/OTG.CARINA_06MT20011018
Schneider, A., Tanhua, T., Roether, W., and Steinfeldt, R. (2014). Changes in ventilation of the Mediterranean Sea during the past 25 year. Ocean Sci. 10, 1–16. doi: 10.5194/os-10-1-2014
A. J. C. Sharkey (ed.) (1999). Combining Artificial Neural Nets: Ensemble and Modular Multi-Net Systems. Berlin: Springer.
Tanhua, T., Hainbucher, D., Schroeder, K., Cardin, V., Álvarez, M., and Civitarese, G. (2013). The Mediterranean Sea system: a review and an introduction to the special issue. Ocean Sci. 9, 789–803. doi: 10.5194/os-9-789-2013
Tanhua, T., McCurdy, A., Fischer, A., Appeltans, W., Bax, N., Currie, K., et al. (2019). What we have learned from the framework for ocean observing: evolution of the global ocean observing system. Front. Mar. Sci. 6:471. doi: 10.3389/fmars.2019.00471
Testor, P., Coppola, L., and Mortier, L. (2010). MOOSE-GE 2010 Cruise, Téthys II R/V. Washington, DC: AGU. doi: 10.17600/10450080
Testor, P., Coppola, L., and Mortier, L. (2011). MOOSE-GE 2011 Cruise, Téthys II R/V. Washington, DC: AGU. doi: 10.17600/11450160
Testor, P., Coppola, L., and Mortier, L. (2012). MOOSE-GE 2012 Cruise, Le Suroît R/V. Washington, DC: AGU. doi: 10.17600/12020030
Testor, P., Coppola, L., and Mortier, L. (2013). MOOSE-GE 2013 Cruise, Téthys II R/V. Washington, DC: AGU. doi: 10.17600/13450110
Testor, P., Coppola, L., and Mortier, L. (2014). MOOSE-GE 2014 Cruise, Le Suroît R/V. Washington, DC: AGU. doi: 10.17600/14002300
Testor, P., Coppola, L., and Mortier, L. (2015). MOOSE-GE 2015 Cruise, Le Suroît R/V. Washington, DC: AGU. doi: 10.17600/15002500
Testor, P., de Young, B., Rudnick, D. L., Glenn, S., Hayes, D., Lee, C. M., et al. (2019). OceanGliders: a component of the Integrated GOOS. Front. Mar. Sci. 6:422. doi: 10.3389/fmars.2019.00422
Tintoré, J., Pinardi, N., Álvarez-Fanjul, E., Aguiar, E., Álvarez-Berastegui, D., Bajo, M., et al. (2019). Challenges for sustained observing and forecasting systems in the mediterranean Sea. Front. Mar. Sci. 6:568. doi: 10.3389/fmars.2019.00568
Touratier, F., and Goyet, C. (2009). Decadal evolution of anthropogenic CO2 in the northwestern Mediterranean Sea from the mid-1990s to the mid-2000s. Deep Sea Res. Part I Oceanogr. Res. Pap. 56, 1708–1716. doi: 10.1016/j.dsr.2009.05.015
Touratier, F., and Goyet, C. (2011). Impact of the eastern mediterranean transient on the distribution of anthropogenic CO2 and first estimate of acidification for the mediterranean Sea. Deep Sea Res. Part I Oceanogr. Res. Pap. 58, 1–15. doi: 10.1016/j.dsr.2010.10.002
Uppström, L. R. (1974). The boron/chlorinity ratio of deep-sea water from the Pacific Ocean. Deep Sea Res. 21, 161–162. doi: 10.1016/0011-7471(74)90074-6
van Heuven, S., Pierrot, D., Rae, J., Lewis, E., and Wallace, D. W. R. (2011). CO2SYS v 1.1, MATLAB Program Developed for CO2 System Calculations. ORNL/CDIAC-105b. Oak Ridge, TN: Oak Ridge National Laboratory.
Velo, A., Pérez, F. F., Tanhua, T., Gilcoto, M., Ríos, A. F., and Key, R. M. (2013). Total alkalinity estimation using MLR and neural network techniques. J. Mar. Syst. 111–112, 11–18. doi: 10.1016/j.jmarsys.2012.09.002
Viúdez, A., Pinot, J.-M., and Haney, R. L. (1998). On the upper layer circulation in the Alboran Sea. J. Geophys. Res. Oceans 103, 21653–21666. doi: 10.1029/98JC01082
Wang, Z. A., Moustahfid, H., Mueller, A. V., Michel, A. P. M., Mowlem, M., Glazer, B. T., et al. (2019). Advancing observation of ocean biogeochemistry, biology, and ecosystems with cost-effective in situ sensing technologies. Front. Mar. Sci. 6:519. doi: 10.3389/fmars.2019.00519
Weller, R. A., Baker, D. J., Glackin, M. M., Roberts, S. J., Schmitt, R. W., Twigg, E. S., et al. (2019). The challenge of sustaining ocean observations. Front. Mar. Sci. 6:105. doi: 10.3389/fmars.2019.00105
Keywords: nutrients, carbonate system, Mediterranean Sea, neural network, CANYON
Citation: Fourrier M, Coppola L, Claustre H, D’Ortenzio F, Sauzède R and Gattuso J-P (2020) A Regional Neural Network Approach to Estimate Water-Column Nutrient Concentrations and Carbonate System Variables in the Mediterranean Sea: CANYON-MED. Front. Mar. Sci. 7:620. doi: 10.3389/fmars.2020.00620
Received: 10 March 2020; Accepted: 07 July 2020;
Published: 06 August 2020.
Edited by:
Ananda Pascual, Mediterranean Institute for Advanced Studies (IMEDEA), SpainReviewed by:
Ming Fang, Changchun University of Science and Technology, ChinaManuel Lopez Radcenco, UMR 8617 Institut d’Astrophysique Spatiale (IAS), France
Copyright © 2020 Fourrier, Coppola, Claustre, D’Ortenzio, Sauzède and Gattuso. This is an open-access article distributed under the terms of the Creative Commons Attribution License (CC BY). The use, distribution or reproduction in other forums is permitted, provided the original author(s) and the copyright owner(s) are credited and that the original publication in this journal is cited, in accordance with accepted academic practice. No use, distribution or reproduction is permitted which does not comply with these terms.
*Correspondence: Marine Fourrier, bWFyaW5lLmZvdXJyaWVyQG9icy12bGZyLmZy