 Susanne Tonheim
 Aril Slotte2
 Leif Andersson
 Arild Folkvord
 Florian Berg
- 1Department of Biological Sciences, University of Bergen, Bergen, Norway
- 2Institute of Marine Research (IMR), Bergen, Norway
- 3Science for Life Laboratory, Department of Medical Biochemistry and Microbiology, Uppsala University, Uppsala, Sweden
- 4Department of Animal Breeding and Genetics, Swedish University of Agricultural Sciences, Uppsala, Sweden
- 5Department of Veterinary Integrative Biosciences, Texas A&M University, College Station, TX, United States
Atlantic herring (Clupea harengus) is a euryhaline species, occupying fully marine habitats (35 psu) in the North Atlantic, as well as brackish waters (<20 psu) such as in the adjacent Baltic Sea. We co-reared Atlantic purebreds and Atlantic/Baltic F1 hybrids in two salinity regimes (16 and 35 psu) in a common garden experiment for 3 years until their first maturity. This setup enabled for the first time a direct comparison between adults and their larval siblings at respective salinity regimes in terms of larval growth indicated by otolith microstructure. We validated that otolith microstructure analysis of adult otoliths is reflecting the experienced otolith growth during the larval stage. No major selection in terms of otolith growth had taken place during the juvenile stage, except for one experimental group. Surviving adult Atlantic purebreds reared at 16 psu had higher otolith growth compared to their larval stages. The validation that otolith microstructure analyses of adult herring can reliably be extracted and used to examine larval growth even after several years adds strong support for further use of such analyses. Among the parental generation, Baltic herring had a faster initial otolith growth than Atlantic herring. The growth of their laboratory-reared F1 progeny was intermediate compared to their parents. In general, larval growth of both Atlantic purebreds and Atlantic/Baltic hybrids reared in 16 psu was significantly larger than for those herring reared at 35 psu. There was no significant difference in larval growth between Atlantic purebreds and Atlantic/Baltic hybrids reared at 35 psu, but hybrid larval growth was significantly higher compared to larval growth of Atlantic purebreds at 16 psu. This was not reflected at the adult stage where purebreds were ultimately larger than hybrids (Berg et al., 2018). This indicates the influence and importance of environmental and genetic factors throughout the life of Atlantic herring, along with genetic contributions to phenotypic variability.
Introduction
Phenotypic characteristics of marine fish are the result of the interaction between their genotype and the prevailing environmental conditions (Swain and Foote, 1999; Mitchell-Olds et al., 2007; Barrett and Hoekstra, 2011). Non-genetic changes of phenotypes in response to environmental factors is known as phenotypic plasticity (Via et al., 1995). Otoliths are amenable structures to study the extent of phenotypic plasticity since they allow for estimation of age and growth of individual fish (Campana and Thorrold, 2001). Pannella (1971) initially hypothesized that otolith growth occurs by daily increments which was later confirmed for a variety of species (Brothers et al., 1976; Rey et al., 2016; Gibb et al., 2020). The formation of daily increments was also validated for several life stages from larvae to adults (Panfili and Tomas, 2001; Cermeño et al., 2003). These daily increments are the baseline for otolith microstructure analysis being the most applied approach in otolith science (Campana, 2005). Further, otolith chemistry studies validated that the information stored during the larval stage can be still detected in adult otoliths (Gillanders, 2002; Reis-Santos et al., 2013; Rogers et al., 2019). It is, therefore, justifiable to assume that the observed microstructure of adult otoliths still reflects the larval daily growth even after several years of living. In theory, the larval otolith microstructure should not alter in adult otoliths, but the accuracy of daily increment measurements from adult otoliths might be limited (Campana and Jones, 1992). So far, no studies have directly compared if the microstructure formed at early life stages remains reliably measurable and unaltered for analyses in the otoliths from adult life stages. All studies using adult otoliths to investigate the early life history of fish assume that the otolith microstructure reflects the growth pattern experienced at the larval stage.
In general, the growth of otoliths, both on daily or yearly level, is affected by factors like temperature (Folkvord et al., 2004), photoperiod (Mugiya, 1987), or prey density (Johannessen et al., 2000). Otolith microstructure analyses are commonly used for reconstructing individual daily growth patterns during the larval and juvenile stage of fish (Baumann et al., 2006; Gagliano et al., 2007) as well as for adults (Morrongiello and Thresher, 2015). Individual back-calculation of ages using the otolith microstructure is only applicable for young-of-year fish before the onset of the winter ring formation in most temperate species (Pringle and Baumann, 2019). Further, the otolith microstructure can be used to link larval growth to recent environmental histories (Bailey and Heath, 2001; Baumann et al., 2003) or to infer dispersal pathways (Kokita and Omori, 1999; Brophy and King, 2007). In cases of sufficiently distinct spawning areas or seasons, the fidelity and integrity of adult populations can be assessed by otolith microstructure (Husebø et al., 2005; Brophy et al., 2006).
Given this knowledge gap and missing evaluation of using adult otoliths to examine larval growth, our main objective was to conduct such an evaluation based on otoliths from full-siblings, sampled as larvae or adults, that had experienced the same early-life environmental conditions. Such an evaluation is needed to strengthen the support of studies conducting otolith microstructure analysis on adult otoliths. We used offspring of Atlantic herring (Clupea harengus) that were reared in a common garden experiment for 3 years (Berg et al., 2018). This long-time experimental design thus enabled a direct comparison of larval growth between the adults and their larval siblings from the same generation. We hypothesized that otolith microstructure of larvae and adults reared under common garden conditions should be the same.
Further, common garden experiments give a unique possibility to investigate the influence of environmental factors based on the rearing of offspring from different populations under identical environmental conditions. In this case, Atlantic herring was used due to its phenotypic plasticity (Geffen, 2009) as well as complex population structure (Iles and Sinclair, 1982). Especially for herring, otolith microstructure analysis is essential because it is used in stock assessment to identify spring, autumn, and winter spawning herring (Mosegaard and Madsen, 1996; Clausen et al., 2007). Two of the most distinct herring populations are probably Norwegian spring spawners (NSS) and central Baltic (CB) spring spawners (henceforth denoted as Atlantic and Baltic, respectively), differing both phenotypically (Gröhsler et al., 2013; Berg et al., 2017), and genetically (Martinez Barrio et al., 2016; Pettersson et al., 2019), as well as in ambient environmental conditions (fully marine vs. brackish conditions). Therefore, herring in the central Baltic are often specified as a subspecies Clupea harengus membras. Salinity is an environmental factor that is mostly neglected when applying otolith microstructure analysis but linked to a large proportion of the genetic differences among herring populations (Lamichhaney et al., 2012; Martinez Barrio et al., 2016). We conducted a case study, where we focused on the effect of salinity and genetics on phenotypic traits. We used Atlantic and Baltic purebreds as well as Atlantic/Baltic hybrids were reared under controlled conditions with fixed salinities of either 6, 16, or 35 psu (Berg et al., 2018, 2020a). For this case study, we first hypothesized that salinity influences the somatic growth and otolith microstructure and secondly that Atlantic/Baltic hybrids may benefit from the combination of genes displaying highest somatic and otolith growth (i.e., hybrid vigor). The second hypothesis is based on previous crossing experiments with seasonal light regimes (Folkvord et al., 2009), where hybrids outperformed purebred larvae of autumn spawners at both spring and autumn light regimes.
Materials and Methods
Population Samples and Larval Rearing
Wild spring spawning Atlantic herring (Clupea harengus) were used as parental fish to produce first (F1) generation filial herring used in this study. The parental herring populations originated from two different environments: one fully marine environment (35 psu) along the south-western Norwegian coast adjacent to the Atlantic Ocean and one brackish environment (6 psu) in the central Baltic Sea. Norwegian spring spawning-herring were caught approximately 26 km west of Bergen, Norway (60°34′11.2″N 5°0′18.9″E). Central Baltic herring were caught at Hästskär approximately 80 km North of Uppsala, Sweden (60°38′52.0″N 17°48′44.2″E). Both parental populations were caught 21st of May 2013 by gillnets. After net retrieval, euthanized herring were transported to the lab facilities in Bergen for the fertilization experiments. A short summary of the experimental setup will be presented, however, for a detailed experiment description see Berg et al. (2018) and Berg et al. (2019).
For this case study, one single Atlantic female was crossed with one single Atlantic male to produce Atlantic purebred herring (Table 1). Further, one Baltic female was crossed with one Baltic male to produce Baltic purebred herring. The same Atlantic female was also crossed with the same Baltic male producing Atlantic/Baltic F1 hybrids. The rationale of the experimental setup (e.g., the use of single parental crossing) used for this case study will be further elaborated in section “Discussion.” The original plan was to co-rear the F1 progeny, consisting of Atlantic purebreds, Baltic purebreds, and Atlantic/Baltic hybrids, in a common garden experiment using three different salinities (6, 16, and 35 psu) with a water temperature of ∼9°C (see Berg et al. (2018) for details of minimal seasonal fluctuations) and natural light regime corresponding to the light regime at the sampling locations of the parental herring populations (60°N). These salinity regimes were chosen to simulate the original salinities found in Atlantic water (35 psu) and central Baltic water (6 psu) in addition to an intermediate salinity regime of 16 psu. However, due to limited numbers of larvae, we had to adjust the initial experimental setup. Another Atlantic crossing between an additional Atlantic female and male was conducted to produce extra Atlantic purebred larvae to supplement the number of larvae in one of the tanks (Tank 1, 6 psu, see Table 1). Atlantic purebreds and Atlantic/Baltic hybrids were co-reared (approx. ratio 2 hybrids to 1 purebred) at salinities 16 and 35 with two replicates per salinity (Table 1). Baltic purebreds could solely be reared in a single tank at 16 psu (Table 1) because the fertilization success and incubation salinity were too low to supply more larvae. We chose 16 psu for the Baltic purebreds instead of 6 psu because of lacking experiences with rearing of herring at lower salinities. The survival of both Baltic purebreds and larvae at 6 psu was low. Consequently, the 6 psu group was terminated after 4 months and the purebred Baltic group after 24 months. Herring juveniles at 16 and 35 psu were reared until maturity 3 years later. Larvae were fed ad libitum with live feed consisting of algae (Rhodomonas and Isochrysis spp.), rotifers (Brachionus spp.), and natural zooplankton and later Artemia spp. After 3 months the herring were given dry feed.
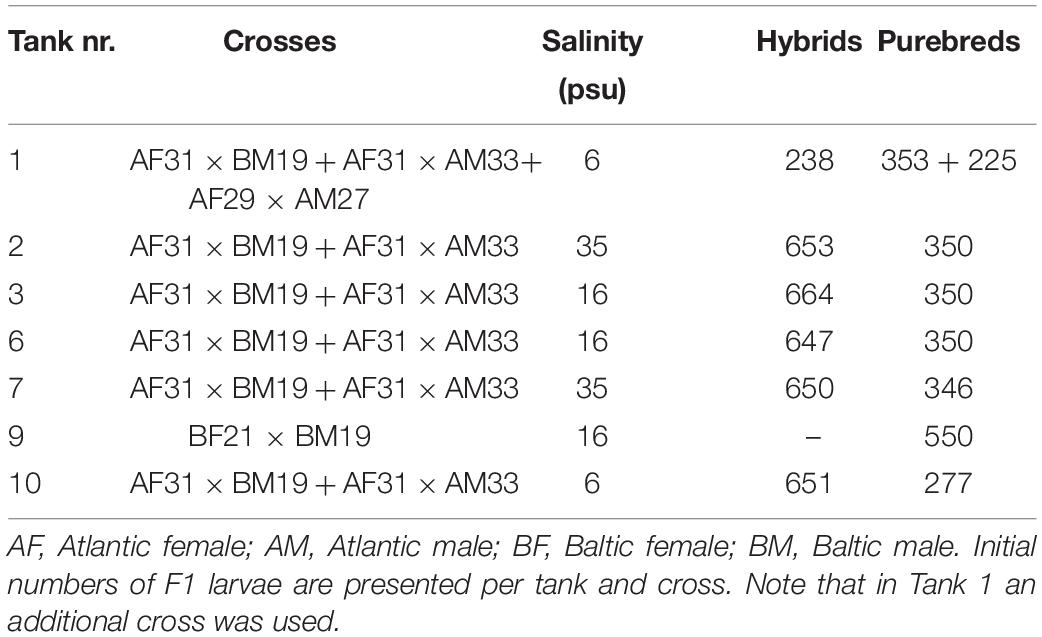
Table 1. Overview of parents used for producing the F1 progeny.
Weekly samples of 10 larvae from each of the different tanks were routinely taken throughout the larval period (approximately 3 months). The number of 10 larvae was based on prior experienced variability in somatic traits between individuals of replicate units (2 × 10, i.e., 20 per treatment), and the considerations regarding animal welfare to reduce the number of animals used for experimentation. In addition, two main samples were conducted 57 and 71 days post hatching (DPH), respectively. Directly after sampling, the standard length of larvae was measured. Further, the larvae were then dried at 55°C for 24 h before measuring the dry weight. Further, routine samples were taken throughout the whole period from the juvenile to the adult stage. Standard length, sex, weight, and maturity stage were determined alongside with otolith extraction for each individual fish. Sampled herring were post-mortem identified as Atlantic purebreds or Atlantic/Baltic hybrids by genotyping a diagnostic SNP using a Custom TagMan® Assay Design Tool (Berg et al., 2018). Somatic parameters of F1 adults are presented in Berg et al. (2018). A bacterial infection was discovered in the 35 psu salinity tank only, 590 DPH. The infection was caused by Tenacibaculum spp. and the herring were put under an antibiotic treatment. Sick and weakened fish were selectively excluded from the experiment. The growth of surviving fish was not influenced by the antibiotic treatment based on a comparison of growth rates before and after the treatment. After 3 years we thus had four experimental groups in the F1 progeny that were followed from larval life stages to adult life stages: Atlantic purebreds reared at 16 psu, Atlantic/Baltic hybrids reared at 16 psu, Atlantic purebreds reared at 35 psu and Atlantic/Baltic hybrids reared at 35 psu (Berg et al., 2019).
Otolith Extraction and Analysis
Larval Herring Otolith Extraction
The selected larvae used in this study (Table 2) were rehydrated before dissection of both sagittal otoliths. Otoliths were mounted on microscope glass slides using QuickStick 135 Mounting Wax, with the proximal (convex side) facing up. Multiple images were taken with 40× magnification with a Nikon camera (camera: DS-Fi2, control unit: DS-U3) attached to an Olympus BX microscope for further microstructure analysis of each otolith. In total, 59 and 86 pairs of otoliths from the two main larval samplings were used for otolith microstructure analysis. Additional 7 individual otoliths from extra samplings (50 and 64 DPH) were specifically chosen to ensure sufficient numbers of Atlantic purebred larvae and to improve the unbalanced group sizes (Table 2).
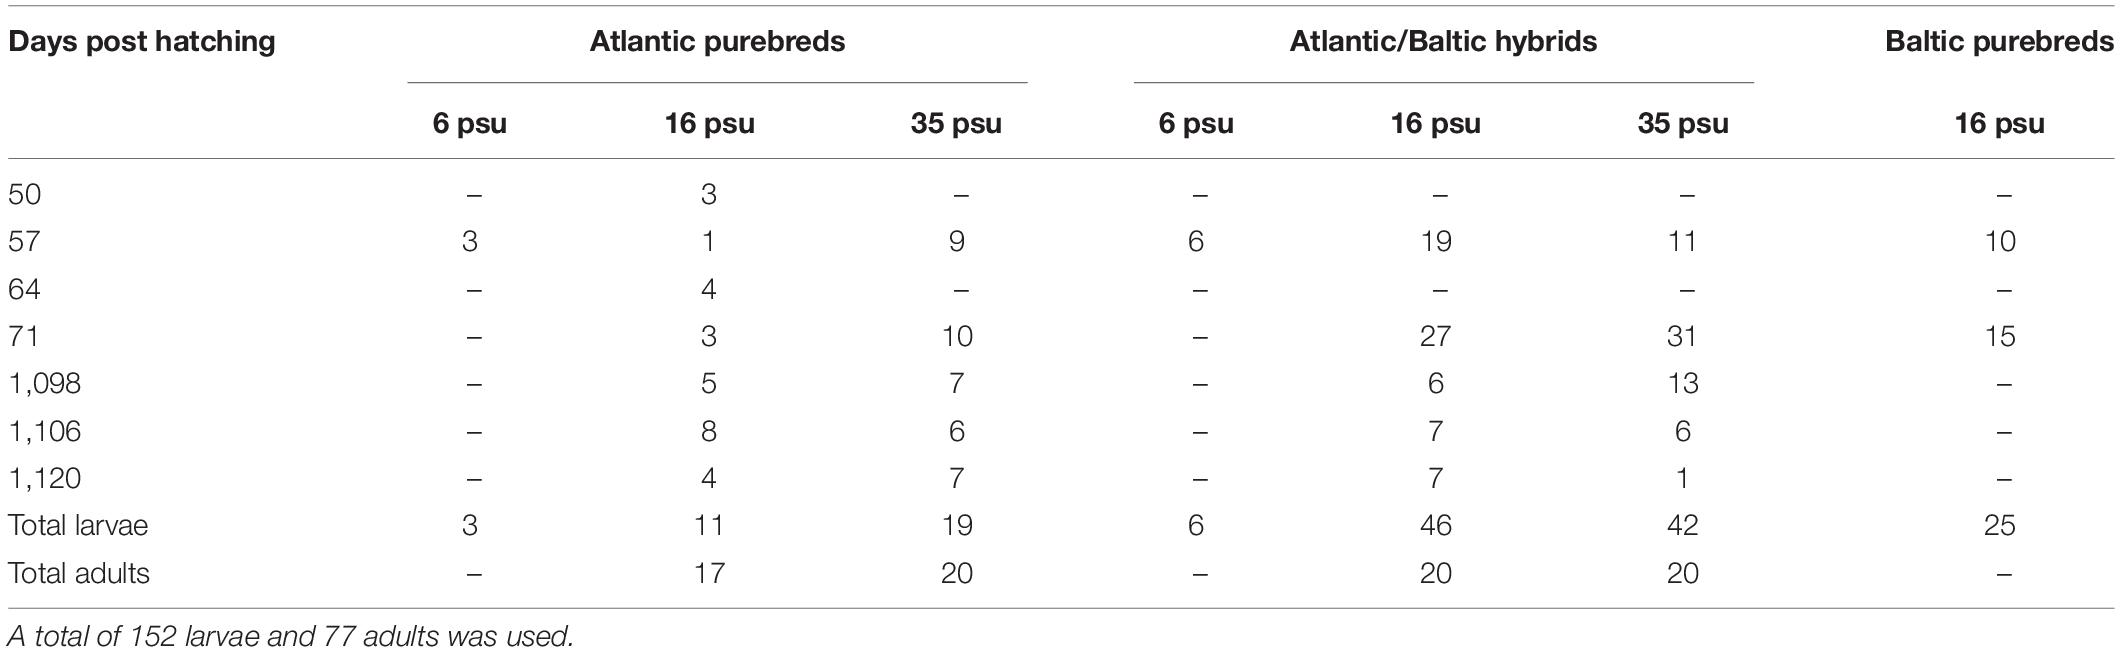
Table 2. Overview of number of F1 progeny larvae (50–71 days post hatching = DPH) and adults (1098-1120 DPH) used for otolith microstructure analysis from various sampling dates and different salinities.
Adult Herring Otolith Extraction
Only otoliths from 3-year-old adult F1 herring, sampled 1098, 1106, and 1120 DPH, were used within this study. In addition, otoliths from the parental populations were included in the otolith microstructure analysis. One otolith from each individual was mounted on glass slides using Crystalbond with the sulcus acusticus facing up. The otoliths were further ground (grit 600 grinding paper) and polished (grit 1200 grinding paper). The slides were thereafter reheated, and the otoliths flipped, so the distal side was facing up. The process of grinding and polishing was repeated on the distal side of the otolith until the core and the microstructure of the otolith appeared clear and visible when using a Leica DMLB light microscope with a 20× magnification. A series of pictures was taken for each otolith with a Nikon camera (same as above) attached to the light microscope for microstructure analysis. A total of 97 wild Atlantic herring and 48 wild Baltic herring were sampled from gillnet samples from 2013, and 17 otoliths were analyzed from each parental population. In total 202 adult F1 herring were randomly collected across the two salinity regimes at three different sampling days in 2016. For each of the four experimental groups (Atlantic purebreds at 16 or 35 psu, Atlantic/Baltic hybrids at 16 or 35 psu), 20 otoliths of adult F1 herring were analyzed (Table 2). However, the total number of Atlantic purebreds at 16 psu was limited to 17 individuals.
Otolith Microstructure Analysis
The otolith microstructure analysis was carried out on calibrated digital images. For larvae otoliths, the otolith microstructure along the longest possible radius of the otolith was used. Daily increments were measured from the core to the outer edge using ImageJ version 1.46r (National Institutes of Health, United States). The first visible increment termed the “first check” (Folkvord et al., 2004), while the next annotation was the first pronounced and (presumed) daily increment. The widths of all the increments, from the first daily increment (excluding the first check) toward the outer margin were measured. For adult otoliths, the Caliper function in Image-Pro Plus® version 7.0 (Media Cybernetics, United States) was used to automatically detect the daily increments. Otolith annotations were individually verified, and additional or missing increments were manually removed or added, respectively, to avoid any misinterpretation. Only increments with a minimum distance of 20 μm from the core were used for the analyses because former increments are not necessarily daily or easily discernible (Geffen, 1982; Campana et al., 1987; Fox et al., 2003). For larvae, all increments until the edge of the otolith were measured. In combination with the exact known age of larvae, we could assign each increment to a given day and could, therefore, back-calculate the age of the otolith at a specific distance from the core. Such an exact back-calculation of the age based on the number of increments was not possible for adult otoliths because only a part of the otolith increments (approximately up to 150–200 μm from the core) were measured. Therefore, distance from otolith core was chosen for this comparison of otoliths from larvae and adults.
Statistical Analysis
All statistical analyses and plotting were conducted in the R software (R Core Team, 2019). For all tests, we used p < 0.05 as the level of significance. The best-fitting model explaining the data was selected based on the Akaike information criterion (AIC). The model with the lowest AIC was chosen, in case the AIC difference was <2 the simpler model was selected.
For the F1 progeny, both for larvae and adults, only Atlantic purebreds and Atlantic/Baltic hybrids from 16 and 35 psu were used for statistical analysis. These groups were also the only ones available at adult stages after 3 years. Other groups (herring reared at 6 psu and Baltic purebreds at 16 psu) were excluded from statistical testing due to low sample size and lacking coverage across life stages and are only included in graphs for visual comparison.
The somatic growth measurements weight, length (total length for adults and standard length for larvae), and otolith radius were generally log-transformed, both for the parental and F1 progeny, while we used the untransformed standard length for the growth estimates of F1 larvae. We used simple linear models for the estimation of somatic growth. The final model explaining the somatic growth of the parental population was:
where weight is the wet weight, TL the total length, and Pop the population (Atlantic vs. Baltic). The growth of F1 larvae was best fitted by the following model:
where SL is the standard length of larvae, Age the age in days post hatching, and Sal the rearing salinity. All larvae sampled were included in this model, but not all of them were genetically identified. Therefore, only salinity was added as a covariate.
For the following analyses, only larvae included for the otolith microstructure were used. All these larvae were genetically identified and genetics (Atlantic purebreds vs. Atlantic/Baltic hybrids) was included as a factor in the initial models.
where DW is the dry weight, Gen the genetics of the larvae (Atlantic purebred and Atlantic/Baltic hybrid), and OR the otolith radius of each larval otolith.
For the otolith microstructure, we used linear mixed-effects models. First, the optimal structure of the random effects was tested using likelihood estimations (REML) (Zuur et al., 2009). The fixed effects structure was selected based on AIC. All mixed-effects models were fitted using the “lme” function within the “nlme” R-package (Pinheiro and Bates, 2000).
For all models on the otolith microstructure, both for the parental and F1 progeny, we used only increments between 30 and 100 μm distance from the core of an otolith. The distance from the core was also log-transformed for all models on the otolith microstructure to accomplish overall linearity in the increment width vs. otolith size relationship. For each model, the first observation j = 1 was the first increment after a distance >30 μm of the individual otolith i and the last observation was the last increment before a distance <100 μm. The term ai is the random intercept for the individual otolith i. The final models describing best the otolith growth for the parental generation was:
for the F1 progeny, both for larvae and adults:
where Width is the width between the increment j and the next increment, Dis the log-transformed distance from the core to the increment j, Pop the parental population (Atlantic vs. Baltic), Sal the rearing salinity (16 vs. 35 psu), and Gen the genetics of the F1 progeny (Atlantic purebreds vs. Atlantic/Baltic hybrids). The population, salinity, and genetics were categorical variables.
The last models we used were to compare if larvae and adults of the F1 progeny had similar daily otolith growth. This analysis was conducted for hybrids and purebreds separately to identify potential growth-dependent selection within each group. The following model was selected based on the lowest AIC for hybrids:
and for purebreds:
In case significant statistical interactions were noted, Tukey contrasts were performed on combined groups using the multcomp package in R (Hothorn et al., 2008), to evaluate overall differences of main factors. Further, we estimated the ratio between hybrids and purebreds as a proxy for growth-independent mortality during the larval stage (<80 DPH). The ratio between hybrids and purebreds for juvenile and adult fish (>180 DPH) has been previously published by Berg et al. (2019).
Results
Parental Populations
Somatic Parameters
The mean total length and weight of Atlantic herring (N = 97) was 32.2 ± 1.9 cm (mean ± standard deviation) and 273.0 ± 44.7 g, respectively, while it was 20.2 ± 1.0 cm and 55.5 ± 9.7 g for Baltic herring (N = 48) (Figure 1).
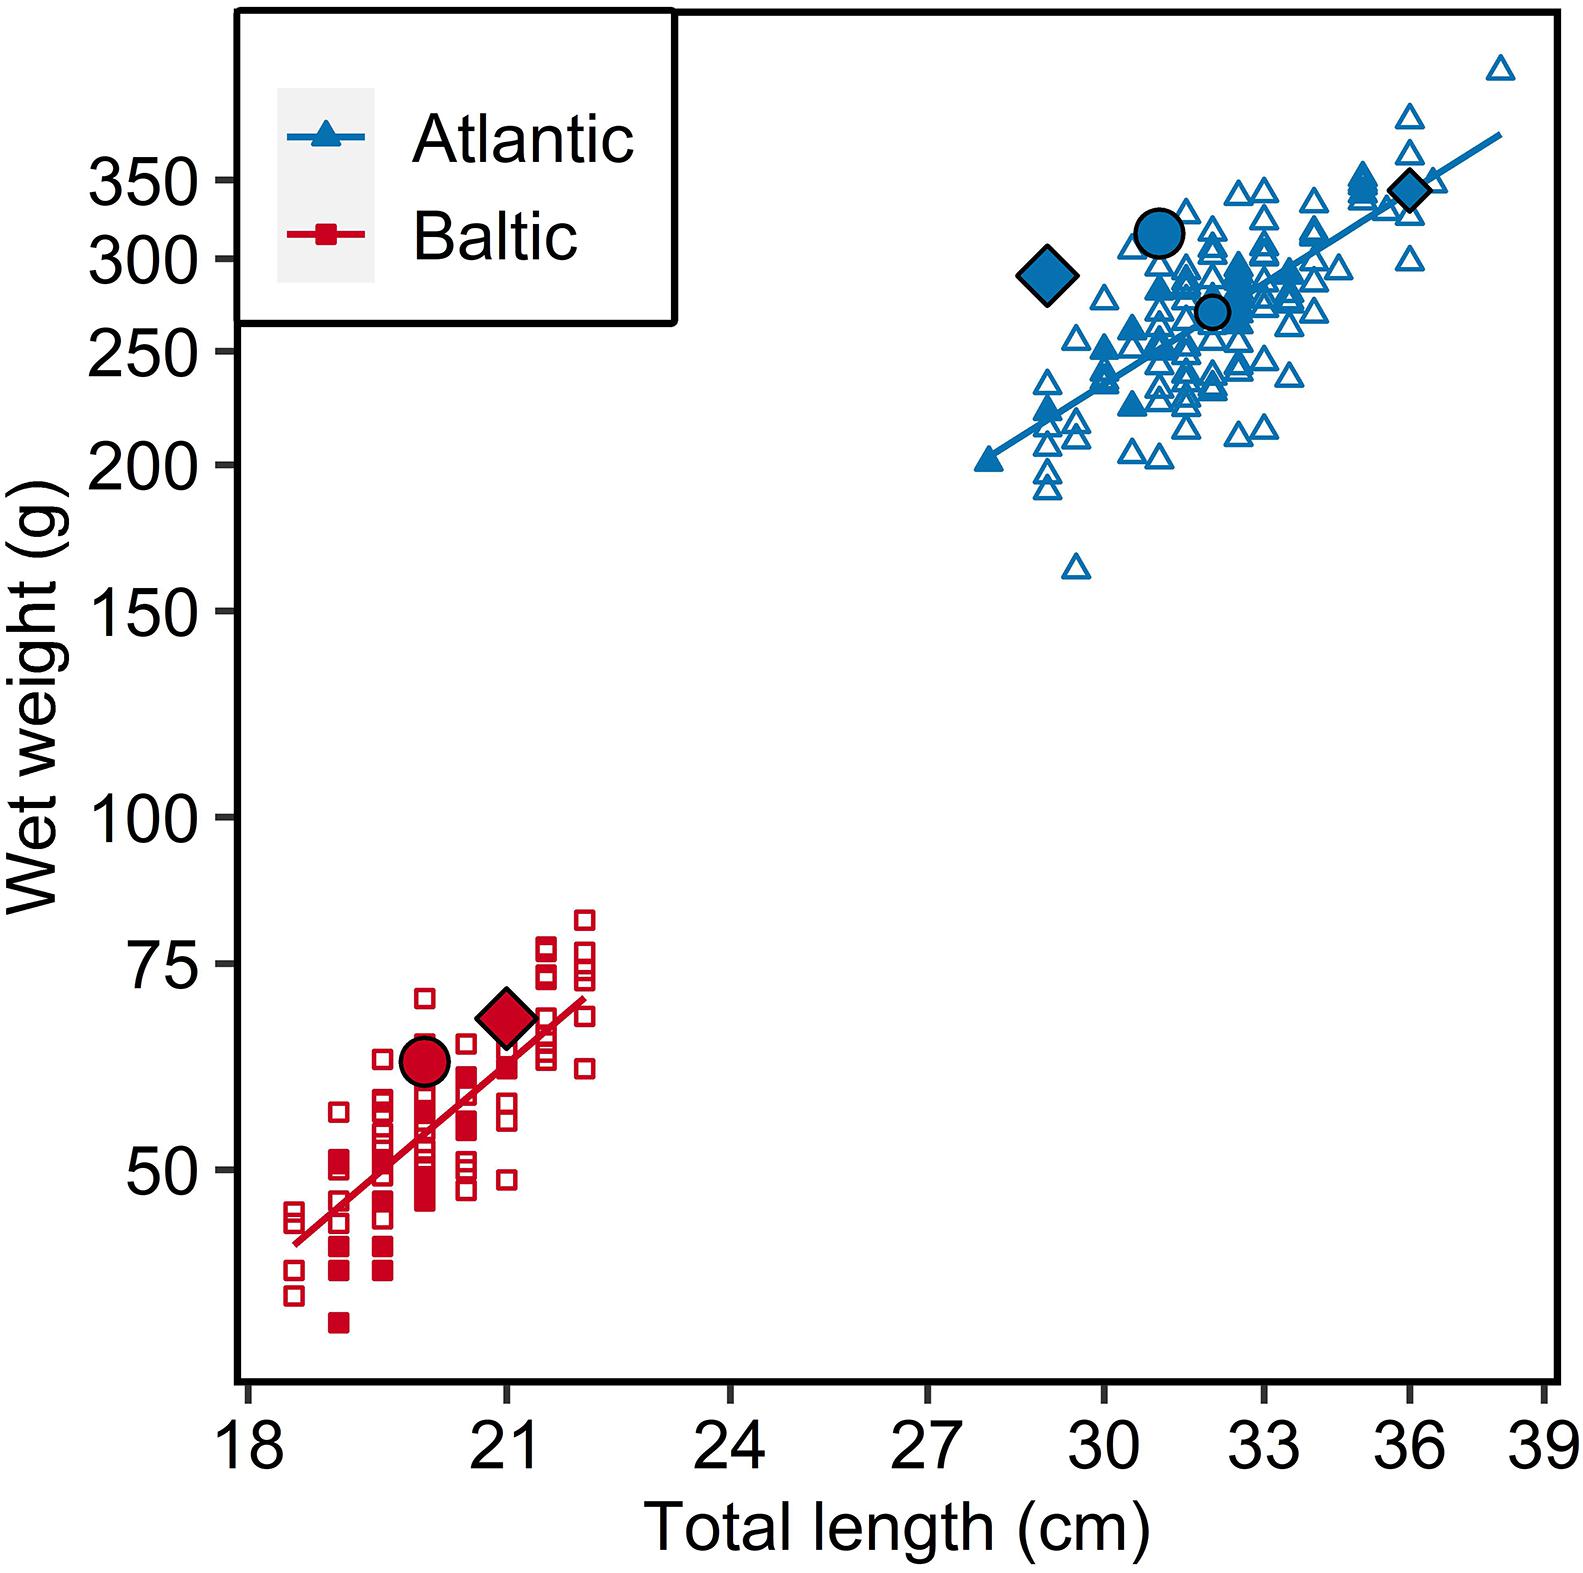
Figure 1. Length-weight relationship of Atlantic (N = 97) and Baltic (N = 48) parental herring. Filled points represent individuals used for otoliths analysis (17 individuals from each parental population), largest points represent main parental fish (Diamond = female; circle = male) used in crossing, medium sized points represent additional parents used for 6 psu group in tank 1. Fitted lines represent regressions from statistical model on logarithmic values.
Otolith Microstructure
Both populations had a steady increase in increment widths with increasing distance from the core. The Baltic parental population had wider increments in the beginning, but the increase in daily otolith growth was lower compared to the Atlantic parental population (ANOVA, F1,897 = 9,51, p < 0.01; Figure 2 and Supplementary Table S8). After 100 μm the increments of both populations followed different trajectories, whereas the otolith growth of Baltic herring continued increasing, even though to a lower extent than previously, the otolith growth of Atlantic herring was decreasing (Figure 2).
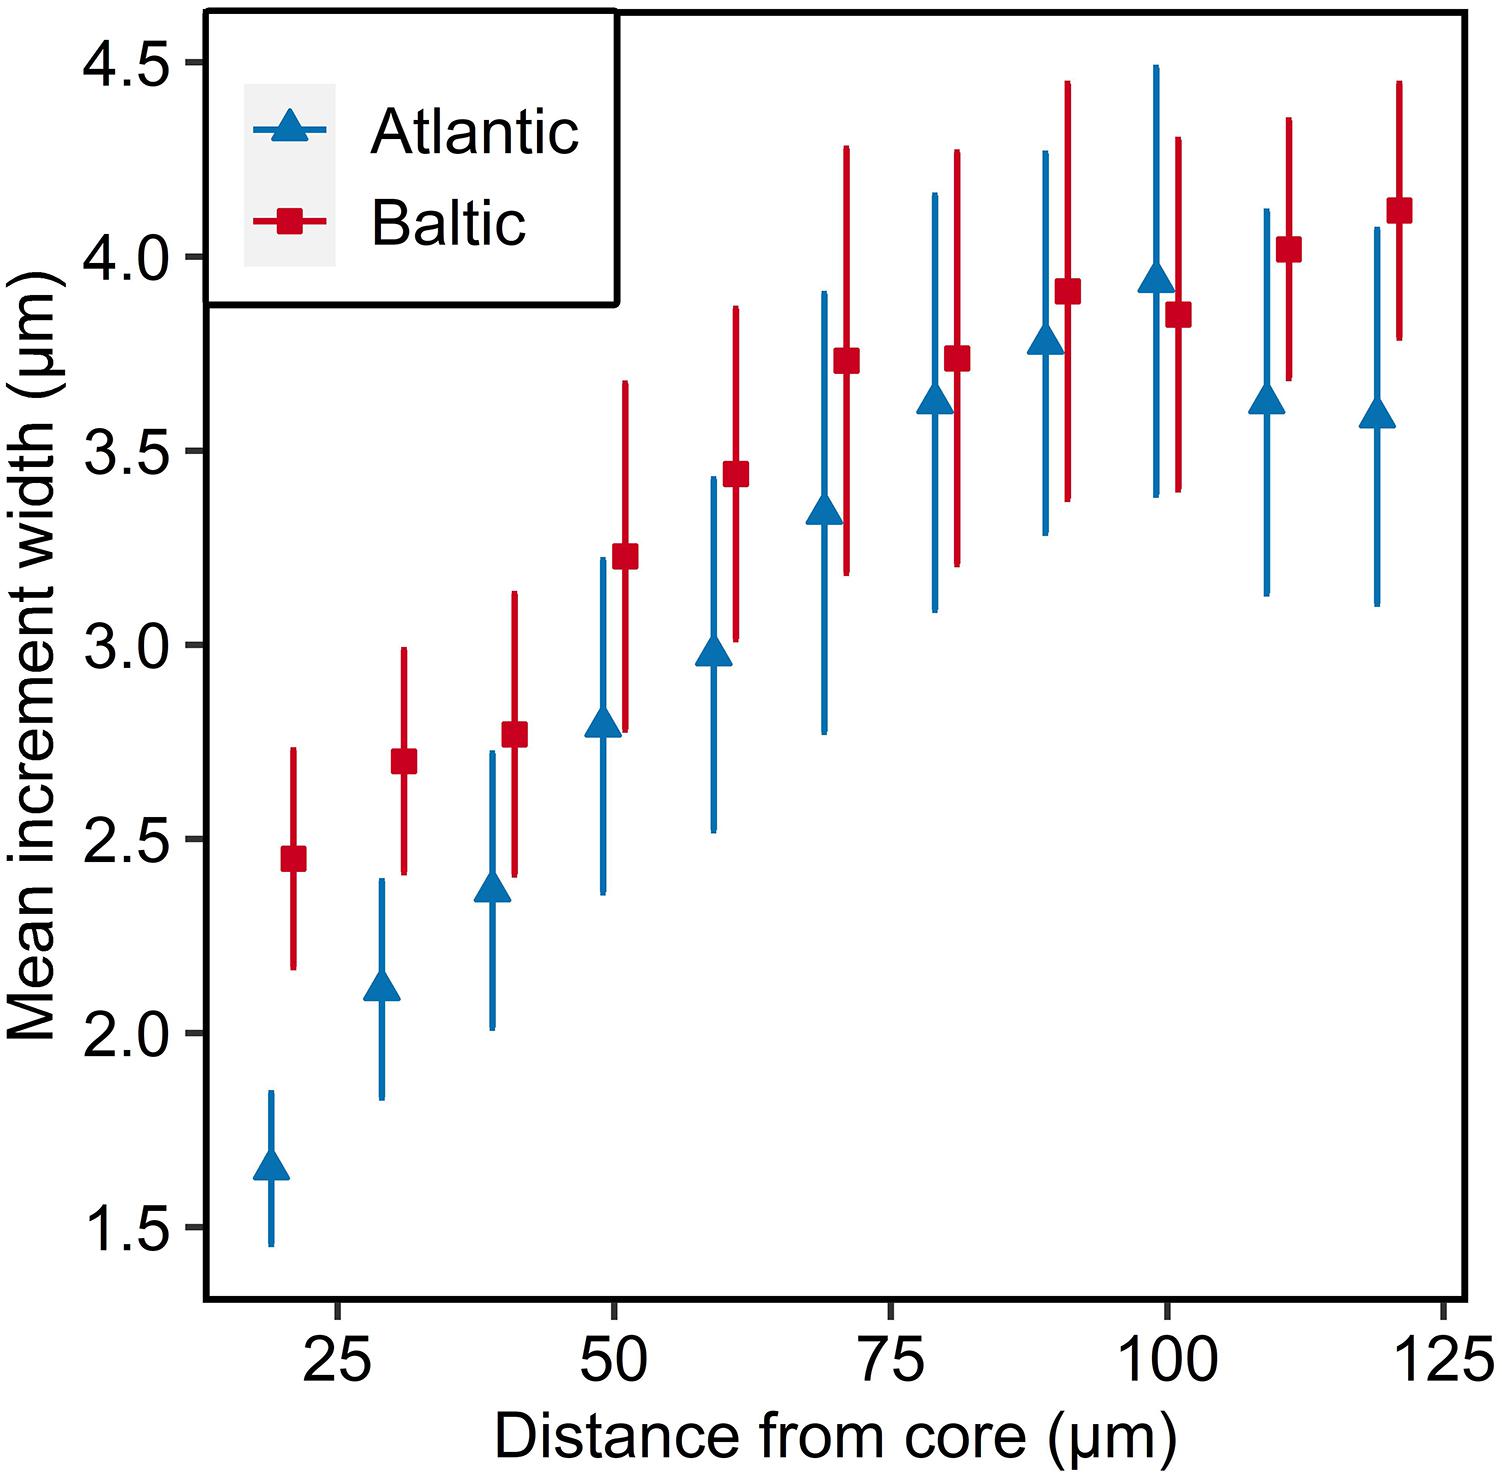
Figure 2. Otolith microstructure of parental Atlantic (blue) and Baltic (red) populations. Mean increment width ± 95% confidence intervals are given for each 10 μm interval. Data points are offset for visual clarity.
Comparisons of F1 Larvae and Adults
Otolith Microstructure
Comparing the daily otolith growth of F1 larvae with their sibling F1 adults indicate no difference between the stages for all groups (Tukey tests, p > 0.05), except Atlantic purebreds reared at 16 psu (Tukey tests, p < 0.05, Figure 3 and Supplementary Tables S1, S2). In Atlantic purebreds from 16 psu, the daily increments of adults were wider than for larvae (ANOVA, F1,63 = 7.06, p = 0.01). Generally, the increment widths increased from somewhat over 1.5 μm near the core (∼25 μm) to width of 3 μm or more further outside from the core (∼100 μm).
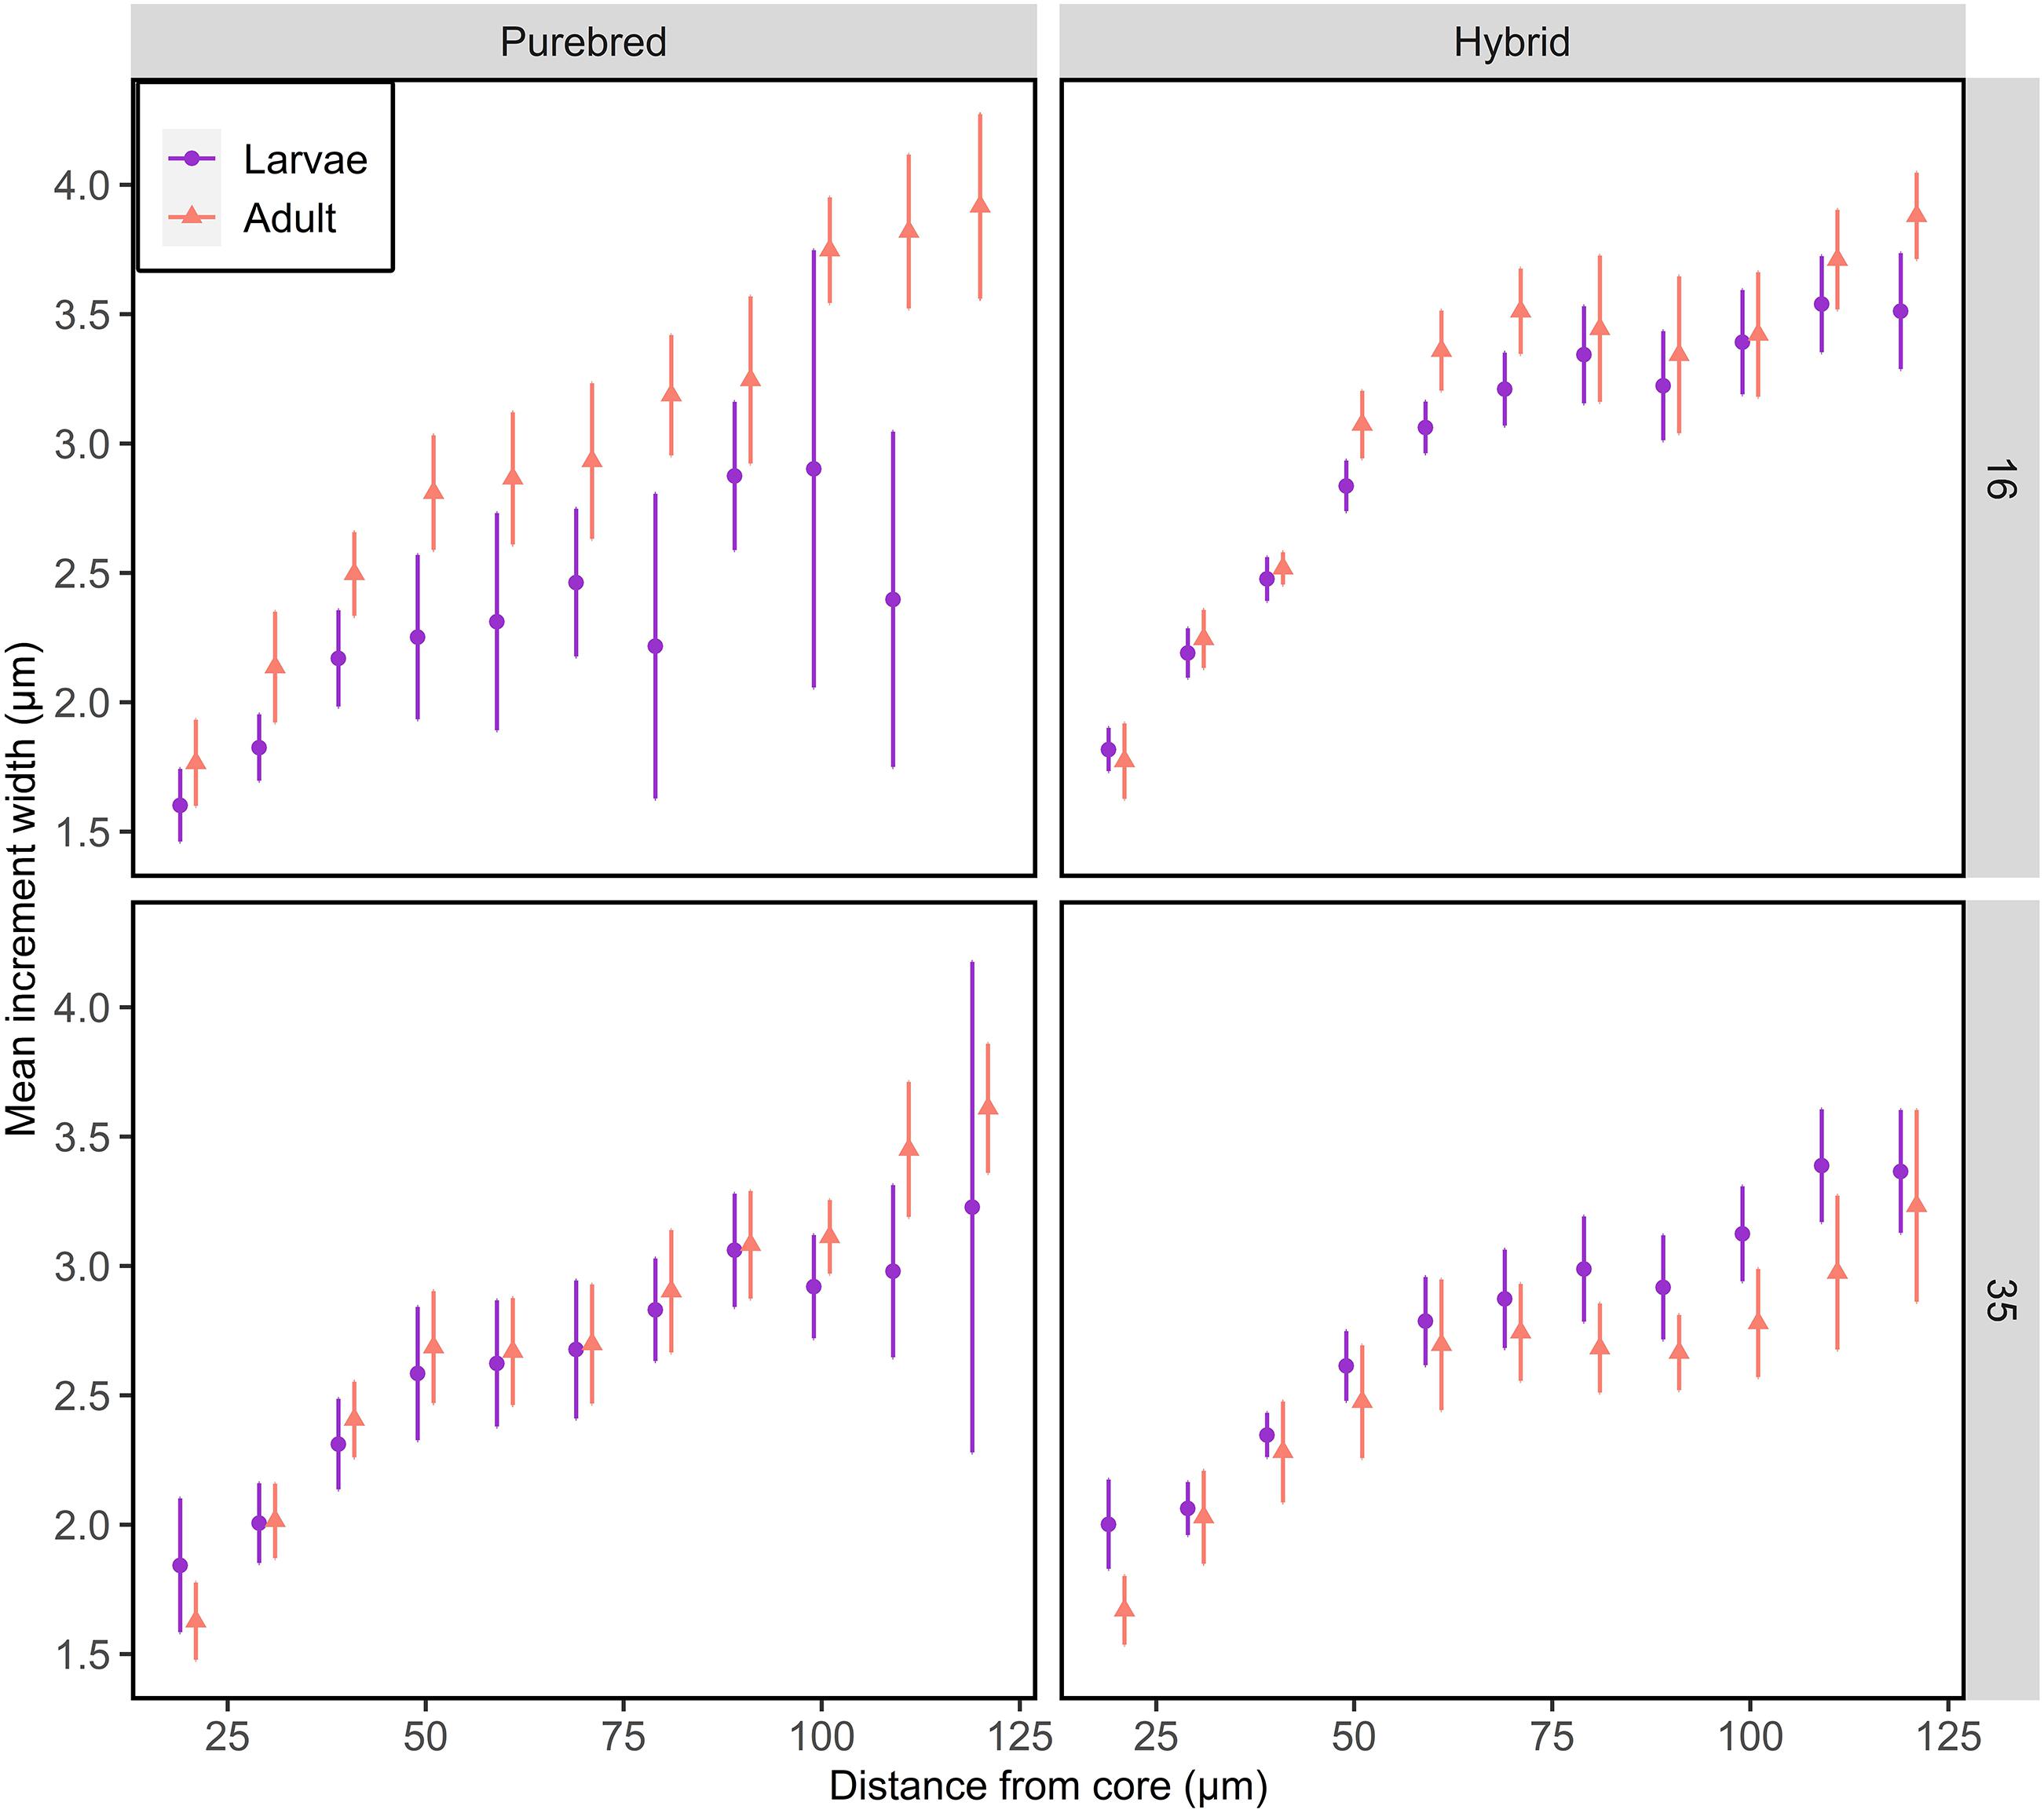
Figure 3. Otolith growth of F1 larvae and adult purebred and hybrid herring reared at salinity of 16 or 35 psu. Mean increment width ± 95% confidence intervals are given for each 10 μm interval. Data points are offset for visual clarity.
Hybrid to Purebred Ratio
Initially, the hybrid to purebred ratio of F1 herring was near 2:1 in the 16 and 35 psu salinity regimes. The overall ratio did not change at 35 psu (Table 3). During the early larval phase, hybrid survival at 16 psu was higher than for purebreds, as the overall ratio had changed drastically (11.5:1). The survival at 16 psu from the larval phase to adult phase was higher for purebreds indicated by a decreasing ratio (4.3:1). The survival of purebreds and hybrids at 35 psu was similar as indicated by the constant ratios during the entire experiment (for details see Berg et al., 2019).
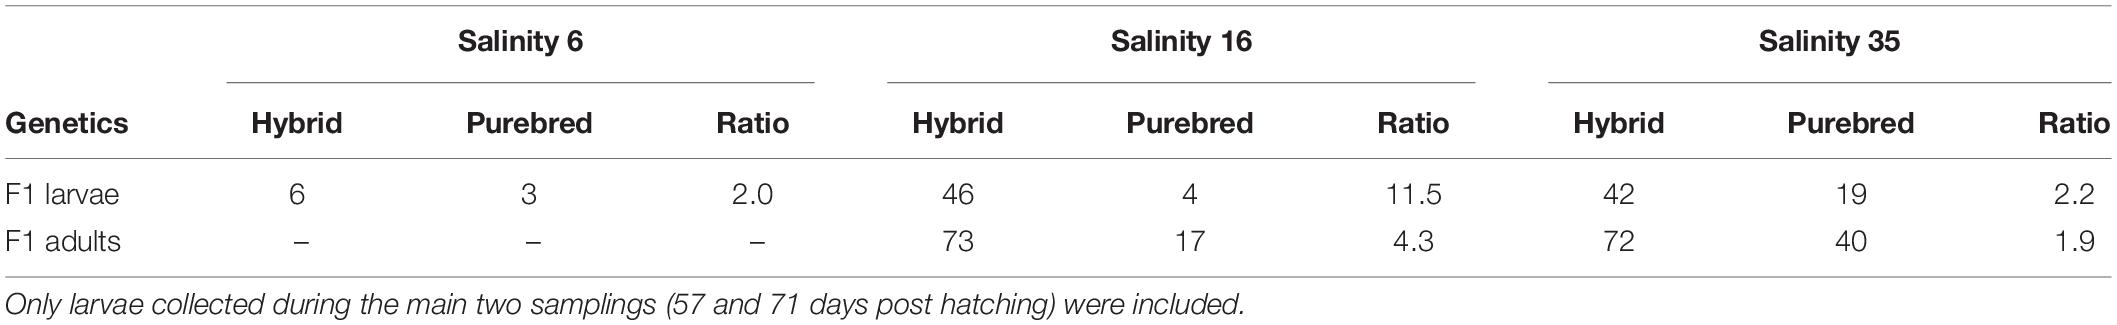
Table 3. Overview of the ratio between Atlantic purebreds and Atlantic/Baltic hybrids during the larval stage and as adults.
F1 Larvae
Somatic Parameters
F1 larvae showed an expected increase in standard length with increasing age at all three salinity regimes (6, 16, and 35 psu; Figure 4), including the purebred Baltic larvae reared at 16 psu. The initial size at hatching of Baltic purebreds was smaller compared to offspring from the Atlantic females. Atlantic purebred and Atlantic/Baltic hybrid F1 larvae co-reared at 16 psu grew faster in length than purebreds and hybrids co-reared at 35 psu (ANOVA, F1,390 = 23.66, p <.001; Supplementary Table S3).
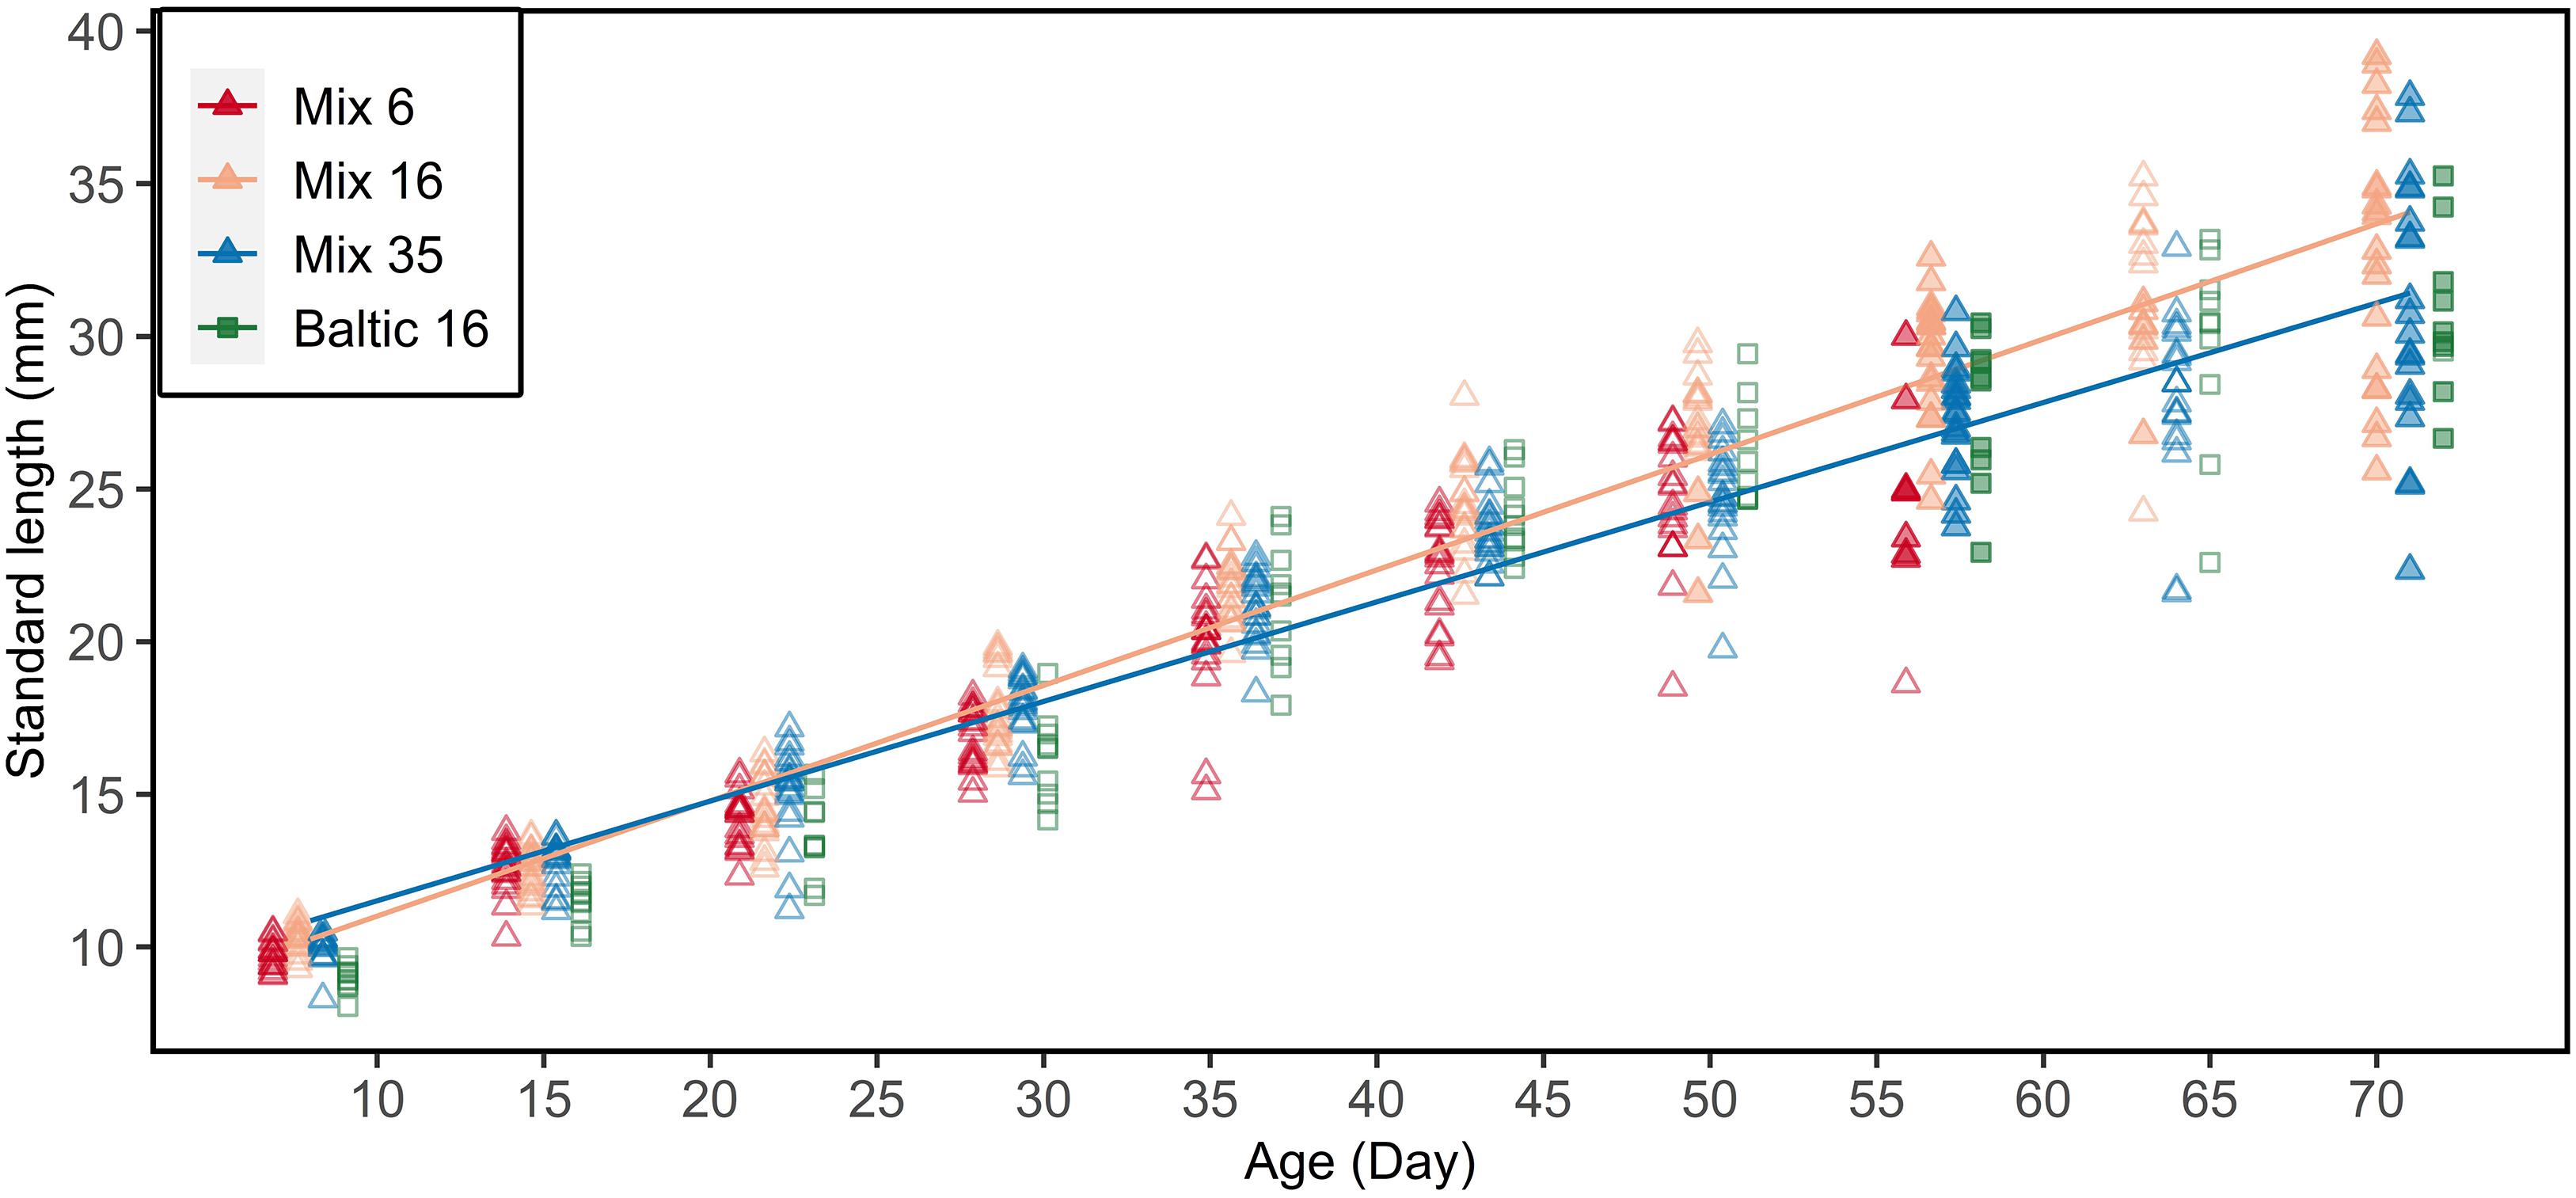
Figure 4. Standard length-at-age relationship for all sampled F1 larvae. Filled symbols indicate larvae used for the otolith microstructure analysis (at age 57 and 71 for all tanks, and age 50 and 64 solely for 16 psu). Atlantic purebreds and Atlantic/Baltic hybrids were co-reared (mix) at 6, 16, or 35 psu. Baltic purebreds were separately reared at 16 psu. Lines indicate linear regression for salinity 16 (excluding Baltic purebreds) and 35 psu. Data points are jittered to reduce overlap of data points.
The dry weights of larvae increased allometrically with standard length. Independent of the salinity, the weight of Atlantic/Baltic hybrids increased faster with increasing length than for Atlantic purebreds (ANOVA, F1,81 = 26.77, p < 0.0001: Supplementary Table S4). Also, herring at 35 psu were generally heavier than herring at 16 psu in respective genetic groups (Tukey test, p < 0.05). Herring at 6 psu were even lighter at length than those at 16 psu (Figure 5A).
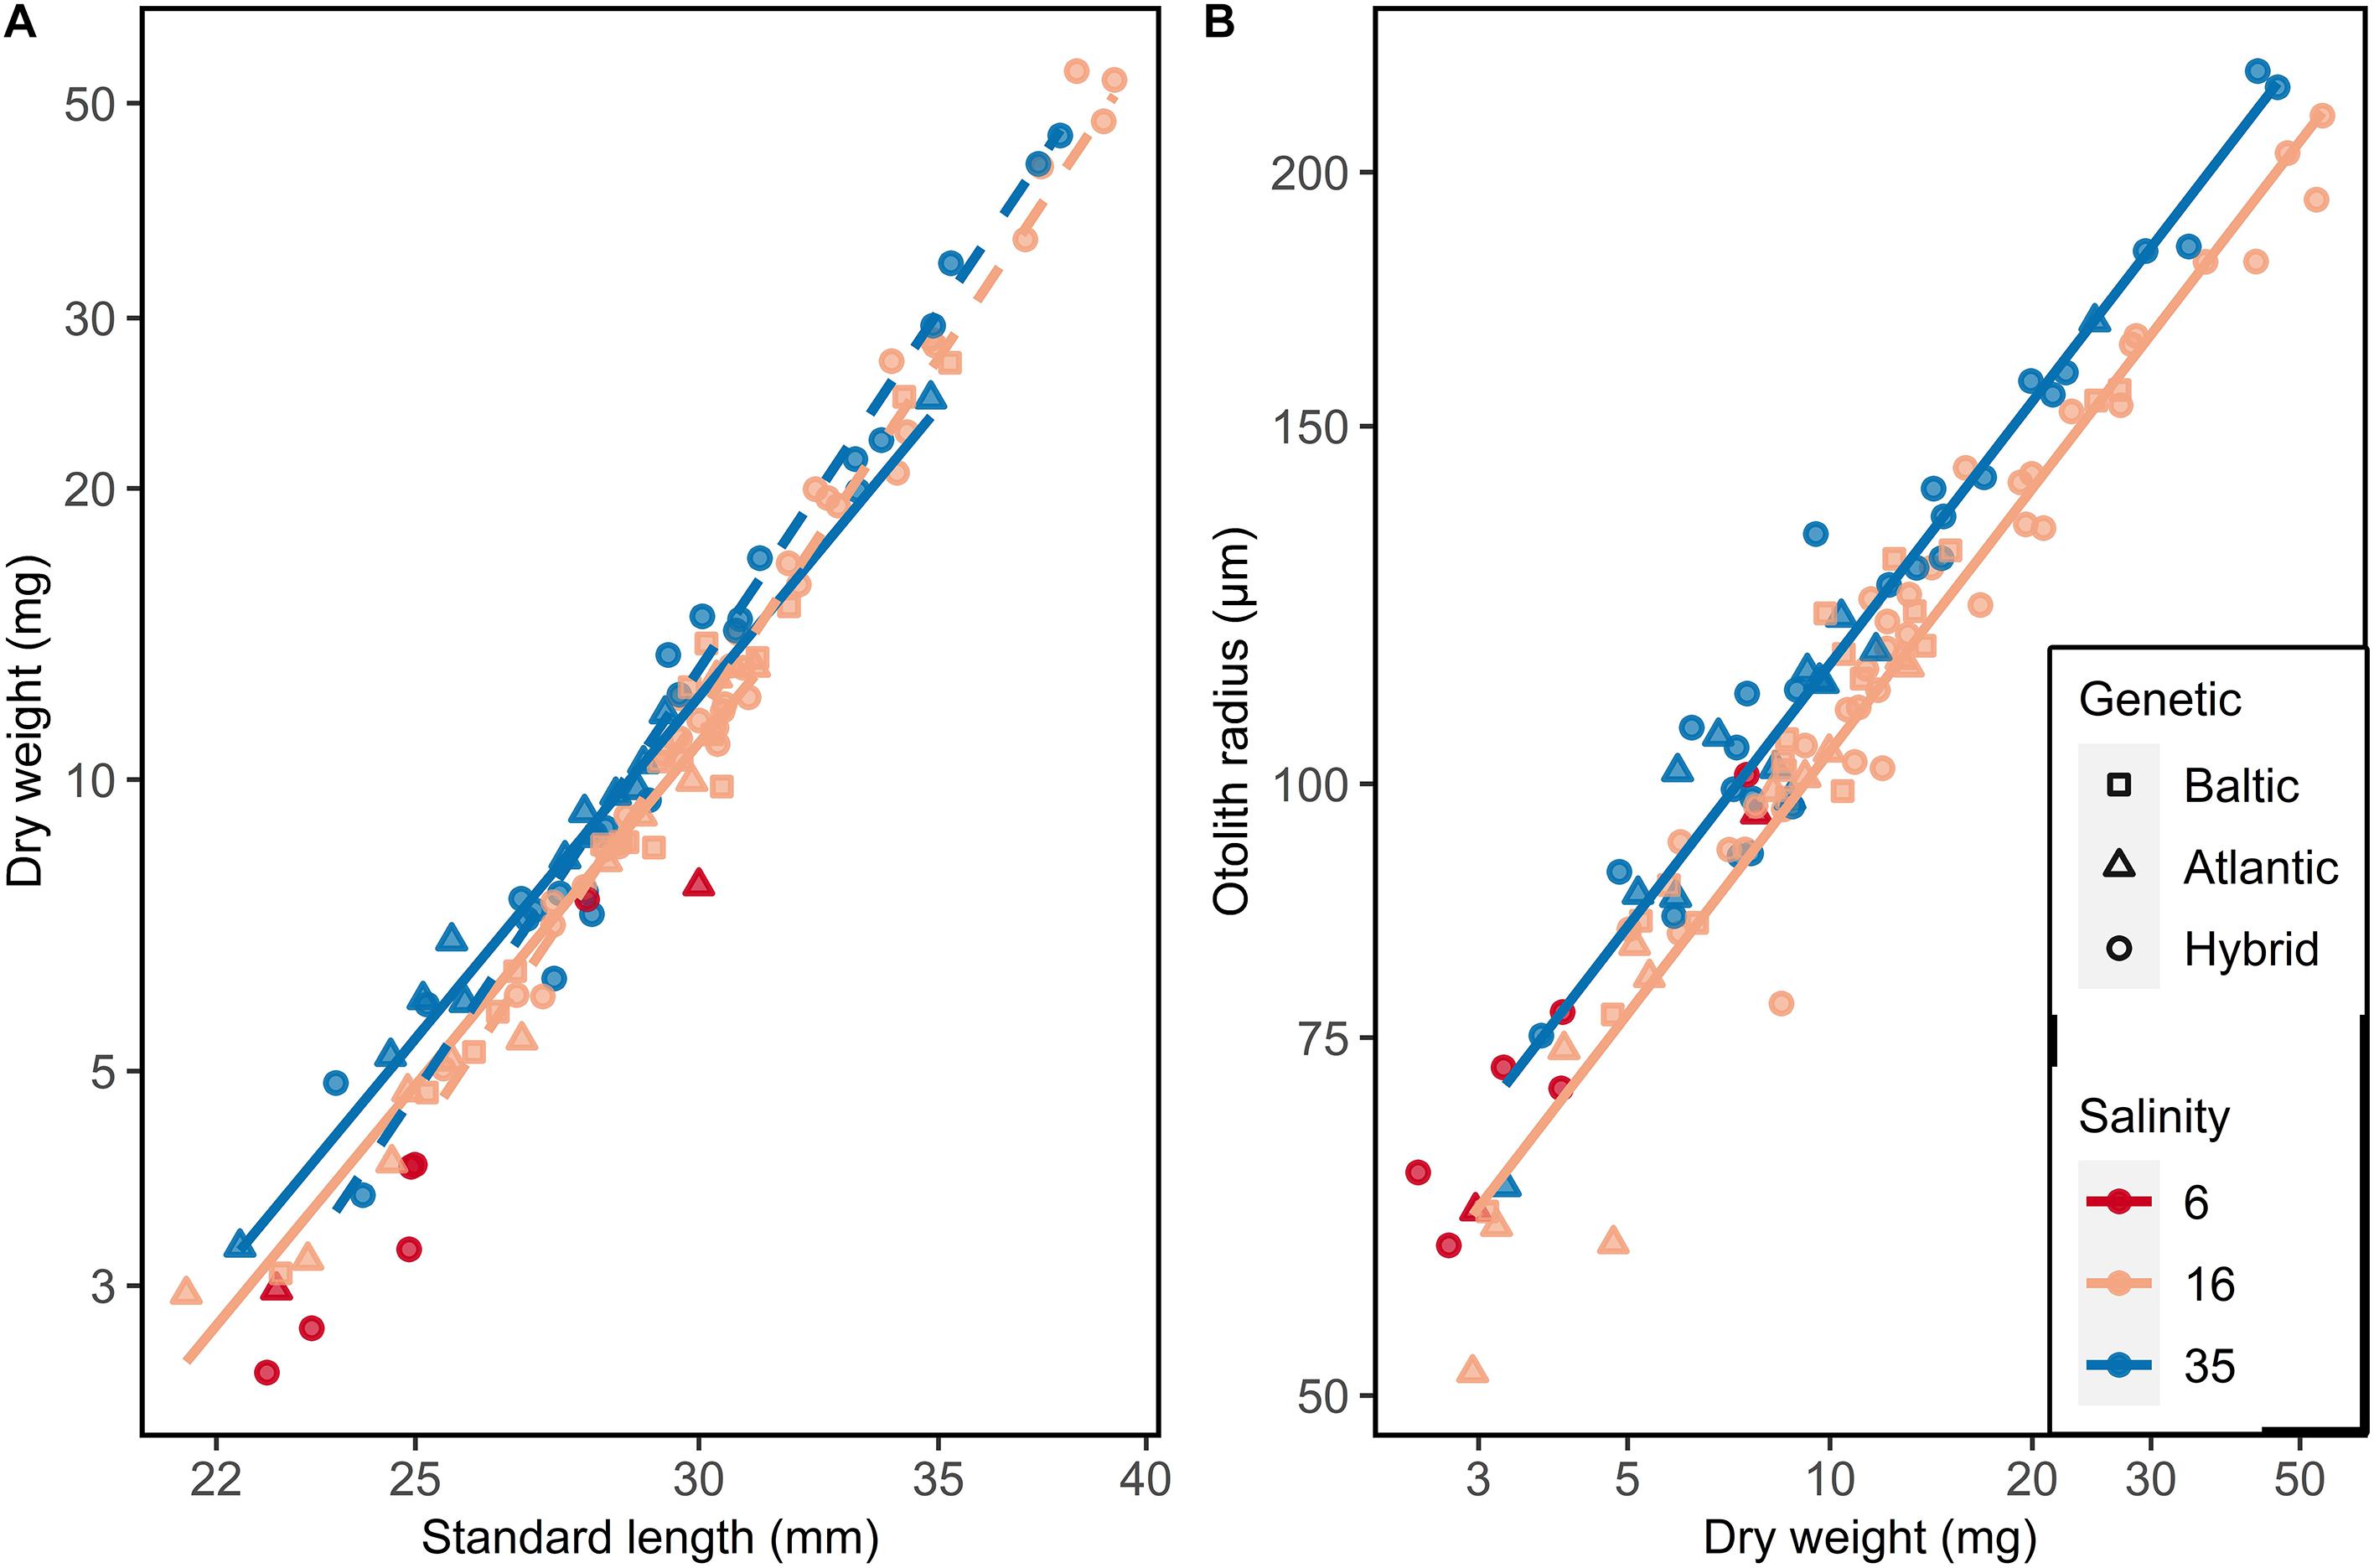
Figure 5. Somatic growth of F1 larvae used for otolith microstructure analysis. (A) Length-weight relationship and (B) Dry weight-otolith radius. Lines represent linear models: (A) Solid line = Atlantic purebred, dashed line = Atlantic/Baltic hybrids; (B) no significant differences between genetic groups.
A similar trend was observed comparing the otolith radius and dry weight of F1 larvae. Purebreds and hybrids at 35 psu had larger otolith radii compared to purebreds and hybrids reared at 16 psu (ANOVA, F1,82 = 42.87, p < 0.001; Figure 5B, Supplementary Table S5). There were no differences between purebreds and hybrids within each salinity (ANOVA, F1,82 = 2.30, p = 0.13; Supplementary Table S5).
Otolith Microstructure
The otolith microstructure analysis of all larval salinity groups showed generally a positive relationship with increasing increment widths with increasing distance from core up to 100 μm (Figure 6). The statistical model included an interaction between distance from core, salinity, and genetics (ANOVA, F1,3093 = 9.59, p = 0.002; Supplementary Table S6). The daily otolith growth did not differ between Atlantic purebreds at 16 and 35 psu (Tukey test, p > 0.05), while it was higher at 16 psu than 35 psu for hybrids (Tukey test, p < 0.05). The hybrids at 35 psu had similar otolith growth as the purebred groups (Tukey test, p > 0.05). Baltic purebred larvae reared at 16 psu had a similar daily otolith growth as hybrids. Atlantic purebreds and Atlantic/Baltic hybrids co-reared at 6 psu had the lowest daily otolith growth (narrowest increments) of all groups (Figure 6).
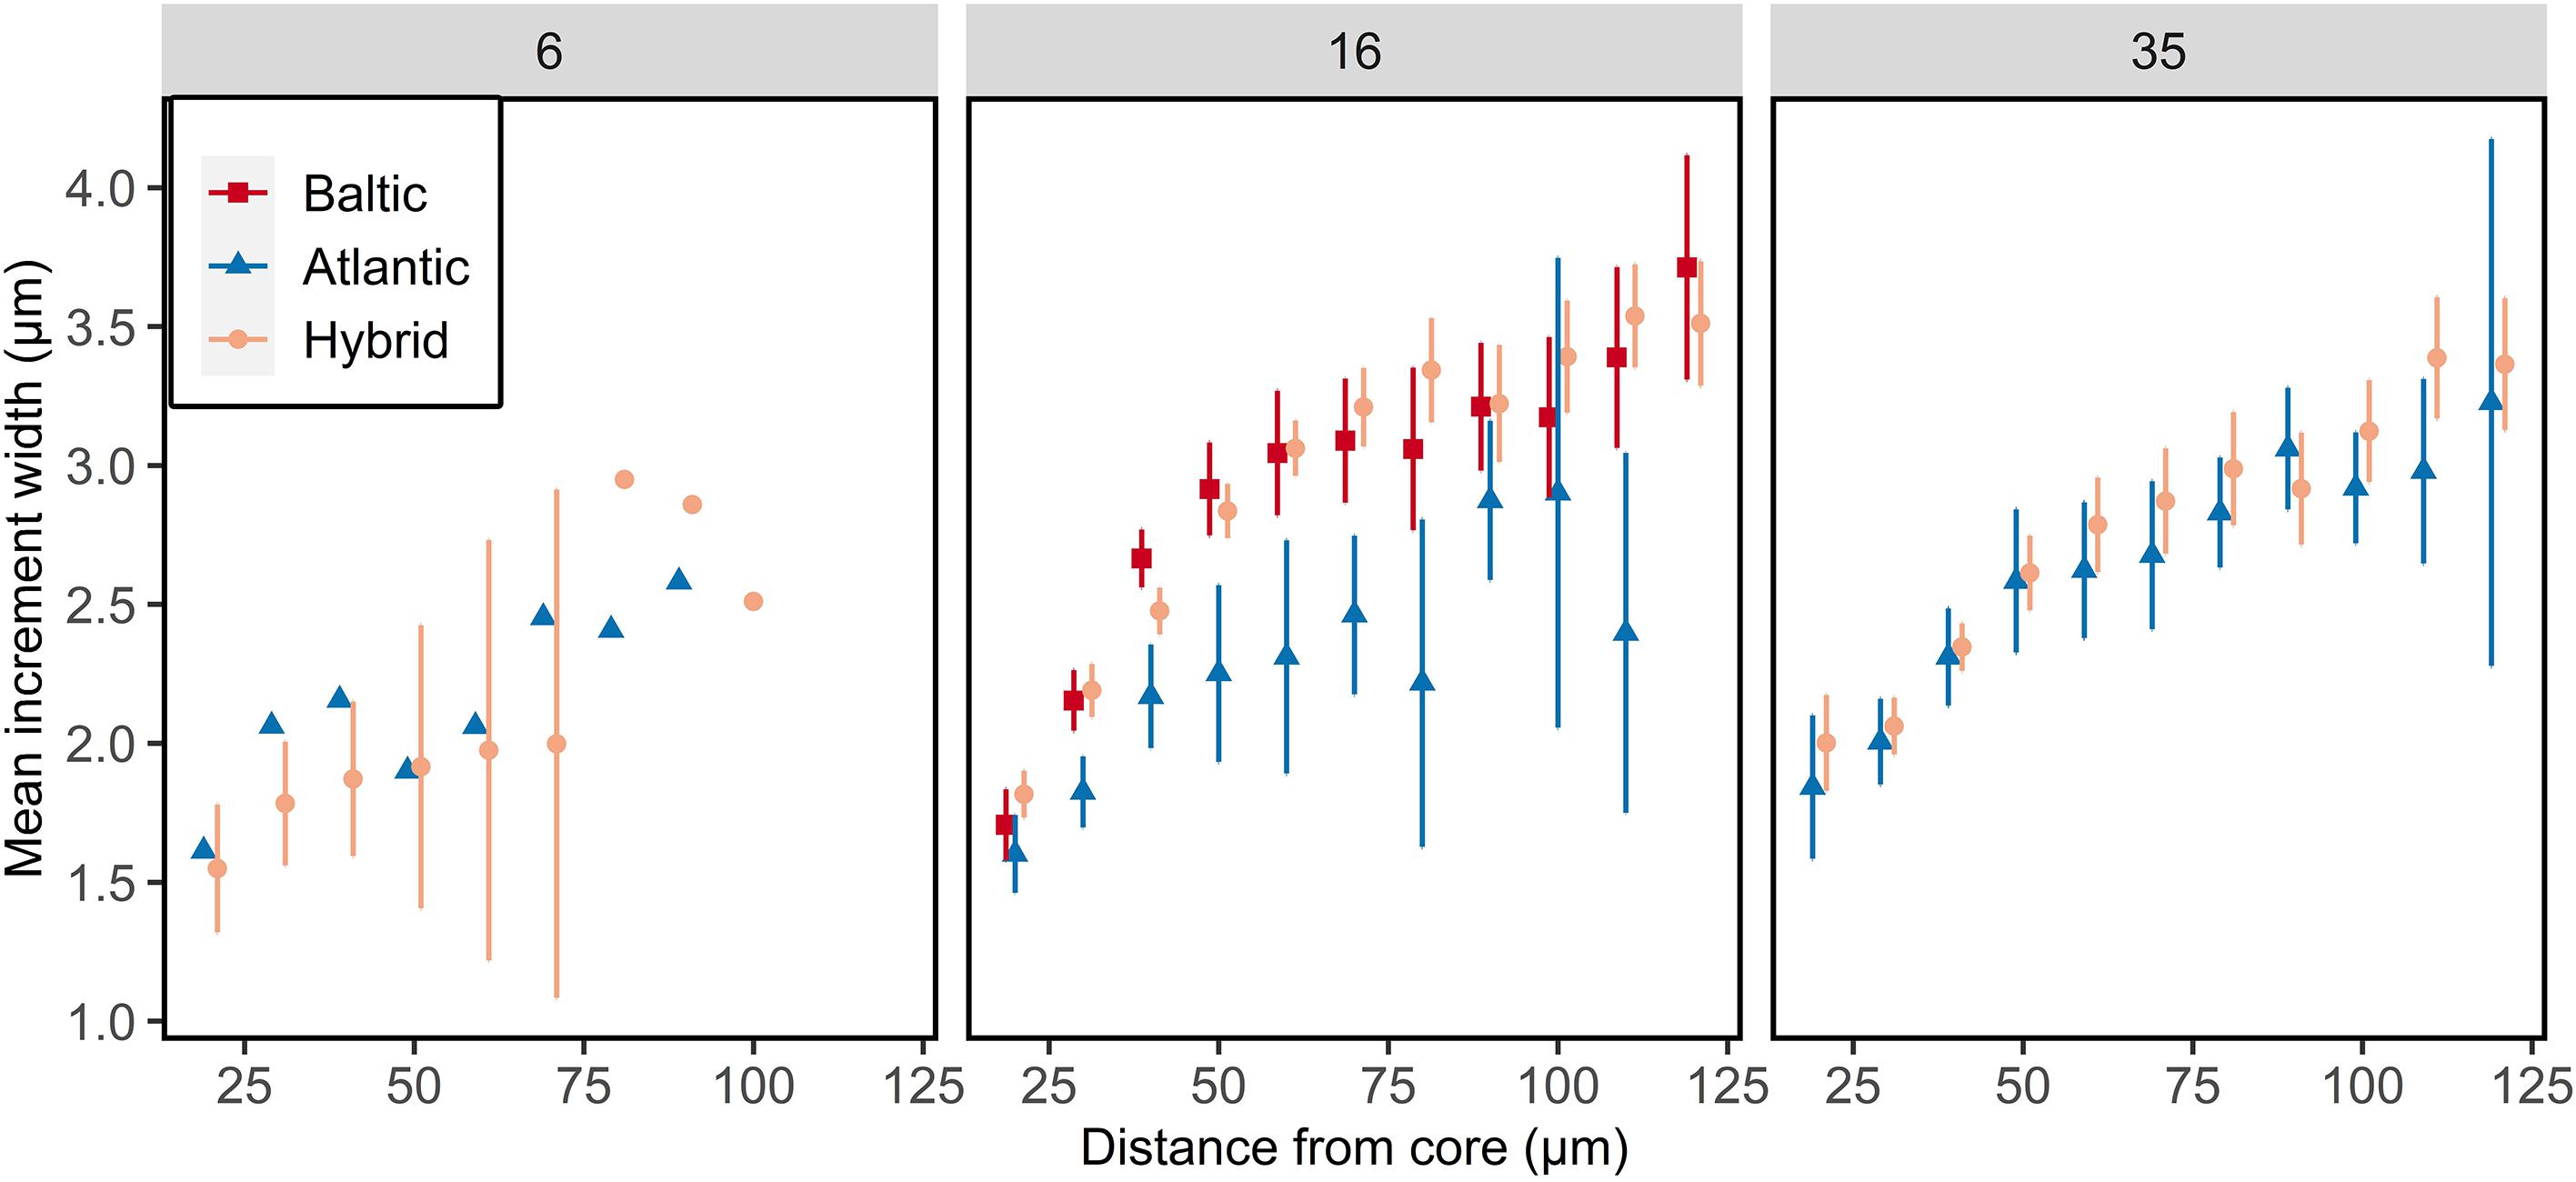
Figure 6. Otolith growth of F1 larvae reared at salinity of 6, 16, or 35 psu. Mean increment width ± 95% confidence intervals are given for each 10 μm interval. Data points are offset for visual clarity. Confidence intervals are only displayed for n > 5.
F1 Adults
Otolith Microstructure
The otolith microstructure analysis of the F1 adults showed generally an increasing trend in increment widths up to 100 μm where the increment widths of F1 adults at 16 psu increased faster compared to F1 adults at 35 psu (ANOVA, F1,2246 = 48.11, p < 0.0001; Figure 3, Supplementary Figure S1 and Supplementary Table S7). Also, the otolith growth was higher in 16 than 35 psu for hybrids, but not for purebreds (ANOVA, F1,73 = 6.08, p = 0.016; Supplementary Table S7). The somatic growth of F1 adults has been previously described in Berg et al. (2018).
Discussion
This is, to our knowledge, the first study contrasting the otolith microstructure of Atlantic herring (Clupea harengus) larvae and full sibling adults originating from identical larval environments. We evaluated and validated that microstructure analysis of adult otoliths is reflecting otolith growth during the larval stage based on Atlantic purebreds and Atlantic/Baltic hybrids co-reared at different salinities over several years. This validation is beneficial for further otolith microstructure analyses, strengthening the validity of their results. However, growth-dependent selection during the development from larvae to adults might produce biases when using adult otoliths to estimate larval growth. Besides the validation of the methods, we demonstrated in a case study that herring had higher otolith growth under intermediate salinity conditions (16 psu) independent of their genetic background. This demonstrates the plasticity of herring and the importance of salinity. In addition, to the documentation of growth-dependent selection and general growth trajectories, this experiment indicated different survival rates during the larval stage which is also supported by Berg et al. (2019) for the juvenile and adult stages. Finally, this study shows the strength of a common garden experiment with several closed and well-defined groups.
There is no doubt that the otolith microstructure, more specifically the increment width pattern, to a certain extent reflects daily growth patterns during the larval stage, but in most cases, these patterns are extracted from otoliths of larvae. Within this study, we validated that the microstructure revealed from adult otoliths did not differ from the otolith microstructure of larvae in absence of selective mortality. High accuracy and precision are needed when conducting otolith microstructure analysis and small deviations can lead to inconclusive results (Campana, 2001). Preparing adult otoliths for microstructure analysis is challenging since large amounts of material must be removed (Campana and Jones, 1992; Brophy, 2014), whereas larval otoliths need little or no preparation as in this study. In some species, time-consuming thin sectioning of adult otoliths is recommended to obtain clear increment patterns (e.g., Tomás and Panfili, 2000). Still, the choice of sectioning plane, as will over- or under-grinding of adult otoliths, may inaccurately align the mid-core area, resulting in inaccurate appearance of increment numbers and widths. Thus, the shape of the adult otoliths may to a variable extent be amenable to accurate microincrement estimation due to their thickness and need for extensive grinding or sectioning. Adult herring otoliths, like for most clupeid fish, increasingly attain a relatively thin and compressed form along the medial-distal axis past metamorphosis (Härkönen, 1986; Berg et al., 2018) making them well suited for studies of otolith microstructure.
The results of selection and mortality studies based on microstructure analyses (see Sponaugle (2010) and references therein for examples) will be strengthened by this validation because they use the survivors, mostly adults to contrast against individuals from earlier stages. If there would be differences between the otolith microstructure of larvae and adults without selective mortality, this could lead to false interpretations. For Atlantic herring, most selection studies have concentrated on juvenile fish (Stenevik et al., 1996; Slotte et al., 2019). However, our results allow for new studies on the selection of Atlantic herring in the wild using adults. Year class strength of herring, especially the Norwegian spring-spawning herring, is highly variable and not predictable. Selection studies comparing otolith growth of larvae and survivors (adults) on for example strong and weak year classes might reveal new insights on the recruitment dynamics of herring. Further, this validation strengthens other studies where conclusions are drawn from microstructure analysis of adult otoliths which have management (Clausen et al., 2007) or ecological (Berg et al., 2020b) implications.
Despite the methodological validation, there are some limitations when applying this approach to wild-caught adult herring which should be considered. Within our experiment, we observed growth-dependent selection for one of our experimental groups (Atlantic purebreds reared at 16 psu), even without strain-selective mortality. A significant fraction of purebreds was possibly not able to adapt fully to their new salinity environment and consequently only the fittest and faster growing offspring survived. A typical mechanism that could explain this growth-dependent selection in experiments is cannibalism (Puvanendran et al., 2008; Folkvord et al., 2010). Although intra-cohort cannibalism on rare occasions has been reported in late larval and early juvenile herring (e.g., Wespestad and Moksness, 1990). Atlantic purebreds were, in general, suffering during the larval phase in 16 psu as indicated by the hybrid to purebred ratio. Therefore, it is most likely that surviving adult purebreds had the highest capability, potentially trough higher growth, to cope with their non-native salinity. Such a selection during the development from larvae to adults might produce biases when estimating larval growth based on adult otoliths (Pringle and Baumann, 2019). In the wild, natural selection will probably account for even larger differences and should not be neglected. Further, different environmental conditions, like salinity in this case study, could have strong effects on the otolith microstructure. Additional analysis, such as otolith microchemistry (Moll et al., 2019), in combination with otolith microstructure, can be applied, e.g., to investigate the migration dynamics of herring in the transition zone, as is the case between the Atlantic and Baltic Sea where a strong salinity gradient exists.
A further aspect of this study is the use of a small number of parental herring (n = 3 for main study, n = 6 in total) resulting in a narrow genetic baseline. By using only one female as parental female for Atlantic purebreds and Atlantic/Baltic hybrids, non-environmental maternal effects were purposely and effectively minimized. This setup was considered beneficial when evaluating and validating the otolith microstructure analysis of larvae and adult siblings. It should be noted that Atlantic and Baltic herring show very strong genetic differentiation at hundreds of loci underlying ecological adaptation (Pettersson et al., 2019). Therefore, a single random Atlantic herring and a single Baltic herring are expected to show genotype differences at the majority of these loci. However, we cannot, even if our results are clear and significant, formally differentiate between individual and population-specific effects, which makes a transfer of the findings to the entire populations somewhat uncertain. Also, the observed differences in otolith growth trajectories could be a result of paternal effects rather than environmental effects (Bang et al., 2006; Poirier et al., 2017). Still, the findings serve as a good basis for further refined hypotheses and experiments on herring dealing with population-specific responses to different salinity conditions.
For the parental populations, phenotypic differences in terms of body length and growth have been previously described and related to lower temperatures in the central Baltic (Brunel and Dickey-Collas, 2010; Gröhsler et al., 2013). This is supported by our findings, where all the mature adult Baltic herring are much smaller, even though marginally older than the mature Atlantic herring used in this study. Consequently, age effects can be considered minor and other factors must be driving these differences. However, a direct or indirect impact of salinity on the smaller sizes of central Baltic herring cannot be excluded as being demonstrated for other clupeids (Palkovacs et al., 2007; Palkovacs and Post, 2009). Although the central Baltic is in general colder [see S5 Figure in Berg et al. (2018)], spawning locations are typically on vegetation in coastal areas (Aneer, 1989; Rajasilta et al., 1989) where the ambient water temperature is more susceptible to sudden temperature increase. Local coastal spawning areas might thus have higher temperatures explaining the contrasting results of initially higher otolith growth of Baltic herring than for Atlantic herring during the larval phase. Due to the general lower temperature in the central Baltic and the strong effect of temperature on the otolith growth (Folkvord et al., 2004) one would expect lower larval otolith growth for Baltic herring. Usually, herring at lower temperatures have a smaller growth coefficient (Brunel and Dickey-Collas, 2010). Also at later life stages, the conditions within the central and northern Baltic are less favorable and consequently restricting the growth of adult herring resulting in smaller total length (Gröhsler et al., 2013). In general, the prey density within the Baltic (Flinkman et al., 1998; Möllmann et al., 2000) is approximately 10-times lower compared with the density of the Atlantic (Dalpadado et al., 2000; Gislason and Astthorsson, 2002). Another explanation for the better larval otolith growth can be natural selection of the best fit individuals. Assuming the Baltic conditions are marginal, only the strongest and best-adapted individuals actually survive the larval period. A direct comparison of adult otolith microstructure and those of wild larvae is needed to justify and strengthen this explanation. One adaptation to the marginal conditions of the Baltic is a mutation on rhodopsin allowing Baltic herring to cope with lower water clarity conditions (Hill et al., 2019). The benefit of improved vision is expected to be of special importance during the early stages in fish since they are strongly affected by turbidity and reduced water clarity (Utne-Palm, 2004). This may also be one of the reasons for the relatively good larval growth performance of Baltic herring larvae compared to Atlantic herring larvae. In addition to the effects of visibility, reduced water oxygen content (Pauly and Cheung, 2018), salinity (Berg et al., 2018), limited availability of suitably sized plankton for the larger herring may reduce the growth and maximum size of Baltic herring (Möllmann et al., 2005). Further, there is a tendency that adult Baltic populations migrate into habitats with higher salinities for feeding, e.g., from the western Baltic into the Skagerrak (Clausen et al., 2015) or from the central Baltic into the western Baltic (Gröhsler et al., 2015). Whether this migration is due to direct salinity effect on herring or is due to better feeding conditions needs to be investigated. Within this study, however, we demonstrated the potential of Baltic purebred herring reared under optimal environmental conditions (16 psu, water temperature of approximately 9°C, fed ad libitum, and clear visibility) to attain higher growth rates than the parental fish and they obtained a size of 18.5 cm and weight of 52.0 g after 2 years (unpubl. results). This indicates the potential phenotypic plasticity in growth of Baltic herring when provided alternative and more beneficial environmental conditions. However, we cannot exclude that the growth of Baltic purebreds might be even higher when reared under laboratory conditions at their original salinity of 6 psu.
Given the common garden design, we could contrast the otolith growth under salinity conditions typical for the Atlantic Ocean (35 psu) and Baltic Sea (6 & 16 psu). Our results indicate that salinity can act as a major factor influencing the somatic and otolith growth of herring. In general, highest otolith and somatic growth were observed for larvae at 16 psu which is in accordance with other studies showing the positive effect of intermediate salinities on the growth (Boeuf and Payan, 2001), oxygen consumption (Berg et al., 2020a), or fertilization (Berg et al., 2019). The studies concluded that osmoregulation is less resource demanding at intermediate salinities allowing for larger growth. Caution is needed interpreting the results for larvae reared in 6 psu due to the low sample size (3 and 6 for purebreds and hybrids, respectively). Following our results, there is a tendency that both Atlantic purebred and Atlantic/Baltic hybrid larvae had the lowest otolith growth at 6 psu. Further studies including a comparison of Baltic purebreds reared at 6 psu are needed to draw any general conclusion, e.g., that herring with Atlantic genes might not be well adapted to low salinities or if this is an artifact regarding low survival of certain types of zooplankton at 6 psu. Besides the effect of salinity on otolith growth, the findings in this study demonstrate a changing mortality of genetic groups in the intermediate salinity. The ratio of hybrids to purebreds at 16 psu had drastically increased during the larval stage followed by a steady decrease during the juvenile and adults stage as indicated by Berg et al. (2019) to a level higher than the original 2:1 ratio. Similar results were observed for hybrid spring x autumn spawned herring larvae by Folkvord et al. (2009), with hybrids also outperforming purebred larvae under their original light regime conditions. The reasons for the reverse selection of purebreds vs. hybrids from the larval stage to the adult stage in the 16 psu group in this experiment remains unresolved, however, it could possibly be linked to past selection of superior purebred offspring during the larval stage. A consequence of this mortality was an unbalanced group size between Atlantic purebreds and Atlantic/Baltic hybrids at 16 psu which was counteracted by additional analyses of purebreds from extra sampling dates.
In conclusion, this study validates that otolith microstructure analysis of adults reflects the experienced otolith growth during the larval stages. Otolith microstructure analyses have been widely used for many years, but this is the first evaluation that the larval otolith growth can be analyzed in sibling groups after several years. This evaluation will be beneficial for future studies investigating the patterns of selection based on otolith microstructure analysis. Further, we demonstrated the importance of the environmental factor salinity along with genetic contributions to phenotypic variability and plasticity in herring. Similar common garden experiments with multiple parents are needed to verify our findings and conclusion that genetics affect key life-history traits as well as the ability of herring to adapt to different salinity environments at the population level.
Data Availability Statement
The datasets generated for this study are available on request to the corresponding author.
Ethics Statement
The animal study was reviewed and approved by Norwegian national animal Ethics Committee (Forsøksdyrutvalget-FOTS ID-5072).
Author Contributions
AF conceived and designed the study with contributions from LA, AS, and FB. ST performed the otolith analysis. ST and FB performed the statistical analysis. ST wrote the first draft of the manuscript. FB wrote sections of the manuscript. All authors contributed to manuscript revision, read and approved the submitted version.
Funding
This work was funded by the RCN project 254774 (GENSINC).
Conflict of Interest
The authors declare that the research was conducted in the absence of any commercial or financial relationships that could be construed as a potential conflict of interest.
Acknowledgments
We are grateful to Christel Krossøy, Frank Midtøy, Heikki Savolainen, and Julie Skadal from the UiB for their efforts in sampling the data material. We also acknowledge two reviewers for their input and comments having a considerable contribution to improvements of the manuscript.
Supplementary Material
The Supplementary Material for this article can be found online at: https://www.frontiersin.org/articles/10.3389/fmars.2020.00529/full#supplementary-material
References
Aneer, G. (1989). Herring (Clupea harengus L.) spawning and spawning ground characteristics in the Baltic Sea. Fish. Res. 8, 169–195. doi: 10.1016/0165-7836(89)90030-1
Bailey, M. C., and Heath, M. R. (2001). Spatial variability in the growth rate of blue whiting (Micromesistius poutassou) larvae at the shelf edge west of the UK. Fish. Res. 50, 73–87. doi: 10.1016/s0165-7836(00)00243-5
Bang, A., Grønkjær, P., Clemmesen, C., and Høie, H. (2006). Parental effects on early life history traits of Atlantic herring (Clupea harengus L.) larvae. J. Exp. Mar. Biol. Ecol. 334, 51–63. doi: 10.1016/j.jembe.2006.01.003
Barrett, R. D. H., and Hoekstra, H. E. (2011). Molecular spandrels: tests of adaptation at the genetic level. Nat. Rev. Genet. 12, 767–780. doi: 10.1038/nrg3015
Baumann, H., Gröhsler, T., Kornilovs, G., Makarchouk, A., Feldmann, V., and Temming, A. (2006). Temperature-induced regional and temporal growth differences in Baltic young-of-the-year sprat Sprattus sprattus. Mar. Ecol. Prog. Ser. 317, 225–236. doi: 10.3354/meps317225
Baumann, H., Pepin, P., Davidson, F. J. M., Mowbray, F., Schnack, D., and Dower, J. F. (2003). Reconstruction of environmental histories to investigate patterns of larval radiated shanny (Ulvaria subbifurcata) growth and selective survival in a large bay of Newfoundland. ICES J. Mar. Sci. 60, 243–258. doi: 10.1016/s1054-3139(03)00019-5
Berg, F., Almeland, O. W., Skadal, J., Slotte, A., Andersson, L., and Folkvord, A. (2018). Genetic factors have a major effect on growth, number of vertebrae and otolith shape in Atlantic herring (Clupea harengus). PLoS One 13:e0190995. doi: 10.1371/journal.pone.0190995
Berg, F., Andersson, L., and Folkvord, A. (2020a). Respiration rates of herring larvae at different salinities and effects of previous environmental history. Mar. Ecol. Prog. Ser. (inpress), doi: 10.3354/meps13318
Berg, F., Østgaard, H. D., Slotte, A., Andersson, L., and Folkvord, A. (2020b). A combination of genetic and phenotypic characterization of spring- and autumn-spawning herring suggests gene flow between populations. ICES J. Mar. Sci. (inpress), doi: 10.1093/icesjms/fsaa046
Berg, F., Slotte, A., Andersson, L., and Folkvord, A. (2019). Genetic origin and salinity history influence reproductive success of Atlantic herring. Mar. Ecol. Prog. Ser. 61, 81–94. doi: 10.3354/meps12680
Berg, F., Slotte, A., Johannessen, A., Kvamme, C., Clausen, L. A. W., and Nash, R. D. M. (2017). Comparative biology and population mixing among local, coastal and offshore Atlantic herring (Clupea harengus) in the North Sea, Skagerrak, Kattegat and western Baltic. PLoS One 12:e0187374. doi: 10.1371/journal.pone.0187374
Boeuf, G., and Payan, P. (2001). How should salinity influence fish growth? Comp. Biochem. Physiol. Part C 130, 411–423. doi: 10.1016/S1532-0456(01)00268-X
Brophy, D. (2014). “Chapter eight - Analysis of growth marks in calcified structures: insights into stock structure and migration pathways,” in Stock Identification Methods (Second edition), eds S. X. Cadrin, L. A. Karr, and S. Mariani (San Diego: Academic Press), 141–170. doi: 10.1016/b978-0-12-397003-9.00008-4
Brophy, D., Danilowicz, B. S., and King, P. A. (2006). Spawning season fidelity in sympatric populations of Atlantic herring (Clupea harengus). Can. J. Fish. Aquat. Sci. 63, 607–616. doi: 10.1139/f05-235
Brophy, D., and King, P. A. (2007). Larval otolith growth histories show evidence of stock structure in Northeast Atlantic blue whiting (Micromesistius poutassou). ICES J. Mar. Sci. 64, 1136–1144. doi: 10.1093/icesjms/fsm080
Brothers, E. B., Mathews, C. P., and Lasker, R. (1976). Daily growth increments in otoliths from larval and adult fishes. Fish. Bull. 74, 1–8. doi: 10.1006/jfbi.1993.1006
Brunel, T., and Dickey-Collas, M. (2010). Effects of temperature and population density on von Bertalanffy growth parameters in Atlantic herring: a macro-ecological analysis. Mar. Ecol. Prog. Ser. 405, 15–28. doi: 10.3354/meps08491
Campana, S. E. (2001). Accuracy, precision and quality control in age determination, including a review of the use and abuse of age validation methods. J. Fish Biol. 59, 197–242. doi: 10.1111/j.1095-8649.2001.tb00127.x
Campana, S. E. (2005). Otolith science entering the 21st century. Mar. Freshwater Res. 56, 485–495. doi: 10.1071/mf04147
Campana, S. E., Gagné, J. A., and Munro, J. (1987). Otolith microstructure of larval herring (Clupea harengus): image or reality? Can. J. Fish. Aquat. Sci. 44, 1922–1929. doi: 10.1139/f87-236
Campana, S. E., and Jones, C. M. (1992). “Analysis of otolith microstructure data,” in Otolith Microstructure Examination and Analysis, eds D. K. Stevenson and S. E. Campana (Ottawa, ON: Canadian Special Publication of Fisheries and Aquatic Sciences), 73–100.
Campana, S. E., and Thorrold, S. R. (2001). Otoliths, increments, and elements: keys to a comprehensive understanding of fish populations? Can. J. Fish. Aquat. Sci. 58, 30–38. doi: 10.1139/f00-177
Cermeño, P., Uriarte, A., De Murguía, A. M., and Morales-Nin, B. (2003). Validation of daily increment formation in otoliths of juvenile and adult European anchovy. J. Fish Biol. 62, 679–691. doi: 10.1046/j.1095-8649.2003.00056.x
Clausen, L. A. W., Bekkevold, D., Hatfield, E. M. C., and Mosegaard, H. (2007). Application and validation of otolith microstructure as a stock identification method in mixed Atlantic herring (Clupea harengus) stocks in the North Sea and western Baltic. ICES J. Mar. Sci. 64, 377–385. doi: 10.1093/icesjms/fsl036
Clausen, L. A. W., Stæhr, K. J., Rindorf, A., and Mosegaard, H. (2015). Effect of spatial differences in growth on distribution of seasonally co-occurring herring Clupea harengus stocks. J. Fish Biol. 86, 228–247. doi: 10.1111/jfb.12571
Dalpadado, P., Ellertsen, B., Melle, W., and Dommasnes, A. (2000). Food and feeding conditions of Norwegian spring-spawning herring (Clupea harengus) through its feeding migrations. ICES J. Mar. Sci. 57, 843–857. doi: 10.1006/jmsc.2000.0573
Flinkman, J., Aro, E., Vuorinen, I., and Viitasalo, M. (1998). Changes in northern Baltic zooplankton and herring nutrition from 1980s to 1990s: top-down and bottom-up processes at work. Mar. Ecol. Prog. Ser. 165, 127–136. doi: 10.3354/meps165127
Folkvord, A., Høie, H., Johannessen, A., and Solbakken, T. (2009). Effects of prey concentration, light regime, and parental origin on growth and survival of herring larvae under controlled experimental conditions. ICES J. Mar. Sci. 66, 1702–1709. doi: 10.1093/icesjms/fsp072
Folkvord, A., Johannessen, A., and Moksness, E. (2004). Temperature-dependent otolith growth in Norwegian spring-spawning herring (Clupea harengus L.) larvae. Sarsia 89, 297–310. doi: 10.1080/00364820410002532
Folkvord, A., Koedijk, R. M., Lokøy, V., and Imsland, A. K. (2010). Timing and selectivity of mortality in reared Atlantic cod revealed by otolith analysis. Environ. Biol. Fishes 89, 513–519. doi: 10.1007/s10641-010-9699-5
Fox, C. J., Folkvord, A., and Geffen, A. J. (2003). Otolith micro-increment formation in herring Clupea harengus larvae in relation to growth rate. Mar. Ecol. Prog. Ser. 264, 83–94. doi: 10.3354/meps264083
Gagliano, M., McCormick, M. I., and Meekan, M. G. (2007). Survival against the odds: ontogenetic changes in selective pressure mediate growth-mortality trade-offs in a marine fish. Proc. R. Soc. B 274, 1575–1582. doi: 10.1098/rspb.2007.0242
Geffen, A. J. (1982). Otolith ring deposition in relation to growth rate in herring (Clupea harengus) and turbot (Scophthalmus maximus) larvae. Mar. Biol. 71, 317–326. doi: 10.1007/bf00397048
Geffen, A. J. (2009). Advances in herring biology: from simple to complex, coping with plasticity and adaptability. ICES J. Mar. Sci. 66, 1688–1695. doi: 10.1093/icesjms/fsp028
Gibb, F. M., Régnier, T., and Wright, P. J. (2020). Inferring early larval traits from otolith microstructure in the sandeel. J. Sea Res. 158, 101872. doi: 10.1016/j.seares.2020.101872
Gillanders, B. M. (2002). Connectivity between juvenile and adult fish populations: do adults remain near their recruitment estuaries? Mar. Ecol. Prog. Ser. 240, 215–223. doi: 10.3354/meps240215
Gislason, A., and Astthorsson, O. S. (2002). The food of Norwegian spring-spawning herring in the western Norwegian Sea in relation to the annual cycle of zooplankton. Sarsia 87, 236–247. doi: 10.1080/00364820260294860
Gröhsler, T., Oeberst, R., Schaber, M., Larson, N., and Kornilovs, G. (2013). Discrimination of western Baltic spring-spawning and central Baltic herring (Clupea harengus L.) based on growth vs. natural tag information. ICES J. Mar. Sci. 70, 1108–1117. doi: 10.1093/icesjms/fst064
Gröhsler, T., Schaber, M., Larson, N., and Oeberst, R. (2015). Separating two herring stocks from growth data: long-term changes in survey indices for Western Baltic Spring Spawning Herring (Clupea harengus) after application of a stock separation function. J. Appl. Ichthyol. 32, 40–45. doi: 10.1111/jai.12924
Härkönen, T. (1986). Guide to the Otoliths of the Bony Fishes of the Northeast Atlantic. Hellerup: Danbiu ApS.
Hill, J., Enbody, E. D., Pettersson, M. E., Sprehn, C. G., Bekkevold, D., Folkvord, A., et al. (2019). Recurrent convergent evolution at amino acid residue 261 in fish rhodopsin. Proc. Natl. Acad. Sci. U.S.A. 116, 18473–18478. doi: 10.1073/pnas.1908332116
Hothorn, T., Bretz, F., and Westfall, P. (2008). Simultaneous inference in general parametric models. Biometric. J. 50, 346–363. doi: 10.1002/bimj.200810425
Husebø, Å, Slotte, A., Clausen, L. A. W., and Mosegaard, H. (2005). Mixing of populations or year class twinning in Norwegian spring spawning herring? Mar. Freshw. Res. 56, 763–772. doi: 10.1071/mf04170
Iles, T. D., and Sinclair, M. (1982). Atlantic herring: stock discreteness and abundance. Science 215, 627–633. doi: 10.1126/science.215.4533.627
Johannessen, A., Blom, G., and Folkvord, A. (2000). Differences in growth pattern between spring and autumn spawned herring (Clupea harengus L.) larvae. Sarsia 85, 461–466. doi: 10.1080/00364827.2000.10414595
Kokita, T., and Omori, M. (1999). Long distance dispersal of larval and juvenile rockfish, Sebastes thompsoni, with drifting seaweed in the Tohoku area, northwest Pacific, estimated by analysis of otolith microstructure. Bull. Mar. Sci. 65, 105–118.
Lamichhaney, S., Martinez Barrio, A., Rafati, N., Sundström, G., Rubin, C.-J., Gilbert, E. R., et al. (2012). Population-scale sequencing reveals genetic differentiation due to local adaptation in Atlantic herring. Proc. Natl. Acad. Sci. U.S.A. 109, 19345–19350. doi: 10.1073/pnas.1216128109
Martinez Barrio, A., Lamichhaney, S., Fan, G., Rafati, N., Pettersson, M., Zhang, H., et al. (2016). The genetic basis for ecological adaptation of the Atlantic herring revealed by genome sequencing. eLife 5:e12081. doi: 10.7554/eLife.12081
Mitchell-Olds, T., Willis, J. H., and Goldstein, D. B. (2007). Which evolutionary processes influence natural genetic variation for phenotypic traits? Nat. Rev. Genet. 8, 845–856. doi: 10.1038/nrg2207
Moll, D., Kotterba, P., Jochum, K. P., von Nordheim, L., and Polte, P. (2019). Elemental inventory in fish otoliths reflects natal origin of Atlantic herring (Clupea harengus) from Baltic Sea juvenile areas. Front. Mar. Sci. 6:191. doi: 10.3389/fmars.2019.00191
Möllmann, C., Kornilovs, G., Fetter, M., and Köster, F. W. (2005). Climate, zooplankton, and pelagic fish growth in the central Baltic Sea. ICES J. Mar. Sci. 62, 1270–1280. doi: 10.1016/j.icesjms.2005.04.021
Möllmann, C., Kornilovs, G., and Sidrevics, L. (2000). Long-term dynamics of main mesozooplankton species in the central Baltic Sea. J. Plankton Res. 22, 2015–2038. doi: 10.1093/plankt/22.11.2015
Morrongiello, J. R., and Thresher, R. E. (2015). A statistical framework to explore ontogenetic growth variation among individuals and populations: a marine fish example. Ecol. Monog. 85, 93–115. doi: 10.1890/13-2355.1
Mosegaard, H., and Madsen, K. P. (1996). Discrimination of mixed herring stocks in the North Sea using vertebral counts and otolith microstructure. ICES C.M. 1996/H 17, 1–8.
Mugiya, Y. (1987). Effects of photoperiods on the formation of otolith increments in the embryonic and larval rainbow trout Salmo gairdneri. Nippon Suisan Gakkaishi 53, 1979–1984. doi: 10.2331/suisan.53.1979
Palkovacs, E. P., Dion, K. B., Post, D. M., and Caccone, A. (2007). Independent evolutionary origins of landlocked alewife populations and rapid parallel evolution of phenotypic traits. Mol. Ecol. 17, 582–597. doi: 10.1111/j.1365-294x.2007.03593.x
Palkovacs, E. P., and Post, D. M. (2009). Experimental evidence that phenotypic divergence in predators drives community divergence in prey. Ecology 90, 300–305. doi: 10.1890/08-1673.1
Panfili, J., and Tomas, J. (2001). Validation of age estimation and back-calculation of fish length based on otolith microstructures in tilapias (Pisces, Cichlidae). Fish. Bull. 99, 139–150.
Pannella, G. (1971). Fish otoliths: daily growth layers and periodical patterns. Science 173, 1124–1127. doi: 10.1126/science.173.4002.1124
Pauly, D., and Cheung, W. W. L. (2018). Sound physiological knowledge and principles in modeling shrinking of fishes under climate change. Glob. Change Biol. 24, e15–e26. doi: 10.1111/gcb.13831
Pettersson, M. E., Rochus, C. M., Han, F., Chen, J., Hill, J., Wallerman, O., et al. (2019). A chromosome-level assembly of the Atlantic herring genome—detection of a supergene and other signals of selection. Genome Res. 1919–1928. doi: 10.1101/gr.253435.119
Pinheiro, J. C., and Bates, D. M. (2000). Mixed-Effects Models in S and S-PLUS. New York, NY: Springer.
Poirier, M., Listmann, L., and Roth, O. (2017). Selection by higher-order effects of salinity and bacteria on early life-stages of Western Baltic spring-spawning herring. Evol. Appl. 10, 603–615. doi: 10.1111/eva.12477
Pringle, J. W., and Baumann, H. (2019). Otolith-based growth reconstructions in young-of-year Atlantic silversides Menidia menidia and their implications for sex-selective survival. Mar. Ecol. Prog. Series 632, 193–204. doi: 10.3354/meps13174
Puvanendran, V., Laurel, B., and Brown, J. (2008). Cannibalism of Atlantic cod Gadus morhua larvae and juveniles on first-week larvae. Aquat. Biol. 2, 113–118. doi: 10.3354/ab00044
R Core Team (2019). R: A Language and Environment for Statistical Computing (version 3.6.1). Vienna: R Foundation for Statistical Computing.
Rajasilta, M., Eklund, J., Kääriä, J., and Ranta-Aho, K. (1989). The deposition and mortality of the eggs of the Baltic herring Clupea harengus membras L., on different substrates in the south-west archipelago of Finland. J. Fish Biol. 34, 417–427. doi: 10.1111/j.1095-8649.1989.tb03324.x
Reis-Santos, P., Tanner, S. E., Vasconcelos, R. P., Elsdon, T. S., Cabral, H. N., and Gillanders, B. M. (2013). Connectivity between estuarine and coastal fish populations: contributions of estuaries are not consistent over time. Mar. Ecol. Prog. Ser. 491, 177–186. doi: 10.3354/meps10458
Rey, J., Fernández-Peralta, L., García, A., Nava, E., Clemente, M. C., Otero, P., et al. (2016). Otolith microstructure analysis reveals differentiated growth histories in sympatric black hakes (Merluccius polli and Merluccius senegalensis). Fish. Res. 179, 280–290. doi: 10.1016/j.fishres.2016.03.020
Rogers, T. A., Fowler, A. J., Steer, M. A., and Gillanders, B. M. (2019). Spatial connectivity during the early life history of a temperate marine fish inferred from otolith microstructure and geochemistry. Estuar. Coast. Shelf Sci. 227:106342. doi: 10.1016/j.ecss.2019.106342
Slotte, A., Husebø, Å, Berg, F., Stenvik, E. K., Vikebø, F., Folkvord, A., et al. (2019). Earlier hatching and slower growth, a key to survival in the early life history of Norwegian spring spawning herring. Mar. Ecol. Prog. Ser. 617-618, 25–39. doi: 10.3354/meps12682
Sponaugle, S. (2010). Otolith microstructure reveals ecological and oceanographic processes important to ecosystem-based management. Environ. Biol. Fishes 89, 221–238. doi: 10.1007/s10641-010-9676-z
Stenevik, E. K., Fossum, P., Johannessen, A., and Folkvord, A. (1996). Identification of Norwegian spring spawning herring (Clupea harengus L.) larvae from spawning grounds off Western Norway applying otolith microstructure analysis. Sarsia 80, 285–292. doi: 10.1080/00364827.1996.10413602
Swain, D. P., and Foote, C. J. (1999). Stocks and chameleons: the use of phenotypic variation in stock identification. Fish. Res. 43, 113–128. doi: 10.1016/S0165-7836(99)00069-7
Tomás, J., and Panfili, J. (2000). Otolith microstructure examination and growth patterns of Vinciguerria nimbaria (Photichthyidae) in the tropical Atlantic Ocean. Fish. Res. 46, 131–145. doi: 10.1016/s0165-7836(00)00140-5
Utne-Palm, A. C. (2004). Effects of larvae ontogeny, turbidity, and turbulence on prey attack rate and swimming activity of Atlantic herring larvae. J. Exp. Mar. Biol. Ecol. 310, 147–161. doi: 10.1016/j.jembe.2004.04.005
Via, S., Gomulkiewicz, R., De Jong, G., Scheiner, S. M., Schlichting, C. D., and Van Tienderen, P. H. (1995). Adaptive phenotypic plasticity: consensus and controversy. Trends Ecol. Evol. 10, 212–217. doi: 10.1016/S0169-5347(00)89061-8
Wespestad, V. G., and Moksness, E. (1990). Observations on growth and survival during the early life history of Pacific herring Clupea pallasii from Bristol Bay, Alaska, in a marine mesocosm. Fish. Bull. 88, 191–200.
Keywords: population structure, otolith microstructure, common garden, population discrimination, salinity, phenotypic plasticity
Citation: Tonheim S, Slotte A, Andersson L, Folkvord A and Berg F (2020) Comparison of Otolith Microstructure of Herring Larvae and Sibling Adults Reared Under Identical Early Life Conditions. Front. Mar. Sci. 7:529. doi: 10.3389/fmars.2020.00529
Received: 30 January 2020; Accepted: 10 June 2020;
Published: 03 July 2020.
Edited by:
Benjamin D. Walther, Texas A&M University Corpus Christi, United StatesCopyright © 2020 Tonheim, Slotte, Andersson, Folkvord and Berg. This is an open-access article distributed under the terms of the Creative Commons Attribution License (CC BY). The use, distribution or reproduction in other forums is permitted, provided the original author(s) and the copyright owner(s) are credited and that the original publication in this journal is cited, in accordance with accepted academic practice. No use, distribution or reproduction is permitted which does not comply with these terms.
*Correspondence: Susanne Tonheim, c3VzYW5uZS50b25oZWltQGhpLm5v; Florian Berg, Zmxvcmlhbi5iZXJnQGhpLm5v