 Hilde Hannevig
 Bernt Arne Bertheussen
- School of Business and Economics, Faculty of Biosciences, Fisheries and Economics, UiT The Arctic University of Norway, Tromsø, Norway
It is an established “truth” in the literature that a company which restricts itself to utilize existing resources without exploring new business opportunities is doomed to fail in the long run. An underlying premise for the claim is that the competition arena is dynamic and organized according to free competition principles. This study, however, examines whether it is more profitable for a fishing vessel to primarily exploit existing resources when the quota shares of the players are institutionally protected so that there is no real competition between them. The context is Norwegian seagoing purse seiners, which in 2005 experienced the introduction of a more market oriented individual transferable quota (ITQ) system with some distinct modifications. The vessels in the study were classified into strategic groups based on their exploitation versus exploration approaches. Financial accounts covering the period 2003–2017 were collected and analyzed to empirically address the issue. Some vessels did considerable explorative activities in the period studied by fishing related species, investing in quotas, and in new vessel technology. The findings suggest that firms which did not explore, but instead exploited their existing resource base performed relatively better than their peers except for EBITDA (earnings before interest, tax, depreciation and amortization) margin. Finally in the paper, the findings are discussed and implications outlined.
Introduction
Why apparently successful firms vanish or diminish over time has been a core question in strategic research for quite some time (e.g., Tushman and O’Reilly, 1996; Probst and Raisch, 2005; Kücher et al., 2018). Research indicates that to survive and succeed in the long run, companies must balance exploitation and exploration. Exploration is in this context related to experimentation, innovation, flexibility, and divergent thinking, whereas exploitation is associated with focus, efficiency, refinement, and implementation (e.g., March, 1991). A firms’ capability to balance exploration and exploitation reflects how it responds to opportunities and threats in the environment while simultaneously securing acceptable short-term performance (O’Reilly and Tushman, 2013).
The trade-off between exploration and exploitation is challenging because exploring and exploiting business strategies compete for the same scarce resources within a firm (Junni et al., 2013). Firms have a tendency to tilt toward exploitation rather than exploration when prioritizing between the two. A reason for this can be found in a firm’s preference for short-term success over the uncertainty of future exploring outcomes (March, 1991). A downside of leaning too much on exploitation can be that the firm becomes vulnerable to changes in its business environment. This may especially be the case when a firm faces revolutionary change, turning from existing products, markets, technologies, or institutions, to radically new ones (Raisch and Birkinshaw, 2008). On the other hand, too extensive exploration can lead to endless searches for change that the firm does not manage to capitalize on (Levinthal and March, 1993). The tensions between the two have been described as the “exploitation-exploration” dilemma of a firm (e.g., Prange and Schlegelmilch, 2009).
The need to engage in both exploration and exploitation, and to what degree the firm should engage in each, is influenced by the rivalry and competitive intensity of the industry (Auh and Menguc, 2005). Balancing exploration and exploitation seems to be more rewarding for high tech firms, firms in service industries, and firms that are exposed to dynamic environments (Volberda and Lewin, 2003; Simsek et al., 2009; Junni et al., 2013). In an environment of low competition and low change intensity, a firm can succeed by mainly exploiting existing resources and capabilities (Probst et al., 2011; O’Reilly and Tushman, 2013). In a market place sheltered from competition, and with no radical changes spotted in foreseeable future, firms might perform better with a low degree of exploration. However, a firm can get caught up in a “competency trap” that stems from the structural and cultural inertia that arises when it becomes larger and older (Levitt and March, 1988). Both the knowledge base and the resources of a firm may have become so specialized that change is hard to achieve because it lacks the capabilities to recognize and implement changes. This inertia can cause the factors that made the firm successful in the first place to be a hindrance for change and future success (Tushman and O’Reilly, 1996; Volberda and Lewin, 2003).
Scholars have requested more studies of the effect of environmental factors when balancing exploitation-exploration (Raisch and Birkinshaw, 2008; Simsek et al., 2009; Junni et al., 2013). Insights about contingencies effects are still rare in the literature, albeit a potent source of future theory building (Fourné et al., 2019). Such an avenue of research also has the potential to create new managerial insights (ibid.). This study responds to a call for increased recognition of contingencies that serve as boundary conditions of strategic choices and performance of firms (e.g., Gupta et al., 2006). Moreover, the study follows Lavie et al.’s (2010, p. 142) advice to “systematically study the antecedents to exploration–exploitation.” Thus, bringing institutions to the forefront of the strategy literature research agenda is the main theoretical contribution of this paper.
The Norwegian seagoing purse-seine fleet is chosen as the empirical context of this study, and to investigate thereby the long-term relationship between fishing vessels exploitation and exploration strategies and their subsequent performance is at the core of this work. The fleet operates under an individual fishing quota (ITQ) regime, and is a subsidy-free limited entry fishery. This industry is particularly interesting in an institutional perspective; firstly because the institutions surrounding the industry clearly limits the actors’ strategic room to maneuver. On the other hand, and secondly, the same institutions strongly protect the strategic position of the players from outside intruders, and also efficiently block the rivalry between them.
In the following section, a tentative theoretical framework is developed which guides this inquiry. Thereafter, the institutional context of the study is described. Next, the research design and method is explained and findings are presented. Finally, results and implications are discussed.
Theory
Tushman and O’Reilly(1996, p. 11) state that: “Almost all successful organizations evolve through relatively long periods of incremental change punctuated by environmental shifts and revolutionary change.” When a firm’s business environment is disrupted by revolutionary change, the conditions in which the firm has succeeded are altered. The changes can, for instance, be driven by new technology, rougher competition, or institutional change. Only few firms manage to adapt and succeed in radically altered environments (ibid.). A central premise for the exploration-exploitation framework concerns the tradeoffs between the two (March, 1991). When choosing to support exploration, resources are allocated toward development of activities, knowledge, and capabilities that are meant to gain future performance (Lavie et al., 2010). These resources could alternatively be used to achieve better economic performance at the present time.
Separating exploration and exploitation and how it is done has been debated extensively in the literature (e.g., Gupta et al., 2006; Lavie et al., 2010). Lavie et al. (2010) in their study suggest that exploration and exploitation should be considered a continuum of behaviors, and not discrete choices, because exploration and exploitation are often a matter of degree. Firms’ transition from exploitation to exploration and vice versa over time, and the capability of gaining new knowledge will often be rooted in the existing knowledge base of the firm (ibid.). Besides the sliding alteration between the two, exploration versus exploitation is relative regarding the degree of “newness.” “Certain knowledge, technology, or markets may be new to one organization but familiar to another. Consequently, “one organization’s exploration may be considered exploitation by another” (Lavie et al., 2010, p. 115). In the present study, the criteria used to classify the purse seine vessels was whether they fished blue whiting or not. The exploiting vessels had chosen not to fish blue whiting but focus on fishing traditional pelagic species such as herring, mackerel and capelin using a purse seine. The exploring vessels had, on the other hand, chosen to add blue whiting to their traditional pelagic fishery. To catch blue whiting required the vessel owner to explore new technologies such as rigging for trawl in addition to purse seine, and often to invest in a larger and newer vessels with increased engine power. Furthermore, to fish the new species also involved buying blue whiting quota shares. Investing in new technology and capabilities of catching new species requires building new knowledge and expertise in the individual firms, in addition to requiring substantial financial resources.
Natural resource-based industries are designed and framed by institutions. For example, total allowable catch (TAC) regulations are key instruments in the management of all financially valuable fish stocks in the Barents and the Norwegian Seas (Sandberg et al., 1998). Moreover, the race to fish is curbed by institutional arrangements such as catch shares. When catch shares as ITQ’s are introduced in a fishery, these are protected from rivals (Grafton, 1996; Arnason, 2005). Accordingly, the ITQ institution may have a decisive impact on whether a fishing vessel finds it more financially attractive to utilize existing vessels and quotas than exploring related fisheries, new technological opportunities or new opportunities arising in the quota market. Figure 1 presents the tentative theoretical framework of the study.
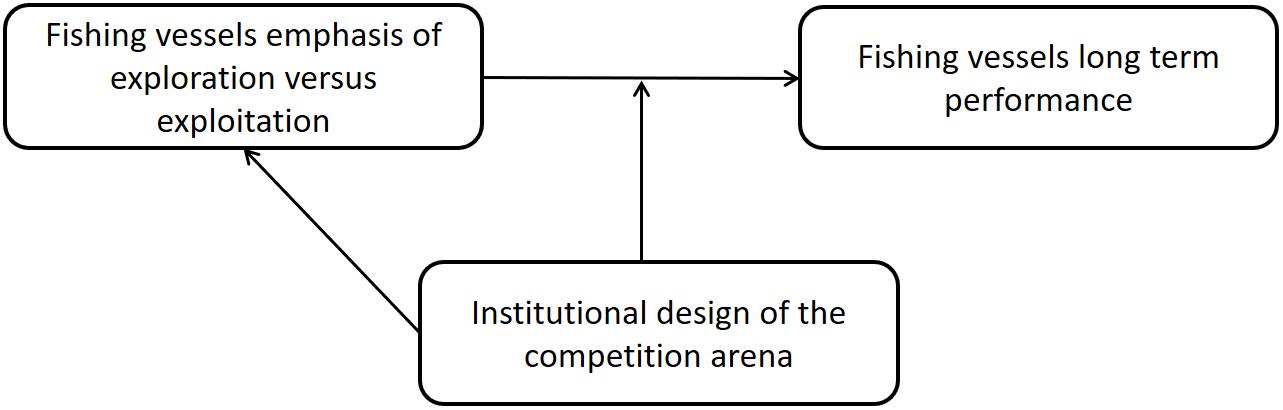
Figure 1. The tentative theoretical framework guiding this work.
Figure 1 illustrates a contingency model of the relationship between fishing vessels’ strategic choises (exploitation versus exploration) and their expected long-term performance. In the model, the relationship is contingent upon the institutional design of the competition arena. If the catch shares of vessels are institutionally protected, there will be no race to fish (e.g., Birkenbach et al., 2017). Accordingly, this study anticipates that it will be more profitable to exploit existing resources and capabilities than to explore new business opportunities. However, if there is free competition in the competition arena, the relationship between the strategic approach chosen and performance may be otherwise.
The research design chosen is a theoretically motivated comparative case study. Fishing vessels are the unit of analysis, and the two cases consists of two strategic vessel groups, which fish the same species (primarily herring, mackerel, and capelin), and use the same catch technology (purse seining). Furthermore, the vessels have chosen two different strategies, one of which is “pure” exploitation, and the other is a hybrid strategy in which they also do exploration by fishing another species (blue whiting). To uncover the long-term effects of the two different strategic approaches, a longitudinal research design is chosen. When comparing the performance of the two strategic groups over time, this study hopefully can find indications on the performance effect of engaging in exploitation only versus also doing exploration for a fishing vessel. The institutional context of the study is presented in the next section.
Securing the Revenue From Fishing Through Institutions
Norwegian seagoing pelagic seiners constitute the empirical context of this study. The most valuable pelagic species fished is herring and mackerel. After the national TAC is set through international agreements, it is distributed to different Norwegian pelagic vessel groups as group quotas (Bjørndal and Ekerhovd, 2014). In addition to seagoing purse seiners, groups of pelagic trawlers, coastal pelagic boats, and purse seiners without concession also exist. The group quotas are further distributed to the vessels within the groups based on their quota holdings. Approximately 2/3 of the TAC goes to the group quota of seagoing purse seiners. This group consists of purse seiners over 90 feet or those having a load capacity over 1,500 hl. The entire population of the seagoing purse seiner group in 2015 included 78 vessels (Iversen et al., 2018).
Securing the Revenue of the Industry Through TAC-Regulations
To secure the revenue base of the Norwegian pelagic industry, the fishery has, throughout the study period, been successfully regulated by annual TACs. Left axis of Figure 2 measures the revenue by species (stacked bars) by all Norwegian pelagic vessels that are longer than 28 m. Furthermore, right axis measures the total catch volume of all species (dashed line).
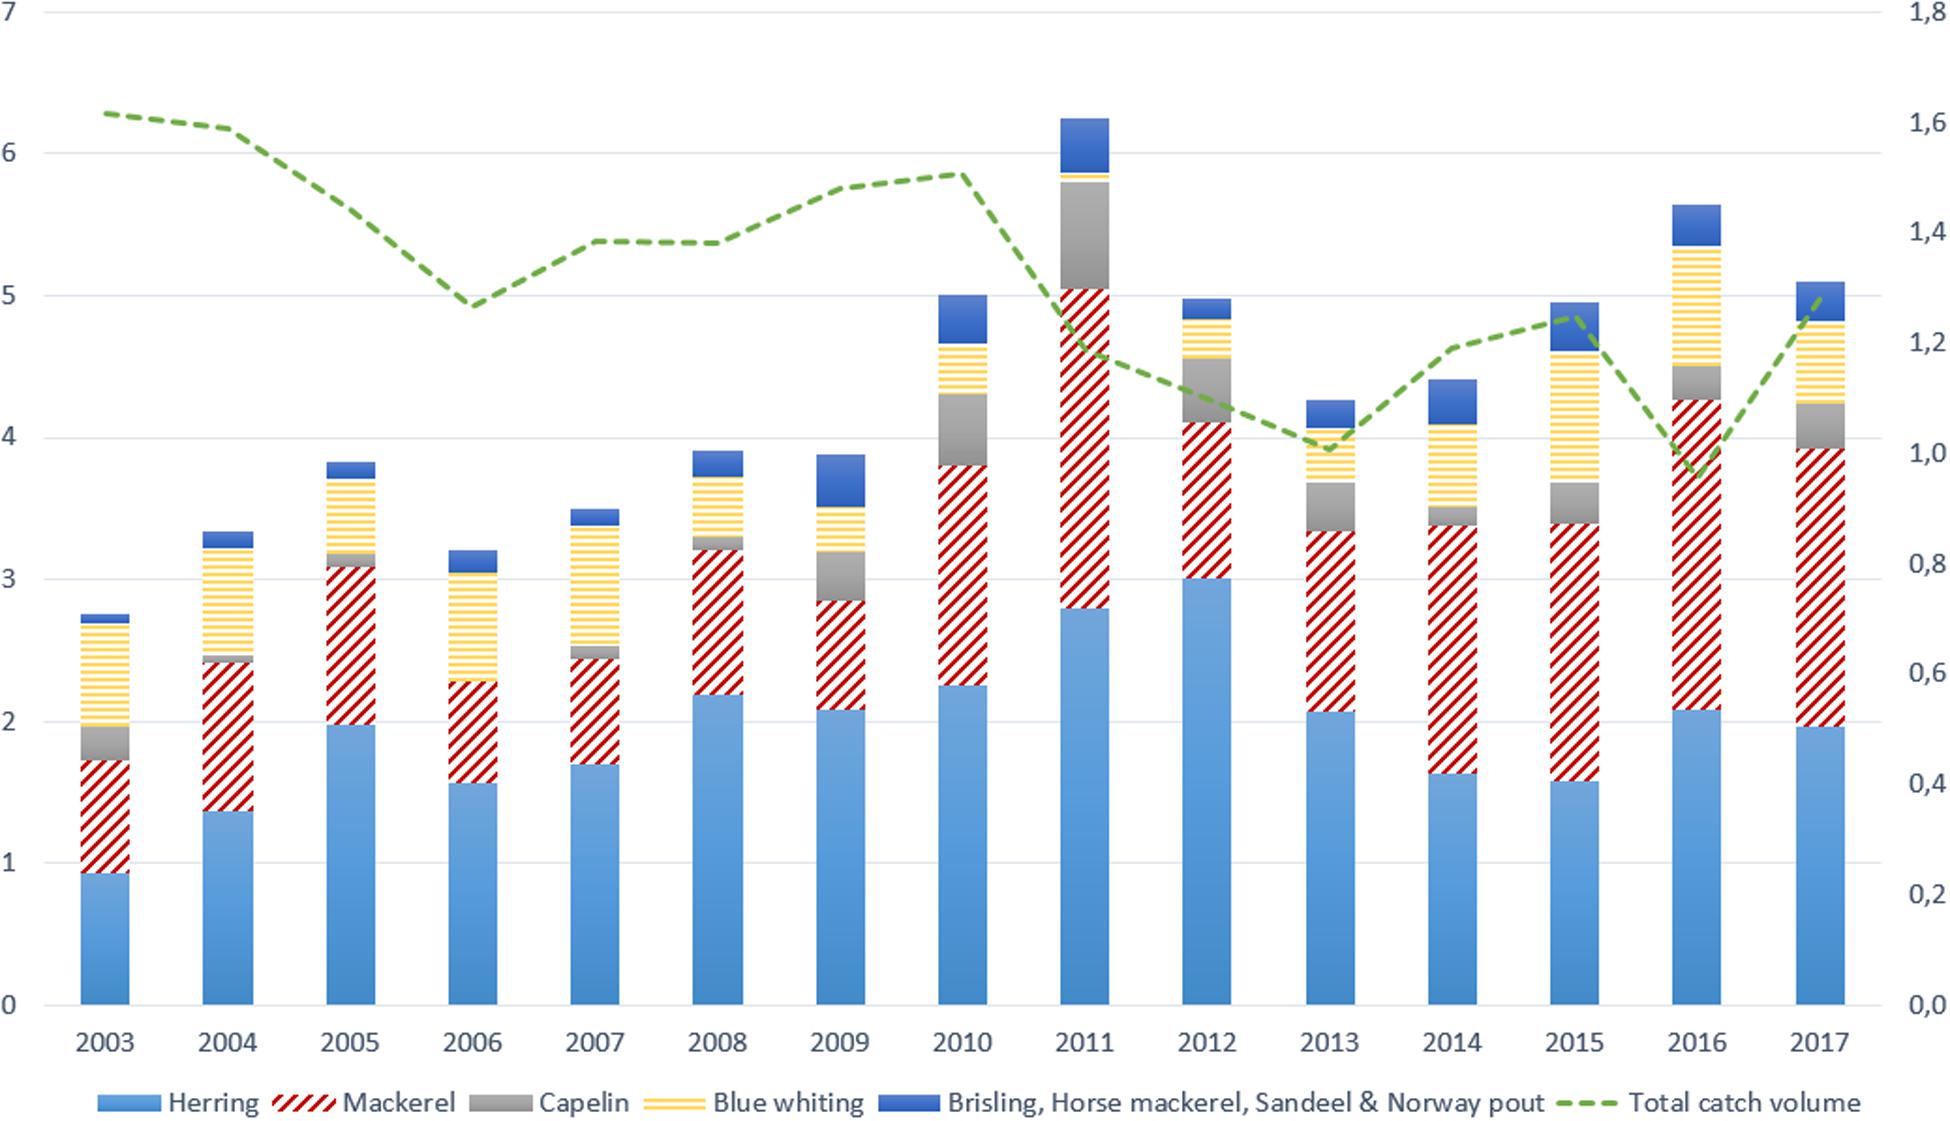
Figure 2. Left axis: Revenue in billion NOK of pelagic species of vessels >28 m. Right axis: Total catch in billion kilos of pelagic species of vessels >28 m. Source: Norges Sildesalgslag (https://www.sildelaget.no).
During the period covered, revenues from the seagoing pelagic vessel group have increased from NOK 3 billion in 2003 to NOK 5 billion in 2017 (left axis in Figure 2). This corresponds to an annual revenue growth rate of 3.5%. Revenues peaked in 2011 at NOK 6 billion. However, in the same period, the total catch volume of all pelagic species has declined from 1.6 billion kilos in 2003 to 1.3 billion kilos in 2017. This corresponds to an average annual decline in catch volume of 1.5%. When revenues have increased despite a decrease in volume, this can be explained by an increase in prices of pelagic products. Part of the price increase is due to an increase in the proportion of products that go to human consumption. The fact that the Norwegian currency has depreciated relative to dollars and euros in recent years is another important contributor to the price increase experienced by the Norwegian players (European Central Bank, 2020).
Securing the Revenue of the Vessels Through ITQ-Regulations
In 1972, after the collapse of the Norwegian herring fishery, all vessels catch volumes were limited. Additionally, a license was required to restrict new vessels from entering the fishery. Norway does not manage its fisheries officially by individual transferable quotas (ITQ’s), but in reality, the applied ITQ system has many similarities with an ITQ system (e.g., Hannesson, 2013; Asche et al., 2014; Standal and Hersoug, 2014; Johnsen and Jentoft, 2018; Standal and Asche, 2018). Thus, a pelagic quota consists of a “package” that gives a Norwegian seagoing purse seiner the right to catch a certain volume of herring, mackerel, and capelin. Even before 2005 quotas had been traded. However, in 2005, a more market oriented and flexible “structural” quota (SQ) system was introduced. The original quota of the vessel, which was awarded gratis by the state to those vessels participating in the fishery when it was closed, is described as a base quota (BQs). When a BQ is being traded, it has been, after 2005 converted to a structural quota (SQ). The predecessor to the structural quota system was a more rigid individual vessel quota system (IVQ) (Johnsen and Jentoft, 2018).
A purse seine owner with Norwegian citizenship can buy another vessel in the same vessel group, transfer the quota from the bought vessel, decommission the bought vessel, and keep the transferred quota for a limited number of years, for example 20. Quotas sold are curtailed by a certain proportion. The truncated portion is redistributed to the vessel group. A vessel owner can buy and transfer quotas only up to a certain limit. If an owner has more quotas than he can fish with his active vessel, then he can apply for a permit to split and sell it. Once the limited time period is over, the quota is supposed to go back to the group and be redistributed on a permanent basis to the remaining vessels in the seagoing purse seiner group. Thus, all vessels in the group will get more quotas.
In the seagoing purse seine group, there is one national market with regional boundaries and specific restrictions involved (Standal and Hersoug, 2014). There is a certain curtailment of the quota depending upon which county the quota is transferred to. These measures are intended to limit regional concentration of fishing capacity and operations. Finally, there are substantial legal barriers to entry into the fishery in the form of license requirements, nationality requirements, residency requirements, and vessel requirements (Sørgård et al., 2018). To sum up, the ITQ system outlined provides an institutional protection of the vessels’ catch shares from their rivals. Moreover, it protects the incumbent vessels from outside intruders.
Development of Empirical Hypothesis
In this section, an empirical hypothesis is developed relating to the performance effect of a vessel pursuing an exploitation versus an exploration business strategy.
Exploring Opportunities Arising in Related Fisheries
Catches of blue whiting have increased rapidly since 1998 (Bjørndal and Ekerhovd, 2014). In some years during the study period, Norwegian seagoing vessels have been fishing a substantial volume of blue whiting (see Figure 1). Blue Whiting is a small fish in the cod family, and is characterized as an oceanic, semi-pelagic species (Standal, 2006). The population has a considerable dissemination covering major areas of the north-east Atlantic. The species is numerous, and for a time blue whiting was one of the largest fisheries in the North East Atlantic (Bjørndal and Ekerhovd, 2014).
However, the coastal states that are involved in the blue whiting fishery have had trouble agreeing on the distribution of the TAC of the migrating blue whiting stock. Thus, the stock has been overexploited (Standal, 2006). Until 2005, there was a de facto free fishing for blue whiting (Bjørndal and Ekerhovd, 2014). For some seagoing vessels that were fishing for mackerel and herring, it appeared to be an attractive strategy to expand into blue whiting fishing in order to reap economics of scope (Standal, 2006). Blue whiting is mainly caught by trawl, not purse seine like herring and mackerel. Furthermore, blue whiting is found in deep waters further off shore than the other pelagic species. Norwegian vessels participating in blue whiting fishing therefore need high engine power and a large load capacity to minimize the number of trips, and thus the transaction costs to the rough far-distant blue whiting fishing waters (Standal, 2006; Bjørndal and Ekerhovd, 2014).
Exploring Opportunities Arising in the Quota Market
In strategic factor markets, firms can buy and sell resources in order to implement their strategies (Barney, 1986). However, if the cost of strategy implementation is greater than the returns obtained, a firm will not create above normal economic profit. If strategic factor markets are perfectly competitive, the full value of the resources will be discounted when purchased. Accordingly, vessels will only obtain normal returns from purchasing strategic resources as, e.g., quotas in a perfect (quota) market. In an imperfect quota market, however, an obvious motive to invest is that the quota investment is regarded as profitable in itself. If a buyer has excess catch capacity and high expectations of the future, he/she may buy the quota at a steep price. On the other hand, a firm which wants to exit the industry, perhaps because it is less efficient than its rivals or because of a generation change, may have lowered the future expectations of the fishery and subsequently charge a lower price than the market price for the quotas sold (ibid.). If so, the buyer of the quota will reap the future economic benefit of the quota transaction.
When investing in quotas, both costs and revenues are affected. A larger quota results in a larger catch, which will give rise to higher revenues. Larger catches can also enable a firm to better exploit economics of scale and thus reduce costs (Nøstbakken, 2012). Moreover, transaction costs for both the seller and buyer can decrease when the vessel delivers large catches (Hannesson, 2016).
Exploring New Technological Opportunities
A firm will invest in new vessel technology to become more efficient and profitable. Fishing vessel firms can also invest in better technological equipment to improve the working days and safety of the crew and thereby attract more skilled fishermen. This can, however, lead to over-investment in capital. The effect may be reinforced by tax subsidies (Townsend, 1985). Moreover, technology that is available and purchased in an open market can hardly give a firm any competitive advantage as it can easily be imitated by rivals (Barney, 1986). However, the way the vessel is used to harvest the quota available can give rise to a competitive advantage and above-normal profit (Barney, 1991). The same goes for the culture of the crew, their fishing practices, and the relationships between fishermen and the skipper (Vázquez-Rowe and Tyedmers, 2013). The most efficient purse seiners are the ones who use the shortest time to fill their quotas, as long as the product quality is not impaired, and thereby affect the market price obtained. The market prices are set in electronic auctions with no product inspections and conducted on a first-price, sealed-bid basis (Sogn-Grundvåg et al., 2019). Furthermore, a vessel is expected to have large catch capacity and modern capture and storage technology. Such a vessel could also have lower transaction costs (Williamson, 1981) than a vessel based on old and less efficient fishing technology. For a ship who is harvesting a natural resource, the possibility of cost-effective fishing may only exist for brief periods of the year (Hermansen and Dreyer, 2010). In this case, it is important for the vessel to have sufficient and efficient catch capacity to exploit those brief time windows when they are open.
Within an ITQ management system, adapting the catch capacity to the quota base is a central strategic decision for the individual fishing vessel firm (Iversen et al., 2018; Bertheussen et al., 2020). The size of the quota and the catch capacity of the vessel must be aligned for a firm to operate efficiently, and a mismatch will incur an economic loss on the company. Consequently, quota investments are expected to be followed up with more vessel investments so that the two investment types support each other in a balanced way. However, the vast majority of purse seiners have many open days for fishing at specific periods of the year; i.e., they dispose of free fishing capacity. The quality of the different species varies over the year due to the migration-, feeding-, and mating pattern. This restricts the fleet from catching their quotas all year round. Despite these seasonal restrictions, there still is overcapacity in the fleet (Bertheussen et al., 2020). Thus, larger quotas entail very little increase in other costs, excluding the crews’ share of the catch. It is therefore rarely necessary for a vessel owner to invest in more catch capacity when investing in quotas. An exception is when a vessel invests in blue whiting quotas. In doing so it must be able to use both trawl and purse seine. The BQ always contains pelagic species such as herring and mackerel that is caught by purse seine, while blue whiting is caught by trawl. Such exploration demand a vessel that are rigged for both trawl and purse seine. Both rebuilding or buying a new vessel for this purpose requires large investments.
Exploiting Existing Resources and Capabilities
Some vessel firms in the industry may have chosen not to buy additional quotas, and rather kept on economizing with quotas received for free (Bertheussen and Vassdal, 2019). One reason is that they may not have found it profitable to buy additional quotas in the market place in order to expand their business (Barney, 1986). Firms which have neither bought quotas nor vessels apparently have a rather risk adverse attitude and reactive strategic approach toward their position in the industry (Spanos and Lioukas, 2001). Accordingly, these firms seem to follow an exploitation strategy as they appear to be satisfied with their original quota base and existing (old) vessel. These firms exploit existing resources, and develop their business through refinement and by improving existing routines and assets (Gupta et al., 2006).
An alternative motive for not investing in either quota or vessels might be that these firms are planning a future exit from the industry, for example in connection with a generational change. If so, their main focus may be to maintain their institutionally sheltered position until they eventually decide to exit the industry (Nøstbakken, 2012). When there is an old written off vessel in the accounts, the quota may be perceived as even more attractive by potential buyers, as they then purchase a “clean” quota as far as you can get it in the Norwegian ITQ-system. Finally, a last reason for a vessel owner not to buy a quota is having a long-term perspective. When a vessel buys additional quotas, it can only utilize SQs for a limited time period before it is reversed to the general group quota share and partitioned between all the vessels in the group.
The exploiting vessels possess valuable intangible assets (fishing quotas) that are invisible in their balance sheets because they have received them for free and they have not yet been subject to a market transaction. Thus, the input generated biologically by the fish stock has essentially a zero cost in the vessels income statements. Moreover, these firms dispose of (old) vessels which are more or less written off in their accounts. Nevertheless, the relatively old boat, its fishing equipment, and crew are still capable of capturing the quota available. The vessels in this strategic group have expectedly gained a significant cost advantage relative to its peers (Bertheussen and Vassdal, 2019).
Empirical Hypothesis
Based on the discussions in this section, the following empirical hypothesis is posited in this study:
H1: In a fishery where vessels quota shares are institutionally protected, exploiting vessels’ perform better than vessels both exploiting and exploring.
Materials and Methods
Research Design
The research design of the empirical study outlined in this article requires in-depth knowledge of the emphasis of exploitation-exploration strategies implemented by the vessels. The design also requires valid and reliable performance measures. Finally, a dataset of representative firms over a period covering the introduction and long term use of an ITQ-like management regime is needed. In this context, a period of 15 years (2003–2017) is considered sufficient in order to study how vessels have strategically adapted their fishing activities to an ITQ system.
Strategic theory requires in-depth knowledge of the competitive arena being studied (Rumelt, 1991). It is important that the environment is as similar as possible for the companies that are compared. By focusing on one single industry, it is possible to control for industry impact (Miller and Shamsie, 1996) which, according to Porter (1980), is crucial for the firms’ profitability. The resource-based view on strategy, on the other hand, requires good measures of firms’ individual resource positions (Dreyer and Grønhaug, 2004). Previous empirical studies utilizing this perspective have often been of the case study (Barney and Clark, 2007). However, the literature recommends a comparative design to avoid the weaknesses of case analyses (Reed and DeFillippi, 1990). In this study, a sample consisting of most of the population of the Norwegian seagoing purse seiners is included to disclose the link between different exploitation-exploration strategies and vessels’ performance. The population was split into two strategic groups in line with their emphasis of an exploitation-exploration approach. Finally, the financial performance of the two groups was compared in order to disclose whether there is a relationship between exploitation-exploration strategies and vessels profitability. The research design can be modeled as follows:
Long-term performance effects of exploiting and exploring vessels −Long-term performance effects of exploiting vessels = Long-term performance effects from exploring activities
Unit of Analysis
The vessel, which is a strategic business unit (SBU), is the unit of analysis in the present study. The validity of the comparison of vessels profitability is highest when vessels are similar (Richard et al., 2009). This study therefore chose an industry of similar vessels, which is the Norwegian purse seines fleet. None of these vessels are either vertically or horizontally integrated with other SBUs such as processing, sales, or non-fishery SBUs. Furthermore, according to the Norwegian Participation Act (2013, §6), a fisherman must have been actively fishing for at least three of the past 5 years to be allowed to own a fishing vessel. Consequently, all Norwegian purse seiners are owned by active Norwegian fishermen (Johnsen and Jentoft, 2018). Further, to prevent concentration of quotas on a few vessels, there is a quota ceiling for each vessel in Norway of 850 quota units (so-called “base tons”) at present, which represents approximately 2% of the TAC share. The quota basis of the largest vessel in the industry is less than three times the quota basis of the smallest vessel.
To sum up, the Norwegian purse seiners are comparable in scale. As a result, it is reasonable to claim that, in the research context chosen, the validity of the comparison of the vessels performance is high (Richard et al., 2009).
Sample and Data Collection
Fisheries management objectives generally include improving economic performance. Nevertheless, vessel profitability data to assess this is often unavailable as managers of relatively few fisheries collect such information, or they collect it only sporadically (Pascoe et al., 2019). However, the Norwegian Directorate of Fisheries requires most fishing companies to report income and cost data annually per vessel. Furthermore, physical catch data must be reported per fish species, the number of man-years used on the vessel, the number of operating days per vessel, and so on. This study has gained access to this unique dataset, and bases all its analysis on it.
For this study, management accounts of most of the Norwegian purse seiners were analyzed (see the two rightmost columns in Table 2). A number of studies have shown that extraordinary firm or vessel performance can be partly explained by random events and that this may vary widely in a short or medium perspective (Jacobson, 1988). To avoid a snapshot of the profitability of the sample vessels, the analysis period extend over 15 years. Accordingly, management accounts were collected for the years 2003–2017. The period covers the introduction of the Norwegian ITQ system in 2005. The final database has 952 observations (accounting years) with 74 vessels participating in 2003 gradually decreasing to 56 vessels in 2017 (see Table 2).
Classification of Vessels Into Strategic Groups
The vessels in the sample were classified into two strategic groups based on their main emphasis of exploitation versus exploration business strategy. The criterion applied to include a vessel into a specific group is outlined in Table 1.
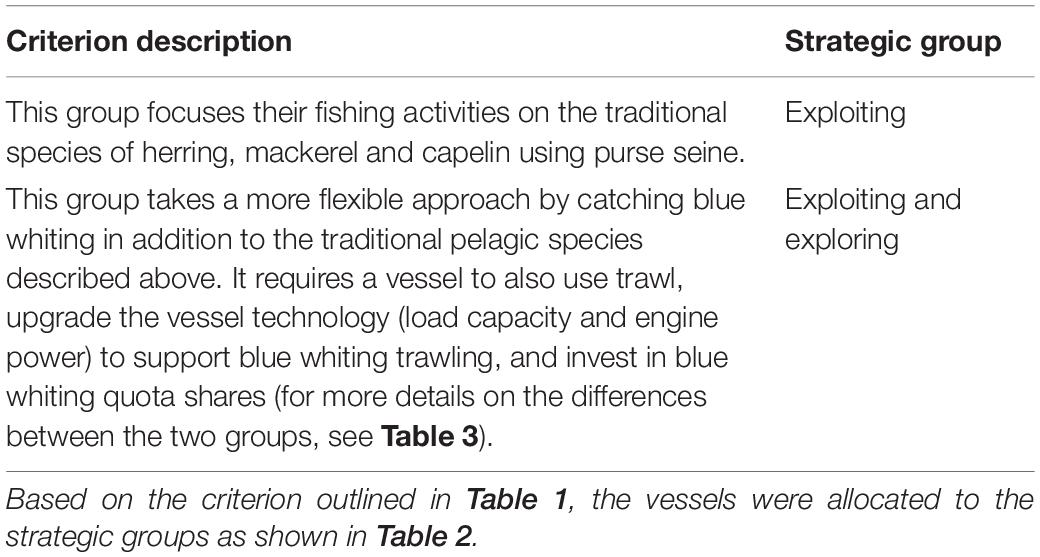
Table 1. Classification criterion for the separation of the sample into strategic groups.
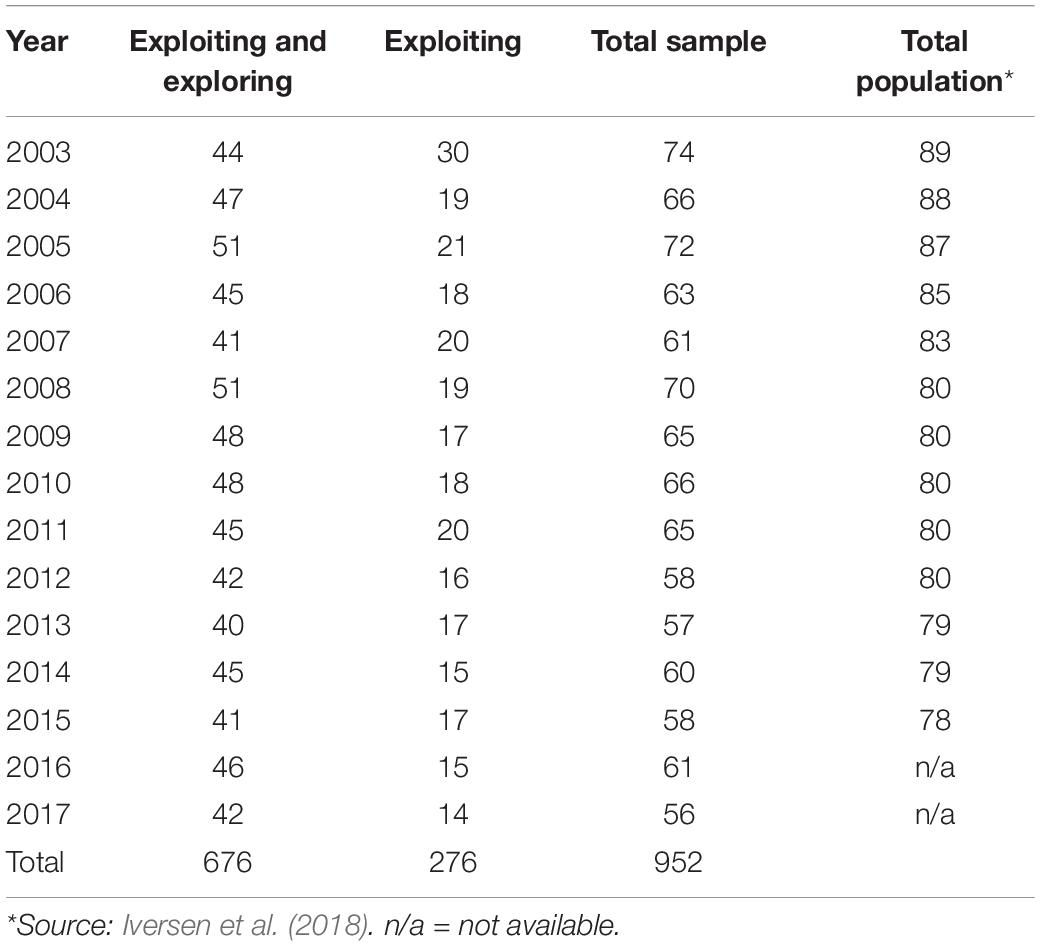
Table 2. Number of vessels classified into the sample of strategic groups per financial year.
Table 3 shows typical characteristics of the two different vessel groups in relation to the fishing effort employed.
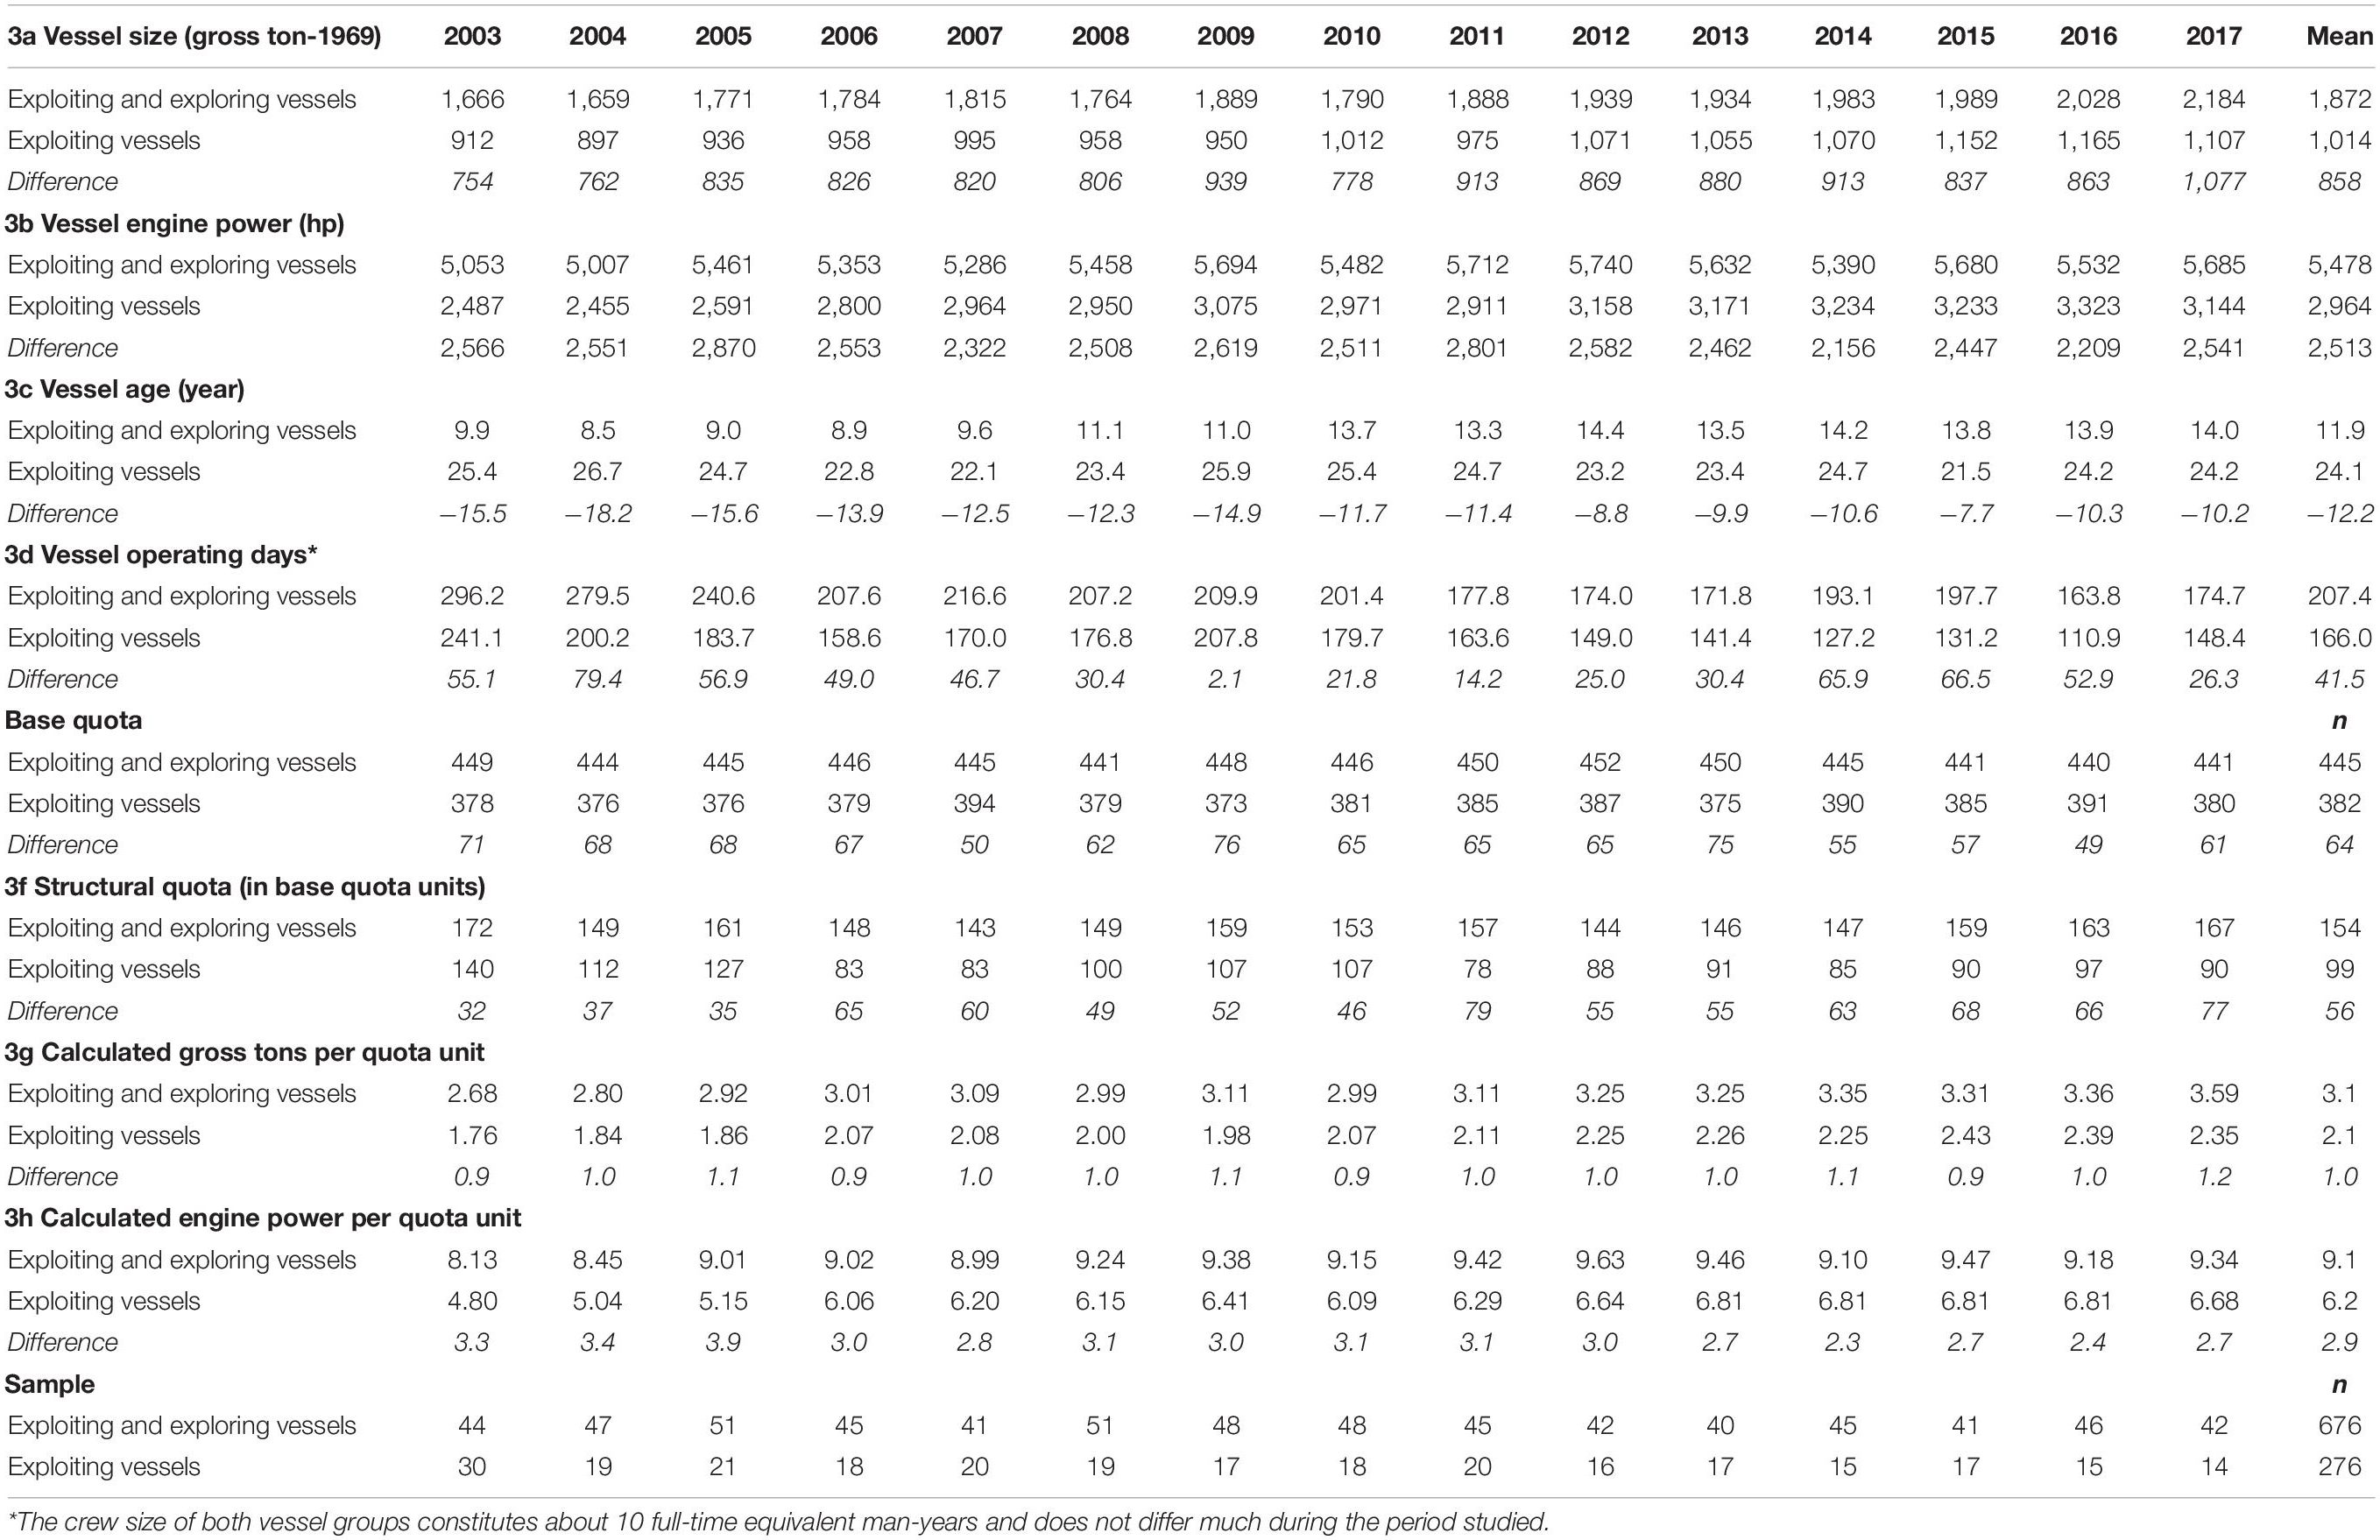
Table 3. Yearly and mean fishing effort of the two vessel groups.
Table 3 shows that the exploiting and exploring group has invested in significant larger, more powerful and newer vessels (3a, 3b, and 3c). The difference in vessel size (3a) has increased during the time period, whereas the exploiting and exploring vessels has constantly used almost twice the engine power of the exploiters (3b). Moreover, the difference in vessel age (3c) has declined slightly over the years. The two vessel groups operate their ships with approximately the same crew size (see table note). The exploiting group has, however, significantly less operating days (3d) than their peers. The difference is strongly related to how well the blue whiting fishery is. Thus, the difference was quite small in 2009–2012 when the quotas of blue whiting was lesser (see Figure 2). The more exploring vessel group holds significantly more quota units (3e and 3f) than the exploiters. The difference of base quota (3e) has been stable, whereas the difference in structural quota (3f) has increased in favor of the more exploring boats. Note too that the blue whiting quota of the exploiting and exploring vessels is not specified as this quota unit measure is not comparable with base quotas and structural quota units. The exploiting and exploring vessel group has not only invested more in absolute catch capacity (3a and 3b) and quota holdings (3e and 3f), but also relatively per quota unit (3g and 3h), which is the scarce production factor in the fishery. The overall impression is that Table 3 shows a picture of two vessel groups that are quite stably different.
Measuring Performance
The aim of this study is to explain variations in input (fishing) effort and performance among fishing vessels that have implemented different exploitation-exploration strategies. The 15-year long time period used also includes the implementation of the tradable ITQ-regulation system in Norwegian pelagic fisheries in 2005. It is of particular interest to study vessels’ strategic behavior over time in a population like this, because the adaption process to the new regime is not necessarily rapid. Thus, the effects of different strategic approaches may not be quickly visible. As disclosed by the rightmost column of Table 2 (Total population), the industry structure has been relative stable in the study period. In such a setting, there is a particular need for a long-term study, as prospects will then be better to uncover which strategic approaches may explain variability in vessels’ input effort and output.
Performance is a multidimensional concept, and can, for example, be measured by firm profitability, growth, or market share. Performance can also be measured using non-financial goals, such as flexibility and quality (Dreyer and Grønhaug, 2004). This study applies multiple performance measures. One operationalized dependent variable is vessels’ return on assets (ROA). It is calculated as Net Income/Total Assets based on book values. ROA includes the total activity of the vessel, and enables comparing vessels of different sizes (Magni, 2009; Penman, 2013).
The wealth increase that has taken place among all players in the industry as a result of significant increases in quota prices during the study period (Hannesson, 2016; Flaaten et al., 2017), is not reflected in ROA calculations based on book values. Accordingly, other performance measures which do not apply the book value of balance sheet data supplement ROA calculations, such as EBITDA (Earnings Before Interest, Tax, Depreciation and Amortization) margin and revenue growth. In the next section, findings are presented.
Findings
In this section, the empirical findings of the study are presented. The hypothesis raised in the study stated:
H1: In a fishery where vessels quota shares are institutionally protected, exploiting vessels’ perform better than vessels both exploiting and exploring.
Table 4 outlines key variables, which describe the performance of the pelagic vessels in the two strategic groups studied.
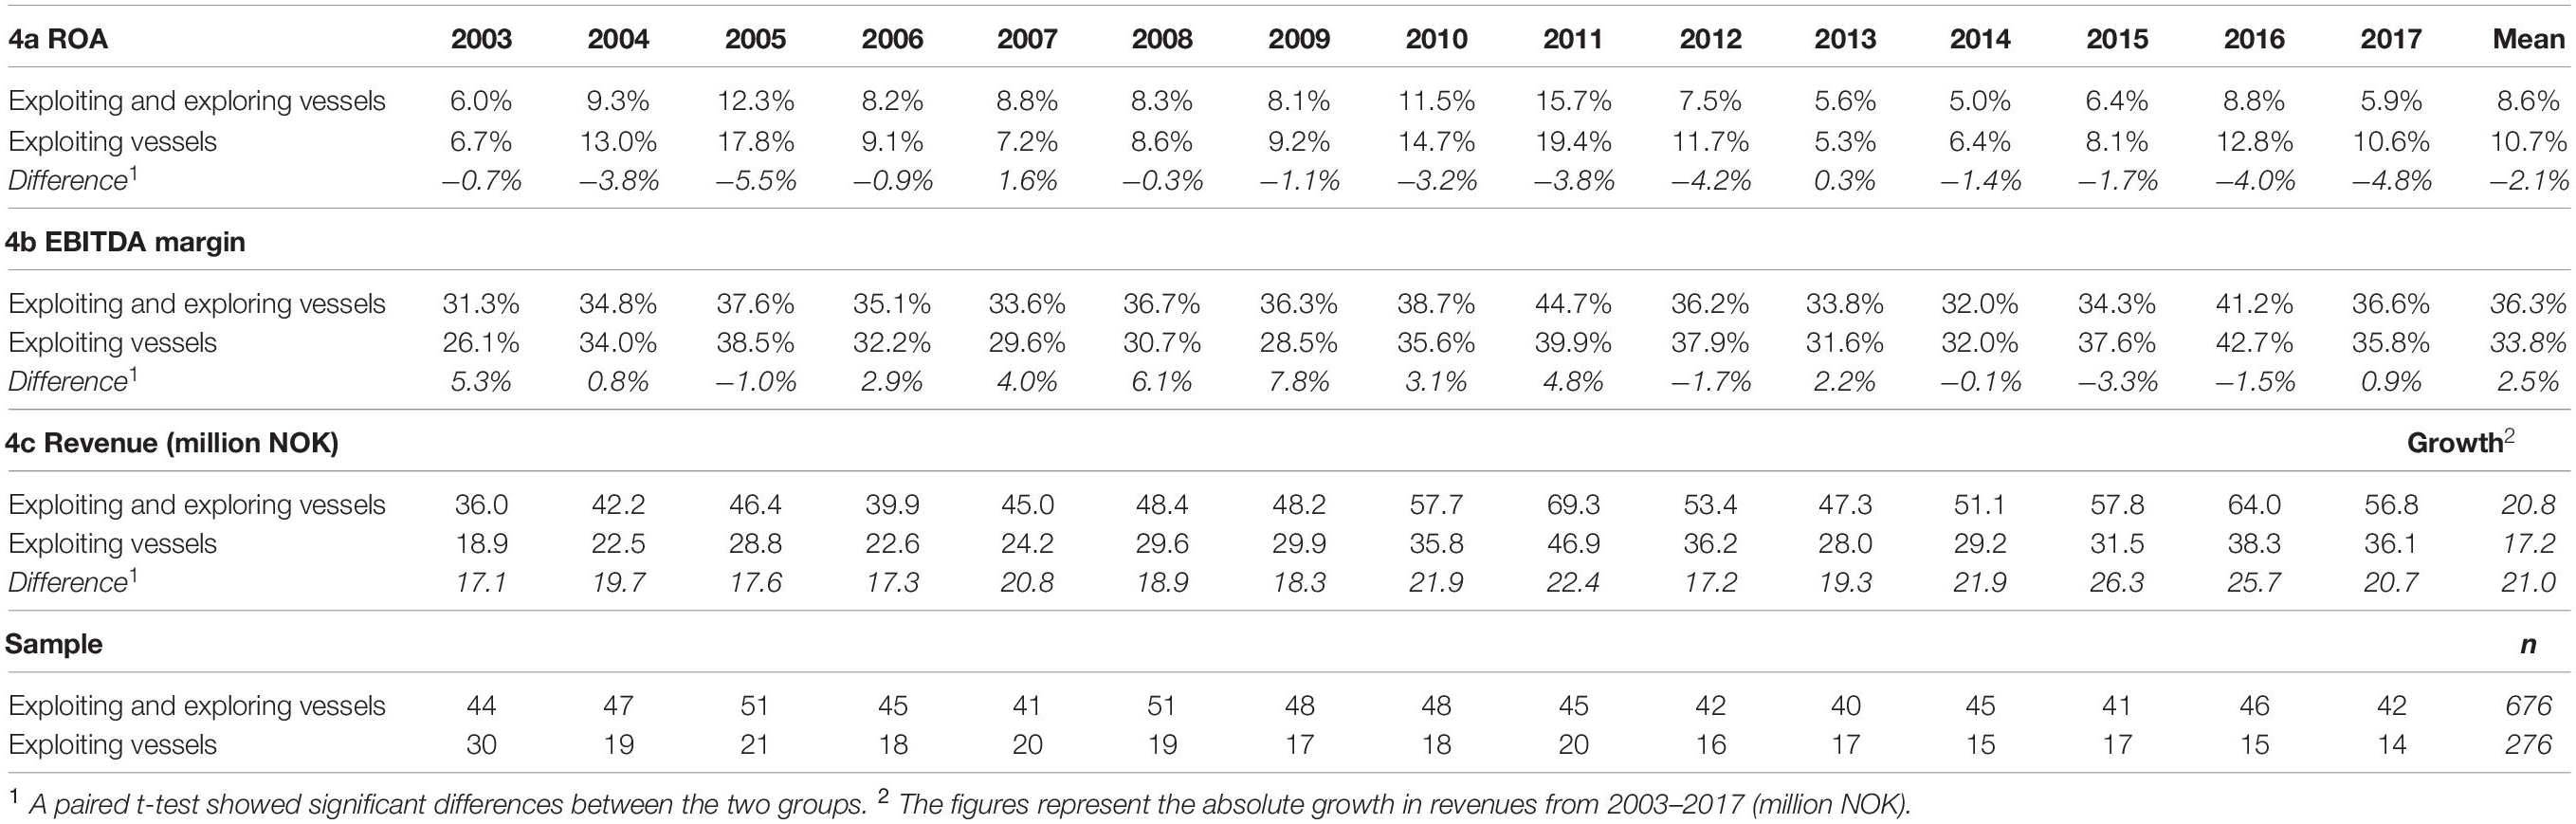
Table 4. Performance differences of the two strategic vessel groups in the seagoing Norwegian purse-seine fleet in the period 2003–2017.
This is equivalent to a mean annual growth rate of 2.5% for the exploiting and exploring vessels and 3.3% for the exploiting vessels.
The exploiting vessels has performed financially better (ROA) than their peers consistently over time (4a). The more exploring vessels performed best in 2007 and marginally better in 2013 (0.3%). However, in the 13 other years of the study period, the exploiters achieved the highest ROA. The picture was otherwise when it comes to EBITDA (4b). Here, the explorers obtained the best results for ten out of 15-years. The revenue difference between the two strategic groups (4c) has been remarkably stable at twenty million NOK a year in favor of the explorers. Nevertheless, the annual growth rate has been higher for the exploiting group (3.3% versus 2.5%), which had a relatively low revenue starting point in 2003. To sum up, it seems appropriate to conclude that the findings in Table 4 provide conditional support for H1.
Discussion
The present study investigates the relationship between fishing vessels exploitation-exploration strategies and their long-term economic performance conditional that the vessels operate under an ITQ management regime. The vessels in the chosen industry, the Norwegian seagoing purse-seine fleet, were subject to a significant institutional intervention with the introduction of an ITQ management system at the beginning of the 15-year period covered in the study. The empirical investigation started by separating the sample of 952 vessel financial years (ca. 80% of the population in 2013–2017) into two strategic groups, based on the their relative emphasis on exploitation versus exploration. Accordingly, 676 vessel/years were classified as exploiting and exploring, whereas 276 vessel/years were classified as exploiting (see Table 2). Consequently, the exploiting and exploring strategic approach was dominant among the vessels in the sample.
Vessel Performance
The hypothesis (H1) raised in this study was that in a fishery where vessels quota shares are institutionally protected, exploiting vessels perform better than vessels both exploiting and exploring. This hypothesis is supported by finding 4a in Table 4, as the exploiting vessel group’s long term ROA was significantly better than that of other strategic group. The exploiting group achieved an annual mean ROA of 10.7% before tax in the 15-year period studied, versus 8.6% of the exploiting and exploring vessel group.
Distinctive resources and capabilities are required to achieve superior performance relative to peers. This is dependent on an actor having something unique, which competitors find difficult to imitate (Barney et al., 2011). For a fishing vessel, it may for example be easier to make extraordinary profit based on quotas which they have received for free by the authorities by being in the right place at the right historical point of time (Barney, 1986). This vessel group which had more moderately invested in quotas (see 3f in Table 3) and also in the vessel (see 3a and 3b in Table 3) had smaller intangible and tangible assets entered into its balance sheets. Consequently, the modest amount invested in assets affected the magnitude of its ROA (see 4a in Table 4). Thus, the most profitable strategic group kept on economizing with a larger share of the quota holding received for free as the ratio 3e/3d in Table 3 is 0.26 for exploiting vessels versus 0.35 for exploring and exploiting vessels. The findings are supported by Bertheussen and Vassdal (2019) and Junni et al. (2013), but in contrast to the study by Auh and Menguc (2005), who examined the moderating role of competitive intensity on exploiting and exploring firms’ economic performance.
There are probable several reasons why the exploiting vessel group to a lesser extent chose to participate in the “quota race” and the “renewal of vessel race” taking place in the industry. One obvious explanation is that they found it more profitable to invest strategically neither in quotas nor in a new fishing boat because their quota base and catch capacity were well tuned at the outset (Bertheussen et al., 2020). If they have assessed the market prices on quotas too expensive (Hannesson, 2016), they may also not have found it economically tempting to invest in a new or upgraded vessel. Weninger and Just (2002) argue that uncertain, costly, and irreversible investments in a vessel can curb incentives to get rid of unproductive capital. Nevertheless, any player wishing to remain in the industry in the very long run must renew their vessel at some point in time. The oldest boats in the sample were built more than 50 years ago and still delivered very strong economic results during the period studied.
Another motive for the exploiting strategic group to invest more hesitantly might be that they are planning a future exit from the industry, for example in relation to a planned generation change. If this is a relevant scenario, a vessel may have chosen to harvest extraordinary profit as long as possible based on gratis quotas and an old written off vessel. When it is no longer possible to participate in the fishing without renewing the vessel, they can put a more or less “clean quota” out for sale as soon as the opportunity to make a lucrative deal occurs (Nøstbakken, 2012). Or they may be waiting to upgrade their vessel by buying a used technically decent vessel of the appropriate capacity when it is available.
This study also uses EBITDA margin as a performance indicator (4b in Table 4). Along this economic dimension, the exploring vessels performed significantly better over time, delivering on average 2.5% higher margin. The finding is in contrast to Bertheussen and Vassdal (2019) and Bertheussen et al. (2020), and indicates that there can be economies of scale among the pelagic vessels in Norway.
Finally, this study uses growth as a performance indicator. Finding 4c in Table 4 reveals a larger absolute revenue growth among the vessels pursuing an exploiting and exploring business strategy. This result is in line with the study results of Junni et al. (2013), who found that firm growth was significantly and positively related to the balancing of exploration and exploitation. However, in relative terms the exploiting vessels had an annual growth rate of 3.3% versus 2.5% for the more exploring vessels, a finding that contrasts Junni et al. (2013).
Implications
For a Norwegian purse seiner, a more explorative strategy involves substantial investments (see Table 3), which require a strong financial basis and a long-term economic perspective. If radical change in quotas caused by, e.g., environmental factors or institutional changes become future threats, understanding how to handle these is vital. Thus, the more exploring vessels may have accumulated exploring capabilities that can become beneficial in the future. If, on the other hand, the institutional and biological environments remain as stable as they have been during the period studied, focusing primarily on exploitation will probably still be the most economically lucrative strategy to follow provided that economic performance is the primary aim of the actors.
When major institutional changes occur, actors can choose to sit passively when important political decisions are made, as some do, or they can explore by developing institutional entrepreneurial skills enabling them to influence the authorities who design and implement policy changes (Hardy and Maguire, 2008). Managers developing political skills can possibly reap benefits thereof in the long run in a heavily politicized industry. By exploring institutional opportunities, actors may themselves contribute to adjusting the institutional framework that their vessels must adhere to.
The Norwegian fishing fleet is, together with other renewable nature-based industries, dependent on both good management regimes and the fact that the world’s climate does not change significantly. Norway manage the herring and mackerel stock in cooperation with other nations such as Iceland and the Faroe Islands. There are, however, constant disagreements over the distribution of the common scarce natural resource (Spijkers and Boonstra, 2017). If one of the parties withdraws from the agreement, the species may face a collapse due to overexploitation of the stocks as this is an obvious negative consequence for the industries in all nations involved.
Blue whiting is used in salmon feed. Thus, the growing demand for salmon in the world market is positively reflected in the price of blue whiting. Mackerel was managed sustainably, but recently mackerel was removed from the MSC certification due to no agreement being reached with Faroe Island and Iceland (Østhagen et al., 2020). One of the world’s largest salmon feed producers, Cargill, has signaled that they could drop purchases of blue whiting if Marine Stewardship Council (MSC) certification comes to an end. Cargill is concerned that the coastal states in the Northeast Atlantic will not agree on the distribution of the total blue whiting quota and that the species will no longer be harvested sustainably (Blue whiting MSC certification, 2020). A possible negative outcome will lead to a radical change in the business environment for those vessels harvesting blue whiting, and will expectedly affect the earnings of the exploiting and exploring vessel group significantly.
Moreover, global climate change can lead to new migration patterns of the fish species in question. Herring and mackerel might for example migrate out of the Norwegian zone permanently. If so, the Norwegians will have weak negotiating cards at hand against the countries to which the species migrates. Furthermore, there is an increase in the spread of mackerel (Hughes et al., 2015). The mackerel is the ocean’s predator; it eats everything it comes across from eggs, fry, and other smaller mackerel. This may threaten other fish populations (Hughes et al., 2015). Also, climate change can cause food availability to change, leading to stocks declining as a result (ibid.).
In addition, there are environmental requirements from the authorities regarding fuel use and capture efficiency. Purse seining has a low energy footprint compared to other types of fleet, but additional requirements can still be expensive for the fleet to handle, especially for those vessels trawling for blue whiting. To reduce the business risk by being exposed to the threats represented by climate change and possible international institutional changes, a fishing vessel firm can develop into other industries by means of funds earned in the purse-seine industry. In Norway, there are several successful examples of purse-seine companies that have diversified into unrelated industries such as salmon farming and to the oil platform supply vessel industry to reduce their overall business risk.
Conclusion
Institutional conditions in an industry can affect firms’ ability to create above or below normal economic return (Peng et al., 2009). The Norwegian pelagic industry, which is the empirical context of this study, is characterized by a rigid institutional framework. On one hand, institutions reduce the firms’ strategic scope of action. For example, there are strong limits to growth through the quota ceiling requirements. On the other hand, the same institutional arrangements protect the stocks of fish from overexploitation. Institutions also protect incumbent vessels from inside rivalry through the ITQ regime, and institutions protect inside vessels from outside competition through entry barriers. The Participation Act limits who is allowed to own a Norwegian fishing vessel with quotas. The general rule is that the owner must be a Norwegian citizen who is an active fisherman. However, a foreign subject can own up to 40% of a fishing vessel, and a Norwegian fish processing firm can own up to 50%.
As a consequence of institutional constraints, some vessels in this study limited themselves strategically by focusing on an exploitation strategy (see Tables 2, 3). These vessels did not explore new fisheries, and only modestly invested in quotas and vessel renewal. Accordingly, they carried out fishing traditional pelagic species with an older, and to a greater extent, down written and more or less debt-free vessel (Bertheussen and Vassdal, 2019). Nevertheless, their focused exploitation strategy turned out to be the most profitable over time (see 4a in Table 4). This finding is in line with those of Auh and Menguc (2005), Raisch and Birkinshaw’s (2008), and Simsek et al. (2009) who found that the industry and business environment that a firm operate within can moderate the effectiveness of balancing exploration and exploitation.
The finding, however, contrasts that of O’Reilly and Tushman (2013), who found that organizations that have higher ability to explore and exploit concurrently benefit from doing so. The finding also contrasts that of Wang and Li (2008), who found that an imbalance between exploitation and exploration may hurt performance. This study thus suggests that in an industry with significant institutional barriers to entry and with limited rivalry as quota shares are institutionally protected, it is possible to achieve superior economic results through an exploitation strategy. Nevertheless, the more flexible exploring strategic group also made profits above normal provided that the nominal opportunity cost of capital before tax was less than 8.6% (see 4a in Table 4). This finding indicates that all vessels operate in a stable industry institutionally protected from inside and outside competition.
Previous research includes industry type as a moderator for how much emphasis a company should place on exploitation versus exploration (Junni et al., 2013). This study suggests that the institutional framework of an industry can be a significant moderator on the performance of actors exploring and exploiting. This is the most important theoretical contribution of the study.
Limitations
This study cannot conclusively identify causality between the independent variable vessel strategy and the dependent variable vessel performance as it is not possible to establish a valid counterfactual control group. Accordingly, the study lacks an identification strategy that can demonstrate that a vessel’s strategy causes its financial return as the necessary exclusion restriction is not present.
However, the more similar the units being compared, the better is the prospect to isolate factors accountable for explaining differences between them. The vessels participating in the study are exposed to the same environmental influences. The fish stocks which they harvest are protected by TAC regulations. The race to fish is curbed through ITQ regulations. There are substantial barriers to entry through fishing license requirements which protect all incumbent firms against new entrants. Finally, all vessels sell their fish at auctions through a jointly owned fishing cooperation (Norges Sildesalgsslag). Furthermore, in this study, vessels are the unit of analysis and not firms. This makes the units of analysis even more similar. Finally, all vessels fish the same main species which are herring, mackerel and capelin. What really sets them apart is whether they fish blue whiting or not. Otherwise, the vessels are quite similar.
Through the selection of very similar vessels which are exposed to the same environmental influences, this study controls for many variables that can potentially affect their performance. Furthermore, by following many case units in each group over a long period of time, the possibility that patterns emerge due to chance is reduced. Factors common to the two groups cannot be used to explain differences between the groups. Matching as many factors as possible through case selection can be considered an alternative to statistical control. Thus the study argues, along with statistical correlations, that it is reasonable to indicate something about the causal relationships between the main variables vessel strategy and vessel performance. Nevertheless, the study cannot ignore the fact that the results obtained can be driven by confounders. Furthermore, the sample of this study is not a fixed share of the total population of the industry across time (see Table 2). This inconsistency introduced by the Norwegian Fisheries Directorate data collection procedure could also possibly impact the results.
Finally, it is a strength of the present study that it has access to detailed long-term operational accounting data for individual pelagic vessels. At the same time, it is a weakness that the unit of analysis is a SBU as is a pelagic fishing vessel. This is a relatively specialized vessel that has limited opportunities to engage in exploration within a rigid institutional framework such as the Norwegian one. A fruitful future research path may therefore be to lift the unit of analysis from the SBU level to a firm or corporate level when investigating the exploitation-exploration dilemma in fisheries.
Data Availability Statement
The data analyzed in this study was obtained from The Norwegian Directorate of Fisheries, the following licenses/restrictions apply: “The use of data is limited to research in the receiving institution and to the purpose agreed upon.” Requests to access these datasets should be directed to Annette-Ellefsen Person, YW5ldHRlLWVsbGVmc2VuLnBlcnNvbkBmaXNrZXJpZGlyLm5v.
Author Contributions
HH contributed to the Introduction, Theory, and Discussion sections. BB contributed to the development of the Hypothesis, Materials and Methods, and Findings sections.
Funding
The publication charges for this manuscript have been funded by a grant from the publication fund of UiT The Arctic University of Norway.
Conflict of Interest
The authors declare that the research was conducted in the absence of any commercial or financial relationships that could be construed as a potential conflict of interest.
Acknowledgments
We would like to thank the reviewers of this manuscript for guiding us to the published final product in a constructive and supportive way. We also want to thank Prof. Svein Ottar Olsen for having contributed to the structuring of this manuscript.
References
Arnason, R. (2005). Property rights in fisheries: Iceland’s experience with ITQs. Rev. Fish Biol. Fish. 15, 243–264. doi: 10.1007/s11160-005-5139-6
Asche, F., Bjørndal, M. T., and Bjørndal, T. (2014). Development in fleet fishing capacity in rights based fisheries. Mar. Policy 44, 166–171. doi: 10.1016/j.marpol.2013.08.018
Auh, S., and Menguc, B. (2005). Balancing exploration and exploitation: the moderating role of competitive intensity. J. Bus. Res. 58, 1652–1661. doi: 10.1016/j.jbusres.2004.11.007
Barney, J. B. (1986). Strategic factor markets: expectations, luck and business strategy. Manag. Sci. 32, 1231–1241. doi: 10.1287/mnsc.32.10.1231
Barney, J. B. (1991). Firm resources and sustained competitive advantage. J. Manag. 17, 99–120. doi: 10.1177/014920639101700108
Barney, J. B., and Clark, D. N. (2007). Resource-based Theory: Creating and Sustaining Competitive Advantage. Oxford: Oxford University Press on Demand.
Barney, J. B., Ketchen, D. J. Jr., and Wright, M. (2011). The future of resource-based theory: revitalization or decline? J. Manag. 37, 1299–1315. doi: 10.1177/0149206310391805
Bertheussen, B. A., and Vassdal, T. (2019). Strategic sources of superprofit in a well-regulated fishery. Mar. Policy 106:103551. doi: 10.1016/j.marpol.2019.103551
Bertheussen, B. A., Xie, J., and Vassdal, T. (2020). Strategic investments in catch capacity and quotas: how costly is a mismatch for a firm? Mar. Policy 103874. doi: 10.1016/j.marpol.2020.103874
Birkenbach, A. M., Kaczan, D. J., and Smith, M. D. (2017). Catch shares slow the race to fish. Nature 544, 223–226. doi: 10.1038/nature21728
Bjørndal, T., and Ekerhovd, N. A. (2014). Management of pelagic fisheries in the North East Atlantic: Norwegian spring spawning herring, mackerel, and blue whiting. Mar. Resour. Econ. 29, 69–83. doi: 10.1086/676286
Blue whiting MSC certification, (2020). Sildelaget Frykter for Kolmulesertifiseringen (“The Fishermens Sales Organisation of Herring Fears for Blue Whiting Certification”). Fiskeribladet. Available online at: https://fiskeribladet.no/nyheter/?artikkel=70875 (accessed January 9, 2020).
Dreyer, B., and Grønhaug, K. (2004). Uncertainty, flexibility, and sustained competitive advantage. J. Bus. Res. 57, 484–494. doi: 10.1016/s0148-2963(02)00315-6
European Central Bank, (2020). Euro versus Norwegian Krone. Available online at: https://www.ecb.europa.eu/stats/policy_and_exchange_rates/euro_reference_exchange_rates/html/eurofxref-graph-nok.en.html (accessed 20 January, 2020).
Flaaten, O., Heen, K., and Matthíasson, T. (2017). Profit and resource rent in fisheries. Mar. Resour. Econ. 32, 311–328. doi: 10.1086/692074
Fourné, S. P., Rosenbusch, N., Heyden, M. L., and Jansen, J. J. (2019). Structural and contextual approaches to ambidexterity: a meta-analysis of organizational and environmental contingencies. Eur. Manag. J. 37, 564–576. doi: 10.1016/j.emj.2019.04.002
Grafton, R. Q. (1996). Individual transferable quotas: theory and practice. Rev. Fish Biol. Fish. 6, 5–20. doi: 10.1007/bf00058517
Gupta, A. K., Smith, K. G., and Shalley, C. E. (2006). The interplay between exploration and exploitation. Acad. Manag. J. 49, 693–706. doi: 10.5465/amj.2006.22083026
Hannesson, R. (2013). Norway’s experience with ITQs. Mar. Policy 37, 264–269. doi: 10.1016/j.marpol.2012.05.008
Hannesson, R. (2016). Fish quota prices in Norway. Mar. Resour. Econ. 32, 109–117. doi: 10.1086/689190
Hardy, C., and Maguire, S. (2008). “Institutional entrepreneurship,” in Handbook of Organizational Institutionalism, Vol. 1, eds R. Greenwood, C. Oliver, R. Suddaby, and K. Sahlin-Andersen, (London: Sage), 198–217.
Hermansen, Ø, and Dreyer, B. (2010). Challenging spatial and seasonal distribution of fish landings—the experiences from rural community quotas in Norway. Mar. Policy 34, 567–574. doi: 10.1016/j.marpol.2009.11.003
Hughes, K. M., Dransfeld, L., and Johnson, M. P. (2015). Climate and stock influences on the spread and locations of catches in the northeast Atlantic mackerel fishery. Fish. Oceanogr. 24, 540–552. doi: 10.1111/fog.12128
Iversen, A., Isaksen, J. R., Hermansen, Ø, Henriksen, E., Nyrud, T., and Dreyer, B. (2018). Strukturering i Fiskeflåten. Drivkrefter og Konsekvenser (In Norwegian: Structuring of the fishing fleet. Antecedents and consequences). Report No. 8/2018. Tromsø: Nofima.
Jacobson, R. (1988). The persistence of abnormal returns. Strat. Manag. J. 9, 415–430. doi: 10.1002/smj.4250090503
Johnsen, J. P., and Jentoft, S. (2018). “Transferable quotas in Norwegian fisheries,” in Fisheries, Quota Management and Quota Transfer: Rationalization through Bio-economics, ed. G. M. Winder, (Cham: Springer International Publishing), 121–139. doi: 10.1007/978-3-319-59169-8_6
Junni, P., Sarala, R. M., Taras, V., and Tarba, S. Y. (2013). Organizational ambidexterity and performance: a meta-analysis. Acad. Manag. Perspect. 27, 299–312. doi: 10.5465/amp.2012.0015
Kücher, A., Mayr, S., Mitter, C., Duller, C., and Feldbauer-Durstmüller, B. (2018). Firm age dynamics and causes of corporate bankruptcy: age dependent explanations for business failure. Rev. Manag. Sci. 14, 633–661. doi: 10.1007/s11846-018-0303-2
Lavie, D., Stettner, U., and Tushman, M. L. (2010). Exploration and exploitation within and across organizations. Acad. Manag. Ann. 4, 109–155. doi: 10.1080/19416521003691287
Magni, C. A. (2009). Splitting up value: a critical review of residual income theories. Eur. J. Operat. Res. 198, 1–22. doi: 10.1016/j.ejor.2008.09.018
March, J. G. (1991). Exploration and exploitation in organizational learning. Organ. Sci. 2, 71–87. doi: 10.1287/orsc.2.1.71
Miller, D., and Shamsie, J. (1996). The resource-based view of the firm in two environments: the hollywood film studios from 1936 to 1965. Acad. Manag. J. 39, 519–543. doi: 10.5465/256654
Nøstbakken, L. (2012). Investment drivers in a fishery with tradable quotas. Land Econ. 88, 400–424. doi: 10.3368/le.88.2.400
O’Reilly, C. A. III, and Tushman, M. L. (2013). Organizational ambidexterity: past, present, and future. Acad. Manag. Perspect. 27, 324–338. doi: 10.5465/amp.2013.0025
Østhagen, A., Spijkers, J., and Totland, O. A. (2020). Collapse of cooperation? The North-Atlantic mackerel dispute and lessons for international cooperation on transboundary fish stocks. Mar. Stud. 1–11. doi: 10.1007/s40152-020-00172-4
Pascoe, S., Giles, N., and Coglan, L. (2019). Extracting fishery economic performance information from quota trading data. Mar. Policy 102, 61–67. doi: 10.1016/j.marpol.2019.02.002
Peng, M. W., Sun, S. L., Pinkham, B., and Chen, H. (2009). The institution-based view as a third leg for a strategy tripod. Acad. Manag. Perspect. 23, 63–81. doi: 10.5465/amp.2009.43479264
Porter, M. (1980). Competitive Strategy: Techniques for Analyzing Industries and Competitors. New York, NY: Free Press.
Prange, C., and Schlegelmilch, B. B. (2009). The role of ambidexterity in marketing strategy implementation: resolving the exploration-exploitation dilemma. Bus. Res. 2, 215–240. doi: 10.1007/bf03342712
Probst, G., and Raisch, S. (2005). Organizational crisis: the logic of failure. Acad. Manag. Exec. 19, 90–105. doi: 10.5465/ame.2005.15841958
Probst, G., Raisch, S., and Tushman, M. L. (2011). Ambidextrous leadership: emerging challenges for business and HR leaders. Organ. Dyn. 40, 326–334.
Raisch, S., and Birkinshaw, J. (2008). Organizational ambidexterity: antecedents, outcomes, and moderators. J. Manag. 34, 375–409. doi: 10.1177/0149206308316058
Reed, R., and DeFillippi, R. J. (1990). Causal ambiguity, barriers to imitation, and sustainable competitive advantage. Acad. Manag. Rev. 15, 88–102. doi: 10.5465/amr.1990.4308277
Richard, P. J., Devinney, T. M., Yip, G. S., and Johnson, G. (2009). Measuring organizational performance: towards methodological best practice. J. Manag. 35, 718–804. doi: 10.1177/0149206308330560
Rumelt, R. (1991). How much does industry matter? Strat. Manag. J. 12, 167–185. doi: 10.1002/smj.4250120302
Sandberg, P., Bogstad, B., and Røttingen, I. (1998). Bioeconomic advice on TAC–the state of the art in the Norwegian fishery management. Fish. Res. 37, 259–274. doi: 10.1016/s0165-7836(98)00142-8
Simsek, Z., Heavey, C., Veiga, J. F., and Souder, D. (2009). A typology for aligning organizational ambidexterity’s conceptualizations, antecedents, and outcomes. J. Manag. Stud. 46, 864–894. doi: 10.1111/j.1467-6486.2009.00841.x
Sogn-Grundvåg, G., Zhang, D., and Iversen, A. (2019). Large buyers at a fish auction: the case of the Norwegian pelagic auction. Mar. Policy 104, 232–238. doi: 10.1016/j.marpol.2018.06.011
Sørgård, B., Gormley, T. P., Gombrii, K.-J., Dalheim, T., Andersen, R. T., Johnson, I. E., et al. (2018). Komparativ Analyse av de Juridiske Rammebetingelsene for Havnæringene (“Comparative Analysis of the Legal Framework Conditions for the Marine Industry”). Oslo: Arntzen de Besche.
Spanos, Y. E., and Lioukas, S. (2001). An examination into the causal logic of rent generation: contrasting Porter’s competitive strategy framework and the resource based perspective. Strat. Manag. J. 22, 907–934. doi: 10.1002/smj.174
Spijkers, J., and Boonstra, W. J. (2017). Environmental change and social conflict: the northeast Atlantic mackerel dispute. Reg. Environ. Change 17, 1835–1851. doi: 10.1007/s10113-017-1150-4
Standal, D. (2006). The rise and decline of blue whiting fisheries—capacity expansion and future regulations. Mar. Policy 30, 315–327. doi: 10.1016/j.marpol.2005.03.007
Standal, D., and Asche, F. (2018). Hesitant reforms: the Norwegian approach towards ITQ’s. Mar. Policy 88, 58–63. doi: 10.1016/j.marpol.2017.11.005
Standal, D., and Hersoug, B. (2014). Back to square one? Fisheries allocation under pressure. Mar. Policy 43, 236–245. doi: 10.1016/j.marpol.2013.06.004
Tushman, M. L., and O’Reilly, C. A. III (1996). Ambidextrous organizations: managing evolutionary and revolutionary change. Calif. Manag. Rev. 38, 8–30.
Vázquez-Rowe, I., and Tyedmers, P. (2013). Identifying the importance of the “skipper effect” within sources of measured inefficiency in fisheries through data envelopment analysis (DEA). Mar. Policy 38, 387–396. doi: 10.1016/j.marpol.2012.06.018
Volberda, H. W., and Lewin, A. Y. (2003). Coevolutionary dynamics within and between firms: from evolution to coevolution. J. Manag. Stud. 40, 2111–2136. doi: 10.1046/j.1467-6486.2003.00414.x
Wang, H., and Li, J. (2008). Untangling the effects of overexploration and overexploitation on organizational performance: the moderating role of organizational dynamism. J. Manag. 34, 925–951. doi: 10.1177/0149206308321547
Weninger, Q., and Just, R. E. (2002). Firm dynamics with tradable output permits. Land Econ. 84, 572–584. doi: 10.1111/1467-8276.00320
Keywords: institutional contingency, strategic groups, purse seiners, Norway, balancing between exploitation and exploration, regulative framework
Citation: Hannevig H and Bertheussen BA (2020) The Exploitation-Exploration Dilemma of Fishing Vessels With Institutionally Protected Quota Shares. Front. Mar. Sci. 7:436. doi: 10.3389/fmars.2020.00436
Received: 20 February 2020; Accepted: 18 May 2020;
Published: 16 June 2020.
Edited by:
Di Jin, Woods Hole Oceanographic Institution, United StatesReviewed by:
Andrew Michael Carr-Harris, Northeast Fisheries Science Center (NOAA), United StatesKimberly Oremus, University of Delaware, United States
Copyright © 2020 Hannevig and Bertheussen. This is an open-access article distributed under the terms of the Creative Commons Attribution License (CC BY). The use, distribution or reproduction in other forums is permitted, provided the original author(s) and the copyright owner(s) are credited and that the original publication in this journal is cited, in accordance with accepted academic practice. No use, distribution or reproduction is permitted which does not comply with these terms.
*Correspondence: Bernt Arne Bertheussen, YmVybnQuYmVydGhldXNzZW5AdWl0Lm5v