
95% of researchers rate our articles as excellent or good
Learn more about the work of our research integrity team to safeguard the quality of each article we publish.
Find out more
ORIGINAL RESEARCH article
Front. Mar. Sci. , 19 May 2020
Sec. Marine Ecosystem Ecology
Volume 7 - 2020 | https://doi.org/10.3389/fmars.2020.00343
This article is part of the Research Topic Climate Change and Light in Aquatic Ecosystems: Variability & Ecological Consequences View all 10 articles
 Rafael Gonçalves-Araujo*†
 Stiig Markager
Light is essential for primary production and, therefore, its attenuation controls the vertical distribution of plants and phytoplankton over the water column. The diffuse attenuation of irradiance (K) is mainly governed by the attenuation by the water itself and the concentrations of optically active substances (e.g., phytoplankton, inorganic particles and colored dissolved molecules), which makes it an important parameter for eutrophication monitoring. Over the past century, Denmark has had recurrent eutrophication events, with extreme episodic cases where anoxic conditions were observed. Since the 1980’s, eutrophication in Danish waters has been monitored with regards to the diffuse attenuation coefficient of scalar irradiance (Ko) of photosynthetically active radiation (PAR, 400–700 nm), Ko(PAR). However, radiometric measurements in Denmark are difficult in winter due to low solar zenith angle and only few light hours. On top of that, radiometric measurements in the first meters of the water column are highly affected by light refraction influenced by waves, compromising the monitoring of shallow turbid waters as in Denmark. Therefore, we developed a semi-analytical model based on data to from a spectral AC instrument (AC-S, Sea-Bird Scientific) that can estimate the underwater light field and the diffuse attenuation coefficient of downwelling irradiance, Kd(PAR). We tested two distinct approaches based on equations from the literature for estimation of Kd(PAR). The results show that modeled PAR profiles follow the overall shape of in situ radiometric profiles but with smoother profiles, especially in the surface layer (2–5 m). Along with that, the method provided robust Kd(PAR) estimates, that were strongly correlated to the reference Ko(PAR) values from in situ profiles and with low root mean square error (RMSE). Thus, AC-S data can be used to estimate the underwater light field and Ko(PAR). This will make possible to retrieve Ko(PAR) in the absence of daylight and, therefore, allow for environmental monitoring outside the daylight hours, making environmental monitoring more efficient. In addition, the method provides valuable insights into the factors controlling light attenuation.
Anthropogenic nutrient loadings from land to the marine environments is a worldwide problem (Cloern, 2001). Eutrophication and the associated negative effects for the marine environment, e.g., anoxic events, increase in light attenuation, and loss of underwater vegetation, have been observed not only in Danish marine waters, but in many places around the world (Riemann et al., 2016) and is a calling for political actions as well as systematic monitoring of the marine environment (de Jonge et al., 2006). The highest amounts of nitrogen loadings from Danish land were observed during the 80’s. Then a series of political action plans were implemented to mitigate the inputs of nitrogen and phosphorous to the marine environment (Dalgaard et al., 2014; Murray et al., 2019). Eutrophication events alter, among many aspects, the underwater light regime, leading to significant changes in the structure and food web of the ecosystem and in particular the distribution of primary production among types of photo-autotrophs with important implications for the ecosystem (Krause-Jensen et al., 2012). A common pattern is that the primary production is displaced toward the surface both in shallow systems (Krause-Jensen et al., 2012) where the benthic macrophytes are replaced by phytoplankton, and in planktonic systems where production in the pycnocline is replaced by production in the mixed layer (Lyngsgaard et al., 2014). In both cases the driving factor is an increase in light attenuation (Kirk, 1994; Carstensen et al., 2013; Pedersen et al., 2014; Riemann et al., 2016). Moreover, light attenuation governs the vertical distribution of different types of macrophytes in all aquatic ecosystems from lakes (Middelboe and Markager, 1997) to the clearest marine waters (Markager and Sand-Jensen, 1992) as a response to differences in minimum light requirements for different types of plants (Markager and Sand-Jensen, 1992, 1996; Middelboe and Markager, 1997). Hence, an in-depth understanding of light attenuation is essential for our understanding of aquatic ecosystems and the mechanisms in eutrophication.
Since transparency is a key property in aquatic ecosystems, and a consequence of eutrophication is an increase in light attenuation due to increasing amounts of particles and colored dissolved organic matter (CDOM), light attenuation has been an important component of eutrophication monitoring. For instance, Secchi disk depth measurements have been widely used in the Baltic Sea as an eutrophication proxy, water quality assessment and management (Fleming-Lehtinen and Laamanen, 2012; Dupont and Aksnes, 2013; Harvey et al., 2019). The light attenuation is often expressed as Secchi disc readings or as the diffuse attenuation coefficient (K) of scalar (Ko) or downwelling irradiance (Kd) at a given wavelength [Ko(λ) or Kd(λ)] or over the PAR range [Ko(PAR) or Kd(PAR)] (Kirk, 1994). K is an apparent optical property (AOP) and therefore determined by the interactions between the inherent optical properties (IOPs, i.e., absorption and scattering), the solar zenith angle and sky and sea state conditions. Kd and Ko estimations and their partitioning into distinct components (with varying target wavelengths, e.g., 490 nm, PAR and spectrally resolved) have been the subject of several previous studies applying various empirical and semi-analytical approaches to a diversity of input variables: in situ IOP measurements (Lund-Hansen, 2004; Pierson et al., 2008; Devlin et al., 2009; Simon and Shanmugam, 2013; Murray et al., 2015; Rose et al., 2019), ocean color remote sensing data (Wang et al., 2009; Zhang et al., 2012a; Barnes et al., 2014; Alikas et al., 2015; Simon and Shanmugam, 2016), Secchi disc depth (Bracchini et al., 2009; Zhang et al., 2012b) and neural network inversion (Jamet et al., 2012). Kd(PAR) is also a key variable for estimating the ocean’s heat budget (Lewis et al., 1990; Kowalczuk et al., 2017; Soppa et al., 2019), and is fundamental for assessing water quality, eutrophication and ecosystem function assessment (Krause-Jensen et al., 2012; Carstensen et al., 2013; Murray et al., 2019) and, ultimately, for ecosystem modeling (Maar et al., 2011; Byun et al., 2014; Neumann et al., 2015). For instance, in coastal areas, sensitive species such as the eelgrass (Z. marina) has considerable ecological importance and promptly respond to eutrophication pressures, due to light limitation. Therefore, this species has become an important parameter for assessing ecological status of marine systems not only in the Baltic region (Orth et al., 2010; Fertig et al., 2013), as their depth limit is closely related to water transparency and light penetration in the water column (Nielsen et al., 2002; Balsby et al., 2013), which is then related to Kd(PAR). Thus, it is essential to develop alternative methods to estimate Kd(PAR) in temperate areas, given the limitations faced for performing traditional PAR measurements due to the low solar angle and short day length during winter.
The waters surrounding Denmark have been monitored for environmental properties since the 1980’s. A national program was launched in 1987 (NOVANA, National Monitoring and Assessment Programme for the Aquatic and Terrestrial Environment) as part of the Danish Action Plan on the Aquatic Environment. Its main objective is to follow the status of the aquatic and terrestrial environments and the main pressures upon them (Friberg et al., 2005). The program has established time series for many parameters that have been consistently sampled since its start. The NOVANA program was implemented when nutrient loadings to the marine environment were high and, with the strategies adopted, nutrient input has been reduced over the past decades (Dalgaard et al., 2014; Riemann et al., 2016; Murray et al., 2019). Early Secchi disk measurements date to1905 in the Baltic (Fleming-Lehtinen and Laamanen, 2012) and water transparency from about 1900 has been deduced from old observations of depth limits of eelgrass (Zostera marina). Vertical profiles of PAR have been measured in the NOVANA monitoring program since late 1980’s. As established in the monitoring program protocol (Markager and Fossing, 2015), PAR measurements and estimation of Ko(PAR) are the standard method for monitoring of the underwater light field within the program. Sampling for bio-optical properties (particularly radiometric measurements) in temperate regions like the Baltic (∼55 to 65°N) is nevertheless challenging, given several factors: (1) due to the high latitude, the solar zenith angle is often low; (2) there is a high frequency of overcast days making the use of satellite observations difficult; (3) the day length is short close to the winter solstice causing low efficiency for ship based sampling; (4) the waters are often shallow and turbid, which affects the performance of radiometers. Therefore, it is beneficial to develop alternative approaches for estimating light attenuation regardless of sky and weather conditions and in darkness. The light attenuation coefficient is used for two purposes. One is to allow the calculation of PAR at specific depth, e.g., the daily integrated PAR at the sea floor. The other purpose is to use it as an indicator for the environmental state that can be followed over time. This study is part of a general attempt to improve the NOVANA program by employing new technologies for monitoring water quality. We believe that there is a worldwide need to optimize environmental monitoring since eutrophication is a widespread phenomenon and changes in marine environments are linked to other pressure factors such as climate change. Therefore, a first step toward an automated, sensor-based monitoring was the incorporation of an AC-S instrument to the sampling program in 2017. The future perspective in the program is to use the AC-S for monitoring other environmental parameters such as chlorophyll (that can also be derived from the absorption line height), CDOM absorption and to relate scattering to concentrations of particles (e.g., total suspended matter–TSM).
Given the limitations presented above regarding sampling daylight irradiance in Denmark and the interests toward the implementation of state-of-the-art sensor based sampling, the main objective of this study is to develop a semi-analytical model that can retrieve Kd(PAR) from the spectrally resolved underwater light field derived from IOP measurements acquired with an AC-S instrument and assess whether the estimated Kd(PAR) is a good proxy for the Ko(PAR) consistently monitored within the NOVANA program.
86 sampling stations in the waters surrounding the island of Fyn (Denmark) were visited in the autumn 2017 (Oct. 17th –Nov. 1st) and spring 2019 (Apr. 25th–May 6th). However, after data quality control, only 48 sampling stations presented reasonable data with respect to all the considered parameters (Figure 1). The sampling comprised a range of stations from very shallow coastal sites with local depth of about 3 m to deeper areas reaching bottom depths of 40 m. At each station, vertical profiles of physico-chemical and bio-optical water properties were acquired by deploying several sensors attached to a CTD frame. The CTD-frame was equipped with sensors for conductivity (AMT, Analysemesstechnik GmbH), temperature (AMT, Analysemesstechnik GmbH), PAR (Biospherical Instruments Inc.) and chlorophyll-a (Chl-a) fluorescence (ECO, Sea-Bird Scientific). Sensors for conductivity and temperature were calibrated every second week (accuracy of ± 1 and 0.1°C; precision of ± 0.05 and 0.05°C, for salinity and temperature, respectively) and annually on the factory. The signal for chlorophyll fluorescence was converted to a chlorophyll concentration based on water samples from 1, 5, 10, to 15 m from each profile according (Lyngsgaard et al., 2014). The profiles of temperature, salinity and Chl-a were median binned to a 0.2-m vertical resolution. Underwater scalar irradiance profiles (Eo) in the PAR range [Eo(PAR),%] were measured with a spherical PAR sensor (Biospherical Instruments Inc.) placed on the CTD frame and expressed as percentage of the readings of a surface reference sensor on top of the vessel. It will hereafter be referred to as PAR-CTD. The PAR-CTD sensor was placed on the very top of the CTD frame. After processing, profiles for all variables were median binned and presented in the same vertical resolution, i.e., 0.2 m. The PAR profiles were then visually quality controlled, and any noisy profiles were not taken into consideration for this study. An additional sampling survey was conducted on Jun. 13th, 2019 with the purpose of spectral validation of the model for underwater light field based on the AC-S measurements. On that occasion, spectrally resolved radiometric measurements were performed at five stations. Profiles of downwelling irradiance (Ed, W m–2 nm–1) were obtained with a Satlantic free-falling optical profiler (Sea-Bird Scientific) equipped with hyperspectral up- and downwelling radiometers (350–800 nm). Another hyperspectral radiometer was placed on top of the vessel and used as reference. PAR-Sat was obtained by integrating the Ed spectra over the PAR wavelength range (400–700 nm). At each station, four to eight profiles were sampled ensuring that the profiler was at least 15 m away from the boat. After visual inspection, the best PAR-Sat profile (i.e., with less noise) was considered. Data was then processed and interpolated at a 0.2 m vertical resolution using the ProSoft software (Sea-Bird Scientific, version 7.7).
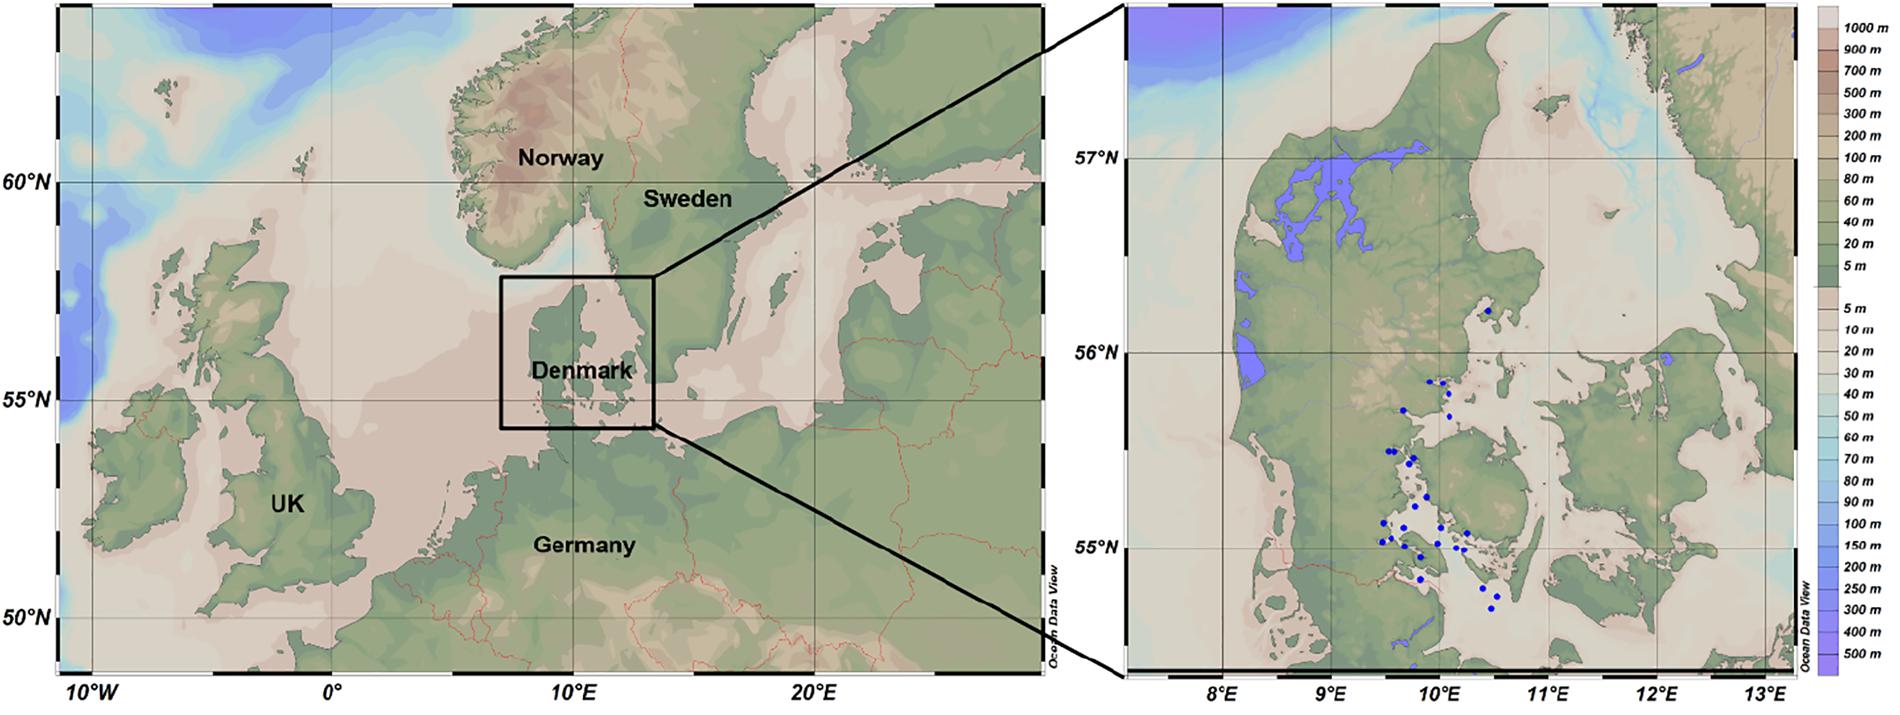
Figure 1. Sampling stations of the NOVANA monitoring program considered in this study (autumn 2017 and spring 2019).
A 25 cm-path length AC-S spectrophotometer (Sea-Bird Scientific) was mounted on the CTD frame to measure the hyperspectral absorption [a(λ), m–1] and beam attenuation [c(λ), m–1] coefficients in the water pumped through the cuvettes with the aid of a pump installed in the frame. Measurements were performed for 83 individual channels over a spectral range of 400–740 nm with ∼4 nm increments. The measurements were recorded with a sampling rate of 4 Hz, with an acquisition of ca. 40–45 measurements per meter. The instrument was cleaned with Milli-Q water daily, after sampling, and calibrated with Milli-Q water daily, prior to the start of the measurements. AC-S data were 0.2-m median binned (set of 9 measurements centered at the target depth) and measurements out of the ± 2 standard deviation-interval were removed. Profiles with sparse data over the water column were not taken into consideration for this study. The absorption and scattering spectra of pure water were accounted while processing the AC-S data (Pope and Fry, 1997; Zhang et al., 2009), and the data was corrected for temperature and salinity dependence by the water itself (Sullivan et al., 2006) as well as for proportional scatter (Zaneveld et al., 1994). a(λ) and c(λ) were interpolated to common wavelengths and scattering coefficient values [b(λ), m–1] were obtained by subtracting a(λ) from c(λ). In this study, apart from reporting spectra from the analyzed parameters, we also report a, b, and c results at the blue range, 440 nm, given its application to bio-optics and ocean color remote sensing (Prieur and Sathyendranath, 1981; IOCCG, 2006; Gonçalves-Araujo et al., 2018, 2019).
The spectral measurements of a(λ) and b(λ) were used to estimate the profiles of Kd(λ,z) over the layer extended from the surface to the depth where irradiance values measured with the PAR-meter were reduced to 1%. Kd(λ,z) (m–1). Two methods were applied. First the equation by Kirk was used (Kirk, 1994, 2003):
where G is the coefficient representing the relative contribution of scattering to the vertical attenuation of irradiance. In this study we used a constant value of G = 0.256 (Kirk, 1994). Secondly, Kd(λ,z) was obtained by applying a semi-analytical model of light attenuation based on the radiative transfer equation, where Kd(λ,z) is estimated for the depth where the downward irradiance is reduced to 10% of that penetrating the surface (Lee et al., 2005):
where Qa is the solar zenith angle (in degrees), atotal is the total absorption coefficient (a + awater) and bb is the backscattering. We approximated bb(λ,z) by applying the averaged bb:b ratio of 0.0138 (Loisel et al., 2007) to b(λ,z). Although water also contributes to bb, it was not incorporated to our calculations since it is often negligible in coastal waters (Morel, 1974).
Kd(λ,z) was then used to calculated the light spectra with depth by applying AC-S-derived Kd(λ) values to a surface irradiance spectrum representing the averaged surface irradiance [Ed(λ, 0) (W m–2 nm–1)] for Denmark (Markager, unpubl. results). The spectrally resolved underwater irradiance at a given depth [Ed(λ, z)] was approximated as follows (Kirk, 1994, 2003):
where z is depth. Ed(λ,z) spectra were integrated over the PAR range (400–700 nm). In this way we obtain depth profiles of the PAR irradiance based on AC-S measurements, hereafter referred to as PAR-Kirk and PAR-Lee, for the spectra calculated using Kd values generated with (Equations 1and 2), respectively. The profile of these PAR-values with depth contain the same features as those recorded with a PAR sensor, e.g., a spectral narrowing that caused a decrease in Kd with depth. The approach therefore allows a direct comparison of the two methods. Figure 2 presents a schematic description of the steps in the data analysis and computing routines implemented in this study.
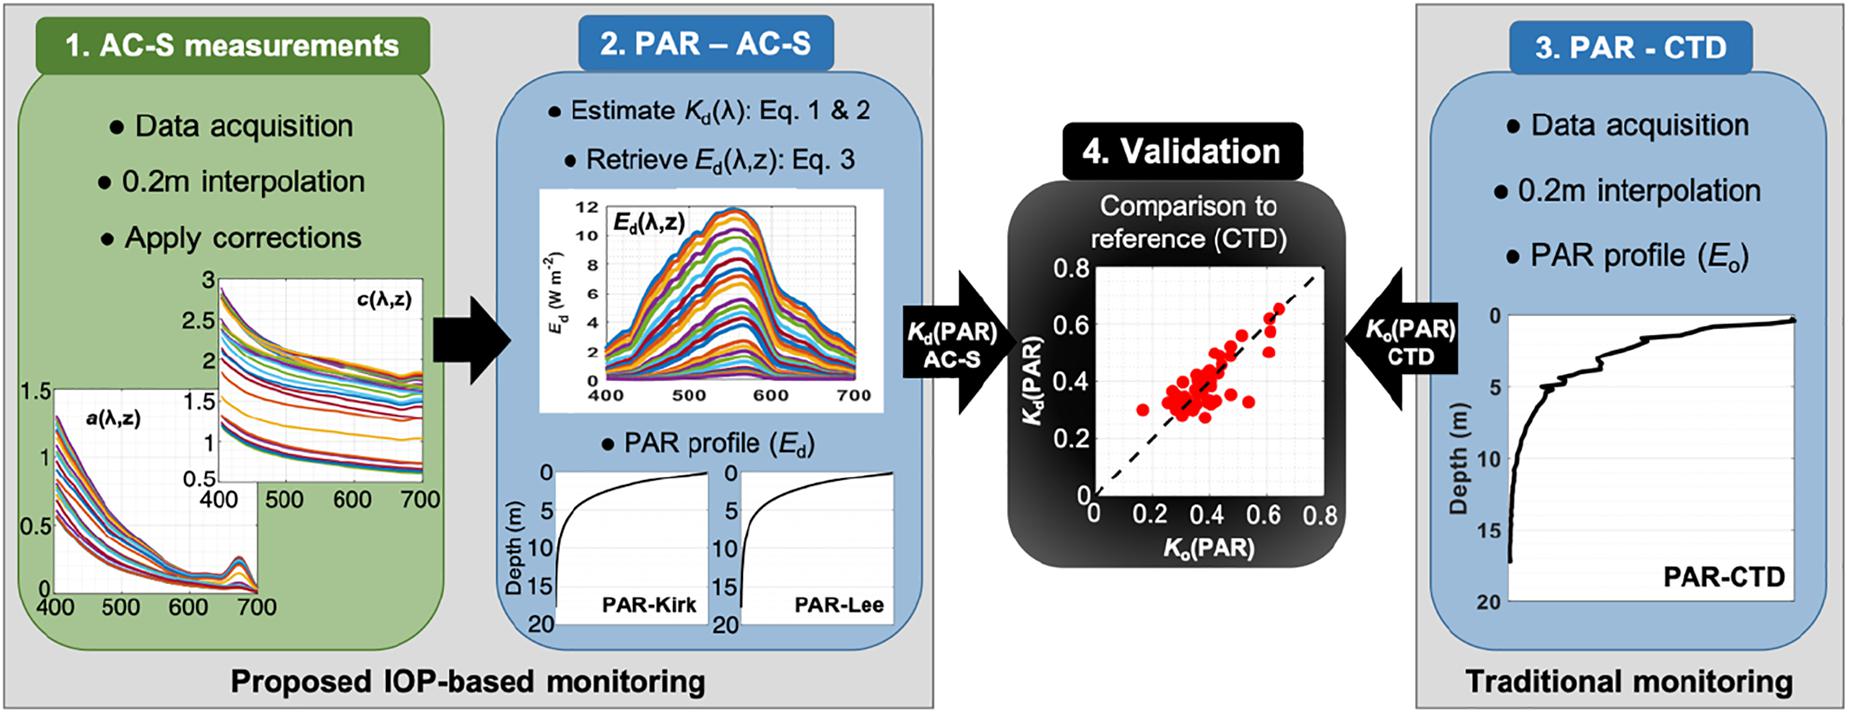
Figure 2. Scheme showing the routine employed in this study. First, we retrieved the underwater light field and the diffuse attenuation coefficient for downwelling irradiance in the PAR range [Kd(PAR), 400–700 nm] from AC-S measurements with a spectrally resolved semi-analytical model. Then we calculate the scalar Ko(PAR) from the light profile (reference observations). Finally, the AC-S based Kd-values were validated against the reference Ko(PAR)-values.
The methods described in the section above give us a set of Kd(λ) spectra. However, our main purpose is to quantify our ability to predict Ko(PAR) as estimated from depth profiles of PAR irradiance, as this is the standard method in monitoring and biological oceanography. For this, it is usually assumed that Ko(PAR) is constant with depth, despite several factors that can cause Ko(PAR) to change with depth: for instance, that the light spectrum will change with depth toward the wavelengths with low K(λ)-values (Morel, 1988), and that the average zenith angle for photons varies with depth due to and changes in the balance between scattering and absorption with depth and to changes in concentrations of optically active compounds. K(PAR) (m–1) over the water column was determined from the slope in a linear regression between depth and the natural logarithm transformed PAR values after a visual inspection of each profile. This approach was employed to all PAR profiles analyzed in this study (e.g., PAR-CTD, PAR-ACS and PAR-Sat). Additionally, since in this study we have estimated Ed(PAR) with two methods (Kirk vs. Lee), the subsequent Kd(PAR) estimates will be hereafter referred to as Kd-Kirk and Kd-Lee, respectively. When performing field measurements of Eo(PAR), values close to the surface were sometimes noisy likely due to the light refraction from wave action and movements of the ship. The upper most values (varying from 0 to 2 m) were, therefore, omitted, following the standard protocol for the monitoring program (Markager and Fossing, 2015 [in Danish]). Similarly, at greater depths, the changes with depth would decrease and approach the dark current signal when the sensor reach its detection limit. Thus, the depth interval with a log-linear profile of irradiance was selected from inter-active plots and based on the monitoring program protocol (Markager and Fossing, 2015 [in Danish]) and common practice in biological oceanography and limnology (Kirk, 1994; Markager and Vincent, 2000). Since our objective is to estimate comparable K(PAR) derived from PAR profiles obtained with different methodologies, we have employed the same routine established in the monitoring program. We are aware that more advanced techniques for calculating Kd are available (Murray, 2015; Murray et al., 2015; Holding et al., 2019), but these are more difficult to use and not yet implemented in the monitoring program. In addition to the averaged K(PAR) estimated over the entire water column (excluding the very surface data) and in order to check the variability of K(PAR) over the water column, we have estimated the apparent K(PAR). This parameter was similarly estimated by deriving the slope in a linear regression between depth and the natural logarithm transformed Eo(PAR) and Ed(PAR), considering a 1-m window interval over the water column.
We acknowledge that PAR-CTD and both PAR-Kirk and PAR-Lee do not represent the same quantities, as the former is expressed in quantum units whereas latter is in energy units. The relative depth profiles of these two quantities can be slightly different, which may lead to differences in Kd estimates. Since those differences are generally small (Thimijan and Heins, 1983), here we directly compare Ko(PAR) estimated from the CTD measurements with Kd(PAR), estimated from either measured or modeled irradiance.
The relationship between the modeled Kd(PAR)-values and the measured Ko(PAR)-values were evaluated with orthogonal linear regression to determine the slope (S), intercept, the coefficient of correlation (r) and p-value. The root mean square error (RMSE) was also calculated to assess the performance of modeled Kd(PAR):
where Y is the modeled Kd(PAR) (i.e., Kd-Kirk and Kd-Lee) and X is the measured Ko. Finally, to compare the variables among themselves or among different groups of samples, two-sample Kolmogorov–Smirnov tests were applied, after performing normality tests.
The water column was generally characterized by a shallow mixed layer with the presence of marked pycnocline observed at 3–15 m depth, except for the shallowest stations (bottom depth < 5 m) that presented well-mixed thermohaline profiles. Surface Chl-a concentration ranged from 4.1 to 12.1 mg m–3, with the highest values observed within the upper mixed layer, where no marked sub-surface peak was observed.
Surface values of a(440), b(440), and c(440) varied between 0.35–0.91 m–1, 0.26–1.49 m–1, and 0.68–2.38 m–1, respectively. For the three parameters, the highest values occurred at shallow stations with high turbidity, probably due to resuspension. Those parameters were constant over the upper mixed layer and then decreasing from the pycnocline and toward the bottom, with similar behavior as presented by Chl-a. However, for some stations a(440), b(440), and c(440) tend to increase near the bottom, most likely due to resuspension of sediments from the seabed (Figure 3). a(440) at the surface was directly correlated with surface Chl-a (r = 0.50; p < 0.001).
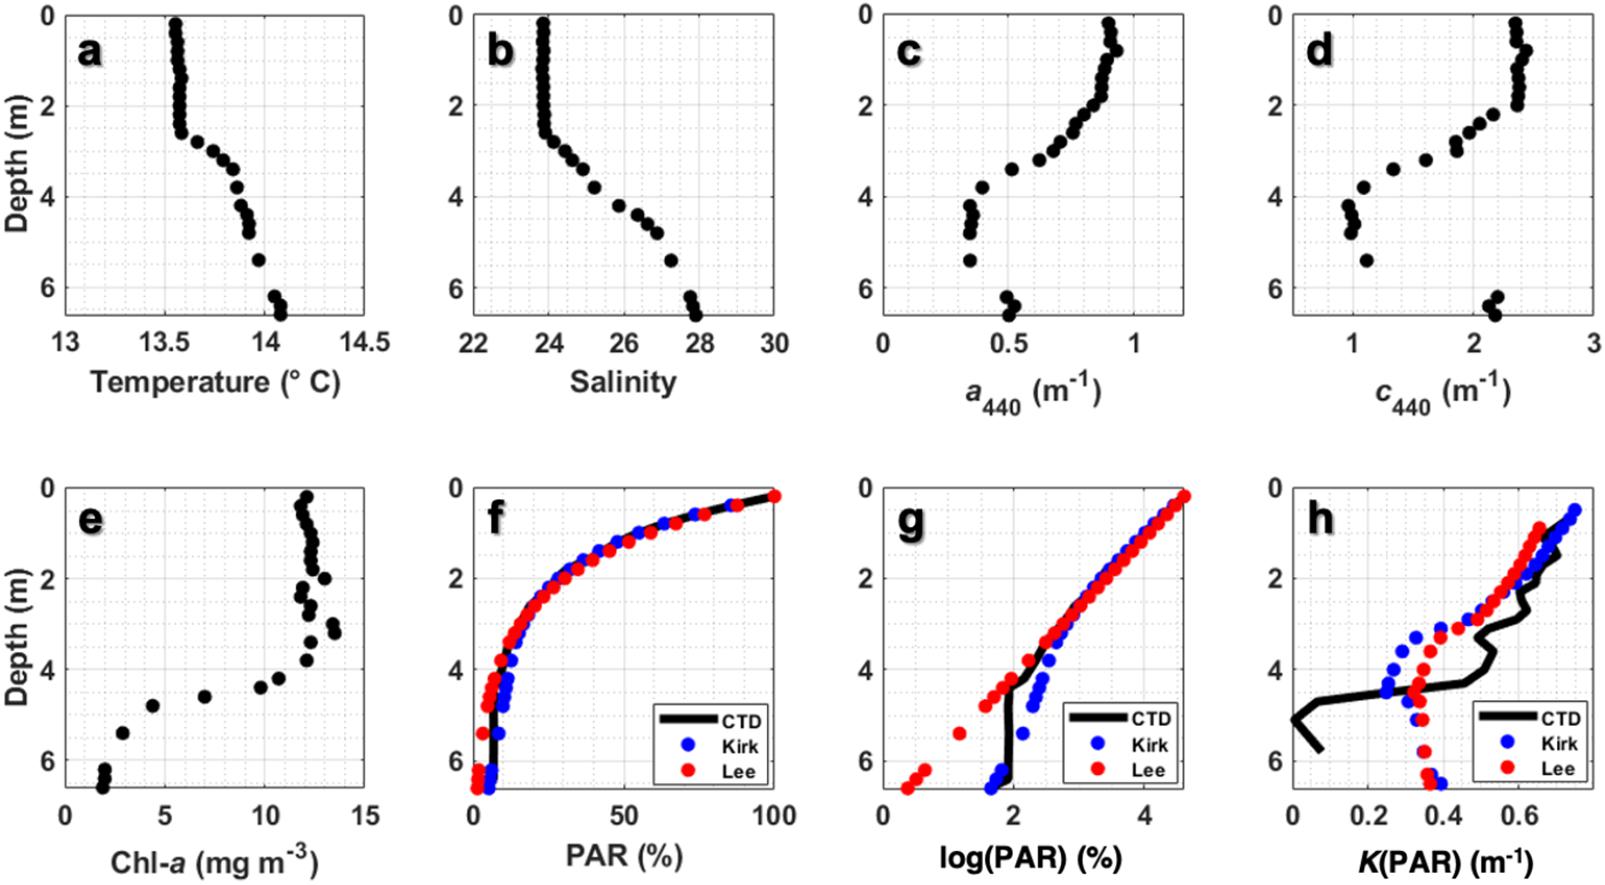
Figure 3. Example of vertical profiles of environmental parameters for a shallow sampling station (number 2) visited on 19 Oct. 2017: (a) temperature (°C); (b) salinity; (c) a440 (m– 1); (d) c440 (m– 1); (e) Chl-a fluorescence (mg m– 3); (f) PAR (%); (g) log(PAR); (h) apparent K (m– 1) obtained for every 1-m interval.
We compared the four profiles for PAR (PAR-CTD, PAR-Sat, PAR-Kirk and PAR-Lee). All four methods gave the expected exponential decrease for PAR (Figures 3,4). The Satlantic and the CTD-PAR measurements were very similar, however, both types were sometimes affected by practical problems close to the surface (Figure 4). The PAR-CTD measurements become noisy if the boat is pitching or rocking and these movements are transferred to the CTD-frame (Figure 4E). The relative effect of this is highest close to the surface. The Satlantic instrument is free falling and therefore not affected by this problem. However, both types of measurements can be affected by the shadow of the boat close to the surface (Figures 4A,B), despite attempts to avoid this, particularly if the sun and wind or current are coming from the same direction. On top of that, the fluctuations of downwelling irradiance observed at near-surface depths may also be due to the focusing of sunlight by wind-driven surface waves, which is a natural phenomenon inherent to in situ radiometric measurements (You et al., 2010). However, it is not possible to assure what were the factors driving the variability observed in our study.
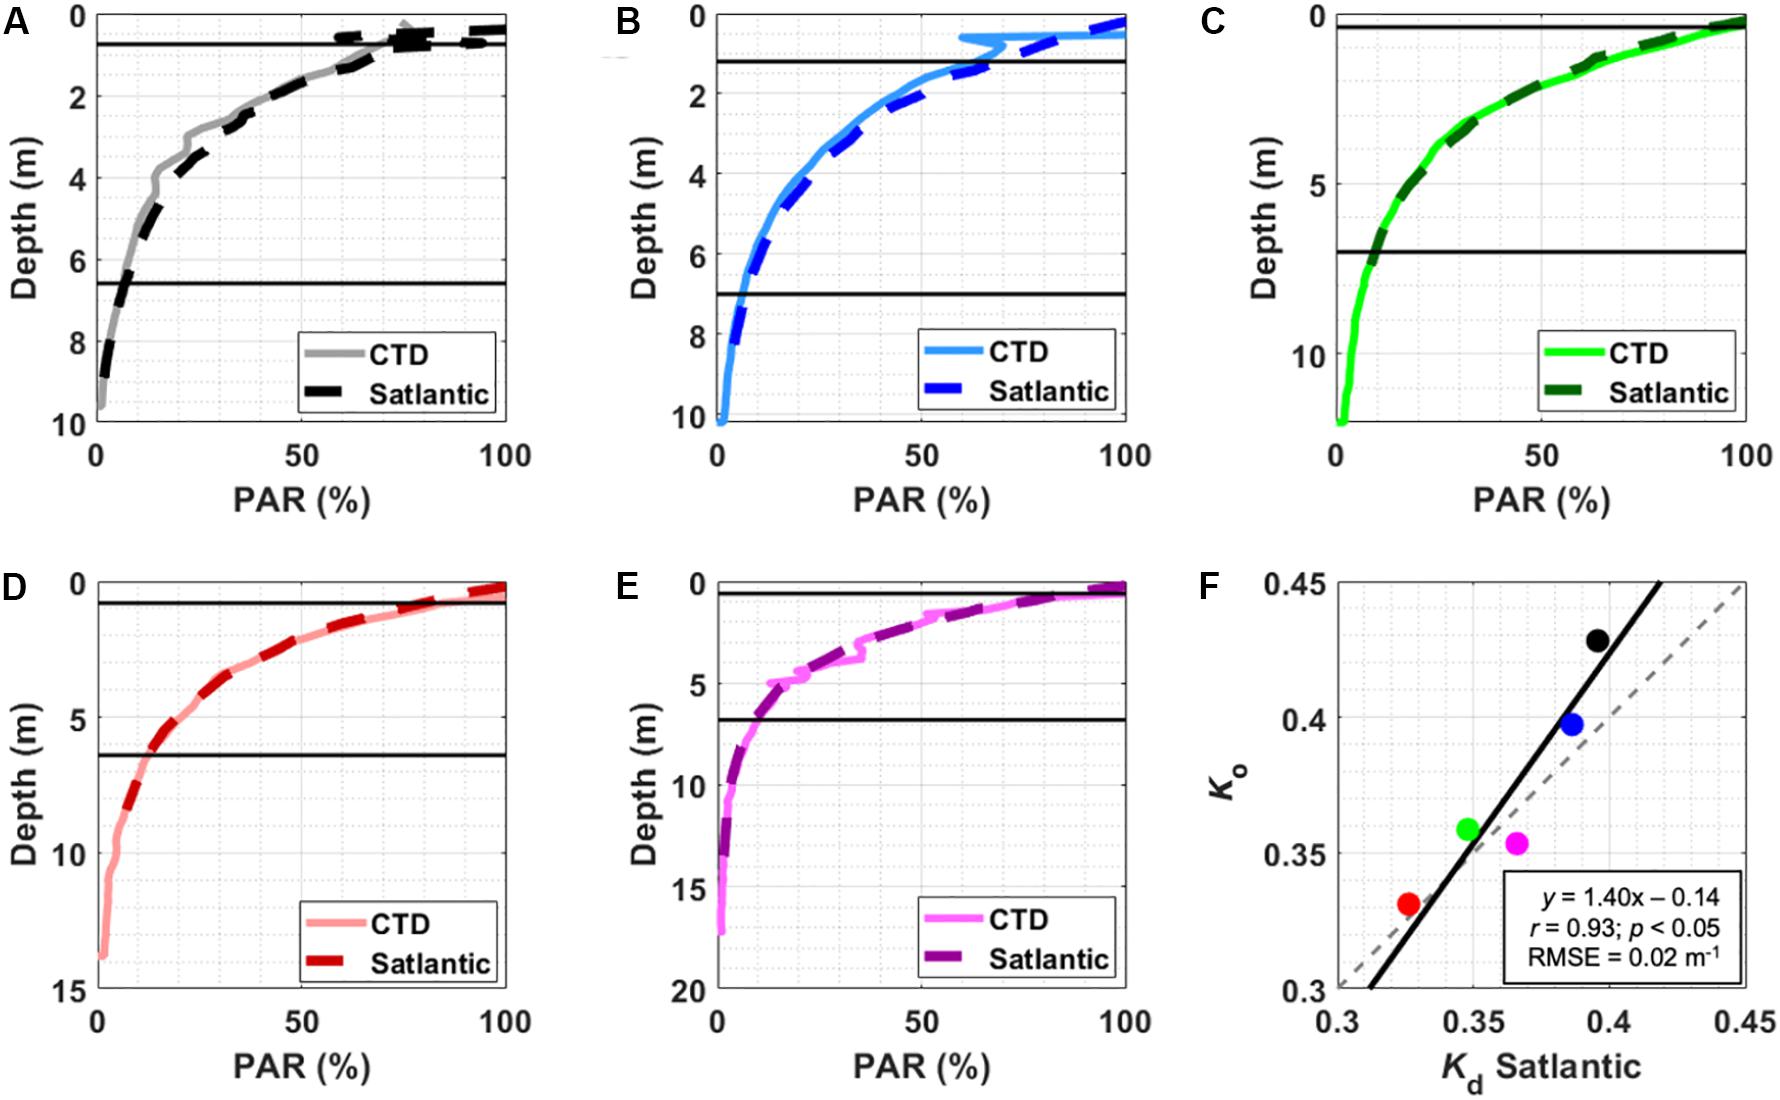
Figure 4. (A–E) Profiles of PAR (%) acquired with the PAR-meter (CTD) and a free-falling optical profiler (Satlantic) for the 5 stations visited during the calibration exercise on Jun. 13th, 2019. Black horizontal lines indicate the depth limits considered for estimating Kd(PAR) for each station. (F) Scatter plot of Kd(PAR)-Sat vs. Ko(PAR)-CTD (m– 1); solid black line shows the orthogonal linear regression fit and the dashed gray line indicates the 1:1 line.
At depth, the results show the clear advantages of the AC-S measurements. Figure 3f and particularly Figure 3g show that the CTD-PAR data become noisy at 3.5 m depth and stop working at 4 m as the irradiance falls below the sensitivity of the sensor. On the other hand, the estimates based on the AC-S measurements continue to provide results for Kd, albeit the two methods begin to deviate. Similar limitations for CTD-PAR measurements at seen at Figures 5d–f. Thus, the AC-S measurements were capable of recoding the increase in Kd close to the bottom based on the increase in both a and c values. That increase in suspended material content has direct impact on the underwater light attenuation, should there be light available, and that was not detected by the PAR-CTD measurements (Figure 3g).
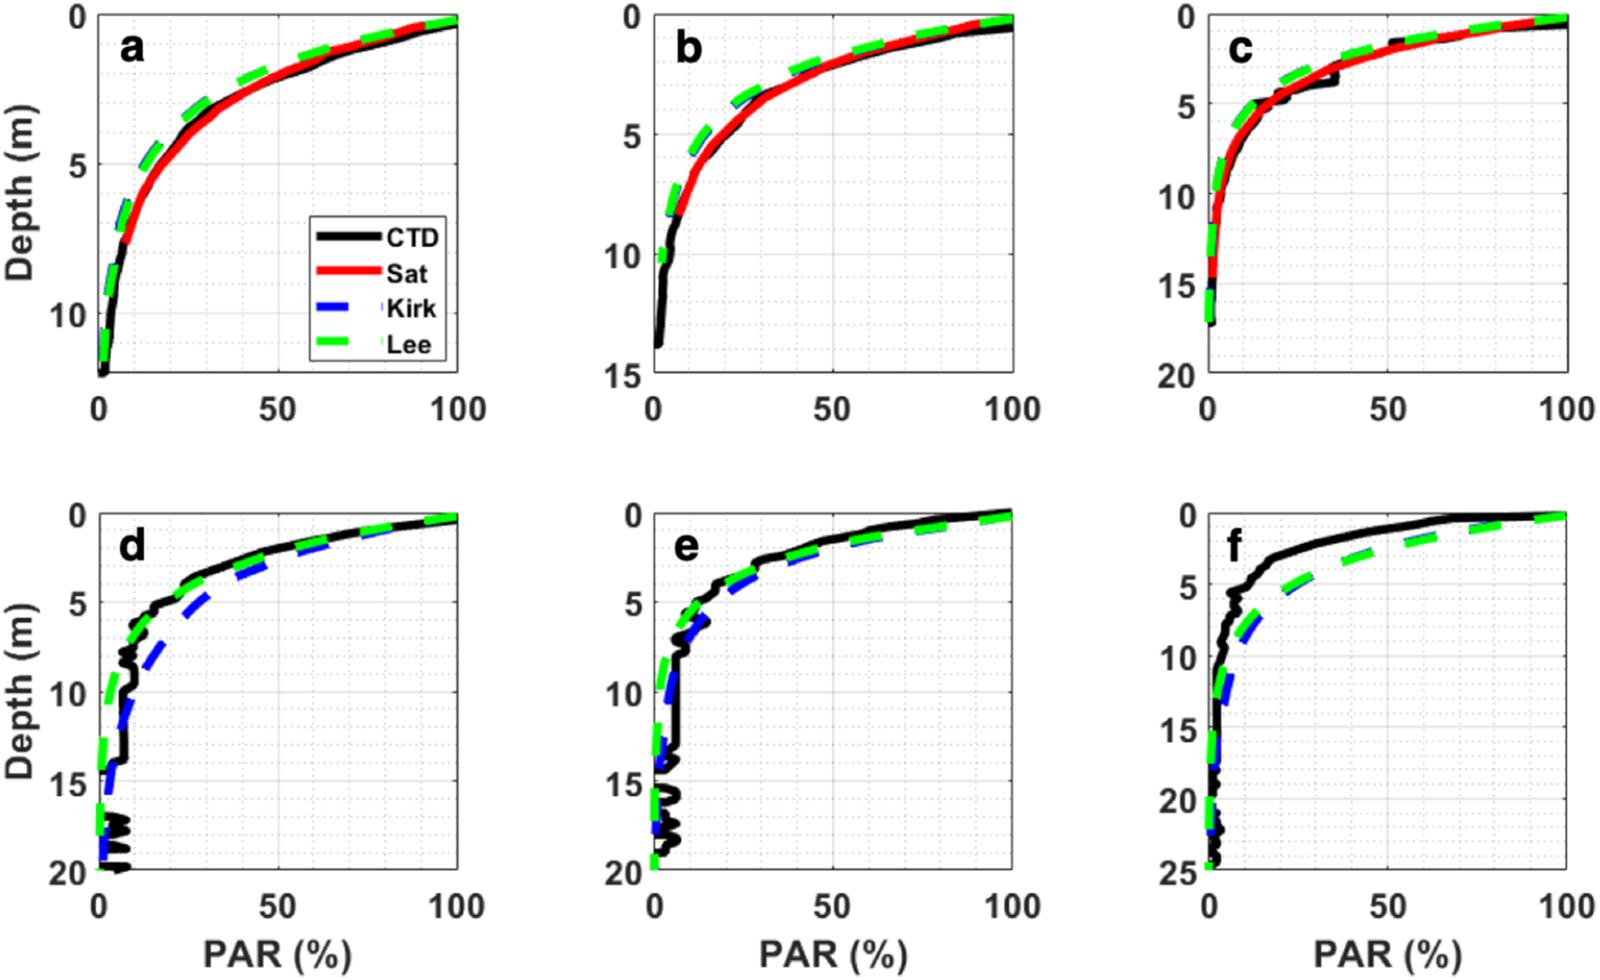
Figure 5. Examples of profiles of in situ measured [PAR-CTD (a–f) and PAR-Sat (a–c), the latter available only for measurements performed during the calibration exercise in June 2019] and AC-S-derived PAR [PAR-Kirk (a–f) and PAR-Lee (a–f)] for selected sampling stations.
Another aspect of the underwater light field is the spectral shape, which was validated here by comparing the AC-S data with data from the Satlantic profiler in June 2019. Overall, the spectra are similar with high attenuation for high and low wavelengths within the PAR-spectrum and a minimum Kd(λ)-value at ca. 570 nm. For these five profiles the two models, AC-S Kirk and AC-S Lee, gave very similar results. The most notable difference was between the modeled spectra and the data from the Satlantic profiler in both ends of the spectrum. Here the Satlantic profiler gave Kd(λ)-values that were systematically lower than the models (Figures 6e,f).
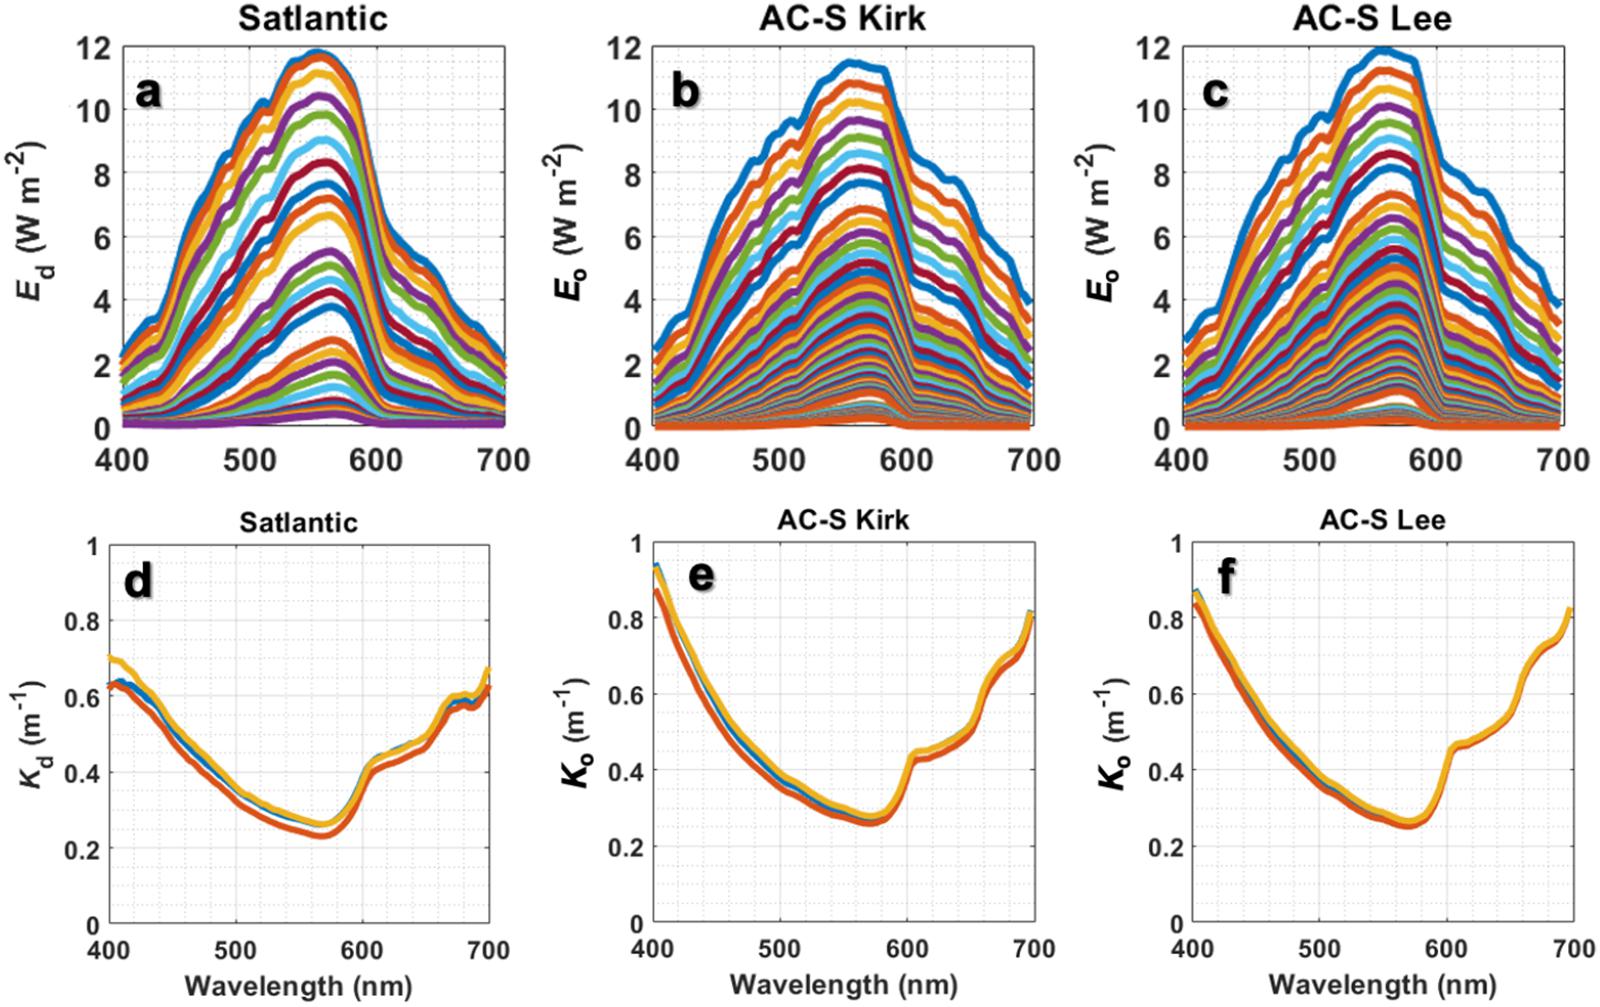
Figure 6. Examples of E spectra over depth measured in situ with the free-falling Satlantic optical profiler (a) and estimated with Kirk’s (b) and Lee’s (c) methods. Examples of spectrally resolved K estimated from Satlantic measurements (d) and obtained with Kirk’s (e) and Lee’s (f) methods. All the examples displayed in this figure are from the same visited station on Jun. 13th, 2019. Colors in the top panels (a–c) represent different sampling depths, with the top lines indicating close-to-the-surface measurements and the bottom lines indicating measurements performed close to the bottom.
Our estimations of Ko(PAR), Kd(PAR)-Kirk and Kd(PAR)-Lee ranged from 0.21–0.62 m–1, 0.20–0.52 m–1, to 0.27–0.65 m–1, respectively (Table 1 and Figure 7). K(PAR) values were significantly higher at shallow stations (p < 0.01) with the highest a(λ) and c(λ) values and, therefore, indicating the highest turbidity. The AC-S derived Kd(PAR) estimates (Kd-Kirk and Kd-Lee) were strongly, significantly correlated to the reference, Ko (Table 1 and Figure 7), thus denoting the efficiency of the approach to retrieve underwater light conditions. Additionally, Kd-Kirk and Kd-Lee could detect increase in Kd at close to the bottom due to sediment resuspension, which was not observed in Ko (Figure 3h). Although both Kd-Kirk and Kd-Lee were in good agreement with Ko estimates, there were differences in their relationship to Ko estimates. While Kd-Kirk presented a slope close to 1 for its correlation with Ko, it showed a systematic underestimation. Kd-Lee estimates were overall closer to the 1:1 line and presented the lowest RMSE in comparison to Kd-Kirk, but the slope between Kd-Lee and Ko was less than one (Table 1 and Figure 7). The underestimation of Kd by the Kirk equation could be due to a lower zenith angle than assumed in Equation (2). We computed that Kd-Kirk is, on average, 1.29 times lower than Kd-CTD, which can be translated into a difference in zenith angle of 53°, that is in agreement with the values for the region (see discussion). We applied the computed correction factor of 1.29 to Kd-Kirk and observed an improvement in both slope (1.02) and RMSE (0.16 m–1) (Figure 7). We have calculated the residuals for the correlation between estimated Kd vs. measured Ko for each method, and the residuals were correlated to environmental variables [e.g., local depth and surface temperature, salinity, a(440) and fluorescence]. There was no significant correlation observed, except for local depth that was inversely correlated to Kd-Kirk (r = –0.36; p < 0.05) and Kd-Kirk-adjusted (r = –0.51; p < 0.01).
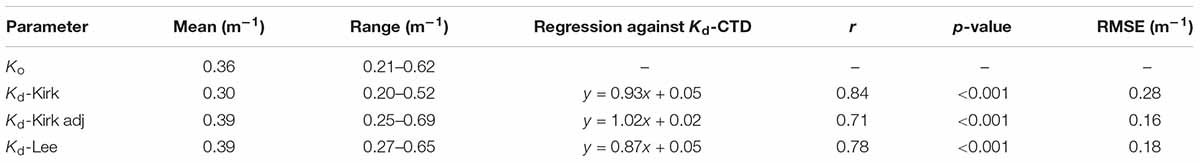
Table 1. Mean, range, and information regarding the correlation (regression, r, p-value and RMSE) between the referred parameter and Ko for Ko, Kd-Kirk, Kd-Kirk adjusted (Kd-Kirk adj) and Kd-Lee.
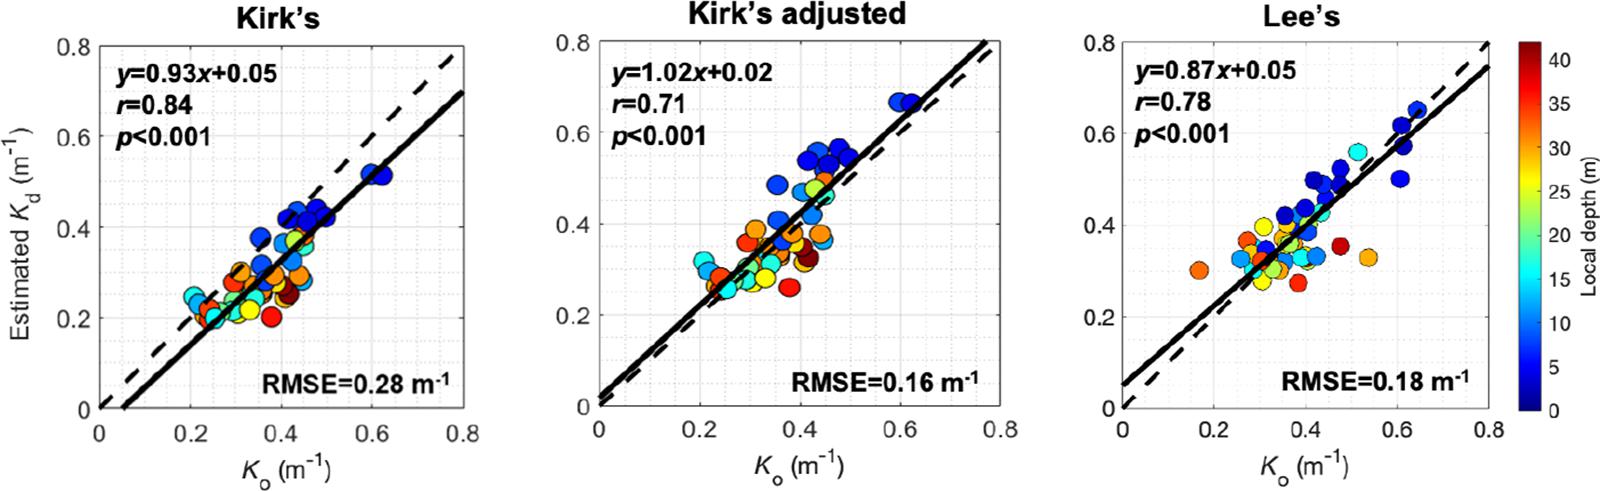
Figure 7. Scatter plots between the reference (Ko) and Kd-Kirk (Left), and Kd-Kirk adjusted (Center) and Kd-Lee (Right) with local sampling depth as color-code.
The underwater light field in this study, described as profiles of PAR-values, was determined by two approaches: from in situ radiometric measurements (PAR-CTD and PAR-Sat), and from AC-S measurements (PAR-Kirk and PAR-Lee). PAR-CTD is widely used as the standard for estimating light attenuation in biological limnology and oceanography. The method has also been used in the Danish environmental monitoring program for decades and is therefore essential that new techniques are validated against this, as consistent time series are critical in environmental monitoring (Hanneke et al., 2015). In addition, the spectral shape of AC-S-derived Kd(λ) was evaluated based on measurements with the Satlantic profiler. However, although the method here employed provides spectrally resolved information, we want to stress that our main objective to is to establish a comparison of Ko(PAR) and Kd(PAR) derived from AC-S measurements.
The measurements of Kd(λ) with the Satlantic instrument show a good agreement with the modeled spectra for Kd(λ) based on AC-S measurements (Figure 6). From 460 to 640 nm the deviation was on average 0.02 m–1 and positive, except from 530 to 590 nm for Kd-Lee. However, for each end of the spectra where Kd(λ) values were high, the deviation was much higher, up to 0.3 m–1. We hypothesize that the cause of this deviation lay in the Satlantic measurements and not in the modeling of Kd(λ) from AC-S data. At depth, the ratio between irradiance at different wavelength becomes very large, e.g., 5 × 10⁴ at the depth of 1% PAR between irradiance at 400 and 574 nm. The Satlantic instrument, as all spectral radiometers, has a limited ability to separate light at different wavelengths (straylight) so a spillover from wavelengths with low Kd (high irradiance at depth) to wavelengths with high Kd (low irradiance at depth) will occur. Such a spillover will cause an underestimation of Kd at both ends of the PAR spectrum at depth, as the observed irradiance at depth will be increasingly affected by irradiance from the middle of the spectrum. Such effects have been observed for other underwater spectroradiometers, e.g., with Li-Cor–1800 underwater spectroradiometer (Markager, unpubl. results). Thus, even though the Kd spectra estimated from direct determined irradiance with the Satlantic instrument appear to be direct measurements, they might also be prone to errors. This shows the relevance and strength of the modeled Kd(λ)-values based on AC-S measurements, as they represented an alternative approach.
As PAR-meters are instruments that passively measure light, their measurements have limitations in terms of sensitivity and light availability. This is especially critical in temperate regions that have long periods with low solar angle and short day light length during winter. Combined with high attenuation in the water column, the irradiance in the first meters of water column is often close to or below the sensitivity of the instrument. This makes it challenging to do efficient environmental monitoring with radiometric-based measurements. Apart from the influence of the solar zenith angle on the performance of radiometers, surface effects from light refraction by waves-focusing and eventual shadows of the vessel may also affect radiometric measurements, particularly close to the surface, where the light attenuation tends to be the highest (Kirk, 1994; Markager and Vincent, 2000; You et al., 2010). We observed those effects in a few PAR-CTD profiles (see example in Figure 5) from shallow and highly turbidity stations, where, although resembling the overall exponential curve shape, a noisy profile was observed. Such noisy features in PAR-CTD profiles have been demonstrated to compromise the overall measurements, especially when those will be used for estimating the Ko (Markager and Vincent, 2000). Due to the abovementioned operational limitations, several of the PAR-CTD measurements (ca. 30%) did not pass the quality control and were discarded. Thus, to deal with the limitations associated to radiometric measurements often experienced in shallow temperate environments as the Danish waters, we propose the AC-S based alternative and IOP-based model to retrieve the underwater light field. The approach allows for monitoring light attenuation regardless of the solar conditions and even at night, thus increasing the sampling yield per unit effort (vessel time at sea).
Our estimations of Kd(PAR) were reliable and in agreement with values observed for Danish waters (Lund-Hansen, 2004), thus denoting the efficiency of the proposed approach to retrieve underwater light conditions. Such efficiency in applying IOP measurements to retrieve Kd at specific wavelengths has already been reported in the literature (Simon and Shanmugam, 2013; Alikas et al., 2015; Rose et al., 2019), however, to our knowledge, there is no previous study focusing on retrieving Kd(PAR) from a spectrally-resolved, semi-analytical model based on IOP measurements. We showed that the two methods employed in this study, Kd-Kirk and Kd-Lee, were in good agreement with Ko estimations. The Kd-Kirk approach presented the slope closest to 1 (0.93) for its correlation with Ko compared to 0.87 for the Lee model. Yet, Kd-Lee estimates presented the lowest RMSE (see Figure 7). The better agreement for the estimates obtained with Kd-Lee might be related to the fact that Kd-Lee takes into account the solar angle, which is considerably low in Denmark (latitude ∼55°N), especially during winter. Similar results were found by a study conducted in lakes and coastal waters in the Baltic Sea (Alikas et al., 2015), where they found Lee’s method to provide better estimates compared to Kirk’s method. Those authors, however, have used another extended equation for Kirk’s method (Kirk, 1994):
where g1 and g2 are constants provided in Kirk (1994) and μ0 is the cosine of the refracted solar beam just beneath the surface and was estimated as 0.88 for coastal waters in the Baltic Sea (Alikas et al., 2015). We have employed the same equation and constants to our data, however, the resulting Kd(PAR) estimates were poor in comparison to the ones obtained with (Equation 1). Therefore, we decided to present only the results obtained with (Equation 1).
Although Kd-Lee model showed the best agreement to the CTD-PAR based estimates based on the lowest RMSE-value, that method requires the measurement of bb(λ) that is not always available and, in our case, was retrieved from the AC-S measurements. Also, the slope was significantly different from one whereas the Kd-Kirk model showed a slope close to one (0.93 for the original model and 1.02 for the adjusted model, Figure 7).
As mentioned above, we have estimated the difference between the Kd-Kirk values and Ko to a constant offset of 29%. A likely explanation for this difference is the actual zenith angle for the photons traveling down through the water. The zenith angle is affected by the combination of sun angle, cloud cover, wave conditions, refraction and the scattering of light in the water column. The latter is incorporated in Equation (1), but the others are variable and likely different from the conditions for which Kirk determined the constant in Equation (1) (Kirk, 1994). An increase of 29% for Kd will correspond to a difference in zenith angle from, e.g., ca. 35° (which is the angle observed in the region from where Kirk has derived his equation) to ca. 53° for our measurements. The zenith angle for the sun at 56° N is from 33 to 79°, but the average angle for the total irradiance is variable as mentioned above. As that actual zenith angle is variable, we conclude that applying a factor of 1.29 to the results from Equation (1) will bring the estimates in agreement with the measured values for Ko. We applied the computed correction factor of 1.29 to Kd-Kirk and observed a significant improvement in RMSE (0.16 m–1) and a slope of 1.02 (see Figure 6). However, that factor might hold true particularly for the sampled seasons, as the solar zenith angle varies significantly over the year, particularly at high latitudes but also over the day at all latitudes. Further investigation of this subject would be helpful but since it is difficult to estimate the actual zenith angle, e.g., due to varying cloud cover and sea state, it will not help for the practical assessment of Kd estimations from AC-S measurements. At least one full annual sampling cycle would be required to establish reasonable correction factors over the seasonal cycle.
The aim of this study is to develop a method for calculating light attenuation from AC-S measurements and compare with the standard procedure. However, the comparison is hampered by the fact that the reference method has several shortcomings as outlined above. We believe that our methods (with a PAR sensor mounted on top of a CTD-frame and calculating the slope by linear regression on log-transformed data after a visual discarding of outliers) is close to the standard approach in biological limnology and oceanography. The exact protocol differ among investigators. Our irradiance data was measured with a scalar sensor and therefore, strictly speaking, we measure Eo and calculate Ko. However, as our PAR sensor was placed at the top of the frame and therefore, to some extent, shaded from upwelling irradiance. It can be argued, that this is not the ideal approach. However, placing the scalar sensor on a stick, or otherwise prevent shading from below, is not feasible in standard biological science but must of course be addressed in bio-optical research. Similarly, the application of a single exponential attenuation for PAR is not ideal, as Lambert-Beers law does not apply to broad band attenuation, but with our aim it is critical to evaluate the use of AC-S estimates vs. the standard method for estimating light attenuation. Despite of that, our Kd(PAR) estimates were highly correlated with the reference Ko(PAR), showing the strength of applying such an approach in environmental monitoring programs.
Whilst our IOP-based model generates robust underwater irradiance and Kd(PAR) estimates, the AC-S is a sensitive instrument that presents operational limitations, especially in shallow waters, as in our study. Such limitations are, e.g., related to the presence of bubbles in the system, primarily close to the surface, making the data unsuited to use and, thus, compromising the Kd(PAR) estimations. In this study, ~20% of the total sampled stations have had their a and/or c measurements compromised most likely by the presence of bubbles in the system and were not considered. Finally, inelastic scattering, although likely to very low (Marshall and Smith, 1990), might be a source of error to our Kd(PAR) estimations. However, we have considered it to be negligible and have not accounted for it in our calculations. Finally, we acknowledge the existence of seasonal and inter-annual variability within the IOPs and underwater light field in the region and that our model may not represent the conditions considering different seasons or time scales. To account for these dynamic changes in optical and environmental properties, future efforts should consider high frequency sampling over a full annual cycle. Nevertheless, the strength of the IOP relationships across wavelengths (Figure 6) gives confidence that the suggested approach will work correctly also over seasons and correctly identify Kd(PAR) in different conditions, as shown in this study.
We have employed a spectrally resolved, semi-analytical model to reconstruct the underwater light field and estimate the diffuse attenuation coefficient of downwelling photosynthetically active radiation [Kd(PAR)] for shallow Danish waters from IOP measurements performed with an AC-S instrument in an environmental monitoring program. This study shows the synergistic benefits of using data from monitoring programs applied to scientific purposes, as both academia and environmental agencies gain from the development of new technologies that can be further employed to cope with limitations faced by traditional environmental programs. Our results showed that the model was capable of reconstructing the underwater light field, generating reliable PAR profiles, which agreed (in intensity and shape) with the reference measurements. PAR profiles retrieved from AC-S measurements were smoother than the reference measurements, thus, highlighting the effectiveness of the method. Such efficiency was translated in the determination of Kd(PAR) estimates that were reliable and in agreement with the reference, Ko(PAR). In addition, we showed that AC-S measurements have significant advantages when compared to the traditional PAR measurements. Those advantages are mostly related to the fact that AC-S measurements are not affected by fluctuations in light availability and solar zenith angle, which allows us to acquire data regardless of the solar irradiance (e.g., solar zenith angle and day length, allowing for sampling even during the night) and weather conditions (e.g., overcast situations). AC-S measurements are also efficient to retrieve the underwater light field in the surface layers, given that it is not affected by light refraction exerted by waves. Additionally, we have computed Kd(PAR) estimates from AC-S measurements with two distinct methods (Equations 1 and 2) and both methods provided reliable estimates. However, at first sight Lee’s method (Lee et al., 2005) had a better performance than Kirk’s method (Kirk, 1994). We attribute this to the fact that Lee’s model takes into account the variability in the solar angle, which is an important factor controlling light penetration in the water, especially in higher latitude environments. As Lee’s method requires the direct measurement or estimation of bb(λ), here we proposed a simple way to correct Kd-Kirk for the solar zenith angle through the application of a correction factor. However, more investigation is necessary to evaluate the performance of such a factor, as the solar zenith angle significantly varies across the seasons and we have only sampled during two seasons. Finally, we acknowledge the existence of a suite of different methods that could be employed to the dataset here presented, and that this study could gain from the employment of radiative transfer modeling. However, at the same time it is worth it to highlight the importance of taking advantage of performing such a study with data provided by monitoring programs. Although with the monitoring program’s sampling strategy might not be the ideal for further development of the model here presented, it provides a significant amount of information to the scientific community on top of contributing to the monitoring of the environment’s health.
The datasets generated for this study are available upon request to the corresponding author.
SM and RG-A: conceptualization, formal analysis, methodology, visualization, and writing. RG-A: data curation and validation. SM: funding acquisition and project administration.
The authors declare that the research was conducted in the absence of any commercial or financial relationships that could be construed as a potential conflict of interest.
We would like to thank to the Ministry of Environment and Food in Denmark for financial support to the project. We are also indebted to the dedicated crew of the monitoring vessel LIV-II and in particular to Lars Peter Jørgensen for organizing the measurements and the maintenance of the AC-S instrument. Finally, we would like to thank E. Therese Harvey (NIVA, Denmark) and Yangyang Liu (AWI, Germany) for discussions and their help with AC-S data processing.
Alikas, K., Kratzer, S., Reinart, A., Kauer, T., and Paavel, B. (2015). Robust remote sensing algorithms to derive the diffuse attenuation coefficient for lakes and coastal waters. Limnol. Oceanogr. Methods 13, 402–415. doi: 10.1002/lom3.10033
Balsby, T. J. S., Carstensen, J., and Krause-Jensen, D. (2013). Sources of uncertainty in estimation of eelgrass depth limits. Hydrobiologia 704, 311–323. doi: 10.1007/s10750-012-1374-1378
Barnes, B. B., Hu, C., Cannizzaro, J. P., Craig, S. E., Hallock, P., Jones, D. L., et al. (2014). Estimation of diffuse attenuation of ultraviolet light in optically shallow Florida Keys waters from MODIS measurements. Remote Sens. Environ. 140, 519–532. doi: 10.1016/j.rse.2013.09.024
Bracchini, L., Dattilo, A. M., Hull, V., Loiselle, S. A., Tognazzi, A., and Rossi, C. (2009). Modelling Upwelling Irradiance using Secchi disk depth in lake ecosystems. J. Limnol. 68, 83–91.
Byun, D., Wang, X. H., Hart, D. E., and Zavatarelli, M. (2014). Review of PAR parameterizations in ocean ecosystem models. Estuar. Coast. Shelf Sci. 151, 318–323. doi: 10.1016/j.ecss.2014.05.006
Carstensen, J., Krause-Jensen, D., Markager, S., Timmermann, K., and Windolf, J. (2013). Water clarity and eelgrass responses to nitrogen reductions in the eutrophic Skive Fjord, Denmark. Hydrobiologia 704, 293–309. doi: 10.1007/s10750-012-1266-y
Cloern, J. (2001). Our evolving conceptual model of the coastal eutrophication problem. Mar. Ecol. Prog. Ser. 210, 223–253. doi: 10.3354/meps210223
Dalgaard, T., Hansen, B., Hasler, B., Hertel, O., Hutchings, N. J., Jacobsen, B. H., et al. (2014). Policies for agricultural nitrogen management—trends, challenges and prospects for improved efficiency in Denmark. Environ. Res. Lett. 9:115002. doi: 10.1088/1748-9326/9/11/115002
de Jonge, V. N., Elliott, M., and Brauer, V. S. (2006). Marine monitoring: its shortcomings and mismatch with the EU Water Framework Directive’s objectives. Mar. Pollut. Bull. 53, 5–19. doi: 10.1038/s41467-018-05188-3
Devlin, M. J., Barry, J., Mills, D. K., Gowen, R. J., Foden, J., Sivyer, D., et al. (2009). Estimating the diffuse attenuation coefficient from optically active constituents in UK marine waters. Estuar. Coast. Shelf Sci. 82, 73–83. doi: 10.1016/j.ecss.2008.12.015
Dupont, N., and Aksnes, D. L. (2013). Centennial changes in water clarity of the Baltic Sea and the North Sea. Estuar. Coast. Shelf Sci. 131, 282–289. doi: 10.1016/j.ecss.2013.08.010
Fertig, B., Kennish, M. J., and Sakowicz, G. P. (2013). Changing eelgrass (Zostera marina L.) characteristics in a highly eutrophic temperate coastal lagoon. Aquat. Bot. 104, 70–79. doi: 10.1016/j.aquabot.2012.09.004
Fleming-Lehtinen, V., and Laamanen, M. (2012). Long-term changes in Secchi depth and the role of phytoplankton in explaining light attenuation in the Baltic Sea. Estuar. Coast. Shelf Sci. 10, 1–10. doi: 10.1016/j.ecss.2012.02.015
Friberg, N., Baattrup-Pedersen, A., Pedersen, M. L., and Skriver, J. (2005). The New Danish Stream Monitoring Programme (Novana) – Preparing Monitoring Activities For The Water Framework Directive Era. Environ. Monit. Assess. 111, 27–42. doi: 10.1007/s10661-005-8038-8033
Gonçalves-Araujo, R., Rabe, B., Peeken, I., and Bracher, A. (2018). High colored dissolved organic matter (CDOM) absorption in surface waters of the central-eastern Arctic Ocean: implications for biogeochemistry and ocean color algorithms. PLoS One 13:e0190838. doi: 10.1371/journal.pone.0190838
Gonçalves-Araujo, R., Röttgers, R., Haraguchi, L., and Brandini, F. P. (2019). Hydrography-driven variability of optically active constituents of water in the South Brazilian Bight: biogeochemical implications. Front. Mar. Sci. 6:716. doi: 10.3389/fmars.2019.00716
Hanneke, B.-B., Anne, S., Francisco, M.-R., Julia, W., Pamela, W., Lynda, M. M., et al. (2015). The Chlorophyll Case Study in the JMP NS/CS Project. Document Produced as Part of the EU project: ‘Towards Joint Monitoring for the North Sea and Celtic Sea’ (ENV/PP 2012/SEA). Available online at: https://archimer.ifremer.fr/doc/00398/50911/
Harvey, E. T., Walve, J., Andersson, A., Karlson, B., and Kratzer, S. (2019). The effect of optical properties on secchi depth and implications for eutrophication management. Front. Mar. Sci. 5:496. doi: 10.3389/fmars.2018.00496
Holding, J. M., Markager, S., Juul-Pedersen, T., Paulsen, M. L., Møller, E. F., Meire, L., et al. (2019). Seasonal and spatial patterns of primary production in a high-latitude fjord affected by Greenland Ice Sheet run-off. Biogeosciences 16, 3777–3792. doi: 10.5194/bg-16-3777-2019
IOCCG (2006). IOCCG Report number 5: Remote Sensing of Inherent Optical Properties: Fundamentals, Tests of Algorithms, and Applications. Monterey, CA: IOCCG.
Jamet, C., Loisel, H., and Dessailly, D. (2012). Retrieval of the spectral diffuse attenuation coefficient K d (λ) in open and coastal ocean waters using a neural network inversion. J. Geophys. Res. Ocean. 117, 1–14. doi: 10.1029/2012JC008076
Kirk, J. T. O. (1994). Light and Photosynthesis in Aquatic Ecosystems. 2nd Edn. Cambridge: Cambridge University Press.
Kirk, J. T. O. (2003). The vertical attenuation of irradiance as a function of the optical properties of the water. Limnol. Oceanogr. 48, 9–17. doi: 10.4319/lo.2003.48.1.0009
Kowalczuk, P., Meler, J., Kauko, H. M., Pavlov, A. K., Zabłocka, M., Peeken, I., et al. (2017). Bio-optical properties of Arctic drift ice and surface waters north of Svalbard from winter to spring. J. Geophys. Res. Ocean. 122, 4634–4660. doi: 10.1002/2016JC012589
Krause-Jensen, D., Markager, S., and Dalsgaard, T. (2012). Benthic and pelagic primary production in different nutrient regimes. Estuar. Coasts 35, 527–545. doi: 10.1007/s12237-011-9443-9441
Lee, Z.-P., Du, K.-P., and Arnone, R. (2005). A model for the diffuse attenuation coefficient of downwelling irradiance. J. Geophys. Res. 110:C02016. doi: 10.1029/2004JC002275
Lewis, M. R., Carr, M.-E., Feldmant, G. C., Esaias, W., and McClain, C. (1990). Influence of penetrating solar radiation on the heat budget of the equatorial Pacific Ocean. Nature 347, 543–545.
Loisel, H., Mériaux, X., Berthon, J.-F., and Poteau, A. (2007). Investigation of the optical backscattering to scattering ratio of marine particles in relation to their biogeochemical composition in the eastern English Channel and southern North Sea. Limnol. Oceanogr. 52, 739–752. doi: 10.4319/lo.2007.52.2.0739
Lund-Hansen, L. C. (2004). Diffuse attenuation coefficients Kd(PAR) at the estuarine North Sea–Baltic Sea transition: time-series, partitioning, absorption, and scattering. Estuar. Coast. Shelf Sci. 61, 251–259. doi: 10.1016/j.ecss.2004.05.004
Lyngsgaard, M. M., Markager, S., and Richardson, K. (2014). Changes in the vertical distribution of primary production in response to land-based nitrogen loading. Limnol. Oceanogr. 59, 1679–1690. doi: 10.4319/lo.2014.59.5.1679
Maar, M., Møller, E. F., Larsen, J., Madsen, K. S., Wan, Z., She, J., et al. (2011). Ecosystem modelling across a salinity gradient from the North Sea to the Baltic Sea. Ecol. Modell. 222, 1696–1711. doi: 10.1016/j.ecolmodel.2011.03.006
Markager, S., and Fossing, H. (2015). Lyssvaekkelse (Technical description No. M06, Version 3). Available online at: http://bios.au.dk/fileadmin/bioscience/Fagdatacentre/MarintFagdatacenter/TekniskeAnvisninger2011_2015/TA_M06_Lyssvaekkelse_ver3.pdf
Markager, S., and Sand-Jensen, K. (1992). Light requirements and depth zonation of marine macroalgae. Mar. Ecol. Prog. Ser. 88, 83–92.
Markager, S., and Sand-Jensen, K. (1996). Implications of thallus thickness for growth-irradiance relationships of marine macroalgae. Eur. J. Phycol. 31, 79–87. doi: 10.1080/09670269600651231
Markager, S., and Vincent, W. F. (2000). Spectral light attenuation and the absorption of UV and blue light in natural waters. Limnol. Oceanogr. 45, 642–650. doi: 10.4319/lo.2000.45.3.0642
Marshall, B. R., and Smith, R. C. (1990). Raman scattering and in-water ocean optical properties. Appl. Opt. 29:71. doi: 10.1364/AO.29.000071
Middelboe, A. L., and Markager, S. (1997). Depth limits and minimum light requirements of freshwater macrophytes. Freshw. Biol. 37, 553–568. doi: 10.1046/j.1365-2427.1997.00183.x
Morel, A. (1974). “Optical properties of pure water and pure seawater,” in Optical Aspects of Oceanography, eds N. G. Jerlov and E. Steeman Nielsen (London: Academic), 1–24.
Morel, A. (1988). Optical modeling of the upper ocean in relation to its biogenous matter content (case I waters). J. Geophys. Res. 93, 10749–10768. doi: 10.1029/JC093iC09p10749
Murray, C., Markager, S., Stedmon, C. A., Juul-Pedersen, T., Sejr, M. K., and Bruhn, A. (2015). The influence of glacial melt water on bio-optical properties in two contrasting Greenlandic fjords. Estuar. Coast. Shelf Sci. 163, 72–83. doi: 10.1016/j.ecss.2015.05.041
Murray, C. J., Müller-Karulis, B., Carstensen, J., Conley, D. J., Gustafsson, B. G., and Andersen, J. H. (2019). Past, present and future eutrophication status of the Baltic Sea. Front. Mar. Sci. 6:2. doi: 10.3389/fmars.2019.00002
Neumann, T., Siegel, H., and Gerth, M. (2015). A new radiation model for Baltic Sea ecosystem modelling. J. Mar. Syst. 152, 83–91. doi: 10.1016/j.jmarsys.2015.08.001
Nielsen, S. L., Sand-Jensen, K., Borum, J., and Geertz-Hansen, O. (2002). Depth colonization of eelgrass (Zostera marina) and macroalgae as determined by water transparency in Danish coastal waters. Estuaries 25, 1025–1032. doi: 10.1007/BF02691349
Orth, R. J., Marion, S. R., Moore, K. A., and Wilcox, D. J. (2010). Eelgrass (Zostera marina L.) in the Chesapeake Bay region of mid-atlantic coast of the USA: challenges in conservation and restoration. Estuar. Coasts 33, 139–150. doi: 10.1007/s12237-009-9234-9230
Pedersen, T. M., Sand-Jensen, K., Markager, S., and Nielsen, S. L. (2014). Optical changes in a eutrophic estuary during reduced nutrient loadings. Estuar. Coasts 37, 880–892. doi: 10.1007/s12237-013-9732-y
Pierson, D. C., Kratzer, S., Strömbeck, N., and Håkansson, B. (2008). Relationship between the attenuation of downwelling irradiance at 490 nm with the attenuation of PAR (400 nm–700 nm) in the Baltic Sea. Remote Sens. Environ. 112, 668–680. doi: 10.1016/j.rse.2007.06.009
Pope, R. M., and Fry, E. S. (1997). Absorption spectrum (380–700 nm) of pure water. II Integrating cavity measurements. Appl. Opt. 36:8710. doi: 10.1364/AO.36.008710
Prieur, L., and Sathyendranath, S. (1981). An optical classification of coastal and oceanic waters based on the specific spectral absorption curves of phytoplankton pigments, dissolved organic matter, and other particulate materials1. Limnol. Oceanogr. 26, 671–689. doi: 10.4319/lo.1981.26.4.0671
Riemann, B., Carstensen, J., Dahl, K., Fossing, H., Hansen, J. W., Jakobsen, H. H., et al. (2016). Recovery of Danish coastal ecosystems after reductions in nutrient loading: a holistic ecosystem approach. Estuar. Coasts 39, 82–97. doi: 10.1007/s12237-015-9980-9980
Rose, K. C., Neale, P. J., Tzortziou, M., Gallegos, C. L., and Jordan, T. E. (2019). Patterns of spectral, spatial, and long-term variability in light attenuation in an optically complex sub-estuary. Limnol. Oceanogr. 64, S257–S272. doi: 10.1002/lno.11005
Simon, A., and Shanmugam, P. (2013). A new model for the vertical spectral diffuse attenuation coefficient of downwelling irradiance in turbid coastal waters: validation with in situ measurements. Opt. Express 21:30082. doi: 10.1364/OE.21.030082
Simon, A., and Shanmugam, P. (2016). Estimation of the spectral diffuse attenuation coefficient of downwelling irradiance in inland and coastal waters from hyperspectral remote sensing data: validation with experimental data. Int. J. Appl. Earth Obs. Geoinf. 49, 117–125. doi: 10.1016/j.jag.2016.02.003
Soppa, M. A., Pefanis, V., Hellmann, S., Losa, S. N., Hölemann, J., Martynov, F., et al. (2019). Assessing the influence of water constituents on the radiative heating of laptev sea shelf waters. Front. Mar. Sci. 6:221. doi: 10.3389/fmars.2019.00221
Sullivan, J. M., Twardowski, M. S., Zaneveld, J. R. V., Moore, C. M., Barnard, A. H., Donaghay, P. L., et al. (2006). Hyperspectral temperature and salt dependencies of absorption by water and heavy water in the 400-750 nm spectral range. Appl. Opt. 45:5294. doi: 10.1364/AO.45.005294
Thimijan, R. W., and Heins, R. D. (1983). Photometric, radiometric, and quantum light units of measure: a review of procedures for interconversion. Hortic. Sci. 18, 818–822.
Wang, M., Son, S., and Harding, L. W. (2009). Retrieval of diffuse attenuation coefficient in the Chesapeake Bay and turbid ocean regions for satellite ocean color applications. J. Geophys. Res. 114:C10011. doi: 10.1029/2009JC005286
You, Y., Stramski, D., Darecki, M., and Kattawar, G. W. (2010). Modeling of wave-induced irradiance fluctuations at near-surface depths in the ocean: a comparison with measurements. Appl. Opt. 49:1041. doi: 10.1364/AO.49.001041
Zaneveld, J. R. V., Kitchen, J. C., and Moore, C. C. (1994). “Scattering error correction of reflecting-tube absorption meters,” in Proceedings of the Volume 2258, Ocean Optics XII, ed. J. S. Jaffe Bergen, 44–55. doi: 10.1117/12.190095
Zhang, X., Hu, L., and He, M.-X. (2009). Scattering by pure seawater: effect of salinity. Opt. Express 17:5698. doi: 10.1364/OE.17.005698
Zhang, Y., Liu, X., Yin, Y., Wang, M., and Qin, B. (2012a). A simple optical model to estimate diffuse attenuation coefficient of photosynthetically active radiation in an extremely turbid lake from surface reflectance. Opt. Express 20:20482. doi: 10.1364/OE.20.020482
Keywords: bio-optics, photosynthetically active radiation, diffuse attenuation coefficient, absorption coefficient, beam attenuation, inherent optical properties
Citation: Gonçalves-Araujo R and Markager S (2020) Light in the Dark: Retrieving Underwater Irradiance in Shallow Eutrophic Waters From AC-S Measurements. Front. Mar. Sci. 7:343. doi: 10.3389/fmars.2020.00343
Received: 08 December 2019; Accepted: 23 April 2020;
Published: 19 May 2020.
Edited by:
Patrick J. Neale, Smithsonian Environmental Research Center (SI), United StatesReviewed by:
Patrick Biber, University of Southern Mississippi, United StatesCopyright © 2020 Gonçalves-Araujo and Markager. This is an open-access article distributed under the terms of the Creative Commons Attribution License (CC BY). The use, distribution or reproduction in other forums is permitted, provided the original author(s) and the copyright owner(s) are credited and that the original publication in this journal is cited, in accordance with accepted academic practice. No use, distribution or reproduction is permitted which does not comply with these terms.
*Correspondence: Rafael Gonçalves-Araujo, cmFmZ29AYXF1YS5kdHUuZGs=; cmFmYWVsZ29uY2FsdmVzYXJhdWpvQGdtYWlsLmNvbQ==
†Present address: Rafael Gonçalves-Araujo, National Institute of Aquatic Resources, Technical University of Denmark, Lyngby, Denmark
Disclaimer: All claims expressed in this article are solely those of the authors and do not necessarily represent those of their affiliated organizations, or those of the publisher, the editors and the reviewers. Any product that may be evaluated in this article or claim that may be made by its manufacturer is not guaranteed or endorsed by the publisher.
Research integrity at Frontiers
Learn more about the work of our research integrity team to safeguard the quality of each article we publish.