- School of Civil and Environmental Engineering, Georgia Institute of Technology, Atlanta, GA, United States
Internal waves are ubiquitous features in coastal marine environments and have been observed to mediate vertical distributions of zooplankton. Internal waves possess fine-scale hydrodynamic cues that copepods and other zooplankton are known to sense, such as fluid density gradients and velocity gradients (quantified as shear strain rate). The role of copepod behavior in response to cues associated with internal waves is largely unknown. The objective is to provide insight to the bio-physical interaction and the role of biological vs. physical forcing in mediating organism distributions. A laboratory-scale internal wave apparatus is designed to facilitate fine-scale observations of copepod behavior in flows that replicate in situ conditions of internal waves in two-layer stratification. An experimental configuration is presented with a density jump of 1 σt. Theoretical analysis of the two-layer system provided guidance to the target forcing frequency needed to generate a standing internal wave with a single dominate frequency of oscillation. Flow visualization and signal processing of the interface location were used to quantify the wave characteristics. The results show a close match to the target wave parameters. Marine copepod (mixed population of Acartia tonsa, Temora longicornis, and Eurytemora affinis) behavior assays were conducted for three different physical arrangements: (1) no density stratification (i.e., control), (2) stagnant two-layer density stratification, and (3) two-layer density stratification with internal wave motion. Digitized trajectories of copepod swimming behavior indicate that in the control (case 1) the animals showed no preferential aggregation. In the stagnant density jump treatment (case 2) copepods preferentially moved horizontally, parallel to the density interface. In the internal wave treatment (case 3) copepods demonstrated loopy, orbital trajectories near the density interface. Analysis of advected trajectories in the internal wave, with and without superimposed copepod swimming, reveal distinct differences with the observed copepod trajectories in the internal wave treatment. These differences and a consideration of the potential hydrodynamic cues indicate that copepod behavior response has a substantial influence on the swimming trajectories in the internal wave region.
1. Introduction
Internal waves are ubiquitous phenomena that often form in regions of high temperature or salinity variability as the pycnocline oscillates to create the wave (Phillips, 1966). Interests in studying internal waves have varied across a wide spectrum including breaking internal waves, shoaling internal waves, and tidal internal wave packets (e.g., Thorpe, 1999; Troy and Koseff, 2005; Hult et al., 2009).
In addition to interest in the physical aspects of internal waves, studies often are focused on understanding the vertical mixing of nutrients or vertical displacements of plankton distributions (Mann and Lazier, 1996). Zooplankton distributions are also influenced by the presence of internal waves (e.g., Haury et al., 1979; Greer et al., 2014; Sevadjian et al., 2014). In fact, the majority of observations indicate aggregation and increased zooplankton presence in and around the internal wave region (e.g., Haury et al., 1983; McManus et al., 2005; Van Haren, 2014). This phenomenon also has been observed in a fresh-water lake (Rinke et al., 2007). To understand the association of zooplankton population dynamics with internal waves, we must better understand the bio-physical coupling and the role of fine-scale hydrodynamic cues induced by internal waves. The majority of these studies suggest that the zooplankton are advected by the internal wave fluid motion, although there are some indications that behavioral responses may play an important or critical role. In this regard, Macías et al. (2010) reported that the distribution of zooplankton in internal waves in the Strait of Gibraltar appeared to result from a spatial differentiation between weakly-swimming and strong-swimming taxa. Despite this observation, they ultimately concluded that zooplankton distributions result from physical forcing as opposed to migration patterns. Further, Van Haren (2014) noted that zooplankton “gathered” near internal wave structure, which implies a behavioral component. Modeling efforts also suggest that behavior may play an important role. Lennert-Cody and Franks (1999) and Lennert-Cody and Franks (2002) showed that horizontal distributions of phytoplankton in internal wave structure are greatly influenced by their ability to weakly swim. Further, Scotti and Pineda (2007) and Garwood et al. (2020) found that depth-keeping zooplankton in propagated weakly internal wave can form aggregations and enhance cross-shore transport.
In the absence of the oscillations associated with internal waves, there are many observations that the pycnocline is important for the distribution of biomass along the water column. Field observations have shown that thin layers, which are sparse patches of high phytoplankton biomass in the water column (Holliday et al., 2003), are often formed around the pycnocline (Dekshenieks et al., 2001; McManus et al., 2003). Further, copepods and other zooplankton have been observed to aggregate around thin layers (e.g., Cowles et al., 1998; Dekshenieks et al., 2001; Gallager et al., 2004). And, there is evidence that zooplankton sensing and behavioral responses play an important role in the distribution of zooplankton (Woodson et al., 2005, 2007a,b; True et al., 2018). Thus, a relevant question is whether the behavioral component that contributes to aggregations of zooplankton around thin layers is modified by the unsteady, orbital oscillations of internal waves.
The objective of this study is to design and test a laboratory apparatus to study the balance of behavioral vs. physical forcing in the distribution of marine zooplankton in and around internal waves at an individual scale. No study to date has examined the mechanistic link between the fluid motion of internal waves and copepod behavior. However, the oscillations of the internal wave generate dynamic hydrodynamic cues that copepods may be able to sense. Hence, our intent is to provide insight to the mediating factors that dictate organism distributions such as advective transport and swimming behavior responses to velocity and density gradients. The objective is consistent with the statements in Haury et al. (1983) seeking to determine the influence of passive transport vs. the influence of behavior responses to explain the resulting zooplankton distributions. The paper presents a detailed description of the apparatus and a theoretical analysis of the internal wave structure in the laboratory configuration. The wave characteristics are experimentally quantified to compare to the theoretical targets, and finally behavioral trials for a mixed population of copepods are described and interpreted.
2. Materials and Procedures
A laboratory-scale internal wave apparatus was created to replicate the flow characteristics of a standing internal wave in a two-layer stratified system. It should be noted that internal waves typically propagate in a stratified medium in the ocean, but a standing internal wave can be generated in the special case of a finite trapped region of altitude or depth (Ewing, 1950). A standing wave is preferred in this study in order to avoid traveling waves that reflect in the finite-sized laboratory apparatus. The target parameters were chosen based on the theoretical analysis of a standing internal wave in a two-layer stratified system, presented in the next section. Flow visualization and signal processing were used to quantitatively compare the results to the target parameters. Copepod behavioral assays were conducted to understand their response to hydrodynamic cues (in addition to the inevitable directional cue of the orientation of gravity) associated with internal waves such as fluid density gradients and velocity gradients (quantified as shear strain rate).
2.1. Experimental Apparatus
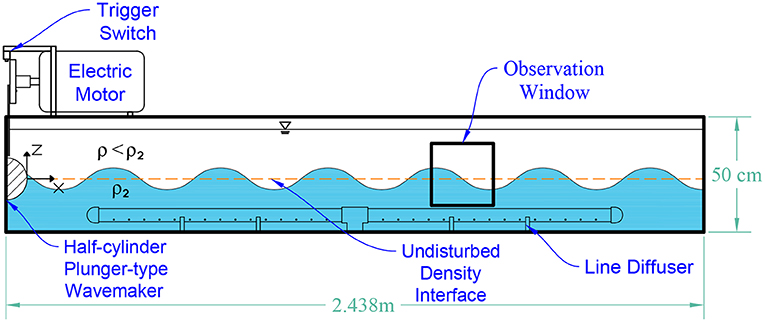
The main tank (2.438 m × 50 cm × 50 cm) was constructed from clear acrylic sheets with thickness of 1.905 cm. The schematic of the internal wavemaker apparatus is shown in Figure 1. A line diffuser (PVC) was installed along the middle of the tank floor to be used to fill the tank.
Following the theory described in Dean and Dalrymple (1991), a half-cylinder plunger-type wavemaker was used to create a perturbation at the pycnocline represented by the interface between the density layers. The PVC plunger had dimensions of 10.16 cm diameter and 50 cm length and was driven by an electric motor. A stainless steel linkage connected the plunger to a disk mounted on the rotating motor shaft. A timing control signal is triggered by a striking tab on the disk contacting a switch button. On each revolution, the switch sent a voltage signal to the external trigger port of a pulse generator. By precisely controlling the delay following the external trigger signal, the pulse generator sent a signal to the camera to capture an image at a targeted phase of the standing wave cycle.
2.2. Experimental Parameters
The design parameters for a standing internal wave were chosen in order to mimic the thin layer structures found in highly-stratified coastal environments (Cheriton et al., 2009; Velo-Suárez et al., 2010). In determining the parameters, several constraints were taken into account such as the tank dimensions, the size of the wave with respect to the observation window, and the resolution of the recorded images. The independent variables were: (1) the fluid density jump between the layers, (2) the amplitude of the plunger displacement, (3) the layer thickness, and (4) the seiching mode of the wave. The wave period (T = 2π/ω, where ω is the angular frequency of the wave) was calculated from these input variables using the theoretical wave description presented in the next section.
A density jump of 1.0 σt was chosen based on previous copepod behavior assays performed by Woodson et al. (2007a). This study showed that based on a regression analysis of the number of individual calanoid copepods Temora longicornis and Acartia tonsa crossing the interface vs. the magnitude of the density jump, the threshold range was between △ρ = 0.4 to 2.0 σt. The lower boundary was where the regression curve began to decrease, and the upper boundary was where approximately 75% of the population was not crossing the density interface. The density jump of 1.0 σt was also consistent with density interfaces observed in situ (e.g., Dekshenieks et al., 2001; Cowles, 2004; Gallager et al., 2004, and Cheriton et al., 2009). The amplitude of the plunger motion was experimentally (i.e., trial and error) set to 3 cm; larger amplitudes produced higher harmonics, evanescent modes, and eventually wave breaking. In the experimental set-up, the layer thicknesses were equal (i.e., h1 = h2 = 22.2 cm, where h is the layer thickness).
2.3. Stratification Procedure
A two-layer stratified volume was prepared prior to running either the wave characterization or behavior assay experiments. The fluid for each layer was created in separate batches using filtered artificial seawater (Instant Ocean). The lighter density layer (ρ1 referred to as the “upper layer”) was prepared in the experimental tank with a density of 1,025 kg/m3 (33 ppt). The heavier density layer (ρ2, the “lower layer”) was prepared in a separate reservoir with a density of 1,026 kg/m3 (34.3 ppt). The salinity levels were chosen to best match natural levels in the ocean where the copepods were harvested. For visual characterization, red food coloring (Kleckner's Tomatoshade) was mixed into the lower layer fluid. The lower layer fluid was slowly introduced to the tank via the line diffuser at the bottom of the tank. The flow rate was initially 1.9 L/min until the depth of the incoming layer was greater than the height of the diffuser. Then the flow was increased to 7.6 L/min. The incoming flow rate was specified to maintain laminar flow in the jet flows exiting the diffuser holes in order to avoid turbulent mixing. The layer structure was assumed to be fixed over the course of the experiments (~ 2 h) because of the long time scales (~ days) associated with molecular diffusion.
3. Theoretical Analysis
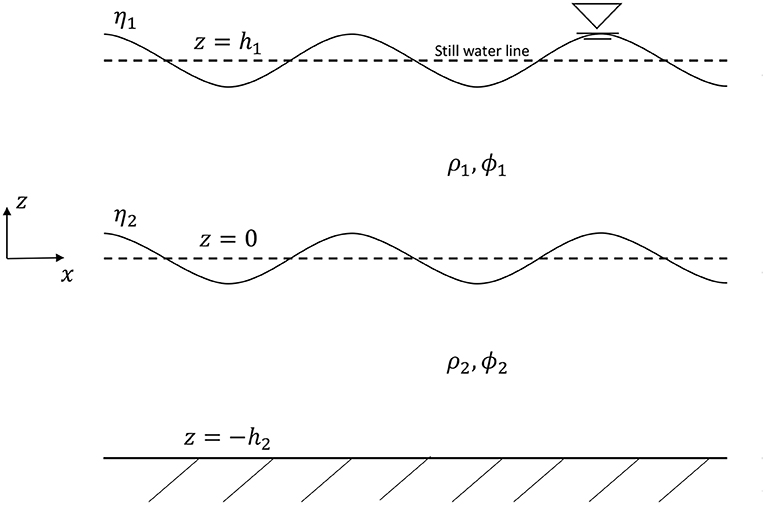
An accurate wave dispersion relationship is needed to identify the target wave and piston motion parameters. The two-layer density stratified system is represented in Figure 2. Anticipating that the amplitude of the waves will be significant compared to the wavelength, the third-order solution for internal waves propagating along the interface between two homogeneous incompressible and inviscid fluids, which considers the non-linearity of the internal wave profile, is computed in this work to find the dispersion relationship (Umeyama, 2000, 2002). Since the flow is considered inviscid for analysis purposes, the potential function is a useful parameterization of the velocity field, and it is denoted with the variable ϕ1 and ϕ2 in each layer. The position of the instantaneous density interfaces are denoted by η1 and η2 as shown in Figure 2. The third-order solution for internal waves may be defined as:
where ε is the perturbation parameter. The superscripts (1), (2), and (3) indicate quantities that correspond to the first-order, second-order, and third-order perturbation solutions. The governing equations and boundary conditions are
where g is acceleration due to gravity, t is time, and the comma notation in the subscript indicates a derivative operation with respect to the subsequent variable. Equations (6) and (7) are the Laplace equations, which describe mass continuity for each layer. Equations (8) and (9) are the kinematic and dynamic boundary conditions at the free surface. Equation (10) is the bottom solid wall boundary condition, and the kinematic and dynamic boundary conditions at the density interface are defined in Equations (11), (12), and (13). Since the vertical velocity of the fluid in both layers at the interface must be equal to the velocity of the interface, Equations (11) and (12) should be satisfied. Furthermore, Equation (13) provides the dynamic boundary condition at the fluid interface, where the normal stress of the fluid must be continuous across the interface (Drazin, 2002). It was shown that the boundary conditions and the governing equations for the first-, second-, and third-order functions can be derived by substituting Equations (1)–(5) into Equations (6)–(13) (Umeyama, 2000, 2002). The first-, second-, and third-order perturbation solutions for the frequency dispersion relation of the wave are
where k is the wavenumber, and
The analytical third-order solution is used to calculate the frequency of oscillation of the piston to be used as an operational parameter to achieve the target wave treatment. As noted above, the density jump was 1.0 σt, which was selected based on previous observations of copepod behavior in stagnant density interface treatments. The density interface was established in the center of the tank with h1 = h2 = 22.2 cm. These parameters, combined with the length dimension of the main tank and the wave amplitude [ cm], were used in the analytical equations presented above to determine the dispersion relationship between the mode of the standing wave and the frequency (i.e., Equation 5). The seiching mode number is equal to the harmonic mode of a standing wave, which dictated the number of full wavelengths in the tank. The target seiching mode is determined by a criteria to capture at least a quarter wavelength in a 30 × 30 cm viewing window during the behavioral trials in order to uniquely pinpoint any location on the wave at a given time and to maintain enough imaging resolution to resolve the wave interface position. In the case presented here, mode 8 was selected to yield a wavelength of 610 mm. Based on these parameters, the third-order dispersion equation yields a targeted frequency of 0.041 Hz, corresponding to a wave period of 24.27 s. As a final note, the value of for this treatment is 0.26, which indicates the amplitude is not negligible relative to the wavelength and is consistent with the anticipated need to include the non-linear effects in the analysis.
4. Flow Characterization Techniques
For the wave characterization trials, the layers were marked by the sharp interface between the red-dyed bottom layer and clear upper layer. After initiating the wavemaker motion, the interface motion took about 30 min (on average) to develop into a standing internal wave due to the long wave period and return time of the transient reflected waves.
A CCD camera (Vision Research Inc. model Phantom v210) with 60 mm focal length lens (Nikon) was used to record the interface location. The resolution of the camera was 1,280 × 800 pixels. The spatial resolution of the images is 0.758 mm/pixel, which provides high resolution of the internal wave interface location. The recorded videos were calibrated for distortion via the camera control software (i.e., Vision Research Phantom Camera Control Application). The exposure was set to 750 μs and f-stop to f/2.8 to get the necessary depth of field and attaining sufficient brightness for the imaging. Five lamps using fluorescent coil bulbs illuminated the tank and fluid volumes.
Two different triggering strategies were required for capturing images for (1) flow visualization, and (2) recording an image sequence for signal processing. First, to capture still images, the triggered pulse generator was used to control the image acquisition with a precise delay to capture an image at the targeted phase in the cycle. Images were captured for eight phases in the cycle for flow visualization purposes. Figure 3 shows the flow visualization of a complete wave cycle at eight equally-spaced phases. The interface shows a partial standing wave (nodes and antinodes indicated in Figure 3) with some wave perturbations being generated.
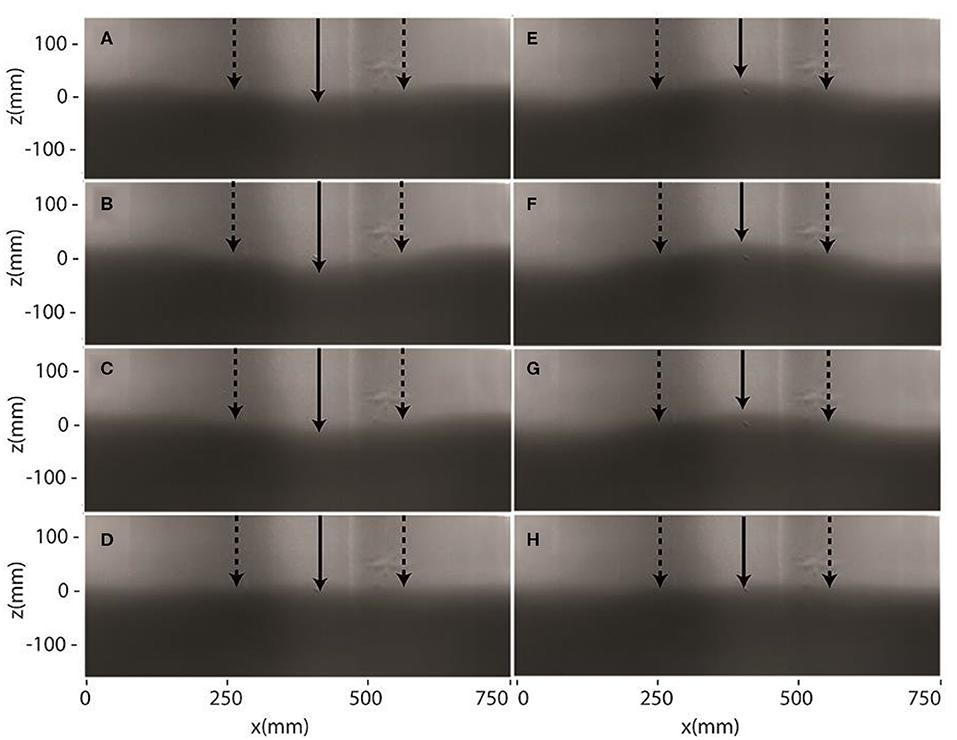
Figure 3. Flow visualization showing eight phases during the wave cycle corresponding to ϕ = (A) 0, (B) , (C) , (D) , (E) π, (F) , (G) , and (H) [radians]. The locations of the nodes are marked by the vertical dotted arrows and the antinodes are marked by the solid arrows.
The camera setup for recording image sequences for signal processing required throttling the frame rate of the camera. In this arrangement, the trigger signal was not phase-locked with the wavemaker motion. The minimum frame rate of the Phantom camera was 24 fps, but the objective was to record at a slower rate in order to increase the total duration of the image sequence and achieve a higher resolution estimate of the dominant frequency during signal processing. The frame rate was lowered to 4 fps by using the camera's trigger mode option and sending a trigger signal for each frame capture. Three sequences of 7,200 images each were captured in this manner.
The generated wave frequencies in the time record of wave height were quantified using signal processing. A time stack image at an anti-node of the wave was created by extracting a vertical line of pixels from a single horizontal location in each image of the recorded sequence and re-arranging them side-by-side to effectively form an image time series at the anti-node location. Two image processing filters, median and sharpen, were used to reduce the noise and sharpen the image in order to use the Sobel edge-detection algorithm, which reliably identified the interface location (and hence the wave height). Figure 4 shows the detected interface (white line) superimposed on the time-stack image. The detected interface accurately captured the oscillation of the density interface at the anti-node. Both elevation and depression internal waves have been observed under various ocean conditions (Orr and Mignerey, 2003). Figures 3, 4 suggest that the apparatus has the potential to investigate zooplankton response to both types of waves.
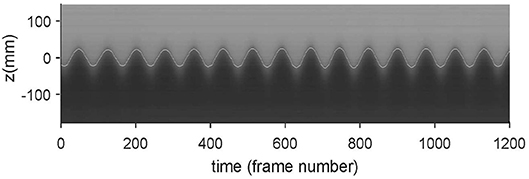
Figure 4. Time stack image at an antinode with the digitally-identified interface location (white line) superimposed.
A fast Fourier transform (FFT) algorithm was used to convert the extracted time record of wave height to the frequency domain. The target parameters for the internal wave were chosen based on the theoretical analysis as explained above, and consisted of Δρ = 1.0σt, seiching mode of 8, and wave period of 24.27 s (i.e., 0.041 Hz). The power spectral density (PSD), which is shown in Figure 5, indicates a narrow peak, where the peak is very close to the target mode of 8 as indicated by the vertical line. It is apparent that the third-order theory captures the non-linearity of the internal wave profiles and predicts the actual behavior of the internal wave with a high degree of accuracy.
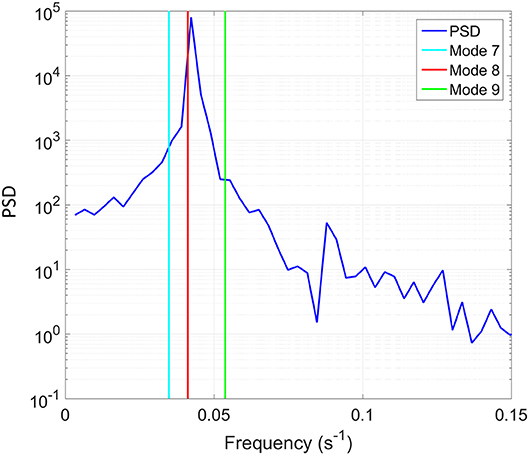
Figure 5. Power spectral density (PSD) of the time record of the interface location shown as function of frequency. In addition, the theoretically-predicted frequencies corresponding to three modes are indicated with the vertical lines.
5. Behavioral Assays and Data Analysis Techniques
For the behavioral assays, a mixed population of three species of copepods was used: A. tonsa, T. longicornis, and Eurytemora affinis. The main goal of the trials is to observe the animals' trajectory paths in the internal wave treatment and gain insight to the influence of biological forcing via their swimming behavior responses.
5.1. Copepod Collection and Maintenance
The copepod specimens were collected in Boothbay, ME, USA (Latitude: 43.860 N, Longitude: 69.582 W). The tow was done during the hours of 12:00–12:30 p.m. using a 153 micron net. The deployment was a surface tow during high tide for 30 min off of the dock at the Bigelow Laboratory for Ocean Sciences. The animals were contained in eight 1 L bottles with food (Rhodomonas) and shipped overnight in a cooler to the Georgia Institute of Technology (Atlanta, GA).
After arrival, the mixed population of copepods were placed into 19 L buckets in a temperature-controlled environmental room. The culture media was artificial seawater (Instant Ocean) at salinity level of 33 ppt, and the ambient temperature was kept at 12°C in order to match natural environment conditions. Copepods were fed Isochrysis and Tetraselmis spp. phytoplankton.
5.2. Behavioral Assays
Behavioral assays were conducted in the same internal wave apparatus as the flow characterization experiments. Dye was not present during the copepod trials. All experiments were conducted at constant temperature (12 ± 0.2 °C). In each trial, 200 fresh copepods of mixed population of A. tonsa, T. longicornis, and E. affinis were used. The tested population consisted entirely of adults. The behavioral assays were performed with artificial seawater (Instant Ocean). A 30 × 30 cm window was used to observe the copepod swimming kinematics (Figure 1). The observation window was positioned such that the undisturbed density interface was at the mid line.
Two 7-W continuous-wave infrared lasers (CrystaLaser, Inc.) with a wavelength of 808 nm illuminated the tank. The lasers were mounted behind the tank at 45° angles and diffused via 50° circular, top hat diffusers (Thorlabs model ED1-C50-MD) to provide uniform illumination in the observation region. The experiments were conducted in the dark, except for the infrared illumination described. Infrared lighting was chosen because copepods typically cannot sense light at this wavelength; therefore, their swimming behavior was not influenced by the illumination during the observation. The Phantom v210 camera was used with a 60 mm focal length lens (Nikon). The exposure time was set to 2,400 μs and the camera was positioned 0.77 m away from the front wall of the tank. The spatial resolution of the recordings was 0.394 mm/pixel. The frame rate was 15 fps because it provided sufficient temporal resolution to accurately quantify swimming behaviors. The camera was externally triggered to achieve this frame rate as described above, and the image capture was not synced with the motion of the wavemaker.
The behavior assays were conducted for three physical treatments: (1) stagnant fluid with no density stratification (i.e., control), (2) stagnant two-layer density stratification, and (3) two-layer density stratification with standing internal wave motion.
Five 5-min image sequences were recorded for each treatment. The copepod trajectories were manually tracked in DLTdv5, a MATLAB particle tracking software developed by Hedrick (2008). The vertical distribution of the copepod specimens was quantified via a probability density function (PDF) of the copepod position in the z-direction. The distribution of trajectories are analyzed for the regions that the computed absolute value of the shear strain rate in the internal wave treatment (Figure 10) is above 80% (−20 to +20 mm of the midline), and 40% (−50 to +50 mm of the midline) of the maximum value. The two-sample Kolmogorov–Smirnov test (2KS-test) is used to measure the agreement between the PDF of vertical position with 100 bins that have at least 100 data points in each bin.
Net-to-gross-displacement-ratio (NGDR), fractal dimension, and turn frequency of swimming trajectories are computed to quantify the degree of morphological complexity of a swimming path. The NGDR represents the ratio of the straight linear distance to the total distance between the beginning and the end points of the path traveled by an organism (Buskey, 1984), which is defined as
This parameter ranges from 0, for a circular, sinuous and diffused path, to 1, for a straight ballistic trajectory. However, the scale dependency of this parameter is its limitation, and the NGDR calculation depends on the length of the track (Dodson et al., 1997). Thus, the tracks are divided to the same period (6.0 s in this case) trajectories for the NGDR computation (Tiselius, 1992). In addition to NGDR, the degree of space occupation of copepod trajectories without any scale-dependency is assessed in this study using the fractal dimension (Coughlin et al., 1992; Seuront et al., 2004; Uttieri et al., 2005). Therefore, it should be noted that the sample sizes for fractal dimension analysis and turn frequency computation are equal to the number of trajectories for each case (23, 33, and 25 for control, stagnant density jump and internal wave treatments, respectively), while the sample sizes for NGDR computation are equivalent to the total number of same period segments (98, 187, and 238 for control, stagnant density jump and internal wave treatments, respectively). The fractal dimension is computed using the box counting method to compare the degree of convolution of trajectories between different treatments. In this method, the slope of the power fit of the log-log plot of the number of boxes vs. mesh size is corresponding to the fractal dimension. Furthermore, the number per second of changes in the direction of motion of more than 15 degrees in each trajectory is defined as turn frequency (Woodson et al., 2005).
6. Results
Figure 6 shows the digitized swimming trajectories for a mixed-population of copepods in a body of water with uniform salinity of 33 ppt (the control case). The 25 sample tracks appear to be predominantly directed upward or downward with no obvious restriction for motion in any direction. Also the PDF of vertical position lacks a strong peak at a particular depth, which suggests the copepods are not aggregating (as one would expect for the control treatment). The lack of preferential aggregation in the trajectories was expected since no directionally-oriented hydrodynamic cues were present in the control treatment except for the orientation of gravity. Approximately 18% of the trajectories of copepods are located between −20 to +20 mm of the midline, and ≈ 47% between −50 and +50 mm of the midline. It should be noted that the PDF is not perfectly uniform and it is less dense toward the bottom (i.e., negative z values). This is perhaps due to the mostly vertically aligned trajectories or the effect of a limited number of trajectories.
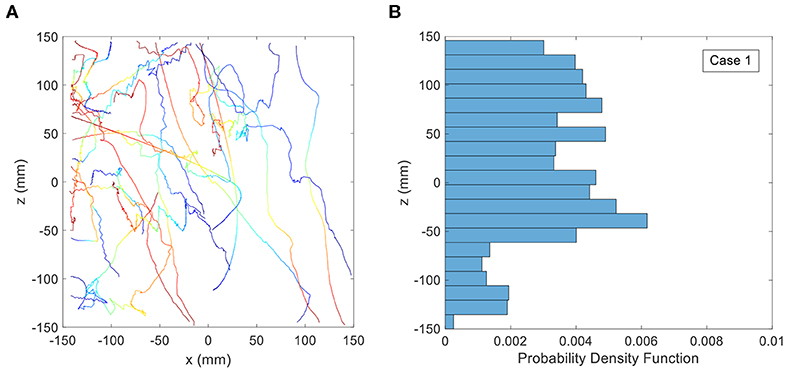
Figure 6. (A) Copepod trajectories for the control treatment with stagnant, uniform density fluid. Color indicates the passage of time with blue corresponding to the beginning of the trajectory and red corresponding to the end. Although shown on the same plot, these trajectories were not collected simultaneously. (B) Probability Distribution Function (PDF) of copepod position in the vertical direction for the control treatment.
For the second treatment, the salinity of the lower level water was increased to 34.3 ppt and the salinity of the upper layer was maintained at 33 ppt. The trajectories of copepods and the PDF of the vertical position for this case are shown in Figure 7. The black dashed line indicates the position of the density interface. The plunger was not activated, and the fluid volume was therefore stationary. The digitized trajectories show that many of the copepods moved preferentially in the horizontal direction, parallel to the density interface. Quantitative analysis using the PDF indicates that ≈ 31% of the trajectories are located between −20 and + 20 mm and ≈ 49% of the trajectories are located between −50 and + 50 mm in the z-direction. Although the comparison of PDFs for the whole region indicates that there is not a significant difference between the PDF of control and stagnant density jump treatments (p = 0.347), the PDF of vertical position for these two treatments are significantly different between −20 and + 20 mm of the midline (p = 0.016).
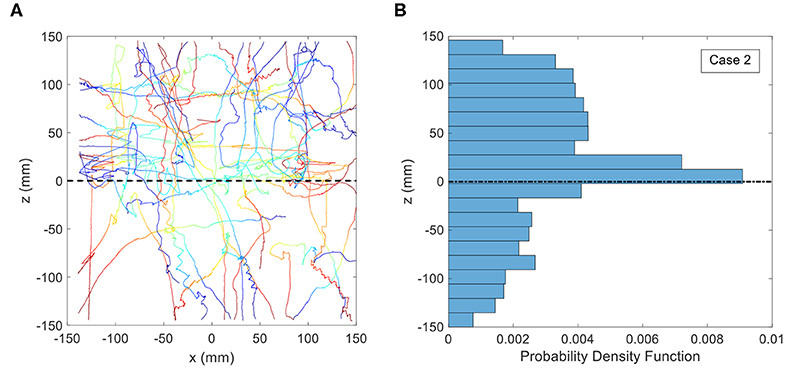
Figure 7. (A) Copepod trajectories for the treatment consisting of a stagnant density jump of 1.0 σt. The black dashed line indicates the location of the density interface. Color indicates the passage of time with blue corresponding to the beginning of the trajectory and red corresponding to the end. Although shown on the same plot, these trajectories were not collected simultaneously. (B) Probability Distribution Function (PDF) of copepod position in the vertical direction for the treatment consisting of a stagnant density jump of 1.0 σt.
In the third treatment, the copepods were observed in the standing internal wave with density jump properties identical to the second treatment, where the lower layer salinity is 34.3 ppt and the upper layer salinity is 33 ppt. Figure 8 shows animal trajectories and the PDF of the vertical position for this case. The dashed lines indicate the upper and lower boundaries of the internal wave as defined by the peak locations of the crests and troughs. In clear contrast to the other treatments, the copepod swimming paths demonstrated more curved trajectories near and inside the boundaries of the internal wave. Some of the trajectories are loopy, orbital motions, whereas a few of the trajectories appear to be zig-zag-like oscillation patterns. Beyond a distance of roughly 75 mm from the resting position of the interface (i.e., z = 0), the trajectories were much less likely to show the looping, orbital shape that is observed in the immediate vicinity of the interface location. The probability of copepods positions between −20 and +20 mm in the z-direction is ≈ 27%, and in the internal wave region (−50 to + 50 mm) is ≈ 65%. Further, according to the 2KS-test, the PDF of vertical position in the internal wave treatment is significantly different from the density jump treatment (p < 0.001) as well as the control treatment (p = 0.008).
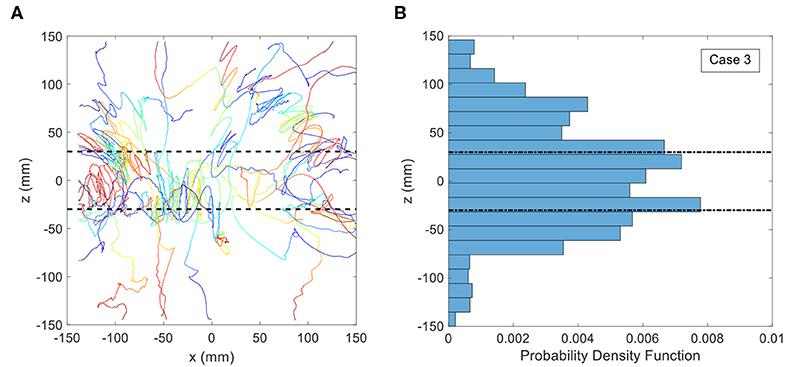
Figure 8. (A) Copepod trajectories for the internal wave treatment with a density jump of 1.0 σt. The black dashed lines indicate the boundaries of the internal wave. Color indicates the passage of time with blue corresponding to the beginning of the trajectory and red corresponding to the end. Although shown on the same plot, these trajectories were not collected simultaneously. (B) Probability Distribution Function (PDF) of copepod position in the vertical direction for the internal wave treatment with a density jump of 1.0 σt.
Results of NGDR, fractal dimension, and turn frequency of the swimming trajectories for the different treatments are shown in Figure 9 and are analyzed using an ANOVA with a Tukey–Kramer post-hoc test between treatment pairs. The statistical analysis is summarized in Table 1. Clear and consistent trends are observed for NGDR, fractal dimension, and turn frequency (Figure 9). The statistical tests (Table 1) also verify these significant differences in NGDR, fractal dimension, and turn frequency. There is a significant difference between average values of NGDR (largest value for the control treatment and smallest value for the internal wave treatment), fractal dimension, and turn frequency (smallest value for the control treatment and largest value for the internal wave treatment) in all pairwise comparisons. Therefore, the statistical analysis implies that the copepod swimming trajectories are changed from more linear, straight and ballistic trajectories for the control treatment to more curved, loopy, and diffused ones in the internal wave treatment.

Figure 9. (A) Net-to-gross-displacement-ratio (NGDR), (B) fractal dimension, and (C) turn frequency (turns per copepod per second) for the swimming trajectories for the control, stagnant density jump, and internal wave treatments. The error bars span ± one standard error.
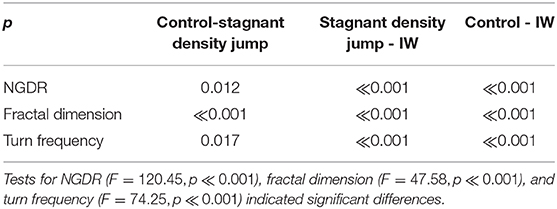
Table 1. Tukey–Kramer post-hoc test results for NGDR, fractal dimension, and turn frequency between pairs of treatments based on α = 0.05.
7. Discussion
For the stagnant density interface treatment, the trajectory pattern shows a clear difference from the control treatment. The apparent reluctance of some of the copepod specimens in the current results to cross the density interface is consistent with the previous results for A. tonsa and T. longicornis, who for a Δρ of 1.0 σt showed a decrease in the number of copepods crossing the density jump layer (Woodson et al., 2007a). In contrast, the other member of the tested copepod population, E. affinis, previously did not reveal a reluctance to crossing a density jump interface (Woodson et al., 2007b). The trajectories in Figure 8 are consistent with both variability among individuals and the reported species-specific variability in behavior with some trajectories clearly oriented parallel to the interface (and hence not crossing the interface location) and other trajectories crossing the interface. The results also show elevated population density near the fluid density interface. This is consistent with previous observations of Harder (1968) and Woodson et al. (2007a). Harder (1968), in particular, found that the aggregations were a behavior response to the change in fluid density itself, rather than another cue such as salinity or temperature. The PDF for the stagnant density interface treatment suggests that the copepods preferred to be in the upper layer, possibly due to a preference to remain in the fluid density (and salinity) in which they were acclimated. Thus, for the stagnant density interface treatment, we conclude that the current population behaves in a consistent manner by moving in the horizontal direction along the fluid density interface, limiting the number of interface crossings, and aggregating near the fluid density interface. Further, the trajectories for the stagnant density interface treatment are more convoluted (i.e., decreased NGDR and increased fractal dimension and turn frequency; Figure 9) compared to the control treatment due to the increased heading changes associated with the limited crossings of the density interface.
In the internal wave treatment, the copepod trajectory shapes were quite distinct from either the control or the stagnant density jump treatment. The looping, orbital trajectories will be discussed further below. The PDF of the vertical position indicates that the copepods are most commonly found in the internal wave region. The percentage of the trajectories that are in the wave region is roughly double that of a uniform distribution (i.e., 65 vs. 33%). While the length scales are obviously different compared to an in situ internal wave, the aggregation reported here for the internal wave treatment suggests that copepod behavior may be an important contribution to explain reported aggregations near internal waves by Haury et al. (1983), McManus et al. (2005), Macías et al. (2010), and Van Haren (2014), and others.
In order to gain insight regarding the looping, orbital copepod trajectories, the trajectory patterns of neutrally-buoyant particles in the theoretical flow field are analyzed. In particular, the authors seek to better understand the balance of physical vs. biological forcing and specifically whether the copepod trajectories resulted from pure advection by the surrounding flow or whether animal behavior was a substantial contributor. The velocity field in the two-layer system is found via the third-order solution, as described in section 3, for the flow conditions matching the experimental treatment. Figure 10 shows the velocity vectors, the iso-contours of the velocity magnitude, and the shear strain rate for four phases ϕ = π/4, ϕ = π/2, ϕ = 3π/4, and ϕ = 3π/2. The velocity fields show the expected sense of motion relative to the dynamic interface. The velocity magnitude is maximum at the interface (z = 0) and decreases with distance away from it. The iso-contour plots of velocity magnitude show the variation through the wave cycle. Among the phases shown, the greatest velocity magnitude appears for ϕ = 3π/4 and has a peak value of 5.6 mm/s. As reported in Woodson et al. (2007a), among others, the copepod species tested in this treatment demonstrate swimming velocities in the same range, which suggests an inherent ability to swim relative to even the strongest fluid motion presented in the treatment.
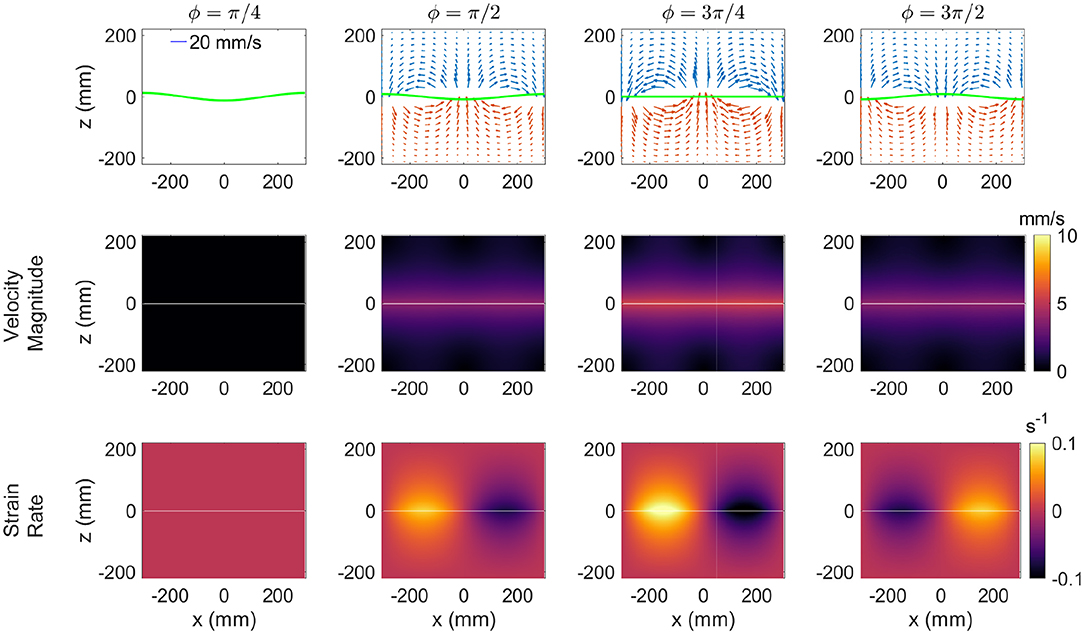
Figure 10. The flow field in the standing internal wave cycle. The velocity field (Top), contours of the velocity magnitude (Middle), and contours of the strain rate (Bottom).
Trajectory analysis for passive, neutrally-buoyant particles was performed in the theoretical flow field, by initiating particles at a grid of locations throughout the two-layer system and tracking their subsequent position due to advection by the time-varying flow field. In Figure 11A, the passively advected particles essentially oscillate back-and-forth, which is expected in a standing internal wave. By comparing to the loopy, orbital trajectories exhibited by copepods in the vicinity of the internal wave interface (Figure 8), the obvious conclusion is that the observed copepod motions are not explained solely by advection due to the fluid motion.
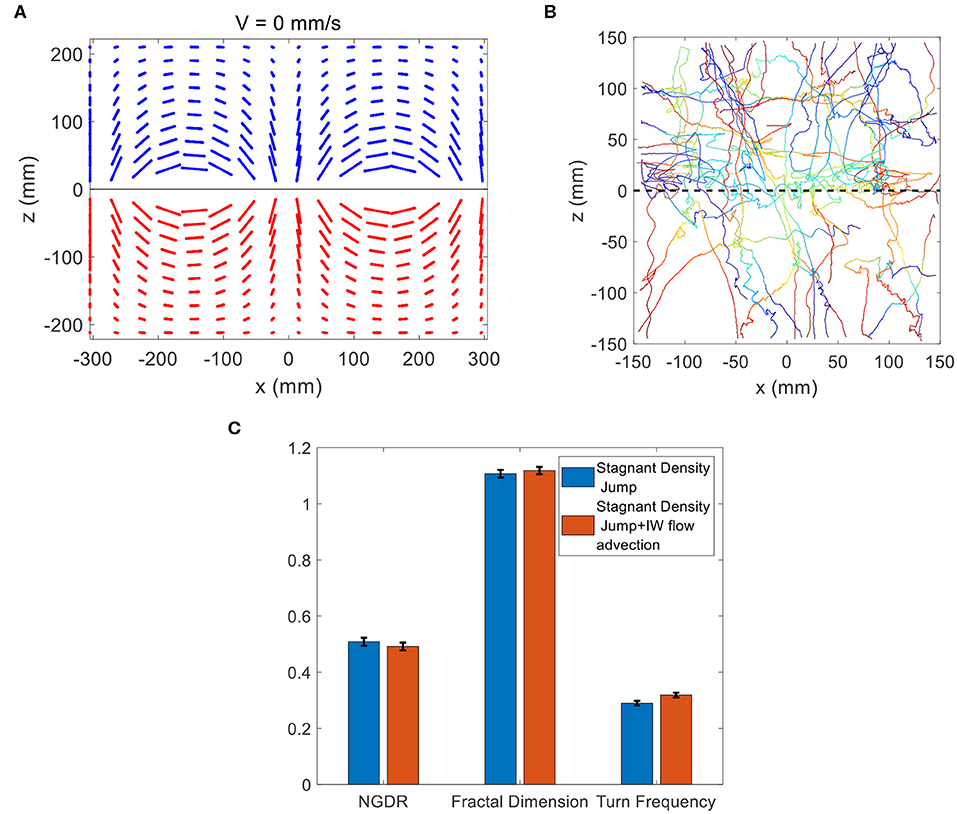
Figure 11. (A) Theoretical trajectories of passive neutrally-buoyant particles in the flow conditions of the internal wave treatment. (B) Copepod trajectories observed for the stagnant density jump treatment (Figure 7A) with advection due to the internal wave motion added at each time step. The trajectories shown correspond to an initial phase of ϕ = 3π/4, and other initial values for the phase yielded similar results. (C) Comparison of NGDR, fractal dimension and turn frequency between the wave-modified trajectories in (B) and the observed copepod trajectories for the stagnant density jump treatment in Figure 7A. There is no significant difference for any variable.
While passive particle advection is clearly distinct from the observed trajectories, the question remains whether the trajectories are explained by the combination of copepod swimming and advection by the wave motion. To address this question, the copepod trajectories for the stagnant density jump treatment (shown in Figure 7A) were combined with advection due to the time-varying theoretical flow field. In this manner, the observed swimming trajectories in the vicinity of the density interface were modified at each time step to include the additional displacement due to advection by the wave. Figure 11B reveals that the modification of the trajectories was minimal. A few trajectories show the addition of a zig-zag-like oscillation to the path, but the overall shape is generally distinct compared the actual copepod trajectories in the internal wave treatment (Figure 8A). The qualitative conclusion is that the observed copepod motions cannot be explained by the addition of advection due to the fluid motion. The potential differences between the copepod swimming trajectories in the stagnant density jump treatment (Figure 7A) and the combined trajectories (Figure 11B) are quantified via NGDR, fractal dimension, and turn frequency (Figure 11C). There is no significant difference for each variable. The mild influence of flow advection is consistent with the relatively small and time-varying fluid velocities, as quantified in Figure 10, compared with copepod swimming velocity. It should be noted that since the copepod trials were not phase-locked with the wave motion, the phase at the start of the trajectory integration and the trajectory start location relative to the wave nodes are independent variables in this analysis. Exploring this parameter space reveals that the mild influence of wave advection on the trajectory shape is not affected by these variables. The trajectory details change slightly, but they do not change the qualitative and quantitative conclusion that the addition of wave advection is a mild influence.
In order to make a more direct comparison between the copepod and advection-modified trajectories, a few examples of animal trajectories are isolated and shown in Figure 12. In a qualitative comparison, several of the copepod trajectories in the internal wave treatment show a similar zig-zag-like oscillation pattern to the stagnant density jump trajectories modified with the addition of wave flow advection. Some of these similar trajectories are shown in Figure 12A. However, the superimposed trajectories (Figure 11B) are quite distinct in character compared to the loopy, orbital trajectories exhibited by other copepod specimens in the internal wave treatment (Figures 12B–D). This suggests animal swimming behavior in response to the hydrodynamic sensory cue was a major contributor to the observed copepod motion. In conclusion, whereas some trajectories may be explained by the addition of wave advection, the majority of trajectories clearly cannot be explained by such a simple response.
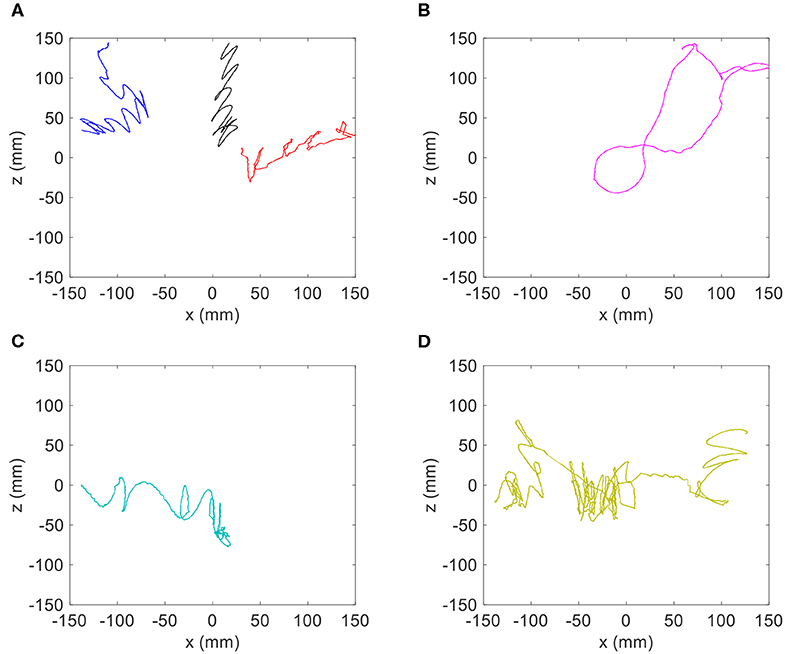
Figure 12. Isolated copepod trajectories for the internal wave treatment with a density jump of 1.0 σt to compare with the theoretical trajectories of passive particles. (A) Samples of trajectories that have a similar zig-zag motion to passive particles with superimposed horizontal velocity, and (B–D) samples of trajectories with loopy, orbital motions.
While the density jump is clearly an important sensory cue (Harder, 1968; Woodson et al., 2005, 2007a,b), the shear strain rate is also a potential hydrodynamic cue to guide copepod behavior. The shear strain rate (Figure 10) shows the maximum value to be at the interface with a peak value of 0.1 s−1. As with the plotted velocity field, there is a strong cyclic temporal variation in the shear strain rate field. The shear strain rate and velocity magnitude are minimum (nearly zero) for phase ϕ = π/4 and at maximum for phase ϕ = 3π/4. To check the consistency with reported internal waves, the wave characteristics reported by Haury et al. (1983) and Greer et al. (2014) were used to estimate the shear strain rates that copepods may encounter in situ. In this case, the internal wave parameters htotal = 80 m, wavelength = 200 m, amplitude = 30 m, and Δρ of 1.0 σt were input into the theoretical internal wave model. The period resulting from these calculations (i.e., 9.2 min) was consistent with that reported in Haury et al. (1983) (i.e., 8–10 min) therefore providing some assurance of the accuracy of the theoretical model characterization. The maximum shear strain rate in the modeled in situ internal wave was 0.015 s−1. This value is roughly 6 times smaller than the maximum shear strain rate in the laboratory arrangement, but it is not radically different in magnitude as one might anticipate from the difference in scales between the laboratory and the ocean. Further, this value is close to the range that copepods have been previously observed to sense and evoke a behavioral response.
The ability of copepods to sense velocity gradients, typically quantified as strain rate, has been extensively documented in recent decades (e.g., Kiørboe et al., 1999). The shear strain rate threshold level to evoke an escape response vary among copepod species ranging from 0.4-26 s−1 (summarized in Woodson et al., 2014), which is much greater than the shear strain rates in the internal wave treatment. However, the reported threshold was much smaller, around 0.025 s−1 for response of A. tonsa and T. longicornis to environmental flow structure (i.e., thin layer shear flow) (Woodson et al., 2005, 2007a,b). The response in this case consisted of excited area-restricted search behavior as part of a cue hierarchy in the search for food. For the current internal wave treatment, copepods experience a shear strain rate field that has peak values in a similar range to the threshold reported by Woodson et al. (2005), Woodson et al. (2007a), and Woodson et al. (2007b). The internal wave treatment also was different from the thin layer treatment because the flow is dynamic and time varying including periods in which the shear strain rate is below the sensory threshold (Figure 10). Nevertheless, the results here suggest a substantial animal behavior contribution to the trajectory shape and the shear strain rate values are consistent with the previously reported threshold to evoke excited area-restricted search behavior suggesting that it may be an important sensory cue.
8. Conclusions
A laboratory-scale internal wave apparatus was used to create a standing internal wave for various physical arrangements that mimic conditions observed in the field. This experimental design was motivated by the objective to understand the biophysical forcing in zooplankton transport in and near internal waves, where high levels of zooplankton densities have been observed. The third-order finite-amplitude solution of a standing internal wave inside a two-layer stratification system guided the selection of the operating parameters for the independent variables controlling the wave motion. A boundary value problem was setup assuming incompressible and irrotational flow. A series of boundary conditions, including bottom, kinetic, and dynamic conditions at the interface between the two layers and the free surface, was applied. The analysis yielded the dispersion relationship between the seiching mode and the wave angular frequency. The internal wave was targeted in the apparatus that correspond to density jump of 1.0 σt, seiching mode of 8, and wave period of 24.27 s (i.e., 0.041 Hz). Signal processing of the interface location revealed that the laboratory generated frequency matched accurately the target frequency from the theoretical analysis.
The zooplankton behavioral assays with a mixed population of marine copepods A. tonsa, T. longicornis, and E. affinis were conducted in control (stagnant homogeneous fluid), stagnant density jump interface, and internal wave flow treatments. The results from tracking their swimming trajectories revealed that the animals reacted to the stagnant density jump interface by showing a preferential horizontal motion parallel to the interface. In the internal wave treatment, the copepods showed an acrobatic, orbital-like motion in and around the internal wave region (bounded by the crests and troughs of the waves). Significant differences in the morphology of the trajectories are quantified by the NGDR, fractal dimension, and turn frequency.
The influence of passive advection is investigated by superimposing advection due to the wave motion on the trajectories observed in the stagnant density jump treatment. The results show only mild changes to the trajectories both visually and quantitatively. A few of the modified trajectories showed zig-zag-like oscillation patterns that are consistent with some trajectories of copepods in the internal wave treatment. However, the majority of the trajectories in the internal wave treatment were characterized as loopy, orbital shapes in the region near the internal wave interface. Therefore, although the response of a few copepods to the internal wave interface could be explained by the addition of flow advection, the swimming patterns for other copepods is more complicated. The conclusion is that copepod behavior response is a key contributor to the observed trajectories in and around the internal wave.
Data Availability Statement
All datasets generated for this study are included in the article/supplementary material.
Author Contributions
DW and SJ designed the study. SJ performed the experiments and processed the physical and behavioral data. KH and MM performed the theoretical wave analysis. MM and DW analyzed the data and wrote the manuscript. All authors approved the final manuscript.
Funding
This research was partially funded by the National Science Foundation (OCE-0728238). Additional funding was provided by the Karen and John Huff Chair endowed funds.
Conflict of Interest
The authors declare that the research was conducted in the absence of any commercial or financial relationships that could be construed as a potential conflict of interest.
Acknowledgments
Thanks to Dr. David Fields of the Bigelow Laboratory for Ocean Sciences for collecting and shipping the copepod specimens. Thanks also to Dr. Aaron True for initial design contributions and construction of the tank and to Dr. Jeannette Yen and Dr. Jeff Koseff for helpful discussions and inspiration. A portion of this study was reported in SJ's M.S. Thesis (Jung, 2015).
References
Buskey, E. J. (1984). Swimming pattern as an indicator of the roles of copepod sensory systems in the recognition of food. Mar. Biol. 79, 165–175. doi: 10.1007/BF00951825
Cheriton, O. M., McManus, M. A., Stacey, M. T., and Steinbuck, J. V. (2009). Physical and biological controls on the maintenance and dissipation of a thin phytoplankton layer. Mar. Ecol. Prog. Ser. 378, 55–69. doi: 10.3354/meps07847
Coughlin, D., Strickler, J., and Sanderson, B. (1992). Swimming and search behaviour in clownfish, Amphiprion perideraion, larvae. Anim. Behav. 44, 427–440. doi: 10.1016/0003-3472(92)90053-C
Cowles, T. J. (2004). “Planktonic layers: physical and biological interactions on the small scale,” in Handbook of Scaling Methods in Aquatic Ecology: Measurements, Analysis, Simulation, eds L. Seuront and P. G. Strutton (Boca Raton, FL: CRC Press), 31–49. doi: 10.1201/9780203489550.ch3
Cowles, T. J., Desiderio, R. A., and Carr, M.-E. (1998). Small-scale planktonic structure: persistence and trophic consequences. Oceanography 11, 4–9. doi: 10.5670/oceanog.1998.08
Dean, R. G., and Dalrymple, R. A. (1991). Water Wave Mechanics for Engineers and Scientists, Volume 2, Advanced Series on Ocean Egineering. World Scientific Publishing Company, Singapore. doi: 10.1142/1232
Dekshenieks, M. M., Donaghay, P. L., Sullivan, J. M., Rines, J. E. B., Osborn, T. R., and Twardowski, M. S. (2001). Temporal and spatial occurrence of thin phytoplankton layers in relation to physical processes. Mar. Ecol. Prog. Ser. 223, 61–71. doi: 10.3354/meps223061
Dodson, S. I., Ryan, S., Tollrian, R., and Lampert, W. (1997). Individual swimming behavior of Daphnia: effects of food, light and container size in four clones. J. Plankton Res. 19, 1537–1552. doi: 10.1093/plankt/19.10.1537
Drazin, P. G. (2002). Introduction to Hydrodynamic Stability, Volume 32, Cambridge Texts in Applied Mathematics. New York, NY: Cambridge University Press.
Gallager, S. M., Yamazaki, H., and Davis, C. S. (2004). Contribution of fine-scale vertical structure and swimming behavior to formation of plankton layers on Georges Bank. Mar. Ecol. Prog. Ser. 267, 27–43. doi: 10.3354/meps267027
Garwood, J. C., Lucas, A. J., Naughton, P., Alford, M. H., Roberts, P. L. D., Jaffe, J. S., et al. (2020). A novel cross-shore transport mechanism revealed by subsurface, robotic larval mimics: internal wave deformation of the background velocity field. Limnol. Oceanogr. doi: 10.1002/lno.11400
Greer, A. T., Cowen, R. K., Guigand, C. M., Hare, J. A., and Tang, D. (2014). The role of internal waves in larval fish interactions with potential predators and prey. Prog. Oceanogr. 127, 47–61. doi: 10.1016/j.pocean.2014.05.010
Harder, W. (1968). Reactions of plankton organisms to water stratification. Limnol. Oceanogr. 13, 156–168. doi: 10.4319/lo.1968.13.1.0156
Haury, L. R., Briscoe, M. G., and Orr, M. H. (1979). Tidally generated internal wave packets in Massachusetts Bay. Nature 278, 312–317. doi: 10.1038/278312a0
Haury, L. R., Wiebe, P. H., Orr, M. H., and Briscoe, M. G. (1983). Tidally generated high-frequency internal wave packets and their effects on plankton in Massachusetts Bay. J. Mar. Res. 41, 65–112. doi: 10.1357/002224083788223036
Hedrick, T. L. (2008). Software techniques for two-and three-dimensional kinematic measurements of biological and biomimetic systems. Bioinspir. Biomimet. 3:034001. doi: 10.1088/1748-3182/3/3/034001
Holliday, D. V., Donaghay, P. L., Greenlaw, C. F., McGehee, D. E., McManus, M. M., Sullivan, J. M., et al. (2003). Advances in defining fine- and micro-scale pattern in marine plankton. Aquat. Living Resour. 16, 131–136. doi: 10.1016/S0990-7440(03)00023-8
Hult, E. L., Troy, C. D., and Koseff, J. R. (2009). The breaking of interfacial waves at a submerged bathymetric ridge. J. Fluid Mech. 637, 45–71. doi: 10.1017/S0022112009008040
Jung, S. (2015). Implementation of internal wave apparatus for copepod behavioral assays (Master's thesis). Atlanta, GA: Georgia Institute of Technology.
Kiørboe, T., Saiz, E., and Visser, A. (1999). Hydrodynamic signal perception in the copepod Acartia tonsa. Mar. Ecol. Prog. Ser. 179, 97–111. doi: 10.3354/meps179097
Lennert-Cody, C. E., and Franks, P. J. S. (1999). Plankton patchiness in high-frequency internal waves. Mar. Ecol. Prog. Ser. 186, 59–66. doi: 10.3354/meps186059
Lennert-Cody, C. E., and Franks, P. J. S. (2002). Fluorescence patches in high-frequency internal waves. Mar. Ecol. Prog. Ser. 235, 29–42. doi: 10.3354/meps235029
Macías, D., Somavilla, R., González-Gordillo, J. I., and Echevarría, F. (2010). Physical control of zooplankton distribution at the Strait of Gibraltar during an episode of internal wave generation. Mar. Ecol. Prog. Ser. 408, 79–95. doi: 10.3354/meps08566
Mann, K. H., and Lazier, J. R. N. (1996). Dynamics of Marine Ecosystems: Biological-physical Interactions in the Oceans, 2nd Edn. Malden, MA: Blackwell Publishing Ltd.
McManus, M. A., Alldredge, A. L., Barnard, A. H., Boss, E., Case, J. F., Cowles, T. J., et al. (2003). Characteristics, distribution and persistence of thin layers over a 48 hour period. Mar. Ecol. Prog. Ser. 261, 1–19. doi: 10.3354/meps261001
McManus, M. A., Cheriton, O. M., Drake, P. T., Holliday, D. V., Storlazzi, C. D., Donaghay, P. L., et al. (2005). Effects of physical processes on structure and transport of thin zooplankton layers in the coastal ocean. Mar. Ecol. Prog. Ser. 301, 199–215. doi: 10.3354/meps301199
Orr, M. H., and Mignerey, P. C. (2003). Nonlinear internal waves in the South China Sea: observation of the conversion of depression internal waves to elevation internal waves. J. Geophys. Res. Oceans 108:3064. doi: 10.1029/2001JC001163
Rinke, K., Hübner, I., Petzoldt, T., Rolinski, S., König-Rinke, M., Post, J., et al. (2007). How internal waves influence the vertical distribution of zooplankton. Freshw. Biol. 52, 137–144. doi: 10.1111/j.1365-2427.2006.01687.x
Scotti, A., and Pineda, J. (2007). Plankton accumulation and transport in propagating nonlinear internal fronts. J. Mar. Res. 65, 117–145. doi: 10.1357/002224007780388702
Seuront, L., Brewer, M. C., and Strickler, J. R. (2004). “Quantifying zooplankton swimming behavior: the question of scale,” in Handbook of Scaling Methods in Aquatic Ecology: Measurement, Analysis, Simulation, eds L. Seuront and P. G. Strutton (Boca Raton, FL: CRC Press), 333359. doi: 10.1201/9780203489550.ch22
Sevadjian, J. C., McManus, M. A., Ryan, J., Greer, A. T., Cowen, R. K., and Woodson, C. B. (2014). Across-shore variability in plankton layering and abundance associated with physical forcing in Monterey Bay, California. Continent. Shelf Res. 72, 138–151. doi: 10.1016/j.csr.2013.09.018
Thorpe, S. A. (1999). On the breaking of internal waves in the ocean. J. Phys. Oceanogr. 29, 2433–2441. doi: 10.1175/1520-0485(1999)029<2433:OTBOIW>2.0.CO;2
Tiselius, P. (1992). Behavior of Acartia tonsa in patchy food environments. Limnol. Oceanogr. 37, 1640–1651. doi: 10.4319/lo.1992.37.8.1640
Troy, C. D., and Koseff, J. R. (2005). The instability and breaking of long internal waves. J. Fluid Mech. 543, 107–136. doi: 10.1017/S0022112005006798
True, A. C., Webster, D. R., Weissburg, M. J., and Yen, J. (2018). Copepod avoidance of thin chemical layers of harmful algal compounds. Limnol. Oceanogr. 63, 1041–1055. doi: 10.1002/lno.10752
Umeyama, M. (2000). Third-order Stokes internal waves for a density-stratified two-layer fluid. Mem. Graduate Schl. Eng. Tokyo Metropolit. Univers. 50, 120–136.
Umeyama, M. (2002). Experimental and theoretical analyses of internal waves of finite amplitude. J. Waterway Port Coast. Ocean Eng. 128, 133–141. doi: 10.1061/(ASCE)0733-950X(2002)128:3(133)
Uttieri, M., Zambianchi, E., Strickler, J. R., and Mazzocchi, M. G. (2005). Fractal characterization of three-dimensional zooplankton swimming trajectories. Ecol. Modell. 185, 51–63. doi: 10.1016/j.ecolmodel.2004.11.015
Van Haren, H. (2014). Internal wave-zooplankton interactions in the Alboran Sea (W-Mediterranean). J. Plankton Res. 36, 1124–1134. doi: 10.1093/plankt/fbu031
Velo-Suárez, L., Fernand, L., Gentien, P., and Reguera, B. (2010). Hydrodynamic conditions associated with the formation, maintenance and dissipation of a phytoplankton thin layer in a coastal upwelling system. Continent. Shelf Res. 30, 193–202. doi: 10.1016/j.csr.2009.11.002
Woodson, C. B., Webster, D. R., and True, A. C. (2014). “Copepod behavior: oceanographic cues, distributions and trophic interactions,” in Copepods: Diversity, Habitat and Behavior (Hauppauge, NY: Nova Publishers), 215–253.
Woodson, C. B., Webster, D. R., Weissburg, M. J., and Yen, J. (2005). Response of copepods to physical gradients associated with structure in the ocean. Limnol. Oceanogr. 50, 1552–1564. doi: 10.4319/lo.2005.50.5.1552
Woodson, C. B., Webster, D. R., Weissburg, M. J., and Yen, J. (2007a). Cue hierarchy and foraging in calanoid copepods: ecological implications of oceanographic structure. Mar. Ecol. Prog. Ser. 330, 163–177. doi: 10.3354/meps330163
Keywords: internal wave, copepod, density stratification, behavior assay, wave dispersion relationship
Citation: Mohaghar M, Jung S, Haas KA and Webster DR (2020) Copepod Behavior Responses Around Internal Waves. Front. Mar. Sci. 7:331. doi: 10.3389/fmars.2020.00331
Received: 09 January 2020; Accepted: 22 April 2020;
Published: 21 May 2020.
Edited by:
Houshuo Jiang, Woods Hole Oceanographic Institution, United StatesReviewed by:
François-Gaël Michalec, UMR5502 Institut de Mecanique des Fluides de Toulouse (IMFT), FranceJessica Garwood, Rutgers, The State University of New Jersey, United States
Copyright © 2020 Mohaghar, Jung, Haas and Webster. This is an open-access article distributed under the terms of the Creative Commons Attribution License (CC BY). The use, distribution or reproduction in other forums is permitted, provided the original author(s) and the copyright owner(s) are credited and that the original publication in this journal is cited, in accordance with accepted academic practice. No use, distribution or reproduction is permitted which does not comply with these terms.
*Correspondence: Donald R. Webster, ZHdlYnN0ZXJAY2UuZ2F0ZWNoLmVkdQ==
 Mohammad Mohaghar
 Seongyu Jung
 Kevin A. Haas
 Donald R. Webster