 Ling-Li Liu
 Jin Sun2†
 Chandramouli Kondethimmanahalli
 Pei-Yuan Qian
- 1Shaanxi Key Laboratory of Natural Products & Chemical Biology, College of Chemistry & Pharmacy, Northwest A&F University, Shaanxi, China
- 2Department of Ocean Science and Hong Kong Branch of the Southern Marine Science and Engineering Guangdong Laboratory (Guangzhou), The Hong Kong University of Science and Technology, HongKong, China
- 3College of Life Sciences and Oceanography, Shenzhen University, Shenzhen, China
- 4Institute of Deep-sea Science and Engineering, Chinese Academy of Sciences, Sanya, China
Citreamicin ε is a group of antitumor compounds produced by Streptomyces species. Cytotoxicology study of two diastereomers, citreamicin ε A and B, showed different apoptotic effects on PtK2 cells with IC50 (half-maximal inhibitory concentration) values of 0.086 and 0.025 μM, respectively. Thus, we performed an iTRAQ (isobaric tags for relative and absolute quantitation)–based quantitative proteomic analysis to reveal the mechanism of cytotoxicity of citreamicin ε A and B in PtK2 cells. A total of 1,079 proteins were identified and quantified, among which 103 and 94 proteins displayed significant changes in expression levels after the treatment of citreamicin ε A and B, respectively. These significantly differentially expressed proteins (DEPs) were further annotated by Gene Ontology, Kyoto Encyclopedia of Genes and Genomes, and protein–protein interaction analysis, which revealed the involvement of eight molecular pathways. Among them, expression trends of proteins involved in the nuclear transcription factor κB (NF-κB) pathway displayed the opposite between the two diastereomer treatments, indicating different modes of action of these two compounds. Citreamicin ε A treatment induced rapid activation of the NF-κB pathway, which might promote cell survival and resulted in lower toxicity. Our comparative proteomic analysis provided molecular evidence on the toxicity of two diastereomers compounds to cells, which may shed new light on future mechanism study of these antitumor compounds.
Introduction
Marine natural products play an important role in modern drug development (Gerwick and Moore, 2012; Khalifa et al., 2019). Citreamicins that are a group of polyketide compounds produced by Streptomyces species have been patented as potential candidates for anticancer drug discovery (Peoples et al., 2009). Virtually all of the citreamicins exhibited toxicity against mammalian cells. Besides, most of the citreamicins displayed inhibitory activity against the Gram-positive bacteria, including multidrug-resistant Staphylococcus aureus and vancomycin-resistant Enterococcus faecalis (Carter et al., 1990; Qadri et al., 1992; Peoples et al., 2008). The potent biological activity and the structural complexity of citreamicins also captured the attention of the chemical synthesis study (Blumberg and Martin, 2017, 2018). Citreamicin ε as one of the most potent members of the family possessed a basic chemical structure of seven condensed rings, including six polycyclic aromatic rings and an oxazolidone ring with two chiral centers. The previous bioactivity study of the citreamicins was almost based on the optical mixture compounds (Hopp et al., 2008).
The stereochemical study of marine natural products is particularly challenging, due to the complex structures and the small amount of compounds obtained from natural sources (Blunt et al., 2009). As stereoisomers may vary greatly in biological activities, the study of the relationship between the biological activities and the stereoisomers has fundamental scientific significance (Morrissey et al., 1996; Davies and Teng, 2003; Peng et al., 2018). Single enantiomers dominate the United States prescription drugs market. Among the top five selling drugs, three are single stereoisomers (Lindsley, 2013). To date, the growth in single stereoisomer products has produced several blockbuster compounds such as Pfizer’s atorvastatin and sertraline. Such stereoisomers often differ in biological activities and pharmacokinetic profiles, and the use of such mixtures may result in adverse effects of the drug particularly if they are associated with the inactive or less active isomer (Hutt and O’Grady, 1996). Because the binding of a compound to a biomolecular receptor in the body is the first and critical step to initiate pharmacological effects (Lin et al., 2011), differential binding affinities of different stereoisomers with the target enzymes can lead to their different bioactivities (Kim et al., 2006). Chiral molecules will certainly play a role in the exploitation of three-dimensional space for the development of new drugs in the future.
We have purified two diastereoisomers of citreamicin ε and studied the mechanism of their cytotoxic activity in our previous work (Liu et al., 2013). Toxicology study revealed that citreamicin ε A and B could cause DNA fragmentation and lead to cell apoptosis via the caspase-3–dependent pathway. The significant increase in reactive oxygen species (ROS) and the down-regulation of Mcl-1 in treated cells indicated the involvement of mitochondria during cell apoptosis.
The global proteomic strategy is a systematic approach to identify and characterize proteins that are responsive to drug treatments in mammalian cells. Proteomic profiling can be used to identify proteins that mediate various biological processes (Aebersold and Mann, 2003; Hondermarck, 2004). Recent studies have used proteomic screening to monitor the binding of small molecules to their potential target enzymes, offering valuable insights into the toxicological mechanism or the mode of action of next-generation therapeutics (Reker and Malmström, 2012). Proteomics can also increase the predictability of early drug development and identify non-invasive biomarkers of toxicity or efficacy (Kennedy, 2002; Poel et al., 2019). Because many physiological functions are regulated by protein complexes and therefore mostly rely on protein–protein interactions (PPIs), the more data on differential protein expression are available, the more we can understand about the regulated pathways involved in the biological process (Ruffner et al., 2007; Alexiou et al., 2017). For instance, the PPI network analysis plays as a powerful tool to get critical information from tons of proteins (Stanyon, 2005; Balashova et al., 2012; Scott et al., 2016). Among all the proteomic techniques, the isobaric tags for relative and absolute quantitation (iTRAQ) technology have gained great popularity in quantitative proteomics applications because of its high sensitivity in the detection of proteins in low concentrations, good sample capacity, accurate quantitation, and reproducibility (Ross et al., 2004).
In the present study, we used the epidemic cell line PtK2 as our experimental model to gain insights into the toxicological mechanisms underlying the different cellular responses of two diastereoisomers—citreamicin ε A and B. A comparative proteomic analysis of both PtK2 cells that were exposed to citreamicin ε A and B was conducted with iTRAQ method coupled with two-dimensional liquid chromatography–tandem mass spectrometry. We identified the differentially expressed proteins between the compound-treated and untreated cells at different time points.
Materials and Methods
Cell Culture and Cytotoxic Activity Assay
PtK2 cells were obtained from American Type Culture Collection (ATCC, Manassas, VA, United States) and cultured in Dulbecco modified eagle medium with L-glutamine, 1.37 g/L sodium bicarbonate, 10% fetal bovine serum, and 0.3% antibiotic and antimycotic solution [10,000 U/mL penicillin G. sodium; 10,000 μg/mL streptomycin sulfate, and 25 μg/mL amphotericin B in 0.85% saline (Gibco)] at 37°C in 5% CO2 in incubators. The cytotoxicity of citreamicins was assessed by a tetrazolium-based colorimetric [3-(4,5-dimethylthiazol-2-yl)-2,5-diphenyltetrazolium bromide (MTT)] assay (Liu et al., 2013). Briefly, cells were seeded in 96-well plates at a density of 1 × 10⁴ cells/well and incubated overnight. The media were changed with fresh media containing various concentrations of citreamicin ε A and B, and incubated for 48 h. Cells treated with dimethyl sulfoxide (DMSO) were used as a negative control. At the end of incubation, the media were entirely removed, and 20 μL of the dye MTT was added to each well with additional incubated for 4 h at 37°C. Then 100 μL of DMSO was added to each well. After 20 min, the absorbance of each well was measured at 570 nm (Thermo Scientific Multiskan FC Multiplate Photometer, Waltham, MA, United States). Three independent experiments were performed. IC50 value (half-maximal inhibitory concentration) was calculated by the Logit method (Finney, 1978).
Cell Treatment, Protein Extraction, and Purification
PtK2 cells were seeded in plate 12 h before the treatment with 0.1 μM citreamicin ε A or B for 6, 12, and 24 h. Dimethyl sulfoxide (vehicle control) was used as a negative control. Cells were harvested and lysed in lysis buffer (8 M urea and 40 mM HEPES, pH 7.4) on ice, followed by centrifugation at 15,000 × g for 15 min at 4°C. Supernatants containing cytosolic and other cellular proteins were precipitated by the addition of four volumes of cold acetone at −20°C for 2 h, and then the proteins were quantified using the RC-DC kit (Bio-Rad, Hercules, CA, United States). Each treatment sample has three biological replicates.
Trypsin Digestion, iTRAQ Labeling, and Strong Cation Exchange Fractionation
A total of 200 μg of the peptide from each prepared cell lysate sample was reduced with 5 mM triscarboxyethyl phosphine hydrochloride at 60°C for 1 h and alkylated with 10 mM methylethanethiosulfonate at room temperature for 20 min (Han et al., 2013). Each sample was then digested overnight at 37°C with sequencing-grade trypsin (Promega, Madison, WI, United States). The protein digests were desalted using Sep-Pak C18 cartridges (Waters Corp., Milford, MA, United States) before being labeled. Two iTRAQ reagents multiplex kits were used to label samples treated with 0.1 μM citreamicin ε A and B, respectively. PtK2 cells treated with DMSO (iTRAQ 114), PtK2 cells treated with citreamicin ε A or B for 6 h (iTRAQ 115), PtK2 cells treated with citreamicin ε A or B for 12 h (iTRAQ 116), and PtK2 cells treated with citreamicin ε A or B for 24 h (iTRAQ 117). The treatment time points and the concentration of the treatment compounds were determined based on the previous TUNEL assay. The labeled peptides were pooled together before analysis. All combined peptide mixture samples were dried using a SpeedVac, followed by reconstituting with 100 μL of buffer A [10 mM KH2PO4, pH 3.0, ACN/H2O 25/75 (vol/vol)] respectively, and then loaded onto a PolySULFOETHYL A strong cation exchange column (200 × 4.6 mm, 200-Å pore size, 5 μm particle size) (PolyLC, Columbia, MD, United States) on a Waters Delta 600 HPLC (Waters Corp.). The samples were fractionated using a gradient of 100% buffer A for 10 min, 0% to 30% buffer B [10 mM KH2PO4, pH 3.0, 500 mM KCl, ACN/H2O 25/75 (vol/vol)] for 25 min, 30% to 100% buffer B for 5 min, and 100% buffer B for 10 min at a flow rate of 1 mL/min for 1 h. A total of 22 fractions were collected and desalted using Sep-Pak C18 cartridges.
Liquid Chromatography–Tandem Mass Spectrometry Analysis
All of the dried peptide fractions were reconstituted in 30 μL 0.1% formic acid, respectively, and then analyzed with a Waters nanoACQUITY UPLC System and a Waters Q-Tof Premier Mass Spectrometer equipped with a nano-electrospray ionization (ESI) source (nanoACQUITY; Waters Corp.). Peptides were separated using buffer A (0.1% formic acid in water) and buffer B (0.1% formic acid in acetonitrile) with a nanoflow gradient from 5% buffer B to 80% buffer B over 110 min at a flow rate of 300 nL/min and then back to the initial gradient of 5% buffer B. For electrospray analysis, the ESI-positive ion mode with a survey scans ranging from m/z 300 to 2,000 was applied.
Protein Identification and Quantification
Peptide identification and quantification were performed using ProteinLynx Global SERVER 2.2.5 (Waters Corp.). Raw MS/MS data were converted into.pkl files with and without MS/MS deisotoping (Han et al., 2013). The four groups of reporter ions were extracted from the non-deisotoped files, and the respective deisotoped files of the same mass range were replaced by using a python script. The combined files with all fractions in each replicate were merged and submitted to Mascot version 2.3.0 (Matrix Sciences, Ltd., London, United Kingdom) to search against the database, which concatenated real and reversed human sequences (downloaded from IPI, version 3.34, including 69,164 protein sequences). Trypsin was selected as enzyme for digestion; cysteine carbamidomethyl was selected as a fixed modification, and methionine oxidation was selected variable modification. The search criteria were 30 ppm for the precursor and 0.5 Da for the fragments. Up to one missed trypsin cleavage was permitted. Data with ion scores lower than 95% of confidence level were removed. The false discovery rate was dynamically controlled as 1% in each replicate. The normalization parameter in this study was the median. A protein with a significant change in expression level was defined from both the Mascot and also beyond the fold range of 0.77 and 1.3, which corresponded to 95% confidence level calculated based on analyzing the variations among technical replicates. The protein ratios in each replicate were quantified based on the summed intensities of the matched spectrum, and one protein had to be quantified by at least two spectra from any of the three replicates. These ratios were then further log2-transformed, which were then evaluated using a Student t test followed by Benjamini–Hochberg correction. A protein with corrected P < 0.05 was considered to be significantly differentially expressed. The fold change limit was set so that 95% of the proteins for each protein score fell within the designated range. All of the raw data about the protein identification and quantification have already deposited in PeptideAtlas with the dataset identifier of PASS0148.
Bioinformatics Analysis
Proteins that showed significant changes after the treatment of citreamicin ε A and B were analyzed by DAVID 6.71. Gene Ontology (GO) analysis and the Kyoto Encyclopedia of Genes and Genomes (KEGG) pathway enrichment analysis were both used to determine the functional subcategories and metabolic pathways for DEPs. The cellular interactions between the DEPs were identified using PPI Spider (Antonov et al., 2009)2 and mapped among those experimentally derived proteins based on the collective information retrieved through exhaustive search from these resources. The model D2 indicated that 1 maximal intermediate protein between any two inputs was used. The significantly enriched pathways (P < 0.01) were considered as a seed for protein functional analysis. Cytoscape v 3.6.1 [National Institute of General Medical Sciences (NIGMS), United States] was used to visualize the “.xgmml” network deduced from PPI Spider.
Western Blot Analysis
The PtK2 cells were seeded onto 100-mm Petri dishes 12 h before being treated with 0.1 μM citreamicin ε A and B, respectively. The cells were collected at different time points (6, 12, and 24 h) and lysed in lysis buffer (50 mM Tris-HCl, pH 7.8, 150 mM NaCl, 1% Triton X-100, and protease and phosphatase inhibitors). The lysates (60 μg) were separated using 10% sodium dodecyl sulfate–polyacrylamide gel electrophoresis and then transferred onto a nitrocellulose membrane (Bio-Rad). After blocking with 5% non-fat milk in TBST (Tris-buffered saline with 0.1% Tween-20), the membranes were incubated with the primary antibodies overnight at 4°C or 2 h at room temperature. The membranes were washed with TBST three times with 15-min intervals and subsequently incubated with horseradish peroxidase–conjugated secondary antibody at room temperature for 1 h. After washing with TBST, the membranes were developed using ImmobilonTM Western detection reagents (Millipore, Billerica, MA, United States). The primary antibodies used in the present study included anti–caspase-3 (Santa Cruz Biotechnology, Santa Cruz, CA, United States), anti–nuclear transcription factor κB (NF-κB)/p65 (Anbo Biotechnology, San Francisco, CA, United States), and anti–β-actin (Sigma-Aldrich, St. Louis, MO, United States). The densitometry results of Western blots were quantified as mean ± SD by ImageJ (National Institutes of Health, United States).
Results
Cytotoxic Effect of the Two Diastereomers Citreamicin ε A and B Against PtK2 Cells
The structures of citreamicin ε A and B were determined to be a pair of diastereoisomers with the only difference in position C-19 (Figure 1). Citreamicin ε A showed β-CH3 orientation at C-19, whereas citreamicin ε B displayed α-CH3 orientation. The cytotoxic activity of both diastereoisomers was investigated by MTT method. The concentration- and cell viability–dependent effects of citreamicin ε A and B on normal cell growth are displayed in Figure 2. The IC50 value of citreamicin ε A was calculated to be 0.086 μM, which was three times higher than the IC50 value of citreamicin ε B (0.025 μM). The different cytotoxic effects of these two diastereomers might be related to different modes of action. To determine whether the cytotoxic effect caused by citreamicin ε A and B was related to apoptosis, we performed a TUNEL assay that detected cells undergoing DNA fragmentation. Compared with the cells treated with DMSO, TUNEL-positive cells could be observed in the treatment of citreamicin ε A and B (Supplementary Figure S1). Cells treated with citreamicin ε B displayed more apoptotic cells compared with the treatment of citreamicin ε A, which was consistent with the results in cytotoxic study.
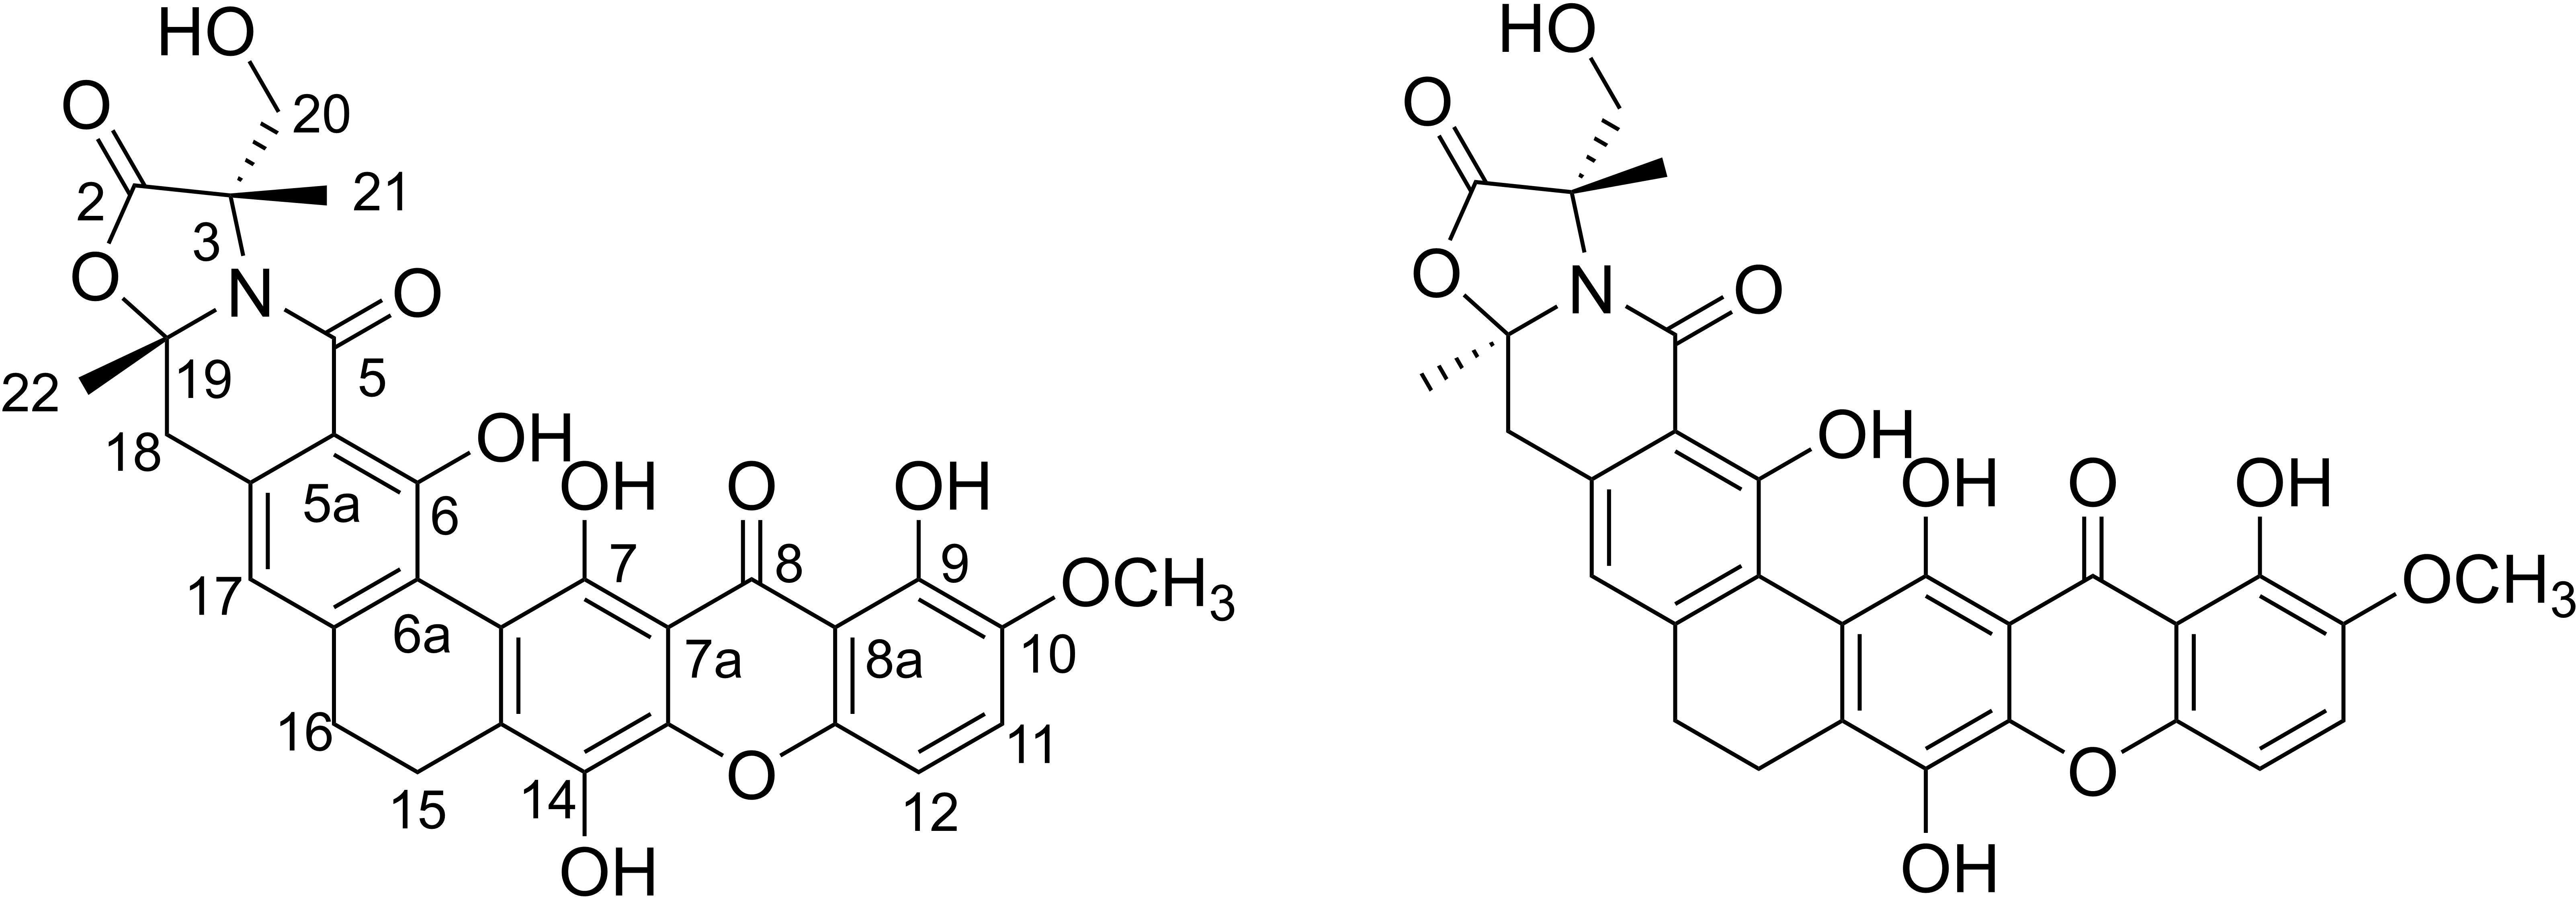
Figure 1. Structures of citreamicin ε A and B.
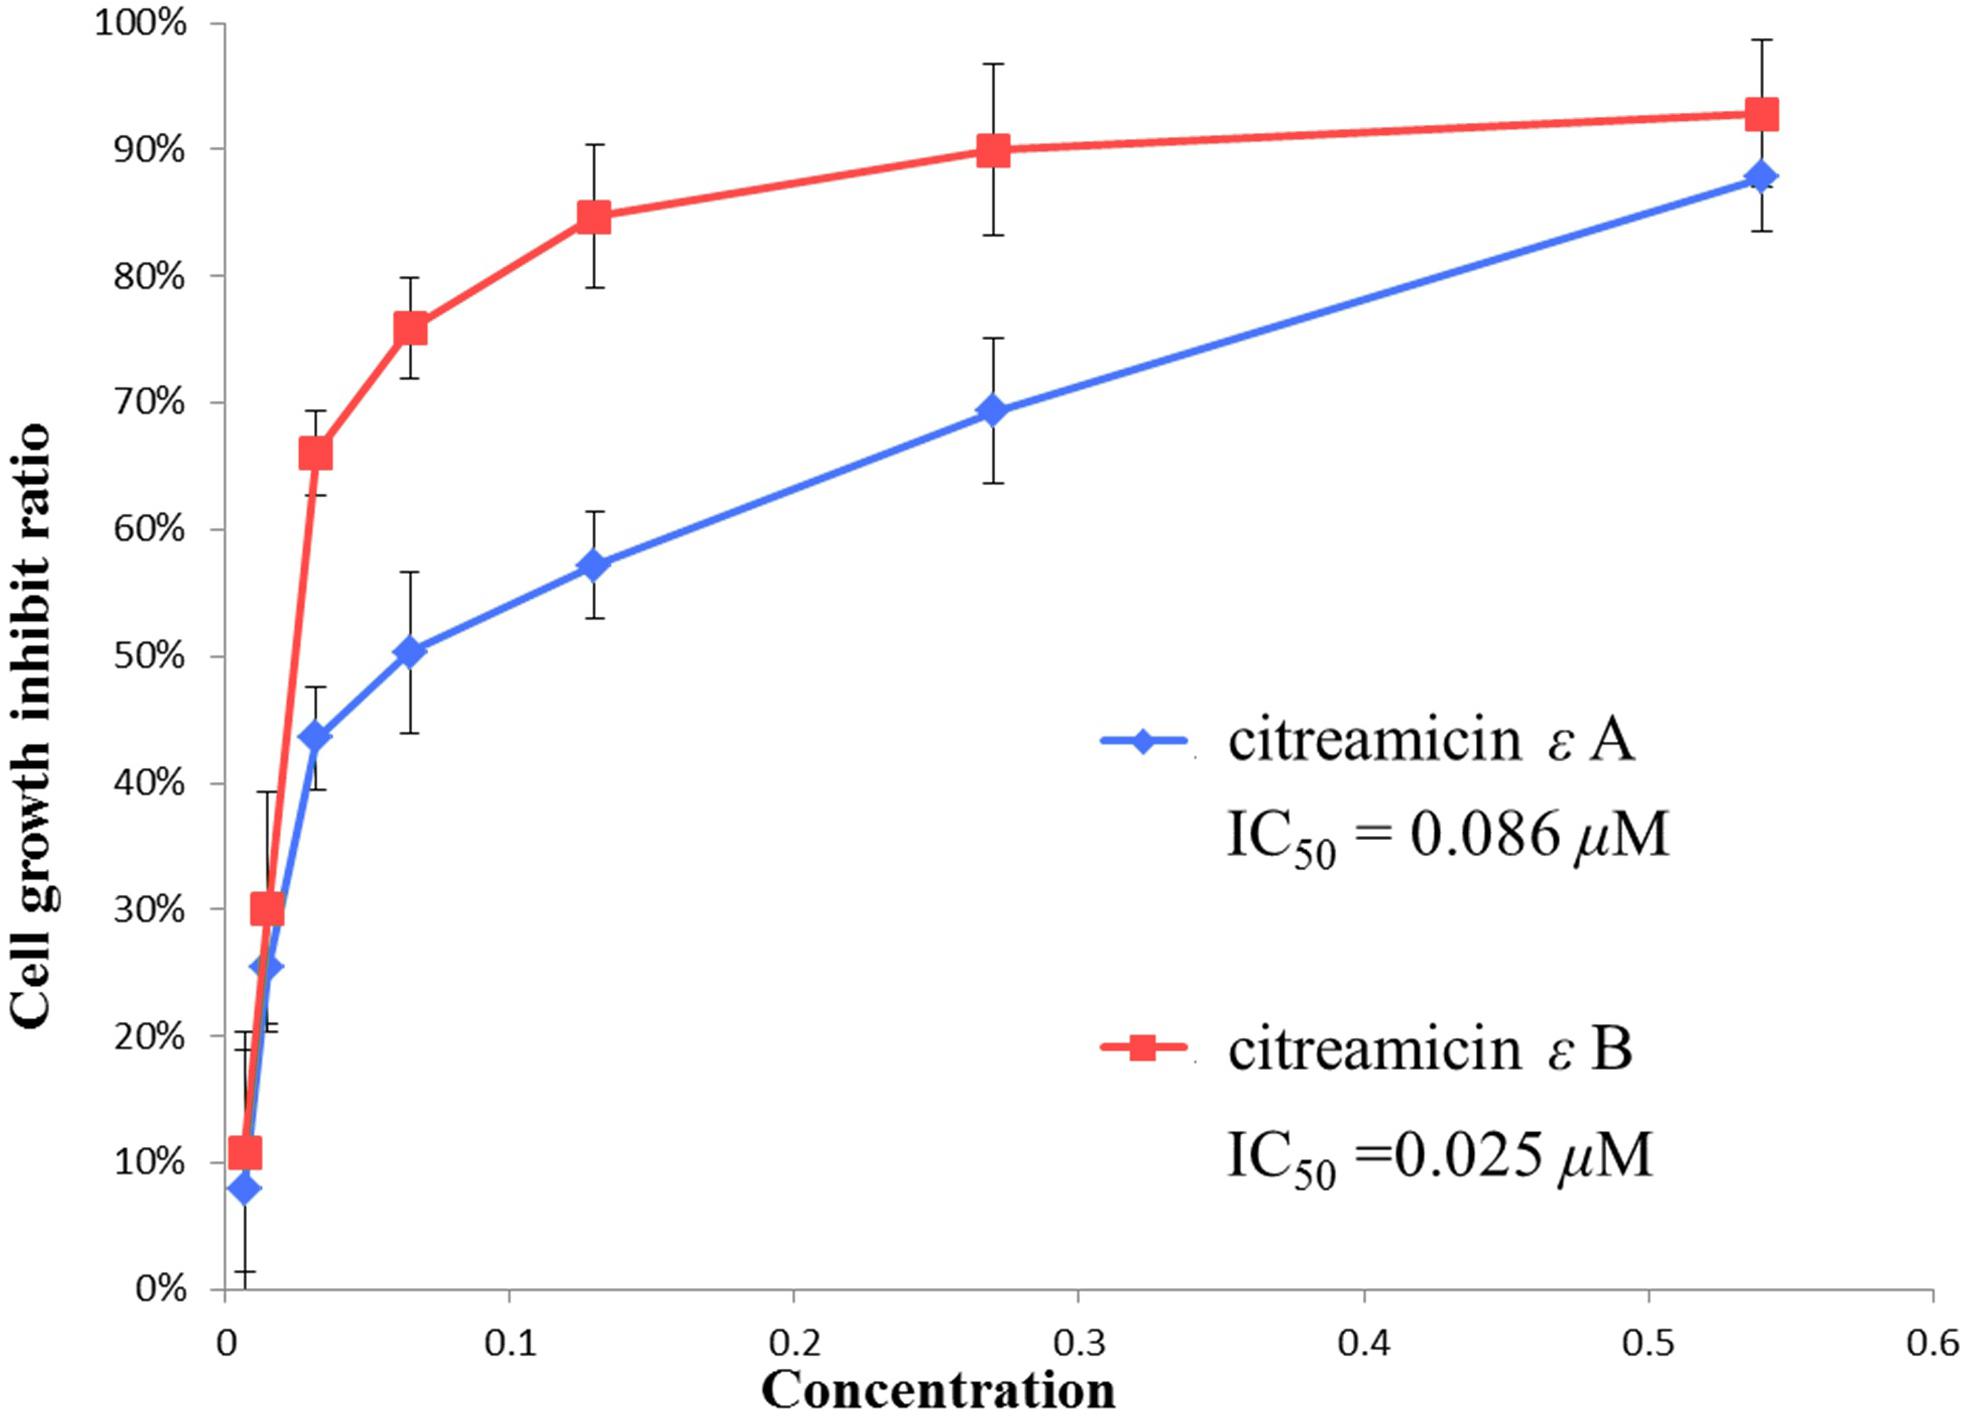
Figure 2. Cytotoxic activity of citreamicin ε A and B against PtK2 cells. Cells were treated with different concentrations of individual diastereoisomers for 48 h. Cell viability was assessed using the MTT method. The data are presented as mean ± SE of three independent experiments.
iTRAQ-Based Proteomic Analysis of Ptk2 Cells in Response to Citreamicin ε A and B
A total of 1,079 proteins have been quantified in both citreamicin ε A and B treatment, after removing the decoy sequences (Supplementary Table S1). These proteins were identified based on more than 45,000 spectra; among them, 6,743 are unique peptides in the citreamicin ε A treatments and 6,746 in the citreamicin ε B treatments. The mean protein sequence coverage of citreamicin ε A and B treatments was 16.0% and 15.9%, respectively (Table 1). To quantify the proteins, the fold change ratio between the control and the treatment was calculated. Hence, in the present study, proteins with the fold changes of ≥ 1.3 or ≤ 0.77 and P < 0.05 in both citreamicin ε A and B treatments were considered as significantly differentially expressed protein (DEPs). The fold change value of 1 representing no change in protein expression levels between treated and the control cells. The heatmap of the changes of all quantified proteins in both citreamicin ε A and B treatment was displayed in Supplementary Figure S2.
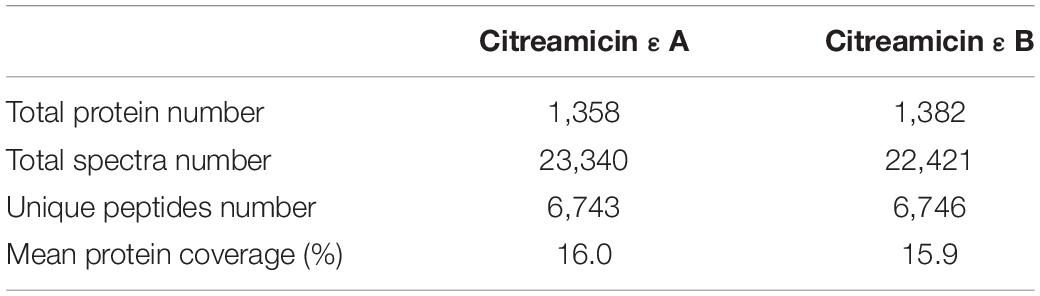
Table 1. General protein and peptides information.
As shown in Figure 3, 53 proteins (15 up-regulated and 38 down-regulated) were found significantly changed in the 6-h treatment of citreamicin ε A, whereas less DEPs (30 proteins including 9 up-regulated and 21 down-regulated) were identified in the 6-h treatment of citreamicin ε B. In the 12-h treatment samples, 38 proteins including 8 up-regulated and 30 down-regulated were found to be DEPs with citreamicin ε A treatment, whereas 64 proteins (21 up-regulated and 43 down-regulated) were identified to be DEPs with citreamicin ε B treatment. Along with the increasing of treatment time, 54 and 43 proteins were found to be DEPs in 24-h treatment samples of citreamicin ε A and B, respectively. In total, the down-regulated proteins were more than the up-regulated in both citreamicin ε A and B treatment in three time points. Of these DEPs, 33 proteins were overlapped in three time points with the treatment of citreamicin ε A, and the corresponding value for citreamicin ε B was 35 (Figures 4A,B). Thus, 103 and 94 proteins were identified to be significantly changed within 24 h of incubation with citreamicin ε A and B, respectively, and only 31 DEPs were overlapped in the two groups (Figure 4C).
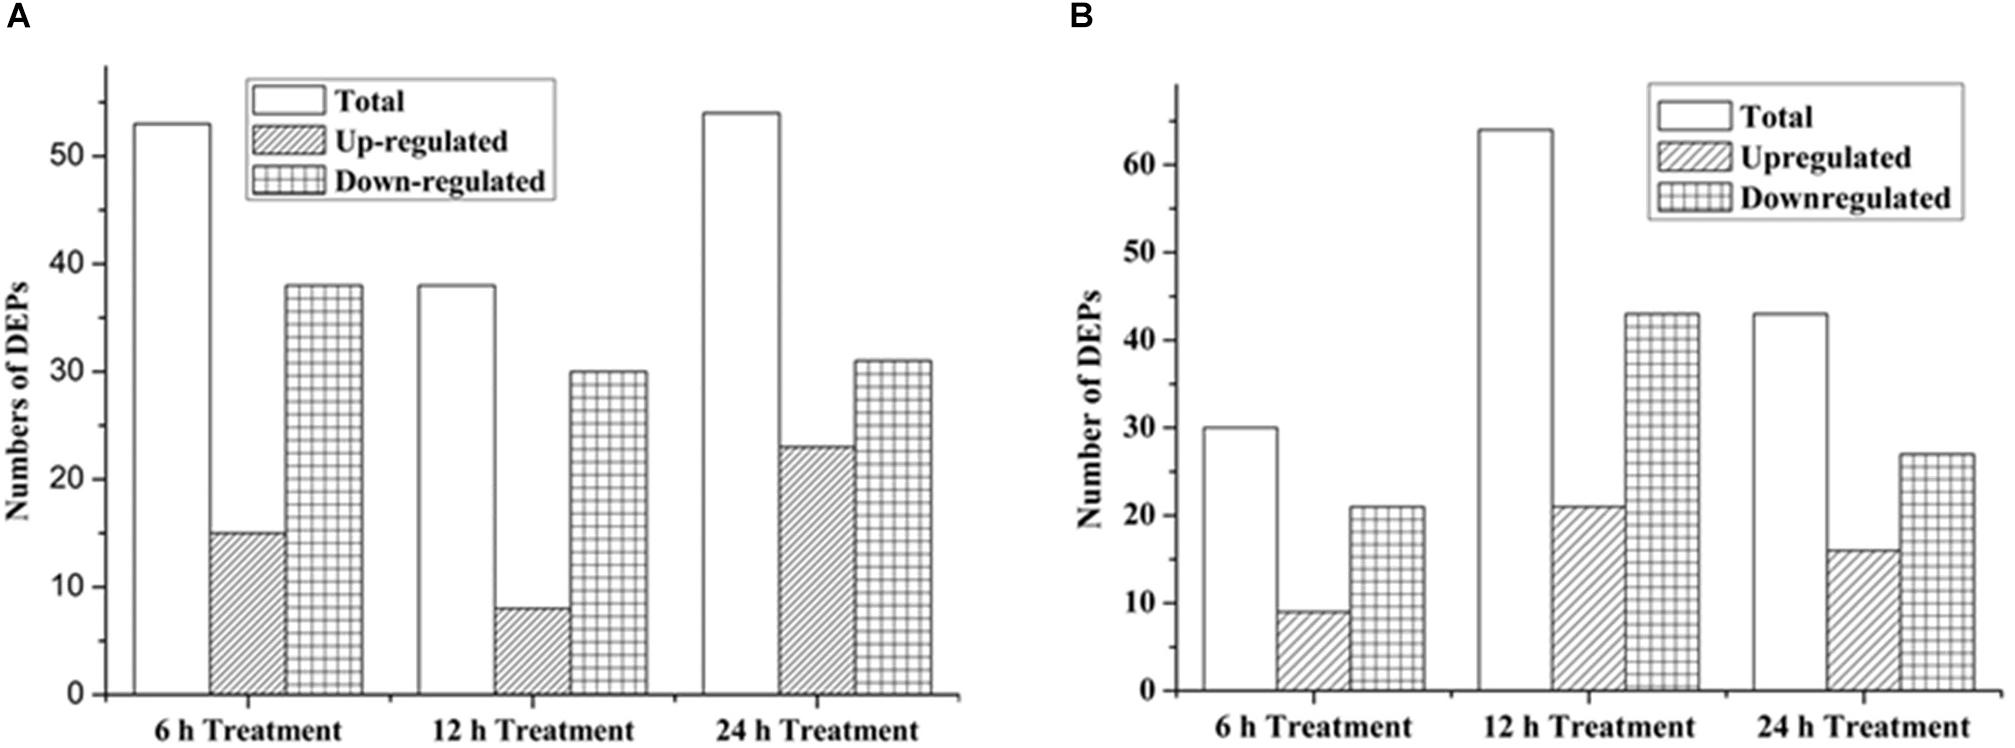
Figure 3. Numbers of significantly DEPs, including the up- and down-regulated proteins in PtK2 cells with the citreamicin ε A (A) and B (B) treatment for 6, 12, and 24 h, respectively.
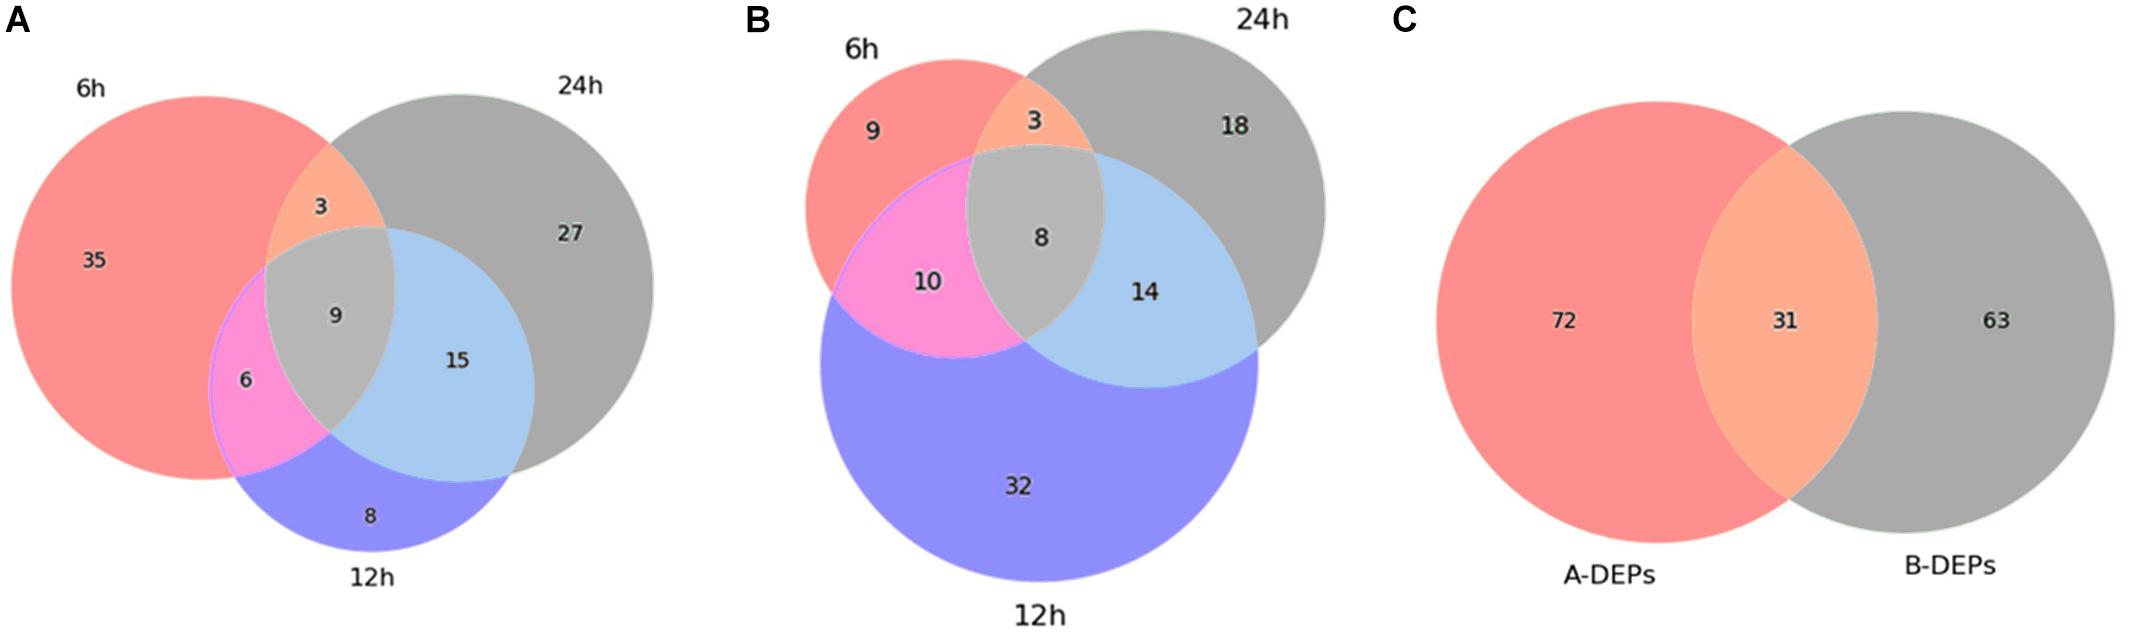
Figure 4. Venn diagrams showing the overlap of the differentially expressed proteins (DEPs) in PtK2 cells with the treatment of citreamicin ε A (A) and B (B) for 6, 12, and 24 h, respectively, and the overlap of the DEPs between citreamicin ε A and B treatment within 24 h (C).
GO Enrichment Analysis of the Identified DEPs
To gain insights into the biological pathways of the DEPs, GO enrichment analysis was done to classify the biological process, molecular function, and cellular component that these proteins were involved in Figure 5. The biological process analysis revealed that the main functional categories were maintenance of location, sequestering of actin monomers, and steroid metabolic process in citreamicin ε A treatment samples and sex differentiation, male sex differentiation, and regulation of inflammatory response in citreamicin ε B treatment. From the result of molecular function analysis, the DEPs in citreamicin ε A treatment were mainly distributed in RNA binding, serine-type endopeptidase inhibitor activity, and cofactor binding. In citreamicin ε B–treated samples, the DEPs were mainly allocated in enzyme inhibitor activity, endopeptidase inhibitor activity, and peptidase inhibitor activity. Some of the molecular functions were characterized in both citreamicin ε A and B treatment. Regarding the cellular component analysis, pigment granule, melanosome, and several of the mitochondrial-related proteins were found in the DEPs in citreamicin ε A–treated samples. The DEPs in citreamicin ε B treatment were mainly related to extracellular space, mitochondrial part, and organelle lumen.
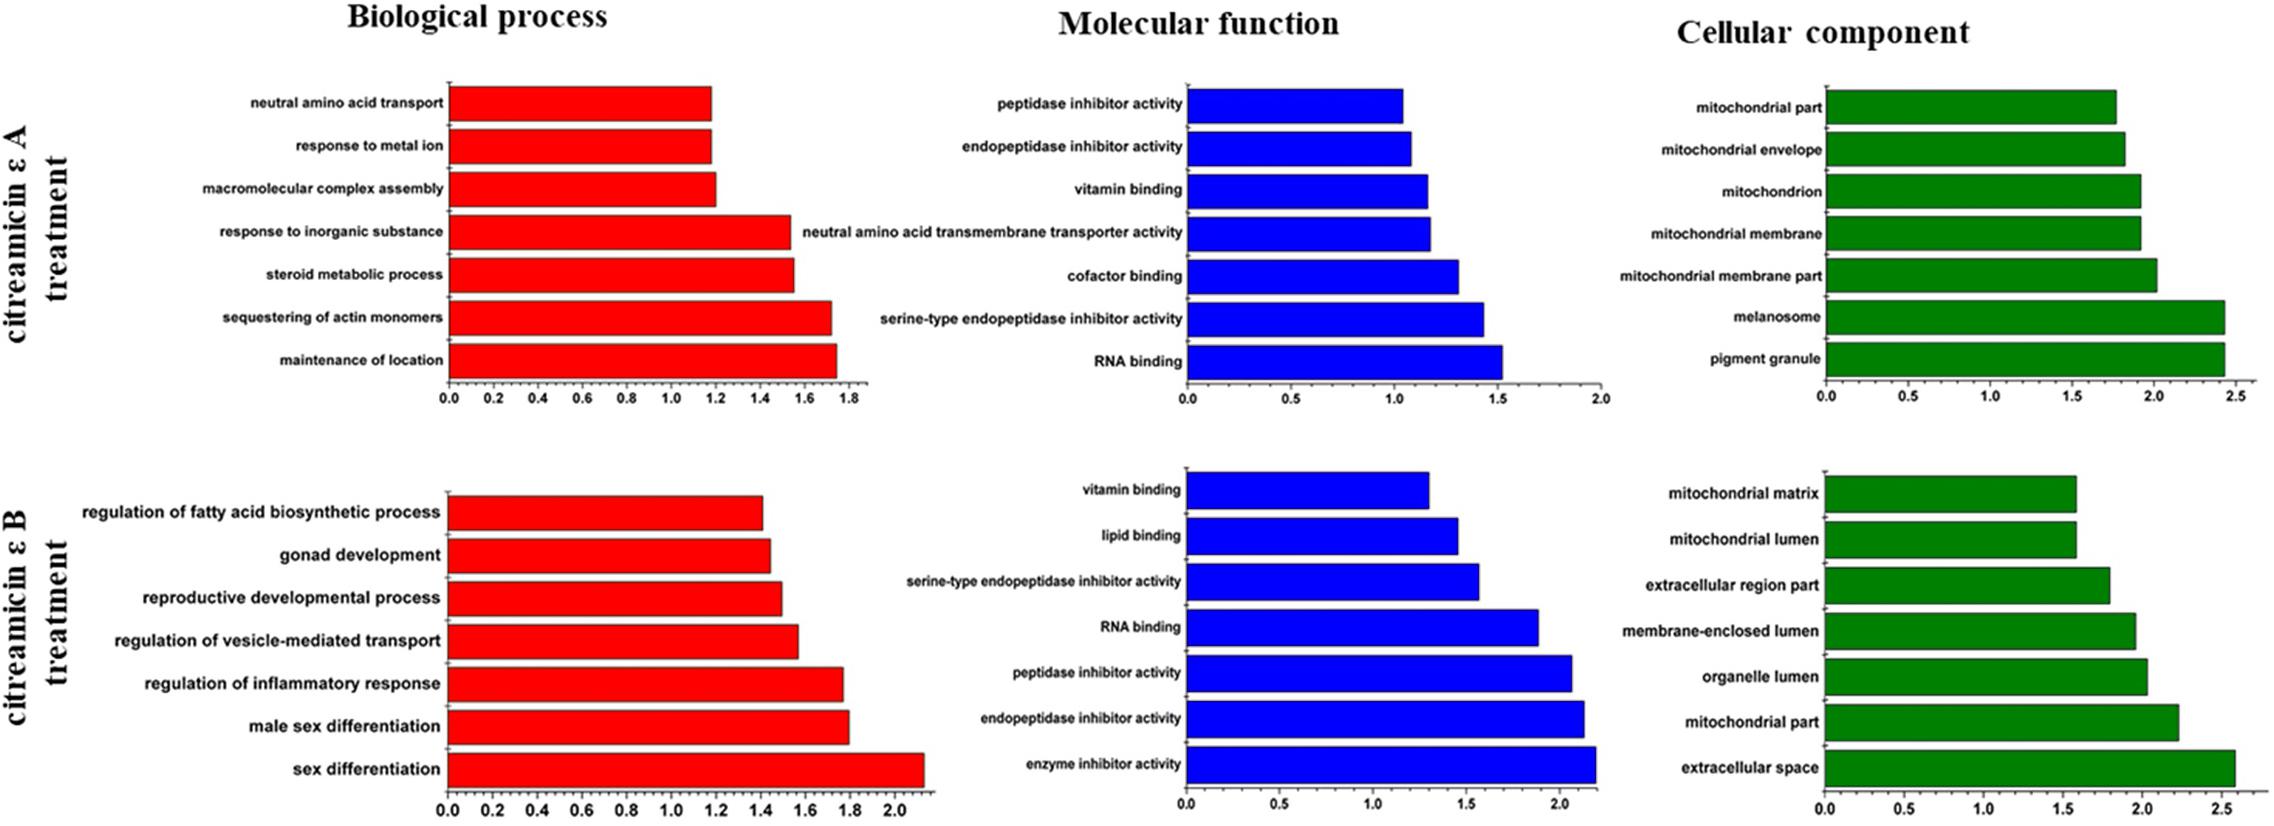
Figure 5. Bioinformatics analysis of differentially expressed proteins (DEPs) in Ptk2 cells treated with citreamicin ε A and B for 24 h through Gene Ontology. The top 7 components for cellular component, biological process, and molecular function of the DEPs are presented along with their enrichment score represented as a P value.
KEGG Pathway Analysis of the DEPs in Both Citreamicin ε A and B Treatment
The biological pathway related to the DEPs in both citreamicin ε A and B treatment was determined by KEGG pathway analysis. The results indicated that seven metabolic pathways, including Huntington disease, Parkinson disease, spliceosome, oxidative phosphorylation, cardiac muscle contraction, ribosome, and Alzheimer disease, were enriched in citreamicin ε A–treated samples. The DEPs in citreamicin ε B treatment were mainly involved in Huntington disease, amyotrophic lateral sclerosis, and Parkinson disease (Table 2). Based on KEGG analysis, the neurodegenerative disease and the inflammation were supposed to involve in both citreamicin ε A and B treatment.
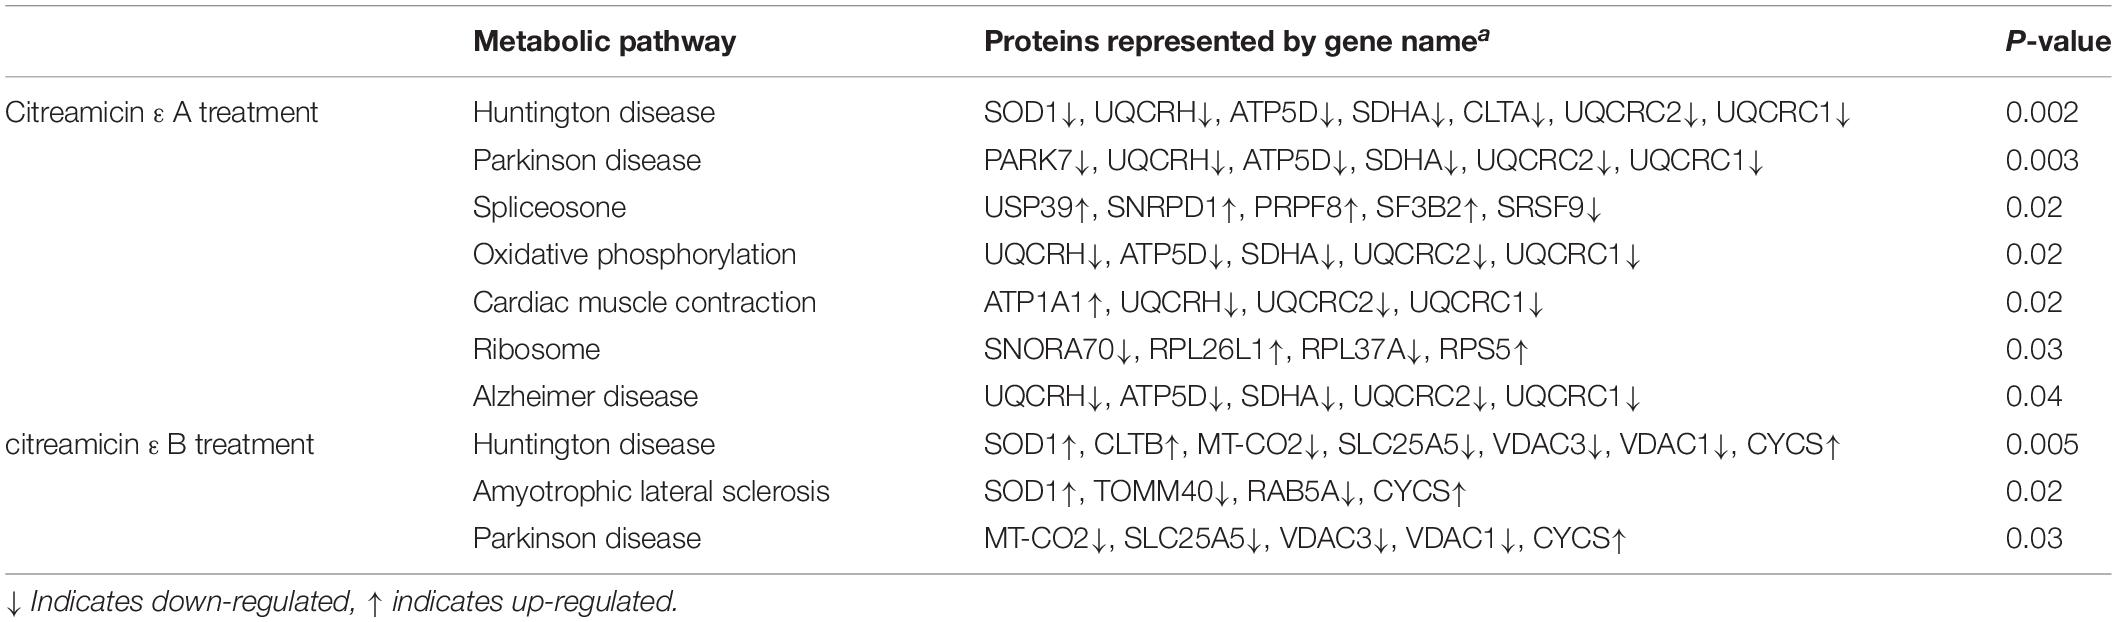
Table 2. Significantly influenced pathways according to KEGG analysis in citreamicin ε A and B treatment.
Protein–Protein Interaction Modeling and Network Analysis of DEPs
PPI Spider was used to transform the two lists of DEPs (Supplementary Tables S2, S3) into a set of networks. The input of 103 DEPs in citreamicin ε A treatment led to an output of 11 enriched pathways. For the citreamicin ε B treatment, the input of 94 DEPs led to the output of 11 enriched pathways. Three pathways, including small GTPase-mediated signal transduction, DNA replication, and positive regulation of IκB-kinase/NF-κB cascade, were enriched in both diastereoisomers treatments (Supplementary Figures S3, S4). When the cells were incubated with citreamicin ε A, neutral amino acid transporter B (0) involved in the NF-κB pathway was highly up-regulated at 6 h and then remained at high levels of expression at 12 and 24 h. However, when the cells were incubated with citreamicin ε B, neutral amino acid transporter B (0) was down-regulated at 6 and 12 h and then was up-regulated at 24 h. The opposite trends of the protein expression in NF-κB pathway between two diastereoisomer-incubated cells possibly implied the involvement of different cytotoxic mechanisms. The down-regulation of cytochrome b-c1 complex subunit indicated the involvement of mitochondria. In addition, the cytochrome c oxidase subunit 2 (COX-2), a protein directly responsible for the initial transfer of electrons from cytochrome c to cytochrome c oxidase (COX) and crucial for the production of ATP during cellular respiration, was significantly down-regulated in citreamicin ε B–incubated cells, whereas there was no significant change in the expression level of COX-2 in citreamicin ε A–incubated cells. Besides, the analysis of iTRAQ-based protein expression revealed that cells incubated with citreamicin ε B showed a highly up-regulated level of cytochrome c. On the contrary, the expression level of cytochrome c showed no statistically significant changes in citreamicin ε A–incubated cells in comparison with that in the control cells.
Expression Levels of NF-κB–Related Proteins
To examine the importance of the NF-κB pathway in the cytotoxicity, two proteins, NF-κB and caspase 3, were examined by Western blot. Citreamicin ε treatment could increase the ROS in cells and then lead to cell apoptosis. IκB kinase/NF-κB cascade is a signaling pathway that can be activated by oxidative stress. Nuclear transcription factor κB contains two subunits (p50 and p65) with different molecular weights. Western blot result showed that after 12 h there was a 30% increase in the level of p65 in citreamicin ε A treatment, but a decline in the level of p65 in the citreamicin ε B treatment. After 24 h, the expression level of p65 started to increase in the cells treated with citreamicin ε B (Figure 6). This trend was consistent with the result of iTRAQ analysis. For the full-length caspase-3, the citreamicin ε A resulted in no significant change in expression in the cells treated for 6 and 12 h, but the level declined for the cells treated for 24 h. On the other hand, the citreamicin ε B treatment caused downregulation of the full-length caspase-3, which was clearly observed in 6 h; the protein expression remained down-regulated at 12 and 24 h.
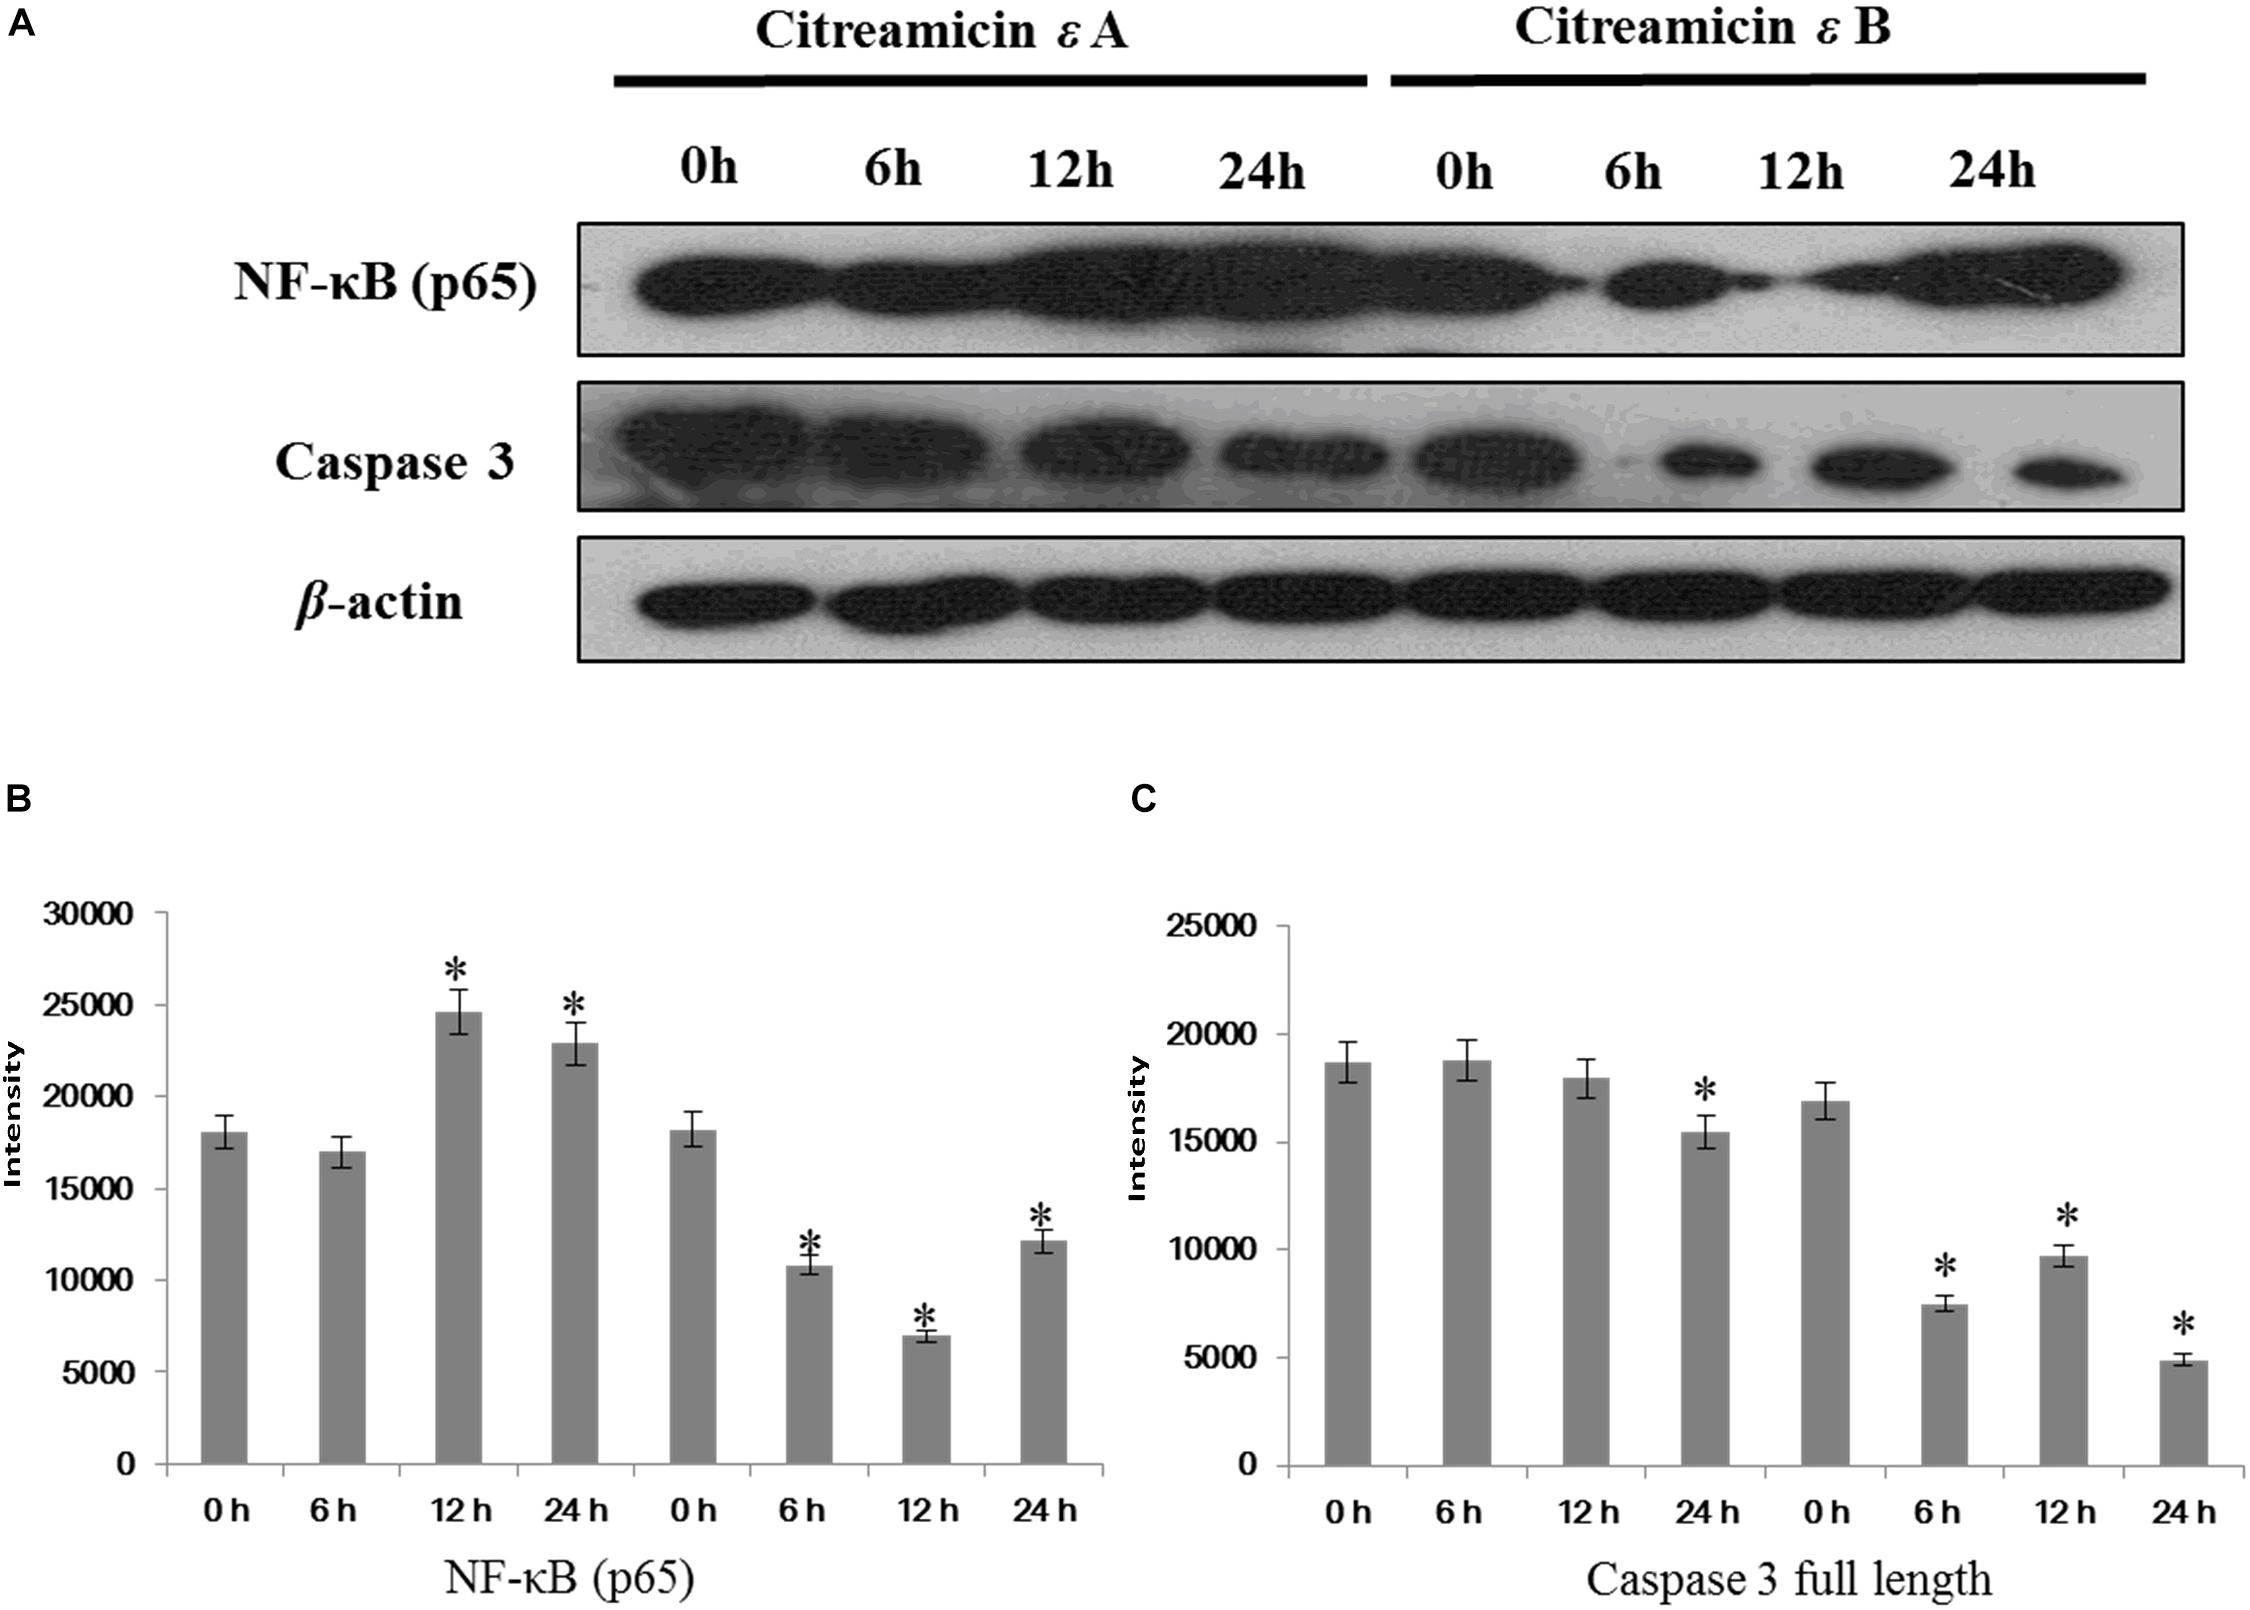
Figure 6. Nuclear transcription factor κB (NF-κB)/p65 activation through citreamicin ε A and B treatment in PtK2 cells. Western blot analysis of NF-κB/p65 and caspase-3 (full length) in PtK2 cells treated with 0.1 μM citreamicin ε A and B for 6, 12, and 24 h. (A) The quantitative of the expression of NF-κB (B), and the quantitative of the expression of caspase 3 full length (C).
Discussion
Citreamicins have been proposed as anticancer and antibacterial agents (Qadri et al., 1992; Hopp et al., 2008). Our previous study showed that citreamicin ε could induce cell apoptosis by triggering the caspase-3–dependent pathways (Liu et al., 2013). There are two common pathways that lead to apoptosis, the extrinsic or death receptor (DR) pathway and the intrinsic or mitochondrial pathway. Reactive oxygen species, which plays an important role in the induction of cell death via intrinsic apoptosis pathway, increased significantly in the cell incubated with citreamicin ε. The elevated intracellular ROS expression indicated an increase in oxidative stress. Mitochondria are both the source and target of oxidative stress. Thus, we assumed the involvement of mitochondria in the cell apoptosis that was induced by citreamicin ε. In addition, the expression level of Mcl-1, belonging to the Bcl-2 family, was down-regulated by the treatment of citreamicin ε. This expression trend provided another piece of evidence for the involvement of mitochondria.
The preliminary structure–activity relationship analysis indicated that the bioactivity of citreamicins might be due to the complementary nature of a five-member heterocyclic ring (Liu et al., 2012). The nitrogen- and oxygen-containing heterocycle in citreamicins has two chiral centers, similar to oxazolines, a class of antibiotics acting as protein synthesis inhibitors (Douglas, 2003; Siddiqui et al., 2018). The two diastereoisomers contain inverse configurations at position 19, with R-configuration in citreamicin ε A and S-configuration in citreamicin ε B. The result of the cytotoxic tests of these two diastereoisomers against the PtK2 cells showed that citreamicin ε B inhibited cell proliferation more quickly than citreamicin ε A. Because the only difference between citreamicin ε A and B is their configuration at position 19, we suspected here that R-configuration in citreamicin ε A triggered certain antiapoptosis pathway to protect cells.
In mammalian cells, a major caspase activation pathway is the cytochrome c–initiated pathway. Cytochrome c is an essential component of the mitochondria electron transfer chain (Vempati et al., 2007). The disruption of electron transport has been recognized as an early feature of cell death (Gottlieb, 2001). The release of cytochrome c from mitochondrial is associated with caspase activation and apoptosis induction (Jiang and Wang, 2004). During intrinsic apoptosis, cytochrome c enters the cytosol and binds to Apaf-1, forming an active complex that recruits caspase-9, and stimulates processing of the inactive caspase-9 to its active form (Srinivasula et al., 1998). The activation of caspase-9 triggers a cascade of caspase events involving the cleavage of caspase-3 and then leads to cell apoptosis (Brentnall et al., 2013). In our study, the expression level of caspase-3 decreased in both the citreamicin ε A and B–incubated cells. However, the down-regulation of caspase-3 in the citreamicin ε B–incubated cells occurred much earlier than that in the citreamicin ε A–incubated cells. These pieces of evidence indicated that citreamicin ε B could induce cell apoptosis via caspase-3–dependent pathway in a shorter incubation time than citreamicin ε A. The proteins related to the electron transport chain are cytochrome b-c1 complex subunits 1, 2, and 6. These proteins are components of the ubiquinol–cytochrome c reductase complexes that mediate the formation of the complex between cytochromes c and c1. The down-regulation of these proteins also indicated the interruption of the mitochondrial respiratory chain.
The extrinsic apoptosis pathway, also named as tumor necrosis factor related apoptosis-inducing ligand (TRAIL)-induced apoptotic pathways, is triggered by the binding of death ligands of the tumor necrosis factor family to their appropriate DRs on the cell surface. Tumor necrosis factor receptor-1 can also activate the mitogen-activated protein (MAP) kinase cascades signaling pathway, which determines the cell fate by regulating apoptosis (Goillot et al., 1997). The MAP kinase (MAPK) signaling pathway consists of MAPK, MAPK kinase (MAPKK), and MAPKK kinase (MAPKKK). MAPKKK phosphorylates and thereby activates MAPKK, and the activation of MAPKK, in turn, phosphorylates and activates MAPK. As an essential enzyme for apoptosis induced by oxidative stress, MAPKKK activates the JNK and p38 pathways by direct phosphorylation and thereby activation of their respective MAPKKs (Ichijo et al., 1997; Declercq et al., 2009). Protein–protein interaction analysis in the present study revealed that the downstream activation of MAPKs included the ribosomal protein L37a (RPL37A), glutamate dehydrogenase 1 (GLUD1), and ribosomal protein L10 (Figure 7). The activation of GLUD1 stimulated the production of ROS and led to the caspase-dependent apoptosis (Ouyang et al., 2012).
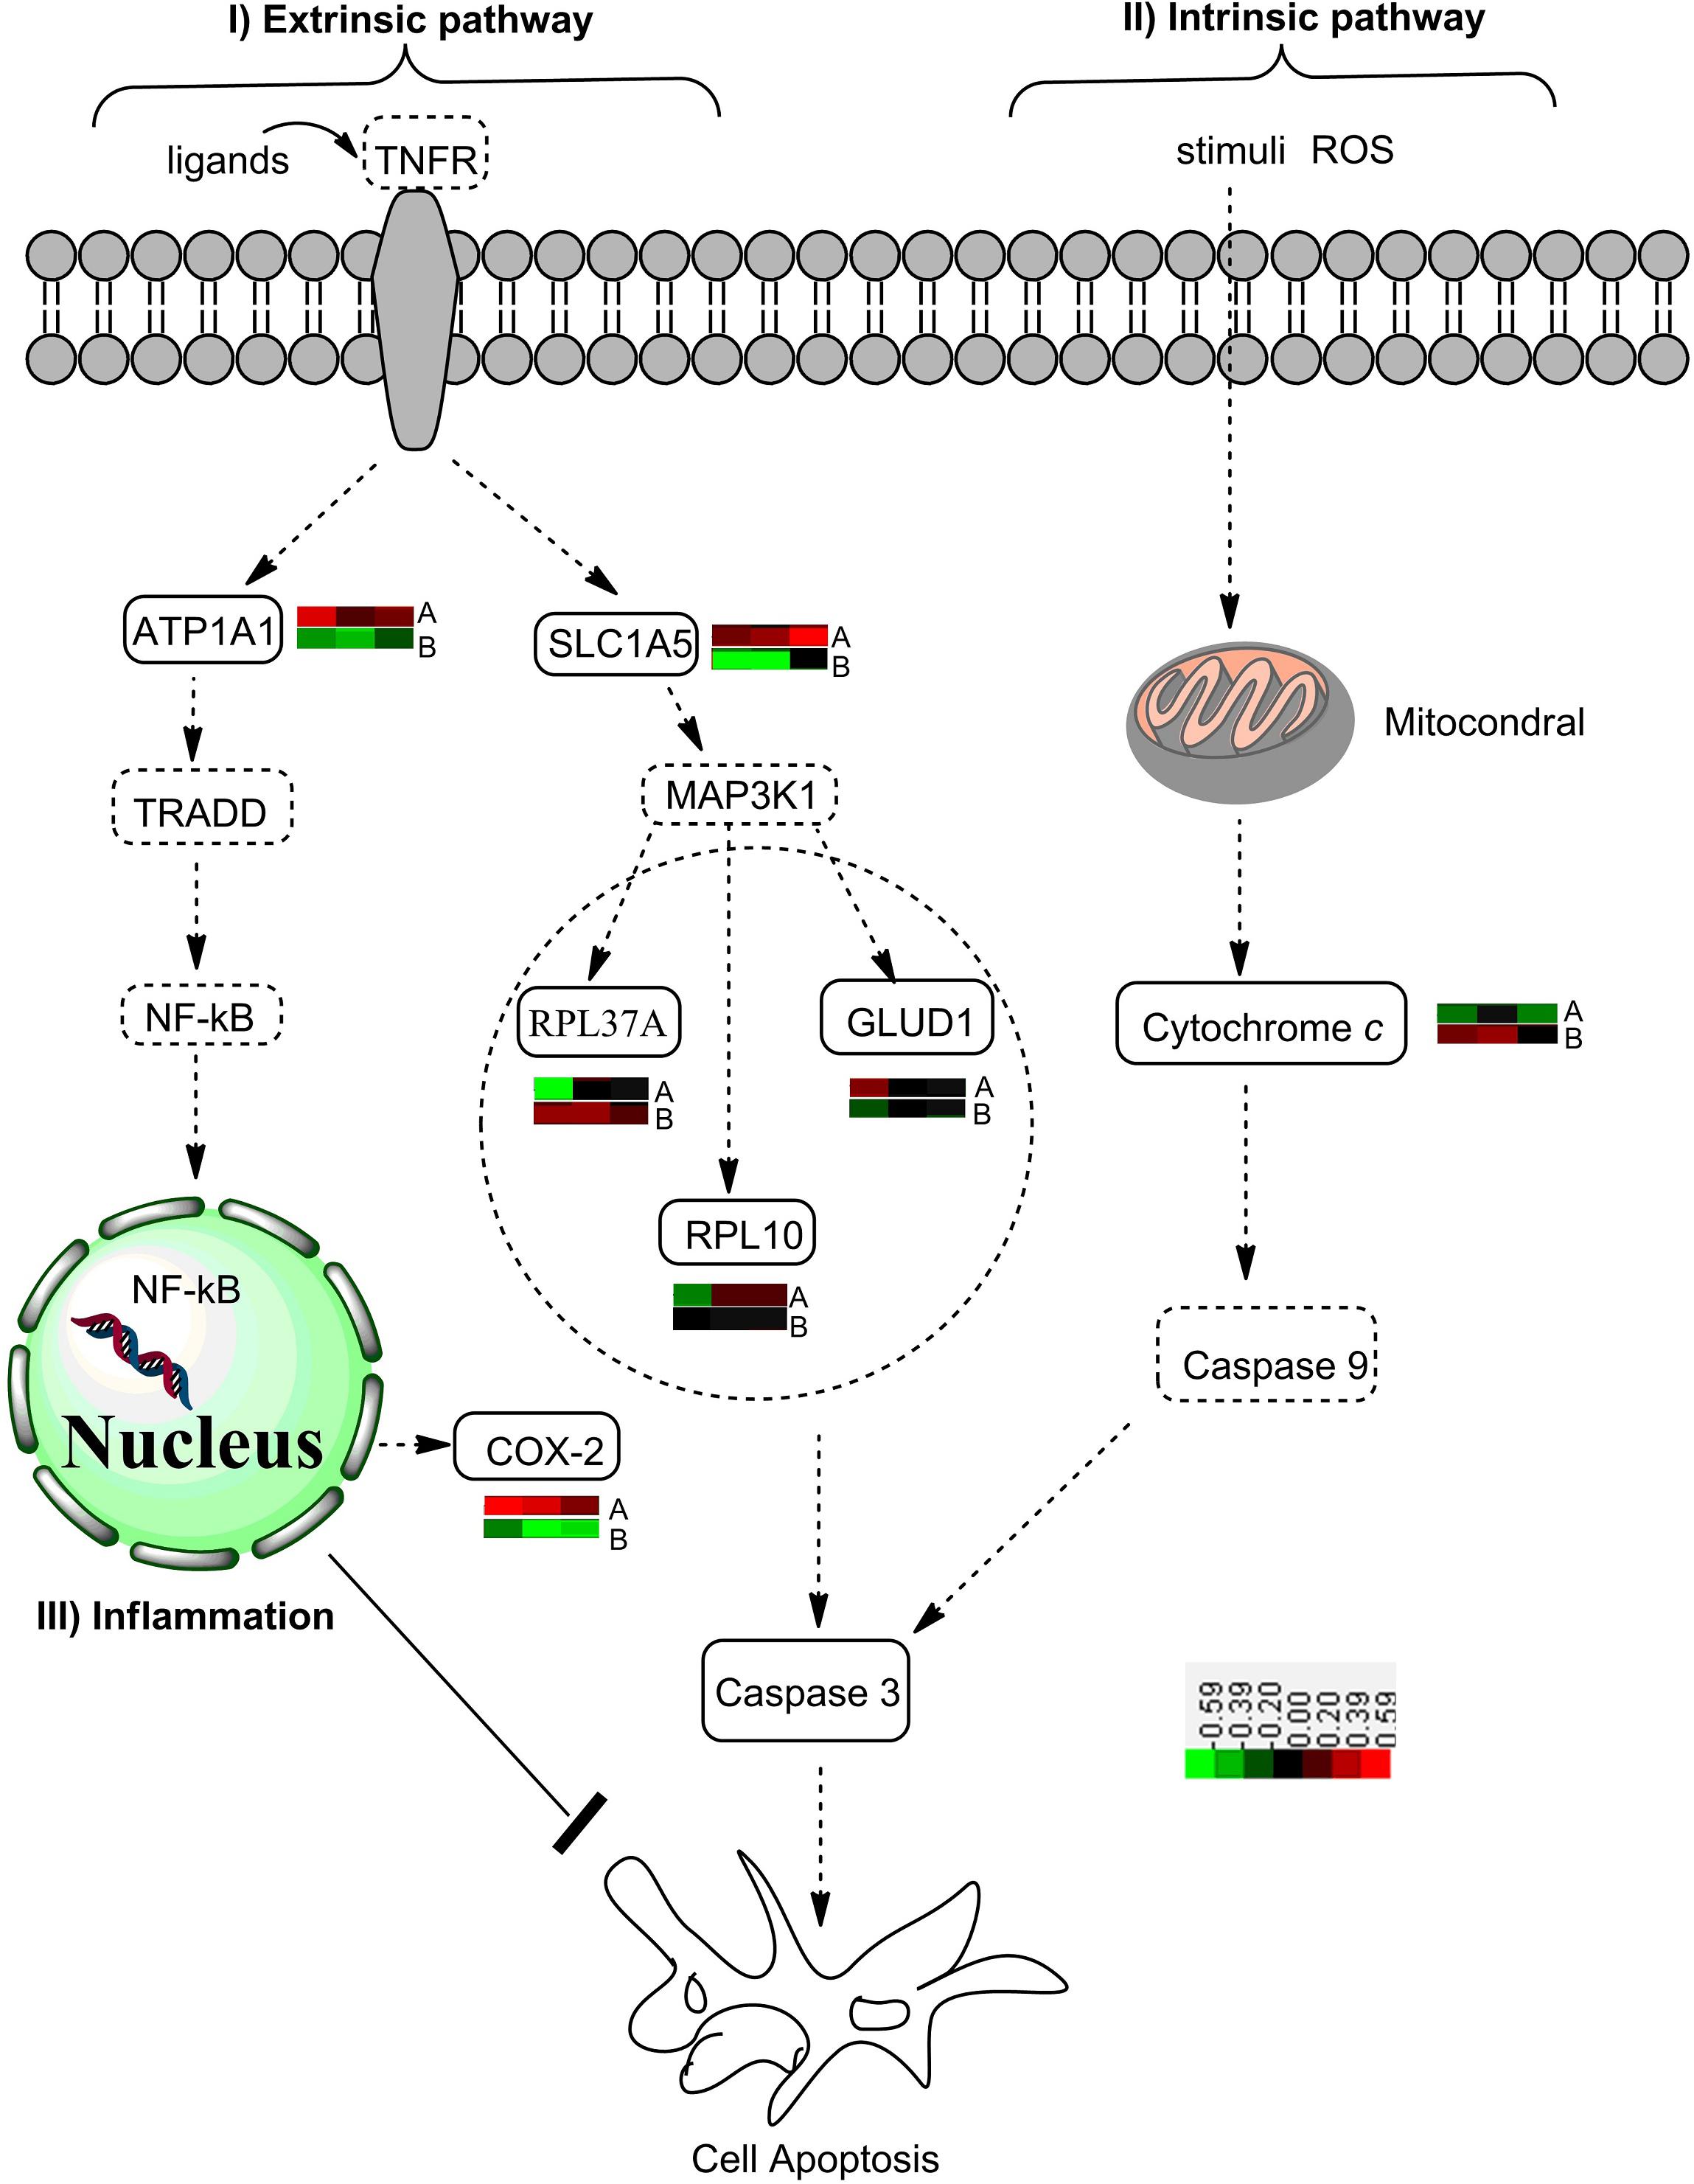
Figure 7. A diagram showing the effects of citreamicin ε A and B on the apoptotic pathway. I The extrinsic pathway includes tumor necrosis factor (TNF) and TNF family ligand receptor. The activation of downstream signaling and the formation of the death-inducing signaling complex are due to the binding of ligands to their respective receptors. Nuclear transcription factor κB is active for entry into the nucleus and rapid transcription of antiapoptotic genes. The failure to activate NF-κB promotes ASK1/MAPKKK activation, which triggers cell apoptosis. ASK1, apoptosis, signal-regulating kinase 1; MAPKKK, mitogen-activated protein (MAP) kinase; NF-κB, nuclear transcription factor κB. II Intrinsic pathway is triggered by various apoptotic stimuli (e.g., ROS), which mediate the permeabilization of the mitochondrial outer membrane and the release of proapoptotic proteins such as cytochrome c. Within the cytosol, cytochrome c forms the apoptosome complex to active procaspase-9. The activation of caspase-3 catalyzed by caspase-9 executes the final steps of apoptosis. III The increased NF-κB activity is linked to increased COX-2 expression and synergistically activates transcription of the inflammatory cytokines. The overexpression of COX-2 inhibits apoptosis in epithelial cell models. COX-2, cyclooxygenase 2. : proteins enriched by PPI Spider; : proteins detected by MSMS. The color bar indicates the protein expression level. Red: up-regulated, black: no change; green: down-regulated.
Recently, there has been increasing evidence supporting the regulatory role of NF-κB antiapoptotic gene expression and the promotion of cell survival (He et al., 2013; Huang et al., 2013). Nuclear transcription factor κB, which is composed of homodimers and heterodimers of several subunits, regulates the expression of a large number of genes that are associated with cellular transformation and oncogenesis (Beg and Baltimore, 1996). Nuclear transcription factor κB is a redox-sensitive transcription factor that has been considered to be the sensor for oxidative stress (Wooten, 1999). Our Western blot results showed a significant up-regulation of NF-κB/p65 in the cells treated with citreamicin ε A at 6 h to 24 h. In contrast, the expression level of NF-κB/p65 was down-regulated in the cells treated with citreamicin ε B at 6 and 12 h. As mentioned above, the MTT results showed that citreamicin ε B was more toxic than citreamicin ε A. The lower toxicity of citreamicin ε A might be due to the rapid activation of the NF-κB signal pathway that can somehow protect cells from apoptosis (Figure 7).
Our PPI analysis showed that several significantly changed proteins after the treatment of citreamicin ε were involved in signal transport pathways, including small GTPase-mediated signal transduction and IκB-kinase/NF-κB cascade. ADP-ribosylation factor-like protein 3 (Arl3) is a small GTP-binding proteins involved in membrane-associated vesicular and intracellular trafficking processes (Brown et al., 1993). The absence of Arl3 is associated with abnormal epithelial cell proliferation and cyst formation (Schrick et al., 2006). Two other enzymes are involved in the pathways that are related to the drug response. One of them, which was up-regulated in citreamicin ε A–incubated cells and down-regulated in citreamicin ε B–incubated cells, is isoform long sodium/potassium-transporting ATPase subunit α1, which belongs to the family of P-type cation transport ATPases. This protein is responsible for establishing and maintaining the electrochemical gradients of Na+ and K+ ions across the plasma membrane (Zhou et al., 2006). The other enzyme is protein DJ-1 that acts as a redox-sensitive chaperone and protects cells against oxidative stress and cell death. Although the function of DJ-1 is unknown, loss-of-function mutations of this protein can cause early-onset Parkinson disease (Canet-Avilés et al., 2004). The down-regulation of protein DJ-1 observed in the present study may thus partially contribute to the toxicity of citreamicin ε.
Conclusion
In the present study, we demonstrated that the iTRAQ-based quantitative proteomics was an effective approach to study the cytotoxicity of citreamicins. Proteins with different expression levels in PtK2 cells after treatment with individual diastereoisomers of citreamicin ε were identified and quantified. Citreamicin ε induced cell apoptosis and activated the NF-κB pathway. Compared with the citreamicin ε B–incubated cells, the activation of NF-κB pathway was relatively faster in citreamicin ε A–incubated cells. Because of the rapid activation of NF-κB pathway, citreamicin ε A showed lower toxicity than citreamicin ε B.
Data Availability Statement
The datasets generated for this study can be found in the PeptideAtlas Repository under accession number PASS01484 (http://www.peptideatlas.org/PASS/PASS01484).
Author Contributions
L-LL, JS, and P-YQ designed the study. L-LL and JS carried out the sampling and did iTRAQ labeling. L-LL, JS, and CK analyzed the MS data. YX and L-SH carried out the Western Blot analysis. All authors contributed to the writing of the manuscript.
Funding
This work was supported by a grant from Hong Kong Branch of Southern Marine Science and Engineering Guangdong Laboratory (Guangdong) (SMSEGL20SC01) and Southern Marine Science and Engineering Guangdong Laboratory (Guangzhou) (GML2019ZD0409).
Conflict of Interest
The authors declare that the research was conducted in the absence of any commercial or financial relationships that could be construed as a potential conflict of interest.
Acknowledgments
The authors would like to express their gratitude to Ms. Lisa Soo for technical support and Dr. Jianbang Zhao in College of Information Engineering, Northwest A&F University, Shaanxi, People’s Republic of China for discussion and comments on the bioinformatics analysis.
Supplementary Material
The Supplementary Material for this article can be found online at: https://www.frontiersin.org/articles/10.3389/fmars.2020.00228/full#supplementary-material
Footnotes
References
Alexiou, A., Vairaktarakis, C., Tsiamis, V., and Ghulam, A. (2017). Protein-protein interaction (PPI) network: recent advances in drug discovery. Curr. Drug Metab. 18, 5–10. doi: 10.2174/138920021801170119204832
Antonov, A. V., Dietmann, S., Rodchenkov, I., and Mewes, H. W. (2009). PPI Spider: a tool for the interpretation of proteomics data in the context of protein–protein interaction networks. Proteomics 9, 2740–2749. doi: 10.1002/pmic.200800612
Balashova, E. E., Dashtiev, M. I., and Lokhov, P. G. (2012). Proteomic footprinting of drug-treated cancer cells as a measure of cellular vaccine efficacy for the prevention of cancer recurrence. Mol. Cell. Proteomics 11, 1–7.
Beg, A. A., and Baltimore, D. (1996). An essential role for NF-kappaB in preventing TNF-alpha-induced cell death. Science 274, 782–784. doi: 10.1126/science.274.5288.782
Blumberg, S., and Martin, S. F. (2017). Synthesis of the pentacyclic core of citreamicin η. Org. Lett. 19, 790–793. doi: 10.1021/acs.orglett.6b03760
Blumberg, S., and Martin, S. F. (2018). Toward the total synthesis of citreamicin η: synthesis of the pentacyclic core and GAB-ring annelation model studies. Tetrahedron 74, 4981–4993. doi: 10.1016/j.tet.2018.04.049
Blunt, J. W., Copp, B. R., Hu, W. P., Munro, M. H. G., Northcote, P. T., and Prinsep, M. R. (2009). Marine natural products. Nat. Prod. Rep. 26, 170–244.
Brentnall, M., Rodriguez-Menocal, L., De Guevara, R. L., Cepero, E., and Boise, L. H. (2013). Caspase-9, caspase-3 and caspase-7 have distinct roles during intrinsic apoptosis. BMC Cell Boil. 14:32. doi: 10.1186/1471-2121-14-32
Brown, H. A., Gutowski, S., Moomaw, C. R., Slaughter, C., and Sternwels, P. C. (1993). ADP-ribosylation factor, a small GTP-dependent regulatory protein, stimulates phospholipase D activity. Cell 75, 1137–1144. doi: 10.1016/0092-8674(93)90323-i
Canet-Avilés, R. M., Wilson, M. A., Miller, D. W., Ahmad, R., McLendon, C., Bandyopadhyay, S., et al. (2004). The Parkinson’s disease protein DJ-1 is neuroprotective due to cysteine-sulfinic acid -driven mitochondrial localization. Proc. Natl. Acad. Sci. U.S.A. 101, 9103–9108. doi: 10.1073/pnas.0402959101
Carter, G., Nietsche, J. A., Williams, D. R., and Borders, D. B. (1990). Citreamicins, novel antibiotics from Micromonospora citrea: isolation, characterization, and structure determination. J. Antibiot. 43, 504–512. doi: 10.7164/antibiotics.43.504
Davies, N. M., and Teng, X. W. (2003). Importance of chirality in drug therapy and pharmacy practice: Implications for psychiatry. Adv. Pharm. 1, 242–252.
Declercq, W., Vanden Berghe, T., and Vandenabeele, P. (2009). RIP kinases at the crossroads of cell death and survival. Cell 138, 229–232. doi: 10.1016/j.cell.2009.07.006
Douglas, K. H. (2003). Oxazolidinone antibacterial agents: a critical review. Curr. Top. Med. Chem. 3, 1021–1042. doi: 10.2174/1568026033452195
Finney, D. J. (1978). Statistical Method in Biological Assay, 3rd Edn, New York, NY: MacMillan Publishing.
Gerwick, W., and Moore, B. (2012). Lessons from the past and charting the future of marine natural products drug discovery and chemical biology. Chem. Biol. 19, 85–98. doi: 10.1016/j.chembiol.2011.12.014
Goillot, E., Raingeaud, J., Ranger, A., Tepper, R. I., Davis, R. J., and Harlow, E. (1997). Mitogen-activated protein kinase-mediated fas apoptotic signaling pathway. Proc. Natl. Acad. Sci. U.S.A. 94, 3302–3307. doi: 10.1073/pnas.94.7.3302
Han, Z., Sun, J., Zhang, Y., He, F., Xu, Y., and Qian, P. Y. (2013). iTRAQ-based proteomic profiling of the barnacle balanus amphitrite in response to the antifouling compound meleagrin. J. Proteome Res. 12, 2090–2100. doi: 10.1021/pr301083e
He, H., Zang, L. H., Feng, Y. S., Chen, L. X., Kang, N., and Ikejima, T. (2013). Physalin A induces apoptosis via p53-Noxa-mediated ROS generation, and autophagy plays a protective role against apoptosis through p38-NF-κB survival pathway in A375-S2 cells. J. Ethnopharmacol. 148, 544–555.
Hondermarck, H. (2004). Proteomics: Biomedical And Pharmaceutical Applications. Dordrecht: Springer.
Hopp, D. C., Milanowski, D. J., Rhea, J., Jacobsen, D., Rabenstein, J., Smith, C., et al. (2008). Citreamicins with potent Gram-positive activity. J. Nat. Prod. 71, 2032–2035. doi: 10.1021/np800503z
Huang, J., Hu, X., Feng, L., Fukudome, S., Zheng, Y., and Lin, J. (2013). BDNF promotes the survival of rat sensory epithelial cells via the PI3K/Akt and NF-κB/Bcl-2 signaling pathways. Open Neurosci. J. 7, 19–27. doi: 10.2174/1874082001307010019
Hutt, A. J., and O’Grady, J. (1996). Drug chirality: a consideration of the significance of the stereochemistry of antimicrobial agents. J. Antimicrob. Chemother. 37, 7–32. doi: 10.1093/jac/37.1.7
Ichijo, H., Nishida, E., Irie, K., ten Dijke, P., Saitoh, M., and Gotoh, Y. (1997). Induction of apoptosis by ASK1, a mammalian MAPKKK that activates SAPK/JNK and p38 signaling pathways. Science 275, 90–94. doi: 10.1126/science.275.5296.90
Kennedy, S. (2002). The role of proteomics in toxicology: identification of biomarkers of toxicity by protein expression analysis. Biomarkers 7, 269–290. doi: 10.1080/13547500210127318
Khalifa, S. A. M., Elias, N., Farag, M. A., Chen, L., Saeed, A., and El-Seedi, H. R. (2019). Marine natural products: a source of novel anticancer drugs. Mar. Drugs 17, 491. doi: 10.3390/md17090491
Kim, D., Hong, S. I., and Lee, D. S. (2006). Binding of fidarestat stereoisomers with aldose reductase. Int. J. Mol. Sci. 7, 519–536. doi: 10.3390/i7110519
Lin, G. Q., You, Q. D., and Cheng, J. F. (2011). Chiral Drugs: Chemistry And Biological Action, 1 Edn, Hoboken, NJ: John Wiley & Sons.
Lindsley, C. W. (2013). The top prescription drugs of 2012 globally: biologics dominate, but small molecule CNS drugs hold on to top spots. ACS Chem. Neurosci. 4, 905–907. doi: 10.1021/cn400107y
Liu, L. L., He, L. S., Xu, Y., Han, Z., Li, Y. X., and Qian, P. Y. (2013). Caspase-3-dependent apoptosis of citreamicin ε-induced HeLa cells is associated with reactive oxygen species generation. Chem. Res. Toxicol. 26, 1055–1063. doi: 10.1021/tx4000304
Liu, L. L., Xu, Y., Han, Z., Li, Y. X., Lu, L., and Qian, P. Y. (2012). Four new antibacterial xanthones from the marine-derived actinomycetes Streptomyces caelestis. Mar. Drugs 10, 2571–2583. doi: 10.3390/md10112571
Morrissey, I., Hoshino, K., Sato, K., Yoshida, A., Hayakawa, I., and Shen, L. L. (1996). Mechanism of differential activities of ofloxacin enantiomers. Antimicrob. Agents Chemother. 40, 1775–1784. doi: 10.1128/aac.40.8.1775
Ouyang, L., Shi, Z., Zhao, S., Wang, F. T., Zhou, T. T., and Bao, J. K. (2012). Programmed cell death pathways in cancer: a review of apoptosis, autophagy and programmed necrosis. Cell Prolif. 45, 487–498. doi: 10.1111/j.1365-2184.2012.00845.x
Peng, M., Yi, Y. X., Zhang, T., Ding, Y., and Le, J. (2018). Stereoisomers of saponins in panax notoginseng (Sanqi): a review. Front. Pharmacol. 9:188. doi: 10.3389/fphar.2018.00188
Peoples, A. J., Zhang, Q., Millett, W. P., Rothfeder, M. T., Pescatore, B. C., and Moore, C. M. (2008). Neocitreamicins I and II, novel antibiotics with activity against methicillin resistant staphylococcus aureus and vancomycin-resistant enterococci. J. Antibiot. 61:457. doi: 10.1038/ja.2008.62
Peoples, A. M. S., Zhang, Q. B., Staley, A., Ling, L., Moore, C., and Lewis, K. (2009). Citreamicin Antibiotic Isolatied From Nocardia. Patent number WO2009085359.
Poel, D., Boyd, L. N. C., Beekhof, R., Schelfhorst, T., Pham, T. V., and Buffart, T. E. (2019). Proteomic analysis of miR-195 and miR-497 replacement reveals potential candidates that increase sensitivity to oxaliplatin in MSI/P53wt colorectal cancer cells. Cells 8:1111. doi: 10.3390/cells8091111
Qadri, S., Saldin, H., Ueno, Y., and Al-Ballaa, S. (1992). Antibacterial activity of citreamicin-alpha (LL-E 19085 alpha) against gram-positive cocci. Chemotherapy 38, 395–398. doi: 10.1159/000239033
Reker, D., and Malmström, L. (2012). Bioinformatic challenges in targeted proteomics. J. Proteome Res. 11, 4393–4402. doi: 10.1021/pr300276f
Ross, P. L., Huang, Y. N., Marchese, J. N., Williamson, B., Parker, K., and Daniels, S. (2004). Multiplexed protein quantitation in Saccharomyces cerevisiae using amine-reactive isobaric tagging reagents. Mol. Cell. Proteom. 3, 1154–1169. doi: 10.1074/mcp.m400129-mcp200
Ruffner, H., Bauer, A., and Bouwmeester, T. (2007). Human protein–protein interaction networks and the value for drug discovery. Drug Discov. Today 12, 709–716. doi: 10.1016/j.drudis.2007.07.011
Schrick, J. J., Vogel, P., Abuin, A., Hampton, B., and Rice, D. S. (2006). ADP-ribosylation factor-like 3 is involved in kidney and photoreceptor development. Am. J. Pathol. 168, 1288–1298. doi: 10.2353/ajpath.2006.050941
Scott, D. E., Bayly, A. R., Abell, C., and Skidmore, J. (2016). Small molecules, big targets: drug discovery faces the protein–protein interaction challenge. Nat. Rev. Drug Discov. 15:533. doi: 10.1038/nrd.2016.29
Siddiqui, A. M., Sattigeri, J. A., Javed, K., Shafi, S., Shamim, M., and Malik, Z. M. (2018). Design, synthesis and biological evaluation of spiropyrimidinetriones oxazolidinone derivatives as antibacterial agents. Bioorg. Med. Chem. Lett. 28, 1198–1206. doi: 10.1016/j.bmcl.2018.02.055
Srinivasula, S. M., Ahmad, M., Fernandes-Alnemri, T., and Alnemri, E. S. (1998). Autoactivation of procaspase-9 by Apaf-1-mediated oligomerization. Mol. Cell 1, 949–957. doi: 10.1016/s1097-2765(00)80095-7
Stanyon, C. A. (2005). Review: protein-protein interactions: methods and applications. J. Proteome Res. 4, 1484–1484. doi: 10.1021/pr050520z
Vempati, U. D., Diaz, F., Barrientos, A., Narisawa, S., Mian, A. M., and Moraes, C. T. (2007). Role of cytochrome c in apoptosis: increased sensitivity to tumor necrosis factor alpha is associated with respiratory defects but not with lack of cytochrome c release. Mol. Cell. Boil. 27, 1771–1783. doi: 10.1128/mcb.00287-06
Wooten, M. W. (1999). Function for NF-kB in neuronal survival: regulation by atypical protein kinase C. J. Neurosci. Res. 58, 607–611. doi: 10.1002/(sici)1097-4547(19991201)58:5<607::aid-jnr1>3.0.co;2-m
Keywords: proteomic, citreamicin, toxicology, antitumor antibiotic, iTRAQ
Citation: Liu L-L, Sun J, Xu Y, He L-S, Kondethimmanahalli C and Qian P-Y (2020) Proteomic Comparison of the Cytotoxicology of Two Diastereomers of Citreamicin Reveals Differentially Activation of NF-κB Pathway. Front. Mar. Sci. 7:228. doi: 10.3389/fmars.2020.00228
Received: 21 November 2019; Accepted: 25 March 2020;
Published: 05 May 2020.
Edited by:
Andrew Stanley Mount, Clemson University, United StatesReviewed by:
Tara Essock-Burns, University of Hawaii, United StatesJaipalreddy Panga, Institute for Systems Biology (ISB), United States
Copyright © 2020 Liu, Sun, Xu, He, Kondethimmanahalli and Qian. This is an open-access article distributed under the terms of the Creative Commons Attribution License (CC BY). The use, distribution or reproduction in other forums is permitted, provided the original author(s) and the copyright owner(s) are credited and that the original publication in this journal is cited, in accordance with accepted academic practice. No use, distribution or reproduction is permitted which does not comply with these terms.
*Correspondence: Pei-Yuan Qian, Ym9xaWFucHlAdXN0Lmhr
†These authors have contributed equally to this work