 Ana L. Ibáñez
 Ebenezer Guerra
 Eloísa Pacheco-Almanzar
- Departamento de Hidrobiología, Universidad Autónoma Metropolitana Unidad Iztapalapa, Mexico City, Mexico
The shape of fish scales is, to a considerable degree, species-specific, making it possible to identify species using only one fish scale per specimen. However, to our knowledge, the shape of the rhombic lamination pattern has not been considered to identify species. This study used landmarks and geometric morphometric approaches to address two questions: (1) whether the rhombic lamination pattern of fish scales along the longitudinal axis varies within species and sex and (2) how many fish scales of the rhombic squamation pattern should be considered to obtain an adequate identification. These questions were assessed with a MANCOVA and a cross-validated quadratic discriminant analysis (DA) using the rhombus of one, three, and six scales, and 6, 14, and 26 landmarks, respectively, in order to discriminate between two co-generic species, Mugil cephalus and Mugil curema. Proportions of the total shape variance explained by the total length and the centroid size were 2.3, 11.8, and 10.5% and 4.2, 5.1, and 5.4% for one, three, and six scales, respectively. Thus, analyses were performed on the shape and the form (shape plus size). The MANCOVA and DA analyses were found to be effective in detecting differences in scale pattern shape between species (except in the case of three scales; p = 0.079 for the shape and p = 0.065 for the form), whereas no differences were recorded between size and sex in all cases. Findings indicate that a good identification of species is possible, with no significant differences when using shape or form. The DA provided values of 75.8, 75.0, and 73.4% based on the shape, and of 72.7, 75.8, and 75.0% based on the form, for 1, 3 and 6 scales, respectively. Thus, it is possible to obtain a rapid and reliable identification of species using the rhombus of one scale only without considering the size. This is a useful finding in practical terms since scaling requires data on length. The finding of a suitable discrimination using only the rhombus of one scale raises the possibility of using an ocular adaptor on a camera or mobile phone, allowing many individuals to be easily screened without having to collect scales.
Introduction
Scales of most teleost fish are of the elasmoid type. Elasmoid scales are thought to derive from the surface “dental” tissues that covered rhombic scales in ancestral osteichthyan fish (Sire and Huysseune, 2003). Scale morphology has been used to identify inland fish of North America (Daniels, 1996), as well as to design taxonomic keys for species of freshwater ecosystems of various areas including California (Casteel, 1972), Britain, and Ireland (Maitland, 2004). Also, an atlas of scales of common Mediterranean teleost fish has recently been published (Bräger and Moritz, 2016). In the last years, fish scales have been used to discriminate among species and populations. The Fourier analysis of fish scales was initially used to discriminate populations (e.g., Jarvis et al., 1978; Richards and Esteves, 1997) and, later, different methods of shape analysis based on landmark data and geometric morphometric methods (GMM) were developed to discriminate among species and populations, as well as among sympatric phenotypes (Ibáñez et al., 2007, 2012a; Garduño-Paz et al., 2010; Staszny et al., 2012). All these studies collected only one fish scale per specimen. Fish scale shape is, to a significant degree, species-specific and is thus useful when defining stock membership.
According to Sire and Akimenko (2004), no reports exist on gene expression during skin development (Le Guellec et al., 2004); however, morphological data suggest that the skin is already pre-patterned at the onset of scale initiation. To date, there are no clear explanations on what factors determine the patterning of squamation in the regular development of scales in a chessboard order. It is known that morphogenesis such as apolipoprotein E, sonic hedgehog, and ectodysplasin A (Monnot et al., 1999; Kondo et al., 2001; Sire and Akimenko, 2004; Harris et al., 2008) are involved in the initiation and morphogenesis of scales (Levin, 2011).
For 12 years now, we have been studying the use of fish scale shape to identify genera, species and local populations of the Mugilidae and Lutjanidae (Ibáñez et al., 2007, 2012a, 2016) in order to determine the influence of allometry on scale shape and classification (Ibáñez and O’Higgins, 2011), to analyze variations in elasmoid fish scale patterns with regard to taxon and swimming mode (Ibáñez et al., 2009), to see whether compensatory growth modifies fish scale shape (Ibáñez et al., 2012b), to use fish scale shape to determine the origin of fish in fish traceability studies (Ibáñez, 2015) and to compare the discrimination of phenotypic stocks using fish otolith and scale shape (Ibáñez et al., 2017). In most of these studies, we have used as a model two co-generic species of fishery importance, Mugil cephalus (Linnaeus, 1758) and Mugil curema (Valenciennes, 1836), striped and white mullet, respectively.
Fish mullet are euryhaline species that play a significant role in small-scale coastal fisheries in numerous areas of the world. In Mexico, they constitute 1 of the 10 most important coastal fisheries, exceeding 28,000 tons annually. Most of the catches take place in the Gulf of Mexico, off the coasts of the states of Veracruz and Tamaulipas. According to Eschmeyer and Fong (2019), the family Mugilidae includes 25 genera and 74 species that live in coastal lagoons and estuaries at all latitudes, except for the polar regions. Liza and Mugil are the genera with the most species, with 12 and 16, respectively. The external morphology of this family is extremely conservative, which increases uncertainty in the discriminations. The effectiveness of species classification following easy, non-destructive, quick, and less costly methods that allow many specimens to be screened without collecting scales is thus highly relevant.
To our knowledge, no studies have compared the effectiveness of species discrimination based on the shape of the rhombic lamination pattern without collecting scales and using only a camera to photograph fish bodies. Therefore, the aim of this study was to evaluate a rapid assessment tool for species discrimination. Accordingly, this study compared the success of discrimination of two co-generic species of fish mullets, M. cephalus and M. curema, collected in Alvarado Lagoon near the Gulf of Mexico. Two specific questions were addressed: (1) does the rhombic lamination pattern of fish scales discriminate two similar co-generic species? and (2) how many fish scales of the rhombic squamation pattern are necessary to obtain an adequate identification? This was assessed by applying GMM to the rhombic pattern of one, three, and six scales (6, 14, and 26 landmarks, respectively) of the longitudinal series on the left flank of the fish. These two Mugilidae species were selected for this study since they are abundant along Mexico’s coasts, they are important economically as a source of roe, and, as the rhombic lamination pattern has not been previously studied, we can use previous studies based on the one scale discrimination as comparison.
Materials and Methods
Fish Scale Collection
Specimens were collected from one same area in order to minimize potential phenotypic differences due to the environment, as Ibáñez et al. (2007) specified. Specimens of M. cephalus (n = 64) and M. curema (n = 64) were collected from Alvarado Lagoon (N18°46′ and W95°46′), and were sexed, measured, and weighed. Most were adult specimens (87.5 and 89.1%) with average total lengths of 51.25 ± 6.46 and 41.30 ± 4.34 cm for females and males, respectively, for M. cephalus and 31.23 ± 2.52 and 29.67 ± 2.21 cm for females and males, respectively, for M. curema (Table 1). A piece of skin (with fish scales) was extracted from the left flank of the fish between the beginning of the first and second dorsal fins. Six landmarks per scale were considered following the TPSdig software (Rohlf, 2017). The landmarks were located on key structures of the ctenoid scale that are common to all scales of the species under study. The following landmarks were considered appropriate (Figure 1): landmarks 1 and 2 are the anterior points connected to the previous scale, landmarks 3 and 4 are the tips of the dorso-ventral portion of the scale, and landmarks 5 and 6 lie at the boundary between the marked and the posterior scale. Three analyses were run, the first was to describe the shape of one scale using 6 landmarks, the second to describe the shape of a configuration of three adjacent scales with 14 landmarks, and the third analysis described the shape of a configuration of six adjacent scale utilizing 26 landmarks. Since the total length was significantly different in the two species (p < 0.05), analyses were carried out for the shape and form (shape plus size).

Table 1. Sample characteristics of fish mullets.
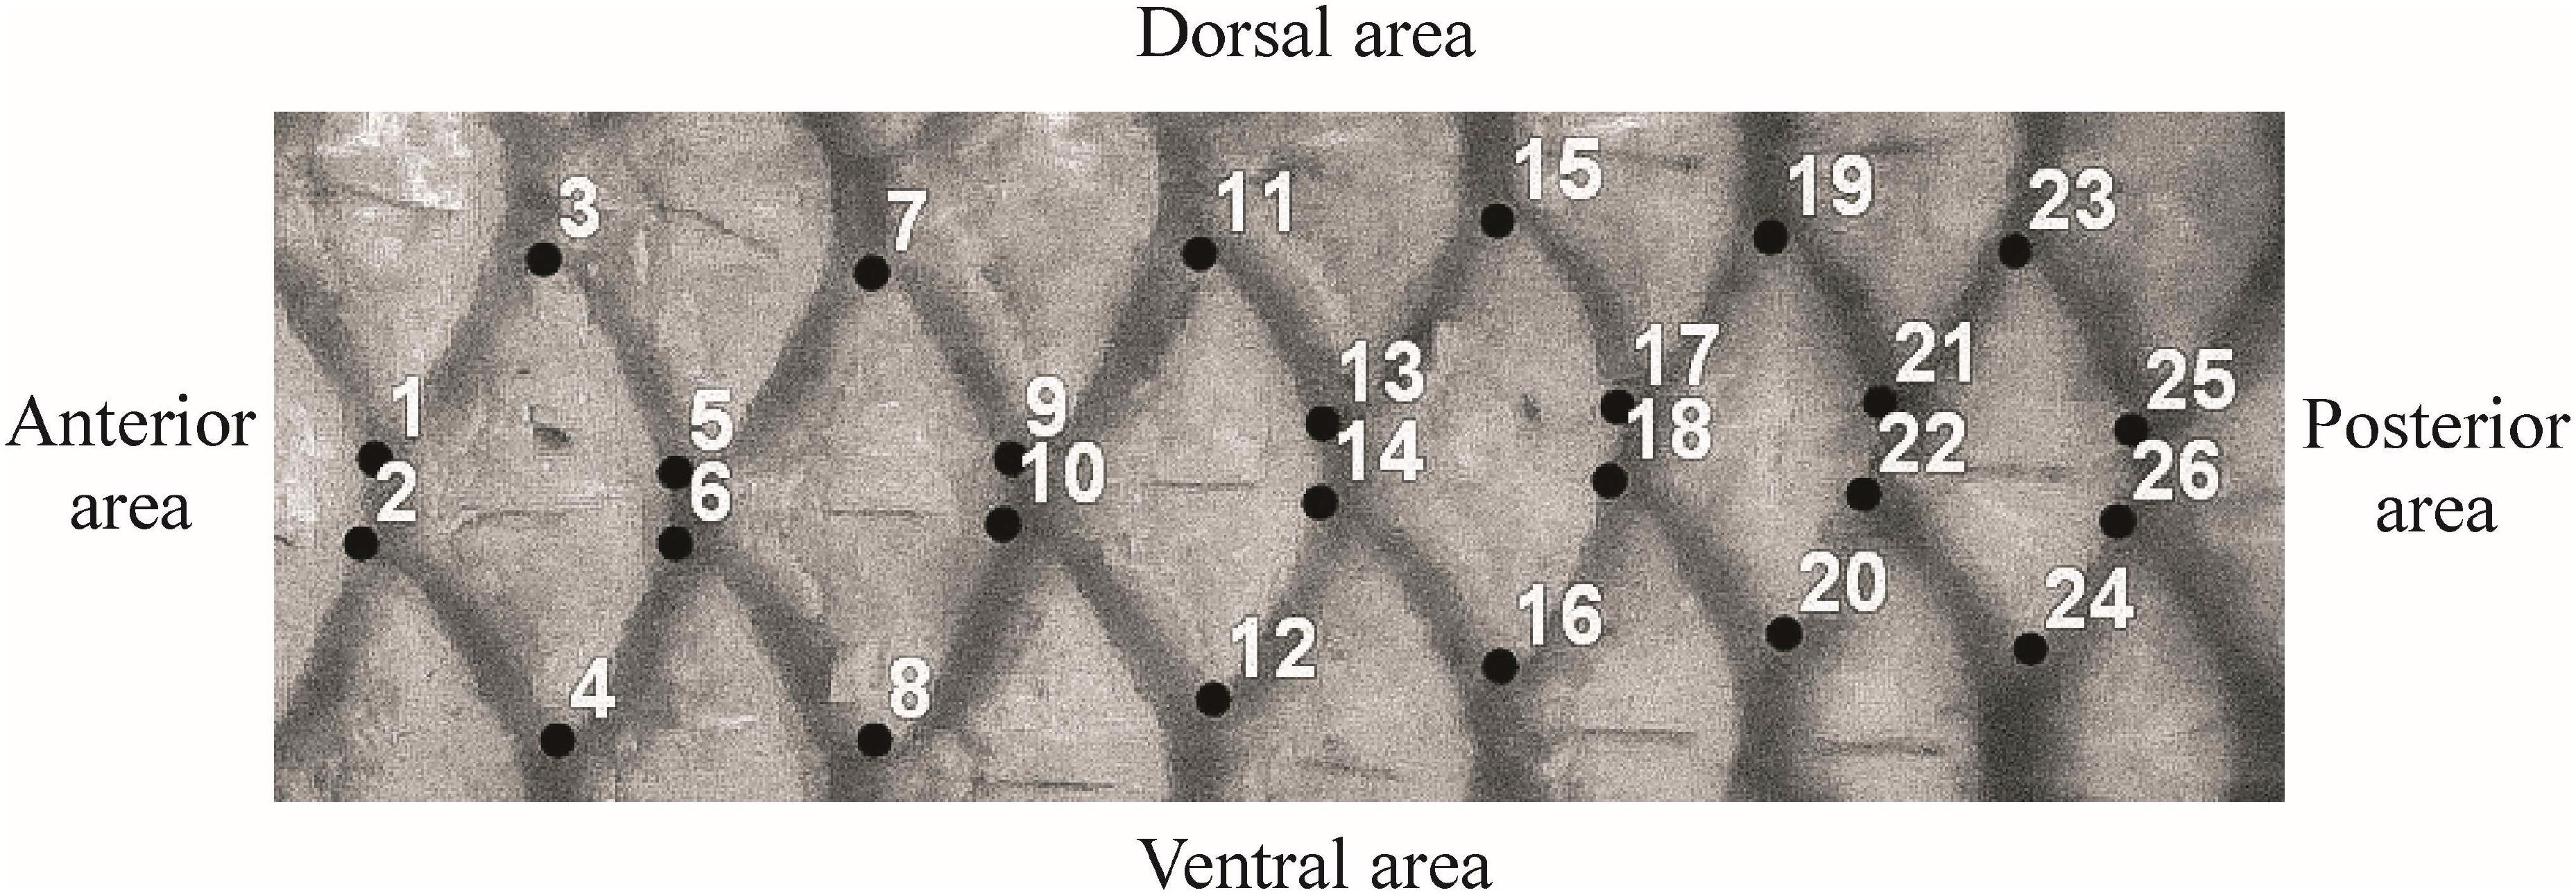
Figure 1. Location of landmark used for the analysis to describe the shape of scales of Mugilidae fishes. For one scale, 6 landmarks were used (from landmark 1 to 6), as well 14 and 26 landmarks were used for three (from landmark 1 to 14) and six scales (from 1 to 26 landmarks).
Morphometrics
The configurations of the landmark coordinates for the sampled scales were scaled, translated and rotated using a generalized Procrustes analysis (GPA). They were then submitted to a tangent projection (Dryden and Mardia, 1993) and later to a principal components analysis (PCA; Dryden and Mardia, 1993; Kent, 1994). The extremes of each PC were then used to recreate the expected shapes of the landmark configurations with those particular scores by adding to the mean tangent coordinates the products of these PC scores (PCs) and the eigenvectors for those PCs before projecting back from the tangent to the configuration space (O’Higgins et al., 2001). The variations in shape between the mean and the shapes represented by the extremes of the PCs of interest were pictured using transformation grids (Bookstein, 1989; Marcus et al., 1996; Dryden and Mardia, 1998) computed with morphologika2 (O’Higgins and Jones, 2006). In order to examine the potential for differences in shape when classifying unknown specimens, the scores of the specimens on all non-zero PCs were submitted to a quadratic discriminant analysis (SPSS ver. 25.0) to compute generalized Mahalanobis’ distances and discriminant functions and to calculate the value of the latter in the classification. This was accomplished with a cross-validation in which multiple repeated analyses were carried out, leaving out one individual in the construction of the discriminant function before classifying this individual according to the function. This reduced the likelihood of overestimating the efficacy of the discriminant functions by using them to classify the specimens employed in their construction. Also, a cross-validated discriminant analysis was used to evaluate and compare the efficacy of the shape and the relative warp in the size–shape space in the discrimination of each species. The percentage of correct classification rates was documented. The analyses were run with 6, 14, and 26 landmarks using one, three, and six fish scales as mentioned above. Also, multivariate regressions of all PCs on species confirmed these general trends. Finally, differences were assessed by a full MANCOVA with all PC scores of shape and form (shape plus size) as dependent variables, total length as the covariate, and species and sex as grouping factors.
Results
The GPA/PCA resulted in a set of PCs that describe the patterns of form and shape variability of the three scales of the rhombic lamination pattern. Specifically, we were concerned to know the extent to which scale form and shape variability relates to species. This was assessed directly by a quadratic discriminant analysis (see below), and was explored initially by an examination of the PCs. The first PC explained 41.2, 64.8, and 79.5% of the total variance, while the second accounted for 25.6, 9.5, and 3.8% in the GPA/PCA analysis of one, three, and six scales of the rhombic lamination pattern examined for the form analysis (79.4, 80.9, and 86.5% for the first three PCs, respectively). The first PC explained 43.7, 35.5, and 26.6% of the total variance while the second accounted for 21.1, 17.3, and 14.1% in the GPA/PCA analysis of one, three, and six scales of the rhombic lamination pattern examined for the shape analysis (79.2, 61.7, and 51.5% for the first three PCs, respectively) (Table 2).
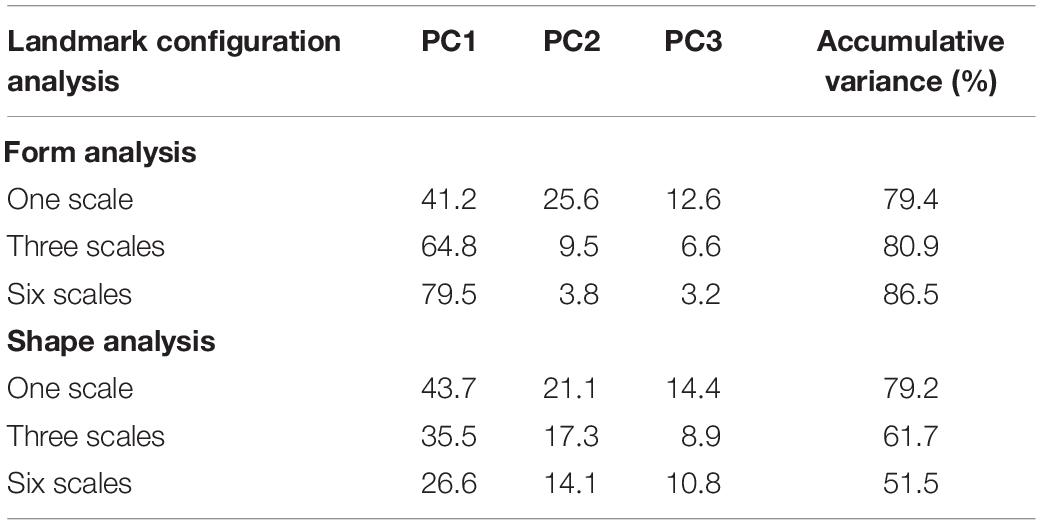
Table 2. Explained variance of PCs for each landmark configuration analysis.
The variation in shape between species is represented in Figure 2 where the leftmost grids are the mean shape of M. curema, the rightmost grids are that of M. cephalus, and the reference shape is in the central grid for one, three, and six scales of the rhombic lamination pattern under study (Figures 2A–C). The one scale pattern (Figure 2A) was characterized by a relative bending to the right of landmarks 1, 2, 5, and 6 for M. curema, and a similar bending to the left of the same landmarks for M. cephalus. An analogous trend was observed for the three and six scales of the rhombic lamination pattern (Figures 2B,C). The key difference was the relative location of the central landmarks which bent more to the right for M. curema than for M. cephalus. Furthermore, the anterior–posterior edge was concave in M. curema and convex in M. cephalus.
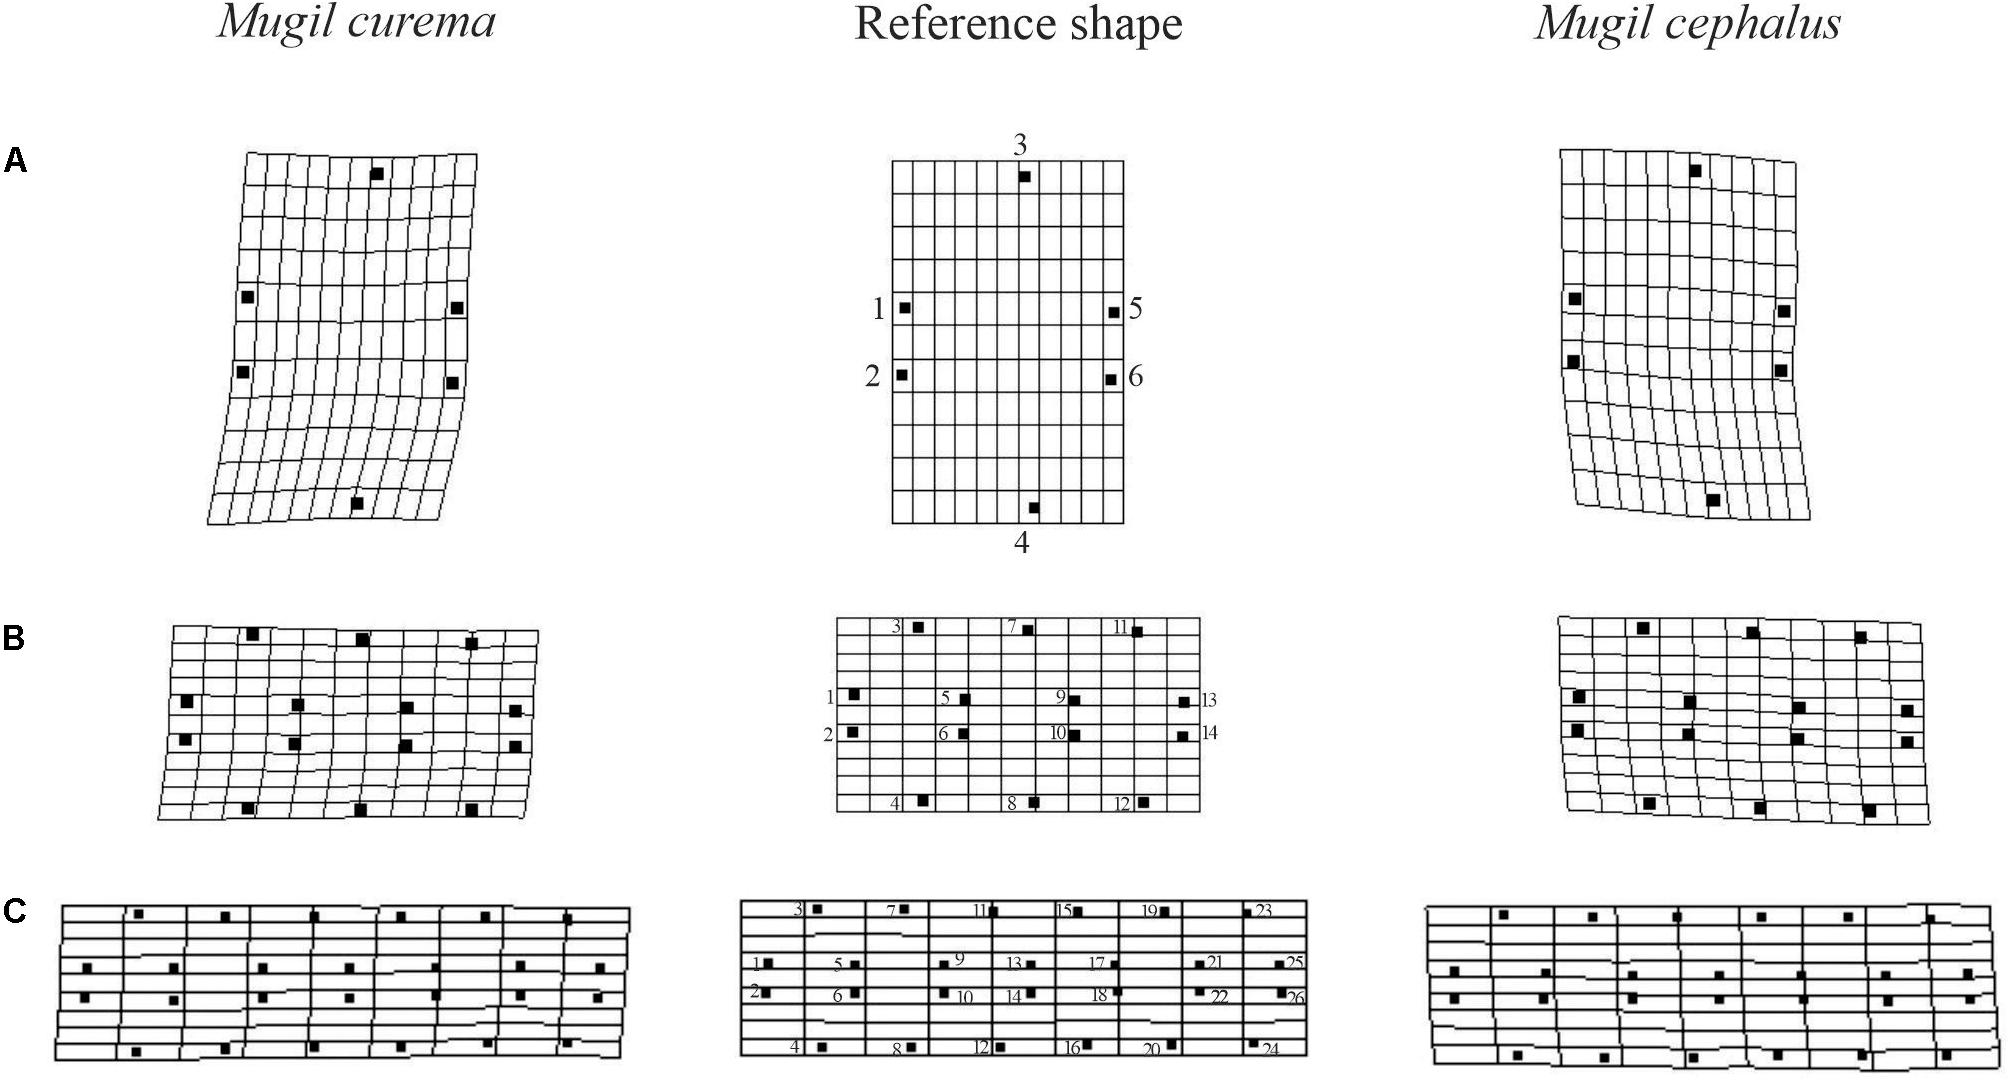
Figure 2. Shape variation in each species visualized using transformation grids. Middle grid shows the regular reference grid in each rhombic squamation pattern showing the landmark utilized for the Procrustes analysis for one (A), three (B), and six (C) scales. Left, deformed grid drawn over the estimated shape for Mugil curema individuals; right, deformed grid drawn over the estimated shape for M. cephalus. Scales orientation are the same as in Figure 1.
In the discriminant analyses, similar cross-validated classification rates were obtained using the shape and the combined scale size and shape (form space; Tables 3, 4). Furthermore, the shape alone performed slightly better than the form when using the rhombic lamination pattern of one fish scale (Table 4). The cross-validated quadratic discriminant analysis using the form (Table 3) correctly classified 72.7, 75.8, and 75% for the rhombic lamination pattern of one, three, and six scales, respectively (Wilks’ λ = 0.676, p < 0.001; Wilks’ λ = 0.467, p < 0.001 and Wilks’ λ = 0.313, p < 0.001 for 1, 3, and 6 scales, respectively). The cross-validated quadratic discriminant analysis using the shape (Table 4) correctly classified 75.8, 75.0, and 73.4% for the rhombic lamination pattern of one, three, and six scales, respectively (Wilks’ λ = 0.680, p < 0.001; Wilks’ λ = 0.482, p < 0.001 and Wilks’ λ = 0.327, p < 0.001 for one, three, and six scales, respectively). The M. curema data performed slightly better than those of M. cephalus. The graphic results of the previous analysis showed the combined histogram for the canonical scores (Figures 3A–C). The two species can be identified from the two distinct modes, particularly for one and six fish scales of the rhombic lamination pattern (Figures 2A,C), with the left one (gray) for M. cephalus having a slightly more leptokurtic distribution. The three fish scales of the rhombic lamination pattern (Figure 2B) showed the less normal distribution for M. cephalus.
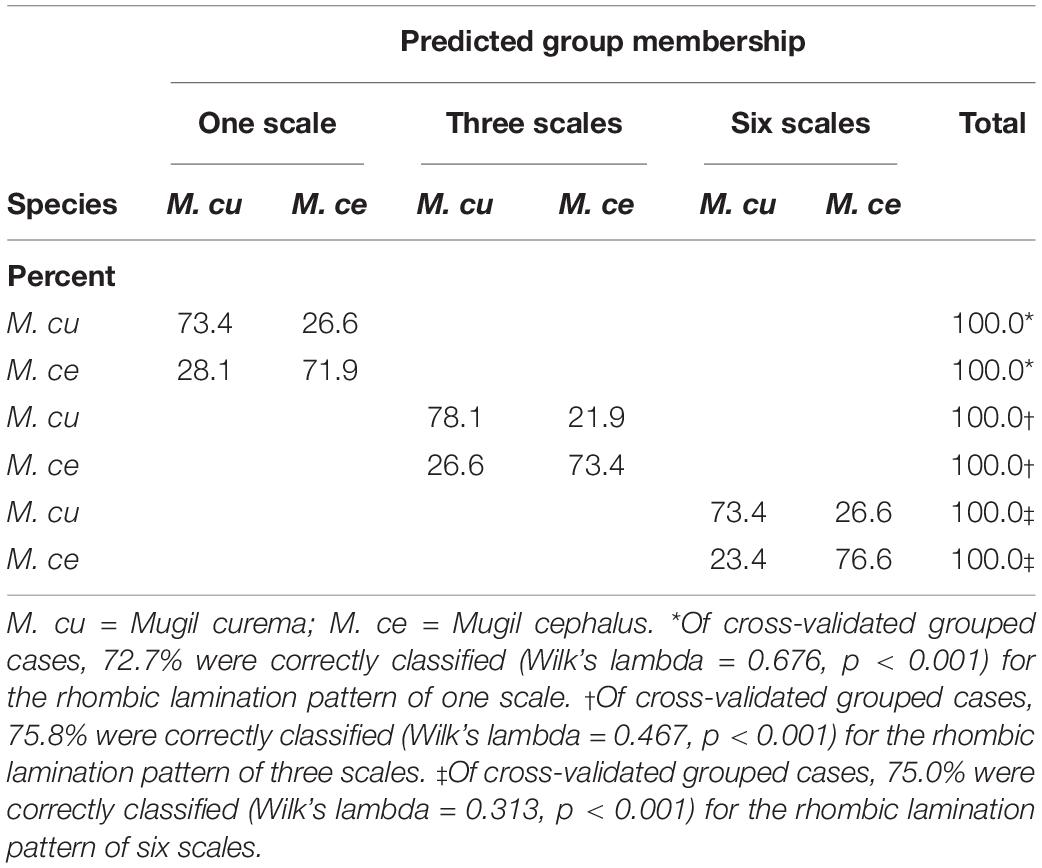
Table 3. Cross-validated predicted species membership using form (indicated as treatment; see text) from the rhombic lamination pattern of one, three, and six fish scales.
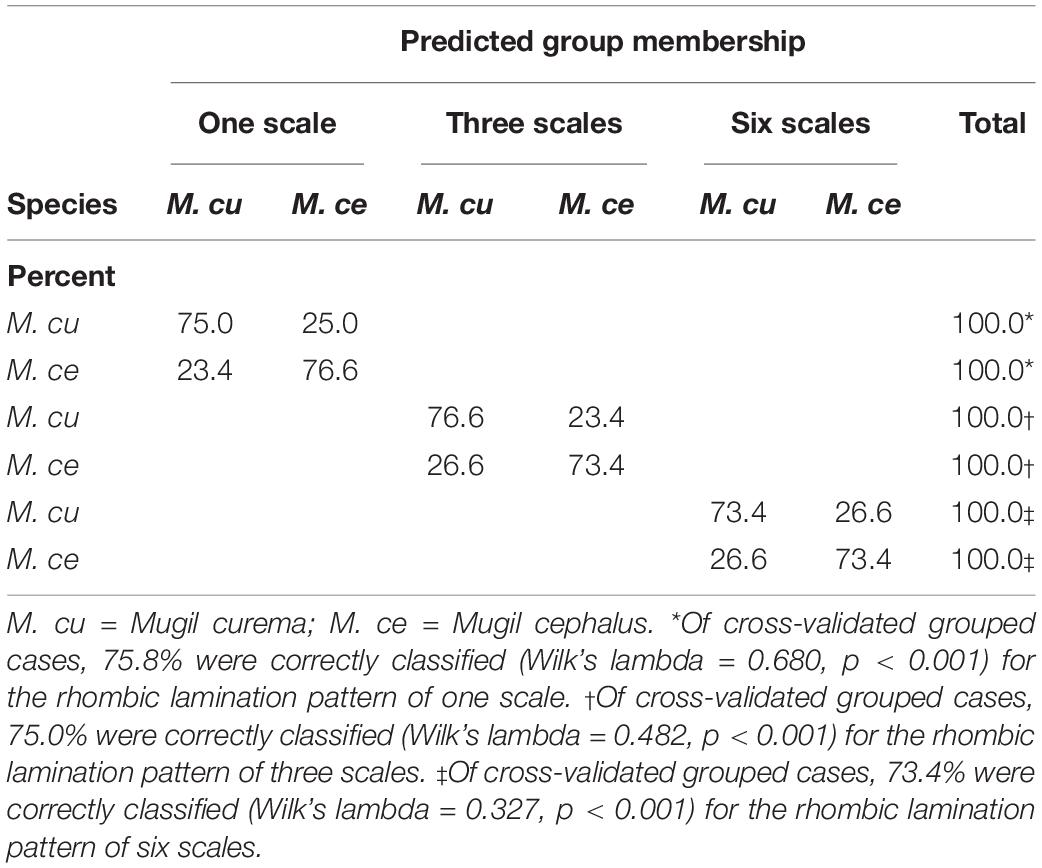
Table 4. Cross-validated predicted species membership using shape (indicated as treatment; see text) from the rhombic lamination pattern of one, three, and six fish scales.
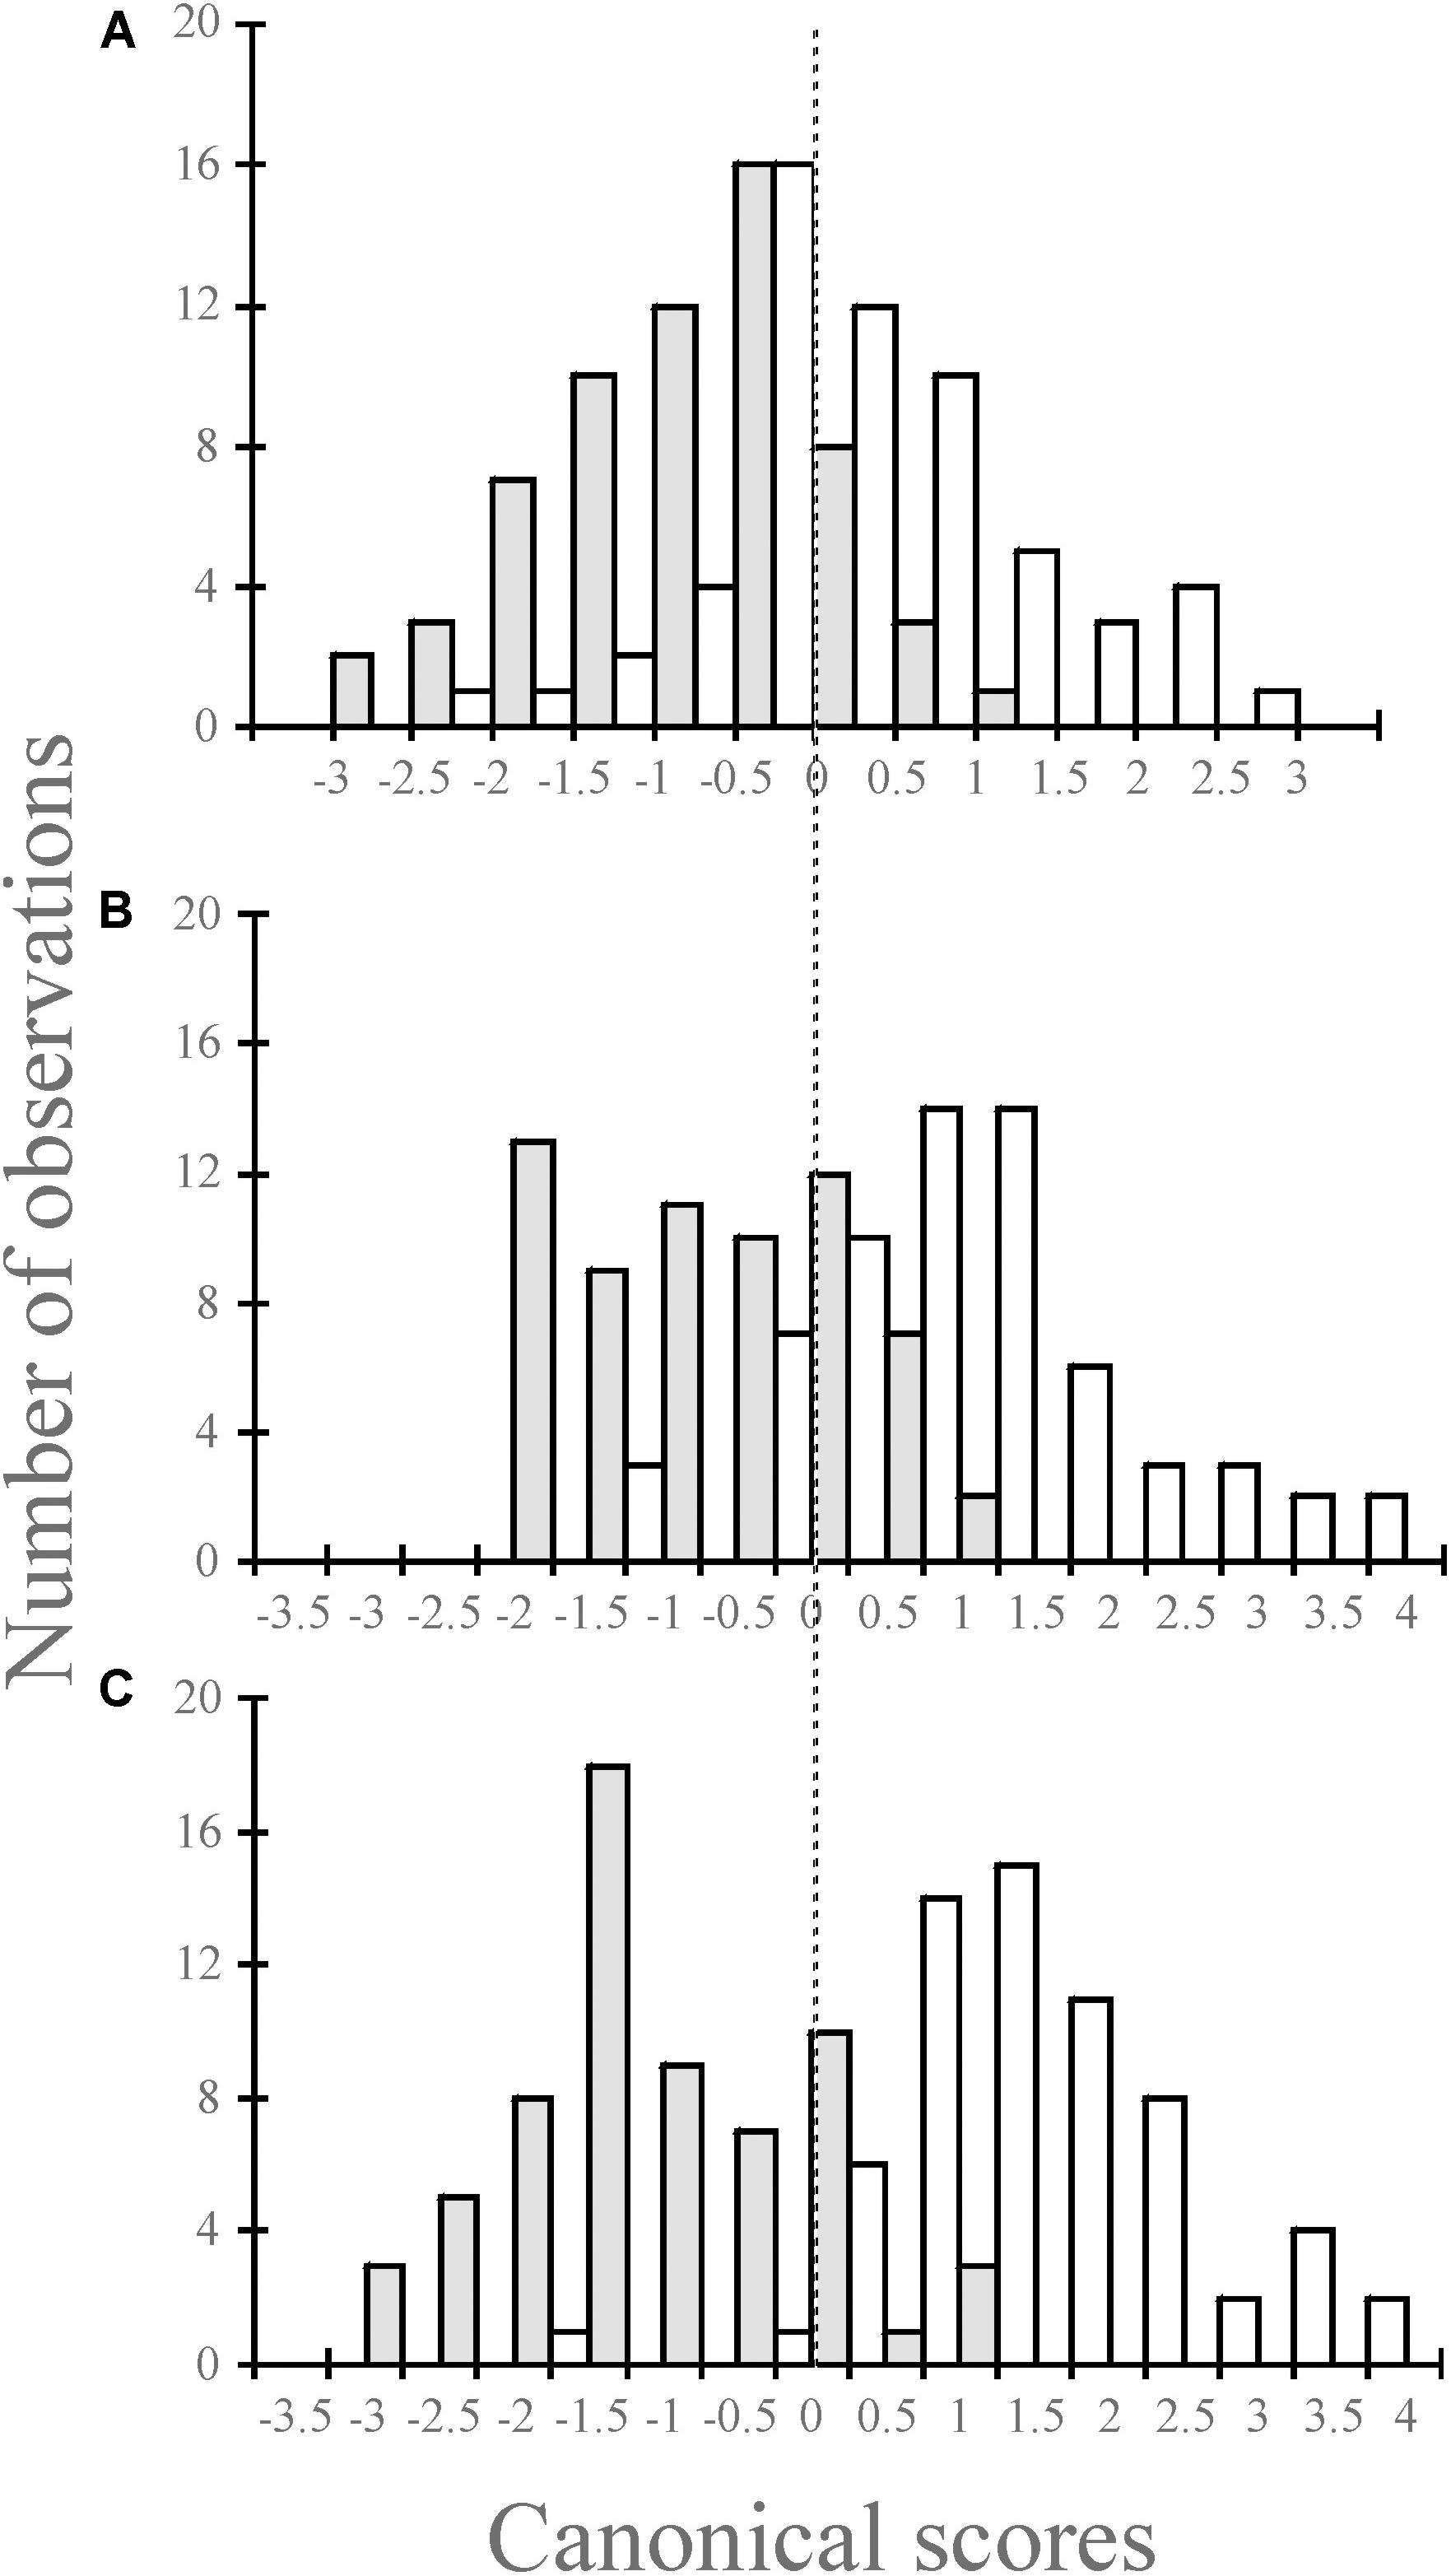
Figure 3. Combined histogram for the canonical scores for Mugil cephalus (gray) and M. curema (white) species using 6, 14, and 26 landmarks for one (A), three (B), and six (C) scales of the rhombic squamation pattern.
MANCOVA analyses were found to be effective in detecting differences in the rhombic lamination pattern of scales between species (except for the case of three scales; p = 0.079 and p = 0.065 for shape and form, respectively), while no differences were found between size and sex in all cases (Table 5). The proportion of the total shape variance explained by the total length was 4.2, 5.1, and 5.4% for the rhombic lamination pattern of scales of one, three, and six scales, respectively.
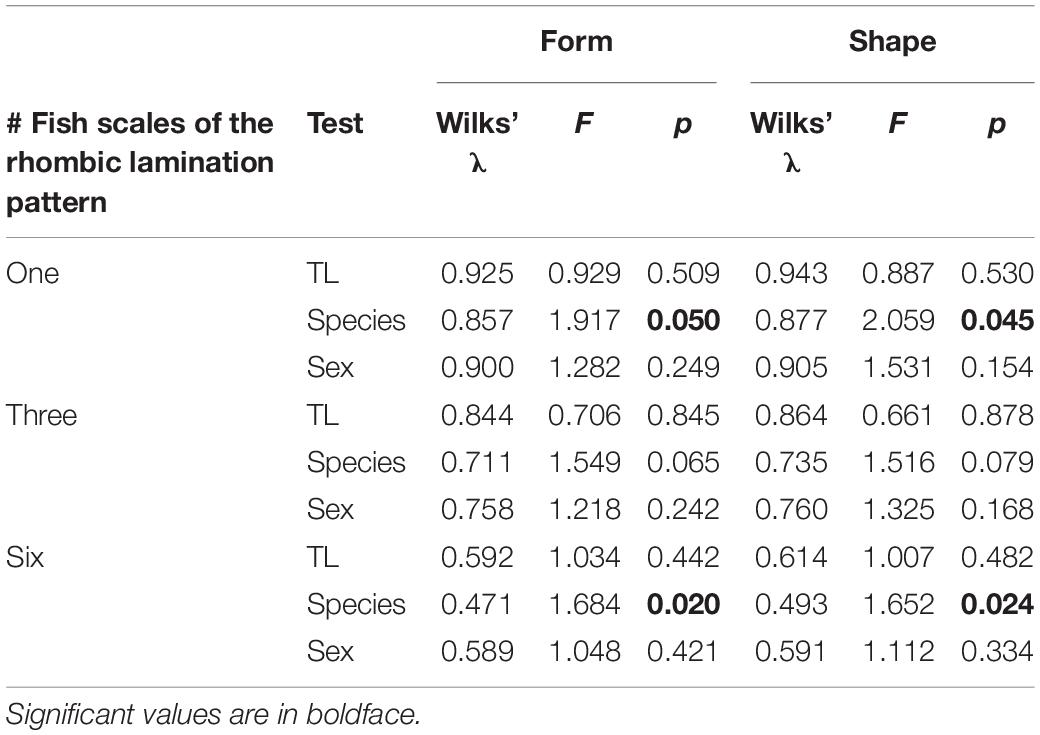
Table 5. MANCOVA test to assess the effect of total length (Tl) on scale form and shape among species and sex by number of fish scales. p-Value of significance test.
Discussion
Our results show that the rhombic lamination pattern of one, three, and six scales can be used to reliably identify species using GMM. In order to use this approach successfully in fisheries management, it is fundamental to comprehend the extent to which differences in the number of scales and fish size might have an effect on species identification.
The size of the fish (total length) did not change the shape significantly (Table 5) or improve species discrimination, as well as the number of scales scanned (Tables 3, 4). This means that one may use one single rhombic lamination pattern for species discrimination without having to consider the size. This is a useful finding in practical terms since the form (shape plus size) requires data on body length. Accordingly, it also raises the possibility of using an ocular adaptor on a camera or cell phone allowing many specimens to be easily screened without having to collect a fish scale. This approach may also prove useful in a situation where it is not possible to quantify the size of the specimens. Nevertheless, the non-normality of the canonical scores of the rhombic lamination pattern for the three scales certainly reduced the effect of the MANCOVA analysis.
Ibáñez et al. (2009), in a study that did not take into account fish size, verified the efficacy of the identification of scales from nine regions along the flank of teleost fish, and obtained the highest rates of correct identification using scales from the central–dorsal region of mature fish and scales from the same body region (Ibáñez et al., 2007, 2009; Garduño-Paz et al., 2010). Correct classification rates were as high as 98% for some species. In the present study, the scales analyzed for the rhombic lamination pattern were collected from the same body area belonging to the lateral series, and most were of sexually mature individuals. Although the rate of correct identification is reduced under some conditions, it compares reasonably with the rate of over 80% recorded in studies using otoliths to categorize co-generic species (Torres et al., 2000; Stransky and MacLellan, 2005). Variations among different species are regularly greater than those within a species; however, it has been suggested that M. curema and M. cephalus are not a single species but a species complex (Durand and Borsa, 2015). In this sense, a wide phenotypic variability is present (Ibáñez et al., 2006, 2007), which could reduce discrimination.
In order to explain the squamation pattern, Sire and Arnulf (1990) proposed that the tension transmitted to the skin during swimming may induce scale development as a means of resisting excessive bending. The rhombic lamination pattern of the scales may also be functionally related to the swimming mode. Both mullet species look similar and present a subcarangiform swimming mode (Breder, 1926). In this sense, the rhombic lamination pattern is also similar. Other similarities are present in these two mullets, such as the number of lateral scales, which is 36–40 in M. cephalus and 35–40 in M. curema, with modes 38 and 37, respectively (Harrison, 2002). Thus, differences in the rhombic lamination pattern could be due to the shape of the fish, with M. cephalus being a more robust species with a projectile shape and M. curema having a slimmer body. These differences were recognized by Jordan and Evermann (1896) in the specific description of these species from Central America and North America. Also, the ctenii of the scales are different in these species and have been used to discriminate them (Ibáñez and Gallardo-Cabello, 2005). Likewise, the roughness of the scale surface has been studied from the point of view of hydrodynamics (Sudo et al., 2002). Thus, the variations in shape of the scale lamination pattern could arise from adaptations to fluctuating hydrodynamic conditions. Supplementary studies that include biomechanical evaluations will offer a possibility to study the function–form relationship.
Scale morphology and squamation have been used to study scale morphology in different parts of the body (Chen et al., 2012; Mondéjar-Fernández and Clément, 2012), to describe the squamation pattern of osteichthyans providing new insights into the early evolution of osteichthyan scales, to understand the early osteichthyan body plan (Cui et al., 2019), and to study the morphology and articulated squamations of extinct species (Žigaite and Goujet, 2012). However, to our knowledge, no other analysis has used the rhombic lamination pattern to discriminate between species as is presented in this study.
Species identification is vital in the conservation of biodiversity and fisheries management, particularly considering the urgent need of correct species identification experienced by a fisheries control officer on the high seas (Fischer, 2013). Thus, this method is useful and non-destructive; it makes it possible to screen rare, museum specimens and endangered species, it allows many individuals in a community to be screened quickly, and it is an inexpensive method to discriminate species. In order to use such an approach effectively in fisheries management, it is important to have described and made available the rhombic lamination pattern of each species.
Data Availability Statement
The datasets generated for this study are available on request to the corresponding author.
Ethics Statement
Research was carried out in accordance to Mexican laws and regulations. Striped and white mullet was collected under the Official Mexican Norm (NOM-016 PESC-1994) for commercial species. Fish were euthanized humanely by being placed directly into an ice water bath upon capture. No non-target or by-catch specimens were collected during the study.
Author Contributions
AI and EP-A conceived the research. AI conducted the field work. EG processed and prepared the fish and performed the statistically analysis. EP-A reviewed the process and preparation of samples. AI prepared the initial manuscript and all authors contributed to later revisions.
Funding
This study was funded by the Universidad Autónoma Metropolitana.
Conflict of Interest
The authors declare that the research was conducted in the absence of any commercial or financial relationships that could be construed as a potential conflict of interest.
Acknowledgments
The authors would like to thank Manuel Castellanos for his help in sample collection and fish dissection.
References
Bookstein, F. L. (1989). Principal warps: thin-plate splines and the decomposition of deformations. IEEE T. Pattern Anal. 11, 567–585. doi: 10.1109/34.24792
Bräger, Z., and Moritz, T. (2016). A scale atlas for common Mediterranean teleost fishes. Vertebr. Zool. 66, 275–386.
Casteel, R. W. (1972). A key based on scales, to the families of native California freshwater fishes. Proc. Calif. Acad. Sci. 39, 75–86.
Chen, D., Janvier, P., Ahlberg, P. E., and Blom, H. (2012). Scale morphology and squamation of the Late Silurian osteichthyan Andreolepis from gotland. Sweden. Hist. Biol. 24, 411–423. doi: 10.1080/08912963.2012.668187
Cui, X., Qiao, T., and Zhul, M. (2019). Scale morphology and squamation pattern of Guiyu oneiros provide new insights into early osteichthyan body plan. Sci. Rep. 9:4411. doi: 10.1038/s41598-019-40845-7
Daniels, R. A. (1996). “Guide to The Identification Of Scales Of The Inland Fishes of Northeastern North America,” in New York State Museum Bulletin 498 (Albany, NY: The University of the State of New York).
Durand, J. D., and Borsa, P. (2015). Mitochondrial phylogeny of grey mullets (Acanthopterygii: Mugilidae) suggests high proportion of cryptic species. C. R. Biol. 338, 266–277. doi: 10.1016/j.crvi.2015.01.007
Eschmeyer, W. N., and Fong, J. D. (eds) (2019). Catalog of Fishes: Species by Family/Subfamily. Electronic Version. Available online at: http://researcharchive.calacademy.org/research/ichthyology/catalog/SpeciesByFamily.asp (accessed November 04, 2019).
Fischer, J. (Ed) (2013). Fish. (Identification)Tools for Biodiversity and Fisheries Assessment: Review and Guidance for Decision-Makers, ed. J. Fischer (Rome: FAO).
Garduño-Paz, M. V., Demetriou, M., and Adams, C. E. (2010). Variation in scale shape among alternative sympatric phenotypes of Arctic charr Salvelinus alpinus from two lakes in Scotland. J. Fish Biol. 76, 1491–1497. doi: 10.1111/j.1095-8649.2010.02584.x
Harris, M. P., Rohner, N., Schwarz, H., Perathoner, S., and Nüsslein-Volhard, C. (2008). Zebrafish eda and edar mutants reveal conserved and ancestral roles of ectodysplasin signaling in vertebrates. PLoS Genet. 4:10. doi: 10.1371/journal.pgen.1000206
Harrison, I. J. (2002). “Mugilidae,” in FAO Species Identification Guide for Fisheries Purposes. The Living Marine Resources of the Western Central Atlantic, Vol. 2. Bony Fishes part 1 (Acipenseridae to Grammatidae), ed. K. Carpenter (Rome: FAO), 1071–1085.
Ibáñez, A. L. (2015). Fish traceability: guessing the origin of fish from a seafood market using fish scale shape. Fish. Res. 170, 82–88. doi: 10.1016/j.fishres.2015.05.016
Ibáñez, A. L., Cabral-Solís, E., Gallardo-Cabello, M., and Espino-Barr, E. (2006). Comparative morphometrics of two population of Mugil curema in the Atlantic and Pacific coasts. Sci. Mar. 70, 139–145. doi: 10.3989/scimar.2006.70n1139
Ibáñez, A. L., Cowx, I. G., and O’Higgins, P. (2007). Geometric morphometric analysis of fish scales for identifying genera, species and local populations within the Mugilidae. Can. J. Fish. Aquat. Sci. 64, 1091–1100. doi: 10.1139/f07-075
Ibáñez, A. L., Cowx, I. G., and O’Higgins, P. (2009). Variation in elasmoid fish scale patterns is informative with regard to taxon and swimming mode. Zool. J. Linn. Soc. Lond. 155, 834–844. doi: 10.1111/j.1096-3642.2008.00465.x
Ibáñez, A. L., Espino-Barr, E., and Gallardo-Cabello, M. (2012a). Population connectivity among geographic variants within the Lutjanidae through fish scales shape recognition. Sci. Mar 76, 667–675. doi: 10.3989/scimar.03675.09C
Ibáñez, A. L., Pacheco-Almanzar, E., and Cowx, I. G. (2012b). Does compensatory growth modify fish scale shape? Environ. Biol. Fish. 94, 477–482. doi: 10.1007/s10641-011-9962-4
Ibáñez, A. L., and Gallardo-Cabello, M. (2005). Identification of two mugilidae species, Mugil cephalus and M. curema (Pisces:Mugilidae), using the ctenii of their scales. B. Mar. Sci. 77, 305–307.
Ibáñez, A. L., Hernández-Fraga, K., and Álvarez-Hernández, S. H. (2017). Discrimination analysis of phenotypic stocks comparing fish otolith and scale shapes. Fish. Res. 185, 6–13. doi: 10.1016/j.fishres.2016.09.025
Ibáñez, A. L., Jawad, L. A., and Sadighzadeh, Z. (2016). Morphometric variation of fish scales among some species of the family Lutjanidae from Iranian waters. Cah. Biol. Mar. 57, 289–295. doi: 10.21411/CBM.A.211AE0D1
Ibáñez, A. L., and O’Higgins, P. (2011). Identifying fish scales: the influence of allometry on scale shape and classification. Fish. Res. 109, 54–60. doi: 10.1016/j.fishres.2011.01.016
Jarvis, R. S., Klodowski, H. F., and Sheldon, S. P. (1978). New method of quantifying scale shape and an application to stock identification in Walleye (Stizostedion vitreum vitreum). T. Am. Fish. Soc. 107, 528–534. doi: 10.1577/1548-8659(1978)107<528:nmoqss>2.0.co;2
Jordan, D. S., and Evermann, E. (1896). The fishes of north and middle America: a descriptive catalogue of the species of fish like vertebrates found in the waters of North America north of the Isthmus of Panama. Bull. U.S. Nat. Mus. 47, 1–3313.
Kent, J. T. (1994). The complex bingham distribution and shape analysis. J. Roy. Stat. Soc. B Met. 56, 285–299. doi: 10.1111/j.2517-6161.1994.tb01978.x
Kondo, S., Kuwahara, Y., Kondo, M., Naruse, K., and Mitani, H. (2001). The medaka rs-3 locus required for scale development encodes ectodysplasin-A receptor. Curr. Biol. 11, 1202–1206. doi: 10.1016/S0960-9822(01)00324-4
Le Guellec, D., Morvan-Dubois, G., and Sire, J. Y. (2004). Skin development in bony fish with particular emphasis on collagen deposition in the dermis of the zebrafish (Danio rerio). Int. J. Dev. Biol. 48, 217–231. doi: 10.1387/ijdb.15272388
Levin, B. A. (2011). Ontogenetic causes and mechanisms for formation of differences in number of fish scales. Russ. J. Dev. Biol. 42, 186–191. doi: 10.1134/S1062360411030106
Maitland, P. S. (2004). Keys to the Freshwater Fish of Britain and Ireland, With Notes on Their Distribution and Ecology. Ambleside: Freshwater Biological Association.
Marcus, L. F., Corti, M., Loy, A., Naylor, G. J. P., and Slice, D. (eds) (1996). Advances in Morphometrics. New York, NY: Nato ASI series Plenum Press.
Mondéjar-Fernández, J., and Clément, G. (2012). Squamation and scale microstructure evolution in the porolepiformes (Sarcopterygii, Dipnomorpha) based on Heimenia ensis from the devonian of spitsbergen. J. Vertebr. Paleontol. 32, 267–284. doi: 10.1080/02724634.2012.646836
Monnot, M. J., Babin, P. J., Poleo, G., et al. (1999). Epidermal expression of apolipoprotein E Gene during Fin and Scale development and Fin regeneration in Zebrafish. Dev. Dynam. 214, 207–215. doi: 10.1002/(sici)1097-0177(199903)214:3<207::aid-aja4>3.0.co;2-5
O’Higgins, P., Chadfield, P., and Jones, N. (2001). Facial growth and the ontogeny of morphological variation within and between the primates Cebus apella and Cercocebus torquatus. J. Zool. Lond. 254, 337–357. doi: 10.1017/s095283690100084x
O’Higgins, P., and Jones, N. (2006). Morphologika2: Tools for Statistical Shape Analysis. Version 2.5. Hull: Hull York Medical School. Available online at: http://life.bio.sunysb.edu/morph/index.html (accessed April 18, 2019).
Richards, R. A., and Esteves, C. (1997). Use of scale morphology for discriminating wild stocks of Atlantic striped bass. T. Am. Fish. Soc. 126, 919–925. doi: 10.1577/1548-8659(1997)126<0919:uosmfd>2.3.co;2
Rohlf, J. F. (2017). Tps Dig 2. Version 2.31. Ecology & Evolution and Anthropology. Stony Brook, NY: Stony Brook University.
Sire, J. Y., and Akimenko, M. A. (2004). Scale development in fish: a review, with description of sonic hedgehog expression in the zebrafish (Danio rerio). Int. J. Dev. Biol. 48, 233–247. doi: 10.1387/ijdb.15272389
Sire, J. Y., and Arnulf, I. (1990). The development of squamation in four teleostean fishes with a survey of the literature. Jpn. J. Ichthyol. 37, 137–143. doi: 10.1007/BF02905381
Sire, J. Y., and Huysseune, A. (2003). Formation of skeletal and dental tissues in fish: a comparative and evolutionary approach. Biol. Rev. 78, 219–249. doi: 10.1017/s1464793102006073
Staszny, Á, Ferincz, Á, Weiperth, A., Havas, E., Urbányi, B., and Paulovits, G. (2012). Scale-morphometry study to discriminate Gibel carp (Carassius gibelio) populations in the balaton-catchment (Hungary). Acta Zool. Acad. Sci. H. 58, 19–27.
Stransky, C., and MacLellan, S. E. (2005). Species separation and zoogeography of redfish and rockfish (genus Sebastes) by otolith shape analysis. Can. J. Fish. Aquat. Sci. 62, 2265–2276. doi: 10.1139/f05-143
Sudo, S., Tsuyuki, K., Ito, Y., and Ikohagi, T. (2002). A study on the surface shape of fish scales. JSME Int. J. C-Mech. Syst. 45, 1100–1105. doi: 10.1299/jsmec.45.1100
Torres, G. J., Lombarte, A., and Morales-Nin, B. (2000). Sagittal otolith size and shape variability to identify geographical intraspecific differences in three species of the genus Merluccius. J. Mar. Biol. Assoc. U.K. 80, 333–342. doi: 10.1017/S0025315499001915
Keywords: geometric morphometrics, landmarks, teleost fish, elasmoid scales, fish mullet, Mugil cephalus, Mugil curema
Citation: Ibáñez AL, Guerra E and Pacheco-Almanzar E (2020) Fish Species Identification Using the Rhombic Squamation Pattern. Front. Mar. Sci. 7:211. doi: 10.3389/fmars.2020.00211
Received: 02 December 2019; Accepted: 17 March 2020;
Published: 17 April 2020.
Edited by:
Benjamin D. Walther, Texas A&M University Corpus Christi, United StatesReviewed by:
Fernanda Gabriela Biolé, University of Buenos Aires, ArgentinaMonica Vanessa Garduno Paz, Universidad Autónoma del Estado de México, Mexico
Ryan Taylor, Environment Agency, United Kingdom
Copyright © 2020 Ibáñez, Guerra and Pacheco-Almanzar. This is an open-access article distributed under the terms of the Creative Commons Attribution License (CC BY). The use, distribution or reproduction in other forums is permitted, provided the original author(s) and the copyright owner(s) are credited and that the original publication in this journal is cited, in accordance with accepted academic practice. No use, distribution or reproduction is permitted which does not comply with these terms.
*Correspondence: Ana L. Ibáñez, YW5hQHhhbnVtLnVhbS5teA==
†ORCID: Ana L. Ibáñez, orcid.org/0000-0002-6062-9172