- 1Integrative Taxonomy and Microbial Ecology Research Group, Department of Biological Sciences, Indian Institute of Science Education and Research Kolkata, Mohanpur, India
- 2Centre for Climate and Environmental Studies, Indian Institute of Science Education and Research Kolkata, Mohanpur, India
Nutrient loading from land masses pose a serious threat to coastal ecosystem functioning. In this study the hypothesis involving applicability of a benthic foraminiferal genus, Ammonia as a reliable proxy for tracking sediment organic carbon load was evaluated in Chilika, Asia’s largest lagoon. In situ environmental parameters namely water temperature, pH, dissolved oxygen and salinity were measured from surface water and from sediment water interface along with measurements of dissolved form of nutrients from six stations of Chilika for a period of 12 months. Besides, sediment samples were collected and analyzed for elucidating total benthic foraminifer communities representing 0–2 cm fraction from all the above stations. Along with benthic foraminifera, pore water was extracted from 0 to 2 cm sediment from each station and subsequently analyzed to determine salinity, pH and dissolved form of nutrients as well as collected sediment (0–2 cm) from each station was analyzed for organic carbon (Corg) content including source characterization (stable isotope of δ13C) for the entire study period. Ammonia population representing live and dead ones was also enumerated from the surface of the sediment column. The investigation revealed that concentration of dissolved nitrate were high in both surface (Max. 86.25 μM, Min. 19.5 μM) and bottom (Max. 90.17 μM, Min. 26.75 μM) while in pore water it was higher in pre-monsoon month of June (Max. 131.67 μM, Min. 68.33 μM). Stable isotopic ratios of carbon (δ13C) from sediments varied within a narrow range (Max. −20.7, Min. −24.2) and did not exhibit any seasonal pattern but supported the idea of nutrient driven increased primary production. Organic carbon (Corg) content showed trends with seasonal oscillation during pre-monsoon (Max. 5.66%, Min. 2.87%) and post-monsoon months (Max. 3.88%, Min. 2.66%) in one of the studied stations. Out of 72 sediment samples, 46 samples had stained individuals of Ammonia spp. which were considered living at the time of collection, while 53 samples had dead specimens. Pearson’s correlation co-efficient analysis showed that assemblages of Ammonia spp. were linked with sedimentary organic carbon and could be used as a reliable proxy for tracking sedimentary organic carbon loading in lagoons.
Introduction
Coastal aquatic environments are extremely vulnerable to nutrient loading as increased influx of terrigenous nitrogen (N) has been identified as one of the significant consequences of increasing anthropogenic activities globally (Vitousek et al., 1997; Boesch, 2002; Scavia et al., 2002). Phosphorus has also been highlighted as a major contributor to coastal eutrophication (Hecky and Kilham, 1988; Hecky, 1998). Apart from nutrient loading from external sources, the release of nutrients from bottom sediments into the water column known as internal loading (Søndergaard et al., 2003) can also result in eutrophication. Contributions from internal loading are known to occur in the same magnitude as external loading (Donazzolo et al., 1989; Markou et al., 2007). Nitrogen is usually released from sedimentary organic matter in the form of ammonium and nitrate (Kim et al., 2003) while phosphorus is present in the water column in predominantly orthophosphate form. Another major contributor to coastal eutrophication is silicate. The historically steady concentration of silicate loading (Gilpin et al., 2004) as opposed to increased loads of N and P in coastal zones (Conley et al., 2009) is particularly of interest globally while comparison between different nutrient concentrations have consequences for primary production.
Coastal lagoons that make up thirteen percent of world’s coastlines (Barnes, 1980; McSweeney et al., 2017) act as major sites for mineralization of organic carbon (Jansson et al., 2000), a process accelerated by increased nutrient mobilization into these shallow systems (Cloern, 2001). Nutrient loading in coastal lagoons is known to enhance primary productivity (Boynton et al., 1996; Newton et al., 2003). A significant portion (25–50%) of surface primary production sinks to benthos as part of organic carbon pool (Jørgensen, 1996). Saturation of carbon sequestration from primary production does not happen due to continuous accretion of sediment particles from nearby landzones in near shore habitats (Mcleod et al., 2011). Higher content of fine grained particles reported to be rich in organic matter (Buchanan and Longbottom, 1970; Mayer, 1994a, b; Tyson, 1995), coupled with increased concentration of available organic carbon lead to hypoxia (dissolved oxygen concentration < 2 mg L-1, Turner et al., 2005). The hypoxia in sediment pore space can be accelerated due to microphytobenthos resulting in the generation of byproducts such as ammonia and hydrogen sulfide (H2S) which can be toxic if present in higher concentration (Santschi et al., 1990; Koretsky et al., 2005). The impact of such complex interplay of factors is most pronounced in the benthic compartment as summarized by Jørgensen (1996) who stated ‘the sediments and benthic communities are, therefore, the most sensitive parts of the coastal ecosystem to eutrophication and hypoxia.’
Benthic foraminifera are one of the most dominant microscopic organisms that functionally characterize the sedimentary diversity of shallow marginal marine environments, and are widely used as a bioproxy for environmental monitoring of lagoons (Samir, 2000; Martins et al., 2013). Lagoons characterized by high nutrient input, longer water residence time and limited tidal influence are found to be often dominated by stress tolerant foraminiferal taxa (Hallock, 2012). Sediment grain size is the most limiting factor that influences distribution and abundance of benthic foraminifera (Armynot du Châtelet et al., 2009). The role of organic carbon as a stress gradient has been also evaluated for benthic foraminifera which were assigned to major ecological groups based on sensitivity and tolerance to organic matter enrichment (Alve et al., 2016). The genus Ammonia which has a ubiquitous distribution in coastlines globally is known to inhabit sheltered, shallow marine to brackish water environments (Donnici et al., 1997; Debenay et al., 2001; Frontalini et al., 2013; Sen and Bhadury, 2017) where organic matter accumulate in sediments (Hallock, 2012). Debenay et al. (2001) have attributed observed dominance to seasonal variations in salinity and increased nutrient loading, while Martins et al. (2013) have argued their dominance due to high tolerance to pollutants. A direct relationship between the genus Ammonia and sedimentary organic matter load is, however, yet to be established in shallow coastal lagoons.
Therefore, we tested the hypothesis that the benthic foraminiferal genus Ammonia is a reliable proxy for tracking sediment organic carbon load within a coastal lagoonal ecosystem. To test this hypothesis, two objectives were framed and investigated- (a) to investigate the effect of seasonal nutrient loading on the sedimentary organic carbon in a tropical coastal lagoon setting (b) to estimate the relationship between benthic foraminiferal genus Ammonia and sedimentary organic carbon load. The investigation has been undertaken in Chilika, Asia’s largest shallow, microtidal coastal lagoon situated along the coastal Bay of Bengal in the state of Odisha, India.
Materials and Methods
Study Area
Chilika lagoon (latitude 19°28′ – 19°54′ N, longitude 85° 06′ - 85° 35′ E), declared as a RAMSAR site of India since 1981, is located on the north-west coast of Bay of Bengal (Figure 1). The coastal Bay of Bengal is known to harbor sizable populations of Ammonia spp. representing different habitats (Rao et al., 2012; Naresh Kumar et al., 2012). Chilika lagoon represents an ideal shallow water coastal zone with an average depth of <2 m and can be classified as a choked lagoon as per the classification of Kjerfve (1986). Previous reports have documented the presence of six different species of Ammonia (Rao et al., 2000) from the lagoon. However, based on more recent estimates and by incorporating taxonomic revisions Sen and Bhadury (2016) have only identified the presence of three species of Ammonia within the lagoon and their abundance is overwhelming but mostly restricted within the top 2 cm of benthic layer. It has been shown that there are three distinct morphotypes classified as Ammonia T2, T10 and T6 in Chilika lagoon (Sen and Bhadury, 2016). The nomenclature provided is to genetically separate with distinct morphological features (e.g., number of chambers in final whorl, absence of secondary calcite, pores having large diameter) observed in Ammonia T2, T10, and T6 (Sen and Bhadury, 2016) which are distinguishable from Ammonia tepida as established by Hayward et al. (2004). The Ammonia populations are generally very abundant throughout the lagoon (Sen and Bhadury, 2016). Besides Ammonia populations, benthic foraminifera species diversity is low in this lagoon (in total 12 species) (Sen and Bhadury, 2016). The lagoon is separated from the Bay of Bengal by a sand bar approximately 60 km long and lost its natural marine connection in 2001 due to siltation. Presently the lagoon maintains its marine connection through two natural and one artificially dredged openings (Sahu et al., 2014). In absence of tidal variation due to limited marine connectivity, prevailing hydrological conditions of the lagoon is controlled by seasonal freshwater influx that happen during monsoon season (July to October). The huge freshwater influx (∼5.09 × 10⁹ m3 acc. to Panda and Mohanty, 2008) from the 52 rivers and rivulets that drain in to the lagoon, leads to an increase in area from 704 km2 in pre-monsoon to 1020 km2 during monsoon (Gupta et al., 2008) and transforms it into a freshwater body (Jeong et al., 2008). The sediment texture is mostly sandy in nature (average-94.21%) throughout the lagoon with silt/clay content slightly higher in the southern sector (Ansari et al., 2015, 2017, 2018). Moreover, there are biogenic carbon deposits in the lagoon originating from empty shells of mollusk (Sen, 2019). Incidentally, members of mollusk dominate in terms of abundance and diversity in this lagoon (Ansari et al., 2017). The lagoon also receives approximately 550 million L day–1 of untreated sewage discharge from the neighboring city of Bhubaneswar along with untreated domestic water discharge from 141 villages that surround the lagoon (Panigrahi et al., 2009). High rate of silt deposition (∼1.5 million MT year–1, Ghosh et al., 2006) coupled with decreased marine water inflow and increased pollutant loading has resulted in extensive macrophyte growth in the lagoon bed which roughly covers 523 km2 (Ghosh et al., 2006) of the lagoonal area. The phenomenon is more prominent in the northern sector of lagoon which has seen a remarkable increase in the growth of invasive plant species Phragmites karka (76.4 km2 in 2000 to 105.1 km2 in 2010, Kumar et al., 2011). Previous investigations looking into the impact of pollutant loading in the lagoon have reported spatial distributions of dissolved nutrients based on discharges from the distributaries in the northern sector (Panigrahi et al., 2009). A more recent investigation have identified the lagoon to be clearly eutrophic to hyper-eutrophic with respect to its Trophic State Index (TSI) values calculated from light attenuation, Chlorophyll a, total phosphate and total nitrate concentrations (Ganguly et al., 2015).
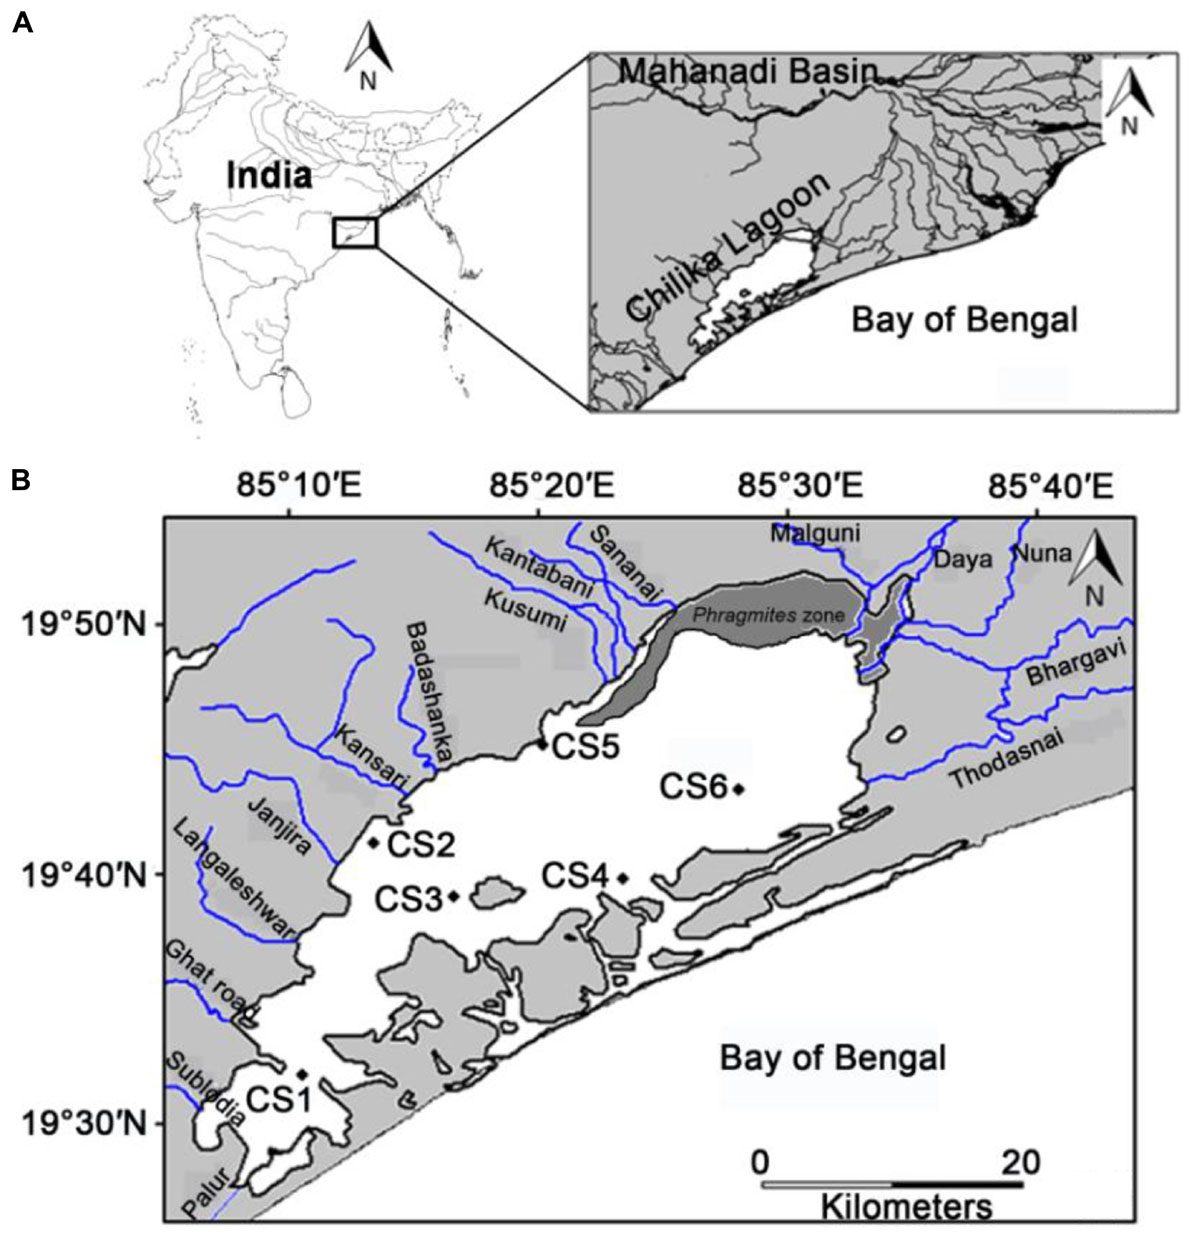
Figure 1. (A) Location of the study area with respect to the Mahanadi basin, the major source of freshwater influx in the Chilika lagoon (B) location of the sampling stations with respect to the different rivers that flow into the lagoon and can act as potential point sources for pollution.
Sampling Stations
In this study six stations were monitored across the lagoon. The selection of these stations was primarily based on their location with respect to potential sources of pollution (Figure 1). The six stations were selected out of twenty three previously established stations which were monitored for benthic diversity within the lagoon from May 2013 until February 2015 (Ansari et al., 2015, 2017). The stations utilized in the present study best represented the entirety of the lagoon environment with respect to surface water and sediment nature (Supplementary Figure S1 of Ansari et al., 2017). Out of the six stations CS1, CS3, and CS4 are located further away from any human inhabited zone of the lagoon. CS1 is located in the southern most part of the lagoon bearing greater depth of water than the other stations (Table 1). CS3 is located adjacent to the declared bird sanctuary of Nalabana Island within the lagoon, while CS4 is located in close proximity to the presently closed natural marine connection of the lagoon. The other three stations are located closer to sources of nutrient influx into the lagoon. CS2 is located in the immediate vicinity of densely populated town of Balugaon. CS5 is located near the conjoint flow of Kusumi, Kantabani and Sananai rivers that flow from the lagoon’s western catchment. CS6 is located in the most north-eastern part of the lagoon that receives freshwater inflow from the Mahanadi basin and serves as an ideal representation of the northernmost parts of the lagoon (Ansari et al., 2017). All six stations were monitored on a monthly basis for a period of twelve months starting from March 2014 till February 2015.
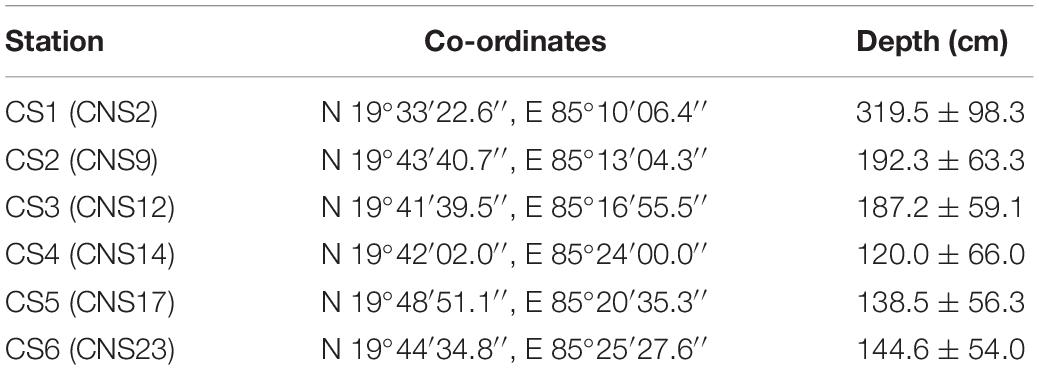
Table 1. Station location and respective average depth of water column; Corresponding station nomenclature used by Ansari et al. (2015, 2017) are mentioned within brackets.
Measurement of in situ Environmental Parameters
Parameters reflecting prevailing environmental conditions at the time of sampling were recorded using onboard equipments from surface and bottom water of the lagoon. Air and water temperatures were recorded using a digital thermometer (St9269B Multistem Thermometer, Eurolab, United Kingdom) calibrated to a precision of ±0.1°C. Salinity was determined using a handheld refractometer (ERMA, Tokyo, Japan) calibrated to a precision of ±0.1 using known pre-determined concentration of sodium chloride (NaCl) solution while pH was determined using a pH meter (Oakton pH 5+, Eutech Instruments Pte. Ltd., Singapore), standardized to a precision of ±0.01 using USA pH buffer standards (pH 4.01, 7.00, 10.01) at 25°C. Measurements from the bottom water overlaying the sediment was performed after collecting the water by deploying Niskin sampler (General Oceanics, Florida, United States of America) approximately 25 cm over the sediment surface. This was done after measuring depth of the entire water column using a graduated rod, thus ensuring no disturbance of the sediment layer. Dissolved oxygen (DO) concentrations from the surface water, sediment water interface and from the top layer of the sediment were measured in situ by inserting the galvanometric probe of a microprocessor based DO meter (Cyberscan DO 110, Eutech Instruments Pte Ltd., Singapore) with a precision of ± 0.05 mg/l, to respective zones.
Sample Collection
Water samples for estimating dissolved nutrients were collected from the surface layer and from the sediment water interface. All water samples were fixed to a final concentration of 2% formaldehyde to prevent organic breakdown of nutrients and transported to laboratory following published protocol (Choudhury et al., 2015).
Sediment samples were collected using a Ponar grab (Wild Co., FL, United States of America) of 0.025 m2 area. Sediment sub-samples were cored in triplicates from the collected sediment using a push corer having a length of 10 cm and inner diameter of 3.5 cm. The topmost 0–2 cm was collected for foraminiferal analysis, immediately stained with rose Bengal (2 gm L–1) for subsequent fixation. Distinction between live and dead collected specimens was done based on rose Bengal staining of the protoplasm. Fixed sample fractions were stored under dark conditions for a minimum of 30 days before undertaking further analyses. Additional replicates of the surface 0–2 cm fraction were also collected for extraction of pore water and determination of organic carbon (Corg) content from sediment.
Extraction of Pore Water
Pore water from the upper 2 cm of the sediment was extracted from replicate fractions immediately upon return to the laboratory. Approximately 500 cc of sediment sample was centrifuged at 5000 rpm for 20 min at room temperature and the resultant supernatant water was collected as pore water. Salinity and pH of the extracted water was immediately measured following the previously described protocols.
Measurement of Dissolved Nutrient Concentrations
Concentrations of dissolved nutrients, i.e., nitrate (NO3–), ortho-phosphate (PO43–), ammonium (NH4+) and silicate (SiO4–) were measured from collected surface water samples, bottom water samples and extracted pore water samples. All samples were passed through a 0.45 μm nylon filter (Merck-Millipore, Darmstadt, Germany) in order to remove suspended particulate matter, and the concentrations of dissolved nutrients were determined spectrophotometrically (U-2900UV/VIS Spectrophotometer, Hitachi, Tokyo, Japan). Dissolved NO3– concentrations were subsequently measured following published methodology (Finch et al., 1998). Likewise, dissolved PO43– and SiO4– levels were measured spectrophotometrically by acid-molybdate (Strickland and Parsons, 1972) and ammonium molybdate (Turner et al., 1998) methods respectively. Concentrations of dissolved NH4+ were also determined following potassium ferrocyanide method (Liddicoat et al., 1975).
Determination of Sediment Composition
Composition of the surface sediment was determined from unfixed fractions collected during sampling. Sediment samples were examined for mollusk shells, which were removed manually to minimize biogenic carbonate. Subsequently, the samples were treated with 10% hydrogen peroxide (H2O2), which was changed at regular interval till bubbling from the sediment ceased to ensure removal of all organic components. The sediment samples were then washed vigorously under deionized water and dried for 24 h at 60°C to remove all moisture. Ten grams of the sediment (dry weight) was vigorously stirred for 2 h in a solution of 0.01% sodium hexa-metaphosphate [(NaPO3)6] to separate the sediment particles. The resulting mixture was then wet sieved through the mesh sizes of 500, 250, 125, and 63 μm. The resultant fractions were dried and weighed to determine the sediment composition and were defined according to Wentworth size classes (Buchanan, 1984). This classification has been followed in the Chilika lagoon as part of long-term monitoring of benthic biodiversity (Ansari et al., 2015, 2017, 2018).
Characterization of Sedimentary Organic Carbon
Approximately 1 c.c. of surface sediment samples were initially acidified with 5% HCl in order to dissolve all carbonates, followed by rinsing with a minimum of 1000 ml of deionized water. Subsequently, sediment was dried at 60°C for 24–48 h. Dried samples were ground to a fine powder using mortar and pestle. Samples for carbon stable isotope analysis were combusted in FLASH 2000 Elemental Analyzer (Thermo Fisher Scientific, Massachusetts, United States of America). Stable isotopic ratios were determined on a Mass Spectrometer (MAT 253, Thermo Fisher Scientific, Massachusetts, United States) with respect to tank CO2 and are expressed relative to Vienna Pee Dee Belemnite (VPDB) as δ values, defined as:
where X = 13C/12C. Reproducibility of values was calibrated to a precision of 0.1‰. Determination of organic carbon (Corg) was performed by calibrating the tank CO2 with respect to IAEA-CH3 Cellulose used as internal reference material, measured after every four samples to maintain the quality of the estimation.
Identification and Estimation of Ammonia spp.
Ammonia spp. was identified following the genus description established by Hayward et al. (2004) and based on a previous study undertaken in Chilika lagoon (Sen and Bhadury, 2016). Ammonia spp. was counted from stained and fixed fractions of upper 2 cm of sediment collected from the lagoon. Sediment of 10 c.c. from each fraction was wet sieved under a gentle stream of freshwater through mesh sizes of 500 and 63 μm. The collected residue in ≥63 μm mesh sizes were observed under binocular microscope (Zeiss Stemi DV4, Carl Zeiss AG, Oberkochen, Germany) by wet splitting. Specimens bearing stained cytoplasm up to the penultimate chamber were considered to be live, while unstained specimens having all the chambers finely preserved up to the prolocular chamber were considered as being dead at the time of collection. Specimens displaying visible primary organic sheet were considered to be taphonomically altered along with specimens having test breakage, and were not considered for the study.
Statistical Analyses
Relationships within the different environmental factors and with observed numbers of live and total (live + dead) foraminifera were tested by calculating Pearson’s correlation coefficient and considering p-values ≤ 0.05 as significant. Presence of seasonal or spatial variation within the Ammonia assemblage was tested by performing a cluster analysis. All abundance data were Log (X + 1) transformed prior to analysis and analysis was performed using Bray–Curtis similarity. Further confirmation of seasonal and spatial variation was performed by employing an analysis of variance (ANOVA) approach among all possible seasonal and spatial combinations of untransformed total foraminiferal numbers. All statistical analyses were performed in PAST version 3.09 (Hammer et al., 2001).
Results
In situ Hydrological Parameters
Temperature at the surface of the lagoon closely matched prevailing air temperature at the time of sample collection (Figure 2). The temperature followed tropical climate of the region with increased values during the months of March- May reaching highest during April, 2014 that corresponds to summer in the region. This pattern was consistently reflected between air and water temperatures. The temperature showed decline from June and the monsoon period of July to October brought down both air and water temperatures. For the months of November 2014 till February 2015 there was a general fall in air and water temperatures which roughly equates to winter in the north-west coast of Bay of Bengal.
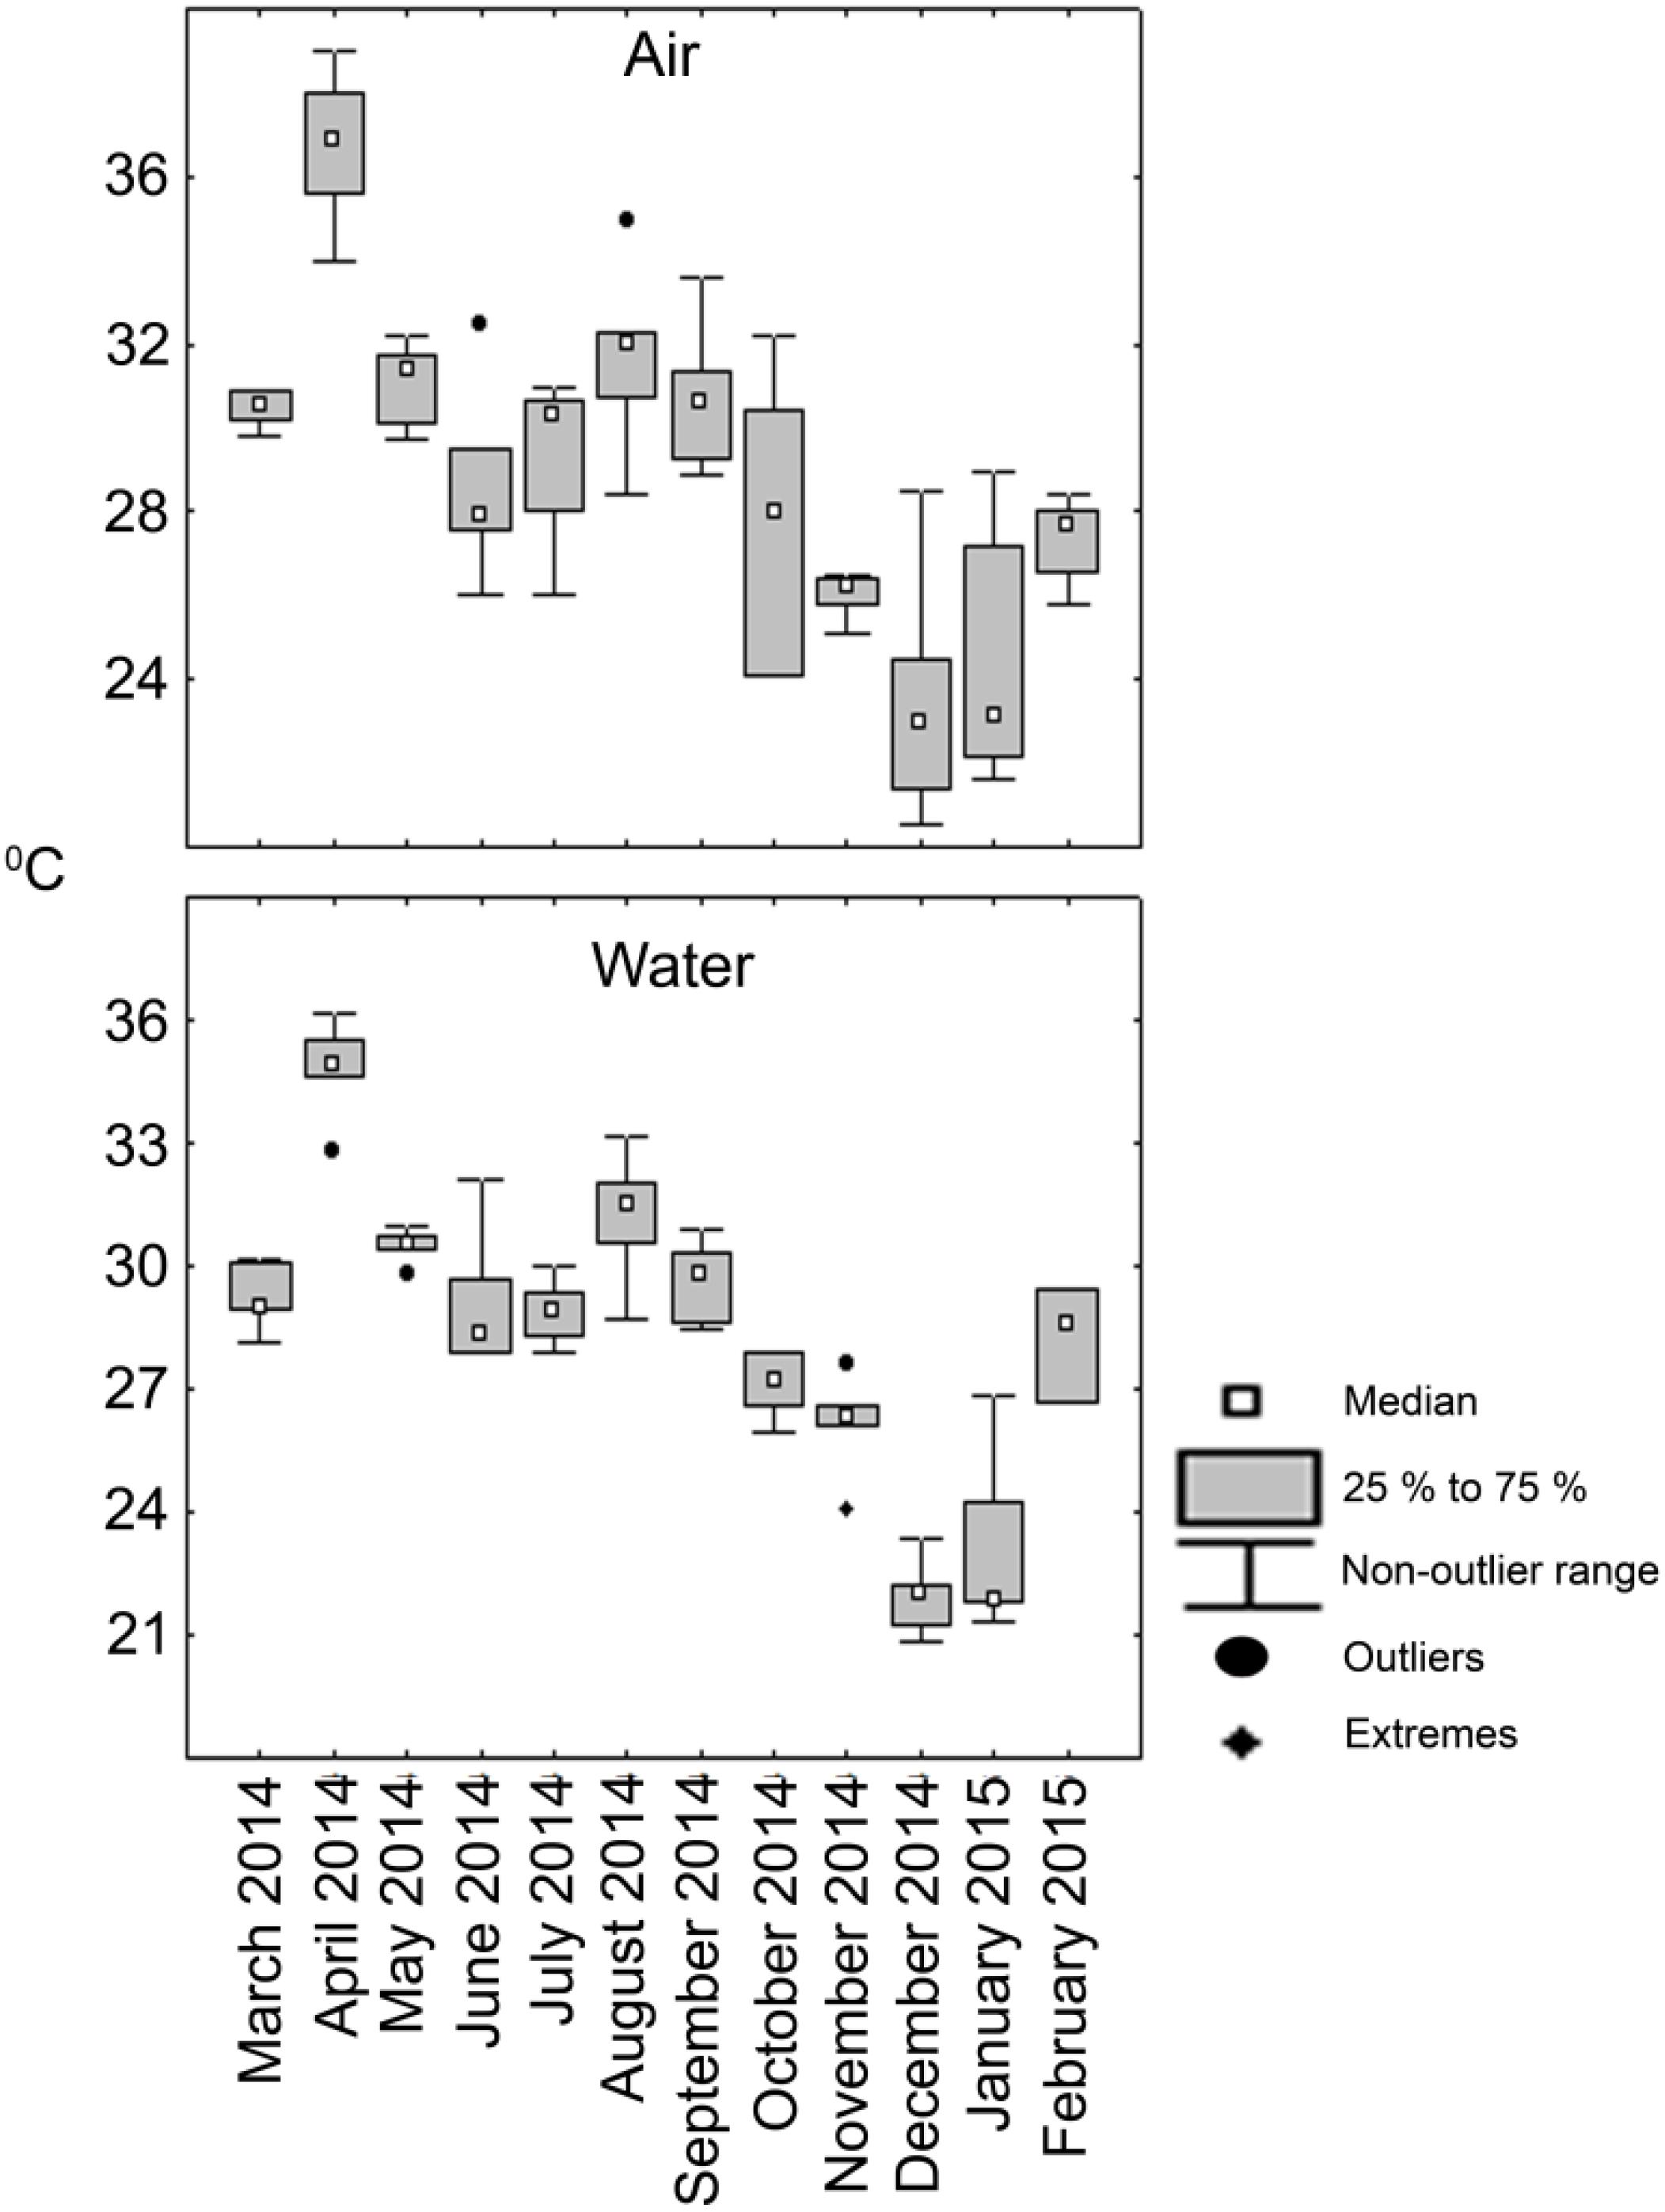
Figure 2. Box and whiskers plot depicting the variation of temperature (°C) in the lagoon observed during the sampling period.
The salinity profile displayed seasonal changes in observed values (Figure 3). During the pre-monsoon months of March till June, variability existed in both surface (Max. 30.3, Min. 0.7) and bottom water (Max. 30.3, Min. 0.7) values within the sampling stations. Pore water salinity for the summer season was determined starting from June, 2014.
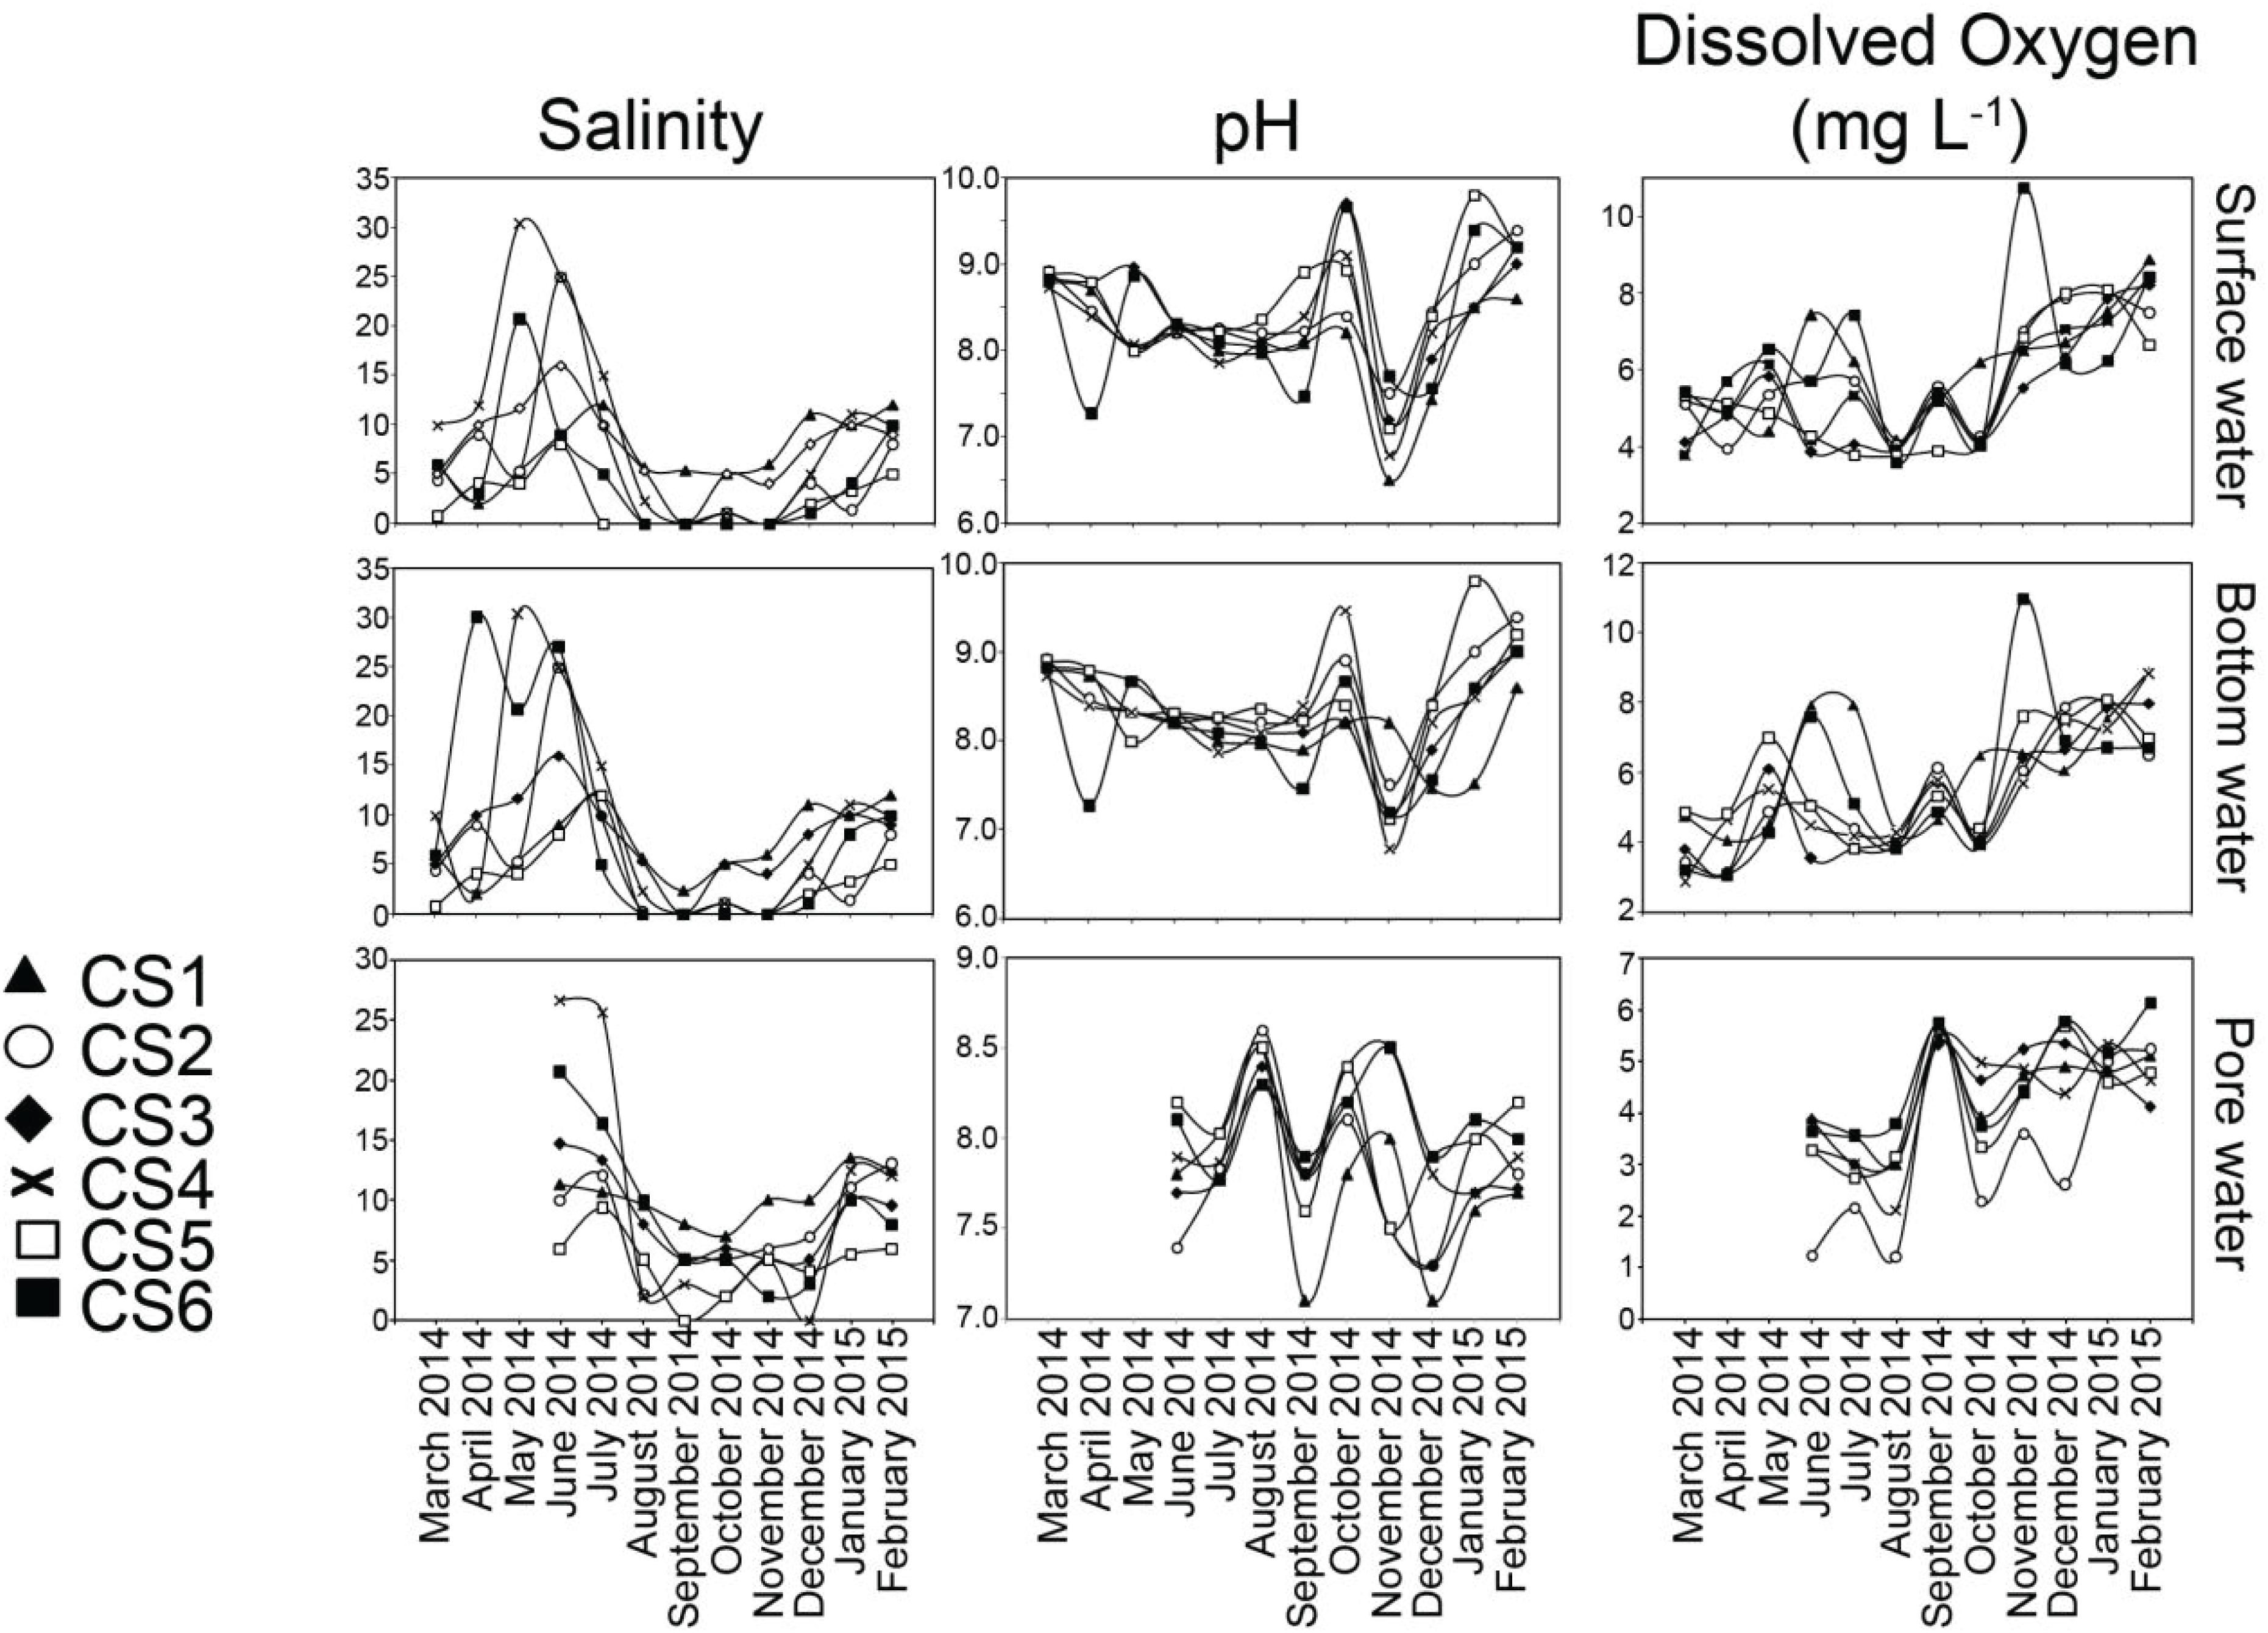
Figure 3. Values of salinity, pH and dissolved oxygen measured for surface water, bottom water, and pore water (sediment) from each sampling station of the lagoon during the sampling period representing March 2014 to February 2015. For pore water, measurements of the above parameters were undertaken from June 2014 to February 2015.
During monsoon all the stations displayed a decrease in their salinity profiles. The change was most pronounced on surface and bottom water values of five stations (CS2–CS6) which had salinities of 0 in September. Pore water salinity ranged between 25.7 (CS4 July) and 0 (CS5 September). During the post-monsoon (November–February) there was a gradual increase in the salinity. Salinity values across the depth profile displayed significant (p ≤ 0.05) correlation within the profiles studied (Table 2).
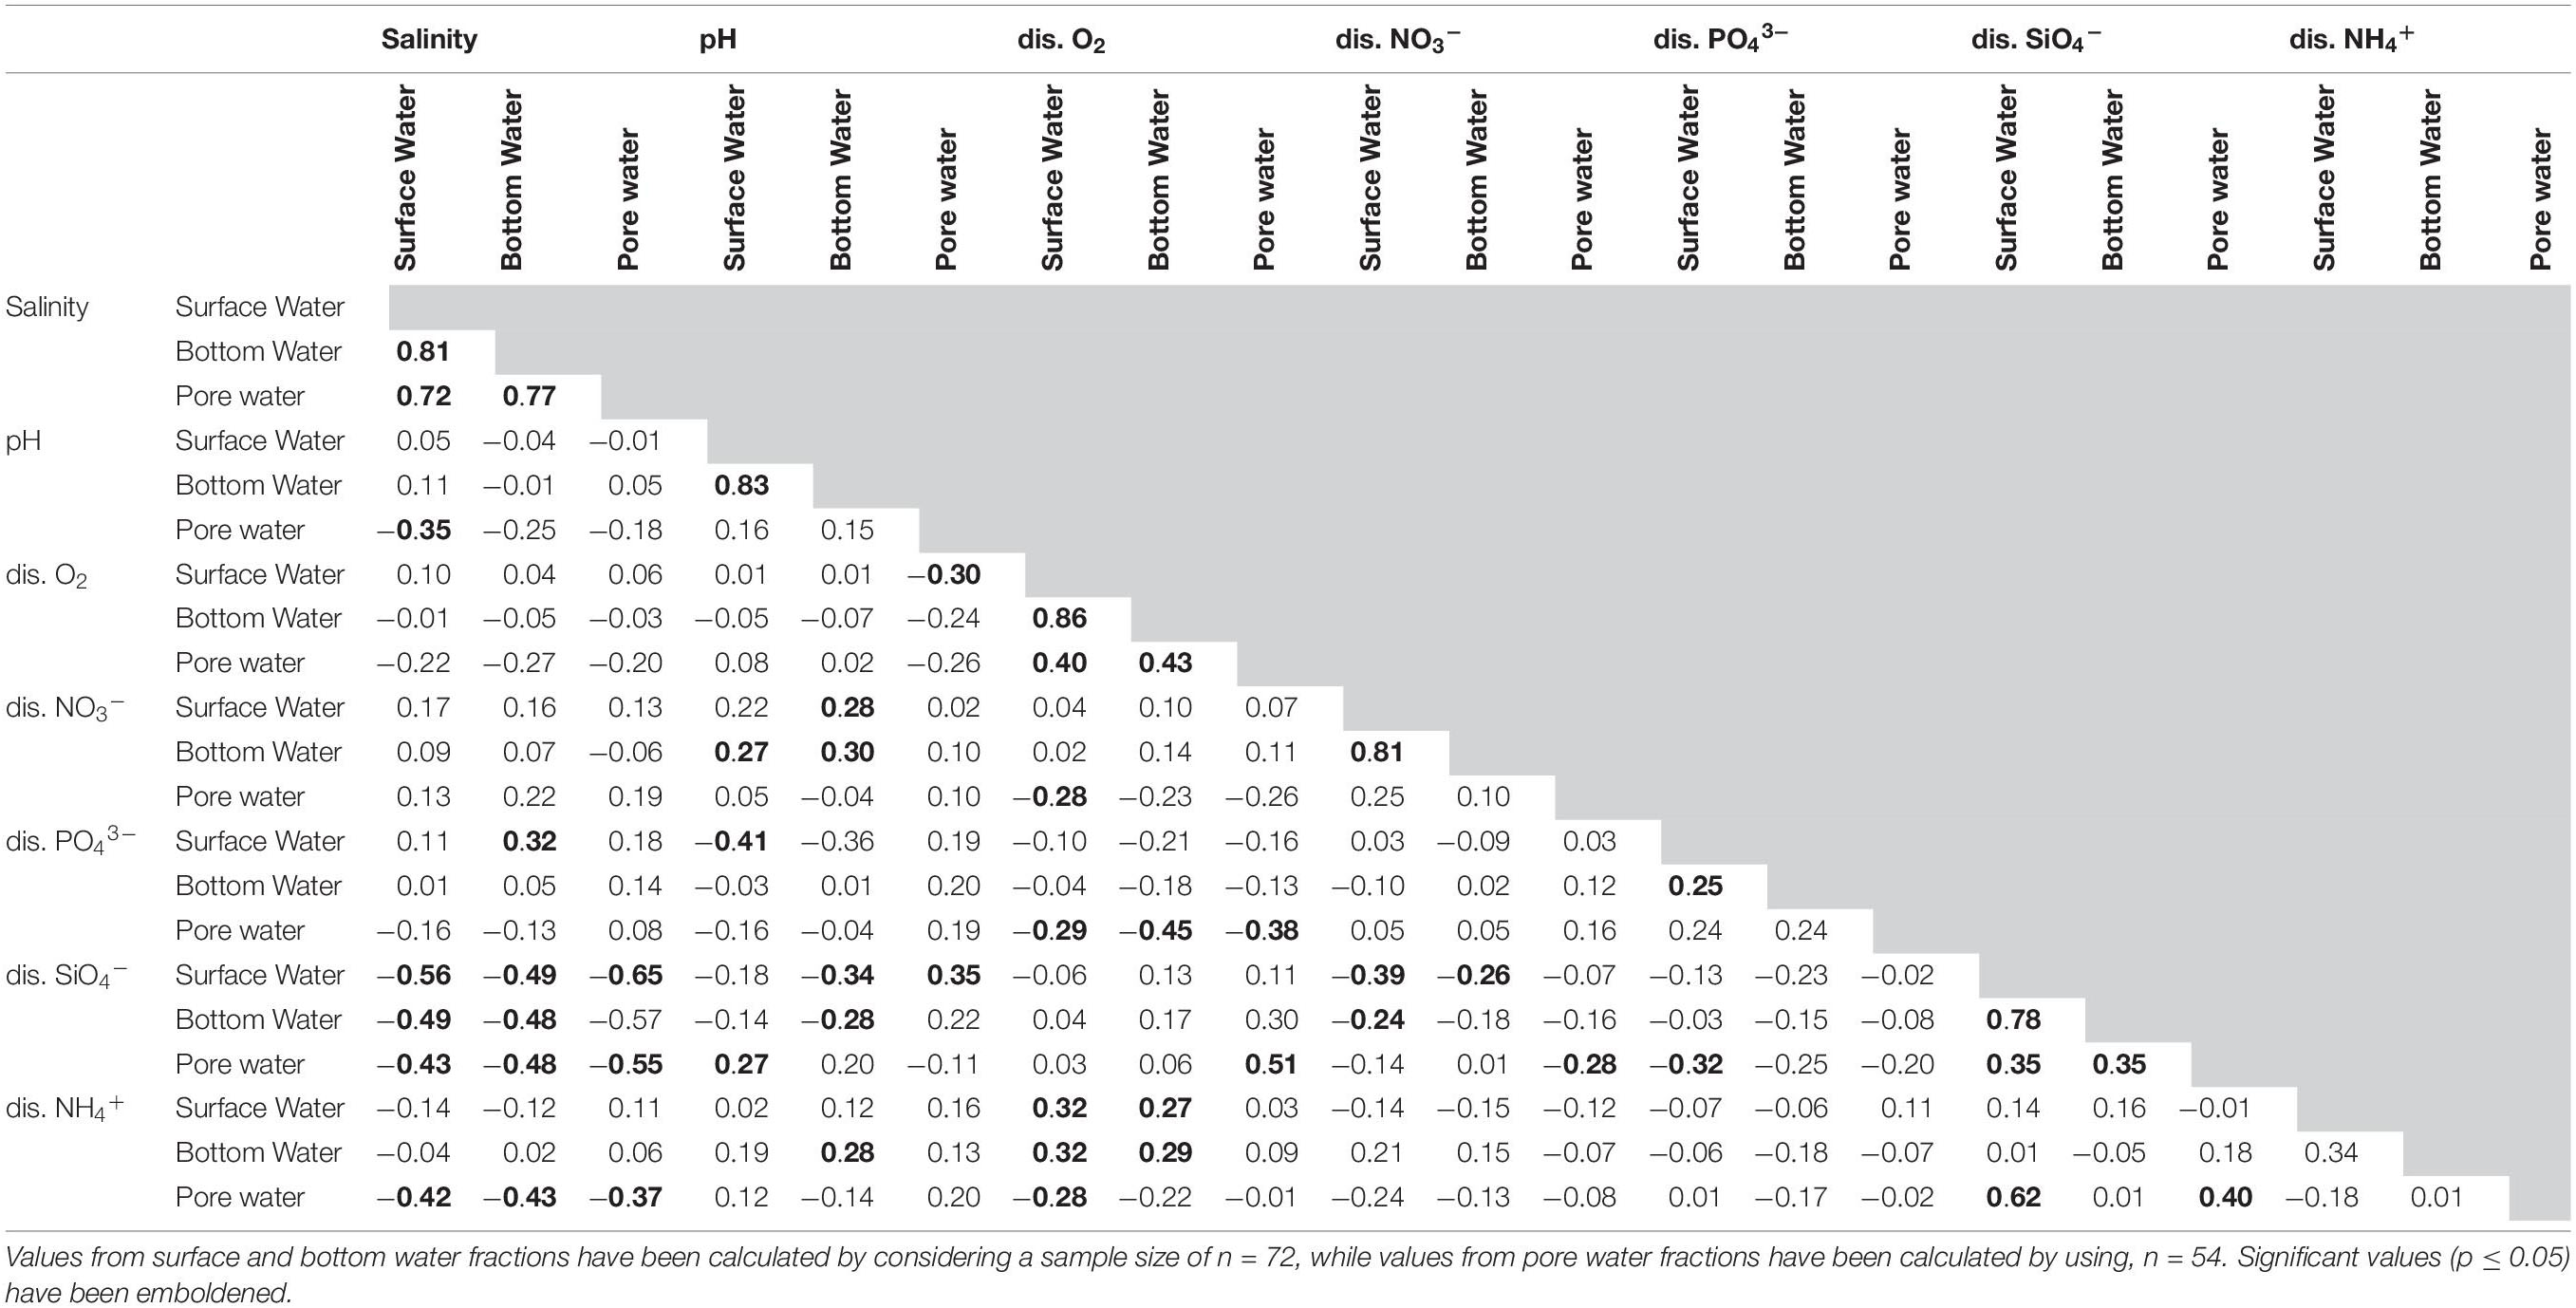
Table 2. Values of Pearson’s correlation co-efficient between the environmental and nutrient parameters observed in the lagoon for the studied period.
Values of pH displayed almost no variation within the depth profiles (Figure 3). Surface water pH values (Max. 9.1, Min. 6.5) varied widely between sampling times, a trend mirrored by bottom water overlaying the sediment (Max. 9.2, Min. 6.8). Increased pH in surface as well as bottom water was observed in the month of October (Max. 9.1, Min. 8.2 and Max. 9.5, Min. 8.2 respectively). Surface (Max. 7.7, Min. 6.5) and bottom (Max. 8.2, Min. 6.8) water pH presented significant correlation in November (Table 2). The pore water pH was found to be more acidic (Max. 8.6, Min. 7.1) compared to its overlaying counterparts and most had values < 8.0.
DO concentrations in the water column and pore space were stable during the pre-monsoon and monsoon months (Figure 3). Post-monsoon months showed a continuous increase in DO values. The lowest range of DO values in surface waters were observed in August (Max. 4.19 mgL–1, Min. 3.60 mgL–1) while the highest was observed in February (Max. 8.88 mgL–1, Min. 6.67 mgL–1). Spatially however the highest value was recorded at CS6 (10.74 mgL–1) in November. The lowest DO concentration from surface water was also reported from CS6 (3.60 mgL–1) in August. The DO values from the sediment water interface reflected the general trends observed in the surface water although having lower range of values. DO values from top 2 cm of the sediment displayed comparatively lower range (Max. 6.14 mgL–1, Min. 1.22 mgL–1). DO values recorded from surface, bottom and pore water displayed significant (p ≤ 0.05) correlation amongst them (Table 2).
Concentration of Dissolved Nutrients
Measured concentration of dissolved nitrate (NO3–) followed strong seasonal pattern in surface and bottom waters of the lagoon (Figure 4). During the pre-monsoon months, NO3– concentrations were relatively high in both surface (Max. 86.25 μM, Min. 19.5 μM) and bottom (Max. 90.17 μM, Min. 26.75 μM) waters. During this period CS5 had highest values (surface: Max. 86.25 μM, Min. 54 μM; bottom: Max. 90.17 μM, Min. 45.12 μM) of the nutrient in both the profiles compared to other stations. Pore water concentrations of NO3– were significantly higher (Max. 131.67 μM, Min. 68.33 μM) in the pre-monsoon month of June compared to the other layers studied with the highest value recorded from CS5. During the monsoon there was considerable lowering of NO3– values in surface (Max. 47.2 μM, Min. 19.73 μM) and bottom water (Max. 46.07 μM, Min. 18.8 μM) values as compared to concentrations in the pore water (Max. 162.47 μM, Min. 27.78 μM). The surface water values were significantly correlated with bottom water values while weak relationship was observed with their pore water counterpart (Table 2). Post-monsoon dissolved NO3– concentrations presented a gradual return to pre-monsoon concentrations in both surface (Max. 83.67 μM, Min. 18.33 μM) and bottom waters (Max. 95.33 μM, Min. 16 μM), while pore water concentrations however decreased (Max. 105.8 μM, Min. 9 μM) during this period.
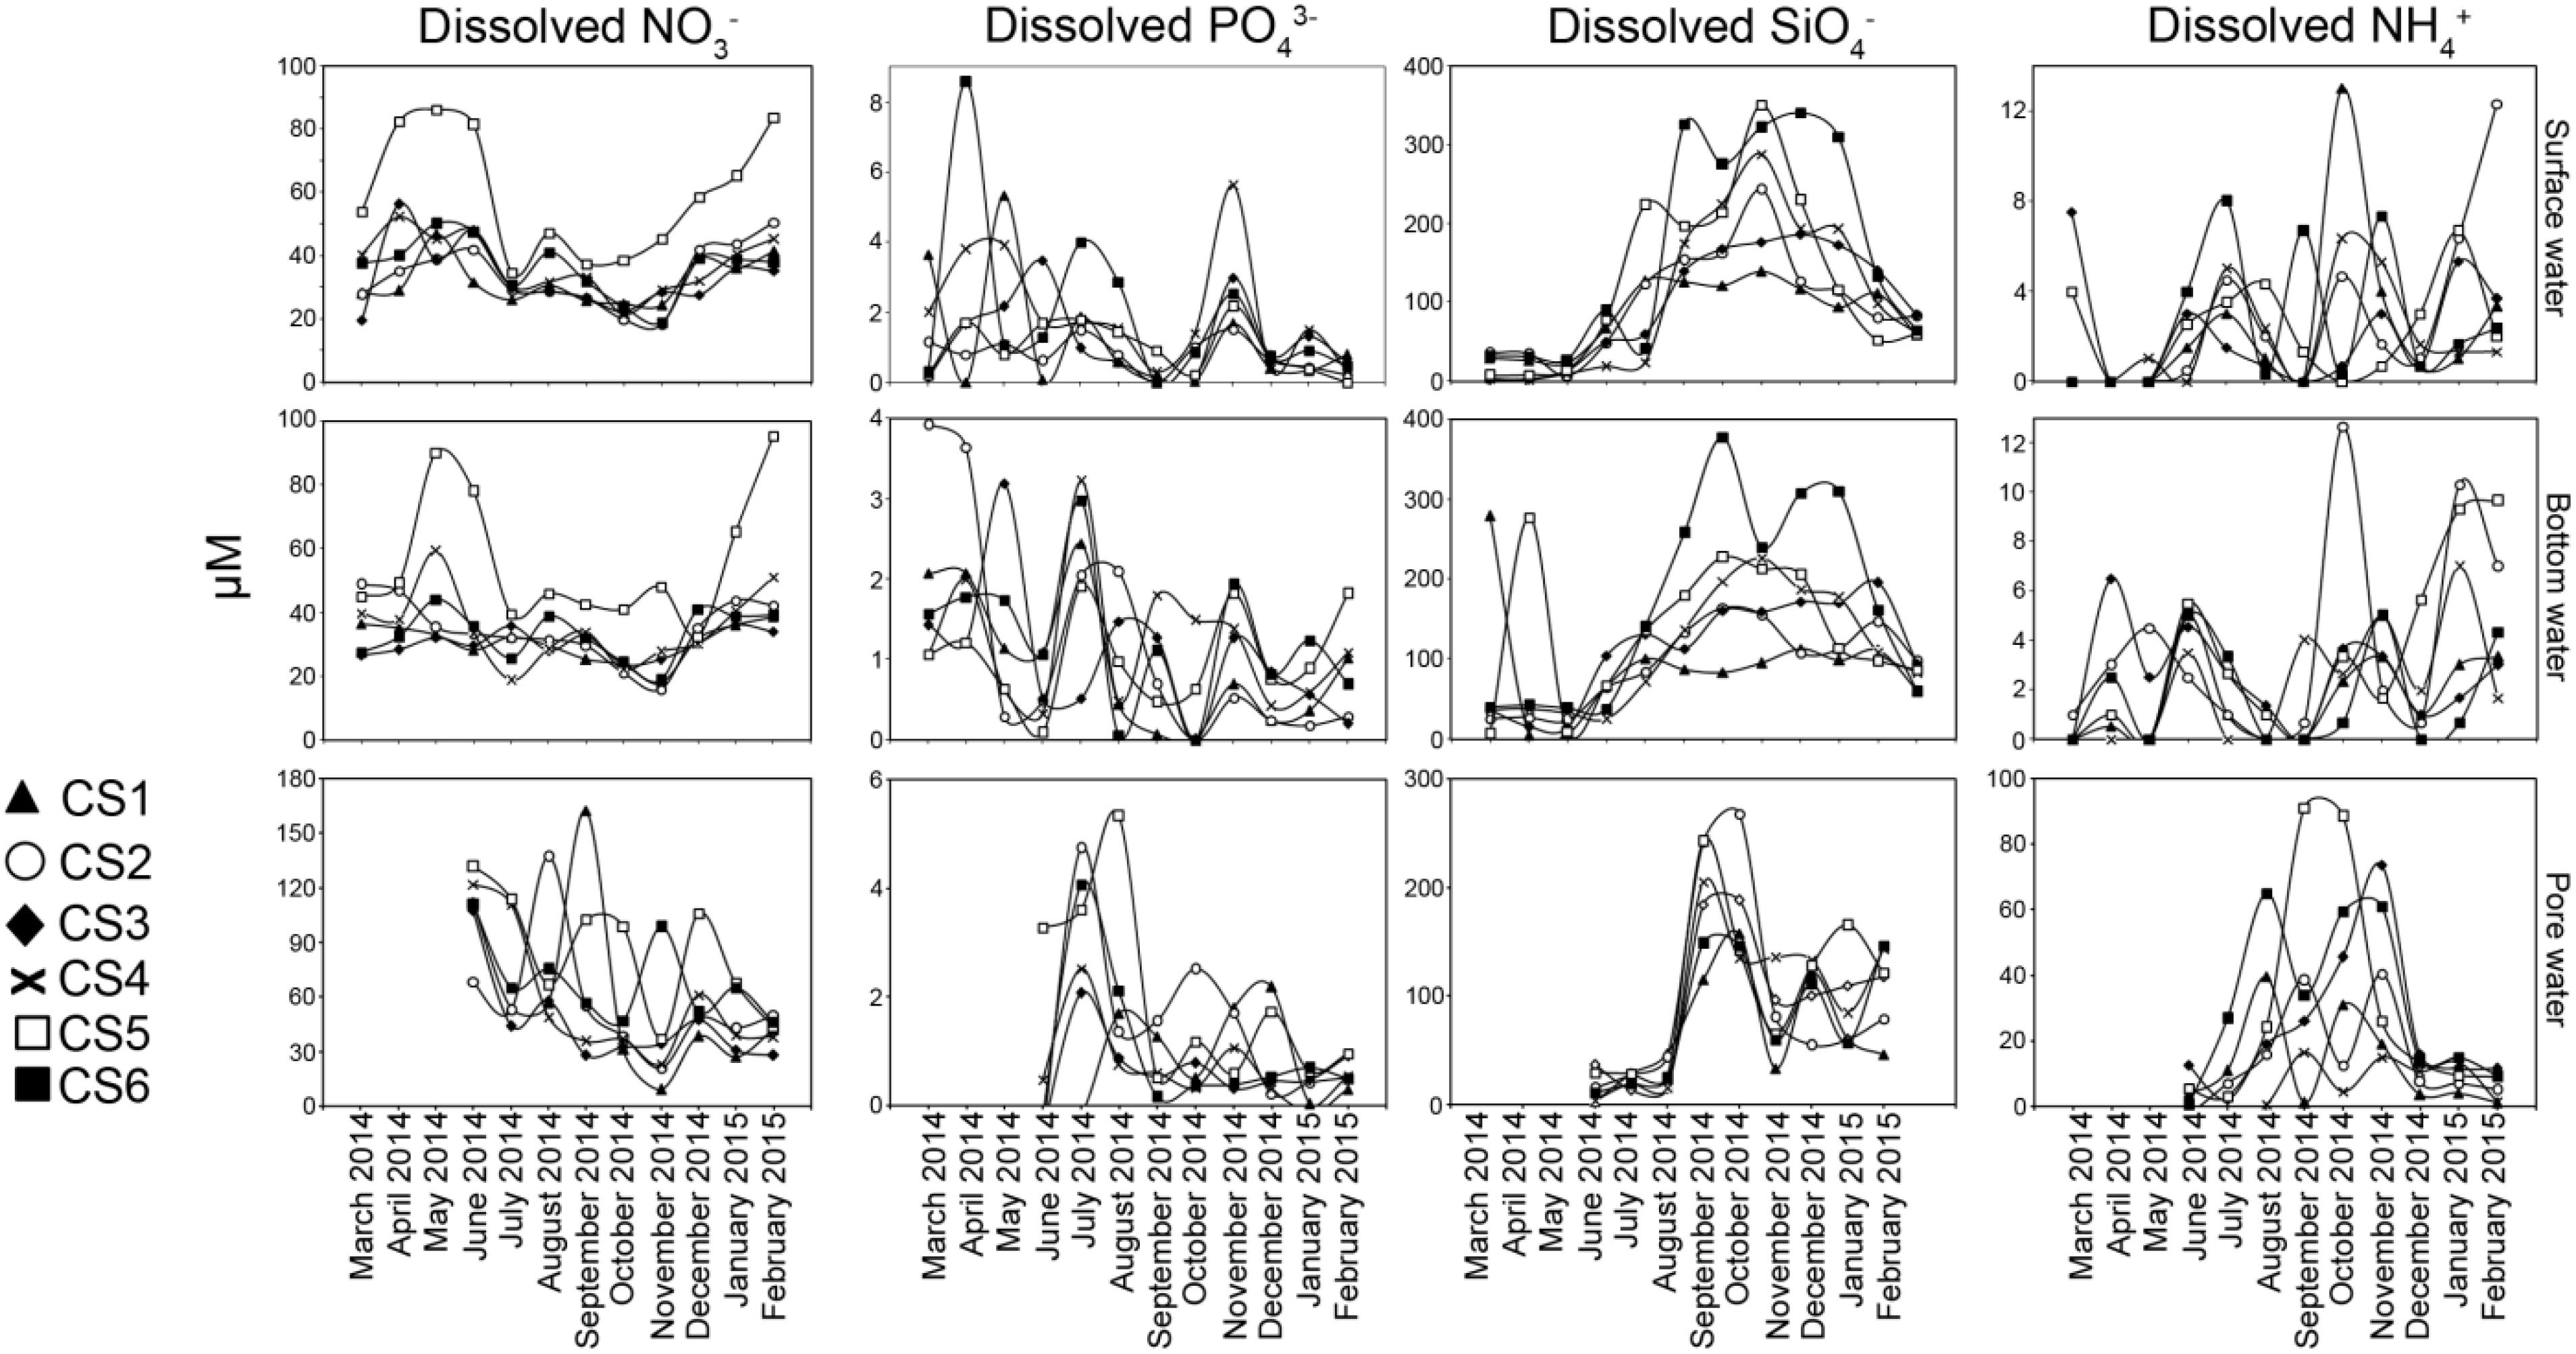
Figure 4. Concentrations of dissolved nutrients estimated from surface water, bottom water, and pore water (sediment) measured from each sampling station of the lagoon during the sampling period representing March 2014 to February 2015. For pore water, measurements of the above parameters were undertaken from June 2014 to February 2015.
Orthophosphate (PO43–) concentrations (Figure 4) in surface water showed wide variability (Max. 8.57 μM, Min. below detection limit of 0.2 μM) among the studied stations during pre-monsoon months while a lower range was observed in bottom water (Max. 3.92 μM, Min. 0.09 μM). The pore water concentrations were mostly below detection limit during June. The concentration of PO43– decreased during the monsoon months in both surface water (Max. 4.0 μM, Min. beyond detection limit) and bottom water (Max. 3.22 μM, Min. beyond detection limit). During monsoon, pore waters concentrations of PO43– were relatively higher compared to June 2014 (Max. 5.33 μM, Min. beyond detection limit). During post-monsoon, surface water concentration of PO43– was mostly low (Max. 2.98 μM, Min. beyond detection limit) barring one sample (CS4 November 2014, 5.62 μM). Similarly, bottom water concentration also decreased (Max. 1.93 μM, Min. 0.18 μM) along with pore water concentration (Max. 2.18 μM, Min. beyond detection limit). Within the profiles, significant correlation existed between the surface water and bottom water concentrations, a relation not present with pore water values.
Concentrations of dissolved silicate (SiO4–) displayed a strong seasonal pattern (Figure 4). Mostly low values of SiO4– were observed during the pre-monsoon period (surface Max. 90 μM, Min., 2.33 μM; bottom Max. 279 μM, Min. 5 μM; pore water Max. 36.17 μM, Min. 2.33 μM). During the monsoon, there was a rapid increase in SiO4– (surface Max. 351 μM, Min. 24 μM; bottom Max. 377.5 μM, Min. 71.5 μM, pore water Max. 268 μM, Min. 13.7 μM) with CS5 and CS6 showing higher values than other stations. Following monsoon, a drop in dissolved nutrients concentration was observed starting November. Surface water values reflected a reversal to pre-monsoon values (Max. 340.67 μM, Min. 53 μM) along with bottom water (Max. 310.5 μM, Min. 59.5 μM) except for CS6 which maintained higher values till December. The SiO4– concentrations in pore water though lower (Max. 165 μM, Min. 33 μM) than monsoon values was still higher compared to June. Amongst the dissolved nutrient concentrations studied, SiO4– displayed strongest relationship within the depth profiles as significant correlations were observed between all the fractions (Table 2).
Dissolved ammonium (NH4+) concentration was mostly lower than the detection limit during the first three months of the study in the surface layer followed by low concentrations in June (Figure 4). Bottom water concentration of the nutrient was also low during the pre-monsoon period (Max. 6.5 μM, Min. beyond detection limit). Pore water values (Max. 6.5 μM, Min. beyond detection limit) were also found to be low in June. Surface water concentrations did not vary much during monsoon (Max. 13.0 μM, Min. beyond detection limit) and post-monsoon (Max. 12.33 μM, Min. 0.67 μM) seasons. Similar range of concentrations was also recorded from bottom water samples (monsoon Max. 12.67 μM, Min. beyond detection limit, post-monsoon Max 10.33 μM, Min. beyond detection limit). Increased NH4+ was detected from pore water during the monsoon months of August till October (Max. 91.0 μM, Min. 0.05 μM) and in November (Max. 73.5 μM, Min. 15 μM).
Sediment Composition
Sediment composition at the six stations (Figure 5) displayed little variation with time among which four stations, i.e., CS1, CS2, CS3, and CS6 were entirely dominated by silt-clay (<63 μm) fraction (silt-clay content Max: 99.69%, Min. 25.14%). CS4 was the only station with a higher fraction of sand (>63 μm) particles. CS5 however displayed more variation in its sediment composition comparatively. The variation in silt-clay content (Max. 86.24%, Min. 33.94%) was considerably large among the samples collected from CS5.
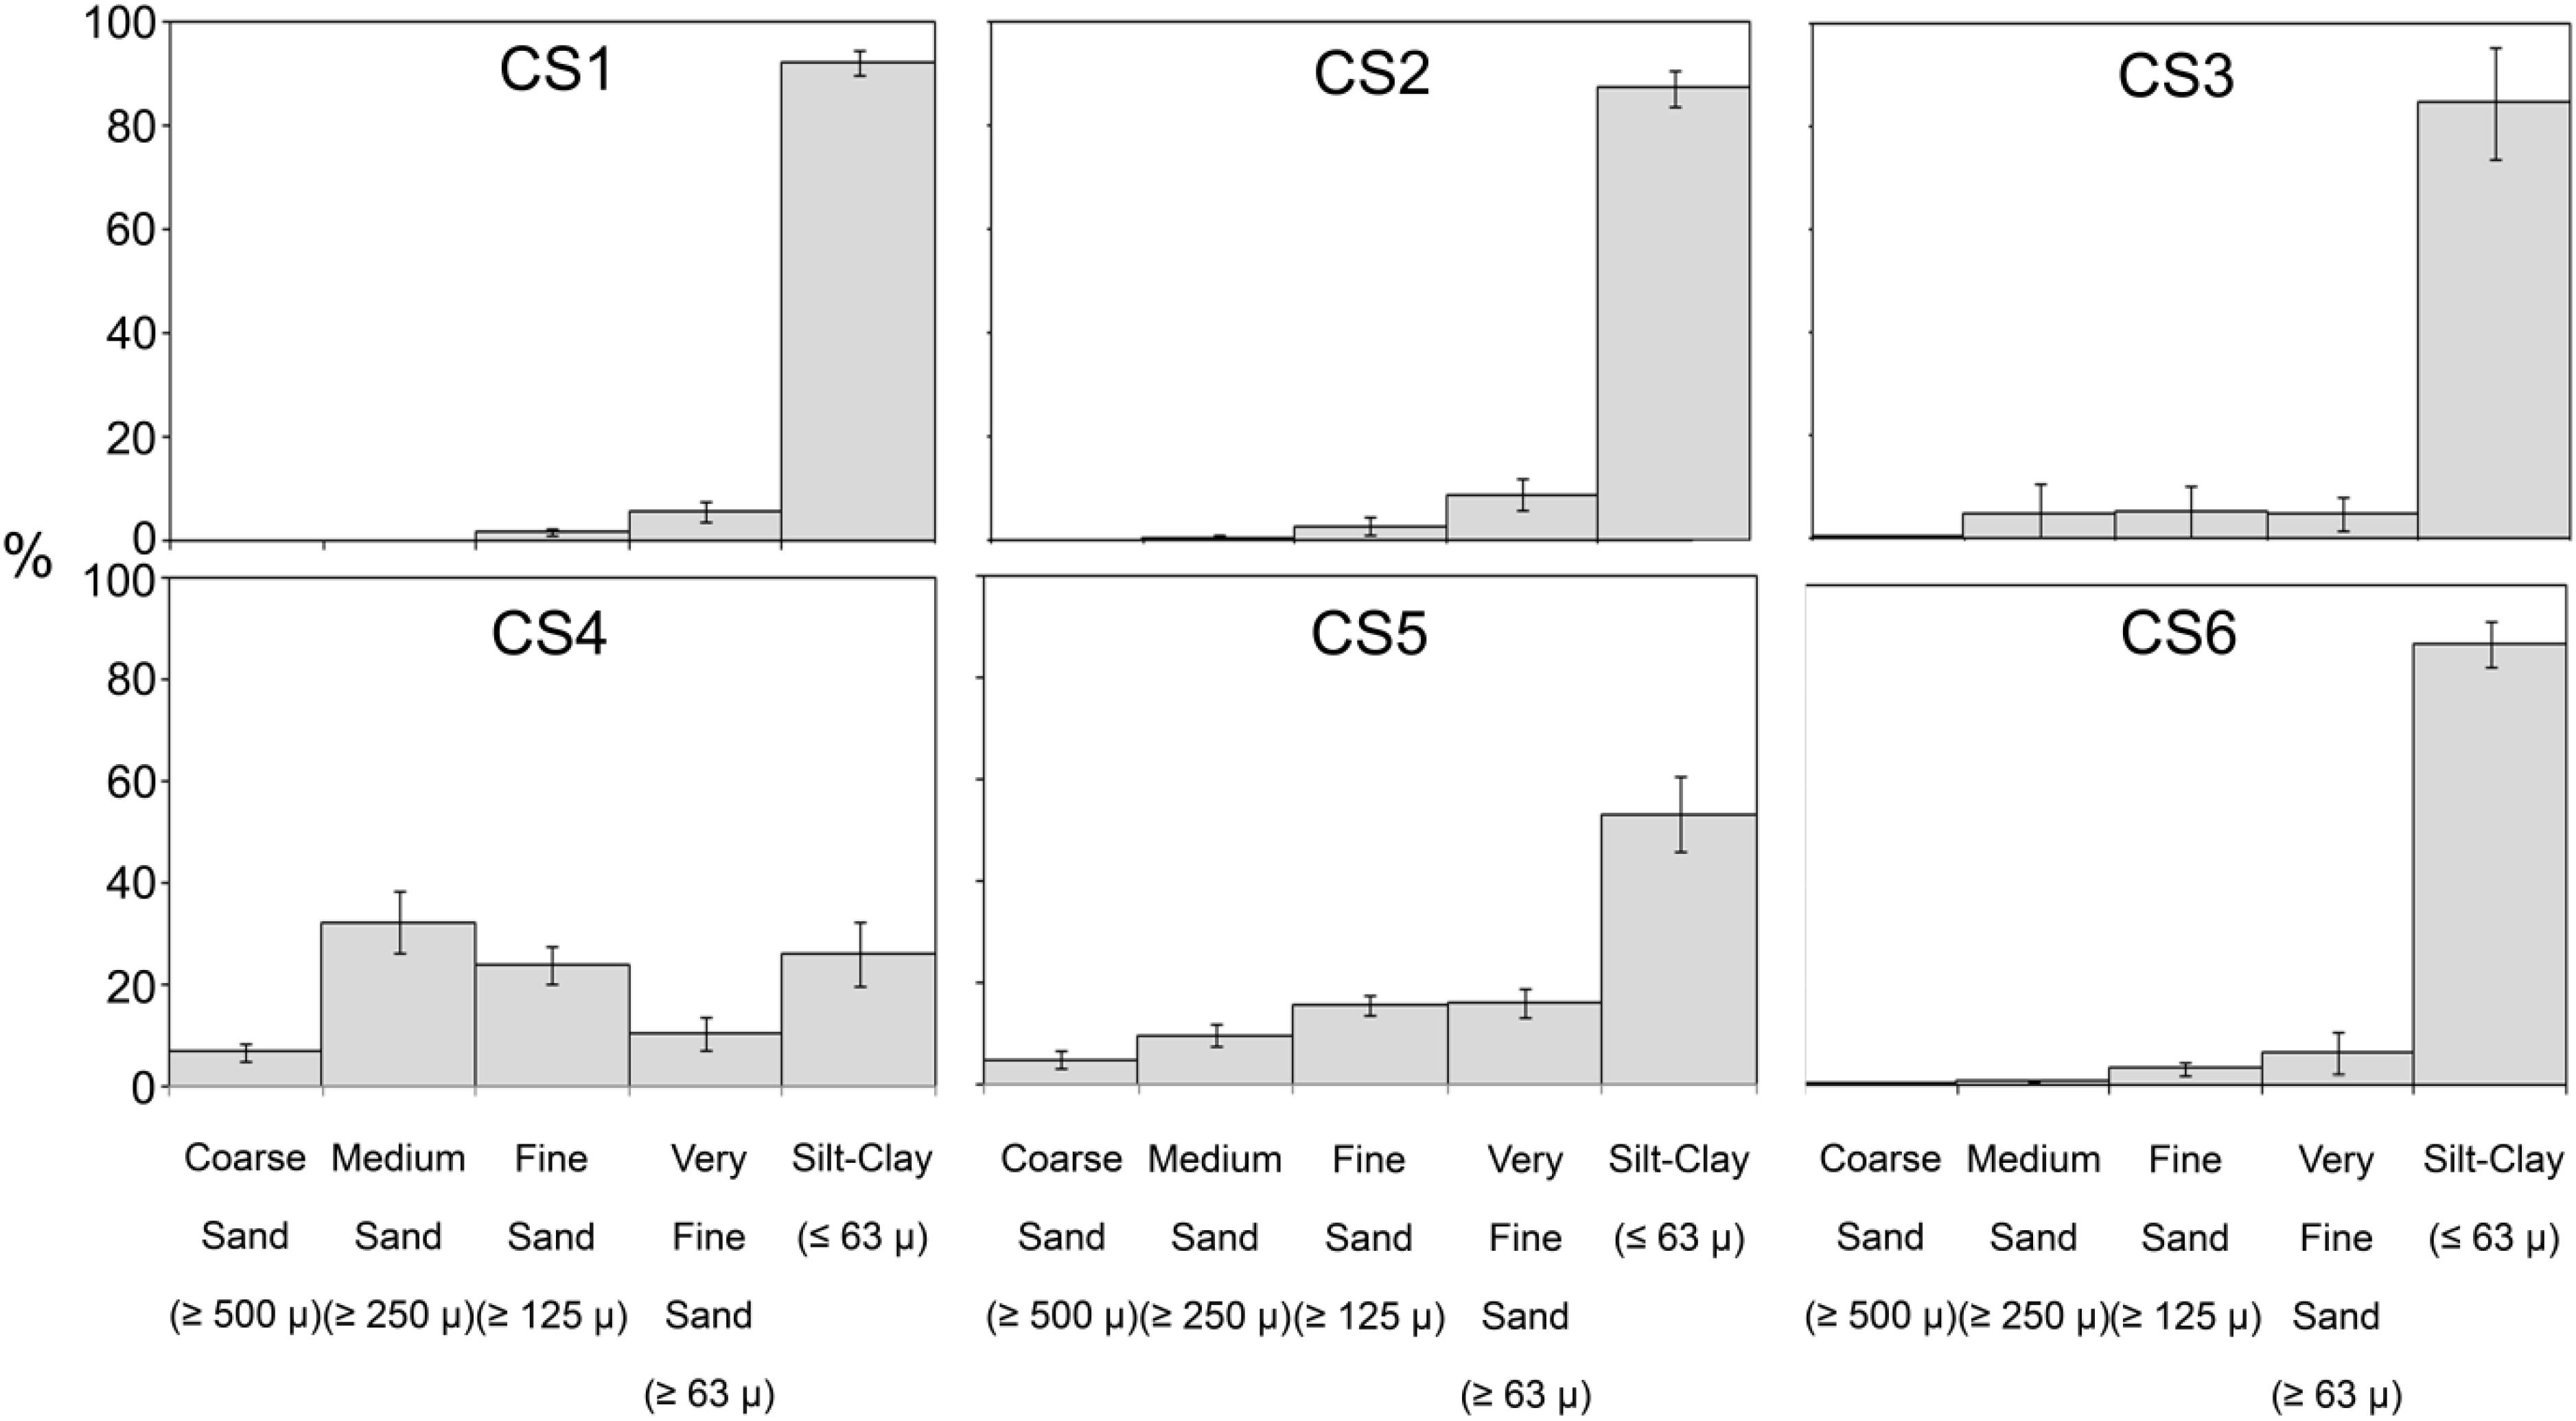
Figure 5. Sediment composition across the sampling stations in the lagoon for study period. Observed size classes of sediment particles have been grouped following Wentworth scale.
Sedimentary Organic Carbon
Stable isotopic ratios of carbon (δ13C) from the sediments varied within a narrow range (Max. −20.7, Min. −24.2) and did not show any seasonal pattern (Figure 6). Organic carbon (Corg) content however oscillated in CS5; there were increased values during the pre-monsoon months of March until May (Max. 5.66%, Min. 2.87%) and the post-monsoon months of December-February (Max. 3.88%, Min. 2.66%). Values of Corg in other stations varied within a narrow margin (Max. 3.71%, Min. 0.31%) and changed little with respect to seasons.
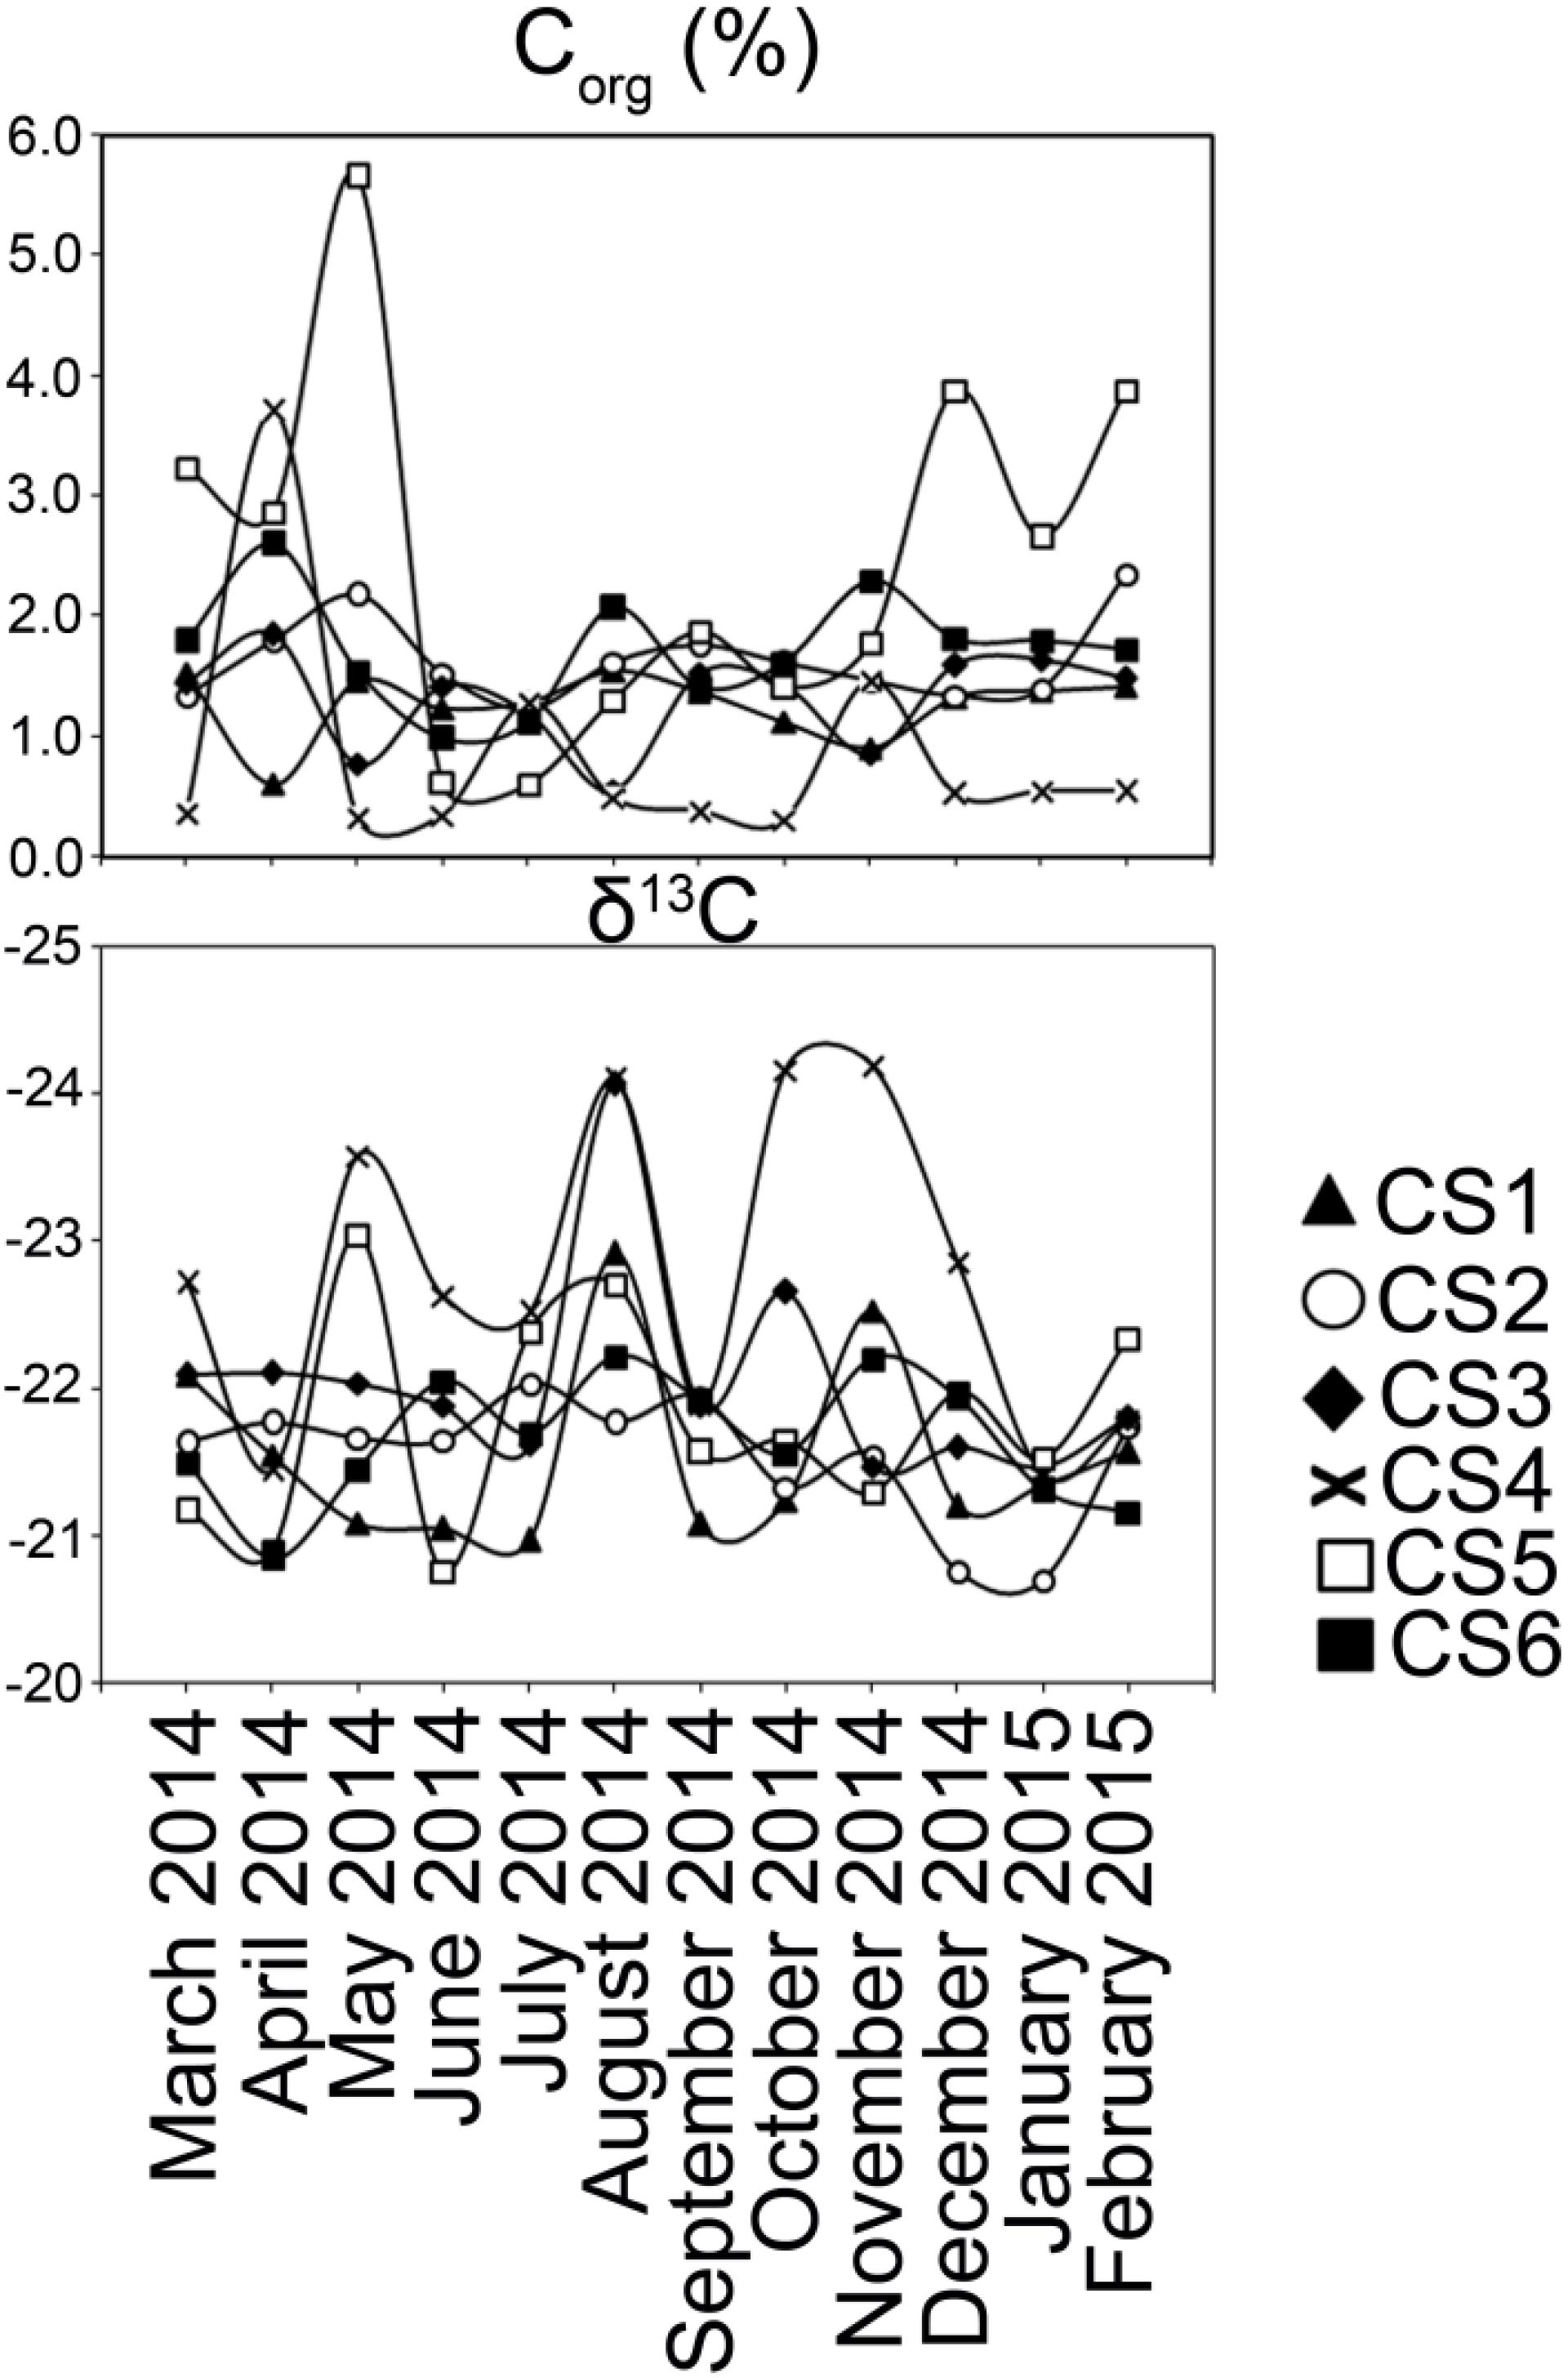
Figure 6. Characterization of sedimentary organic carbon. Values of Corg and δ13C estimated from the surface (0–2 cm) sediment column collected from each sampling station of lagoon during the study period.
Characterization of Ammonia spp. Population
Number of Ammonia spp. was highly variable (Figure 7). Out of the total 72 sediment samples, 46 samples had stained individuals which were considered living at the time of collection, while 53 samples had dead specimens only. The number of live and dead specimens was relatively low at CS1 as the highest number of living specimens (8/10 c.c.) was observed in the sample of July 2014, while the highest number of dead specimens (30/10 c.c.) were recorded in September 2014. CS 2 by comparison had the highest number of dead specimens recorded from across the lagoon with the highest values being 819/10 c.c. (June 2014). The highest number of living specimens at CS2 was observed in November 2014 (36/10 c.c.). Station CS3, during most part of the study period was characterized by low number of living and dead specimens of Ammonia spp. except in September 2014 sample, where the number of living specimens was 54/10 c.c. The highest number of dead specimens observed at CS3 was recorded in the sample collected in December 2014 (24/10 c.c.). The population at CS4 was also mostly characterized by low number of dead specimens alongside fewer living individuals except in the months of March and April 2014, when the number of dead specimens were relatively high (129/10 c.c. and 501/10 c.c. respectively). The number of living specimens was however extremely low in this station (Max. 14/10 c.c.). Occasional increase in the number of living specimens was observed at CS5 with the highest values (126/10 c.c.) being the May 2014 sample which was also the highest recorded across the study period for the entirety of the lagoon. The number of dead specimens at CS5 displayed great variability similar to the number of living specimens, with relatively higher values observed during the months of May 2014 and February 2015 (336/10 c.c. and 255/10 c.c. respectively). CS6 was also mostly characterized by a low number of living and dead specimens for the majority of the sampling period, except in the month of June 2014 when increased numbers of living (106/10 c.c.) and dead (111/10 c.c.) specimens were recorded. Overall a significant correlation (r = 0.4, p = 0.0005) was observed among the number of dead and living specimens for the entirety of the study period across the lagoon.
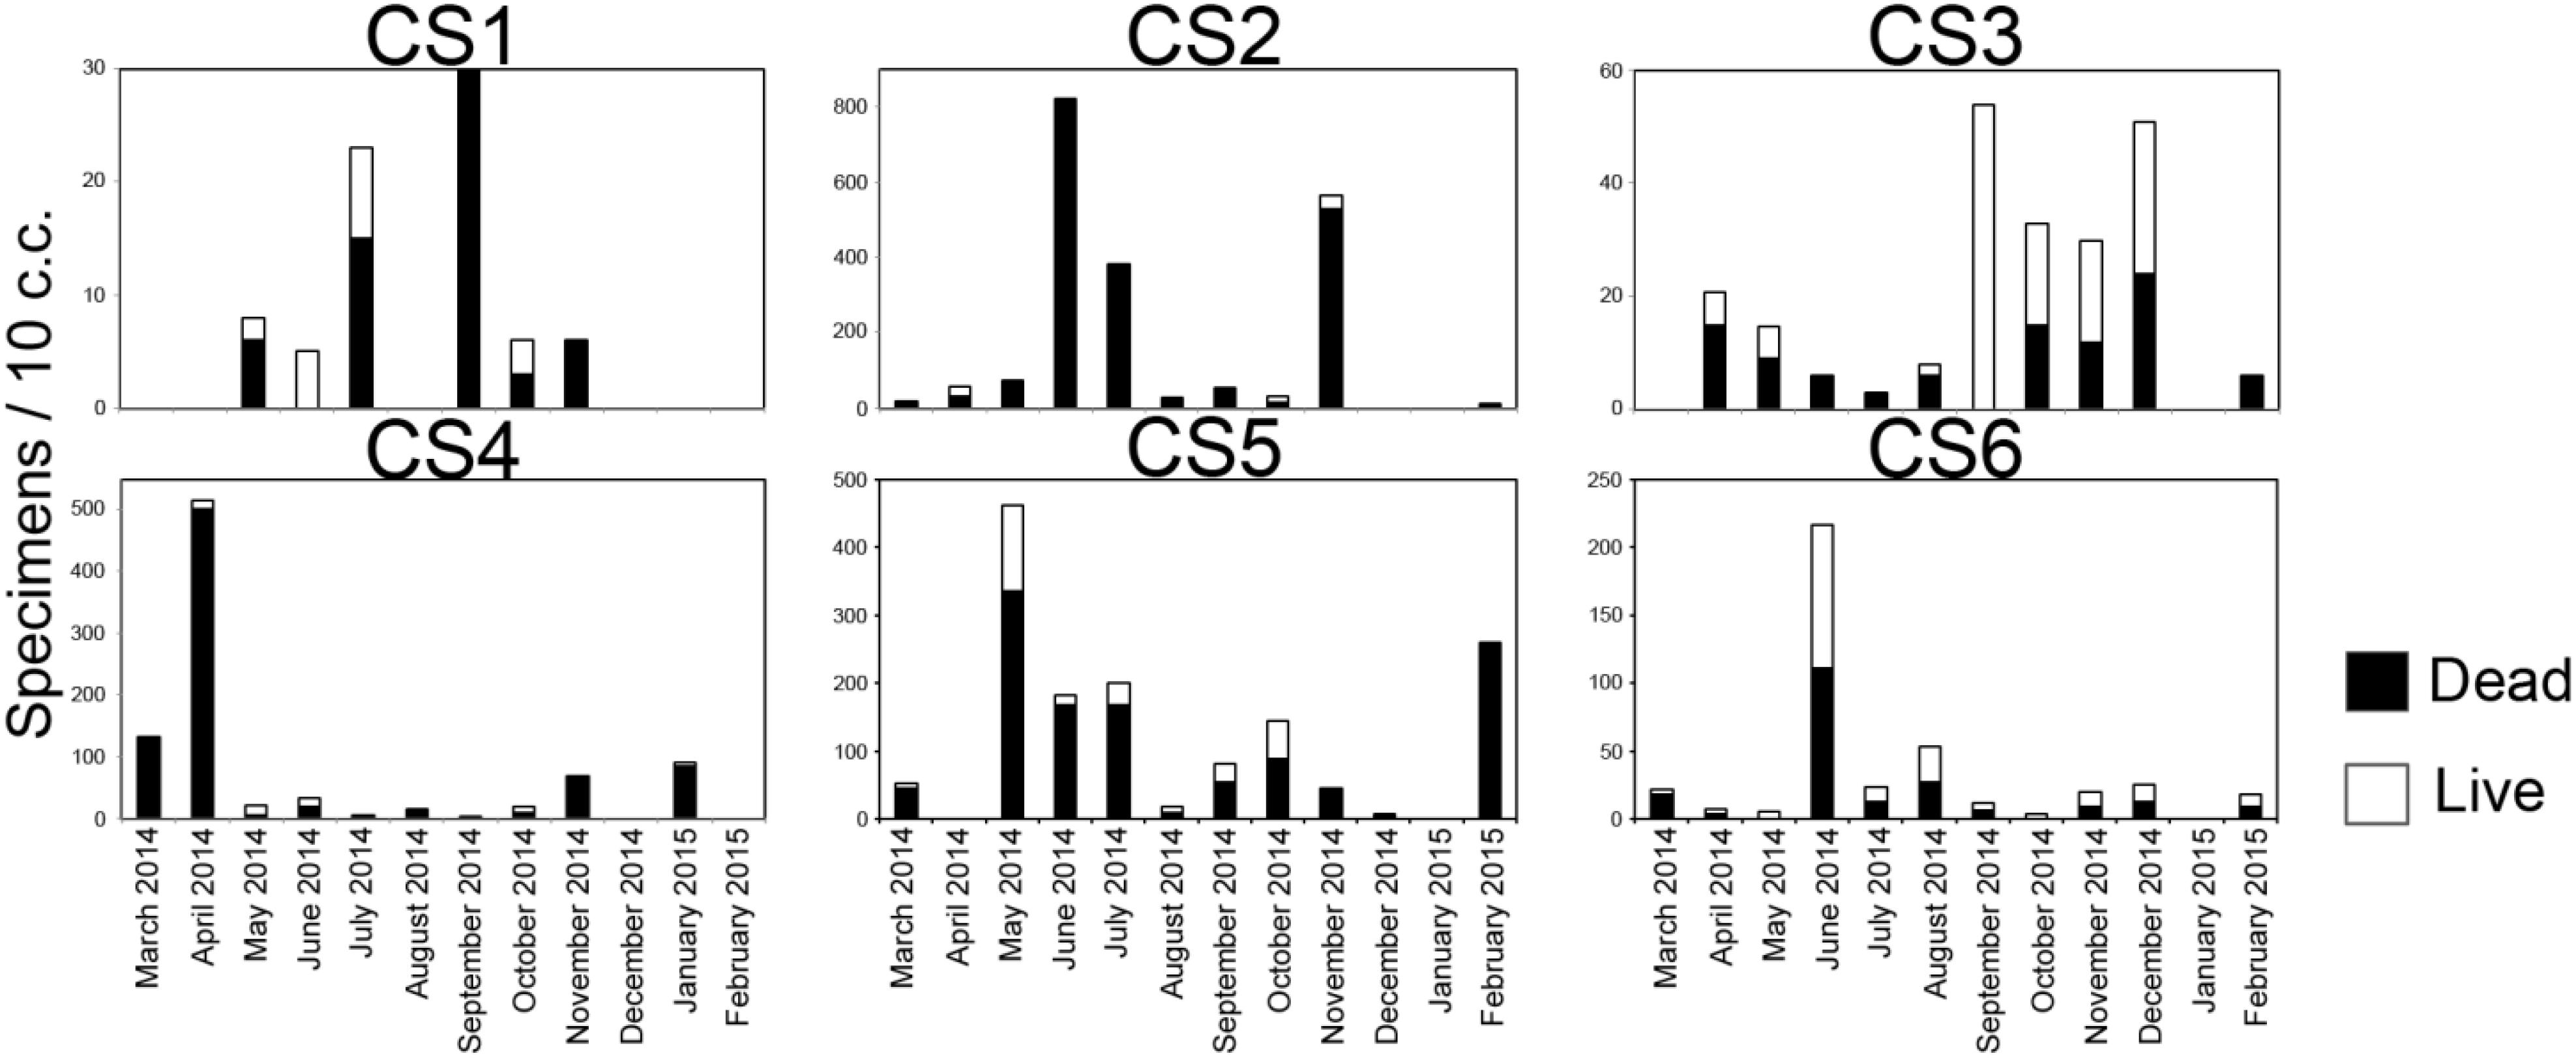
Figure 7. Number of observed live and dead specimens of Ammonia spp. in 10 c.c, of surface (0–2 cm) sediment in the lagoon representing the study period.
A cluster analysis was performed in order to test for spatial and seasonal grouping of samples (Figure 8). The analysis generated six clusters that were formed based on the abundance and contribution of living and dead specimens present in each sample. Cluster I comprised of five samples characterized by the absence of living specimens and served as outgroup to the rest of the dendrogram. Cluster II was also characterized mostly by the absence of living individuals except one sample (CS2Jun14) where the percentage of living specimen was negligible nine samples spread across almost the entirety of the lagoon, having low numbers of living and dead specimens formed cluster III. Cluster IV was formed of 12 samples having greater or significant proportion of living specimens. Similar proportions were also present in the 18 samples that formed cluster V, however the number of observed specimens were much lower as compared to cluster IV. The final cluster VI was comprised of samples having very little contribution of living specimens as well as large numbers of dead specimens pertaining to the genus Ammonia. ANOVA was performed to determine the significance of seasonal or spatial variance within the investigated assemblage. Among the different possible combinations of seasonal and spatial variation ANOVA revealed monsoon samples of CS5 to be significantly (p ≤ 0.05) different from premonsoon samples of CS1 and CS3 (F = 7.49, p = 0.03 and F = 6.44, p = 0.04 respectively), along with monsoon samples of CS1 (F = 5.80, p = 0.05) and postmonsoon samples of CS1 (F = 7.75, p = 0.03) and CS6 (F = 6.29, p = 0.05) (Table 3).
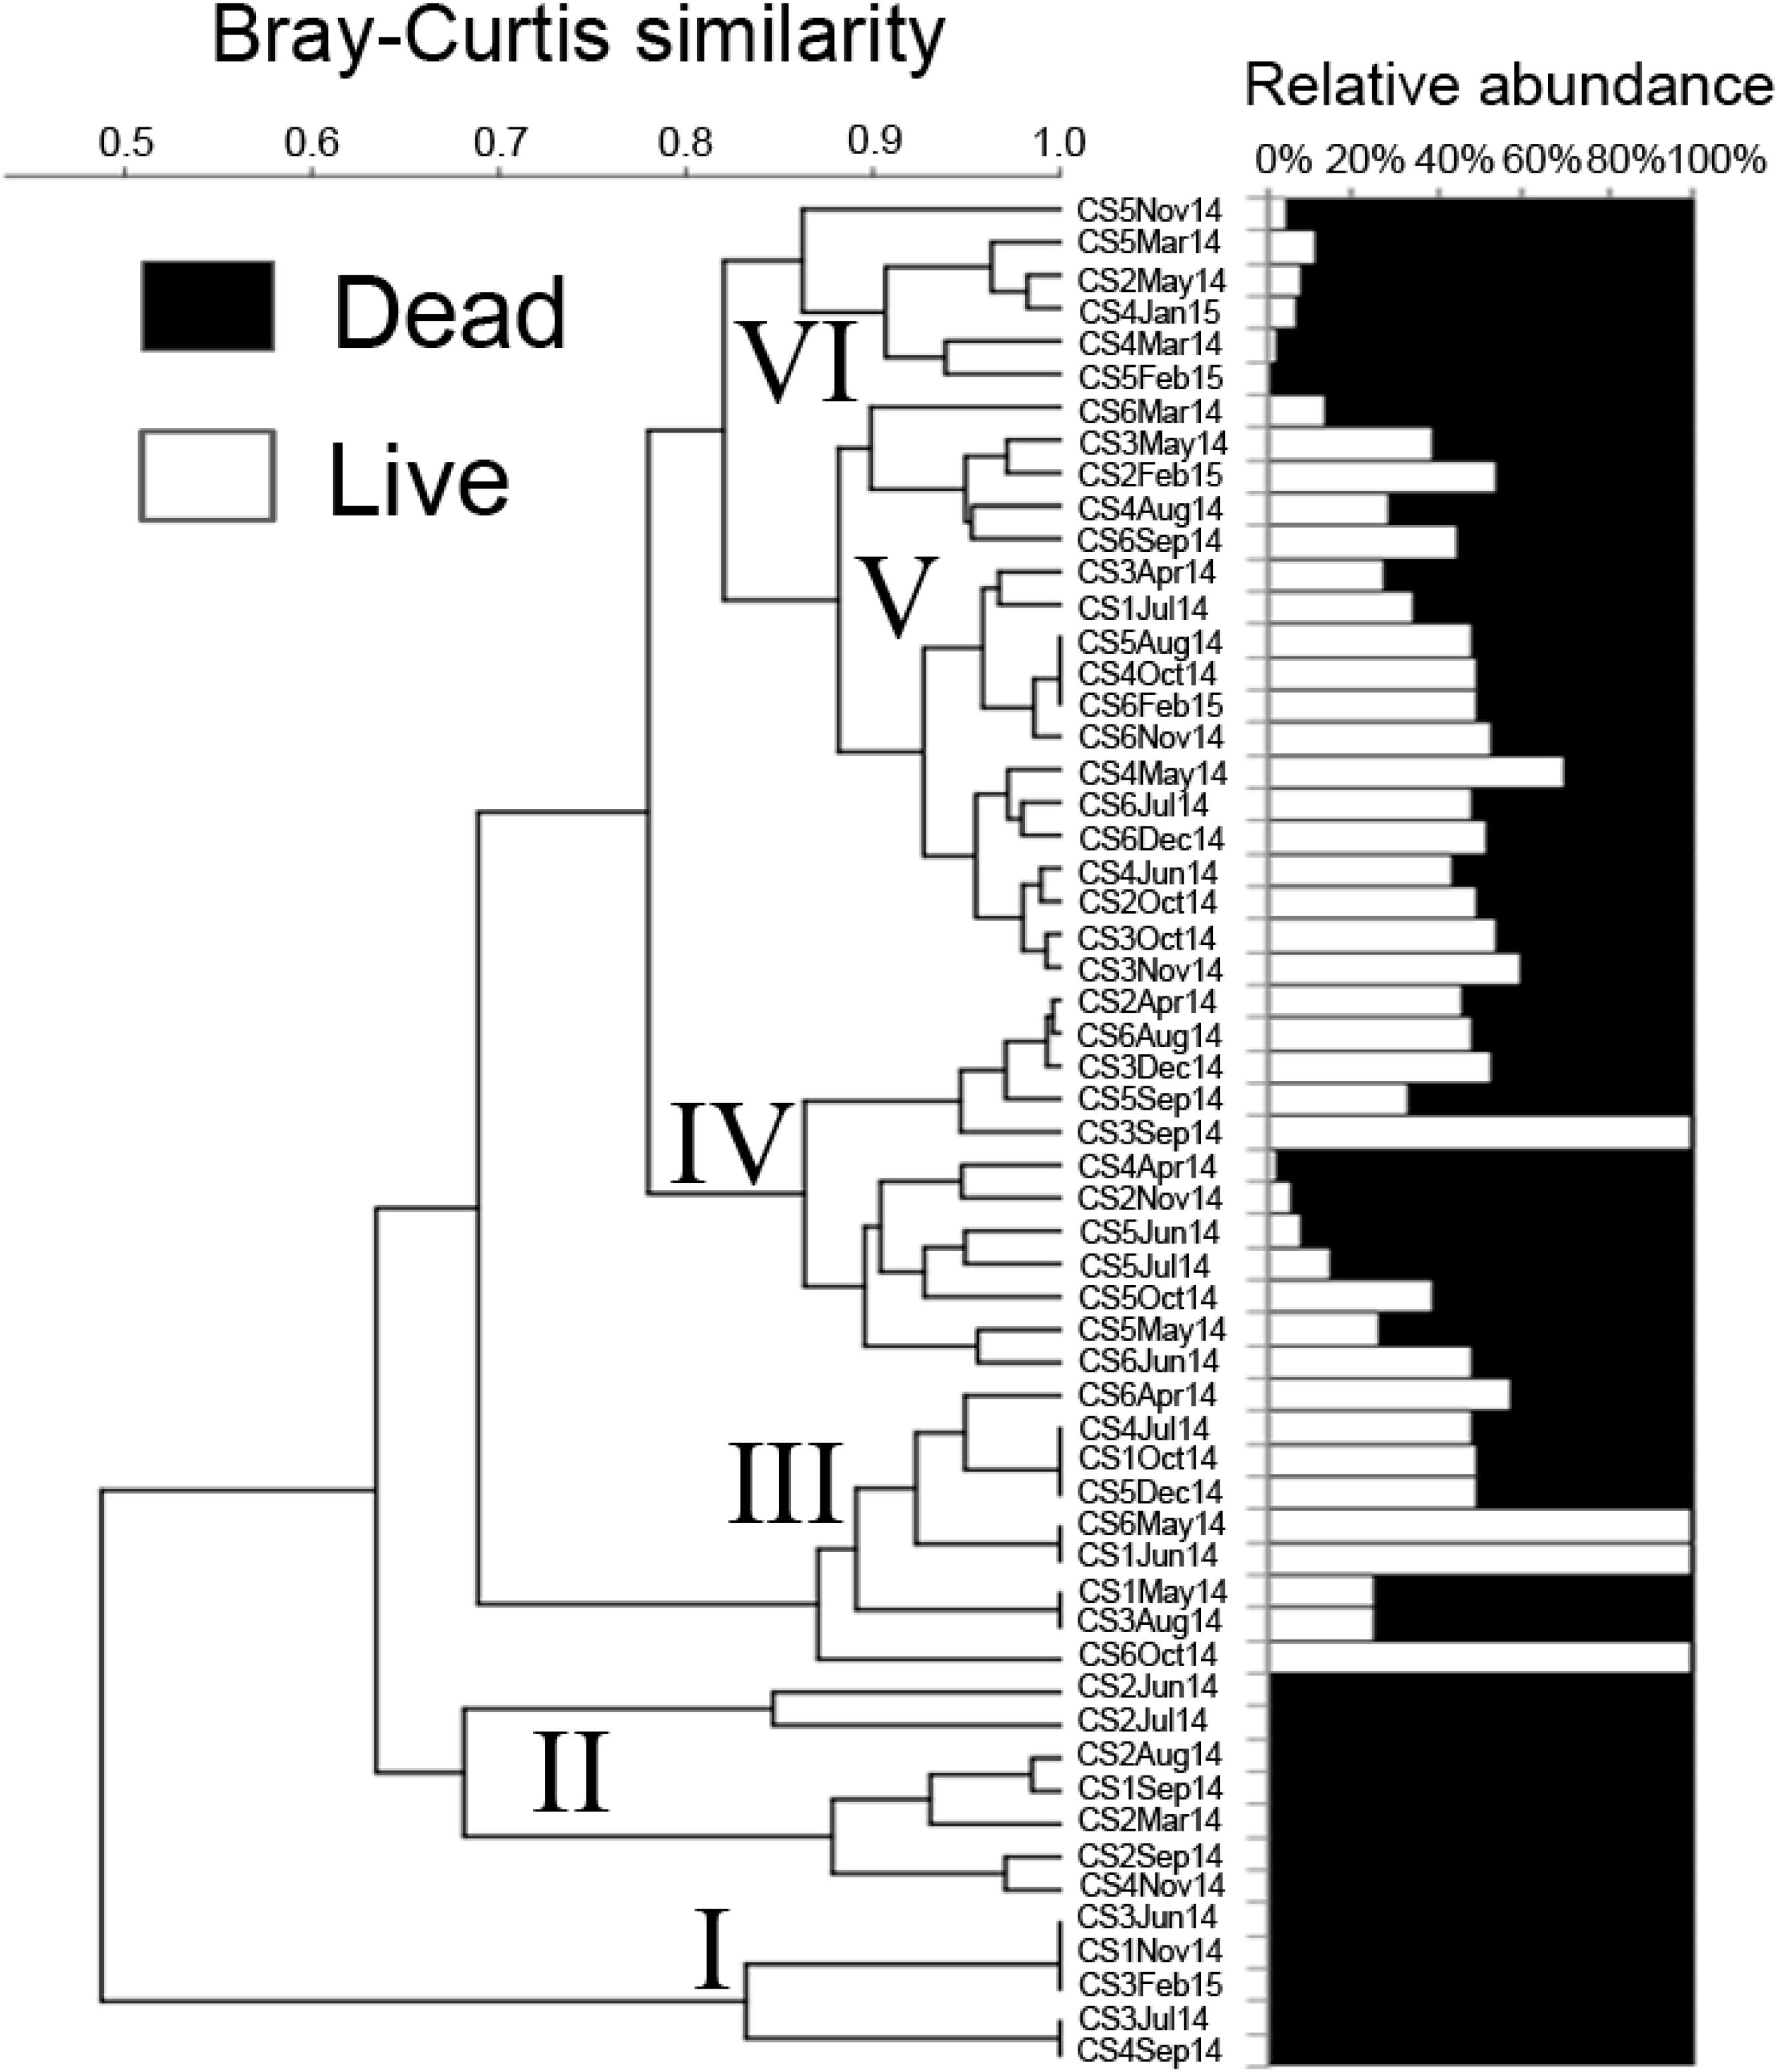
Figure 8. Cluster analysis of Ammonia spp. assemblage using a Bray–Curtis similarity measure. The numerical abundance of live and dead foraminifera were Log (X + 1) transformed prior to the analysis.
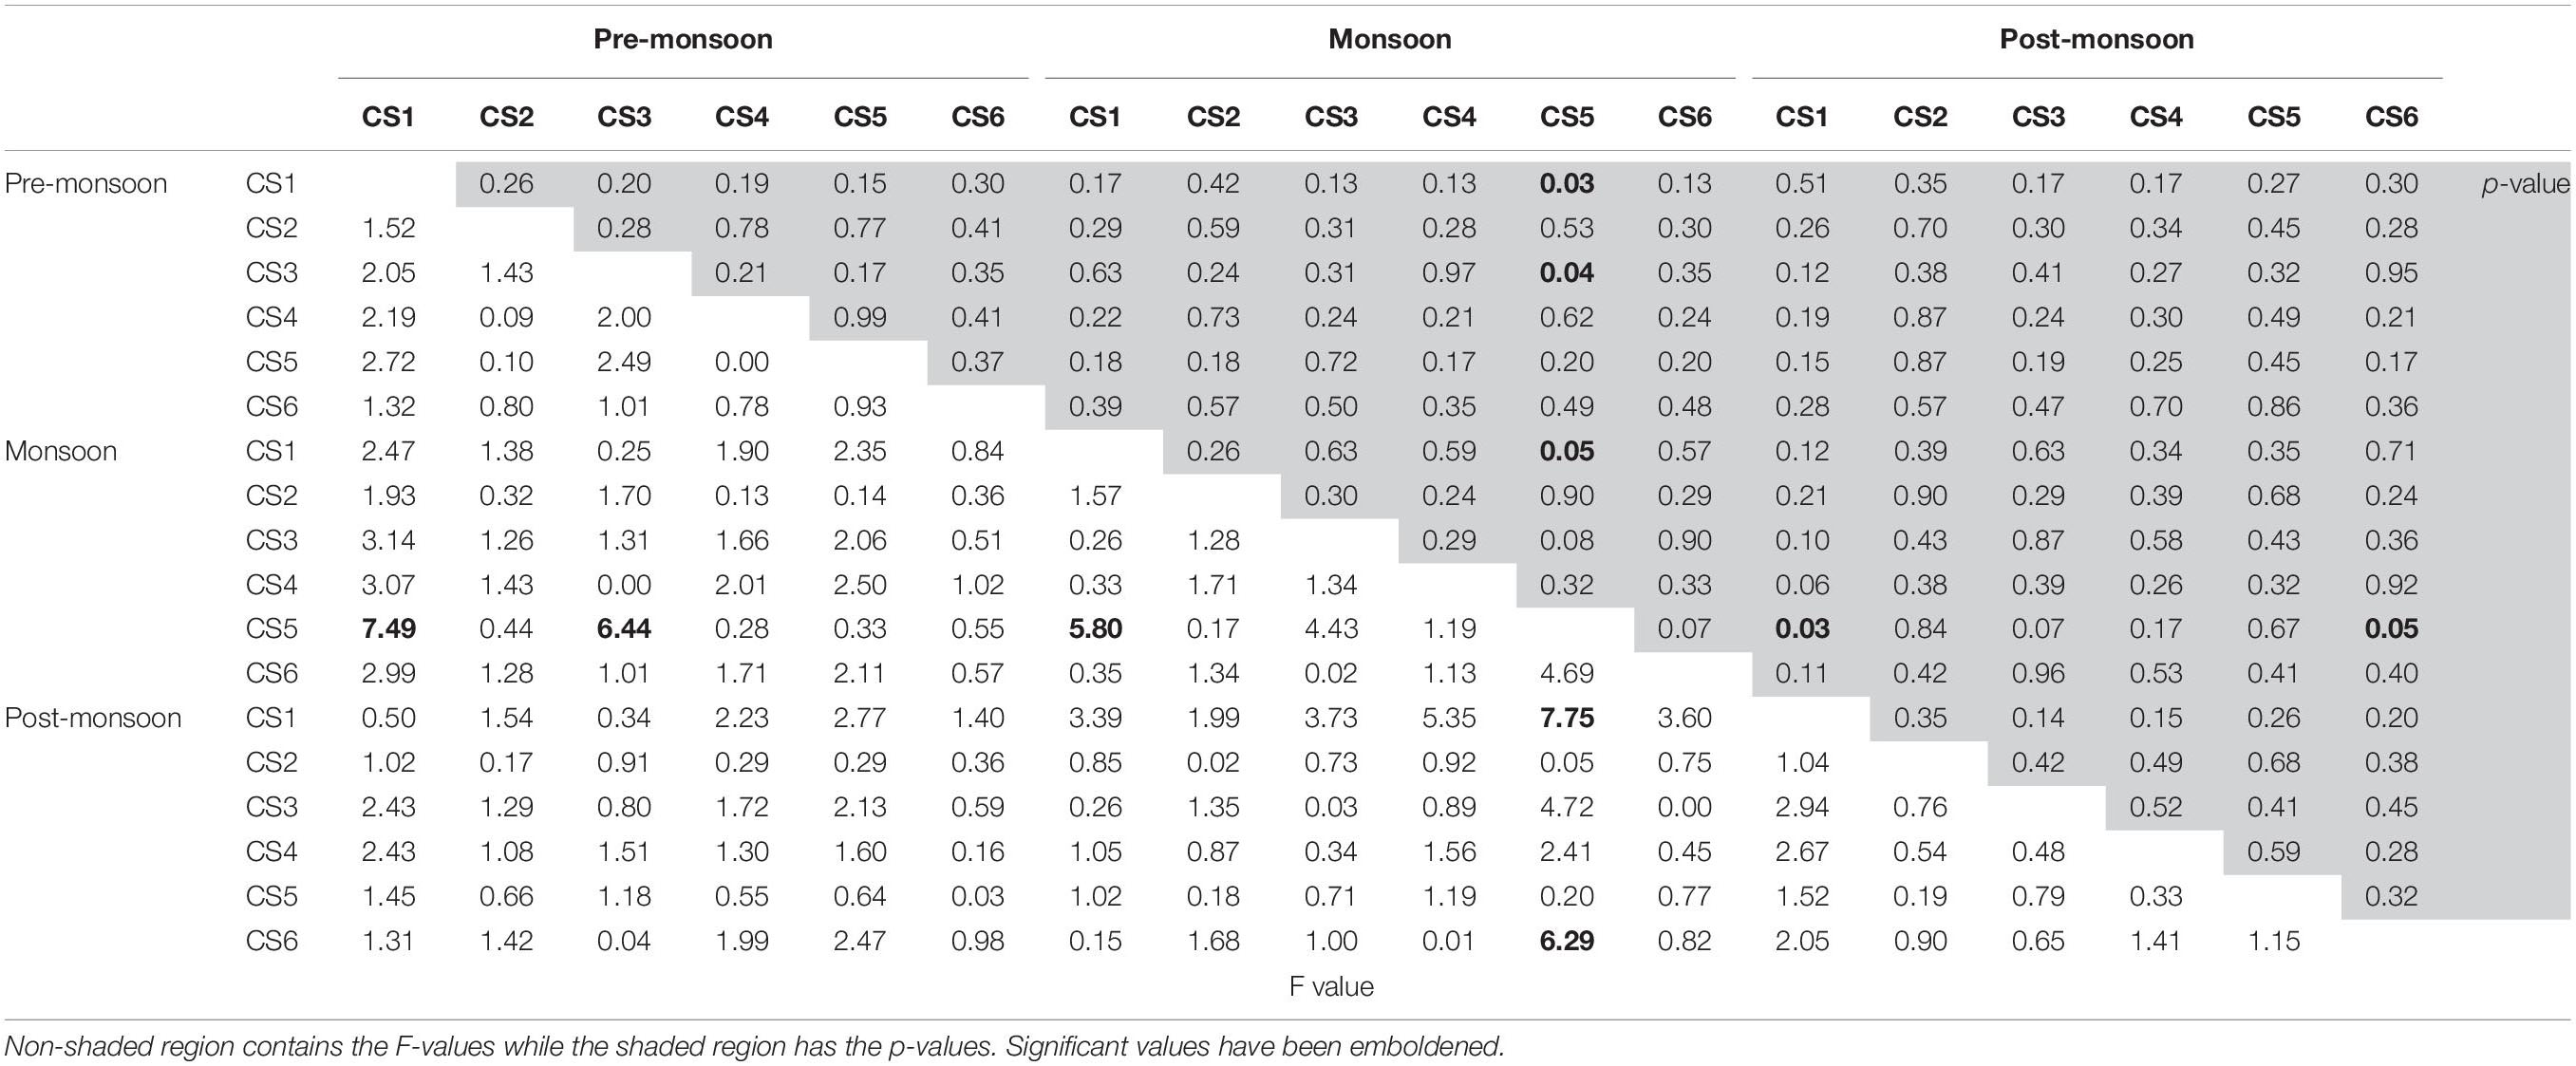
Table 3. Results of ANOVA analysis between all possible combinations of seasonal and station wise total (live + dead) foraminiferal numbers.
A correlation analysis was performed to investigate the relationships between the number of living and total (live + dead) specimens with the studied environmental factors (Table 4). Significant correlation (r = 0.23, p = 0.04) was observed between the surface water concentrations of dissolved NO3– and the number of living Ammonia specimens. Sedimentary Corg values also displayed significant correlation with both living (r = 0.31, p = 0.009) and total (r = 0.29, p = 0.01) number of specimens.
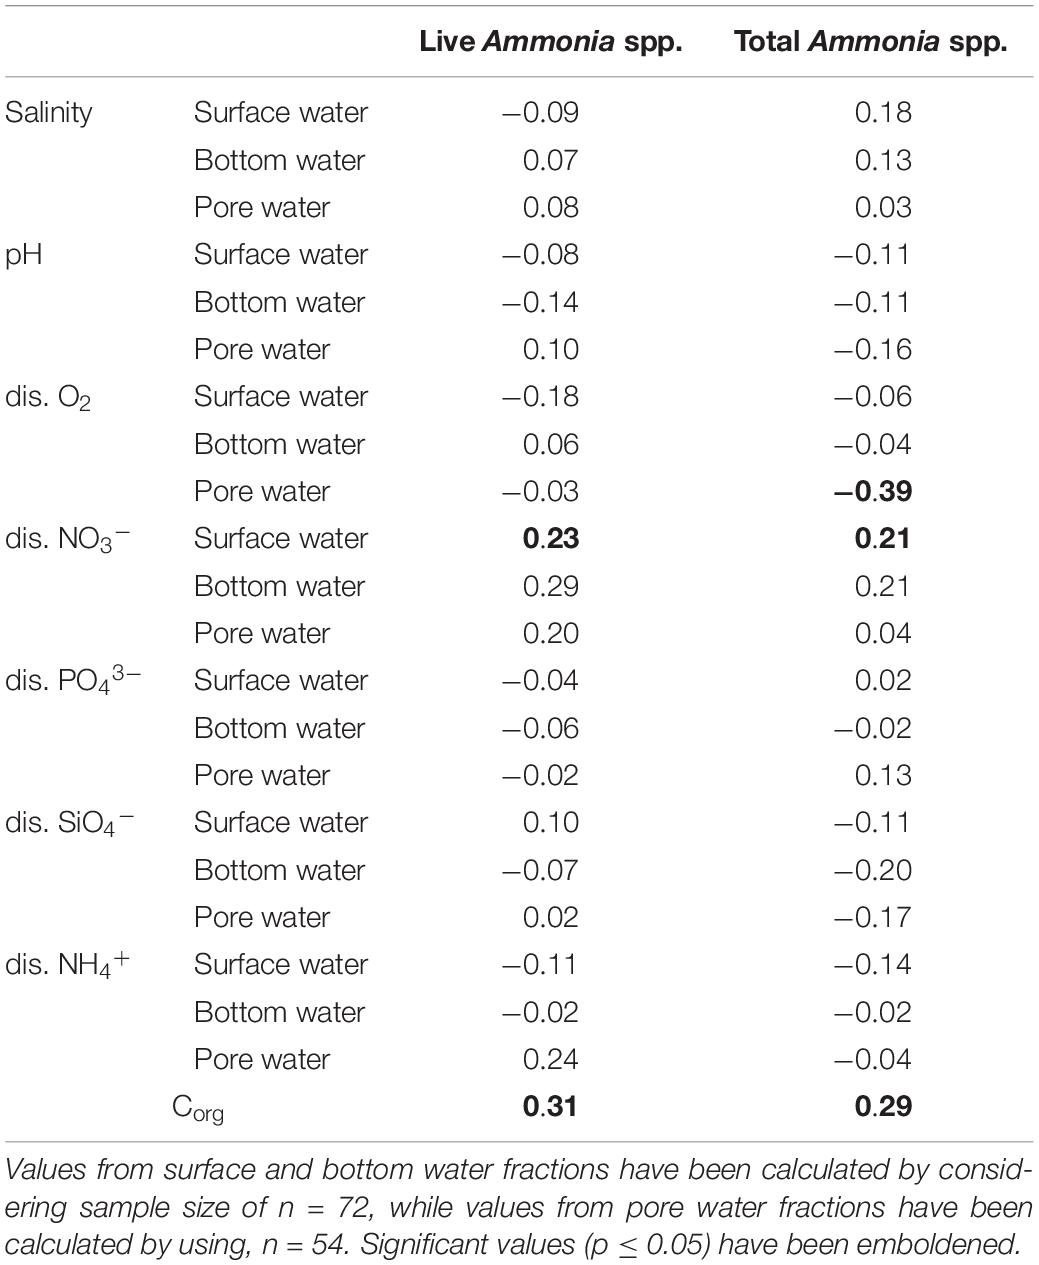
Table 4. Values of Pearson’s correlation co-efficient between observed number of Ammonia specimens and the studied parameters.
Discussion
Chilika lagoon, the largest coastal lagoon in Asia and the second largest in the world, was placed in the Montreux Record for being a wetland under threat in 1993, from which it was removed in 2002 following successful management practices including dredging and opening of an artificial marine connection in response to a declining salinity regime. During the present study period increased salinity was observed during the pre-monsoon months of March till June, a period that corresponds to summer in the north-west coast of Bay of Bengal. Salinity plummeted soon after as the monsoon began in late June and early July of 2014. The amount of total precipitation in the region increased from 297.8 cm in the month of June to 1505.9 cm in July, values similar to which lasted till the passing of monsoon in November during which total precipitation decreased to 5.4 cm (source1). This increased amount of freshwater influx during this period exposes the lagoon to severe threat from seasonal increase in dissolved nutrient concentrations. Investigations regarding eutrophication of coastal water shed zones majorly revolve around changes in the ratios of N, P, and Si and their impacts on primary production. The N:P ratio of 16:1 has been historically set as an benchmark for differentiating between N-limitation and P-limitation in oceanic waters (Falkowski, 1997; Tyrrell, 1999; Lenton and Watson, 2000). Changes in the N:P ratio have been associated with changes in primary producers like phytoplankton species composition. Strong evidence of how human induced changes in the N:P ratio can lead to discrete community shifts comes from a 21 years study from the Wadden Sea (Philippart et al., 2000). During the present investigation observed N:P ratio was markedly above the 16:1 mark for maximum number of the samples (Figure 9), irrespective of the time of collection. Surface water values of nitrate (NO3–) displayed a strong negative relationship with seasonal precipitation as proven by significant positive correlation with surface water salinity. The increased influx of fresh water during the monsoon actually lowered the N:P ratio toward 16:1 as NO3– concentrations diluted. Patra et al. (2010) studying the physicochemical parameters from Chilika for a period of 12 months also reported increases in surface water NO3– across the lagoon following the increased precipitation during monsoon. Patra et al. (2010) reported concentrations of 74.65 and 63.15 μM in pre-monsoon and post-monsoon respectively near the outfall of Kusumi, Kantabani, and Sananai, while the present study reported higher concentrations (86.25 and 83.67 μM at CS5) in neighboring zones. The N:P values recorded during the present investigation was also similar to reports from other investigations being performed during the same time (Srichandan et al., 2015). Concentrations of ammonium (NH4+), another component of the Dissolved Inorganic Nitrogen (DIN) pool was negligible and often below detection limit in the lagoon surface similar to orthophosphate (PO43–), which is another component of the Redfield ratio. Very few samples from surface water fraction displayed values characteristic of P limitation and majority of these samples were collected during the monsoon period. The N:P ratios measured from bottom water compartments strongly reflected the surface water conditions as significant correlations existed between surface water and bottom water values of NO3– and PO43–. Pore water values of N:P were however, particularly interesting, as within the interstitial space the major component of DIN was found to be not NO3–, but NH4+. Increased values of NH4+ were present mostly during the monsoon period, which coincided with lowered values of NO3– concentration. The observed shift can be accounted for by increased generation of NH4+ through degradation of sedimentary organic load possibly by microbial mode of action. The absence of any significant correlation of pore water concentrations of NH4+ with its other counterparts is suggestive of a sedimentary origin and presence of internal loading to overlying water column.
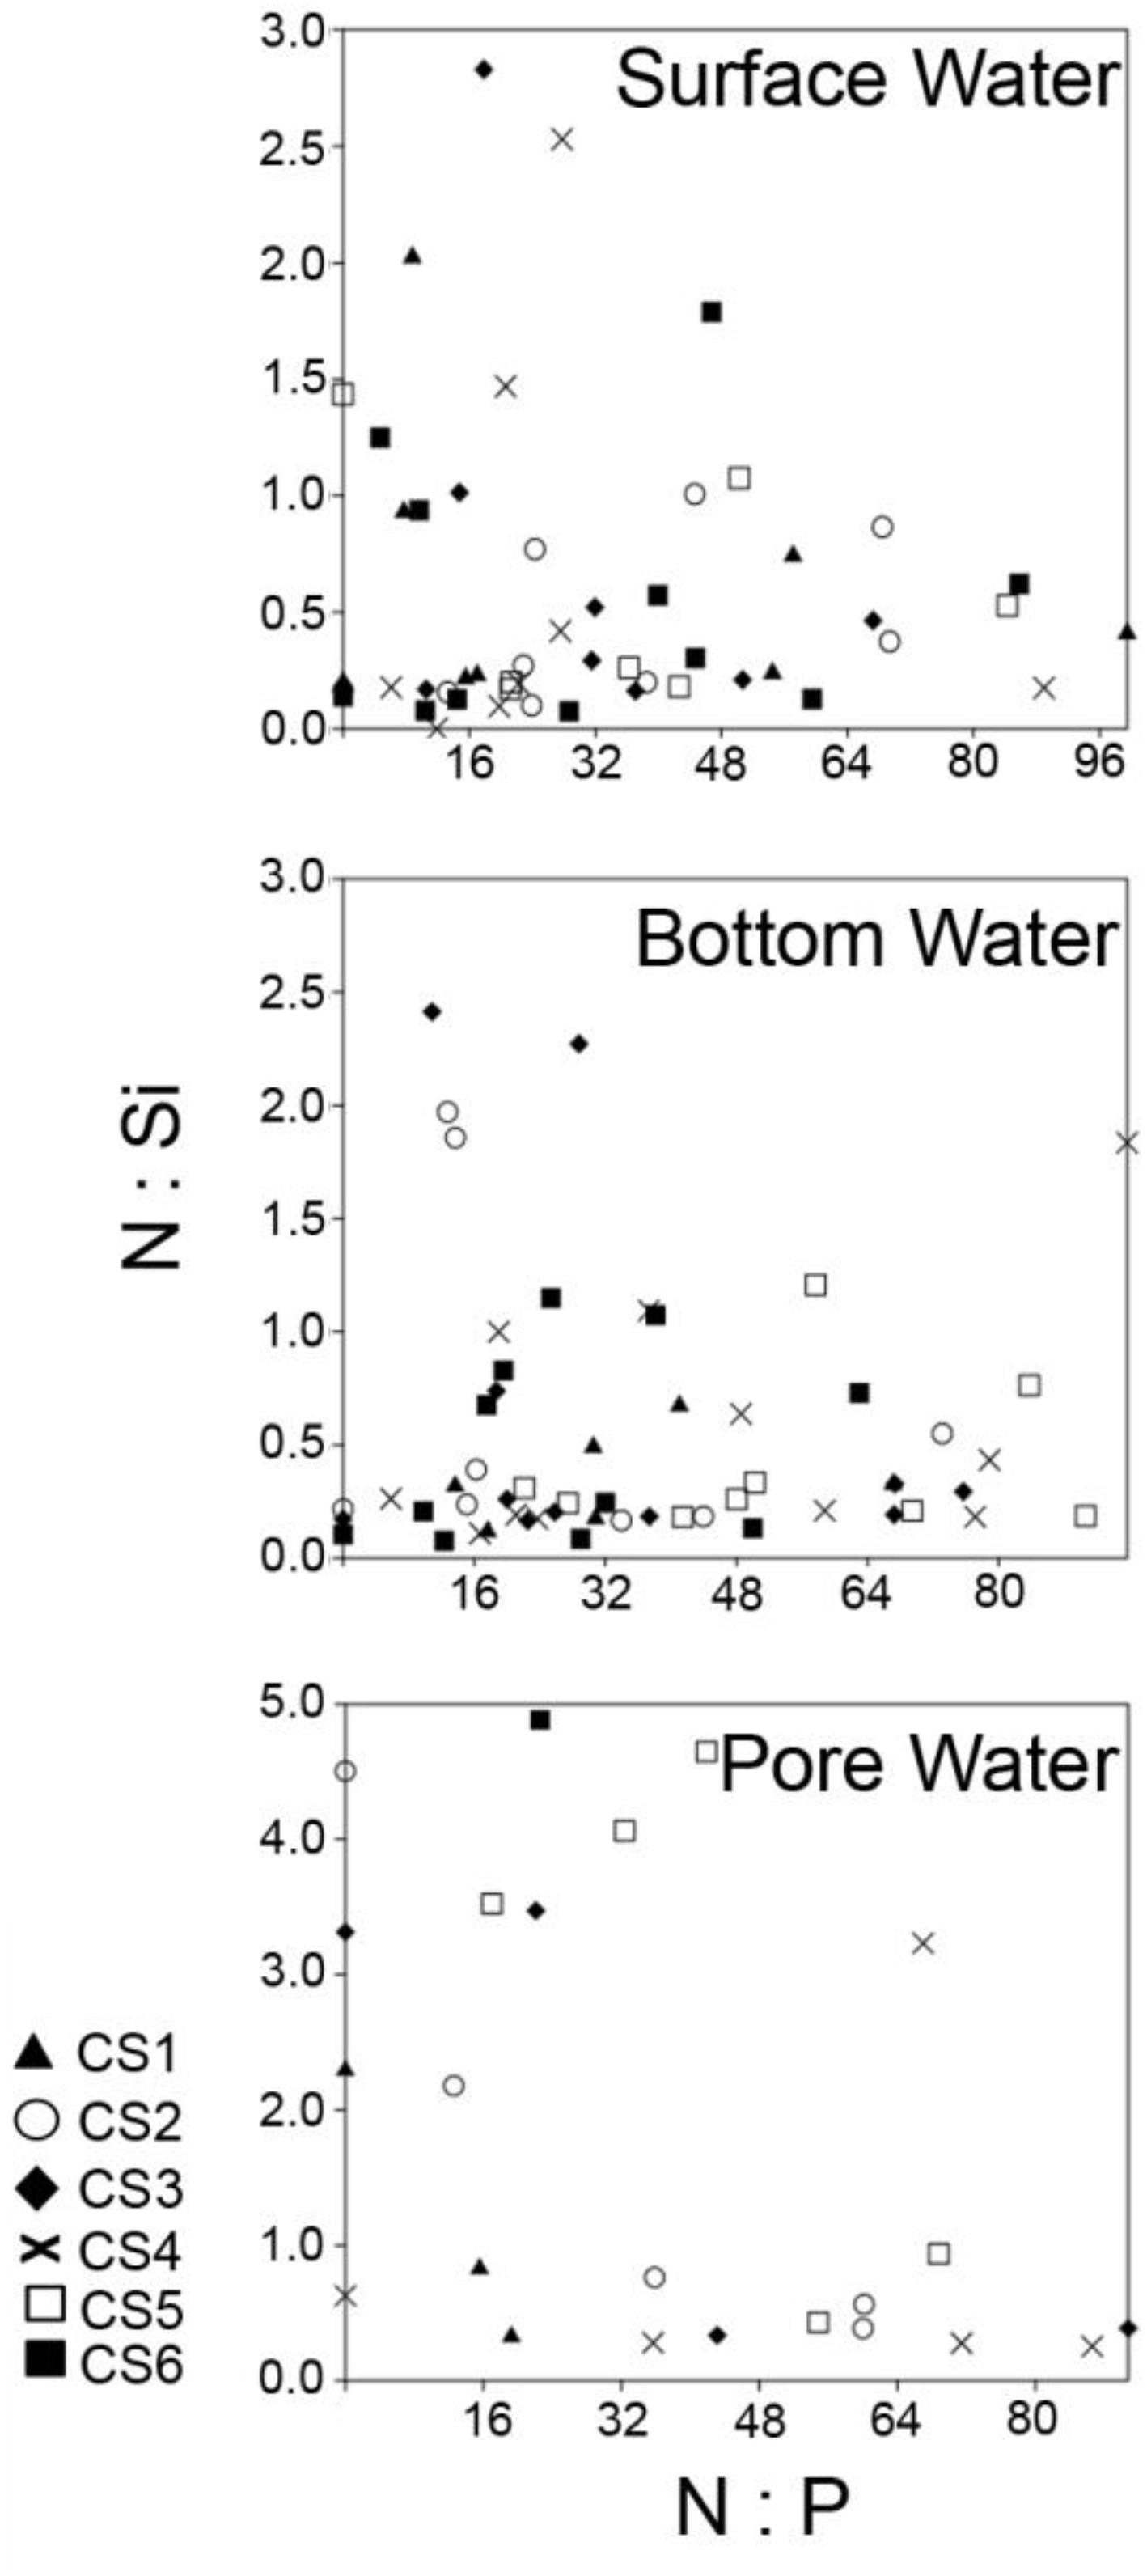
Figure 9. Comparison of N:P and N:Si ratios from all the studied compartments across the sampling stations representing the study period. DIN was calculated by combining the values of dissolved NO3– and dissolved NH4+. Ratios from surface and bottom water fractions have been calculated by considering sample size of n = 72, while values from pore water fractions have been calculated by using, n = 54.
Apart from N:P ratio, the ratio between N and Si is of particular interest with regards to eutrophication because anthropogenic loading cannot be a factor in case of Si concentrations in coastal zones, as majority of it originates from natural sources (Cloern, 2001). Diatoms, a major contributor of surface water primary productivity, require N and Si at the molar ratio of approximately 1 (Redfield et al., 1963; Dortch and Whitledge, 1992). A shift toward N:Si > 1 is normally associated with increased loading of N, followed by an environment selectively supporting non-diatom taxa that require less Si (Conley et al., 1993). Increased loading of N as compared to Si have been often associated with non-diatom blooms (Van Bennekom et al., 1975; Rabalais et al., 1996). In Chilika lagoon, the N:Si values were mostly < 1 in case of surface and bottom water environment following monsoon (Figure 9). Similar values of N:Si were observed during the monsoons of 2012 and 2013 (Srichandan et al., 2015). Lowered values of N:Si appear due to the high values of dissolved SiO4– that is brought into the lagoon during the monsoon freshwater flow, as evidenced from the significant negative correlation observed with salinity. The Si enriched condition of the lagoon following monsoon ensures ample bioavailability of SiO4– for supporting the growth of members belonging to Bacillariophyta. Srichandan et al. (2015) studied the phytoplankton community from the lagoon for a period of twelve months and found Bacillariophyta to be the most abundant group. N:Si > 1 were mostly observed at stations located in the northern and the central part of the lagoon (CS3, CS4, CS5, CS6) during the pre-monsoon months. Dominance of cyanobacterial genera such as Oscillatoria, Lyngbya, and Trichodesmium has been reported previously during the same season (Panigrahi et al., 2009). Dominance of cyanobacterial genus Cylindrospermum (221,667 cells L–1 in March 2013) and Phormidium (105,500 cells L–1 in April 2014) have been recorded previously from the northern and the central sector of the lagoon respectively (Srichandan et al., 2015). Seasonality of the dissolved nutrients thus appeared to be a major driving factor in controlling environmental quality of the lagoon. The relationship between the two nutrients (i.e., SiO4– and NO3–) also display opposite trends signified by a negative correlation as they have opposite relationships with monsoonal precipitation. The trend exists in the bottom water compartment too resulting in similar N:Si ratios, while in pore water the values are mostly high, due to increased concentration of NH4+ evolving from breakdown of sedimentary organic matter.
Sedimentary composition of the lagoon bottom has been described as a mixture of fine to medium sized sand fractions (Mahapatro et al., 2010; Ansari et al., 2015). In the present study four out of the six stations displayed > 90% silt-clay (<63 μm) content in the sediment which can be due to increased siltation in the lagoon. Previous investigation has revealed the positive relationship between higher content of finer sediment fractions and increased organic matter (Tyson, 1995). An area having low hydrodynamic energy tends to allow greater settlement of silt-clay particles which in turn leads to a higher content of organic matter due to increased surface area. In the present work Corg content from the surface 2 cm of the sediment is considered as a proxy for sediment organic matter. Globally, coastal lagoon sediments are characterized by a higher Corg content as compared to other coastal marine environments (Tyson, 1995). The Corg values of Chilika lagoon as presented in the current study had a comparatively lower median value (1.44%) as compared to the well studied Mediterranean coastal lagoons. Cabras lagoon, off the west coast of Sardinia is reported to have the highest median value of surface sediment Corg at 3.41% (De Falco et al., 2004). Values similar to the present study have been recorded from S’Ena Arrubia lagoon (<2%) in Mediterranean (De Falco and Guerzoni, 1995) and also from Etang de Vendres lagoon (∼0.2 – 7.0%) in France (Aloisi and Gadel, 1992). Values such as these are characteristics of OM enrichment in sediment compartments (Lardicci et al., 2001; Frascari et al., 2002). In Chilika, however values of even greater magnitude were observed at a station (CS5) located near the outfall of a river, where the values of Corg ranged between 0.6% and 5.66%, with 66.7% of the values recorded from this station being greater than the median value of entire lagoon. The station, however, was characterized by a lower mean of silt-clay content which explains the absence of any significance correlation between sediment silt-clay content and Corg.
Values of δ13C provide a mean to distinguish between sediment organic matter derived from freshwater and marine source. Vascular land plants and freshwater algae utilizing the C3 Calvin pathway have δ13C range between −26 and −28‰ approximately while marine particulate organic matter comprising of particulate organic carbon (POC), algal and bacterial cells range approximately −19 to −22‰. Organic matter derived from C4 Hatch-Slack pathway range approximately from −12 to −16‰ (Meyers, 1994). The values of δ13C observed in the present study displayed ranges that are mostly characteristic of a marine POC with 47 out of the 72 analyzed samples having values greater than −22‰, indicating an autochthonous origin of observed Corg values. Station-wise, the station neighboring human habitation (CS2) had the highest number of readings within the range characteristic of algal and bacterial productions. The station (CS4) located furthest from any potential inputs and having a lower concentration of Corg, had 8 samples with values within the mixed origin range (<−22‰, >−26‰). As mentioned earlier, Bacillariophyta (δ13C ≈−17.5 to −22.5, Gearing et al., 1984) and Cyanophyta (δ13C ≈−22.2 to −22.6, Schouten et al., 1997) have been reported to dominate surface water primary producer community in the lagoon. The dominance of submerged macrophytes like Potamogeton (δ13C ≈−19.5‰, LaZerte and Szalados, 1982) in the northern sector of the lagoon can also contribute to the observed stable isotopic ratios. Higher values of Corg were observed in the station (CS5) close to the river opening (Figure 10) and having seasonal variation in Corg content as compared to the other studied sites.
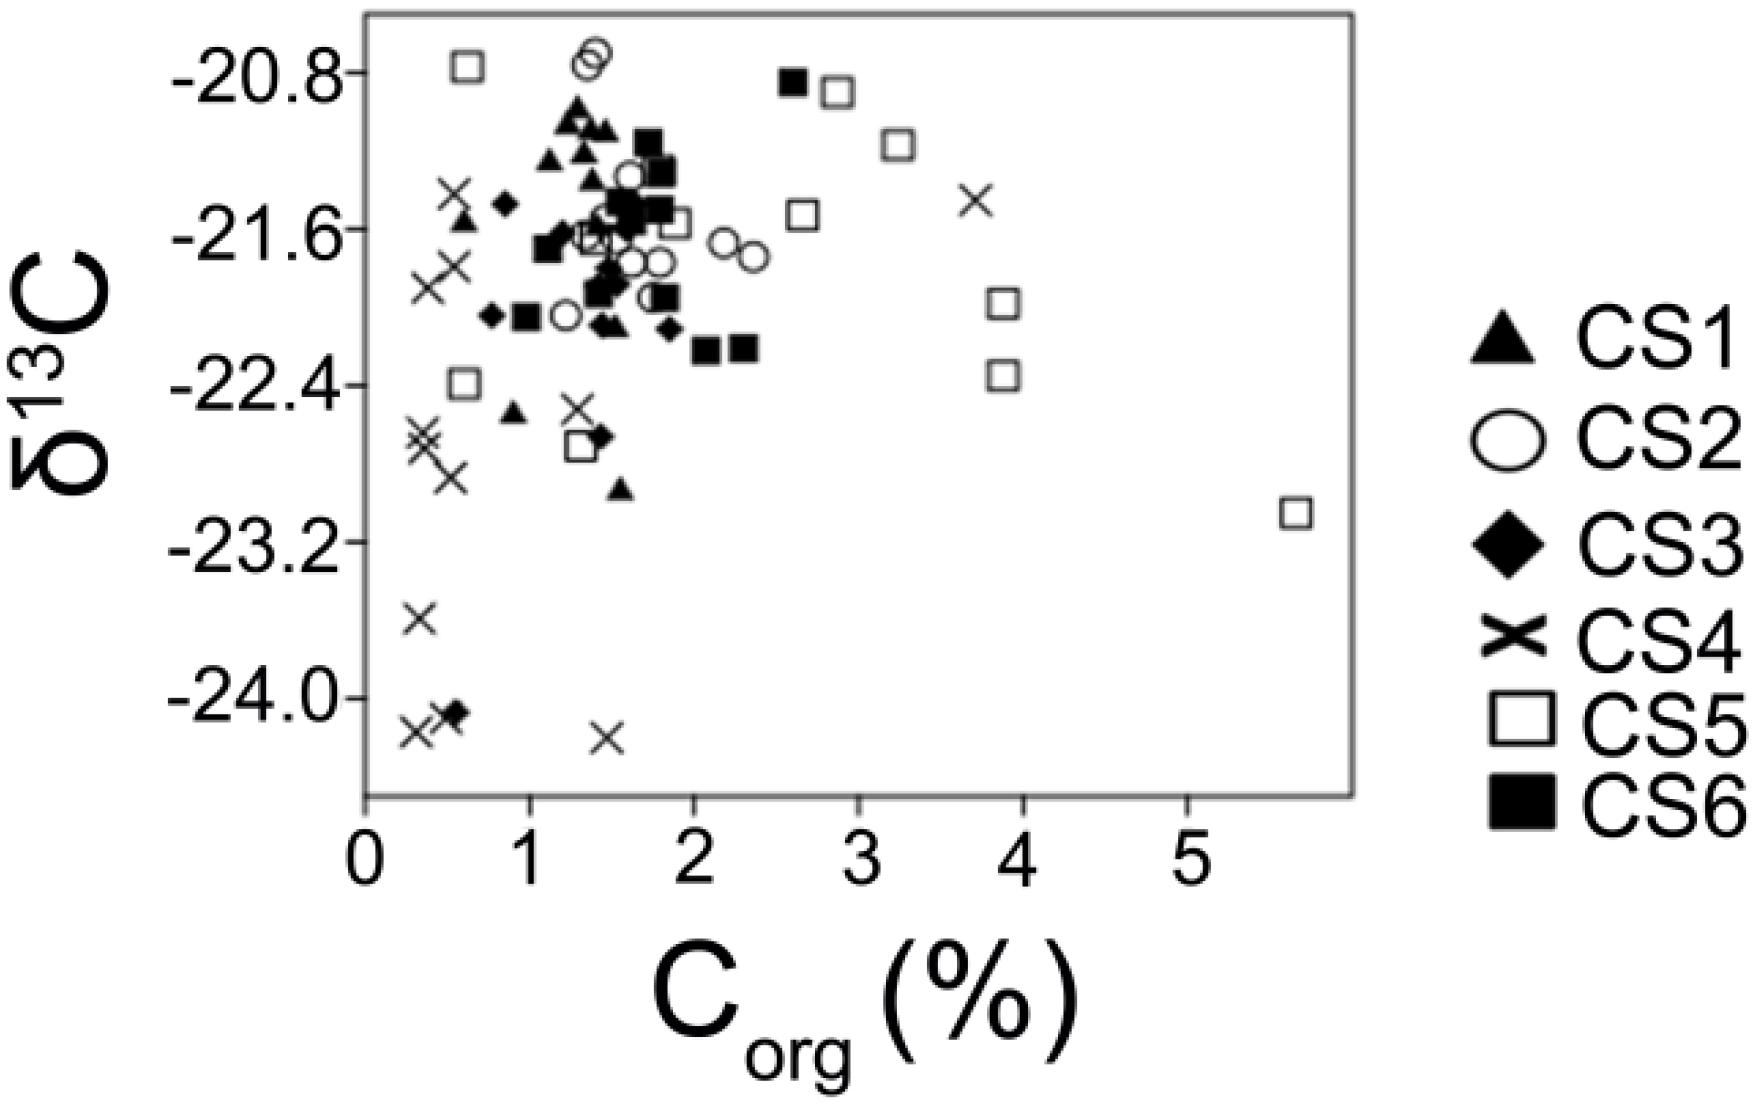
Figure 10. A comparison of observed Corg values and δ13C estimated from the surface (0–2 cm) sediment column in order to generate an idea of spatial patterning of carbon in the lagoonal bottom during the study period.
This may indicate the influence of localized nutrient loading in that particular area of the lagoon resulting in seasonal increase in algal production present in brackish water conditions. Coastal environments which are not vigorously flushed by freshwater or marine water are likely to be characterized by autochthonously produced organic matter in the sediments (Matson and Brinson, 1990). Depleted δ13C was observed in low Corg bearing samples from near the lagoon’s marine opening (CS4). Water residence time measured nearby the lagoons marine connection (∼4–5 days) is in stark contrast with the high water residence time (∼132 days) within the main body of the lagoon (Mahanty et al., 2016). This increased rate of flushing observed near the lagoons marine opening explains the depleted δ13C value observed in that part of the lagoon while the remainder of the lagoon displayed enriched values. Similar enriched values of δ13C have been reported by Yamamuro (2000) from two eutrophic coastal lagoons in Japan (δ13C ≈−21.2 to −25.3) and have been attributed to more primary production from autochthonous sources as opposed to allochthonous deposition.
While the utility of benthic foraminiferal assemblages in assessing environmental conditions is established beyond any doubt, the utility of living versus total foraminiferal assemblages in tracking environmental change remains a highly debated issue. Schönfeld et al. (2012) have highlighted that in bio-monitoring studies living benthic foraminifera assemblages should be considered as they reflect environmental conditions. In the present study it has been shown that dead foraminifera tests can also provide additional information on environmental conditions along with living assemblages in a lagoon such as Chilika where tidal influences are largely absent. The living foraminiferal assemblage of the Chilika lagoon has already been characterized as dominated by Ammonia spp. and shown to be devoid of any seasonal trends (Sen and Bhadury, 2016). Spatial variation within Ammonia assemblages was prominent with respect to stations having higher values of Corg (CS5 and CS6) mostly clustering together based on having comparatively higher contribution of living specimens (cluster III, IV, V) which was further supported by ANOVA in case of the station neighboring river opening during monsoon (CS5). Ammonia assemblages close to the human habituated part of the lagoon (CS2) clustered separately (cluster II) in having a greater number of dead tests and the effect of release sewage was evident in terms of living and dead tests. The occurrence of high number of dead tests including highest in June 2014 was also due to the fact that untreated sewage from nearby town which was being continuously released in closest proximity to CS2 did not undergo dilution during summer period (April–June, 2014) as volume of freshwater in the system significantly declined. Moreover, the continuous release of untreated sewage in this station resulted in changes in bottom water dissolved nutrients (e.g., ammonia) and also evident from Corg values which may have led to sensitivity of prevailing Ammonia populations and ultimately reflected in terms of number of higher dead tests compared to other stations. It has been also shown that in species of Ammonia such as A. beccarii survival of young individuals can vary seasonally (Takata et al., 2019). Indeed such possibility in populations at species levels for the genus Ammonia can be investigated in Chilika lagoon to better understand the wider ecological significance of living and dead tests. Moreover, the effect of anthropogenic forcing such as release of sewage and its effect on young individuals of Ammonia populations can be also studied.
Studies have shown that increased occurrence of dead test in particular portion of the lagoon can also stem from allochthonous deposition of dead foraminifera by bottom currents reported to be present in the lagoon (Mohanty and Panda, 2009). However significant correlation between observed number of living and dead specimens in link with environmental data thus making total foraminiferal assemblage suitable for providing valuable information. Significant correlation existed in case of sediment Corg content with observed Ammonia spp. populations. In both cases, however, the level of significance was greater when considering live specimens. Total (live + dead) assemblage of Ammonia and its significant positive correlation with Corg can be utilized for paleontological interpretation, where such dominance can indicate toward an environment rich in organic matter.
Conclusion
To test the hypothesis that benthic foraminiferal genus Ammonia is a reliable proxy for sediment organic carbon load within a coastal lagoonal ecosystem, two objectives were addressed. As part of the first objective, increased loading of nitrate with respect to phosphate was found and this can make lagoonal environments suitable for increased primary production. The stable isotopic signature of carbon in the sediment from the studied lagoon confirmed the first objective with dominance of surface producers and submerged macrophytes act as a source of organic carbon. In the second objective, the relationship between benthic foraminiferal genus Ammonia and sedimentary organic was estimated. Based on the significant relationship between both living and total assemblages of Ammonia with sedimentary organic matter, the genus was characterized as a reliable proxy for environmental condition including sediment organic carbon load in the studied lagoon. Thus the study confirmed that this benthic foraminiferal genus can be reliably used to track sediment organic carbon load in coastal ecosystems globally and can be critical for monitoring health of lagoons.
Data Availability Statement
All datasets generated for this study are included in the article/supplementary material.
Author Contributions
PB designed the sampling and analysis strategies along with provision of resources to undertake the study. AS and PB undertook field sampling, processing of samples and data analyses. PB and AS wrote the manuscript.
Funding
PB acknowledges IISER Kolkata for the provision of fund to undertake this study.
Conflict of Interest
The authors declare that the research was conducted in the absence of any commercial or financial relationships that could be construed as a potential conflict of interest.
Acknowledgments
The authors would like to thank Prof. Prasanta Sanyal and all the members of Stable Isotope Laboratory at Indian Institute of Science Education and Research Kolkata for assisting in sedimentary carbon characterization. The expertise of Mahesh Ghosh in operating the mass spectrometer is thankfully acknowledged. AS would like to thank Indian Institute of Science Education and Research Kolkata, for the provision of Ph.D. Fellowship. This manuscript has been released as a Pre-Print at Biogeosciences Discussions.
Footnotes
References
Aloisi, J. C., and Gadel, F. (1992). Sedimento-genetical mecanisms and evolution of a mediterranean lagoonar ecosystem: vendres lagoon (Herault). Vie Milieu 42, 165–183.
Alve, E., Korsun, S., Schönfeld, J., Dijkstra, N., Golikova, E., Hess, S., et al. (2016). Foram-AMBI: a sensitivity index based on benthic foraminiferal faunas from North-East Atlantic and Arctic fjords, continental shelves and slopes. Mar. Micropaleontol. 122, 1–12. doi: 10.1016/j.marmicro.2015.11.001
Ansari, K. G. M. T., Pattnaik, A. K., Rastogi, G., and Bhadury, P. (2015). An inventory of free-living marine nematodes from Asia’s largest coastal lagoon, Chilika, India. Wetl. Ecol. Manag. 23, 881–890. doi: 10.1007/s11273-015-9426-2
Ansari, K. G. M. T., Pattnaik, A. K., Rastogi, G., and Bhadury, P. (2017). Multiple spatial scale analysis provide an understanding of benthic macro-invertebrate community structure across a lagoonal ecosystem. Wetlands 37, 277–287. doi: 10.1007/s13157-016-0866-0
Ansari, K. G. M. T., Pattnaik, A. K., Rastogi, G., and Bhadury, P. (2018). Characterization of benthic habitat settings in a lagoonal ecosystem using free-living nematodes as proxy. Wetl. Ecol. Manag. 26, 175–194. doi: 10.1007/s11273-017-9564-9
Armynot du Châtelet, É, Bout-Roumazeilles, V., Riboulleau, A., and Trentesaux, A. (2009). Sediment (grain size and clay mineralogy) and organic matter quality control on living benthic foraminifera. Rev. Micropaléontol. 52, 75–84. doi: 10.1016/j.revmic.2008.10.002
Boesch, D. F. (2002). Challenges and opportunities for science in reducing nutrient over-enrichment of coastal ecosystems. Estuaries 25, 886–900. doi: 10.1007/BF02804914
Boynton, W. R., Murray, L., Hagy, J. D., Stokes, C., and Kemp, W. M. (1996). A comparative analysis of eutrophication patterns in a temperate coastal lagoon. Estuar. Coast 19, 408–421. doi: 10.2307/1352459
Buchanan, J. B. (1984). “Sediment analysis,” in Methods for Study of Marine Benthos, eds N. A. Holme and A. D. McIntyre (London: Blackwell Scientific Publications), 41–65.
Buchanan, J. B., and Longbottom, M. R. (1970). The determination of organic matter in marine muds: the effect of the presence of coal and the routine determination of protein. J. Exp. Mar. Biol. Ecol. 5, 158–169. doi: 10.1016/0022-0981(70)90014-6
Choudhury, A. K., Das, M., Philip, P., and Bhadury, P. (2015). An assessment of the implications of seasonal precipitation and anthropogenic influences on a mangrove ecosystem using phytoplankton as proxies. Estuar. Coast 38, 854–872. doi: 10.1007/s12237-014-9854-x
Cloern, J. E. (2001). Our evolving conceptual model of the coastal eutrophication problem. Mar. Ecol. Prog. Ser. 210, 223–253. doi: 10.3354/meps210223
Conley, D. J., Paerl, H. W., Howarth, R. W., Boesch, D. F., Seitzinger, S. P., Havens, K. E., et al. (2009). Controlling eutrophication: nitrogen and phosphorus. Science 323, 1014–1015. doi: 10.1126/science.1167755
Conley, D. J., Schelske, C. L., and Stoermer, E. F. (1993). Modification of the biogeochemical cycle of silica with eutrophication. Mar. Ecol. Prog. Ser. 101, 179–192. doi: 10.3354/meps101179
De Falco, G., and Guerzoni, S. (1995). Sedimentological characterisation and organic matter budget of a shallow coastal lagoon: S’Ena Arrubia (western Sardinia). Plinius Italian Suppl. Eur. J. Mineral. 14, 134–136.
De Falco, G., Magni, P., Teräsvuori, L. M. H., and Matteucci, G. (2004). Sediment grain size and organic carbon distribution in the Cabras lagoon (Sardinia, western Mediterranean). Chem. Ecol. 20, 367–377. doi: 10.1080/0275754031001629189
Debenay, J. P., Geslin, E., Eichler, B. B., Duleba, W., Sylvestre, F., and Eichler, P. (2001). Foraminiferal assemblages in a hypersaline lagoon, Araruama (RJ), Brazil. J. Foramin. Res. 31, 133–151. doi: 10.2113/0310133
Donazzolo, R., Degobbis, D., Sfriso, A., Pavoni, B., and Orio, A. A. (1989). Influence of Venice Lagoon macrofauna on nutrient exchange at the sediment-water interface. Sci. Total Environ. 86, 223–238. doi: 10.1016/0048-9697(89)90285-4
Donnici, S., Barbero, R. S., and Taroni, G. (1997). Living benthic foraminifera in the lagoon of Venice (Italy): population dynamics and its significance. Micropaleontology 1, 440–454.
Dortch, Q., and Whitledge, T. E. (1992). Does nitrogen or silicon limit phytoplankton production in the Mississippi River plume and nearby regions? Cont. Shelf Res. 12, 1293–1309. doi: 10.1016/0278-4343(92)90065-R
Falkowski, P. G. (1997). Evolution of the nitrogen cycle and its influence on the biological sequestration of CO2 in the ocean. Nature 387, 272–275. doi: 10.1038/387272a0
Finch, M. S., Hydes, D. J., Clayson, C. H., Weigl, B., Dakin, J., and Gwilliam, P. (1998). A low power ultraviolet spectrophotometer for measurement of nitrate in seawater: introduction, calibration and initial sea trials. Anal. Chim. Acta 377, 167–177. doi: 10.1016/S0003-2670(98)00616-3
Frascari, F., Matteucci, G., and Giordano, P. (2002). Evaluation of a eutrophic coastal lagoon ecosystem from the study of bottom sediments. Hydrobiologia 475, 387–401. doi: 10.1007/978-94-017-2464-7_29
Frontalini, F., Margaritelli, G., Francescangeli, F., Rettori, R., Du Châtelet, E. A., and Coccioni, R. (2013). Benthic foraminiferal assemblages and biotopes in a coastal lake: the case study of Lake Varano (Southern Italy). Acta Protozool. 52, 147–160. doi: 10.4467/16890027AP.13.0014.1111
Ganguly, D., Patra, S., Muduli, P. R., Vardhan, K. V., Abhilash, K. R., Robin, R. S., et al. (2015). Influence of nutrient input on the trophic state of a tropical brackish water lagoon. J. Earth Syst. Sci. 124, 1005–1017. doi: 10.1007/s12040-015-0582-9
Gearing, J. N., Gearing, P. J., Rudnick, D. T., Requejo, A. G., and Hutchins, M. J. (1984). Isotopic variability of organic carbon in a phytoplankton-based, temperate estuary. Geochim. Cosmochim. Acta 48, 1089–1098. doi: 10.1016/0016-7037(84)90199-6
Ghosh, A. K., Pattnaik, A. K., and Ballatore, T. J. (2006). Chilika Lagoon: restoring ecological balance and livelihoods through re−salinization. Lakes Reserv. 11, 239–255. doi: 10.1111/j.1440-1770.2006.00306.x
Gilpin, L. C., Davidson, K., and Roberts, E. (2004). The influence of changes in nitrogen: silicon ratios on diatom growth dynamics. J. Sea Res. 51, 21–35. doi: 10.1016/j.seares.2003.05.005
Gupta, G. V. M., Sarma, V. V. S. S., Robin, R. S., Raman, A. V., Kumar, M. J., Rakesh, M., et al. (2008). Influence of net ecosystem metabolism in transferring riverine organic carbon to atmospheric CO2 in a tropical coastal lagoon (Chilka Lake. India). Biogeochemistry 87, 265–285. doi: 10.1007/s10533-008-9183-x
Hallock, P. (2012). “The FoRAM Index revisited: uses, challenges, and limitations,” in Proceedings of the 12th International Coral Reef Symposium, Cairns, QLD, 9–13.
Hammer, Ø, Harper, D. A. T., and Ryan, P. D. (2001). Paleontological statistics software: package for education and data analysis. Palaeontol. Electronica 4, 9–17.
Hayward, B. W., Holzmann, M., Grenfell, H. R., Pawlowski, J., and Triggs, C. M. (2004). Morphological distinction of molecular types in Ammonia–towards a taxonomic revision of the world’s most commonly misidentified foraminifera. Mar. Micropaleontol. 50, 237–271. doi: 10.1016/S0377-8398(03)00074-4
Hecky, R. E. (1998). Low N: P ratios and the nitrogen fix: why watershed nitrogen removal will not improve the Baltic effects of nitrogen in the aquatic environment. KVA Rep. 1, 85–116.
Hecky, R. E., and Kilham, P. (1988). Nutrient limitation of phytoplankton in freshwater and marine environments: a review of recent evidence on the effects of enrichment. Limnol. Oceanogr. 33, 796–822. doi: 10.4319/lo.1988.33.4part2.0796
Jansson, M., Bergström, A. K., Blomqvist, P., and Drakare, S. (2000). Allochthonous organic carbon and phytoplankton/bacterioplankton production relationships in lakes. Ecology 81, 3250–3255. doi: 10.1890/0012-96582000081
Jeong, K. S., Kim, D. K., Pattnaik, A., Bhatta, K., Bhandari, B., and Joo, G. J. (2008). Patterning limnological characteristics of the Chilika lagoon (India) using a self-organizing map. Limnology 9, 231–242. doi: 10.1007/s10201-008-0243-7
Jørgensen, B. B. (1996). “Material flux in the sediment,” in Eutrophication in Coastal Marine Ecosystems, eds B. B. Jørgensen and K. Richardson (Washington, DC: American Geophysical Union), 115–135. doi: 10.1029/ce052p0115
Kim, L. H., Choi, E., and Stenstrom, M. K. (2003). Sediment characteristics, phosphorus types and phosphorus release rates between river and lake sediments. Chemosphere 50, 53–61. doi: 10.1016/S0045-6535(02)00310-7
Kjerfve, B. (1986). “Comparative oceanography of coastal lagoons,” in Estuarine Variability, ed. B. Kjerfve (Cambridge, MA: Academic press), 63–81. doi: 10.1016/b978-0-12-761890-6.50009-5
Koretsky, C. M., Van Cappellen, P., Di Christina, T. J., Kostka, J. E., Lowe, K. L., Moore, C. M., et al. (2005). Salt marsh pore water geochemistry does not correlate with microbial community structure. Estuar. Coast Shelf Sci. 62, 233–251. doi: 10.1016/j.ecss.2004.09.001
Kumar, R., Pattnaik, A. K., and Pattnaik, P. (2011). “Management of Phragmites karka invasion in Chilika lake, Orissa,” in Background Paper for Consultation Workshop, 17th to 18th January, Bhubaneswar.
Lardicci, C., Como, S., Corti, S., and Rossi, F. (2001). Recovery of the macrozoobenthic community after severe dystrophic crises in a Mediterranean coastal lagoon (Orbetello, Italy). Mar. Pollut. Bull. 42, 202–214. doi: 10.1016/S0025-326X(00)00144-2
LaZerte, B. D., and Szalados, J. E. (1982). Stable carbon isotope ratio of submerged freshwater macrophytes. Limnol. Oceanogr. 27, 413–416. doi: 10.4319/lo.1982.27.3.0413
Lenton, T. M., and Watson, A. J. (2000). Redfield revisited: 1. Regulation of nitrate, phosphate, and oxygen in the ocean. Global Biogeochem. Cycles 14, 225–248. doi: 10.1029/1999GB90065
Liddicoat, M. I., Tibbits, S., and Butler, A. I. (1975). The determination of ammonia in seawater. Limnology 20, 131–132. doi: 10.4319/lo.1975.20.1.0131
Mahanty, M. M., Mohanty, P. K., Pattnaik, A. K., Panda, U. S., Pradhan, S., and Samal, R. N. (2016). Hydrodynamics, temperature/salinity variability and residence time in the Chilika lagoon during dry and wet period: measurement and modeling. Cont. Shelf Res. 125, 28–43. doi: 10.1016/j.csr.2016.06.017
Mahapatro, D., Panigrahy, R. C., Panda, S., and Mishra, R. K. (2010). Influence of monsoon on macrobenthic assemblage in outer channel area of Chilika lagoon, east coast of India. J. Wetl. Ecol. 3, 57–68. doi: 10.3126/jowe.v3i0.2223
Markou, D. A., Sylaios, G. K., Tsihrintzis, V. A., Gikas, G. D., and Haralambidou, K. (2007). Water quality of Vistonis Lagoon, Northern Greece: seasonal variation and impact of bottom sediments. Desalination 210, 83–97. doi: 10.1016/j.desal.2006.05.035
Martins, V. A., Frontalini, F., Tramonte, K. M., Figueira, R. C., Miranda, P., Sequeira, C., et al. (2013). Assessment of the health quality of Ria de Aveiro (Portugal): heavy metals and benthic foraminifera. Mar. Pollut. Bull. 70, 18–33. doi: 10.1016/j.marpolbul.2013.02.003
Matson, E. A., and Brinson, M. M. (1990). Stable carbon isotopes and the C: N ratio in the estuaries of the Pamlico and neuse rivers. North Carolina. Limnol. Oceanogr. 35, 1290–1300. doi: 10.4319/lo.1990.35.6.1290
Mayer, L. M. (1994a). Surface area control of organic carbon accumulation in continental shelf sediments. Geochim. Cosmochim. Acta 58, 1271–1284. doi: 10.1016/0016-7037(94)90381-6
Mayer, L. M. (1994b). Relationships between mineral surfaces and organic carbon concentrations in soils and sediments. Chem. Geol. 114, 347–363. doi: 10.1016/0009-2541(94)90063-9
Mcleod, E., Chmura, G. L., Bouillon, S., Salm, R., Björk, M., Duarte, C. M., et al. (2011). A blueprint for blue carbon: toward an improved understanding of the role of vegetated coastal habitats in sequestering CO2. Front. Ecol. Environ. 9, 552–560. doi: 10.1890/110004
McSweeney, S. L., Kennedy, D. M., Rutherfurd, I. D., and Stout, J. C. (2017). Intermittently Closed/Open Lakes and Lagoons: their global distribution and boundary conditions. Geomorphology 292, 142–152. doi: 10.1016/j.geomorph.2017.04.022
Meyers, P. A. (1994). Preservation of elemental and isotopic source identification of sedimentary organic matter. Chem. Geol. 114, 289–302. doi: 10.1016/0009-2541(94)90059-0
Mohanty, P. K., and Panda, B. U. S. (2009). Circulation and mixing processes in Chilika lagoon. Indian J. Mar. Sci. 38, 205–214.
Naresh Kumar, D, Ganesh, B., Karuna karudu, T., and Jagannadha Rao, M. (2012). A Record on Benthic Foraminiferal abundance and distribution in Gosthani estuary, Bheemunipatnam, Andhra Pradesh. Indian J. Geo. Mar. Sci. 41, 425–429.
Newton, A., Icely, J. D., Falcão, M., Nobre, A., Nunes, J. P., Ferreira, J. G., et al. (2003). Evaluation of eutrophication in the Ria Formosa coastal lagoon. Portugal Cont. Shelf Res. 23, 1945–1961. doi: 10.1016/j.csr.2003.06.008
Panda, U. S., and Mohanty, P. K. (2008). “Monitoring and modelling of Chilika environment using remote sensing data,” in Proceedings of Tail 2007: The 12th World Lake Conference, Jaipur, 617–638.
Panigrahi, S., Wikner, J., Panigrahy, R. C., Satapathy, K. K., and Acharya, B. C. (2009). Variability of nutrients and phytoplankton biomass in a shallow brackish water ecosystem (Chilika Lagoon, India). Limnology 10, 73–85. doi: 10.1007/s10201-009-0262-z
Patra, A. P., Patra, J. K., Mahapatra, N. K., Das, S., and Swain, G. C. (2010). Seasonal variation in physicochemical parameters of Chilika Lake after opening of new mouth near Gabakunda, Orissa, India. World J. Fish Mar. Sci. 2, 109–117.
Philippart, C. J., Cadée, G. C., van Raaphorst, W., and Riegman, R. (2000). Long−term phytoplankton−nutrient interactions in a shallow coastal sea: algal community structure, nutrient budgets, and denitrification potential. Limnol. Oceanogr. 45, 131–144. doi: 10.4319/lo.2000.45.1.0131
Rabalais, N. N., Turner, R. E., Justić, D., Dortch, Q., Wiseman, W. J., and Gupta, B. K. S. (1996). Nutrient changes in the Mississippi River and system responses on the adjacent continental shelf. Estuaries 19, 386–407.
Rao, K. K., Jayalakshmy, K. V., Venugopal, P., Gopalakrishnan, T. C., and Rajagopal, M. D. (2000). Foraminifera from the Chilika Lake on the East coast of India. J. Mar. Biol. Ass. India 42, 47–61.
Rao, N. R., Geetha, C., and Shanmhugavel, S. (2012). Benthic foraminiferal colonization of a new mangrove ecosystem – a case study from pazhaiyakayal, Tuticorin, South-East Coast of India. J. Palaeontol. Soc. India 57, 119–127.
Redfield, A. C., Ketchum, B. H., and Richards, F. A. (1963). “The influence of organisms on the composition of sea-water,” in The Sea, Vol. 2, ed. M. N. Hill (New York, NY: Interscience Publishers), 26–77.
Sahu, B. K., Pati, P., and Panigrahy, R. C. (2014). Environmental conditions of Chilika Lake during pre and post hydrological intervention: an overview. J. Coast Conserv. 18, 285–297. doi: 10.1007/s11852-014-0318-z
Samir, A. M. (2000). The response of benthic foraminifera and ostracods to various pollution sources: a study from two lagoons in Egypt. J. Foramin. Res. 30, 83–98. doi: 10.2113/0300083
Santschi, P., Höhener, P., Benoit, G., and Buchholtz-ten Brink, M. (1990). Chemical processes at the sediment-water interface. Mar. Chem. 30, 269–315. doi: 10.1016/0304-4203(90)90076-O
Scavia, D., Field, J. C., Boesch, D. F., Buddemeier, R. W., Burkett, V., Cayan, D. R., et al. (2002). Climate change impacts on US coastal and marine ecosystems. Estuaries 25, 149–164. doi: 10.1007/BF02691304
Schönfeld, J., Alve, E., Geslin, E., Jorissen, F., Korsun, S., and Spezzaferri, S. (2012). The FOBIMO (FOraminiferal BIo-MOnitoring) initiative-towards a standardised protocol for soft-bottom benthic foraminiferal monitoring studies. Mar. Micropaleontol. 94, 1–13. doi: 10.1016/j.marmicro.2012.06.001
Schouten, S., Schoell, M., Rijpstra, W. I. C., Damsté, J. S. S., and de Leeuw, J. W. (1997). A molecular stable carbon isotope study of organic matter in immature Miocene Monterey sediments, Pismo basin. Geochim. Cosmochim. Acta 61, 2065–2082. doi: 10.1016/S0016-7037(97)00062-8
Sen (2019). Benthic Foraminifera from the Marginal Marine Environments of North West Coast of Bay of Bengal. Ph.D. thesis, Indian Institute of Science Education and Research Kolkata, Mohanpur.
Sen, A., and Bhadury, P. (2016). Exploring the seasonal dynamics within the benthic foraminiferal biocoenosis in a tropical monsoon-influenced coastal lagoon. Aquat. Biol. 25, 121–138. doi: 10.3354/ab00658
Sen, A., and Bhadury, P. (2017). Holistic monitoring of increased pollutant loading and its impact on the environmental condition of a coastal lagoon with Ammonia as a proxy for impact on biodiversity. Biogeosci. Discuss. doi: 10.5194/bg-2017-13
Søndergaard, M., Jensen, J. P., and Jeppesen, E. (2003). Role of sediment and internal loading of phosphorus in shallow lakes. Hydrobiologia 506, 135–145. doi: 10.1023/B:HYDR.0000008611.12704.dd
Srichandan, S., Kim, J. Y., Kumar, A., Mishra, D. R., Bhadury, P., Muduli, P. R., et al. (2015). Interannual and cyclone-driven variability in phytoplankton communities of a tropical coastal lagoon. Mar. Pollut. Bull. 101, 39–52. doi: 10.1016/j.marpolbul.2015.11.030
Strickland, J. D., and Parsons, T. R. (1972). A Practical Handbook of Seawater Analysis. Ottawa, ON: Fisheries Research Board of Canada.
Takata, H., Hasegawa, S., and Sonoda, T. (2019). Life history of Ammonia “beccarii” forma 1 (benthic foraminifera, Rhizaria) in Lake Saroma, northern Japan. Estuar. Coast. Shelf Sci. 229:106385. doi: 10.1016/j.ecss.2019.106385
Turner, R. E., Qureshi, N., Rabalais, N. N., Dortch, Q., Justic, D., Shaw, R. F., et al. (1998). Fluctuating silicate: nitrate ratios and coastal plankton food webs. Proc. Natl. Acad. Sci. U.S.A. 95, 13048–13051. doi: 10.1073/pnas.95.22.13048
Turner, R. E., Rabalais, N. N., Swenson, E. M., Kasprzak, M., and Romaire, T. (2005). Summer hypoxia in the northern Gulf of Mexico and its prediction from 1978 to 1995. Mar. Environ. Res. 59, 65–77. doi: 10.1016/j.marenvres.2003.09.002
Tyrrell, T. (1999). The relative influences of nitrogen and phosphorus on oceanic primary production. Nature 400, 525–531. doi: 10.1038/22941
Tyson, R. V. eds. (1995). “Abundance of organic matter in sediments: TOC, hydrodynamic equivalence, dilution and flux effects,” in Sedimentary Organic Matter, (Dordrecht: Springer Netherlands), 8–11.
Van Bennekom, A. J., Gieskes, W. W. C., and Tijssen, S. B. (1975). Eutrophication of Dutch coastal waters. Proc. R. Soc. Lond. B Biol. Sci. 189, 359–374. doi: 10.1098/rspb.1975.0062
Vitousek, P. M., Aber, J. D., Howarth, R. W., Likens, G. E., Matson, P. A., Schindler, D. W., et al. (1997). Human alteration of the global nitrogen cycle: sources and consequences. Ecol. Appl. 7, 737–750. doi: 10.1890/1051-07611997007
Keywords: nutrient loading, lagoon, Corg, δ13C, Ammonia, proxy
Citation: Bhadury P and Sen A (2020) Understanding Impact of Seasonal Nutrient Influx on Sedimentary Organic Carbon and Its Relationship With Ammonia spp. in a Coastal Lagoon. Front. Mar. Sci. 7:177. doi: 10.3389/fmars.2020.00177
Received: 28 June 2019; Accepted: 06 March 2020;
Published: 03 April 2020.
Edited by:
Jiasong Fang, Hawaii Pacific University, United StatesReviewed by:
Akkur Vasudevan Raman, Andhra University, IndiaElena Romano, Italian National Institute for Environmental Protection and Research (ISPRA), Italy
Copyright © 2020 Bhadury and Sen. This is an open-access article distributed under the terms of the Creative Commons Attribution License (CC BY). The use, distribution or reproduction in other forums is permitted, provided the original author(s) and the copyright owner(s) are credited and that the original publication in this journal is cited, in accordance with accepted academic practice. No use, distribution or reproduction is permitted which does not comply with these terms.
*Correspondence: Punyasloke Bhadury, cGJoYWR1cnlAaWlzZXJrb2wuYWMuaW4=; cGJoYWR1cnlAZ21haWwuY29t
 Punyasloke Bhadury
 Areen Sen1