 Vasiliki I. Chalastani1*
 Panos Manetos2
 Abdulaziz M. Al-Suwailem3
 Jason A. Hale3Abhishekh P. Vijayan3John Pagano4Ian Williamson4Scott D. Henshaw4Raed Albaseet4Faisal Butt4
 Russell E. Brainard4,5
 Harry Coccossis2
 Vasiliki K. Tsoukala1
 Carlos M. Duarte5,6
- 1Laboratory of Harbor Works, Department of Water Resources and Environmental Engineering, School of Civil Engineering, National Technical University of Athens, Zografou, Greece
- 2Department of Planning and Regional Development, School of Engineering, University of Thessaly, Volos, Greece
- 3Beacon Development Company, King Abdullah University of Science and Technology, Thuwal, Saudi Arabia
- 4The Red Sea Development Company, Riyadh, Saudi Arabia
- 5Red Sea Research Center (RSRC), King Abdullah University of Science and Technology (KAUST), Thuwal, Saudi Arabia
- 6Computational Bioscience Research Center (CBRC), King Abdullah University of Science and Technology (KAUST), Thuwal, Saudi Arabia
The Red Sea Project (TRSP) is a development that extends over 28,000 km2 along the shores of the Red Sea that will progress to become a sustainable luxury tourism destination on the west coast of the Kingdom of Saudi Arabia. The destination incorporates the Al Wajh lagoon, a pristine 2,081 km2 area that includes 92 islands with valuable habitats (coral reefs, seagrass, and mangroves) and species of global conservation importance. The Red Sea Development Company, responsible for the execution of TRSP, has committed to achieve a net-positive impact on biodiversity while developing the site for sustainable tourism. This requires reaching conservation outcomes superior to those of a “business as usual” scenario for an undeveloped site. After careful optimization of the development plans to explore every opportunity to avoid impacts, we applied marine spatial planning to optimize the conservation of the Al Wajh lagoon in the presence of development. We subsequently tested five conservation scenarios (excluding and including development) using Marxan, a suite of tools designed to identify priority areas for protection on the basis of prescribed conservation objectives. We succeeded in creating a three-layer conservation zoning, achieving conservation outcomes as those possible in the “business as usual” scenario. Subsequently, we designed additional actions to remove existing pressures and generate net positive conservation outcomes. The results demonstrate that careful design and planning could potentially allow coastal development to enhance, rather than jeopardize, conservation.
Introduction
The growing activity of humans in the oceans has generated competing demands for ocean marine space, which challenge established institutional governance arrangements. More particularly, traditional governance is based on sectorial arrangements that are poorly suited to coordinate and balance actions across vastly different sectors. As a result, marine spatial planning (MSP) emerged as a policy framework to optimize marine space allocation to various activities to avoid negative interactions, improve synergies, and advance toward a sustainable ocean economy, as reflected in explicit mandates for MSP. Such mandates have not yet been established for any of the areas considered by the Regional Organization for the Conservation of the Environment of the Red Sea and Gulf of Aden (PERSGA). PERSGA is an intergovernmental body dedicated to the conservation of the coastal and marine environments found in the Red Sea, Gulf of Aqaba, Gulf of Suez, Suez Canal, and Gulf of Aden surrounding the Socotra Archipelago and nearby waters.1 However, MSP policy guidance is in place in the adjacent Mediterranean Sea, involving European Union (EU) member states with marine exclusive economic zones (EEZs). From a regional perspective, MSP is best established, as a governance tool, in Europe, where 37% of all countries apply MSP (Frazão Santos et al., 2019). The MSP policy guidance is described by the 2014/89/EU Directive, which establishes a framework for MSP and aims at promoting the sustainable growth of maritime economies, the sustainable development of marine areas, and the sustainable use of marine resources.2 In Europe, several countries implemented MSP approximately a decade ago and are currently in the second or third round of planning (Frazão Santos et al., 2019). In particular, Norway, Belgium, Netherlands, and Germany have pioneered advanced MSP, whereas other European countries are less advanced, although making progress toward MSP development (e.g., Malta, Lithuania, Cyprus, Portugal). However, all relevant EU member states are mandated to have marine spatial plans in place by 2021 (European Commission, 2014).
Typically, however, MSP has aided in conservation zoning and the design of networks for marine protected areas (MPAs) (Agardy et al., 2011). Indeed, there are few case studies to date where multiple sectors were involved in the planning (e.g., Gulf of Naples; Appolloni et al., 2018), mainly in relation to “extractive industries” (aquaculture, fisheries, and/or marine energy) and ecosystem conservation (e.g., Yates et al., 2015). In complement to MSP, coastal zone management (CZM) provides a policy framework for coordinating human activities and ecosystem management in coastal areas where terrestrial and marine spaces are intricately related. CZM is mostly applied to marine zones less than 2 km from the coastline, whereas MSP can be applied to much wider areas, extending to EEZs (European Commission, 2017). However, Art. 7 of the 2014/89/EU Directive states that “to take into account land–sea interactions in accordance with Article 4(2), should this not form part of the maritime spatial planning process as such, Member States may use other formal or informal processes, such as integral coastal management.” (European Commission, 2014). Therefore, there is a clear need to integrate spatial planning approaches, i.e., an intersectoral and land–sea cross-cutting approach (Panagou et al., 2018). In particular, land–sea interaction is an important factor that should be taken into account during the implementation of spatial plans (Rempis et al., 2018). However, coastal development continues to co-opt coastal space across all continents (Neumann et al., 2015), while CZM is often ignored in MSP exercises. MSP is a process in which to operationalize ecosystem-based management (EBM) theory (Irish, 2018). Therefore, an effort to unify, to put parts together into a whole (Portman et al., 2012), thus an integrated approach which includes CZM in the MSP process, is capable to achieve that goal. An approach which involves different sectors in land, coastal, and marine environments, as well as different levels of governance and a variety of stakeholders while trying to explore synergies and manage conflicts across all these levels, is critically necessary for the success of MSP.
Coastal development and marine conservation have traditionally been antagonistic goals (Lopes et al., 2015), given that coastal development typically alters ecosystems, reduces the extent of habitats, and generates stressors, such as pollution, noise, and others, that often broadly impact the marine ecosystems (Halpern et al., 2012; Song et al., 2016; Yu et al., 2019). The traditional approach to manage the impacts from coastal development on marine ecosystems would be to formulate biodiversity offsets or a deductively defined conservation area, which typically constitutes only 10% of the area to be developed. However, under an optimistic scenario, coastal tourism could be reverted to shift roles from antagonistic with marine conservation toward providing potential pathways for net positive conservation benefits above that obtained with conservation alone. Shifting the interaction between coastal development and conservation from antagonistic to net positive is a challenge that appears well suited for MSP, which strives to reduce conflict (Tuda et al., 2014), and, if at all possible, generating positive synergies. Indeed, MSP was applied as a path to mitigate conflict between artisanal fishing, coastal tourism, and marine conservation in a 38-km2 area within the Mombasa Marine National Park and Reserve (Kenya; Tuda et al., 2014). However, we believe that conservation is at the root of sustainable development. Therefore, reconciling coastal development and conservation requires the embracement of conservation as a primary goal by stakeholders involved in sustainable development. Full uptake of MSP’s attempts at achieving this reconciliation can only succeed if all stakeholders are committed to the MSP process from the onset, rather than receiving an MSP plan for consideration.
Here, we ask the question of whether MSP can, when supported by conservation measures, drive coastal tourism into shifting roles in the 21st century from being a threat toward conservation and thus achieving net positive conservation benefits. We address this question using a real-world case study of The Red Sea Project (TRSP),3 characterized as a giga-project launched by the Kingdom of Saudi Arabia within its Vision 2030 plan to transform the nation. Vision 2030 sets to accomplish the diversification of the economy, creating a vibrant society, and new employment opportunities. TRSP aims to deliver on those commitments by improving the Kingdom’s tourism industry, which currently represents only 3% of the economy. Indeed, 3% is only a fraction of the industry’s role in the global gross domestic product (GDP), which is estimated to represent over 10%. This improvement is centered around the development of a large (28,000 km2 of which 8,008 km2 are islands and marine ecosystems), nearly pristine coastal area for high-end tourism while achieving net positive conservation benefits. High-end tourism refers to touristic services “intended for people who want very good quality products and who do not mind how much they cost.” (Cambridge English Dictionary). Within the boundaries of the entire area (28,000 km2), a special economic zone (SEZ) will be defined and legally instituted. In addition, the Al Wajh lagoon (2,081 km2) has already been declared as a critical habitat. TRSP entails the development of a luxury eco-tourism destination aiming to support approximately 1 million visitors per year. The selected site includes the Al Wajh lagoon, a large lagoon area of 2,081 km2 with 92 islands, valuable ecosystems, and rich biodiversity, such as the coral reefs forming the boundaries of the lagoon while defining its external perimeter. Human population in the area is low, with density within the 28,000 km2 being <0.1 person per km2. There are no residents or settlements in the islands; however, fishing activity is relatively high, with about 300 fishing boats operating in the region. No tourism activity currently exists in the area, but tourism development is considered to be a significant opportunity to create employment and enhance economic activity to reduce the dependence of the Kingdom of Saudi Arabia on fossil fuel revenues. By doing so, TRSP expects to create 70,000 new jobs, contributing over 22B SAR/year to the national economy. This commitment comes, however, with an ambition to create net positive impact and increase the conservation value of the site by 30%. However, whether the level of tourism considered to be sustainable in the Al Wajh lagoon can be compatible with the conservation targets set by TRSP and what specific spatial arrangement may lead to this balance need be assessed. MSP provides, therefore, an effective, and even necessary, approach to seek the optimal way to balance conservation goals with tourism development goals.
We hereto describe how an interdisciplinary team of practice, including concept master planners, engineers, architects, environmental managers, and marine ecologists, was assembled to address this challenge. We further describe how through the necessary layers of information, the team’s members jointly explored every opportunity to avoid impacts through design and then integrated all data streams through a quantitative MSP approach. This approach explores the nexus of conservation and development and proposes a preliminary zoning plan for the 2,081 km2 marine area while designing a strategy to achieve net positive impacts under the “business as usual” scenario. In our case, the “business as usual” scenario refers to the state of study area in the absence of any development, but under the chronic impacts being in place. These threats include overfishing, reflected in the scarcity of large and small fish stocks, bycatch mortality of turtles and dugongs, local extirpation of birds and other vulnerable species by invasive species (rats and cats) present in some of the islands, plastic litter that abounds on the shores, mortality caused by ghost nets abandoned at sea, and climate change. All existing pressures were identified during workshops and intensive studies initiated in 2017. The lack of prior baseline assessments and time series precludes the identification of impacts these pressures cause. Current studies demonstrate that the presence of cats in some islands has led to the extirpation of nesting birds from these areas. In addition, it has been recently recorded that several sea turtles were killed either directly by fishermen or by ghost nets and one dugong was killed by ghost nets. Comparisons of fish stocks in Red Sea reefs of Saudi Arabia and Sudan indicate that the biomass of top predators on offshore Sudanese reefs is, on average, almost three times higher than the one measured on comparable reefs in Saudi Arabia (Kattan et al., 2017). The latter constitutes an underestimation of the biomass decline due to overfishing, since Sudanese reefs also experience some fishing mortality. The threats described above are estimated to result in a decline of about 0.5% year–1 in conservation value, conducive to an estimated 10% loss of conservation value in 20 years, within the lower range of degradation reported for coral reef regions since 1950 (Pandolfi et al., 2003). An MSP approach that identifies the areas that need to be conserved, as well as the areas which could be sustainably developed, is considered necessary for the evolution of TRSP. Furthermore, both the spatial distribution of areas according to their conservation value and the quantification of this value are fundamental for designing a management strategy to tackle the existing pressures. In the context of TRSP, further iterations of MSP are planned, as new baseline information becomes available, to continue managing development and operations adaptively and documenting progress toward the net positive conservation impact pledged by TRSP.
Materials and Methods
Study Area
This study was conducted in the context of TRSP to be developed in and around the Al Wajh lagoon, located on the northeastern part of the Red Sea (Figure 1), including coral reefs of different configurations, mangrove forests, and seagrass meadows. For instance, in the eastern boundaries of the lagoon, extensive coral reef formations occur at depths between 0.5 and 10 m. These are either continuous reefs that fringe the large islands’ coastline or patch and deeper reef formations that are in generally moderate to locally good condition, with live coral cover ranging from ∼30% to ∼70%. Indeed, these represent some of the healthiest and most extensive coral reefs inside the TRSP lagoon. The genera responsible for building these coral reefs include branching growth forms, namely, Porites and Montipora, along with Acropora, Stylophora, Fungia, and Platygyra. Flat sandy bottoms as well as hardgrounds and coral rubble with fleshy macroalgae (Sargassum sp., Cystoseira sp., Laurencia sp., and Turbinaria sp.) dominate the shallow (0.5–1.5 m depth) coasts around the islands, with sparse Halodule sp. and Halophila sp. seagrass patches in between. In the intertidal zone, sparse mangroves (Avicennia marina) grow all along the insular coastline, locally presenting dense, impenetrable facies. The habitats present in the lagoon were classified into 27 habitat types (Figure 1 and Table 1) and mapped through a combination of remote sensing and in situ ground truthing and biodiversity assessment surveys, which also documented existing impacts and pressures at the site. These habitat categories followed those developed by Rowlands et al. (2012), including reefs in the study area, provide an adequate surrogate for biodiversity while conducting conservation planning in the Red Sea. The habitat distribution was then georeferenced using ArcGIS (Figure 1). In addition, the site contains a number of species assessed as “threatened” (endangered, E, or critically endangered, CE) by the International Union for Conservation of Nature (IUCN), including 11 bird species (e.g., white-eyed gull, sooty falcon; Table 2) and two sea turtle species (i.e., hawksbill sea turtle and green sea turtle; Table 1).
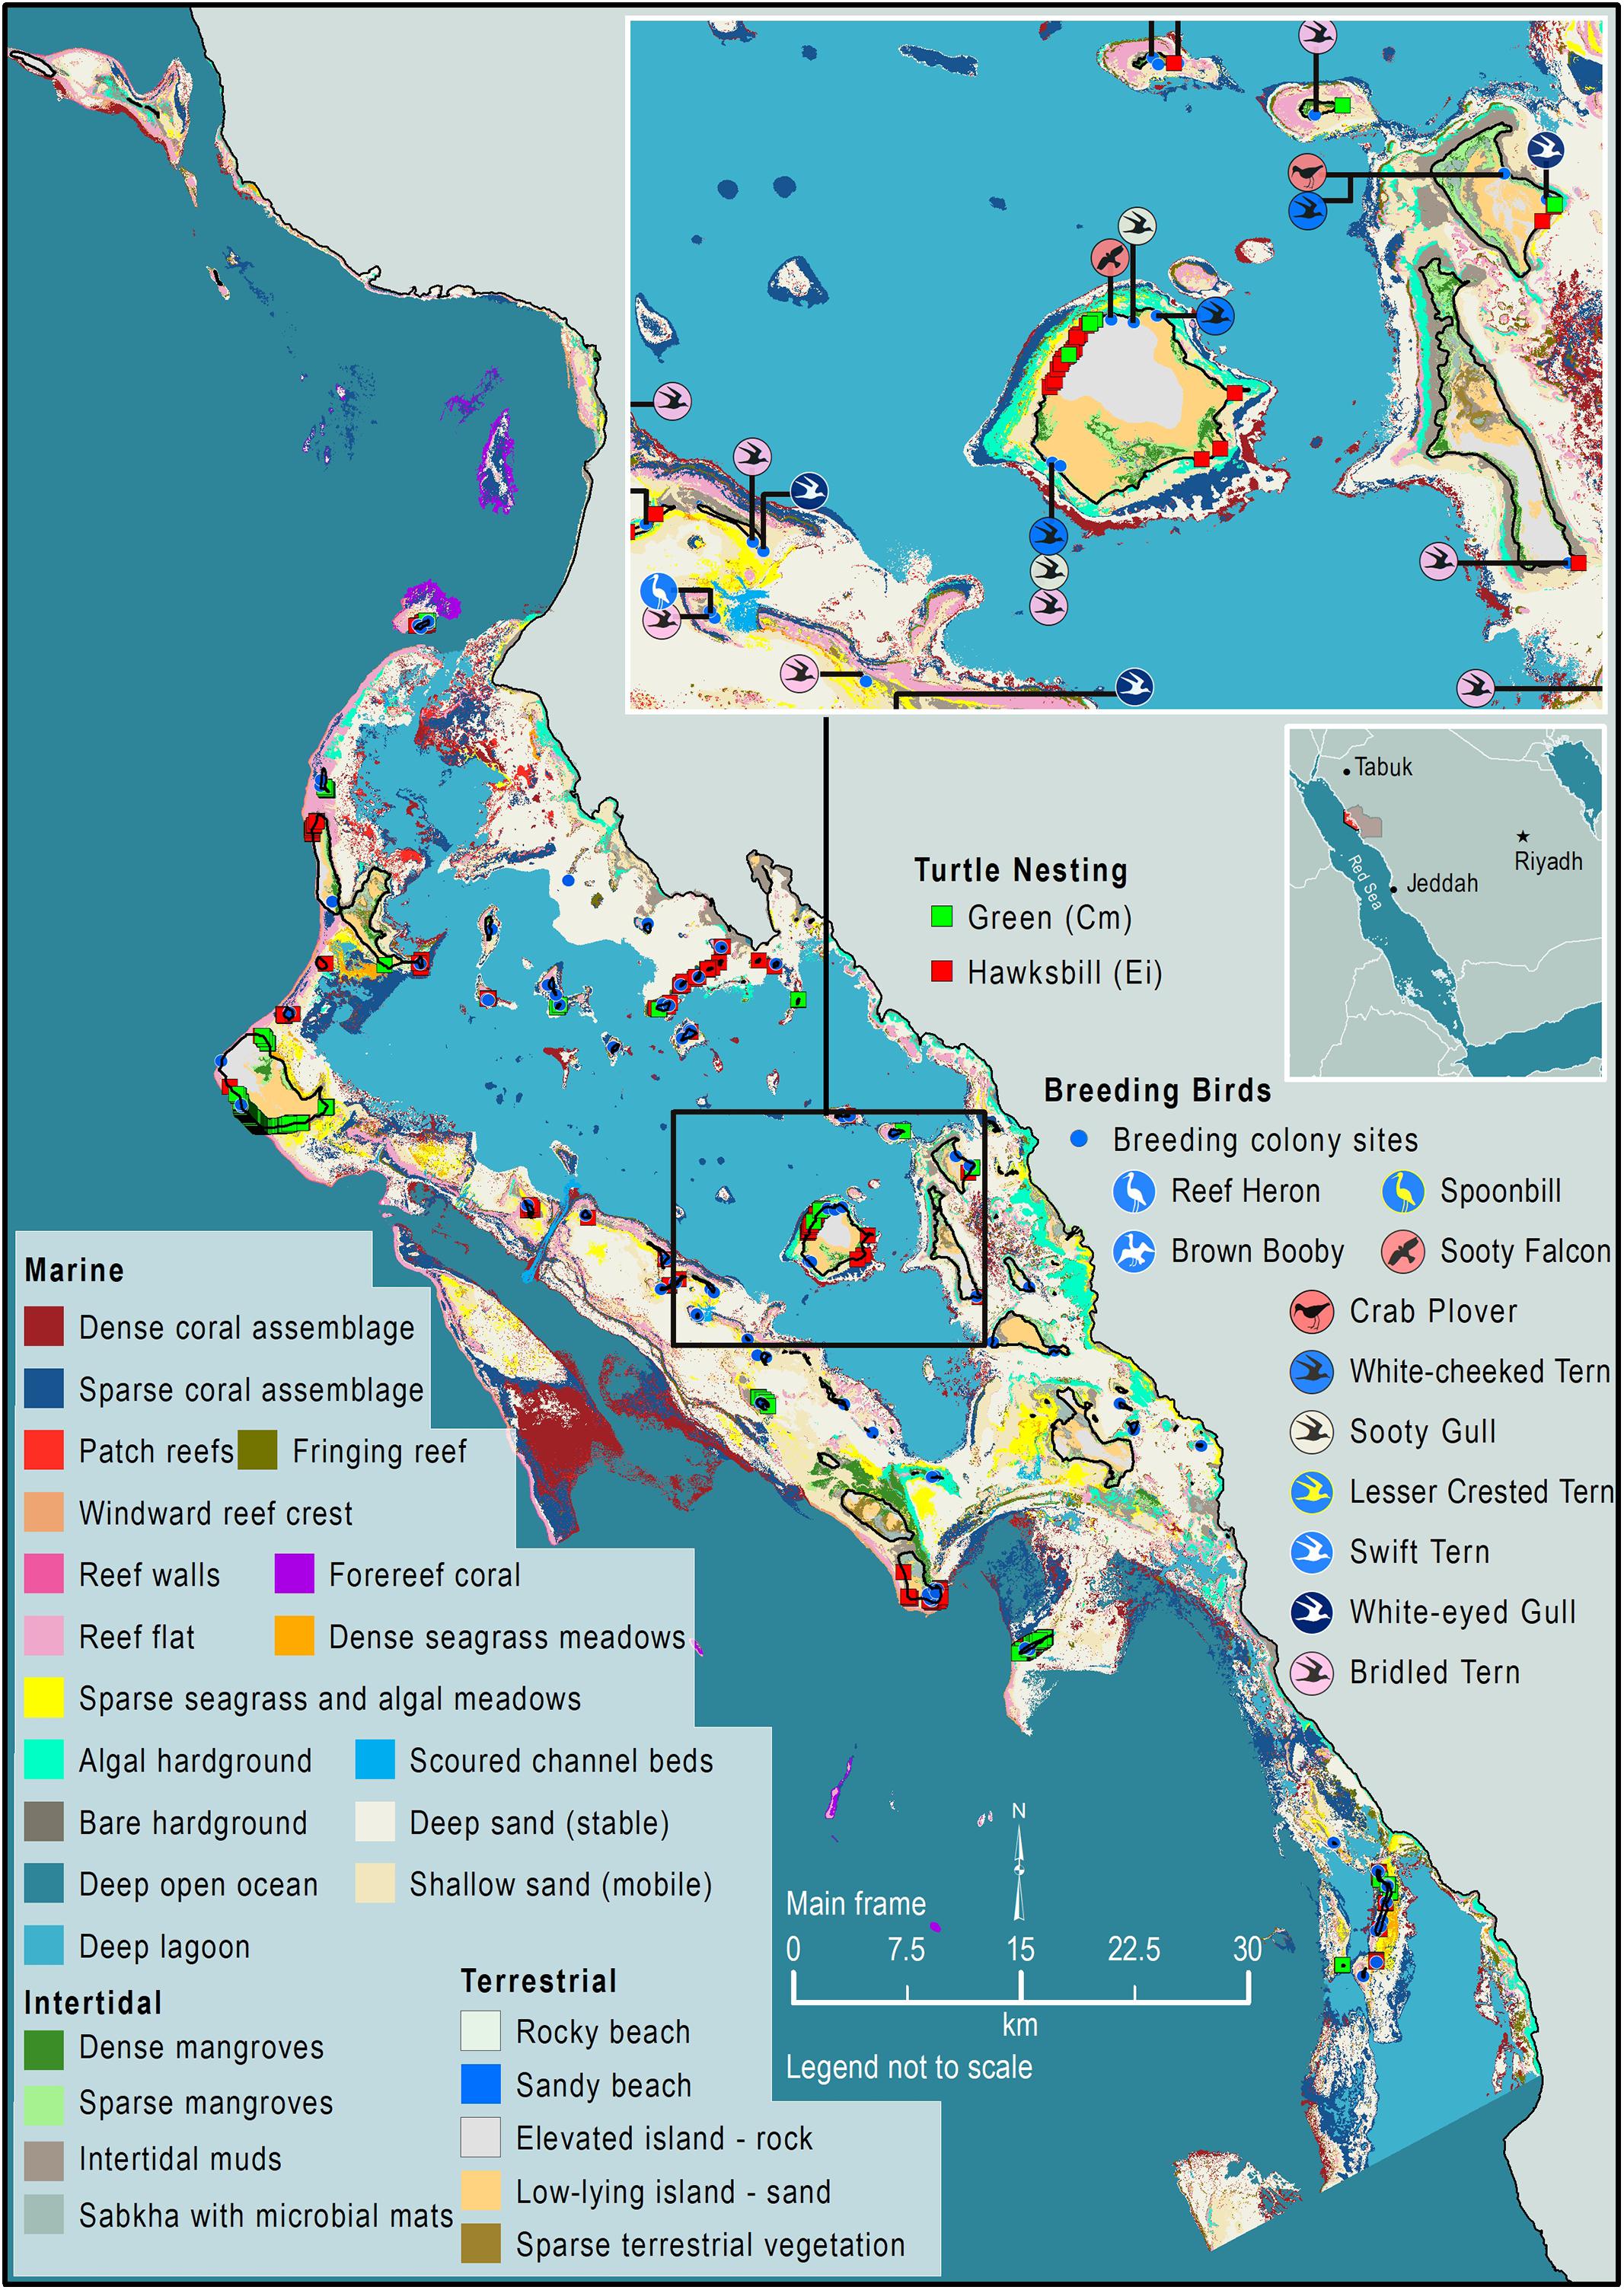
Figure 1. The Al Wajh lagoon, on the northeastern part of the Red Sea, the site of the Red Sea Project (RSP) development. The map shows the distribution of the 27 habitats and the nesting sites for the 11 species within the RSP boundaries.
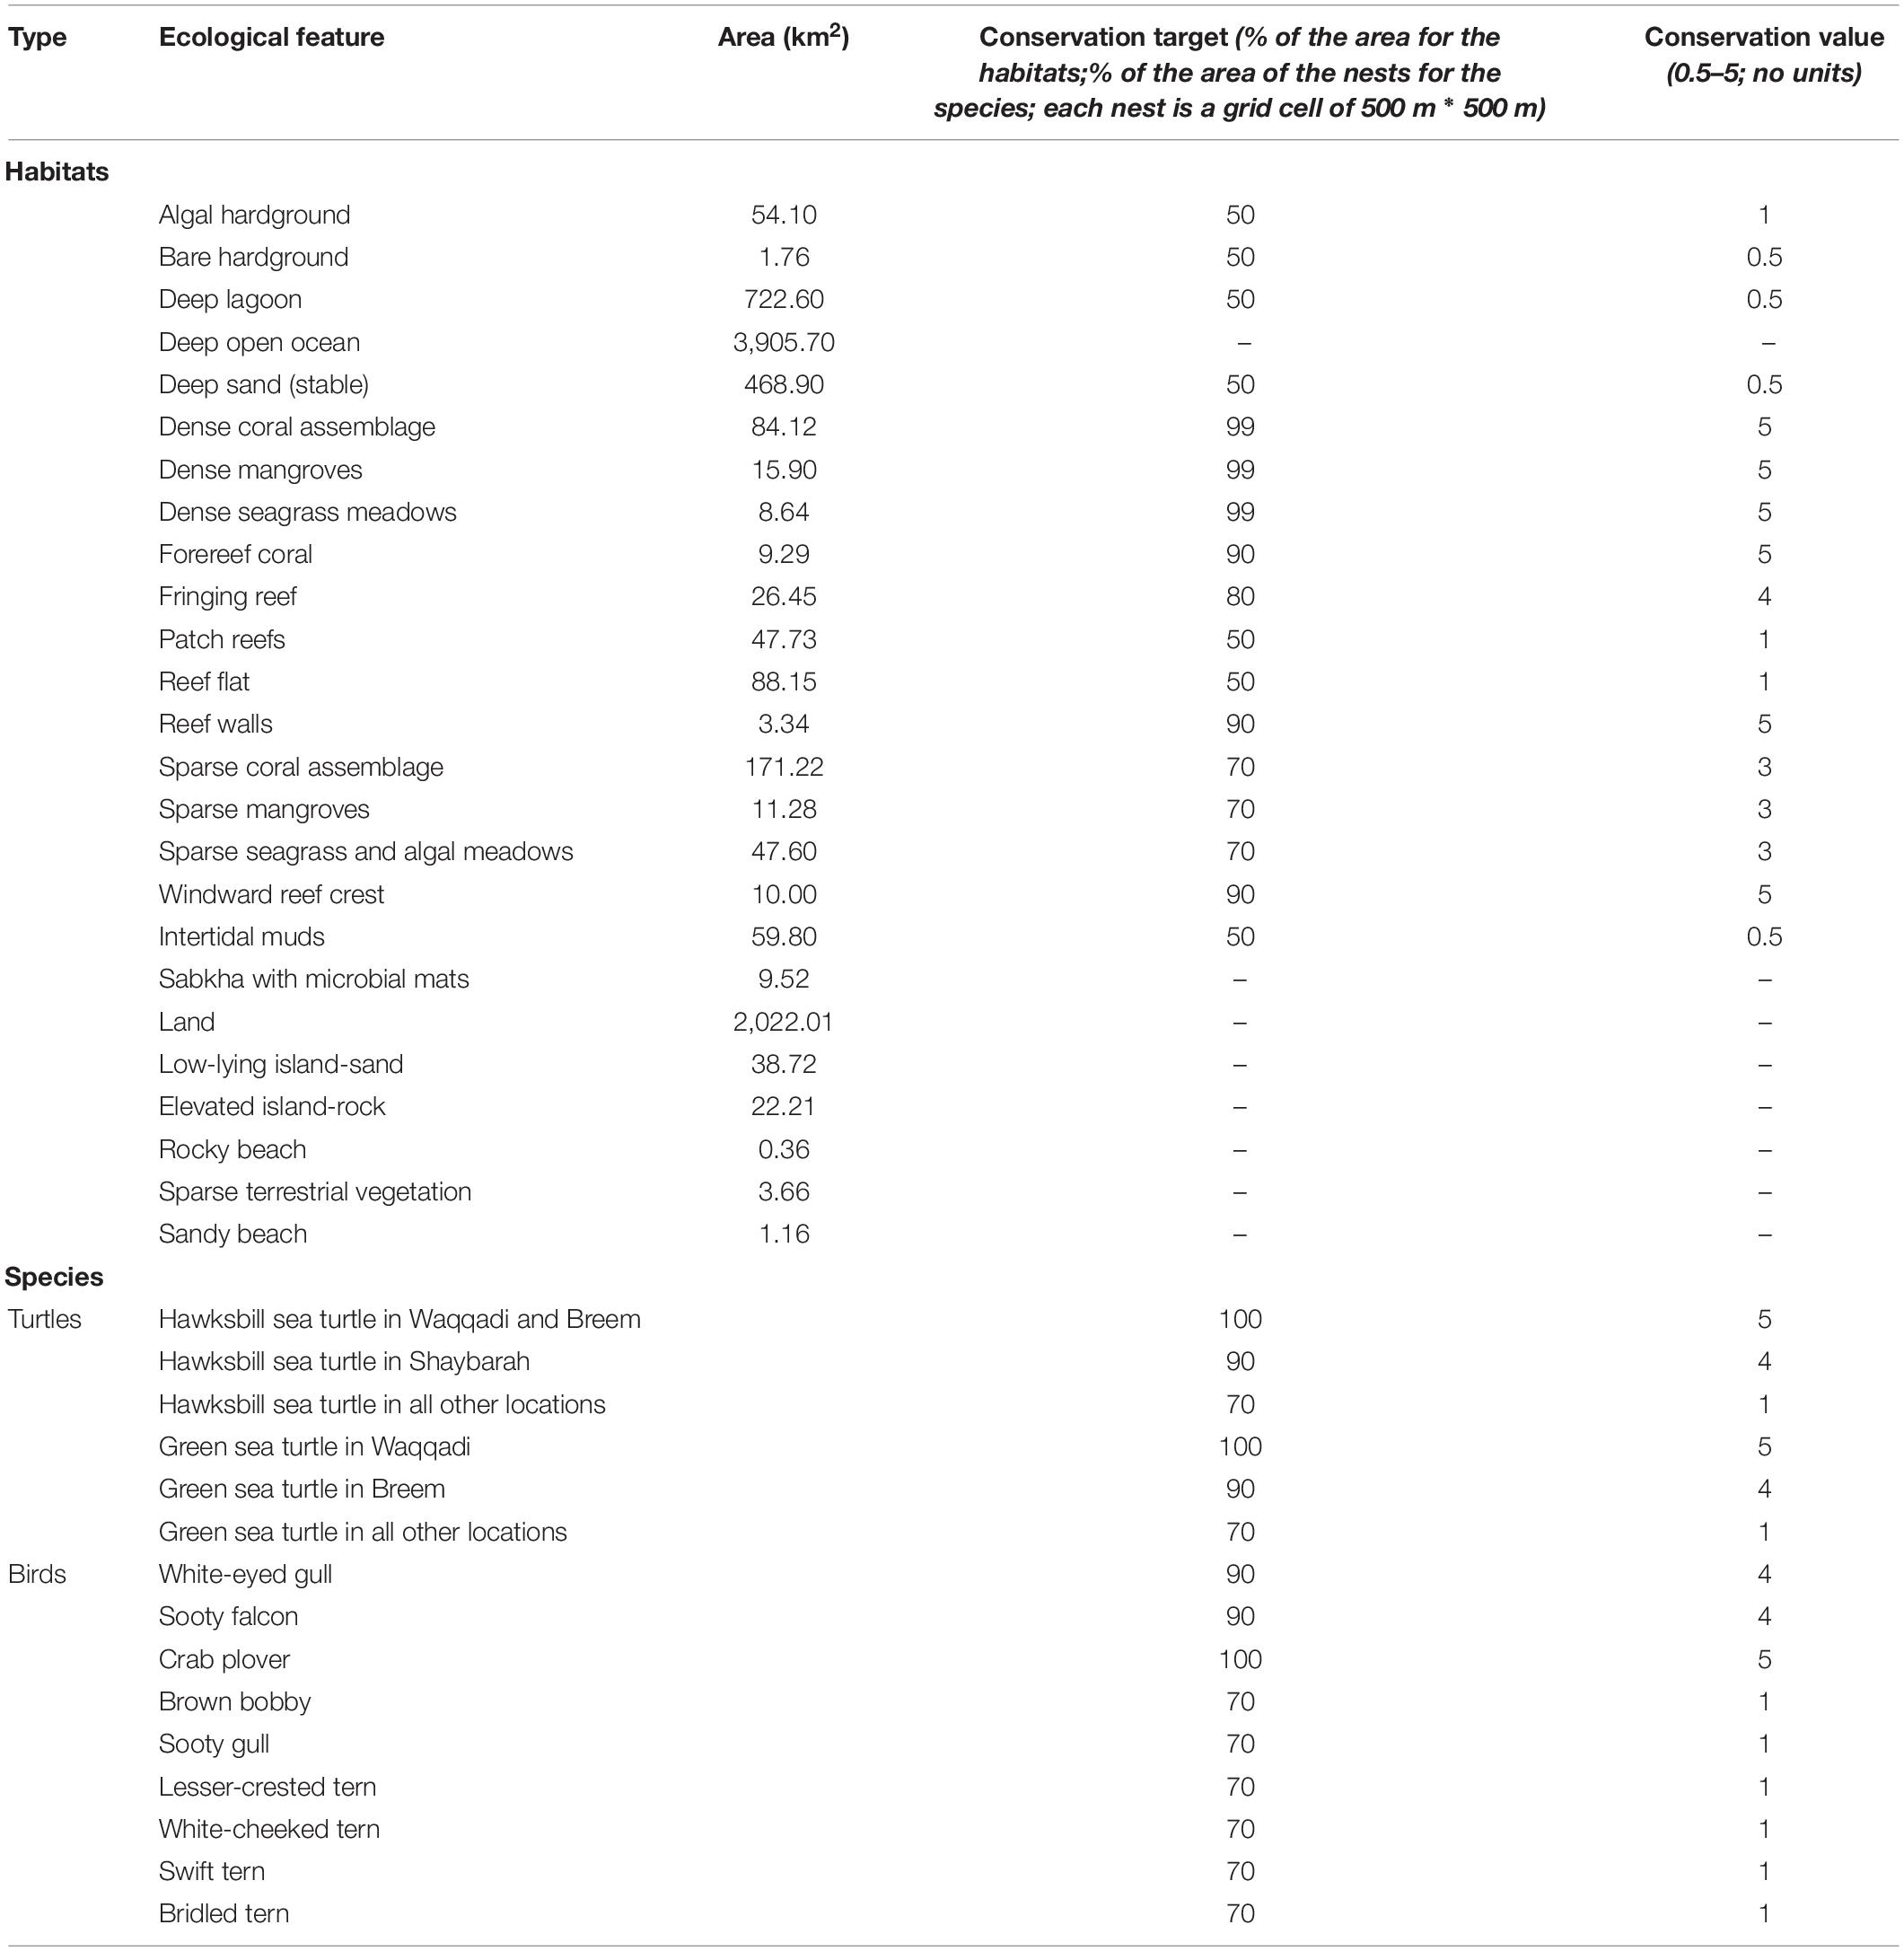
Table 1. The habitats and species within the Al Wajh lagoon are hereto presented as well as the area of each habitat, the total nesting area of the species (500 m buffer zone), the targets, and the conservation value for those considered in the analysis (i.e., no targets and values were assigned to the terrestrial habitats and the deep open ocean).
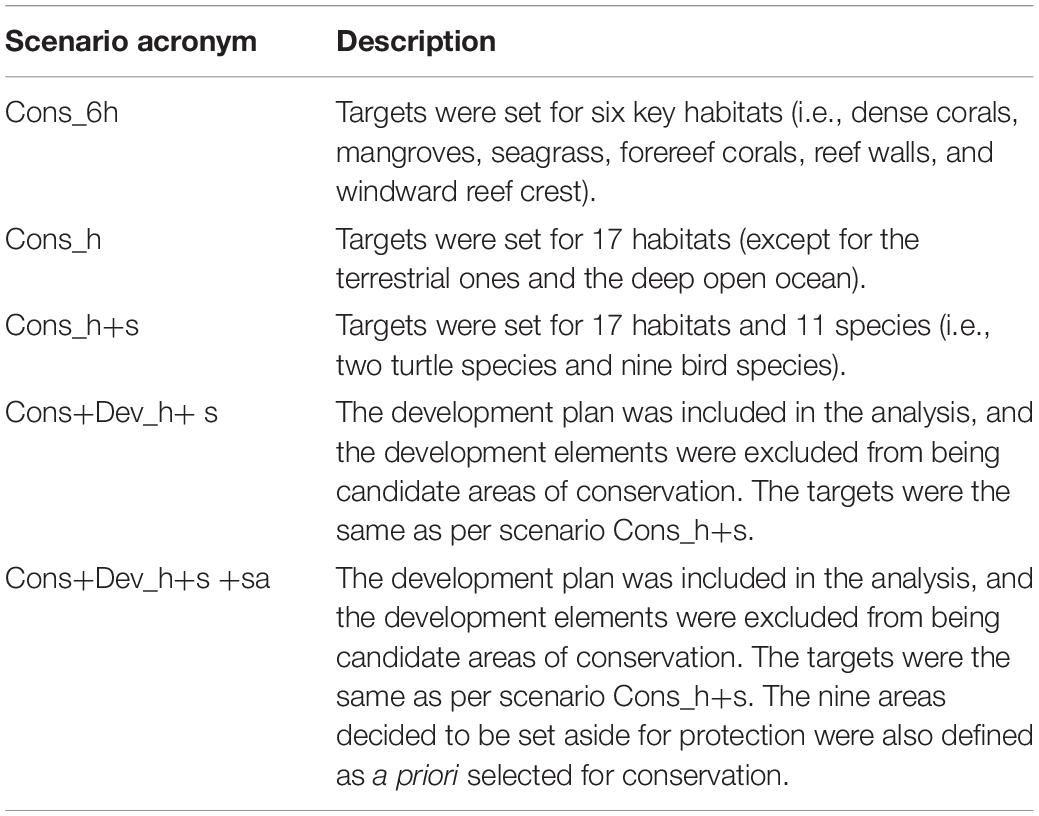
Table 2. Description of the five different scenarios created in the context of the study.
A discrete conservation value, ranging from 0.5 to 5, was assigned to each of 17 habitats (except for the terrestrial ones and the deep open ocean) and 11 species of conservation concern (Table 1) according to the biodiversity they support and their threatened status, respectively. Of the 17 habitats, six were identified to have the highest conservation value (i.e., dense corals, dense mangroves, dense seagrass, forereef corals, reef walls, and windward reef crest) (Table 1). The assignment of the highest conservation value to these six key habitats was based on expert opinion and justified not only by local biodiversity assessments, but also by the current understanding of the ecology of the Red Sea and tropical marine ecosystems elsewhere. Targeting habitats for conservation is supported by demonstrations that marine species are associated with specific marine habitats. Therefore, targeting species-rich habitats for conservation provides an efficient surrogate for species conservation in marine tropical ecosystems (Dalleau et al., 2010; Hamel and Andréfouët, 2010; Törnroos et al., 2013; Sutcliffe et al., 2015). Specifically, our habitat mapping included coral reef conformations of different conservation values as specifically determined for Red Sea coral reefs using a combination of remote sensing and ground truthing by the Living Seas Foundation (Rowlands et al., 2012; Rowlands et al., 2016). Valuable habitats, in terms of biodiversity conservation, included coral reefs of different configurations, seagrass meadows, and mangrove stands. In addition, the abundance of 11 priority species considered in this study led the Al Wajh lagoon to be assessed as an area of conservation significance by the Saudi Wildlife Authority, with populations of three of the area’s species (i.e., crab plover and the two sea turtles) being globally relevant (i.e., including a significant fraction, from 0.001 to 5%, of the global population, based on nesting activity). These species were then assessed to have the highest conservation value (Table 1). Nesting areas for all birds and turtles were mapped based on surveys spanning the entire nesting season. A 500 m buffer zone was established around each nest, colony, or cluster of nests. Species, such as sea turtles and birds that have critical life stages (i.e., nesting) on land have been found to be particularly vulnerable to development as well as to terrestrial invasive species (i.e., cats and rodents) (Wanless et al., 2007; Caut et al., 2008; Jones et al., 2008; Ratcliffe et al., 2010; Baker et al., 2019).
In total, 15 environmental baseline surveys have been conducted during 2017 and 2018 (Supplementary Table S1) to identify and map the patterns of flora and fauna within the Project’s boundaries. However, these surveys constitute an ongoing process. The Red Sea Development Company (TRSDC) is presently planning extensive field biological and ecological surveys over the next 3–4 years to establish comprehensive baseline assessments of biological diversity of marine and terrestrial ecosystems across the entire SEZ. For instance, in 2020, almost 600 stratified-random visual fish assessment surveys of hard-bottom habitats are planned along with a similar number of fish surveys across a broader range of depths and habitats using baited remotely underwater video surveys (BRUVS), including soft-bottom habitats and deep reefs among others. In addition, an array of hydrophones is going to be deployed to continually monitor acoustic soundscapes and cetacean distribution, abundance, and movement patterns. Each of these baseline biodiversity assessments will be continued over time to examine long-term changes associated with development and operations, as well as climate change.
The concept master plan of TRSP includes a variety of infrastructure and activities (e.g., overwater villas, hotels, residences, bridges, marinas, and a golf course) to be developed along the lagoon and its surrounding areas. The development elements at the time of the study created a development footprint of 78 km2 (Supplementary Table S2), with 36 km2 of them located along the shore of the mainland (Figure 1).
Avoiding Development Impacts
An interdisciplinary team involving the chief executive officer (CEO) of TRSDC, the chief development officer, concept master planners, architects, marine and transportation engineers, utility managers, environmental regulators, and marine scientists was assembled to explore every option to avoid impacts in the concept master plan that would dictate how the Al Wajh lagoon will be developed while achieving net conservation benefits. This was effected through the series of 15 environmental baseline surveys conducted during 2017 and 2018 (Supplementary Table S1) but also through monthly environmental alignment workshops conducted for about 1 year prior to the MSP exercise, during which a broad range of actions were taken. These actions included (a) modifying the designs to avoid proximity to habitats and nesting sites of conservation value, implementing buffer zones; (b) minimizing intervention in the area; (c) reducing the density of the development to avoid potential noise and light impacts; and (d) reducing resources (e.g., energy, all of which will be from renewable sources and water, required to operate the development). These assessments were focused on individual development sites, i.e., individual islands, and were informed by the habitat and species baselines, leading to over 18 iterations of development plans and displacement of development from nine islands of high conservation value (“set aside islands,” see below) to minimize impacts. The resulting development footprint was then used to inform, along with the habitat and species maps, a holistic planning approach that required an exercise in MSP effected through a workshop involving all TRSP departments and elements that informed subsequent modeling of the conservation zoning for the site.
Scenarios
Our conservation models assessed two groups of scenarios, one including conservation only and one examining conservation in the presence of development. The rationale of this grouping was to explore the nexus of conservation and development in the area, thus challenging the project pledge to achieve net positive conservation impact through thoughtful sustainable development. In particular, we created five scenarios (Table 2): three scenarios considering only conservation, based on three increasingly comprehensive groups of conservation targets (six habitats of high conservation value, all habitats, other than the terrestrial ones and the deep open ocean, and all habitats plus 11 species of high conservation value, i.e., two sea turtle species and nine bird species), without considering any development plans. By progressively adding conservation targets to the analysis, we assessed whether targeting the most valuable habitats provided a surrogate for broader conservation targets, as assessed in the past (Dalleau et al., 2010; Hamel and Andréfouët, 2010; Törnroos et al., 2013; Sutcliffe et al., 2015), including the Red Sea (Rowlands et al., 2012, 2016). We note that only birds and sea turtle species of conservation concern were explicitly considered among the hundreds of species present in the area. The reason for this was that birds and turtles have vulnerable stages (i.e., nesting) of their life cycles on land, where marine habitats are not defined. We also evaluated two scenarios to assess if similar conservation targets as those in the absence of development could be achieved in the presence of development. The first scenario of this group entailed all habitats and species (as per scenario Cons_h+s; Table 2) but also considered the development elements as areas a priori excluded from conservation. In the second scenario of this group, the nine islands decided by TRSDC to be set aside for protection were also included in the analysis, as a priori selected for conservation in order to evaluate how this decision quantitatively affects the final conservation outcome.
The software-based decision support tool Marxan v 2.43 (Ball et al., 2009) was used to select areas for conservation. Marxan is a software, widely used for systematic selection and designation of conservation areas (Ardron et al., 2010), designed to solve the “minimum set problem,” a reserve design problem in which the aim is to achieve a predefined minimum representation of “conservation features” (e.g., species, habitats) for the smallest possible cost through the selection of areas among potential sites called planning units (PUs) (Game and Grantham, 2008; Picone et al., 2017). This software uses a simulated annealing algorithm followed by another heuristic algorithm called iterative improvement (Ardron et al., 2010; Appolloni et al., 2018) to find a range of near-optimal systems of protected areas that meet prescribed conservation targets. Marxan was used in this analysis as it allows for several iterations of the scenarios to be performed, which facilitates comparison of the spatial distribution of areas selected to achieve different conservation targets. Marxan should be considered as part of a planning process and is not designed to act as a stand-alone reserve design solution. Its effectiveness is dependent upon expert supervision, the adoption of sound ecological principles, the establishment of scientifically defensible conservation goals and targets, and the development and inclusion of quality spatial datasets (Game and Grantham, 2008). For instance, in our case, the development designs had already been revised through a number of iterations to avoid ecologically sensitive areas, minimize impact embedded in the design, and leave high-value areas (i.e., set-aside islands) as a priori conservation zones.
We set Marxan to retain 99 and 90% of the area of high-value habitats (six habitats, all five scenarios) within conservation zones. In addition, we prescribed 50–80% of the area of other habitats (11, in four of the scenarios) to be retained within the conservation zones. Similarly, Marxan was used to conserve 90 and 100% of high-value nesting habitat (for the high-priority species) and 70% of low-value nesting habitat for each of the 11 priority conservation species included within conservation zones (three scenarios, Tables 1, 2). These targets determined the area of Al Wajh lagoon that should be kept for conservation in order to achieve the conservation targets set under the different scenarios (Table 1), with conservation targets being positively correlated to the conservation values (e.g., a species with the maximum conservation target of 100% bears the maximum conservation value of 5). Guiding conservation zoning through the percent of habitat to be included within conservation zones is a common approach used in conservation planning as it ensures biodiversity conservation by prescribing the location of protected areas (Margules and Pressey, 2000), with percent targets reported in other exercises being lower (Giakoumi et al., 2011; Appolloni et al., 2018) (i.e., setting less demanding conservation targets) than those in our case. Indeed, our conservation targets far exceed the suggested 40% to be applied in marine conservation planning (Appolloni et al., 2018). Moreover, the percentage of the habitats and nesting sites not included in the conservation planning will also be conserved under the development guidelines, as the concept master plan was optimized in advance to avoid overlap with these areas and ensure generous buffer zones away from nesting areas and vulnerable habitats.
The study area was divided in 32,398 square PUs of 0.25 km2 each. The dimensions of the PUs (500 m × 500 m) were defined by the spatial accuracy of the available data and the desired analysis output (i.e., to fit the buffer zone around species’ nests; 500 m; decided by the experts on the environmental alignment workshops). PUs are then used as potential candidate areas to be selected by Marxan. The extent of each conservation feature within each PU was calculated, while the parameter of “cost” was equal to 1 for all the elements included in the analysis in order for the spatial distribution of PUs selected for protection to be based only on conservation targets.
The effectiveness of conservation depends on the contiguous conservation area, as it determines the connectivity of a marine ecosystem (Daigle et al., 2018). Therefore, a similar total conservation area but composed of a higher fraction of contiguous PUs conforming large conservation zones should be more effective at achieving conservation outcomes than the same area fragmented into disconnected PUs. The boundary length modifier (BLM) parameter of Marxan was selected after several test runs to achieve adequate contiguity among PUs in the optimal solution (i.e., the selected PUs for conservation), thereby achieving more compact rather than fragmented conservation areas (Ardron et al., 2010). For the test runs, Zonae Cogito (Segan et al., 2011) was used for its calibration functionalities. Marxan runs were iterated (>20 runs), increasing the BLM parameter at each iteration, while keeping all other parameters constant, until the total boundary length of the selected conservation area was minimized (i.e., achieving more compact areas), yielding an optimal BLM of 0.01. Once the BLM was optimized, Marxan was run 100 times for each scenario, each involving 106 iterations to achieve a discrete near-optimal solution. In our case, several test runs were performed and the sensitivity analysis was conducted, which demonstrated that the solutions of each run did not vary significantly due to the severe constraints imposed by the high conservation targets prescribed (Table 1). Therefore, the Marxan routine was carried out for the five different scenarios in order to obtain the near-optimal solution (i.e., the best among the 100 runs) for each scenario.
Marine Spatial Planning Team and Workshop
MSP is often considered to be a pragmatic approach to implement integrated and adaptive management through the use of strategic and participatory processes (Douvere and Ehler, 2009) to allocate marine space in a sustainable and optimal way to achieve agreed-upon goals and objectives across sectors. This requires the involvement of multiple actors and stakeholders at various governmental and societal levels (Olsen et al., 2014). MSP is by definition, multisectoral and entails the notion of integration in terms of crossing boundaries at professional, physical, institutional, or administrative level (Portman, 2011). This integration is perceived as required participatory engagement of actors and individuals stemming from different backgrounds in an MSP exercise, while they often deliver their inputs in a serial, sectorial manner, rather than through a shared participatory exercise (Olsen et al., 2014). However, the approach where MSP is conducted by a technical team that collects inputs from different stakeholders but does not engage them actively through a process that allows for their real-time interaction generates barriers to the holistic view embedded in the MSP notion.
In the case of TRSP, engaging affecting or affected parties, such as tourists and working force, could not be achieved due to the fact that no activities, other than fishing involving almost 300 of artisanal boats, are currently occurring in the area which is characterized by minimal resident population. However, fishermen do not operate in a systematic way and do not form an organization or a union as in other countries (e.g., Portugal) (Almeida et al., 2015). In addition, national legal regime poses strict limits regarding opinion polling and consultation of the local population. Therefore, engagement of the local communities could not occur in our case. For this reason, and through the commitment of TRSDC to conservation planning, we designed a stakeholder simulation that brought actors with all required backgrounds (e.g., concept master planners, managers, architects, engineers, ecologists) to an MSP workshop to gain a shared perspective of how the entire site, and not its individual components, ought to be zoned to achieve the target of sustainability and potentially net positive conservation benefits through development. This required significant input of data from across the different TRSP departments, involving over 100 individuals in collecting and integrating these data related to the current conservation status of the site and the development plans. The aim was to acquire a comprehensive overview of development plans and site operation. Most importantly, this exercise offered an opportunity to identify areas of activity where development planning and conservation goals were not aligned, as they had never been monitored in parallel across the entire site. The platform for this exercise was a workshop, conceived as a “war game,” i.e., as game theory and war theory have been found useful to guide groups with a priori divergent goals toward consensus for conservation (Colyvan et al., 2011). A “war game” is defined as a “military exercise that is carried out for the purpose of training, and that is designed to imitate a real war as closely as possible” (Collins English Dictionary). In our case, the “war game” consisted of recreating the Al Wajh lagoon as a board game where development and conservation were initially in conflict. Workshops which include simulation games constitute a rather common approach among the MSP practices. For instance, Janssen et al. (2015) have conducted a workshop with an interactive mapping tool to identify potential sites for tidal energy devices around the Mull of Kintyre, Scotland; Mayer et al. (2014); Jean et al. (2018), and Keijser et al. (2018) refer to MSP Challenge 2050, which involved both a board game and a simulation to present the results of three case studies on participant learning, in three sessions of game events. Mayer et al. (2014) state that the process “aims to initiate and support MSP in the various Atlantic regions by bringing policy-makers, stakeholders, scientists together in a ‘playful’ but realistic and meaningful environment.” We acknowledge the crucial role of stakeholder engagement following Art. 9 of the 2014/89/EU Directive: “Member States shall establish means of public participation by informing all interested parties and by consulting the relevant stakeholders and authorities, and the public concerned, at an early stage in the development of maritime spatial plans, in accordance with relevant provisions established in Union legislation.” However, we consider that stakeholder involvement in MSP often means tokenistic participation in a very early stage of the planning process or at the end of the process, whereas stakeholders should be onboard during the whole planning process (Pomeroy and Douvere, 2008; Ehler and Douvere, 2009; Gopnik et al., 2012; Flannery et al., 2018; Keijser et al., 2018).
As it was mentioned in the Avoiding Development Impacts section, stakeholders were engaged in considering the interaction between development and conservation through a series of regular, monthly workshops, conducted for over a year prior to the MSP workshop, during which they explored every option to avoid impact and maximize conservation. Therefore, the workshop described in our study aimed to advance the stakeholders’ engagement beyond that achieved through the “environmental alignment workshop” series, with the MSP process of TRSP. In particular, the “war game” workshop encouraged participants to address issues inherent to MSP, such as competing interests and uncertainty caused by missing information by letting the “players,” i.e., workshop participants, experience some of the dynamic and complex interaction between development and conservation. “Players” were tasked to come up with creative solutions to resolve conflicts between development and conservation goals through tactical changes in the development plan. In order to achieve this, the workshop included as participants key members of the RSP team (e.g., utility and transportation managers, engineers, architects), all engaged in different disciplines, among whom the CEO and directors of the various departments participated in the process. Their combined knowledge while examining the area in a holistic way proved crucial for the success of the workshop.
A base map, including the habitats and the key species encountered within the marine boundaries of TRSP (as per Figure 1), was used as the basis of the board game along with selected PUs of the scenario “Cons_h+s” (Table 2) in the absence of development, which were overlaid on transparent paper over the base map. The various development elements and activities were represented by tokens, and different colors of yarn were extended to represent the transportation routes within the lagoon. The experts distributed development and activity tokens along the site, connected with different colors of yarn (e.g., white yarn represents low-volume passenger ferry) on the map according to the concept master plan (Supplementary Figures S1A–C) to identify where the areas selected for conservation by Marxan (“Cons_h+s” scenario; red cells of the transparent paper; Supplementary Figures S1A–C) coincide with development. We also assessed how activities (e.g., swimming, snorkeling) will likely be conducted within the site and how these activities will interact with each, other as well as if their deployment across the site is consistent with the desired conservation goals. The latter was effected through a matrix of interactions of activities and development elements (Supplementary Table S3). Each interaction was scored according to a predefined scale of discrete values: −5, −3, −1 for strong, medium, and low negative interactions, respectively; 0 for no interaction and 1, 3, 5 for low, medium, and strong positive interactions, respectively. Then, for each area examined, a cumulative score of interaction was calculated, acquired from the sum of the scores of interactions of activities. To obtain an overview, three key development areas within the Al Wajh lagoon were examined by different groups of experts, who were challenged to reflect on what actions ought to be taken in order to increase the cumulative interaction score and avoid or minimize both the impact of development on conservation and negative interactions between activities while maximizing positive synergies. These actions included relocation of development elements in other areas, tactical modifications in design, and enhancement of habitats in other parts of the TRSP.
Conservation Zoning
The PUs selected by Marxan for each of the five scenarios were needed to meet the set of conservation targets, but they likely differed in their individual contribution to this target, as inspection of the base habitat and nesting map shows that many habitats and species of high conservation value tend to co-occur (Figure 1). We, therefore, developed a methodology to estimate the cumulative conservation value of each scenario, as well as the contribution of each individual PU selected to this total value. This was achieved by assigning a discrete conservation value ranging from 0.5 to 5 to each habitat and species conforming to the scenario (Table 1), with the conservation value being positively correlated to the conservation target (e.g., a species with the maximum conservation target of 100% target bears the maximum conservation value of 5). Once the results of Marxan were available for each scenario, the cumulative conservation value was calculated according to Eq. (1):
where:
CCV = cumulative conservation value
n = number of selected planning units (PUs)
k = number of ecological features in each selected PU
CV = conservation value ranging from 0.5 to 5
APU = area in the selected PU
ATOT = total area of all selected PUs
More explicitly, for each PU selected for protection (i.e., for each selected grid cell of 500 m ∗ 500 m), the percentage of each ecological feature contained in this PU with respect to the total area of the feature selected for conservation in the scenario was calculated. This ratio was multiplied to the preassigned conservation value of the feature (Table 1). The sum of all these products provides the conservation value of each PU. The sum of the conservation values of all the selected PUs resulted in the cumulative conservation value of the scenario.
The zoning of the site constitutes an important part of the process as it allows the visualization of the ranges of conservation values. Therefore, it gives prominence to the most “valuable” PUs (i.e., with the highest conservation values) and permits to select alternative locations for development according to the conservation values. The zoning of the site was conducted for the scenario where all the elements were taken into account (“Cons+Dev_h+s+sa”; it included all habitats and species considered in the analysis, the development elements and the areas set aside for protection; Table 2). The conservation values of the selected PUs were classified according to the quantile classification method by distributing the range of conservation values of the selected PUs linearly into five groups of equal conservation value width (i.e., data distributed in each of five 20% quantiles). In a quantile classification, each class contains an equal number of features (Robinson et al., 1995). A quantile classification is well suited to linearly distributed data and was used in our analysis because the cumulative conservation value of the selected PUs is following a linear distribution. The two groups with the higher values formed the “top conservation zone,” while the three with the lower values constituted the “high conservation zone.” The PUs dedicated to development created the “development zone” while all the rest remained non-allocated areas. Therefore, the formation of the methodology for the calculation of conservation value per PU and per scenario allowed both for comparing the scenarios as well as for designing the broader zones of the site.
Results
Conservation Scenarios
For each of the three scenarios (“Cons_6h,” “Cons_h,” “Cons_h+s”; Table 2) where development was not taken into account, the PUs selected by Marxan for protection are demonstrated in Figures 2A–C. The total area of the analysis was 2,081 km2 (the terrestrial habitats and the habitat “deep open ocean” were not considered in the analysis). The area selected for conservation was 684 km2, 1,214.8 km2, and 1,232.5 km2 for each of the three conservation scenarios, from the last comprehensive to the most comprehensive, in terms of number of prescribed conservation targets.
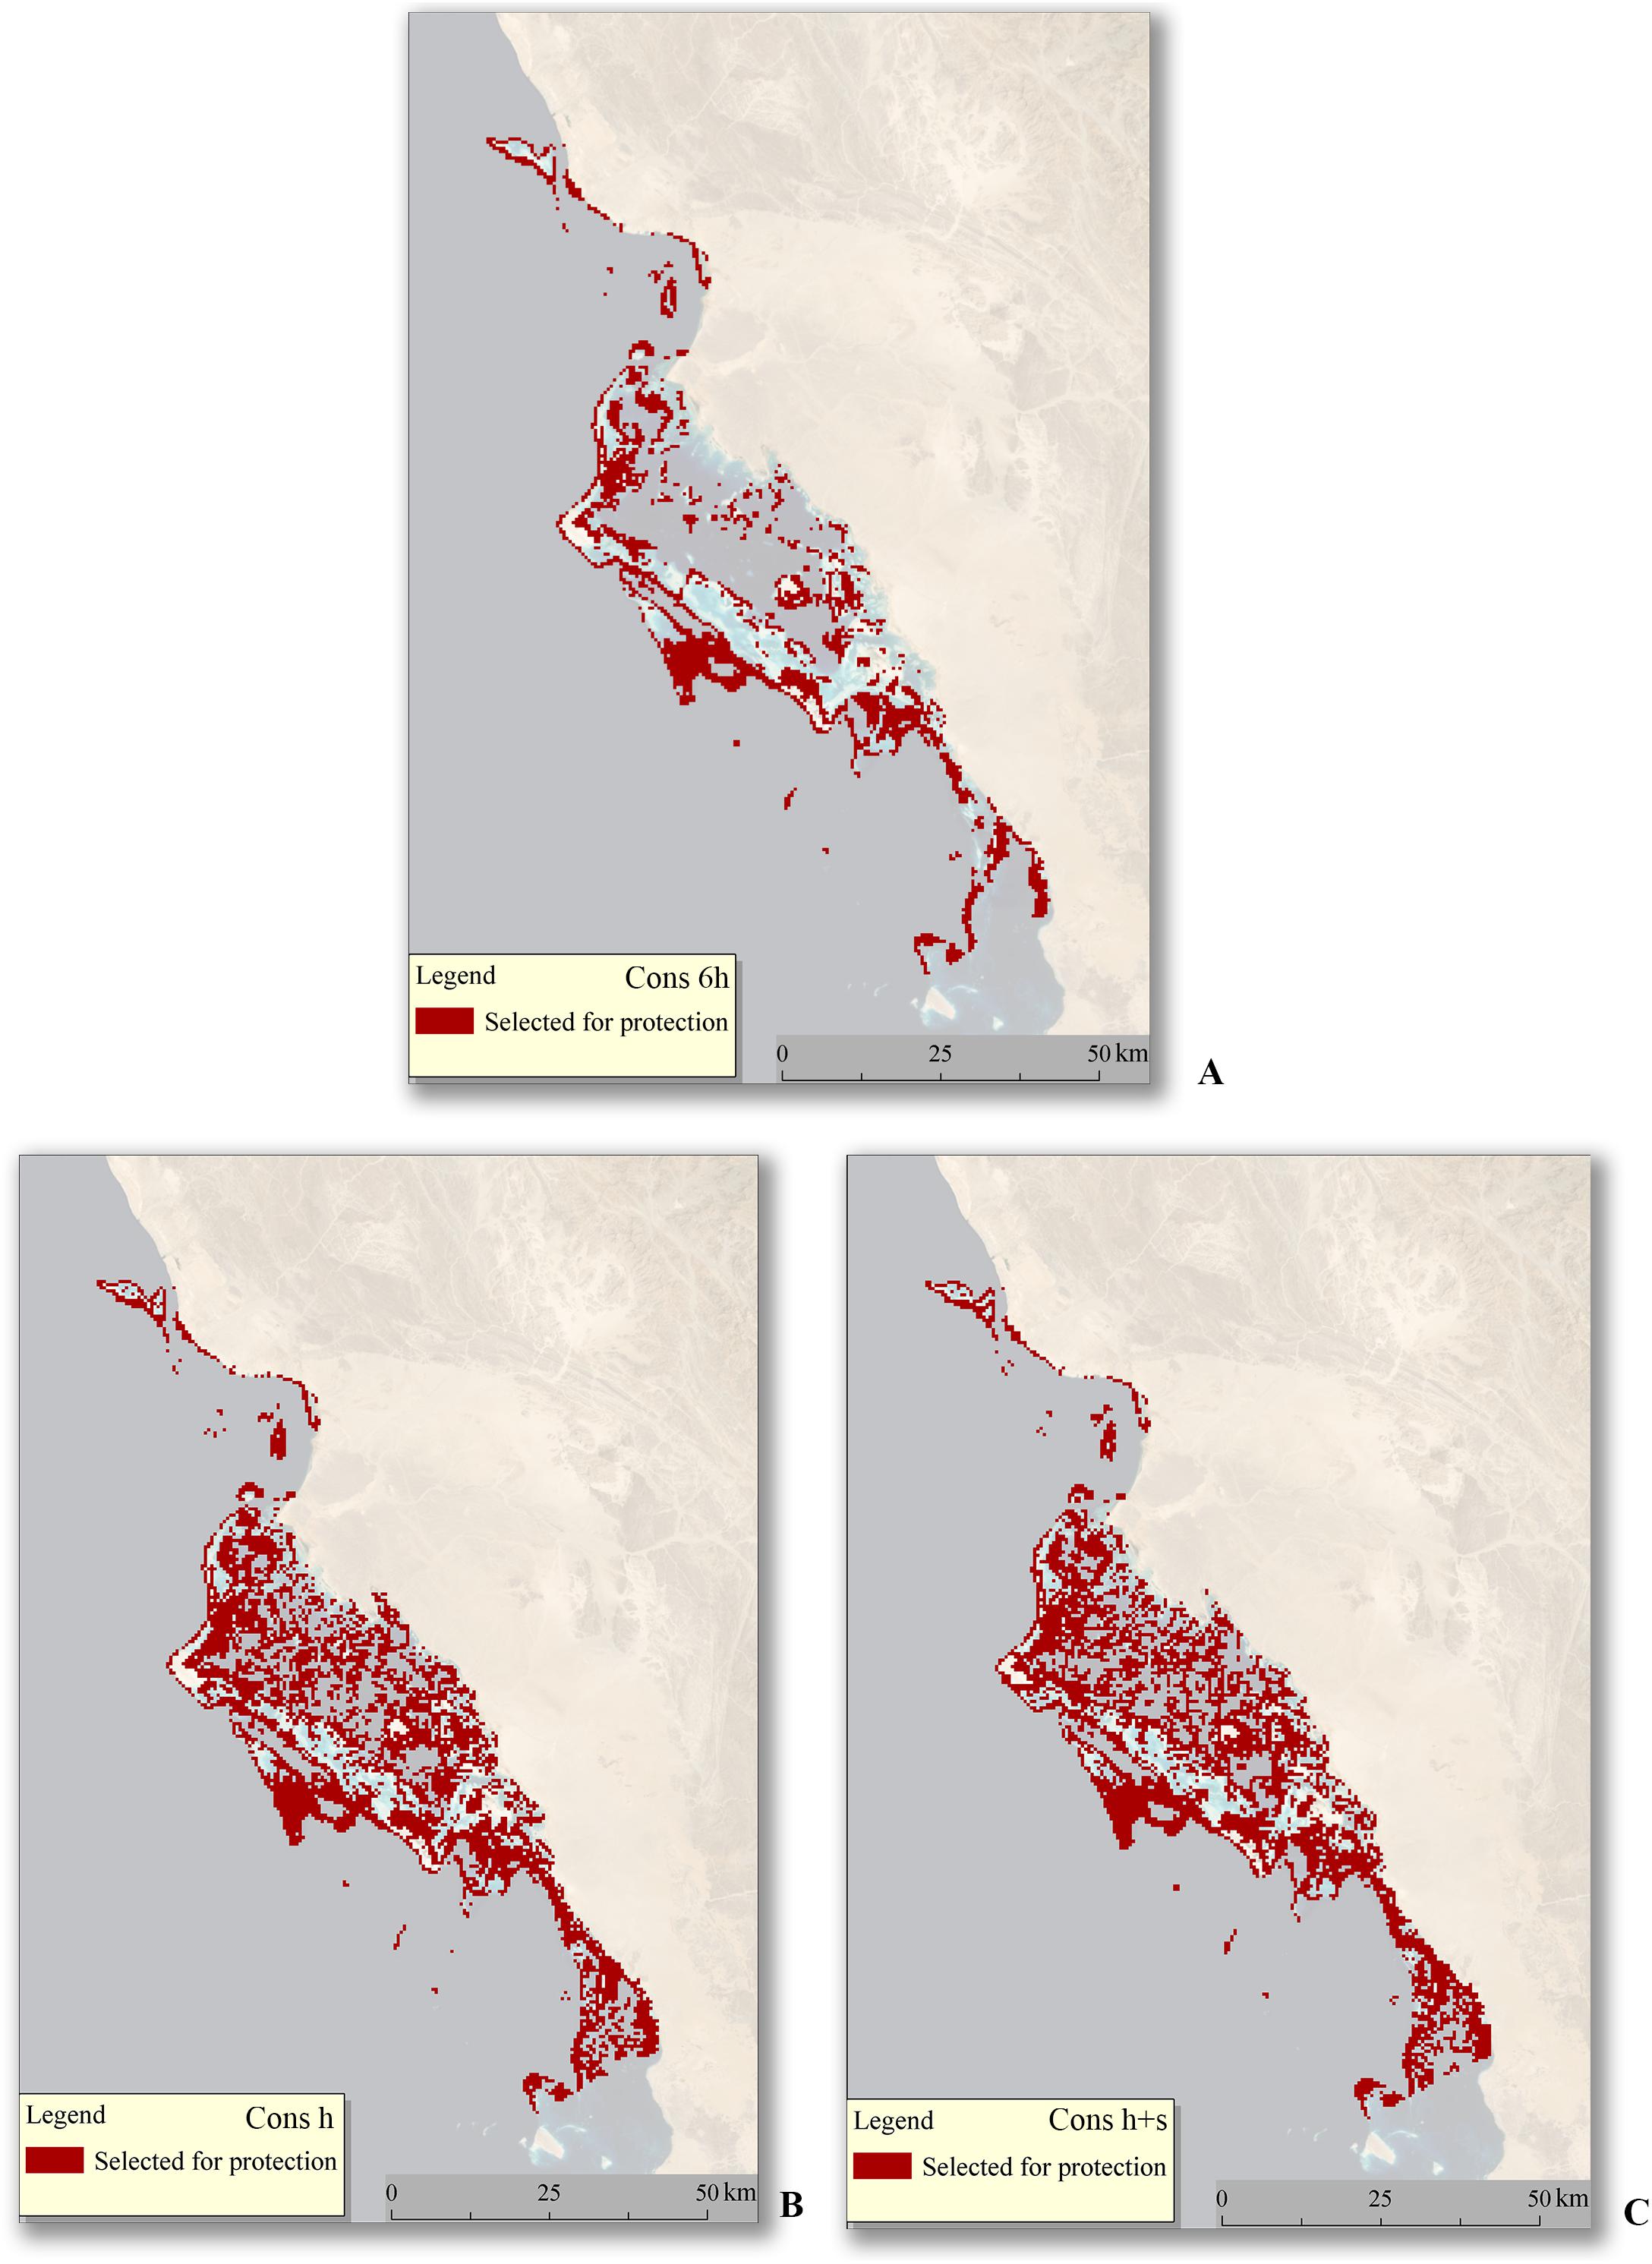
Figure 2. Spatial distribution of the selected planning units (PUs). The total area of the site was 2,081 km2. (A) For the “Cons_6h” scenario, where targets only for six key habitats were considered, the area selected for protection was 684 km2. (B) For the “Cons_h” scenario where targets were set for 17 habitats, the area selected for protection was 1,214.8 km2. (C) For the “Cons_h+s” scenario where targets were set for 17 habitats and 11 species, the area selected for protection was 1,232.5 km2.
The cumulative conservation value was calculated for each scenario, which led to results of 30, 48, and 86 (no units) for “Cons_6h” (Figure 3A), “Cons_h,” and “Cons_h+s” (Figure 3B), respectively. For the “Cons_6h”scenario, 2,736 PUs were selected out of 32,399. The frequency distribution of the cumulative conservation value of the individual selected PUs was highly skewed, ranging three orders of magnitude from the most to the least valuable cells (Figure 3A). The top 10% most valuable cells contributed 29% of the cumulative conservation value, while the top 25% most valuable cells contributed 50% of the cumulative conservation value. For the “Cons_h” scenario, 4,859 PUs were selected for protection by this scenario. Despite the observation that the selected cells were almost double in amount compared to those of the “Cons_6h” scenario, the cumulative conservation value increased by only 18 units. This observation shows that other habitats of conservation value tend to aggregate around key habitats with a high conservation value. Therefore, conservation strategies targeting these key habitats could lead to the protection of a significant amount of other habitats of lesser conservation value with less space required for protection. Finally, for the “Cons_h+s” scenario, the selected PUs were 4,930, only 71 more, once compared to the ones selected in the “Cons_h” scenario (Figure 3B). However, the cumulative value for this last scenario was double (86) than the one of “Cons_h” scenario. The latter demonstrates that the species of conservation value are less concentrated around high-value habitats, thereby requiring a wider conservation area to protect the species.
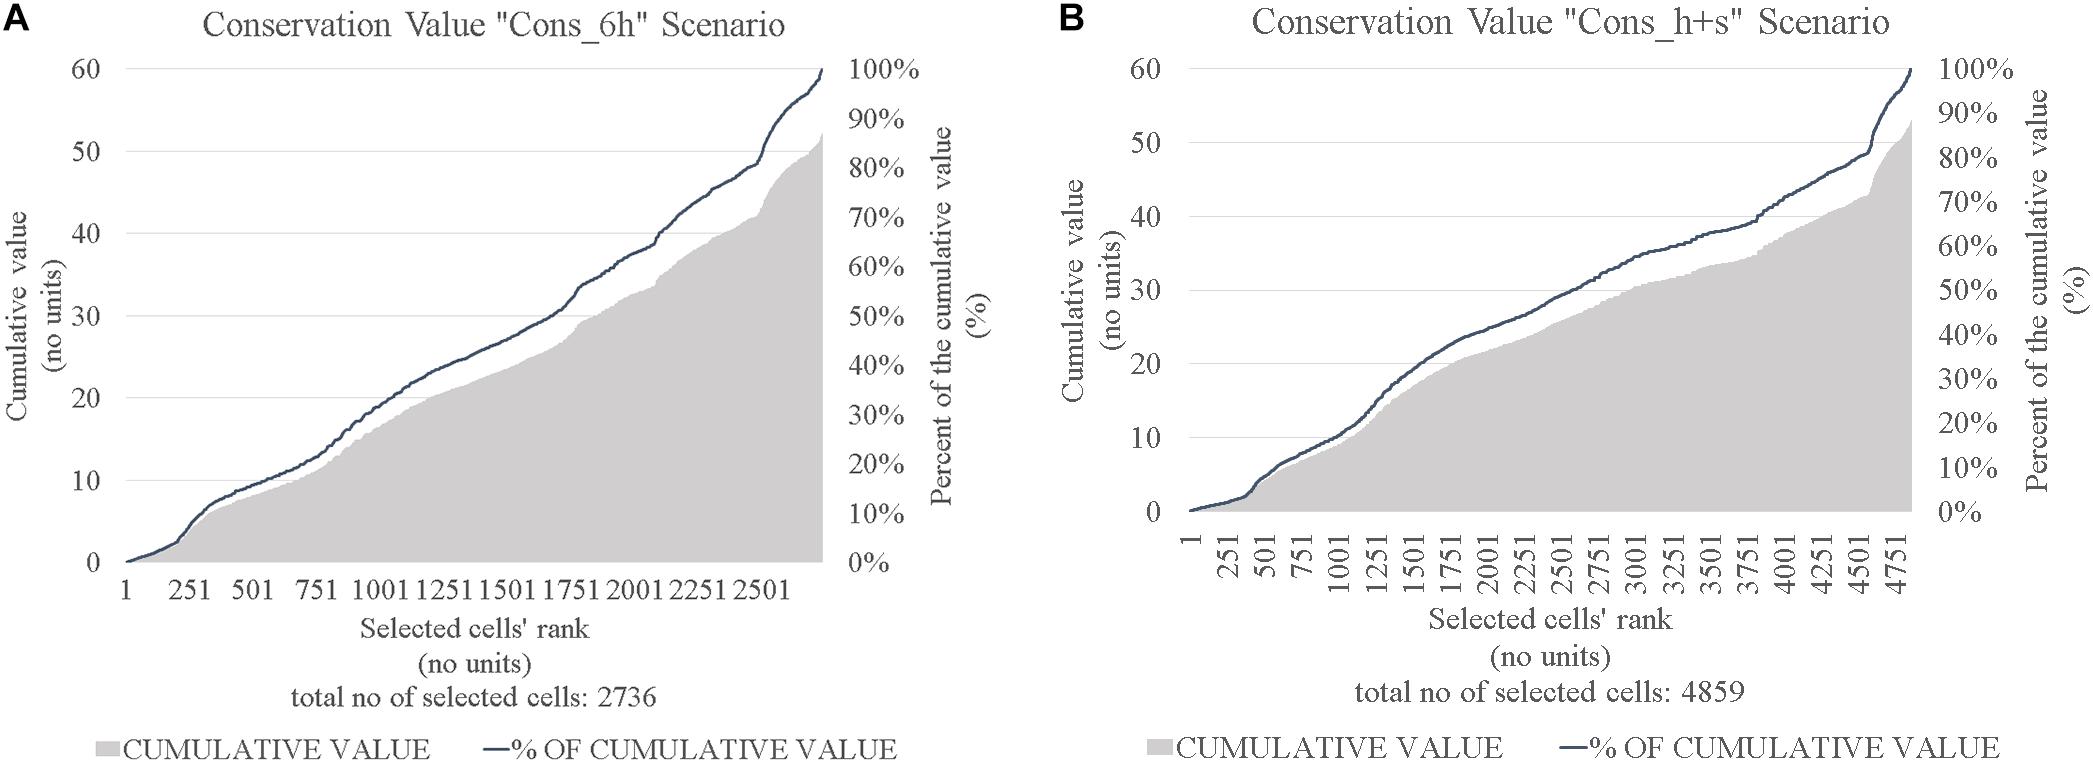
Figure 3. Cumulative distribution of the conservation value of planning units (PUs) selected for conservation. The gray zone expresses the cumulative conservation value, while the blue line demonstrates the percentage of cumulative conservation value per PU. (A) For the “Cons_6h” scenario, the total number of selected PUs is 2,736 out of 32,399 and the cumulative conservation value is 30 (no units). (B) For the “Cons_h+s” scenario, the total number of selected PUs is 4,930 out of 32,399 and the cumulative conservation value is 86 (no units).
Workshop Outcomes
Overlaying the “Cons_h+s” scenario on the development concept master plan identified conflicts for 216 conservation PUs (4.4% of the total conservation area and 41.6% of the total development footprint; Supplementary Figure S2). The concept master plan was, therefore, modified to avoid this overlap, particularly for PUs with a high conservation value. The most important action was to define nine islands designated to be “set aside” for conservation, thereby displacing development to areas of lower conservation value.
Conservation and Development Scenarios
In the two scenarios where areas selected for conservation were identified by Marxan in the presence of development (“Cons+Dev_h+s,” “Cons+Dev_h+s+sa”; Table 2), the grid cells dedicated to development were a priori excluded from being candidate areas of protection. The results of these runs resulted in an area of 1,219 km2 out of 2,081 km2 selected for conservation. However, 30 km2 of areas set aside for conservation were also considered as a priori selected for conservation (i.e., “set aside” islands), demonstrating the strong weight of these areas on the final conservation outcome. Following the calculation of the conservation value per PU for the “Cons+Dev_h+s+sa” scenario, the conservation zoning was conducted (Figure 4). The “top conservation zone” consists of the PUs (20% of the total 32,399 PUs) included in the two highest classes of the quantile separation, comprising cells within the upper 40% of the range of conservation scores of the selected PUs. The “top conservation zone” contains the most valuable cells according to the classification and refers to the most important habitats and should be dedicated only to conservation, research and monitoring. Only guided tours of small groups of visitors for educational purposes would be permitted in this area. The “high conservation zone” formed by the PUs comprising the lower 60% of the range of conservation scores of the selected PUs include 30% of the total 32,399 PUs. This zone will be subject to severe restrictions defining the mobility of humans, the transportation means, and the infrastructure permitted. No permanent structures would be developed within the boundaries of this zone (e.g., hotels or jetties).
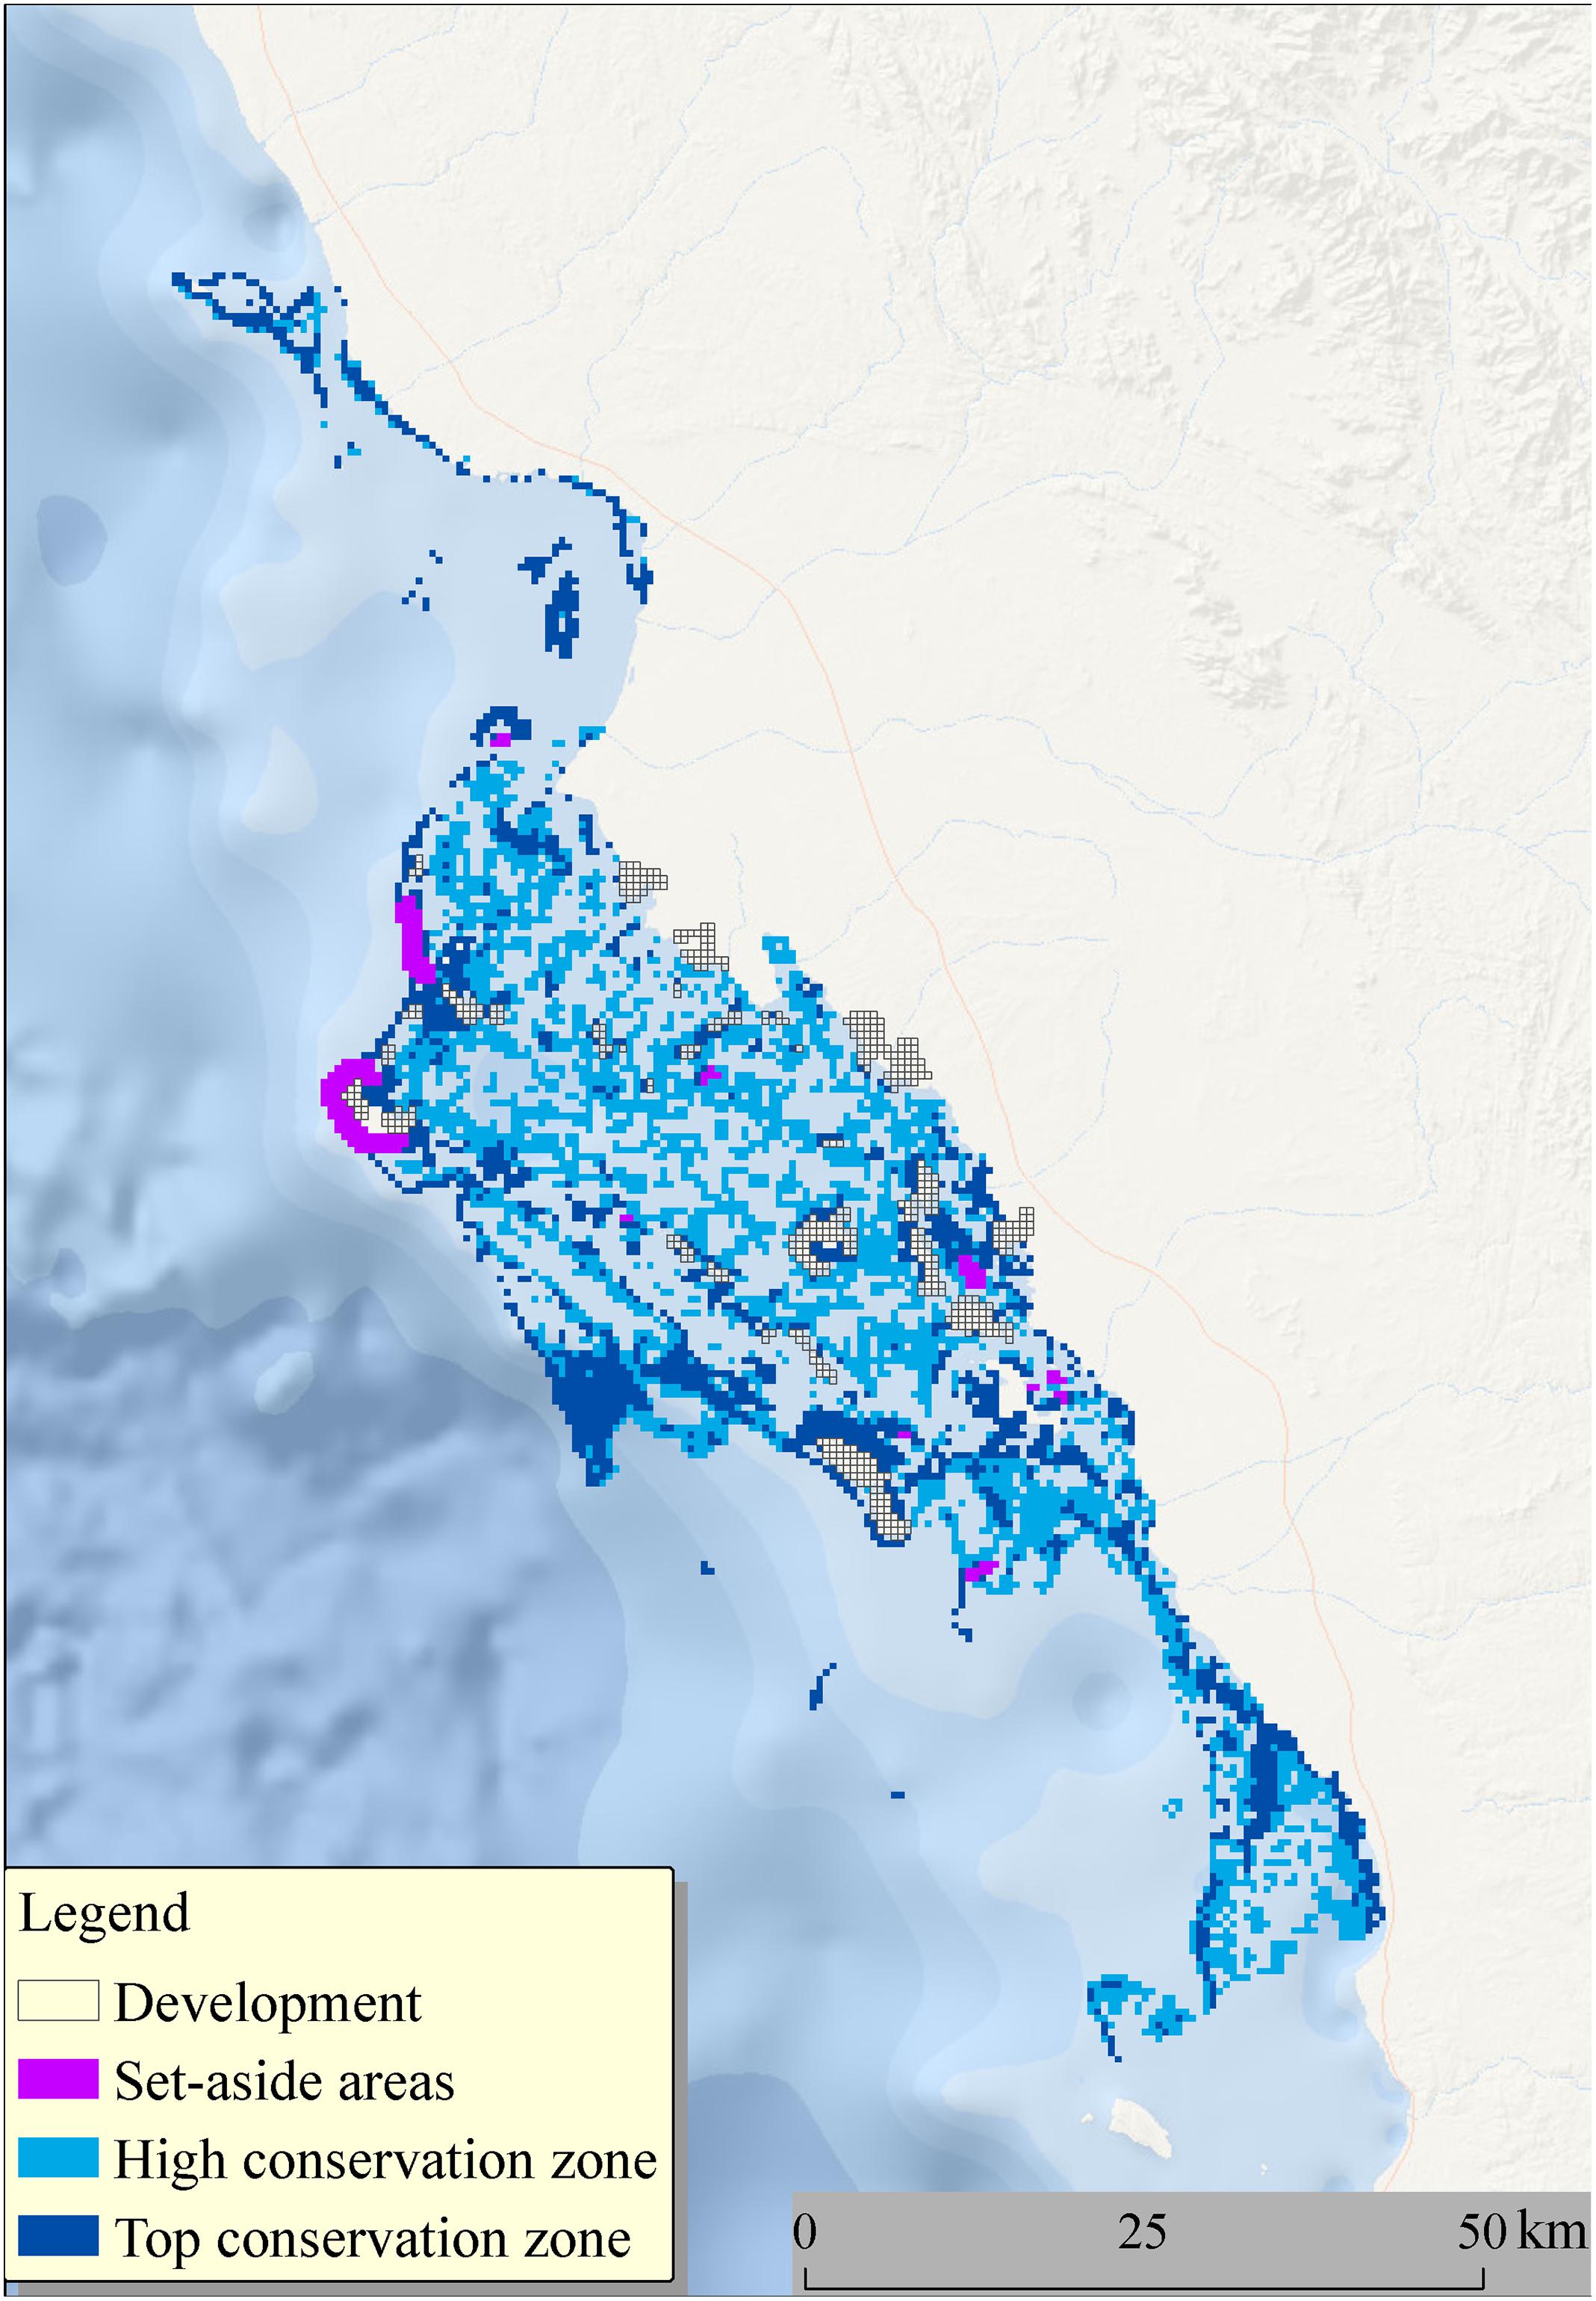
Figure 4. Preliminary zoning of the site. The deep blue grid cells constitute the “top conservation zone,” the light blue grid cells form the “high conservation zone,” the gray grid cells create the “development zone,” and the purple grid cells are the set-aside islands which are part of the “top conservation zone.” All the rest are non-allocated areas.
Finally, the “development zone” (5% of the total PUs) accommodates all the development elements and activities. However, this zone is also facing limitations as the whole area of the lagoon is defined as critical habitat. These include specific buffer zones around vulnerable habitats and nesting sites and strict management of light, noise, and litter. Therefore, 58% of the marine area of the site is planned for conservation, while the remaining 42% includes the development and the non-allocated area, which is subsequent to strict conservation and sustainability guidelines. For instance, all transport will be conducted by electric vehicles, power will be generated by renewable technologies, single-use plastic will be banned, no brine will be discharged within the lagoon, 100% of freshwater will be reused (other than evaporative losses), and recycling aims at no waste to landfills (Table 3).
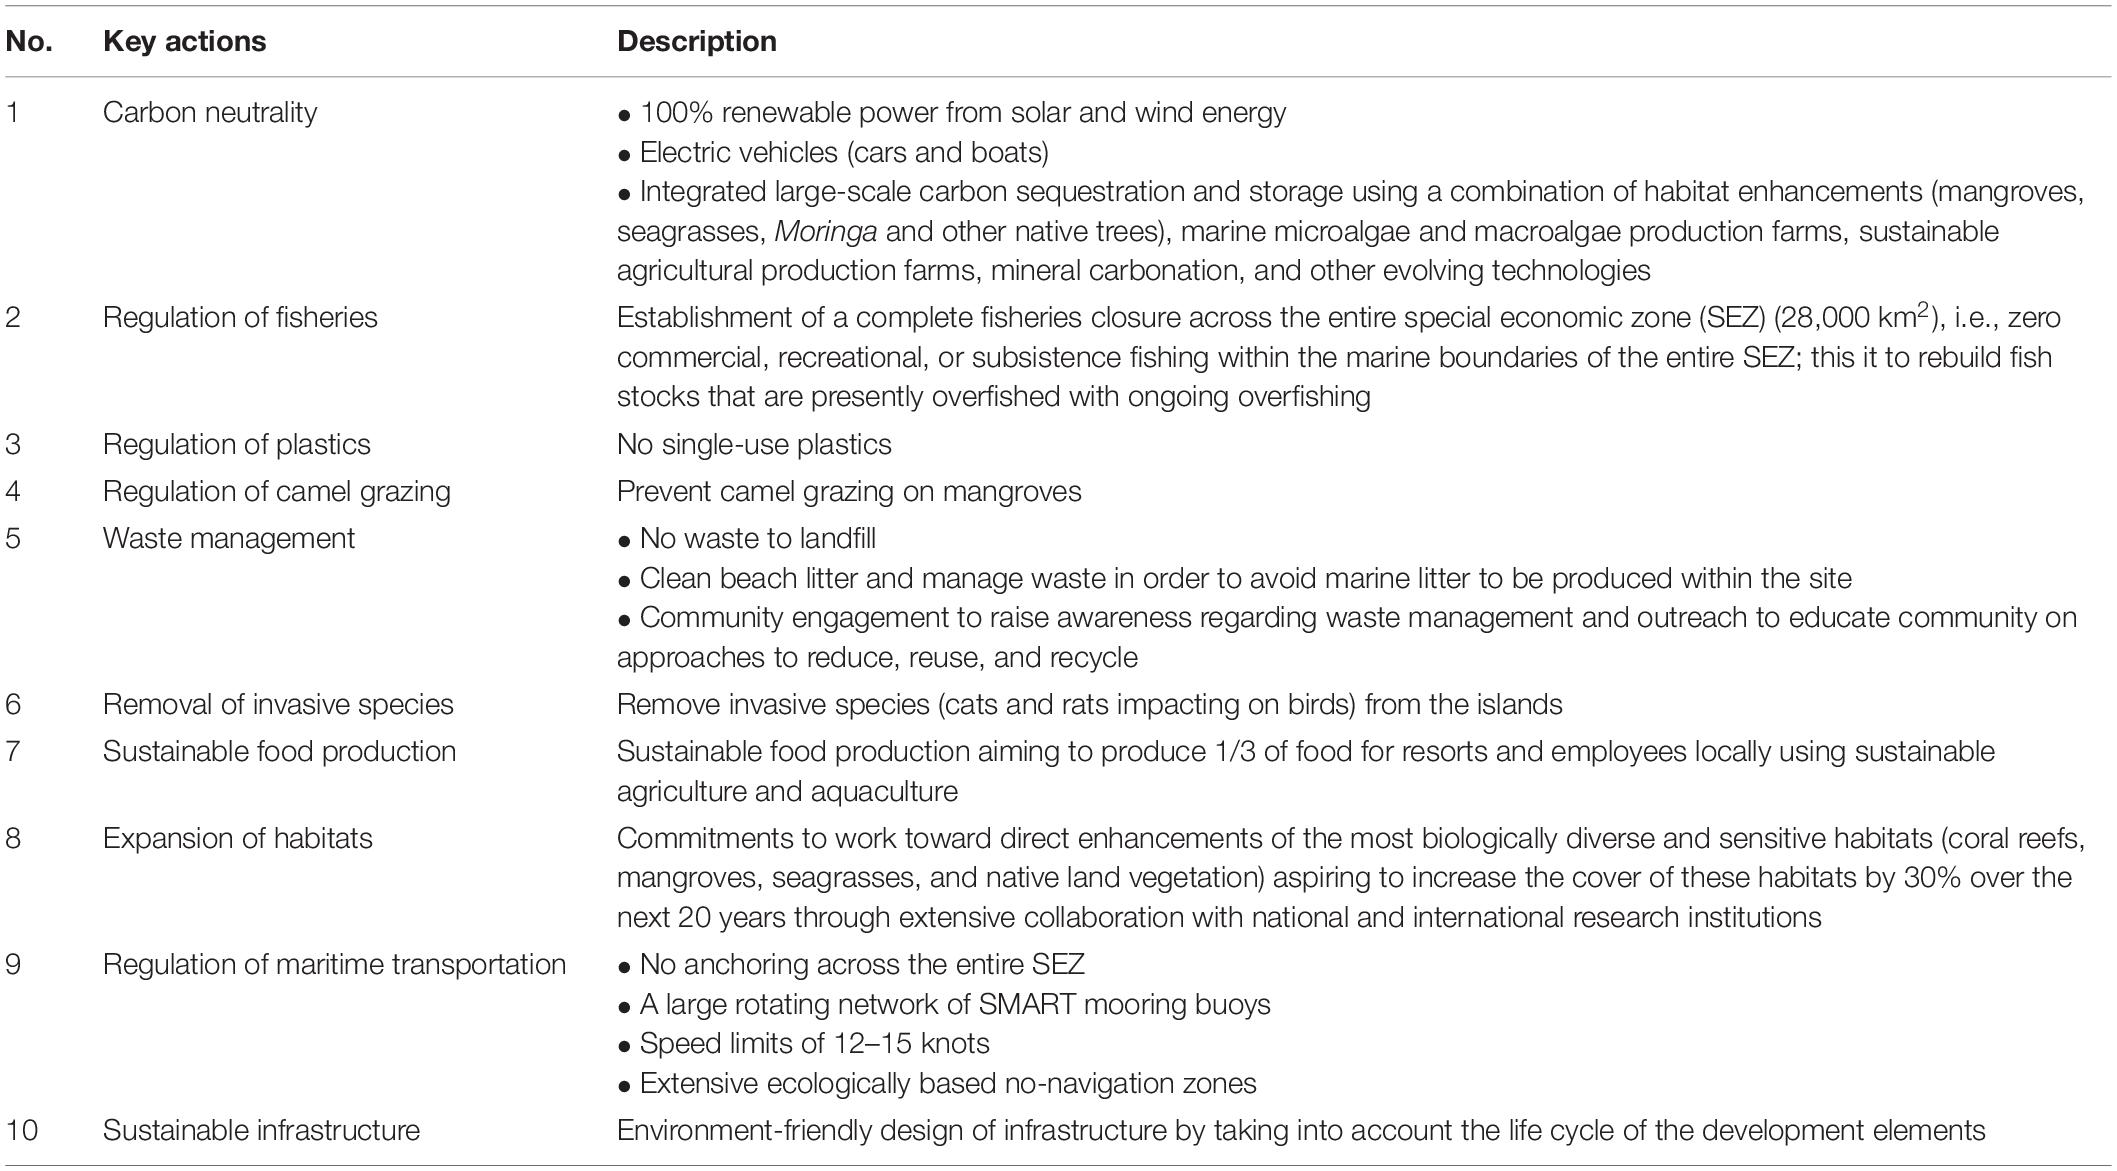
Table 3. Ten key actions to be implemented by The Red Sea Development Company (TRSDC) to achieve net positive conservation benefits for The Red Sea Project area.
Discussion
The possibility to drive net positive impact through high-end tourism in the Al Wajh lagoon by TRSP was examined here. We identified that the conservation zoning of the TRSP emerging from the MSP exercise, including iterative workshops to avoid impacts through changes in design and conservation modeling reaches similar conservation outcomes in the presence of development as if the whole area was declared an MPA (1,219 km2 conservation area required). Indeed, TRSP pledges an increase in net conservation value, as quantified by the metrics described here, of 30% in 20 years compared to the “business as usual” scenario.
Establishing a conservation zoning will protect the area against most of the impacts currently in place (overfishing, locally produced marine litter, bycatch mortality), add resilience against climate change (Roberts et al., 2017), and exclude impacts potentially associated with development (construction and operation, impacts from visitors, etc.). Additional actions will further remove pressures and enhance the conservation value of the site. These actions include beach cleaning campaigns, of which two have already been successfully conducted. Recently, a team from disadvantaged local population was hired to regularly conduct beach cleaning activities, thereby mitigating marine litter originated outside the area’s boundaries. In addition, 10 key actions have been designed to deliver a 30% conservation benefit (Table 3), with these commitments, policies, and activities covered by the national and international media (Supplementary Table S4). More particularly, these actions include, among others, the regulation of fisheries to rebuild fish stocks, the expansion of biologically diverse habitats, such as mangroves, seagrass, and coral reefs, by 30%, and the use of electric-only marine and land vehicles to avoid pollution and noise. Therefore, this exercise, which constitutes an integral part of the approach to development adopted by TRSP, would benefit the ecological state and even enhance the ecological features by removing chronic impacts while ensuring conservation of existing habitats and species, thereby setting the foundations for net positive conservation benefits in the area. For instance, TRSDC is currently preparing plans for enhancing coral reefs to be multifaceted and adaptive. Multiple coral nurseries are planned to be established to interbreed corals with different ranges of thermal resilience. The aspirational goal to achieve significant net conservation impact is exceptionally ambitious and challenging, as risks to the long-term viability of the expanded high-value habitats are related to phenomena beyond human control, including natural catastrophic events, such as volcanic eruptions and earthquakes, as well as climate change. However, coral reefs in the northern Red Sea are particularly resistant to warming, which thereby offers a refugia from climate change (Osman et al., 2018). Therefore, the risks of efforts to conserve and expand coral reefs being jeopardized by climate change are far lower than those in any other coral regions in the world. In addition, TRSDC has been committed to repeatedly test both methods and locations to find the most appropriate taxa and areas for such expansions. The implementation of these measures and policies is under the control of the chief environment officer of TRSP, currently Dr. Rusty Brainard, co-author of this study. The measures refer to the conservation of 58% of the marine area of the site, with the development footprint being only 5% of the total area, hence achieving a conservation to development ratio of 10:1, unprecedented in any documented coastal development plan. Both the development zone and the area not assigned (37% of the marine area) will be subject to strict conservation and sustainability guidelines.
Moreover, the analysis revealed that in the case that conservation area may be limited, high conservation outcomes could still be achieved due to the combined effects of the colocation, in space, of habitats and species and the higher conservation value of certain habitats compared to others. A proper zoning of the site which primarily chooses for protection the most “valuable” PUs (e.g., those containing habitats characterized with a high conservation value and species as well) can achieve high conservation outcomes with a smaller demand for marine space. In addition, the zoning of the site assists the regulator of TRSP, hence TRSDC, in selecting suitable areas for development as well as conducting preliminary estimates regarding the maximum number of resort keys and associated visitors. Both of these actions are implemented based on the spatial variation of conservation values depicted by the zoning scheme. However, the zoning emerging here represents a first step toward conservation, which needs to be embedded in a framework of continual adaptive management as new information becomes available. For instance, the assumption that, by conserving habitats, vulnerable biodiversity is also conserved, needs be challenged in the future once detailed biodiversity maps (i.e., species richness of invertebrates and fish as well as maps for individual species of concern) become available.
Marxan has been proven a useful tool for conservation planning, and priority areas were selected on the basis of conservation features (habitats and species), while cost was equal for all the PUs. However, an innovative characteristic of this study was that the final MSP overview was obtained through a participatory process based on the active engagement of experts from all the departments of TRSP, leading to a commitment to conservation and a deep understanding of the requirements for conservation as well as the multiple ways in which development may impact both ecosystems and species. The formation of a team including developers and marine scientists ensured that development designs were devoid of any possible impact that could be avoided. This proved to be more effective than the preferable workflow in conventional development, where the environmental impact assessment is conducted as a downstream of development design, thereby lacking the opportunities. The iterative process devised here avoids impacts through every step in the design process. Indeed, developers were not only consulted but actively participated in the entire process with commitment in achieving the near-optimal solution. The inherently different processes of development and conservation planning were examined in parallel to reflect the main essence of MSP. Indeed, we exemplify the holistic view of an area and the optimized allocation of space as a means of achieving positive synergies, in this case between conservation and development. The projection of this marine region as it is, with its current uses and impacts, and the declaration of the whole site as an MPA are actions considered ineffective in the Red Sea (Marshall et al., 2010; Spaet et al., 2016). These actions would have been unlikely to achieve the same magnitude of net positive conservation impact compared to the one that TRSP strategy pledges to achieve through the MSP exercise.
Data Availability Statement
The datasets generated for this study are available on request to the corresponding author.
Author Contributions
CD and VC contributed conception and design of the study and wrote the first draft of the manuscript. VC and PM performed the Marxan runs. CD revised thoroughly the results and the manuscript. AV helped with ArcGIS and the artwork. RB wrote the ten key actions described in Table 3 and thoroughly revised the conclusions. AS, JH, JP, IW, SH, RA, FB, HC, and VK contributed as well, both in the research and the drafting of the manuscript, contributed to manuscript revision, read and approved the submitted version.
Funding
The research leading to these results received funding from the Red Sea Development Company (grant number BDC-2018-18) and was supported by KAUST through the Beacon Development Company.
Conflict of Interest
AA-S, JH, and AV were employed by the Beacon Development Company. JP, IW, SH, RA, FB, and RB were employed by The Red Sea Development Company.
The remaining authors declare that the research was conducted in the absence of any commercial or financial relationships that could be construed as a potential conflict of interest.
Acknowledgments
The authors wish to express their gratitude to all the employees of the Red Sea Development Company and the Beacon Development Company who contributed so willingly to the research described in this article.
Supplementary Material
The Supplementary Material for this article can be found online at: https://www.frontiersin.org/articles/10.3389/fmars.2020.00168/full#supplementary-material
Footnotes
- ^ http://www.persga.org/inner.php?mainid=1
- ^ https://eur-lex.europa.eu/legal-content/EN/TXT/?uri=uriserv:OJ.L_.2014.257.01.0135.01.ENG%20
- ^ www.theredsea.sa
References
Agardy, T., Notarbartolo di Sciara, G., and Christie, P. (2011). Mind the gap: addressing the shortcomings of marine protected areas through large scale marine spatial planning. Mar. Policy 35, 226–232. doi: 10.1016/j.marpol.2010.10.006
Almeida, C., Vaz, S., and Karadzic, V. (2015). The seafood market in Portugal: driving forces and consequences. Mar. Policy 61, 87–94. doi: 10.1016/j.marpol.2015.07.012
Appolloni, L., Sandulli, R., Vetrano, G., and Russo, G. (2018). A new approach to assess marine opportunity costs and monetary values-in-use for spatial planning and conservation; the case study of Gulf of Naples, Mediterranean Sea, Italy. Ocean Coastal Manag. 152, 135–144. doi: 10.1016/j.ocecoaman.2017.11.023
Ardron, J. A., Possingham, H. P., and Klein, C. J. (eds) (2010). Marxan Good Practices Handbook Version 2. St. Lucia, QLD: University of Queensland.
Baker, C. M., Plein, M., Shaikh, R., and Bode, M. (2019). Simultaneous invasive alien predator eradication delivers the best outcomes for protected island species. Biol. Invasion. 22, 1085–1095.
Ball, I. R., Possingham, H. P., and Watts, M. E. (2009). “Marxan and relatives: software for spatial conservation prioritization,” in Spatial Conservation Prioritization: Quantitative Methods and Computational Tools, eds A. Moilanen, and K.A. Wilson, & H. Possingham. Oxford, UK: Oxford University Press, 185–195.
Caut, S., Angulo, E., and Courchamp, F. (2008). Dietary shift of an invasive predator: rats, seabirds and sea turtles. J. Appl. Ecol. 45, 428–437. doi: 10.1111/j.1365-2664.2007.01438.x
Colyvan, M., Justus, J., and Regan, H. M. (2011). The conservation game. Biol. Conserv. 144, 1246–1253. doi: 10.1016/j.biocon.2010.10.028
Daigle, R. M., Metaxas, A., Balbar, A., McGowan, J., Treml, E. A., Kuempel, C. D., et al. (2018). Operationalizing ecological connectivity in spatial conservation planning with Marxan Connect. bioRxiv [Preprint]. doi: 10.1101/315424
Dalleau, M., Andréfouët, S., Wabnitz, C. C., Payri, C., Wantiez, L., Pichon, M., et al. (2010). Use of habitats as surrogates of biodiversity for efficient coral reef conservation planning in Pacific Ocean islands. Conserv. Biol. 24, 541–552. doi: 10.1111/j.1523-1739.2009.01394.x
Douvere, F., and Ehler, C. (2009). New perspectives on sea use management: initial findings from European experience with marine spatial planning. J. Environ. Manag. 90, 77–88. doi: 10.1016/j.jenvman.2008.07.004
Ehler, C., and Douvere, F. (2009). Marine Spatial Planning: A Step-by-Step Approach Toward Ecosystem-Based Management. Paris: UNESCO.
European Commission (2014). 89/EU directive of the european parliament and of the council of 23 July 2014 establishing a framework for maritime spatial planning. Official Journal of the European Union L 257, 135.
European Commission (2017). European MSP Platform: Countries. Available at: http://www.msp-platform.eu/msp-practice/countries [accessed November 15, 17].
Flannery, W., Healy, N., and Luna, M. (2018). Exclusion and non-participation in marine spatial planning. Mar. Policy 88, 32–40. doi: 10.1016/j.marpol.2017.11.001
Frazão Santos, C., Ehler, C. N., Agardy, T., Andrade, F., Orbach, M. K., and Crowder, L. B. (2019). “Marine spatial planning,” in World Seas: an Environmental Evaluation (2nd Edn.), ed. C. Sheppard (Cambridge, MA: Academic Press), 571–592.
Game, E. T., and Grantham, H. S. (2008). Marxan User Manual: For Marxan version 1.8.10. St. Lucia, QLD: University of Queensland.
Giakoumi, S., Grantham, H. S., Kokkoris, G. D., and Possingham, H. P. (2011). Designing a network of marine reserves in the Mediterranean Sea with limited socio-economic data. Biol. Conserv. 144, 753–763. doi: 10.1016/j.biocon.2010.11.006
Gopnik, M., Fieseler, C., Cantral, L., McClellan, K., Pendleton, L., and Crowder, L. (2012). Coming to the table: early stakeholder engagement in marine spatial planning. Mar. Policy 36, 1139–1149. doi: 10.1016/j.marpol.2012.02.012
Halpern, B. S., Longo, C., Hardy, D., McLeod, K. L., Samhouri, J. F., Katona, S. K., et al. (2012). An index to assess the health and benefits of the global ocean. Nature 488, 615–620. doi: 10.1038/nature11397
Hamel, M. A., and Andréfouët, S. (2010). Using very high resolution remote sensing for the management of coral reef fisheries: review and perspectives. Mar. Pollut. Bull. 60, 1397–1405. doi: 10.1016/j.marpolbul.2010.07.002
Irish, O. (2018). Identifying ecological hotspots in the United States and Norway: turning ecosystem-based management into practice? Mar. Policy 98, 65–76. doi: 10.1016/j.marpol.2018.09.005
Janssen, R., Arciniegas, G., and Alexander, K. A. (2015). Decision support tools for collaborative marine spatial planning: identifying potential sites for tidal energy devices around the Mull of Kintyre, Scotland. J. Environ. Plan. Manag. 58, 719–737. doi: 10.1080/09640568.2014.887561
Jean, S., Gilbert, L., Medema, W., Keijser, X., Mayer, I., Inam, A., et al. (2018). Serious Games as planning support systems: learning from playing maritime spatial planning challenge 2050. Water 10:1786. doi: 10.3390/w10121786
Jones, H. P., Tershy, B. R., Zavaleta, E. S., Croll, D. A., Keitt, B. S., Finkelstein, M. E., et al. (2008). Severity of the effects of invasive rats on seabirds: a global review. Conserv. Biol. 22, 16–26. doi: 10.1111/j.1523-1739.2007.00859.x
Kattan, A., Coker, D. J., and Berumen, M. L. (2017). Reef fish communities in the central Red Sea show evidence of asymmetrical fishing pressure. Mar. Biodivers. 47, 1227–1238. doi: 10.1007/s12526-017-0665-8
Keijser, X., Ripken, M., Warmelink, H., Abspoel, L., Fairgrieve, R., and Mayer, I. (2018). “Maritime spatial planning – a board game for stakeholder involvement,” in 48th Conference of the International Simulation and Gaming Association, ISAGA 2017, eds H. K. Lukosch, G. Bekebrede, and R. Kortmann (Delft: Springer Verlag).
Lopes, P., Souza, S., Clauzet, M., Silvano, R., and Begossi, A. (2015). Fisheries, tourism, and marine protected areas: conflicting or synergistic interactions? Ecosyst. Serv. 16, 333–340. doi: 10.1016/j.ecoser.2014.12.003
Margules, C., and Pressey, R. (2000). Systematic conservation planning. Nature 405, 243–253. doi: 10.1038/35012251
Marshall, N., Marshall, P., Abdulla, A., and Rouphael, T. (2010). The links between resource dependency and attitude of commercial fishers to coral reef conservation in the red sea. Ambio 39, 305–313. doi: 10.1007/s13280-010-0065-9
Mayer, I., Zhou, Q., Keijser, X., and Abspoel, L. (2014). “Gaming the future of the ocean: the marine spatial planning challenge 2050,” in 5th International Conference Serious Games Development and Applications, SGDA 2014, eds J. B. Hauge, M. F. Oliveira, M. F. Oliveira, and M. Ma (Berlin: Springer Verlag).
Neumann, B., Vafeidis, A., Zimmermann, J., and Nicholls, R. J. (2015). Future coastal population growth and exposure to sea-level rise and coastal flooding – a global assessment. PLoS One 10:e0118571. doi: 10.1371/journal.pone.0118571
Olsen, E., Fluharty, D., Hoel, A. H., Hostens, K., Maes, F., and Pecceu, E. (2014). Integration at the round table: marine spatial planning in multi-stakeholder settings. PLoS One 9:e109964. doi: 10.1371/journal.pone.0109964
Osman, E. O., Smith, D. J., Ziegler, M., Kürten, B., Conrad, C., El-Haddad, K. M., et al. (2018). Thermal refugia against coral bleaching throughout the northern Red Sea. Glob. Change Biol. 24, e474–e484. doi: 10.1111/gcb.13895
Panagou, N., Kokkali, A., and Stratigea, A. (2018). Towards an integrated participatory marine/coastal and territorial spatial planning approach at the local level - planning tools and issues raised. Reg. Sci. Inq. 87–111.
Pandolfi, J. M., Bradbury, R. H., Sala, E., Hughes, T. P., Bjorndal, K. A., Cooke, R. G., et al. (2003). Global trajectories of the long-term decline of coral reef ecosystems. Science 301, 955–958. doi: 10.1126/science.1085706
Picone, F., Buonocore, E., D’Agostaro, R., Donati, S., Chemello, R., and Franzese, P. P. (2017). Integrating natural capital assessment and marine spatial planning: a case study in the Mediterranean sea. Ecol. Modell. 361, 1–13. doi: 10.1016/j.ecolmodel.2017.07.029
Pomeroy, R., and Douvere, F. (2008). The engagement of stakeholders in the marine spatial planning process. Mar. Policy 32, 816–822. doi: 10.1016/j.marpol.2008.03.017
Portman, M. (2011). Marine spatial planning: achieving and evaluating integration. ICES J. Mar. Sci. 68, 2191–2200. doi: 10.2139/ssrn.2873100
Portman, M. E., Esteves, L. S., Le, X. Q., and Khan, A. Z. (2012). Improving integration for integrated coastal zone management: an eight country study. Sci. Total Environ. 439, 194–201. doi: 10.1016/j.scitotenv.2012.09.016
Ratcliffe, N., Bell, M., Pelembe, T., Boyle, D., Benjamin, R., White, R., et al. (2010). The eradication of feral cats from Ascension Island and its subsequent recolonization by seabirds. Oryx 44, 20–29. doi: 10.1017/s003060530999069x
Rempis, N., Alexandrakis, G., Tsilimigkas, G., and Kampanis, N. (2018). Coastal use synergies and conflicts evaluation in the framework of spatial, development and sectoral policies. Ocean Coast. Manag. 166, 40–51. doi: 10.1016/j.ocecoaman.2018.03.009
Roberts, C. M., O’Leary, B. C., McCauley, D. J., Cury, P. M., Duarte, C. M., Lubchenco, J., et al. (2017). Marine reserves can mitigate and promote adaptation to climate change. Proc. Natl. Acad. Sci. 114, 6167–6175. doi: 10.1073/pnas.1701262114
Robinson, A. H., Morrison, J. L., Muehrcke, P. C., Kimerling, A. J., and Guptill, S. C. (1995). Elements of Cartography, 6th Edn. New York, NY: John Wiley & Sons.
Rowlands, G., Purkis, S., and Bruckner, A. (2016). Tight coupling between coral reef morphology and mapped resilience in the Red Sea. Mar. Pollut. Bull. 105, 575–585. doi: 10.1016/j.marpolbul.2015.11.027
Rowlands, G., Purkis, S., Riegl, B., Metsamaa, L., Bruckner, A., and Renaud, P. (2012). Satellite imaging coral reef resilience at regional scale. A case-study from Saudi Arabia. Mar. Pollut. Bull. 64, 1222–1237. doi: 10.1016/j.marpolbul.2012.03.003
Segan, D. B., Game, E. T., Watts, M. E., Stewart, R. R., and Possingham, H. P. (2011). An interoperable decision support tool for conservation planning. Environ. Modell. Softw. 26, 1434–1441. doi: 10.1016/j.envsoft.2011.08.002
Song, G., Balakrishnan, R., Binkley, G., Costanzo, M., Dalusag, K., Demeter, J., et al. (2016). Integration of new alternative reference strain genome sequences into the Saccharomyces genome database. Database 2016:baw074. doi: 10.1093/database/baw074
Spaet, J., Nanninga, G., and Berumen, M. (2016). Ongoing decline of shark populations in the Eastern Red Sea. Biol. Conserv. 201, 20–28. doi: 10.1016/j.biocon.2016.06.018
Sutcliffe, P. R., Klein, C. J., Pitcher, C. R., and Possingham, H. P. (2015). The effectiveness of marine reserve systems constructed using different surrogates of biodiversity. Conserv. Biol. 29, 657–667. doi: 10.1111/cobi.12506
Törnroos, A., Nordström, M. C., and Bonsdorff, E. (2013). Coastal habitats as surrogates for taxonomic, functional and trophic structures of benthic faunal communities. PLoS One 8:e78910. doi: 10.1371/journal.pone.0078910
Tuda, A., Stevens, T., and Rodwell, L. (2014). Resolving coastal conflicts using marine spatial planning. J. Environ. Manag. 133C, 59–68. doi: 10.1016/j.jenvman.2013.10.029
Wanless, R. M., Angel, A., Cuthbert, R. J., Hilton, G. M., and Ryan, P. G. (2007). Can predation by invasive mice drive seabird extinctions? Biol. Lett. 3, 241–244. doi: 10.1098/rsbl.2007.0120
Yates, K., Schoeman, D., and Klein, C. J. (2015). Ocean zoning for conservation, fisheries and marine renewable energy: assessing trade-offs and co-location opportunities. J. Environ. Manag. 152, 201–209. doi: 10.1016/j.jenvman.2015.01.045
Keywords: marine spatial planning, Red Sea, Saudi Arabia, conservation, tourism, sustainability, Marxan
Citation: Chalastani VI, Manetos P, Al-Suwailem AM, Hale JA, Vijayan AP, Pagano J, Williamson I, Henshaw SD, Albaseet R, Butt F, Brainard RE, Coccossis H, Tsoukala VK and Duarte CM (2020) Reconciling Tourism Development and Conservation Outcomes Through Marine Spatial Planning for a Saudi Giga-Project in the Red Sea (The Red Sea Project, Vision 2030). Front. Mar. Sci. 7:168. doi: 10.3389/fmars.2020.00168
Received: 09 August 2019; Accepted: 03 March 2020;
Published: 31 March 2020.
Edited by:
Nancy Knowlton, Smithsonian Institution, United StatesReviewed by:
Athanasios Kampas, Agricultural University of Athens, GreeceTundi Agardy, Sound Seas, United States
Copyright © 2020 Chalastani, Manetos, Al-Suwailem, Hale, Vijayan, Pagano, Williamson, Henshaw, Albaseet, Butt, Brainard, Coccossis, Tsoukala and Duarte. This is an open-access article distributed under the terms of the Creative Commons Attribution License (CC BY). The use, distribution or reproduction in other forums is permitted, provided the original author(s) and the copyright owner(s) are credited and that the original publication in this journal is cited, in accordance with accepted academic practice. No use, distribution or reproduction is permitted which does not comply with these terms.
*Correspondence: Vasiliki I. Chalastani, dmFuZXNhY2hhbGFAaG90bWFpbC5jb20=