 Eloísa Pacheco-Almanzar
 Nadia Loza-Estrada
 Ana L. Ibáñez
- Departamento de Hidrobiología, Universidad Autónoma Metropolitana-Iztapalapa, Mexico City, Mexico
Mugil curema is a teleost fish of economic importance that shows wide phenotypic variability in the coasts of Mexico. Intraspecific morphological variability might replicate either genetic dissimilarity between groups or environmental conditions according to phenotypic plasticity. Fish scales shape was used to discriminate location variants, genetic structure obtained by microsatellite markers, and marine ecoregions of Mexico. The present study uses landmarks and geometric morphometric statistical approaches to address the specific question: if and how fish scale shape varies with genetic structure or with marine ecoregions. This is assessed using seven landmarks by scale, the coordinates of which were subjected to a generalized Procrustes analysis, followed by a principal components analysis and quadratic discriminant analysis with cross-validation analysis on shape. Also, the significance of classifications was assessed by multivariate analysis of covariance (MANCOVA). The proportion of total shape variance explained by total length and by centroid size was 3.8 and 3.0%, respectively. Therefore, only shape (without size) was used for the analysis. MANCOVA was significant in all cases, with locations, genetic structure, and marine ecoregions. The cross-validated discriminant analysis by location correctly classified 42.2%, whereas with the genetic structure prearrangement and marine ecoregions, the identification rates were 58.3 and 57.0%, respectively. It was surprising that, as the same as in the genetic structure (microsatellite analysis), San Antonio Bay, Texas formed a group with Sabancuy, Campeche, Celestun, and Sisal, Yucatan (the Caribbean locations). Likewise, Huave Lagoon System, Oaxaca, located in the Pacific coast is more similar to the Caribbean sites unlike the other locations from the Pacific area, which are similar results depicted with microsatellite analysis. On the other hand, using the marine ecoregions arrangement, the findings indicate that the Mexican Tropical Pacific and the Chiapas-Nicaragua marine ecoregions were very different as opposed to the two marine ecoregions from the Gulf of Mexico more similar in fish scale shape. The Mexican Tropical Pacific ecoregions show more identification rate (80.4%), whereas the rest of marine ecoregions discriminate less than 53.3%. Possibly, hydrographic features as currents or upwellings circumscribe boundaries between marine ecoregions, and this could produce inherent genetic structure.
Introduction
Mugil curema (Valenciennes, 1836) is basically an American species found in both the Atlantic and Pacific oceans, with few populations in African waters (Durand et al., 2012). The species is economically important, with catches of 6,067 metric tons in Mexico during the year 2017, of which 88% were from the Gulf of Mexico coasts and 12% from the Pacific coasts (Secretaría de Medio Ambiente Recursos Naturales y Pesca (SEMARNAP), 2017). A great body morphometric variability has been recorded for this species in the Gulf of Mexico, indicating the presence of more than one population (Ibáñez-Aguirre et al., 2006). Variation in shape in M. curema has been considered to reliably trace fish populations by applying geometric morphometric methods to one fish scale per specimen. Results have shown that fish scale shape clearly separates specimens of different localities (Ibáñez et al., 2007; Ibáñez and O’Higgins, 2011; Ibáñez, 2015). In general, fish scale shape is to a significant extent species-specific and helps determine stock membership (Ibáñez et al., 2007; Garduño-Paz et al., 2010). Furthermore, fish scale shape was used to identify geographic variants among the Lutjanidae (Lutjanus argentiventris, L. guttatus, and L. peru) of three geographic areas along the Pacific coast (Ibáñez et al., 2012a), with results indicating that specimens of each species from the three geographic areas formed two local populations. The consistency of these results for the three species analyzed established that this coincidence does not happen by chance. The variability in hydrogeomorphology, water productivity, and abundance of fish stocks possibly accounted for the observed differences in scale morphology and clarified why scale shape may be used to discriminate among stocks (De Pontual and Prouzet, 1987; Watkinson and Gillis, 2005; Ibáñez et al., 2007). In this sense, it can be surmised that scale morphology is regulated by habitat variability and food availability and type, leading to a differentiation of phenotypic characteristics (Swain and Foote, 1999; Ibáñez et al., 2012b).
As far as we know, only two studies have analyzed the influence of genetics on the shape of fish scales, those of Staszny et al. (2013) and Albertson et al. (2018). The two articles agree that both genetic and environmental factors can significantly influence the formation of scales, and thus the shape of a scale may be used as a tool to explain and detect the potential variability of the environmental influences that affect groups of genetically homogeneous fish.
Mexico’s geographic position, between the Central-Western Atlantic and the Central-Eastern Pacific, explains much of its enormous biological diversity, where fish make up the group of vertebrates with the largest number of species (2,763 species; Espinosa-Pérez, 2014). Marine ecoregions have been defined in order to have a better understanding of their resources and geographic distribution. These marine ecoregions are influenced by environmental factors, including the temperature and circulation of large currents and seawater masses (Lara-Lara et al., 2008). At present, there are no studies based on morphometry or on whether the shape of the scales reflects this division of marine ecoregions.
Mugil curema inhabits coastal lagoons, estuaries, and rivers. The adults migrate to the open sea to spawn, where both eggs and hatchlings are subject to surface currents that aid their transportation. Later, the juveniles migrate to estuaries and coastal lagoons where they live until adulthood (Ibáñez, 1993). The spawning period of M. curema in the Gulf of Mexico was reported by Ibáñez and Colín (2014). In the northern Gulf of Mexico, Madre Lagoon and Tamiahua Lagoon, the spawning period occurs from the end of winter to spring, while in the more southern localities where water is warmer, sexually mature females have been reported in autumn and winter, especially for Alvarado Lagoon, Veracruz and Mecoacán Lagoon, Tabasco (Ibáñez and Colín, 2014). In addition, female individuals collected in the estuaries of Sabancuy, Campeche and Celestun, Yucatan, have a long spawning period from November to April (Pacheco-Almanzar et al., 2017). Thus, different spawning seasons have been reported for this species throughout the Gulf of Mexico. Similarly, different spawning periods have been recorded for the Mexican Pacific (Viera-Muñoz, 1979; Villaseñor-Talavera, 1991; Lucano-Ramírez and Michel-Morfín, 1997; Cabral-Solís, 1999). It is believed that spawning differences may have resulted in differences in the genetic structure of M. curema in the Gulf of Mexico, where three groups have been identified using microsatellite markers (Pacheco-Almanzar et al., 2017; Pacheco-Almanzar, 2019). It is also possible that changes in ocean currents produce diverse environments that generate marine ecoregions that are part of other larger and superior geographical entities, but at the same time have their own characteristics and particular features.
In view of this, it is both possible that populations of nearby water bodies attain connectivity and that populations become separated by mainstream currents. Understanding patterns of connectivity among populations is critical for the advance of accurate, spatially clear descriptions of population dynamics. As was mentioned above, fish scale shape has been used to identify geographic variants, but does it reflect the structure observed along Mexico’s coasts using microsatellite markers or marine ecoregions?
Thus, the objective of this work was to determine if the scale shape reflects the genetic structure observed along the coasts of Mexico using microsatellite markers and also to analyze if the scale shape is related to the marine ecoregions. Three approaches were addressed here: by locality, by spatial empirical genetic patterns, and by marine ecoregions. This was assessed through a geometric morphometric analysis.
Materials and Methods
Fish Scale Collection
Mugil curema specimens were collected from commercial fisheries in San Antonio Bay, Texas (SAB) Madre Lagoon, Tamaulipas (LM), Tamiahua Lagoon (TA), Cazones Estuary (CA) and Alvarado Lagoon, Veracruz (AL), Mecoacán Lagoon, Tabasco (ME), Sabancuy, Campeche (SA), and Celestun (CE) and Sisal, Yucatan (SI), along the Gulf of Mexico in 2009 and 2015. Specimens were also collected in Cuyutlán Lagoon, Colima (CU), the Balsas River, Michoacán (BA), and Huave Lagoon System, Oaxaca (HU), along the Pacific coast of Mexico from 2009 to 2014 (Figure 1).
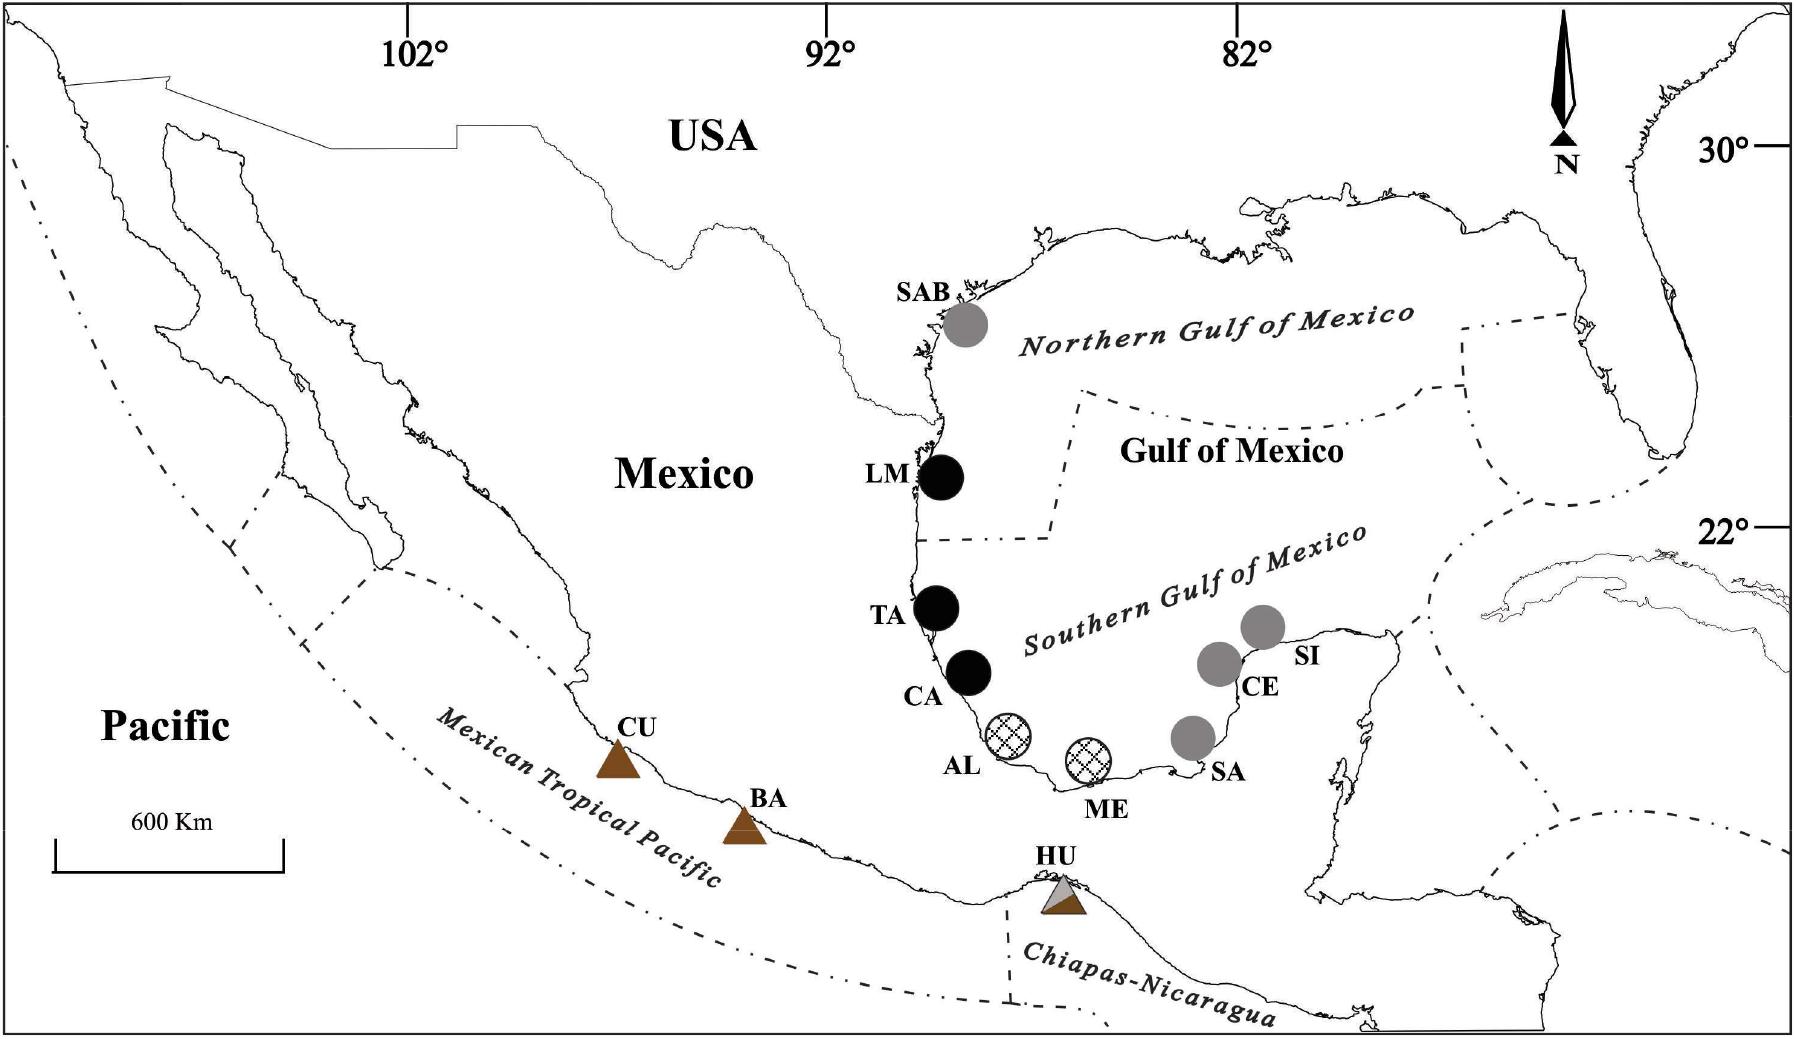
Figure 1. Sampling locations in the Gulf of Mexico: San Antonio Bay, Texas (SAB); Madre Lagoon, Tamps. (LM); Tamiahua Lagoon (TA), Cazones (CA) y Alvarado Lagoon, Ver. (AL); Mecoacán, Tab. (ME); Sabancuy, Camp. (SA); Celestún (CE) and Sisal, Yucatán (SI); Mexican Pacific: Cuyutlán, Col. (CU); Balsas River, Mich. (BA); and Lagunar Huave System, Oax. (HU). In italic are the names of the marine ecoregions. Figures and their tonality form the microsatellite groups.
The marine ecoregionalization of Spalding et al. (2007) was used as follows: the Northern Gulf of Mexico marine ecoregion (NGM) composed by SAB and LM; the Southern Gulf of Mexico marine ecoregion (SGM) comprises TA, CA, AL, ME, SA, CE, and SI; the Mexican Tropical Pacific marine ecoregion (MTP) includes CU and BA; and the Chiapas-Nicaragua marine ecoregion is formed by HU. The distribution of the marine ecoregions is presented in Figure 1.
The fish were measured to the nearest millimeter. The average total length (TL) of all specimens was 261.0 ± 76.8 mm. Fish scales were obtained from the same fish specimens used for the population genetic analysis of Pacheco-Almanzar et al. (2017) (Table 1). All individuals were adults except for Sisal location. One scale per fish was used for the analysis from the left side of the body, between the two dorsal fins. No distinction between sexes was made. They were washed with mild soap and running water, dried, and stained with methylene blue. A digital image of each scale was taken using a Zeiss stereomicroscope (Stemi 2000-C, Carl-Zeiss-Straße, Oberkochen Germany) and an integrated 4.0 MP Canon digital camera (Canon, Ota, Tokyo).
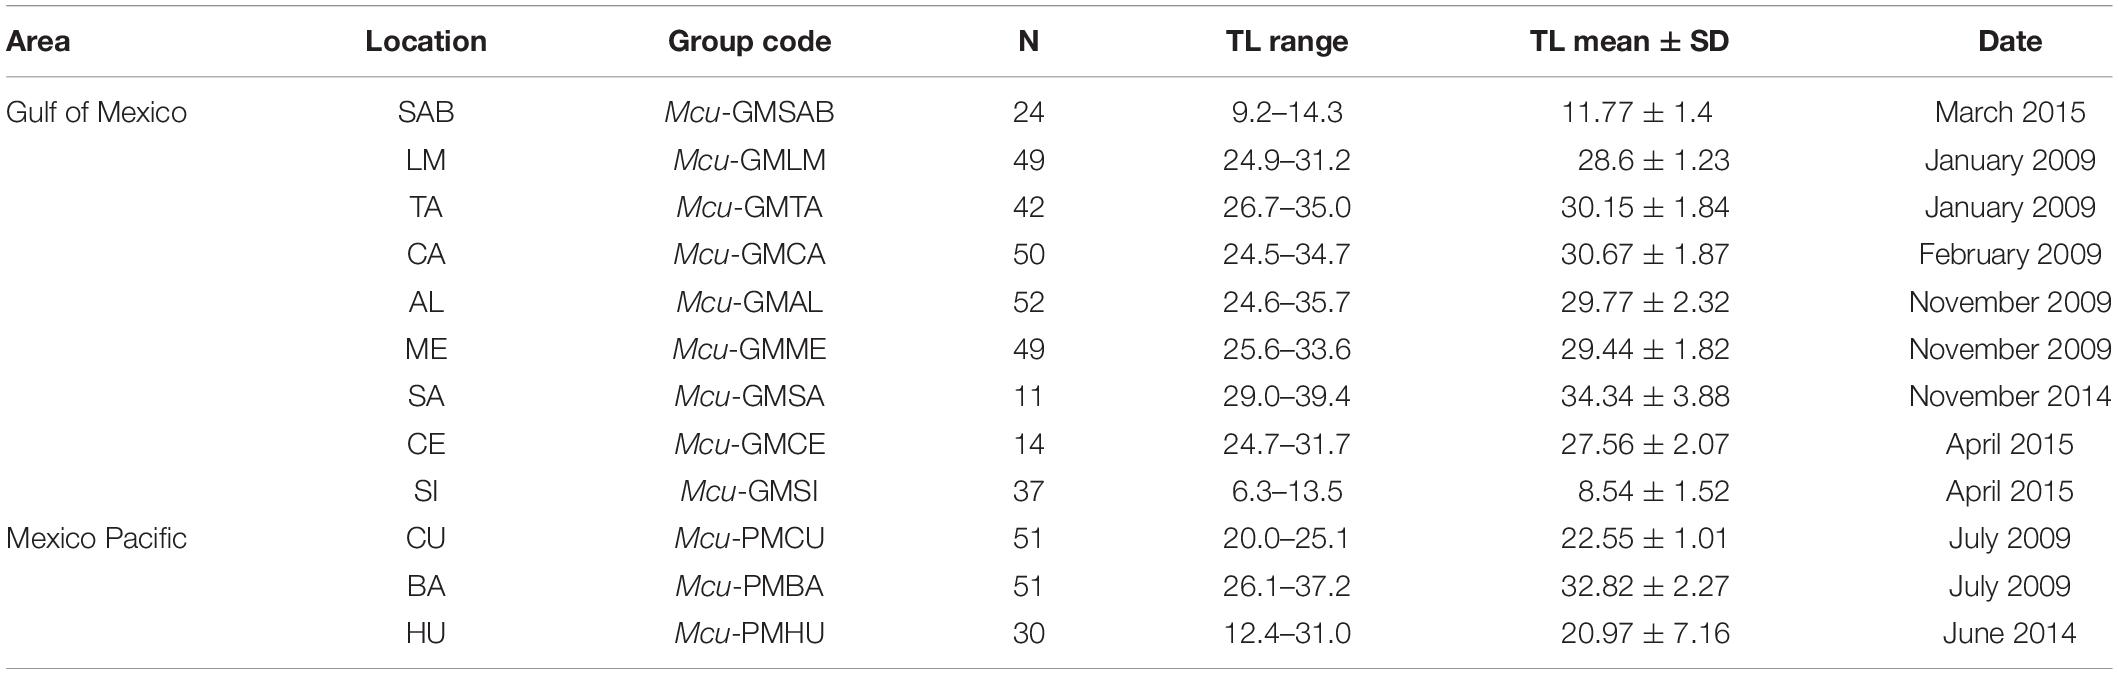
Table 1. Collection sites, size of sample (N), size range (TL = total length in cm), and collection date of M. curema.
The genetic groups proposed by Pacheco-Almanzar et al. (2017) were as follows (Figure 1): the Northern Gulf group (NG) includes the localities of LM, TA, and CA; the Central Gulf group (CG) includes AL and ME; the Southern Gulf group (SG) includes individuals from the localities SAB, SA, CE, SI, and HU (on the Pacific coast); and the Central Pacific group (CP) is formed by BA and CU (Figure 1).
Morphometrics
Seven landmarks per scale were recorded using the tpsDig v2.09 program (Rohlf, 2019) and following the protocol of Ibáñez et al. (2007). The landmarks were located on key features of the ctenoid scale that are common to all scales of the species under study. This ensures that in subsequent interpretations of results, variations in particular landmarks can be related to sharing features of shape. The following landmarks were considered appropriate: landmarks 1 and 3 are the ventrolateral and dorsolateral tips of the anterior portion of the scale; landmark 2 lies at the middle of the anterior edge of the scale; landmarks 4 and 6 lie at the boundary between the anterior portion with circuli and the posterior area covered by cteni (spine-like ornamentations); landmark 5 is the focus of the scale, and landmark 7 is positioned at the tip of the posterior portion or the exposed part of the scale (Figure 2).
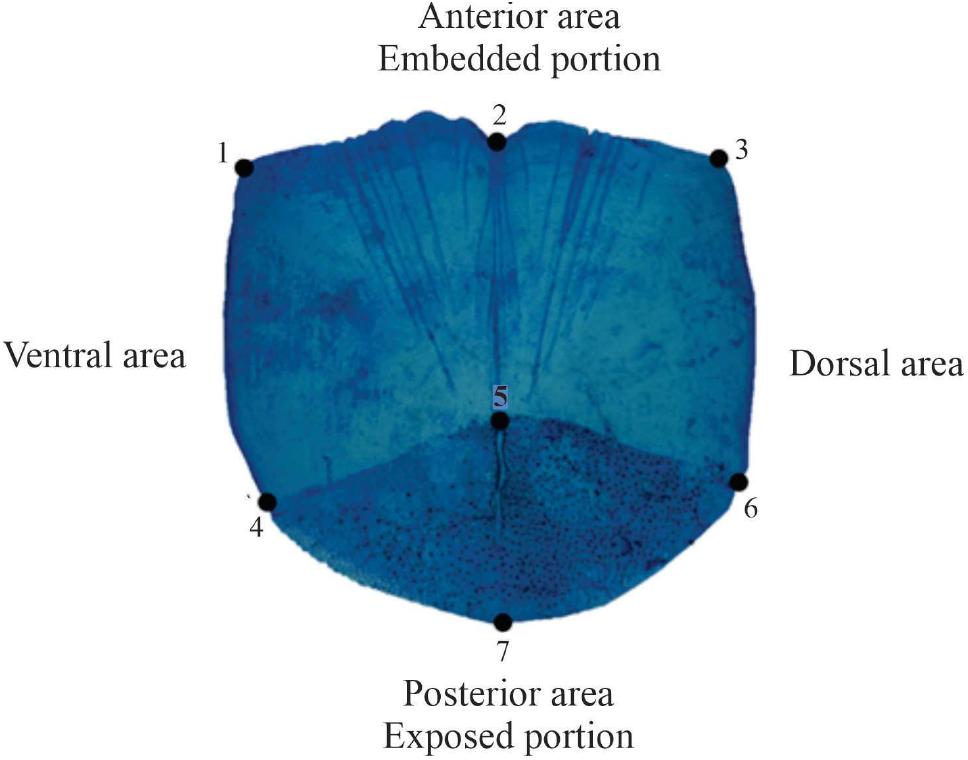
Figure 2. Location of landmarks on scales of Mugil curema.
The configurations of the seven landmark coordinates were submitted to a generalized Procrustes analysis and, following a tangent projection (Dryden and Mardia, 1993, 1998), to a principal components (PCs) analysis (Dryden and Mardia, 1993, 1998; Kent, 1994). The scores of the specimens on all non-zero PCs from the analyses of the shape were regressed on the TL and the centroid size (CS) in order to see the extent to which fish scale size and shape variation is related to body size. The natural measure of size of a landmark configuration is the CS, the square root of the sum of squared distances of a set of landmarks from their centroid (Dryden and Mardia, 1998).
In order to examine the potential for differences in shape when classifying unknown specimens, the scores of the specimens on all non-zero PCs were submitted to a quadratic discriminant analysis to compute generalized Mahalanobis’ distances and discriminant functions and to calculate the value of the latter in the classification. A cross-validated discriminant analysis was applied to assess and compare the efficacy of the shape in the classification by geographic variants (localities), genetic structure, and marine ecoregions.
Finally, differences were assessed by a full multivariate analysis of covariance (MANCOVA) with the shape (all PC scores) as the dependent variable, total length as the covariate, and each of the three approaches addressed here: by locality, by spatial empirical genetic patterns, and by marine ecoregions as the grouping factors. The representation of scale shape by the different approaches was visualized using transformation grids (Bookstein, 1989; Marcus et al., 1996; Dryden and Mardia, 1998) computed with Morphologika2 v2.5 (O’Higgins and Jones, 2006). Statistical analyses were carried out using the Statistical Package for Social Sciences (SPSS v22.0, IBM Corporation, New York, NY, United States) and XLSTAT v2016.02 (XLSTAT Addinsoft Inc., New York, NY, United States) (Addinsoft, 2016).
Results
The scale shape of the M. curema showed significant differences in the three approaches: localities, genetic structure, and ecoregions, according to the result of MANCOVA, which was significant in all cases (p < 0.001). Although the total length differed in all localities, genetic groups, and marine ecoregions, the proportions of shape variance by total length and centroid were 3.8 and 3.0%, respectively, for which reason only the shape (and not the size) was used in the analyses (Table 2).
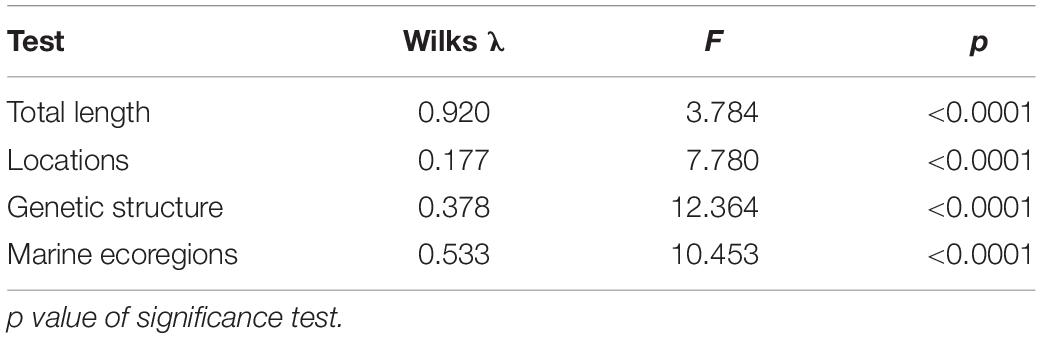
Table 2. MANCOVA test to assess the effect of locations, genetic structure, and marine ecoregions on scale shape.
The first canonical discriminant function for the 460 M. curema individuals classified by geographic variant explained 50.22% of the total variance among geographic variants, and the second represented 20.49% (Wilks λ = 0.144, p < 0.0001). The original discriminant analysis correctly classified 47.6% of the fish scales in each locality, whereas the cross-validation analysis correctly classified 42.2% of the fish scales (Table 3). The best classification index (66.7%) was that of CU, followed by LM and SI with 65.3% and 59.5%, respectively. Most of the erroneous classifications occurred between CA-AL, SA-CE, and HU-SAB (Table 3). Three groups were defined in the graph of the first two discriminant functions, with the specimens of SAB, SI, SA, and CE separated mainly in the first discriminant function with respect to LM, ME, CA, AL, and TA with a considerable overlap of samples, whereas the BA and CU specimens with lower scores were separated in the second function (Figure 3). San Antonio Bay (SAB) is closer to the SA, CE, and SI localities in the Caribbean, while HU on the Pacific coast was more similar to the Gulf of Mexico localities than to the other Pacific localities.
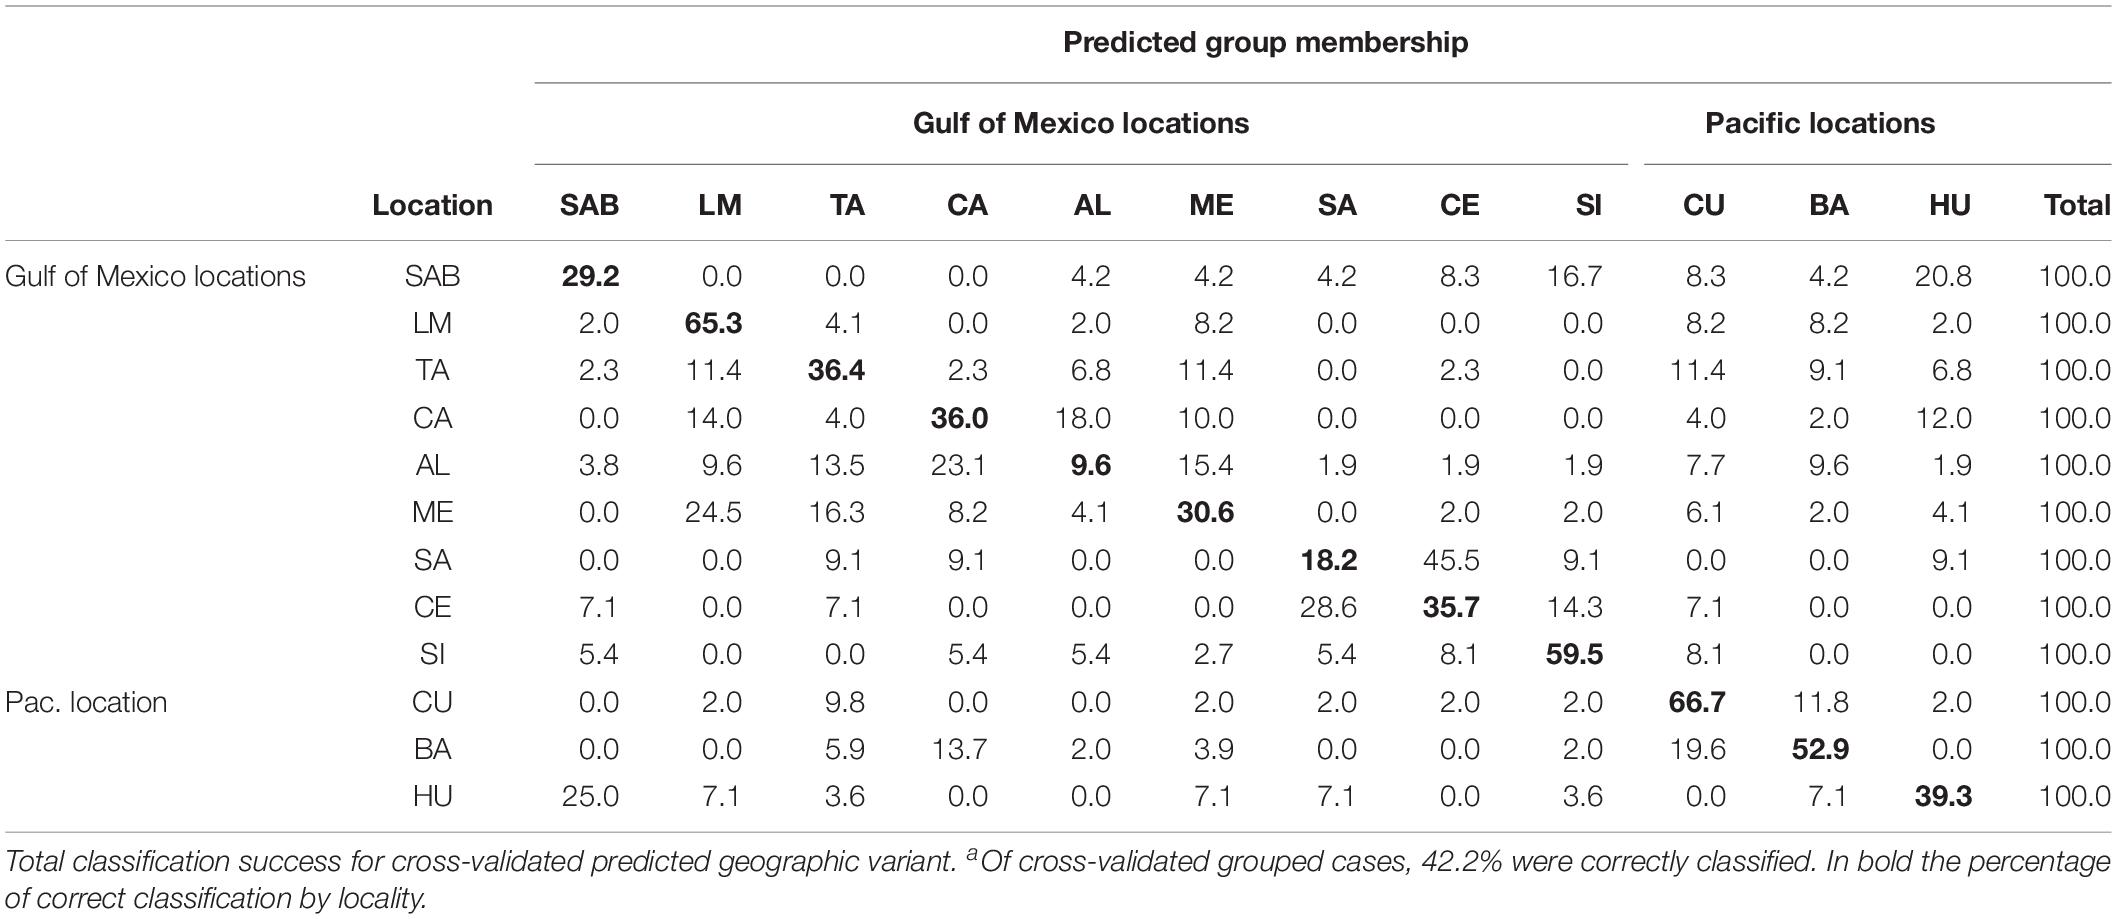
Table 3. Classification resultsa in percentage of the discriminant analysis of the shape of the M. curema scale for the 12 geographic variants.
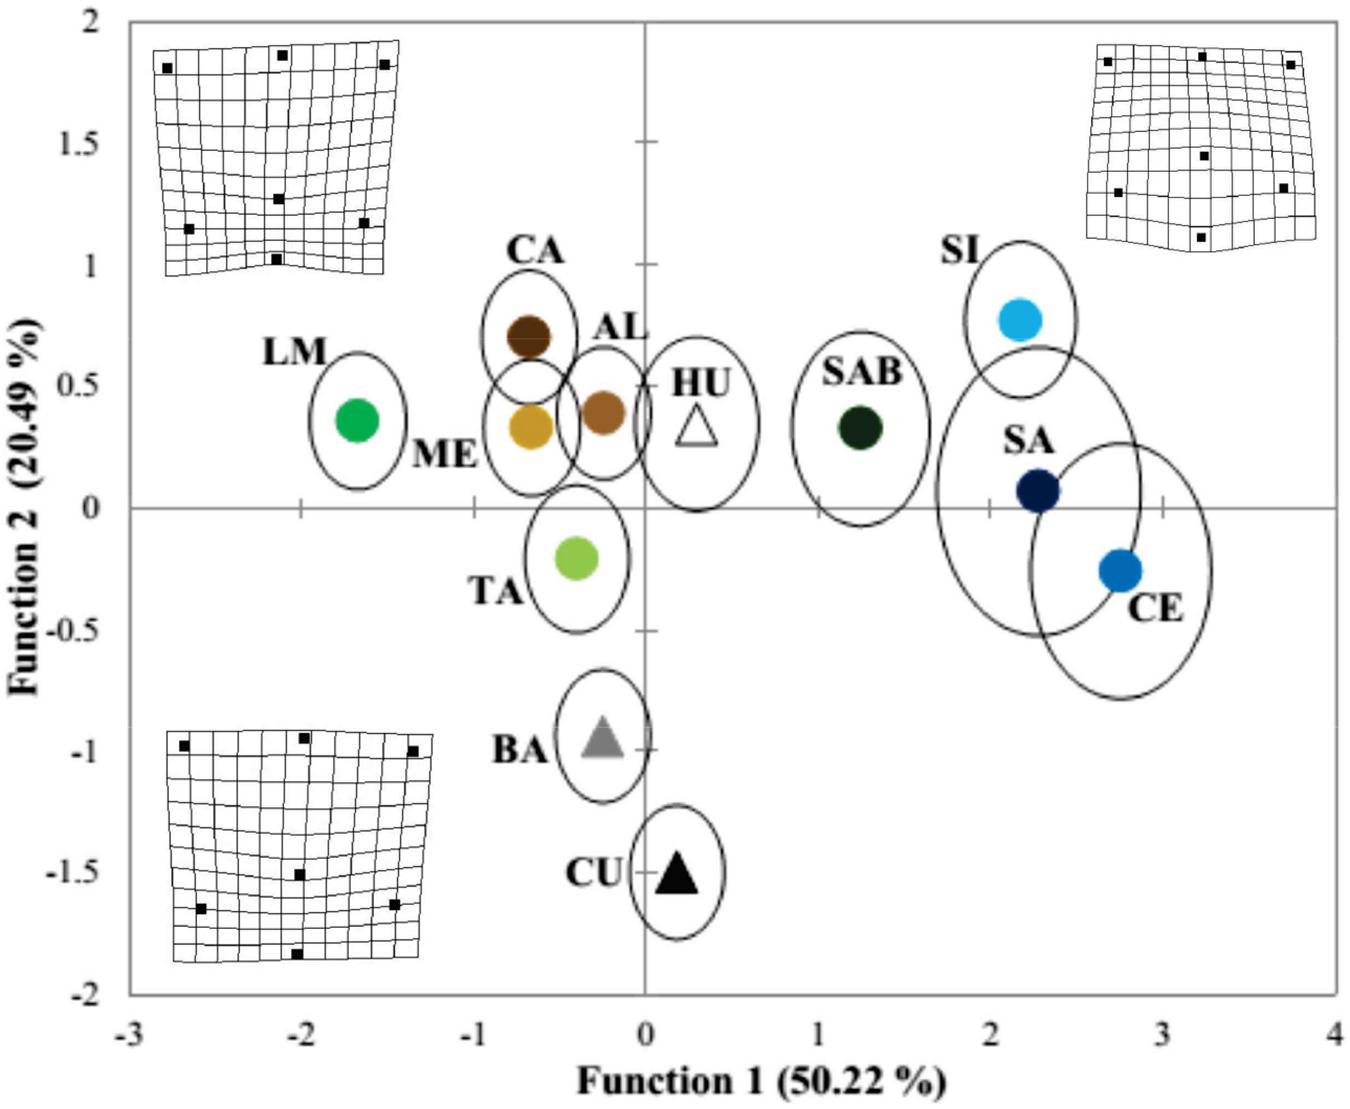
Figure 3. Plot of the discriminant function scores from the analysis of geographic variants of Mugil curema. Circles, locations in Gulf of Mexico, and triangles, locations in the Mexican Pacific. The thin plate spline transformation grids represent the mean shape of M. curema for the localities: LM, TA, CA, ME, and AL (leftmost). The rightmost grid represents the mean shape for the SI, SA, CE, and SAB localities, and the downmost grid represents the localities along the Pacific (CU and BA).
The variations in shape among localities are presented in Figure 3, where the leftmost grid represents the mean shape of M. curema warped to a score of -2.0, basically for the localities in the north and center of the Gulf of Mexico (LM, TA, CA, ME, and AL) and the Huave system (HU) on the Pacific coast. This fish scale was characterized by a relatively shorter distance between the focus and landmark 7. Likewise, the rightmost grid represents the mean shape of M. curema warped to a score of 2.0, basically for the localities in the southern Gulf of Mexico (SI, SA, and CE) and SAB in the northwestern Gulf of Mexico. The downmost grid represents the localities along the Pacific (CU and BA). The key difference between the grids lies in the relative location of the focus, which is relatively more posterior in the Pacific localities. Further, the anterior edge of the scale was convex in the Pacific specimens but concave in the southern Gulf of Mexico specimens.
Regarding the discriminant analysis for the genetic groups, the first discriminant function explained 65.0% of the total variance, and the second represented 32.8% (Wilks λ = 0.359, p < 0.0001). The discriminant analysis correctly classified 62.0% of the original grouped cases, whereas the cross-validation resulted in a correct classification of 58.3% (Table 4). CP presented the best classification rate with 77.5% correctly classified after cross-validation and was followed by SG and NG with 62.9% and 52.5%, respectively. Misclassifications were common between NG and CG (Table 4). Three groups were defined in the graph of the first two discriminant functions of the analysis of the genetic groups. The SG specimens were separated mainly in the first discriminant function with respect to NG and CG with a considerable overlap of samples, whereas the CP specimens were separated by the second function (Figure 4).
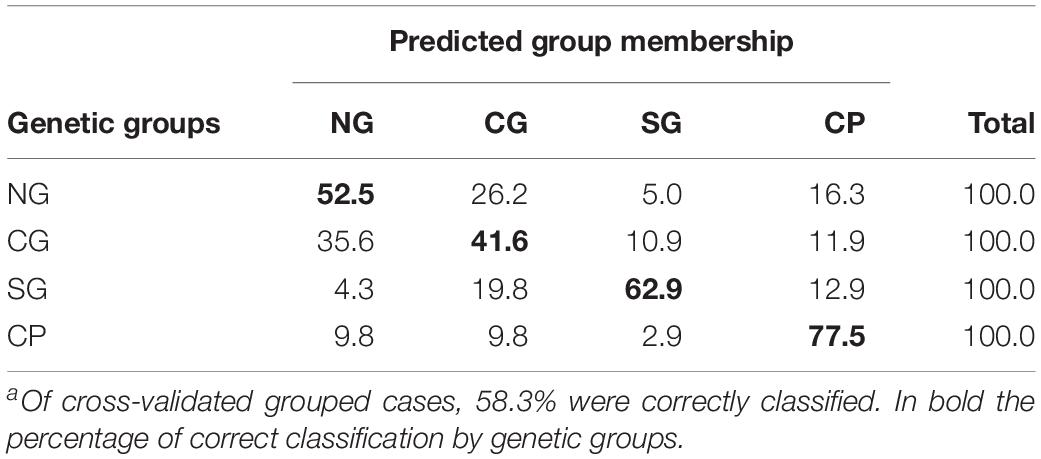
Table 4. Classification resultsa for the cross-validation testing procedure for the four genetic groups: NG, North of GM; CG, Central of GM; SG, South of GM; CP, Central Pacific.
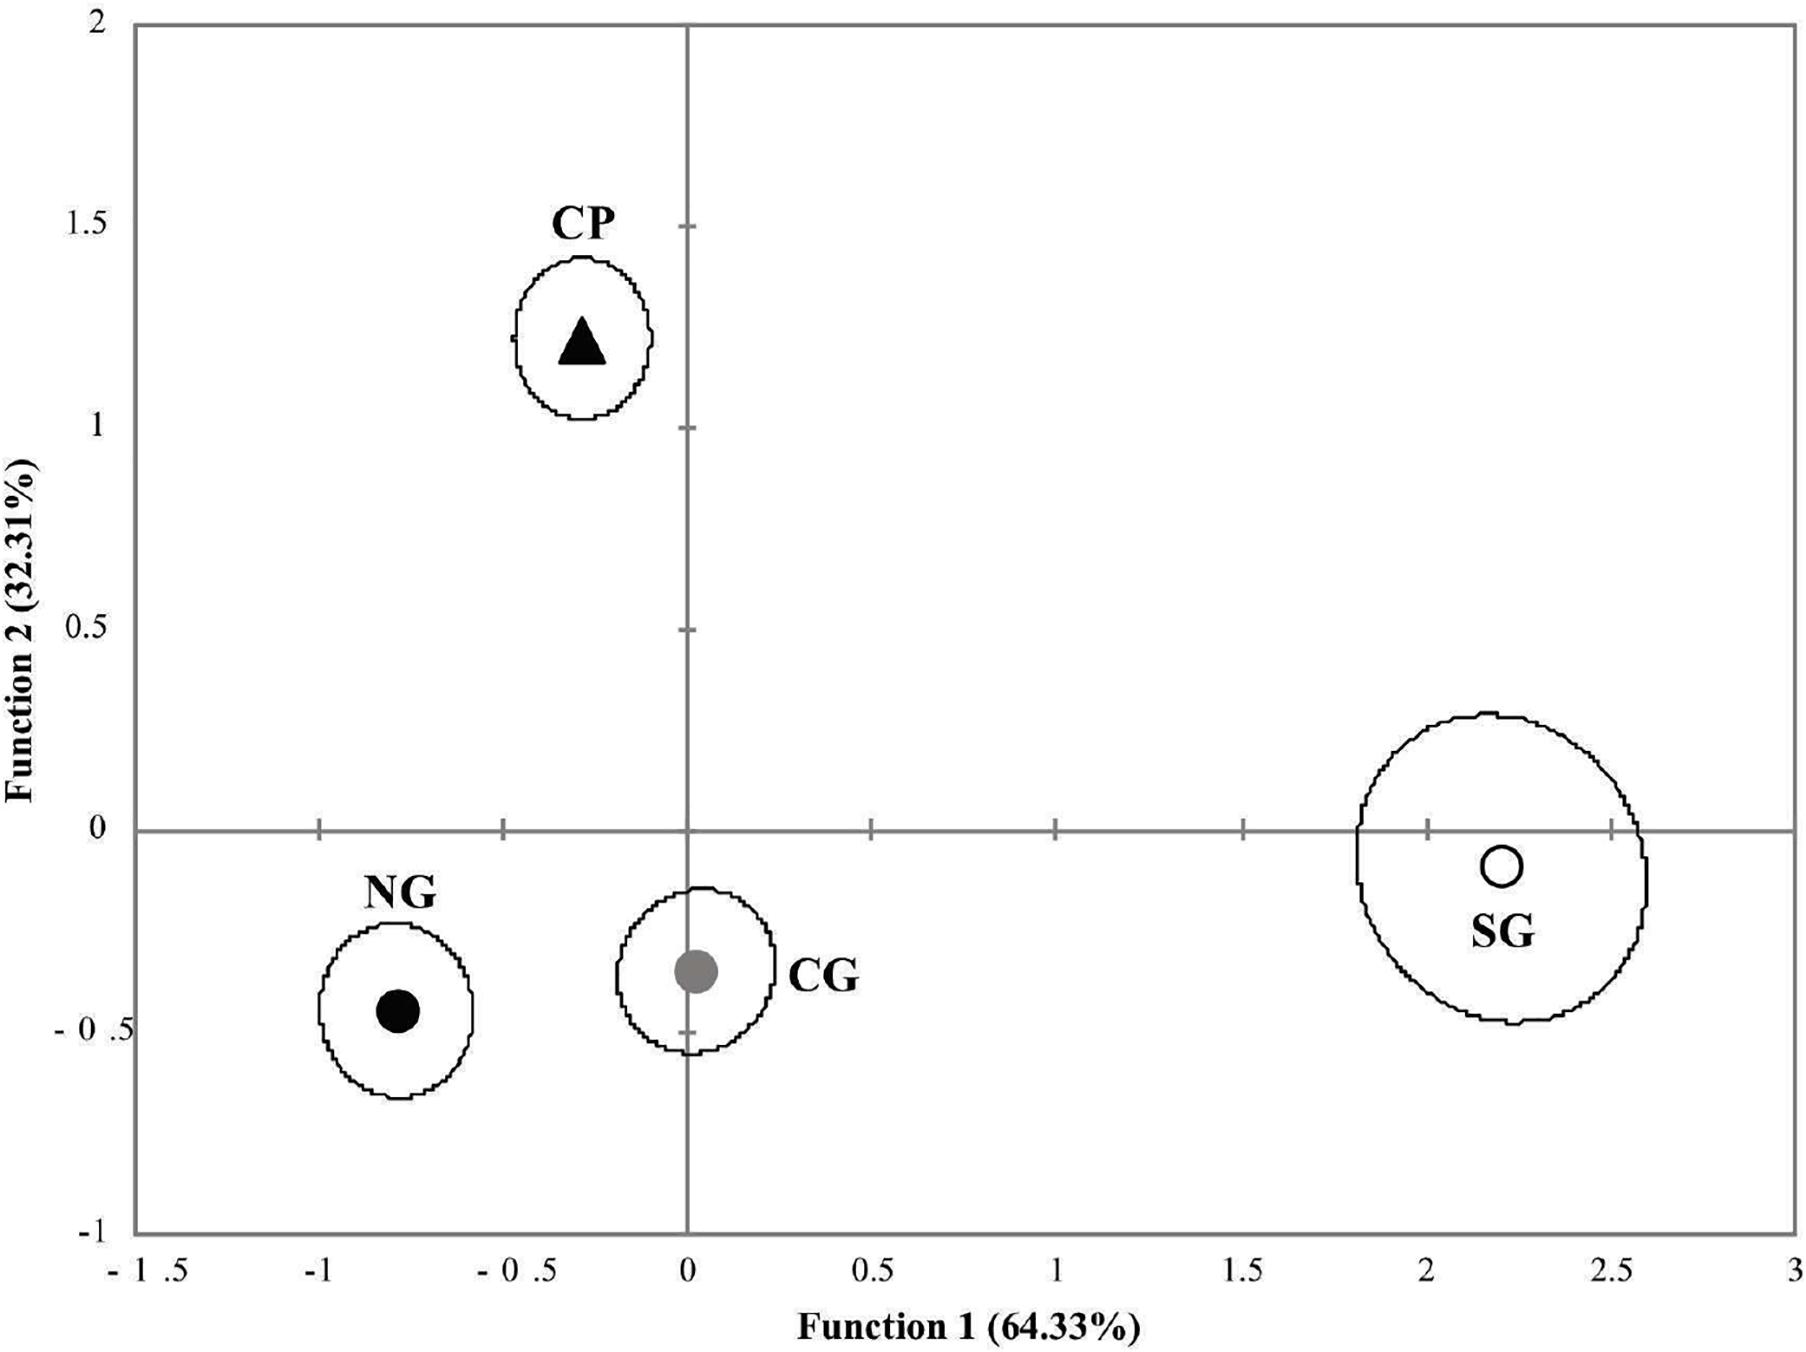
Figure 4. Scatterplot of the discriminant function scores from the analysis of genetic groups of Mugil curema. Gulf of Mexico locations are circles, and Pacific are triangles. Genetic groups: NG, black; CG, gray; SG, white; CP, black.
With respect to the morphometrics arrangement of the marine ecoregions, the first discriminant function explained 61.5% of the total variance, and the second function represented 27.9% (Wilks λ = 0.533, p < 0.0001). The discriminant analysis correctly classified 58.7% of the original cases, whereas the cross-validation correctly classified 55.9% (Table 5). The best classification index was that of the MTP with 81.4%, followed by the NGM and the NC with 52.1% and 50.0%, respectively. The morphometrics results of the two discriminant functions indicate that the MTP was separated from the other marine ecoregions in the first function, compared with the other three marine ecoregions of the Gulf of Mexico (NGM and SGM) and the CN ecoregion of the Pacific coast (Figure 5).
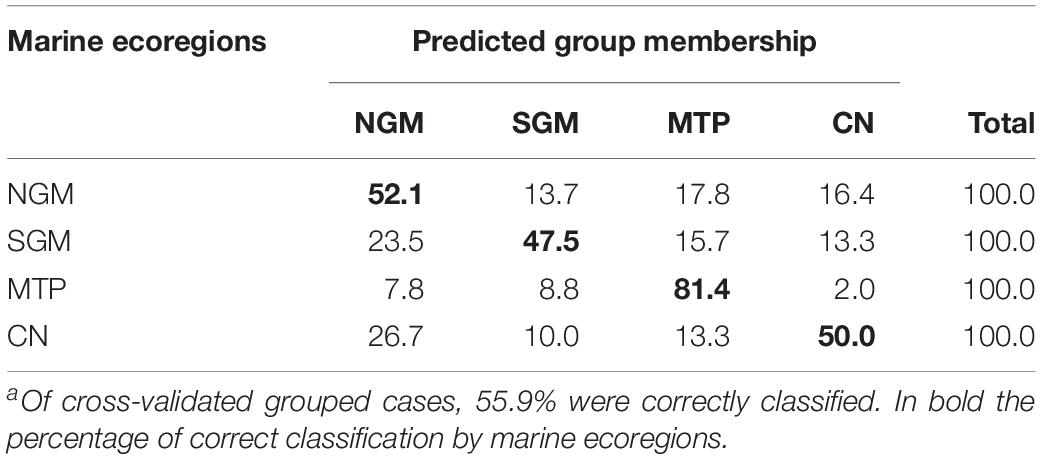
Table 5. Classification resultsa for the cross-validation testing procedure for the four marine ecoregions: NGM, Northern Gulf of Mexico; SGM, Southern Gulf of Mexico; MTP, Mexican Tropical Pacific; CN, Chiapas-Nicaragua ecoregion.
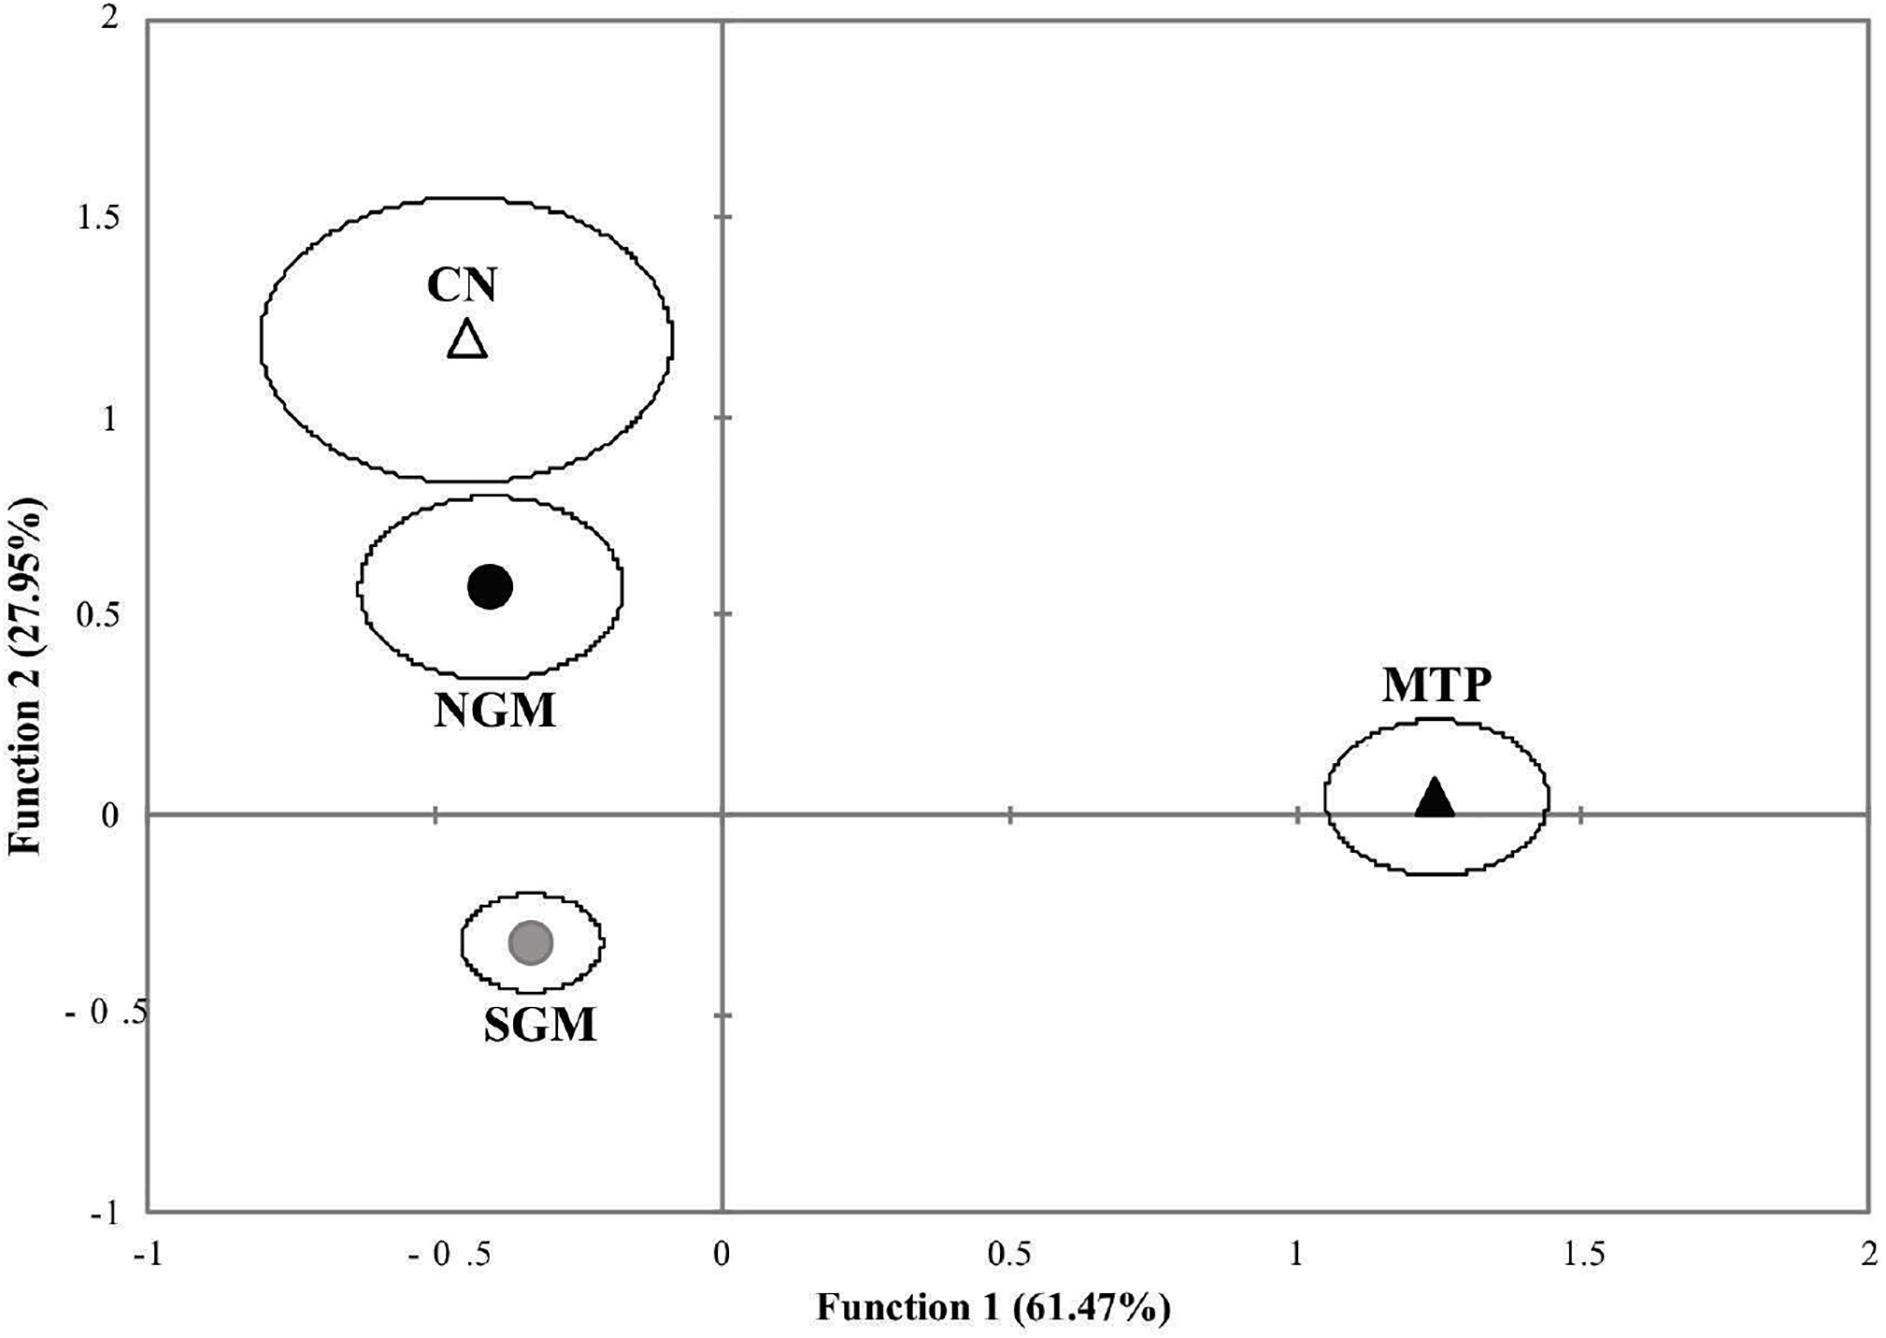
Figure 5. Scatterplot of the discriminant function scores from the analysis of the marine ecoregions. Northern Gulf of Mexico (NGM), black circles; Southern Gulf of Mexico (SGM), gray circles; Mexican Tropical Pacific (MTP), black triangles; Chiapas-Nicaragua (CN), white triangles.
Discussion
There is currently a taxonomic problem still under discussion: if M. curema in the Pacific is the same species as that in the Atlantic. According to Durand et al. (2012), Durand and Borsa (2015), and Nirchio et al. (2017), the genetic distance between both coasts is from 3.2% to 5.4%, enough to be considered as cryptic species. The locations BA and CU from the Pacific (with exception of HU to be discussed later) showed more integrity within them in the canonical discrimination analysis (Table 3). In this sense, scale shape also agrees or reflects the difference between these two possible species.
The results obtained in this study indicate that the scale shape of the M. curema reflects the genetic patterns previously established by Pacheco-Almanzar et al. (2017) and Pacheco-Almanzar (2019). These could be assessed by the highest percentage of discrimination. This could be seen through the canonical discrimination results, the MANCOVA, and the Wilks λ values, as well as in the arrangements of the specimens in the discrimination figures, that is, the HU locality of the Pacific coast that is joined with the Gulf of Mexico localities (Figure 3) and the specimens of the Chiapas-Nicaragua ecoregion, represented only by the HU individuals, which take a position with the Gulf of Mexico localities (Figure 5). It was surprising that, as with the genetic structure (microsatellite analysis), San Antonio Bay formed a group with Sabancuy in Campeche, and Celestun and Sisal in Yucatan (the Caribbean localities).
Mugilid larvae are passively dispersed by currents, which enables the dispersion and flow of genes over long distances and across broad geographic scales (Whitfield et al., 2012). Current dynamics in each ocean may thus play an important role in defining both genetic and morphometric groups.
The California Current (CC) and the Costa Rica Coastal Current (CRCC) meet in the Mexican Pacific and are joined by part of the North Equatorial Current (NEC). The CRCC reaches only the Gulf of Tehuantepec where its surface waters return south due to an anticyclonic flow that forces the CRCC to leave the coast and feed the NEC. Consequently, the two groups found in the Pacific correspond to two marine ecoregions that may be seen as units of evolutionary isolation: the Mexican Tropical Pacific and the Chiapas-Nicaragua region according to Spalding et al. (2007). On the other hand, the Gulf of Mexico currents and river discharges divide this basin into two areas, the North where the Mississippi river (with a discharge of 18,400 m3/s) is the primary source of watershed and discharge data for the Gulf of Mexico and the South that receives a great volume of Caribbean water. Also, different spawning seasons may result in different scale shapes and genetic structures of M. curema in the Gulf of Mexico (Ibáñez and Colín, 2014; Pacheco-Almanzar et al., 2017).
Ocean circulation acts as a barrier to the dispersal of larvae and leads to genetic structuring (Karlsson et al., 2009; Castillo-Olguín et al., 2012; Prieto-Ríos et al., 2014) and morphological differentiation (AnvariFar et al., 2013; Gkafas et al., 2013). The morphological variability recorded among different localities or geographic variants may be due to the genetic structure or to differences in the environmental conditions that prevail in each geographic area.
The causes of morphological differences among populations are often difficult to explain (Poulet et al., 2004; Silva et al., 2008). It has been suggested that the morphological characteristics of fish are determined by the interaction between genetic and environmental factors (Poulet et al., 2004; Salini et al., 2004; Pinheiro et al., 2005; AnvariFar et al., 2011, 2013). Studies such as that of Pinheiro et al. (2005) make clear that the environmental characteristics that prevail during the early stages of development, when individuals may be phenotypically affected by the environment, are particularly important regarding morphological results. For example, different environmental and habitat conditions, such as temperature, turbidity, food availability, and water depth and flow, in different rivers have been seen to cause morphological differentiation in Capoeta sp. specimens (Samaee et al., 2009; AnvariFar et al., 2011).
The genetic groups of M. curema previously differentiated through microsatellite markers (Pacheco-Almanzar et al., 2017; Pacheco-Almanzar, 2019) were successfully distinguished regarding the shape of their scales, indicating that both genetic and environmental factors can significantly influence the formation of the scale shape. Staszny et al. (2013) and Albertson et al. (2018) reported results similar to those of this study for other fish species. Finally, the integration of genetic data through phenotypic traits (the shape of the scale in this case) has the potential to provide a broad view of the roles of adaptation and evolution of phenotypes.
Data Availability Statement
The datasets generated for this study are available on request to the corresponding author.
Ethics Statement
Research was carried out in accordance to Mexican laws and regulations. White mullet was collected under the Official Mexican Norm (NOM-016 PESC-1994) for commercial species. Fish were euthanized humanely by being placed directly into an ice water bath upon capture. No non-target or by-catch specimens were collected during the study.
Author Contributions
EP-A and AI conceived the research and carried out the field work. NL-E processed and prepared the fish scales and performed the statistical analysis. EP-A reviewed the process and preparation of samples. EP-A prepared the initial manuscript. All authors contributed to later revisions.
Funding
This study was funded by the Universidad Autónoma Metropolitana and Consejo Nacional de Ciencia y Tecnología (CONACyT), project number 165569 under the Basic Science convening.
Conflict of Interest
The authors declare that the research was conducted in the absence of any commercial or financial relationships that could be construed as a potential conflict of interest.
Acknowledgments
The authors would like to thank Norman Boyd and James Simons for the sample of San Antonio Bay, Juan Carlos Pérez Jiménez for the sample of Sabancuy, Xavier Chiappa, Maribel Badillo, and Fernando Mex y Alfredo Gallardo for his help in sample collection of Sisal, Elaine Espino Barr from CRIP-Manzanillo for his help in sample collection of Colima, and Pedro Cervantes for the sample of Huave lagoon System. Many thanks to the Texas Parks and Wildlife Department, United States to Norman Boyd (San Antonio Bay Ecosystem Leader) and James Simons (A&M Texas University) who collected the samples from Texas.
References
Addinsoft, (2016). XLSTAT 2016: Data Analysis and Statistical Solution for Microsoft Excel. Paris: Pentraeth.
Albertson, R. C., Kawasaki, K. C., Tetrault, E. R., and Powder, K. E. (2018). Genetic analyses in Lake Malawi cichlids identify new roles for Fgf signaling in scale shape variation. Commun. Biol. 1:55. doi: 10.1038/s42003-018-0060-4
AnvariFar, H., Farahmand, H., Silva, D. M., Bastos, R., Khyabani, A., and AnvariFar, H. (2013). Fourteen years after the Shahid-Rajaei dam construction: an evaluation of the morphometric and genetic differentiation between isolated up- and downstream populations of Capoeta Capoeta gracilis (Pisces: Cyprinidae) in the Tajan River of Iran. Gen. Mol. Res. 12, 3465–3478. doi: 10.4238/2013
AnvariFar, H., Khyabani, A., Farahmand, H., and Vatandoust, S. (2011). Detection of morphometric differentiation between isolated up- and downstream populations of Siah Mahi (Capoeta capoeta gracilis) (Pisces: Cyprinidae) in the Tajan river (Iran). Hydrobiologia 673, 41–52. doi: 10.1007/s10750-011-0748-7
Bookstein, F. L. (1989). Principal warps: thin-plate splines and the decomposition of deformations. IEEE T. Pattern. Anal. 11, 567–585. doi: 10.1109/34.24792
Cabral-Solís, E. G. (1999). Estudio Sobre el Crecimiento y Aspectos Reproductivos de la Lebrancha Mugil curema Cuvier y Valenciennes, 1836, en la Laguna de Cuyutlán, Colima [Tesis de Maestría]. Colima: Universidad de Colima.
Castillo-Olguín, E., Uribe-Alcocer, M., and Díaz-Jaimes, P. (2012). Assessment of the population genetic structure of Sphyrna lewini to identify conservation units in the Mexican Pacific. Cienc. Mar. 38, 635–652. doi: 10.7773/cm.v38i4.2110
De Pontual, H., and Prouzet, P. (1987). Atlantic salmon, Salmo salar L., stock discrimination by scale shape analysis. Aquac. Fish. Manag. 18, 277–289. doi: 10.1111/j.1365-2109.1987.tb00147.x
Durand, J. D., and Borsa, P. (2015). Mitochondrial phylogeny of grey mullets (Acanthopterygii: Mugilidae) suggests high proportion of cryptic species. C. R. Biol. 338, 266–277. doi: 10.1016/j.crvi.2015.01.007
Durand, J. D., Shen, K. N., Chen, W. J., Jamandre, B. W., Blel, H., Diop, K., et al. (2012). Systematics of the grey mullets (Teleostei: Mugiliformes: Mugilic, dae): molecular phylogenetic evidence challenges two centuries of morphology-based taxonomy. Mol. Phylogenet. Evol. 64, 73–92. doi: 10.1016/j.ympev.2012.03.006
Espinosa-Pérez, H. (2014). Biodiversidad de peces en México. Rev. Mex. Biodiv. 85, 450–459. doi: 10.7550/rmb.32264
Garduño-Paz, M. V., Demetriou, M., and Adams, C. E. (2010). Variation in scale shape among alternative sympatric phenotypes of Arctic charr Salvelinus alpinus from two lakes in Scotland. J. Fish. Biol. 76, 1491–1497. doi: 10.1111/j.1095-8649.2010.02584.x
Gkafas, G. A., Tsigenopoulos, C., Magoulas, A., Panagiotaki, P., Vafidis, D., Mamuris, Z., et al. (2013). Population subdivision of saddled seabream Oblada melanura in the Aegean Sea revealed by genetic and morphometric analyses. Aquat. Biol. 18, 69–80. doi: 10.3354/ab00490
Ibáñez, A. L. (1993). Coexistence of Mugil cephalus and M. curema in a coastal lagoon in the Gulf of Mexico. J. Fish. Biol. 42, 959–961. doi: 10.1006/jfbi.1993.1101
Ibáñez, A. L. (2015). Fish traceability: guessing the origin of fish from a seafood market using fish scale shape. Fish. Res. 170, 82–88. doi: 10.1016/j.fishres.2015.05.016
Ibáñez, A. L., and Colín, A. (2014). Reproductive biology of Mugil curema and Mugil cephalus from western Gulf of Mexico waters. Bull. Mar. Sci. 90, 941–952. doi: 10.5343/bms.2014.1004
Ibáñez, A. L., Cowx, I. G., and O’Higgins, P. (2007). Geometric morphometric analysis of fish scales for identifying genera, species, and local populations within the Mugilidae. Can. J. Fish. Aquat. Sci. 64, 1091–1100. doi: 10.1139/F07-075
Ibáñez, A. L., Espino-Barr, E., and Gallardo-Cabello, M. (2012a). Population connectivity among geographic variants within the Lutjanidae through fish scales shape recognition. Sci. Mar. 76, 667–675. doi: 10.3989/scimar.03675.09C
Ibáñez, A. L., Pacheco-Almanzar, E., and Cowx, I. G. (2012b). Does compensatory growth modify fish scale shape. Environ. Biol. Fish. 94, 477–482. doi: 10.1007/s10641-011-9962-4
Ibáñez, A. L., and O’Higgins, P. (2011). Identifying fish scales: the influence of allometry on scale shape and classification. Fish. Res. 109, 54–60. doi: 10.1016/j.fishres.2011.01.016
Ibáñez-Aguirre, A. L., Cabral-Solís, E., Gallardo-Cabello, M., and Espino-Barr, E. (2006). Comparative morphometrics of two populations of Mugil curema (Pisces: Mugilidae) on the Atlantic and Mexican Pacific coasts. Sci. Mar. 70, 139–145. doi: 10.3989/scimar.2006.70n1139
Karlsson, S., Saillant, E., and Gold, J. R. (2009). Population structure and genetic variation of lane snapper (Lutjanus synagris) in the northern Gulf of Mexico. Mar. Biol. 156, 1841–1855. doi: 10.1007/s00227-009-1217-y
Kent, J. T. (1994). The complex Bingham distribution and shape analysis. J. R. Stat. Soc. Ser. B Stat. Methodol. 56, 285–299. doi: 10.1109/TPAMI.2008.234
Lara-Lara, J. R., Arenas, V., Bazán, C., Díaz, V., Escobar, E., García, M. C., et al. (2008). Los Ecosistemas Marinos. Capital Natural de México. 1: Conocimiento actual de la biodiversidad. México: CONABIO, 135–159.
Lucano-Ramírez, G., and Michel-Morfín, J. E. (1997). Ciclo reproductivo y aspectos poblacionales de Mugil curema (Valenciennes, 1836) (Pisces: Mugilidae) en la laguna costera Agua Dulce Jalisco, México. Oceanología 1, 105–115.
Marcus, L. F., Corti, M., Loy, A., Naylor, G. J. P., and Slice, D. (eds) (1996). Advances in Morphometrics. New York, NY: Nato ASI series Plenum Press.
Nirchio, M., Oliveira, C., Siccha-Ramirez, R., Sene, V. F., Sola, L., Milana, V., et al. (2017). The Mugil curema species complex (Pisces. Mugilidae): a new karyotype for the Pacific white mullet mitochondrial lineage. Comp. Cytogenet. 2, 225–237. doi: 10.3897/CompCytogen.v11i2.11579
O’Higgins, P., and Jones, N. (2006). Tools for Statistical Shape Analysis. Heslington: Hull York Medical School.
Pacheco-Almanzar, E. (2019). Conectividad Entre Poblaciones de Mugil Curema (Pisces: Mugilidae) en el Golfo de México y Pacífico mexicano. Ph.D Thesis, México: Universidad Autonoma Metropolitana.
Pacheco-Almanzar, E., Ramírez-Saad, H., Velázquez-Aragón, J. A., Serrato, A., and Ibáñez, A. L. (2017). Diversity and genetic structure of white mullet populations in the Gulf of Mexico analyzed by microsatellite markers. Estuar. Coast. Shelf. S. 198, 249–256. doi: 10.1016/j.ecss.2017.09.015
Pinheiro, A., Teixeira, C. M., Rego, A. L., Marques, J. F., and Cabral, H. C. (2005). Genetic and morphological variation of Solea lascaris (Risso, 1810) along the Portuguese coast. Fish. Res. 73, 67–78. doi: 10.1016/j.fishres.2005.01.004
Poulet, N., Berrebi, P., Crivelli, A. J., Lek, S., and Argillier, C. (2004). Genetic and morphometric variations in the pikeperch (Sander lucioperca L.) of a fragmented delta. Arch. Hydrobiol. 159, 531–554. doi: 10.1127/0003-9136/2004/0159-0531
Prieto-Ríos, E., Solís-Marín, F. A., Borrero-Pérez, G. H., and Díaz-Jaimes, P. (2014). Filogeografía de Holothuria (Halodeima) inornata Semper, 1868 (Echinodermata: Holothuroidea). Rev. Peru. Biol. 21, 155–162. doi: 10.15381/rpb.v21i2.9818
Rohlf, F. J. (2019). Tps-dig. Freeware, Chaps. Available at: https://life.bio.sunysb.edu/morph/soft-dataacq.html (accessed July 22, 2019).
Salini, J. P., Milton, D. A., Rahman, M. J., and Hussain, M. G. (2004). Allozyme and morphological variation throughout the geographic range of the tropical shad, hilsa Tenualosa ilisha. Fish. Res. 66, 53–69. doi: 10.1016/S0165-7836(03)00124-3
Samaee, S. M., Patzner, R. A., and Mansour, N. (2009). Morphological differentiation within the population of Siah Mahi, Capoeta capoeta gracilis, (Cyprinidae, Teleostei) in a river of the south Caspian Sea basin: a pilot study. J. Appl. Ichthyol. 25, 583–590. doi: 10.1111/j.1439-0426.2009.01256.x
Secretaría de Medio Ambiente, Recursos Naturales y Pesca (SEMARNAP), (2017). Anuario estadístico. (de)Acuacultura y Pesca 2017. México: Secretaría de Medio Ambiente, Recursos Naturales y Pesca, 300.
Silva, D. M., Da Cruz, A. D., Bastos, R. P., Telles, M. P. C., and Diniz-Filho, J. A. F. (2008). Morphometric and genetic differentiation among populations of Eupemphix nattereri (Amphibia, Anura, Leiuperidae) from central Brazil. Iheringia, Sér. Zool. 98, 493–500. doi: 10.1590/S0073-47212008000400013
Spalding, M. D., Fox, H. E., Allen, G. R., Davidson, N., Ferdaña, Z. A., Finlayson, F., et al. (2007). Marine ecoregions of the world: a bioregionalization of coastal and shelf Areas. BioScience 57, 573–583. doi: 10.1641/B570707
Staszny, Á, Havas, E., Kovács, R., Urbányi, B., Paulovits, G., Bencsik, D., et al. (2013). Impacts of environmental and genetic factors on the scale shape of zebrafish, Danio rerio (Hamilton 1822): a geometric morphometrics study. Acta. Biol. Hung. 64, 462–475. doi: 10.1556/ABiol.64.2013.4.6
Swain, D. P., and Foote, C. J. (1999). Stocks and chameleons: the use of phenotypic variation in stock identification. Fish. Res. 43, 113–128. doi: 10.1016/S0165-7836(99)00069-7
Viera-Muñoz, A. (1979). Proyecto Cultivo de Lisa (Mugil curema y Mugil cephalus) en el Estado de Jalisco. Mexico City: Programa de inversiones públicas para el desarrollo rural. Departamento de Pesca, Mexico City, Mexico.
Villaseñor-Talavera, R. (1991). Determinación de una Escala de Madurez Sexual Específica y Ovocitos de la Lisa Blanca Mugil Curema (Valenciennes, 1836) de la Región Litoral Central de Nayarit, México. San Nicolás de los Garza, NL: Memorias del II Congreso Nacional de Ictiología.
Watkinson, D. A., and Gillis, D. M. (2005). Stock identification of Lake Winnipeg walleye based on fourier and wavelet description of scale outline signals. Fish. Res. 72, 193–203. doi: 10.1016/j.fishres.2004.11.002
Whitfield, A. K., Panfili, J., and Durand, J. D. (2012). A global review of the cosmopolitan flathead mullet Mugil cephalus Linnaeus 1758 (Teleostei: Mugilidae), with emphasis on the biology, genetics, ecology and fisheries aspects of this apparent species complex. Rev. Fish. Biol. Fish. 22, 641–681. doi: 10.1007/s11160-012-9263-9
Keywords: connectivity, white mullet, Gulf of Mexico, Central Pacific, geometric morphometrics
Citation: Pacheco-Almanzar E, Loza-Estrada N and Ibáñez AL (2020) Do the Fish Scales Shape of Mugil curema Reflect the Genetic Structure Using Microsatellites Markers and the Mexican Marine Ecoregions Classification? Front. Mar. Sci. 7:166. doi: 10.3389/fmars.2020.00166
Received: 09 December 2019; Accepted: 03 March 2020;
Published: 31 March 2020.
Edited by:
Alejandra Vanina Volpedo, University of Buenos Aires, ArgentinaReviewed by:
Alfonso Aguilar-Perera, Universidad Autónoma de Yucatán, MexicoRoberta Callicó Fortunato, University of Buenos Aires, Argentina
Copyright © 2020 Pacheco-Almanzar, Loza-Estrada and Ibáñez. This is an open-access article distributed under the terms of the Creative Commons Attribution License (CC BY). The use, distribution or reproduction in other forums is permitted, provided the original author(s) and the copyright owner(s) are credited and that the original publication in this journal is cited, in accordance with accepted academic practice. No use, distribution or reproduction is permitted which does not comply with these terms.
*Correspondence: Ana L. Ibáñez, YW5hQHhhbnVtLnVhbS5teA==
†ORCID: Ana L. Ibáñez, orcid.org/0000-0002-6062-9172