
95% of researchers rate our articles as excellent or good
Learn more about the work of our research integrity team to safeguard the quality of each article we publish.
Find out more
ORIGINAL RESEARCH article
Front. Mar. Sci. , 14 February 2020
Sec. Marine Biogeochemistry
Volume 7 - 2020 | https://doi.org/10.3389/fmars.2020.00033
 Haijiao LiuChao WuWenzhe XuXingzhou WangSatheeswaran ThangarajGuicheng Zhang
 Xiaodong ZhangYuying Zhao
 Jun Sun*
Shifts in phytoplankton phenology were observed in the Strait of Malacca (SM) and Sunda Shelf (SS), which were speculated to be potentially related to global warming and climate anomaly events. Such interactions between phytoplankton structure and physico-chemical factors were less known in narrow straits. Therefore, the spatial distribution pattern and diversity of surface phytoplankton assemblage, local hydrology, and nutrient regimes were investigated over the SM and SS (South China Sea, SCS) during 2017 and 2018 pre-monsoon season (spring). Diatoms, dinoflagellates, and cyanobacteria were representatives of microphytoplankton in the survey area. Total phytoplankton abundance peaked near Singapore Strait (SGS) and diminished toward SS. From the lower ratio of diatoms to dinoflagellates (<3) in SS, we deduced lower carbon pump efficiency here. In agreement with the modeled results proposed previously, cold conditions (negative Indian Ocean Dipole, IOD) were more suitable for high diatom (especially centric forms) abundance, while warm scenarios (positive IOD/El Niño period as in 2017) seemed to favor dinoflagellates and/or cyanobacteria. Specifically, diatom proportion increased by 30% and dinoflagellate, cyanobacteria reduced by 71%, 75% in response to shifts of climate anomaly from 2017 cruise to 2018 cruise. This study between field microalgae and physical and chemical conditions would be helpful to launch large-scale climate model, biogeochemistry, and carbon cycling in future research.
Coastal areas have been experiencing rapid economic growth, urbanization, and human population booming. Among these coastal areas, the Strait of Malacca (SM) is a major international passage connecting the Andaman Sea and South China Sea (SCS) (Te et al., 1998). For instance, Singapore is one of the worldwide busiest ports that lies between SM and SCS, and its coastal area has been brought in a vast amount of exotic ballast water by shipping traffics through the Singapore Strait (SGS) (Gin et al., 2000). Also, the Sunda Shelf (SS) is adjacent to the SGS, forming the southwestern part and occupying >50% of SCS. Due to sea-level changes, river systems, and channels, SS is featured by complex bottom topography and deep valley (Molengraaff and Weber, 1921; Stattegger et al., 1997; Szarek, 2001). Marine phytoplankton plays as the basis of aquatic food web, especially diatoms and dinoflagellates are considered as major contributors to ecosystem structure and functions (Margalef, 1978; Reynolds, 1997). Diverse sinking mechanisms in phytoplankton cells make them major contributors to marine biological pump (Guo et al., 2016; Sun et al., 2016). Their role in biogeochemistry and carbon cycling is huge, efficiently up-taking the micronutrient concentrations by photosynthetic function in upper oceans (Morel and Price, 2003).
Every coastal area in the world is threatened by harmful algae blooms (HABs) (Anderson et al., 2012). High frequency of occurrence of HABs has been increasingly reported in SM, resulting in intensive monitoring work and scientific research (Teen et al., 2012; Teng et al., 2014; Razali et al., 2015). Some major causative species have been recognized, e.g., toxic Pseudo-nitzschia spp. among diatoms and red tide-formers Ceratium spp. among dinoflagellates (Teng et al., 2014; Razali et al., 2015). Thus, those species can be considered as environmental indicators. HAB events in SM have an extremely adverse effect on fishery industry and mariculture (Anderson et al., 2012; Teen et al., 2012). In addition to HAB events, jellyfish blooms and some bioinvasion incidents can also take place here caused by a natural or human factor (Trottet et al., 2018). HAB species has the unique ability to supplement their biomass production by grazing or organic matter (Glibert et al., 2001). Hydrodynamics circulation in tropical SM and the adjacent SS are mainly driven by the East-Asia monsoon system. SM and SS are characterized by mixed water (Wyrtki, 1961). High nutrient loadings derived from rivers in SM contribute to frequent occurrences of HABs, especially in the near-coastal areas (Yusoff et al., 2001). The distinctly environmental gradients between SM and SS can lead to a difference in phytoplankton biomass and species composition even in intermonsoon season (Wang et al., 2015). The short generation time enables phytoplankton responding to global climate change rapidly (Neukermans et al., 2018). Beltram et al. (2019) observed rapid propagation in cyanobacterial mats during warm El Niño period and declined proliferation during cold La Niña period (Beltram et al., 2019). Besides, Vineetha et al. (2018) reported higher zooplankton abundance and heterogeneous distribution during El Niño period (Vineetha et al., 2018).
The majority of related phytoplankton research around the SM and SS has been focused on Singapore coastal area (Gin et al., 2000; Tkalich et al., 2002; Tan et al., 2016; Trottet et al., 2018). At the same time, several integrated study on phytoplankton diversity have been performed in SM (Te et al., 1998; Li et al., 2013; Siswanto and Tanaka, 2014) and SS (Ke et al., 2012; Zhixin et al., 2012; Ooi et al., 2013; Ke et al., 2014). As yet, there is a paucity of comprehensive interpretation of phytoplankton successions and interactions with diverse hydrodynamic properties between SM and the adjacent SS. Taking into account multiple environmental stressors, shifts and succession in phytoplankton assemblage structure are hypothesized to take place simultaneously. In this study, the main objectives were to document the microphytoplankton assemblage structure and succession in relation to dynamic environmental gradients from SM to SS. We hypothesized that global or regional climate anomaly would result in different phytoplankton composition, particularly, warm species/groups thrived under warm climatic condition, and cold species/groups occupied under an inversed climatic conditions. Besides describing their relationship with environments, surface water conditions across the SM and part of the SS in 1 year, we somehow attempted to associate the microphytoplankton group shifts with global warming and climate anomaly signals regarding a limited field dataset.
We conducted two cruises during 14th to 17th April 2017 and 22th March to 27th April 2018 on-board R/V SHIYAN3 over the Strait of Malacca and Sunda Shelf. Phytoplankton biodiversity and ecology investigations were carried out during the 2-year cruises. Specifically, surface water samples of phytoplankton and the related biogeochemical parameters were collected in the survey area. Sampling locations were displayed in Figure 1. The bottom depth of the survey area was shallow, with an average value of 79 m. Temperature and salinity data were derived from the Seabird Conductivity Temperature Depth (CTD, SBE 9/11 plus) profiler.
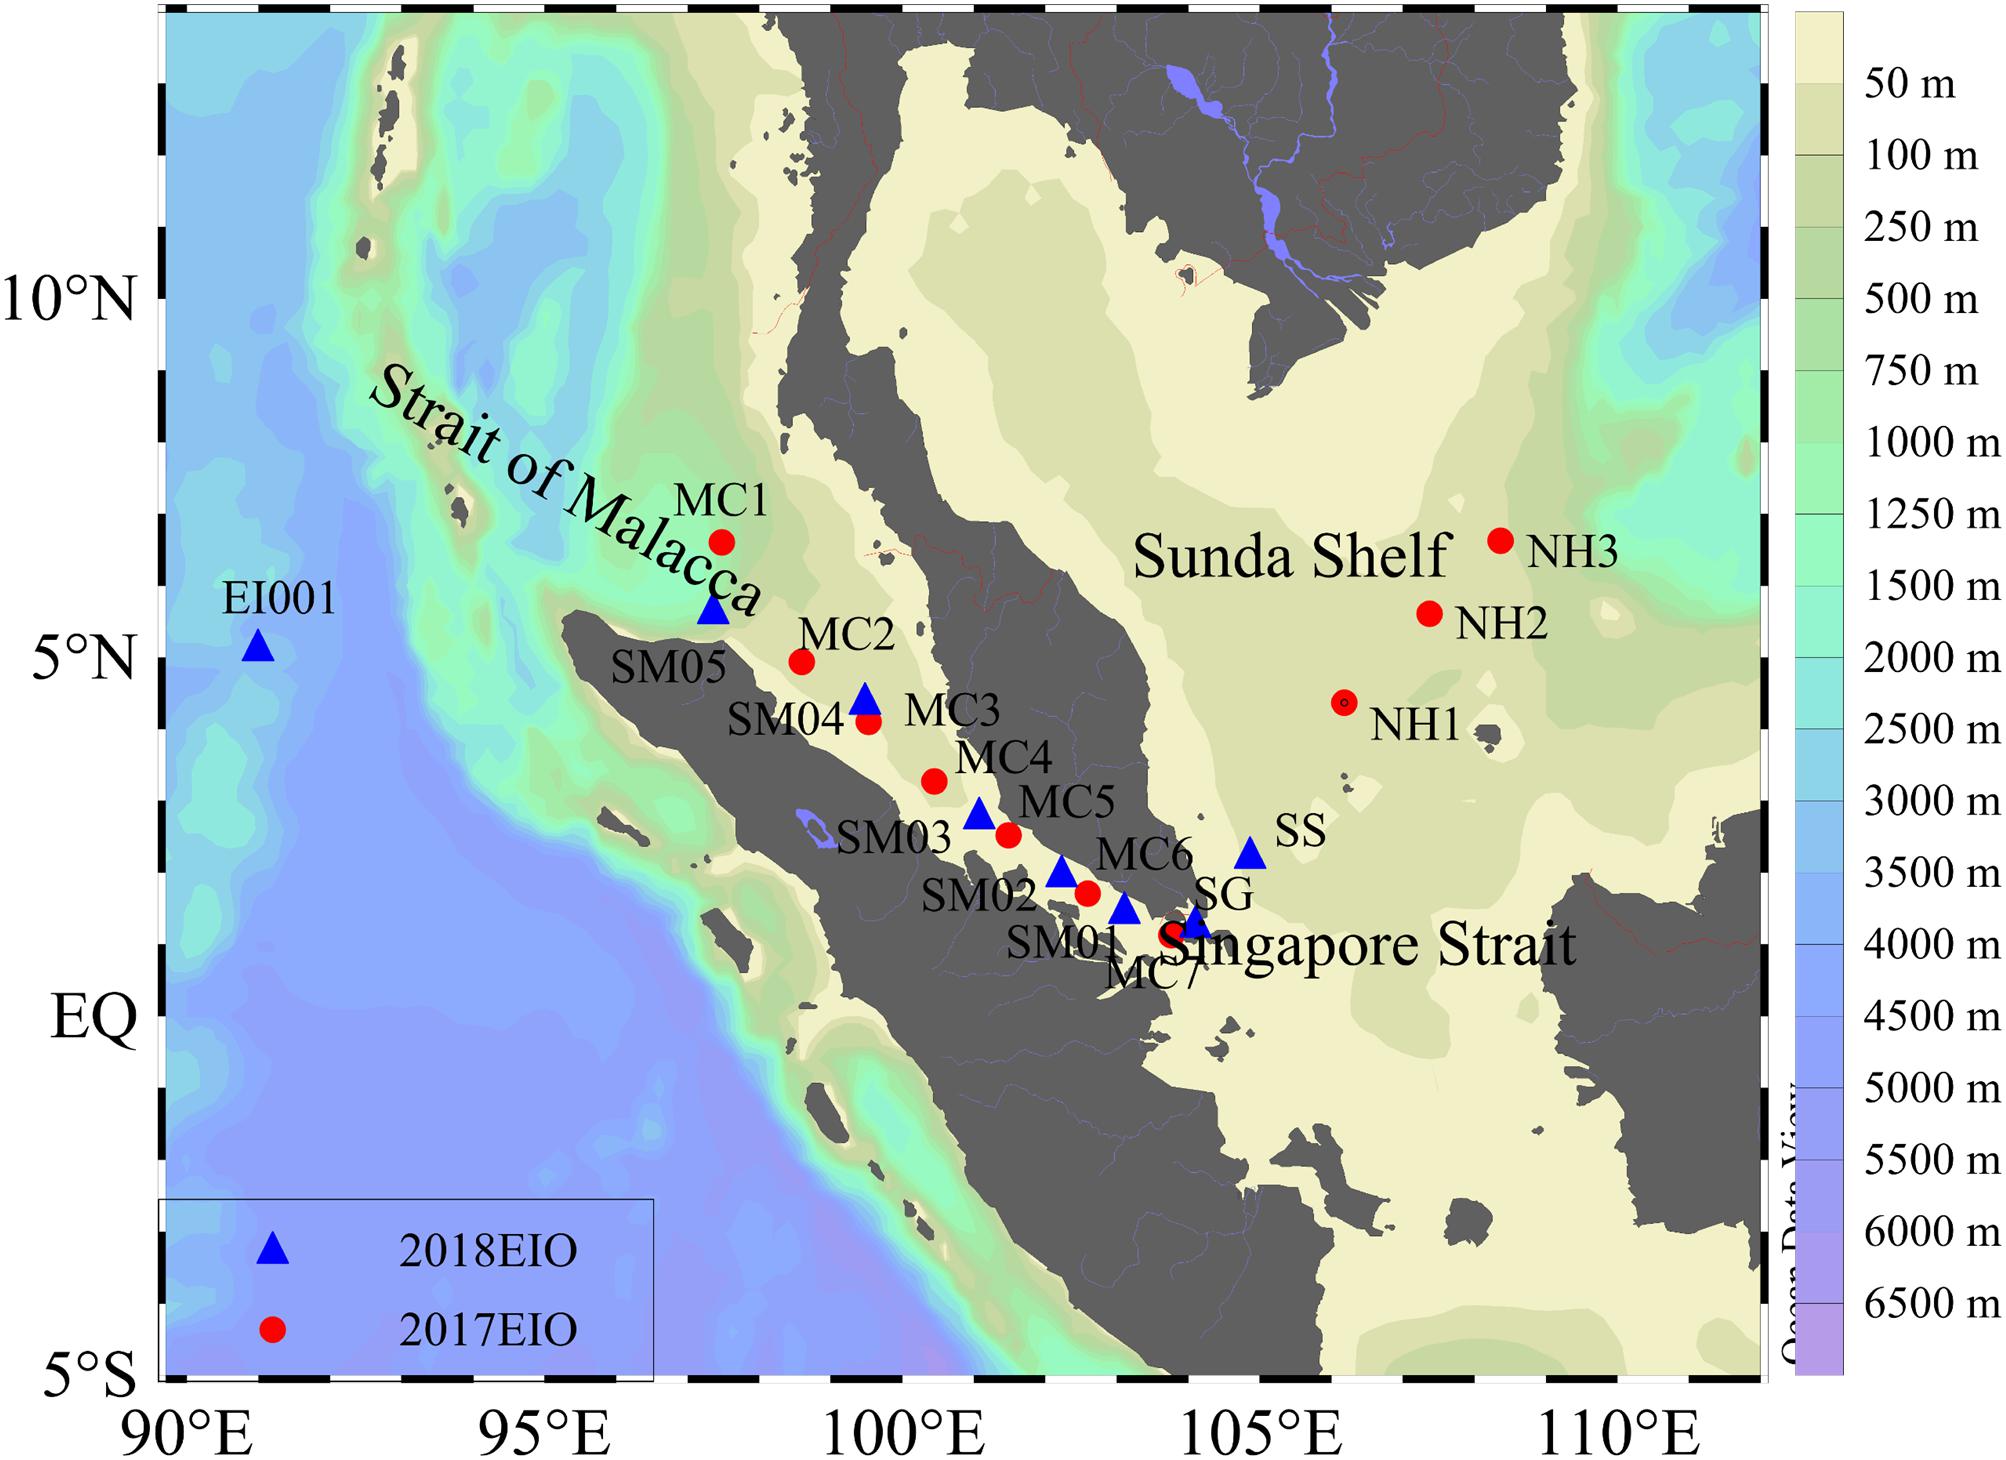
Figure 1. Sampling stations designed in the Strait of Malacca. Two kinds of symbols in the legend represent two cruises.
A total of 1000 ml water was taken from sea surface and fixed with 2% formaldehyde solution in plastic bottle. When back to laboratory, 1000 ml water sample in plastic bottle was condensed to 200 ml by siphoning method. Then taking out 100 ml for 24 h settlement in sedimentation column (Uthermöhl method) after gentle shake (Uthermöhl, 1958). Inverted microscope (Motic, AE2000) was applied for microphytoplankton cell enumeration and species identification under 200 or 400 magnification.
For chlorophyll a (chl a) sampling, a total of 1000 ml seawater was filtered through Whatman GF/F membrane with 25 mm diameter and freezed at −20°C. After the cruise finished, they were measured immediately in laboratory. Chl a measurement was followed by the protocol Parsons et al. (1984). Chl a membrane was extracted by 90% acetone and measured by Turner Trilogy (Turner Designs, San Jose, CA, United States). For nutrient sampling and determination, 100 ml seawater was filtered through 0.4 μm pore-size acetate cellulose filters (acid-clean) and then stored at −20°C. In the laboratory, five nutrient items (NO, NO, PO, SiO, NH) were automatically analyzed using an Autoanalyzer 3-AA3 (Bran + Luebbe, Norderstedt, Germany). Dissolved inorganic nitrogen (DIN), PO, and SiO were analyzed using the copper–cadmium column reduction method (Pai et al., 2001), and typical spectro-photometric methods, respectively (Dai et al., 2008). Here we used two forms of N (NOx: NO + NO) for nutrient ratio calculation considering potential contamination of ammonia in the measurements.
The spatial pattern of phytoplankton assemblages was plotted by Ocean Data View (ODV) software. Origin 8.5 PRO software was used for column graph of phytoplankton community structure. The Spearman’s rank correlation analysis between phytoplankton cell abundance and environmental variables, different alpha-diversities were acquired by referring published formulas (Sun and Liu, 2004). And global beta diversities and canonical corresponding analysis (CCA) were applied in PAST3 software1.
The surveyed stations included the SM and SS. The environmental parameters were listed in Table 1. SM was characterized by high sea surface temperature (SST), low sea surface salinity (SSS), while SS was characterized by low SST and high SSS (Figure 2). The salinity boundary for differentiating SM and SS was 33 psu as shown by T–S diagram (Figure 2C). On the average, SST (SSS) was 29.52°C (31.85) in SM and 28.97°C (33.77) in SS. Higher chl a biomass occurred in the vicinity of SGS, by contrast, lower chl a biomass was observed in SS. Specifically, average value of 2017 chl a biomass was 0.64 μg/L in SGS area, including St. MC4–MC7. Chl a biomass of SGS in 2018 (St. SM01–SM03, SG) was twice (1.45 μg/L) of 2017. Also, nutrient was in the same trend with chl a. Most of nutrient items in 2017 SGS were comparable with 2018 SGS, with the exception of phosphate (P) and silicate (Si), which was 0.03 and 3.22 μmol/L in 2017 SGS, 0.05 and 1.23 μmol/L in 2018 SGS. That led to extremely high N:P ratio and Si:N ratio in 2017 SGS. We showed nutrient ratios among different areas in Figures 3C,D. For convenience, area except SGS and SS was called as the SM. The scatter plot clearly showed that data points near SGS evenly distributed on both sides of N:P Redfield ratio line (dashed line, Figure 3C), while stations in SS and SM located below the reference line (<16:1). For Si:N ratio, almost all data points occurred above the Si:N Redfield ratio line (Figure 3D), i.e., >15:16. Therefore, most survey areas were subjected to N-limitation. As for the limited dataset, the shifts between zones and years were not significant (p > 0.5, t-test, two-tailed).
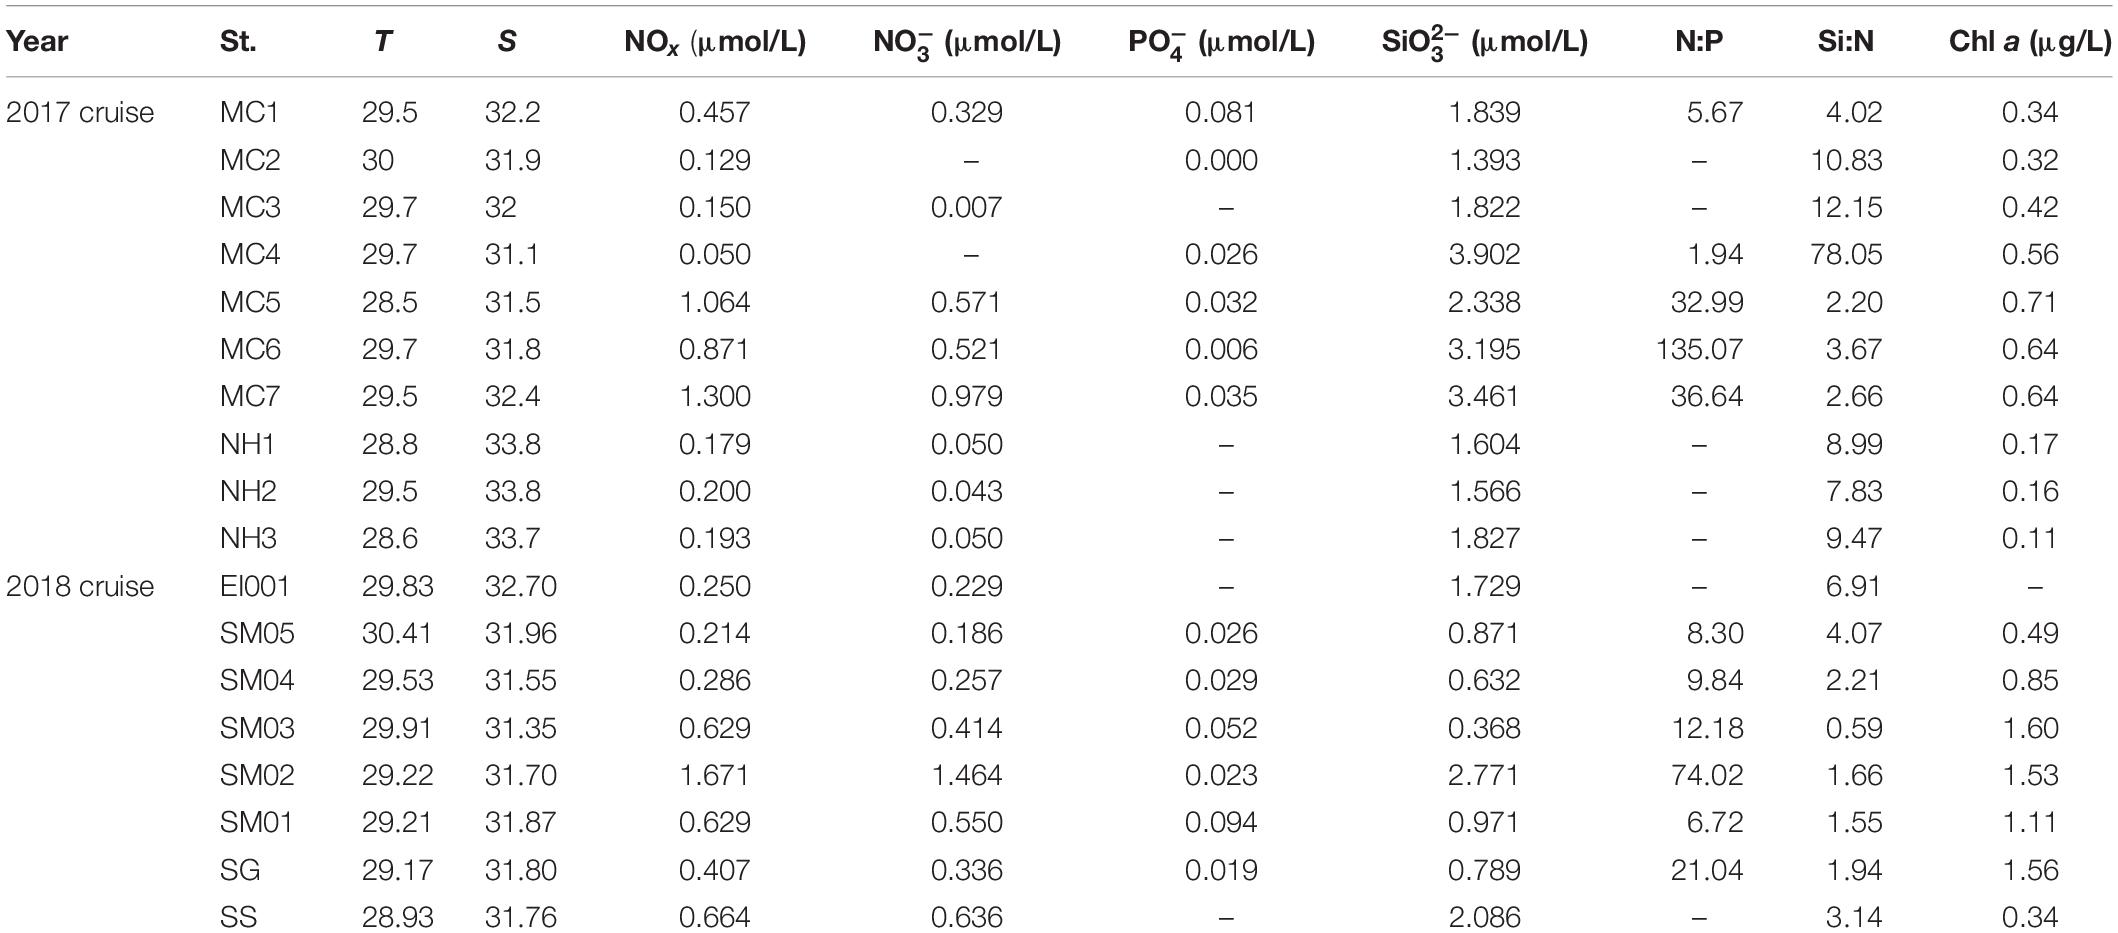
Table 1. Temperature (T), salinity (S), nutrients and chlorophyll a (chl a) in each station (St.).
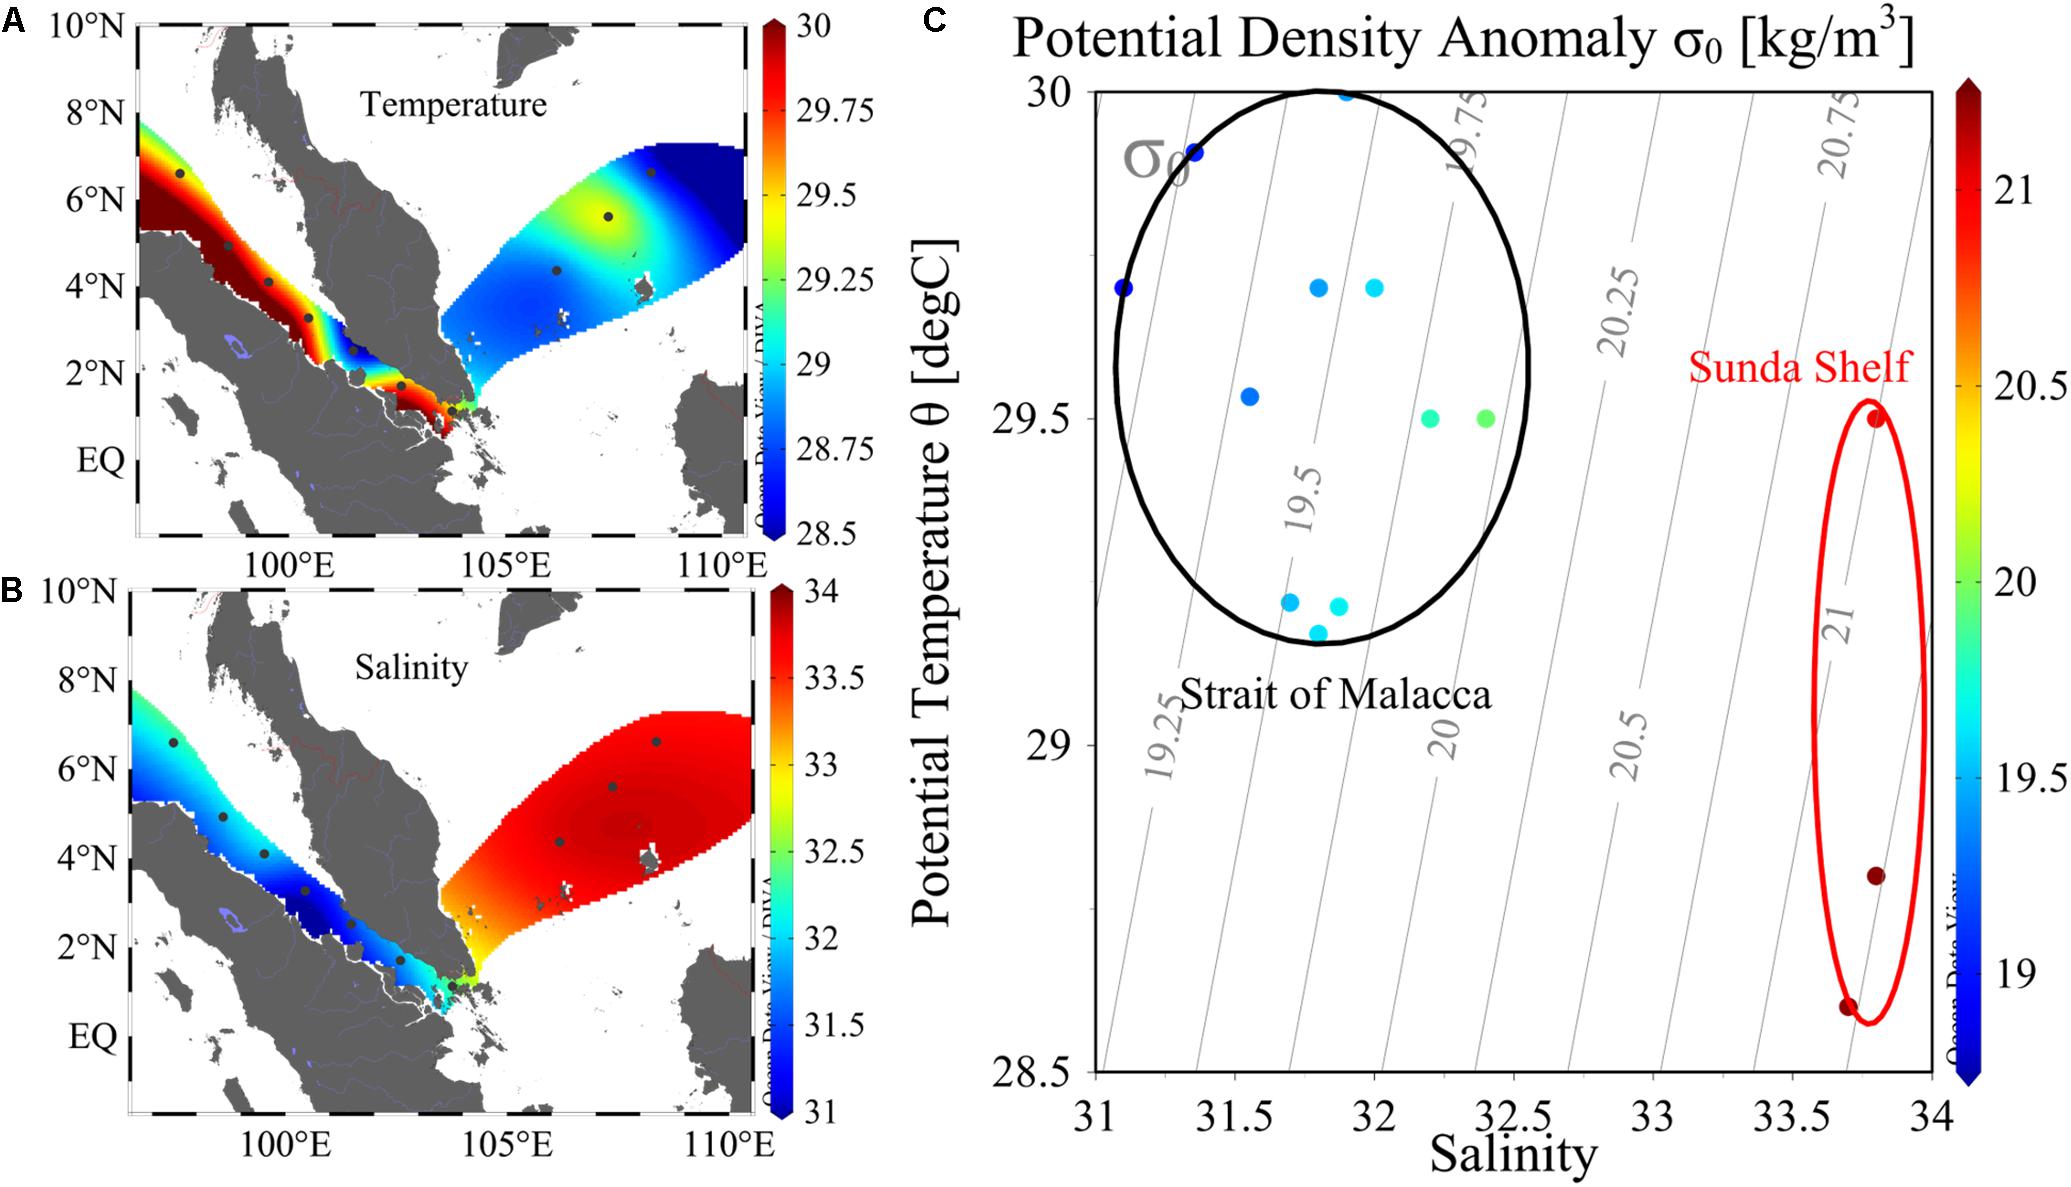
Figure 2. Horizontal distribution of temperature (A), salinity (B), and T-S diagram (C) in 2017 cruise. Data points within the black triangle characterized water in the Strait of Malacca, and data points within the red ellipse characterized water in the Sunda Shelf.
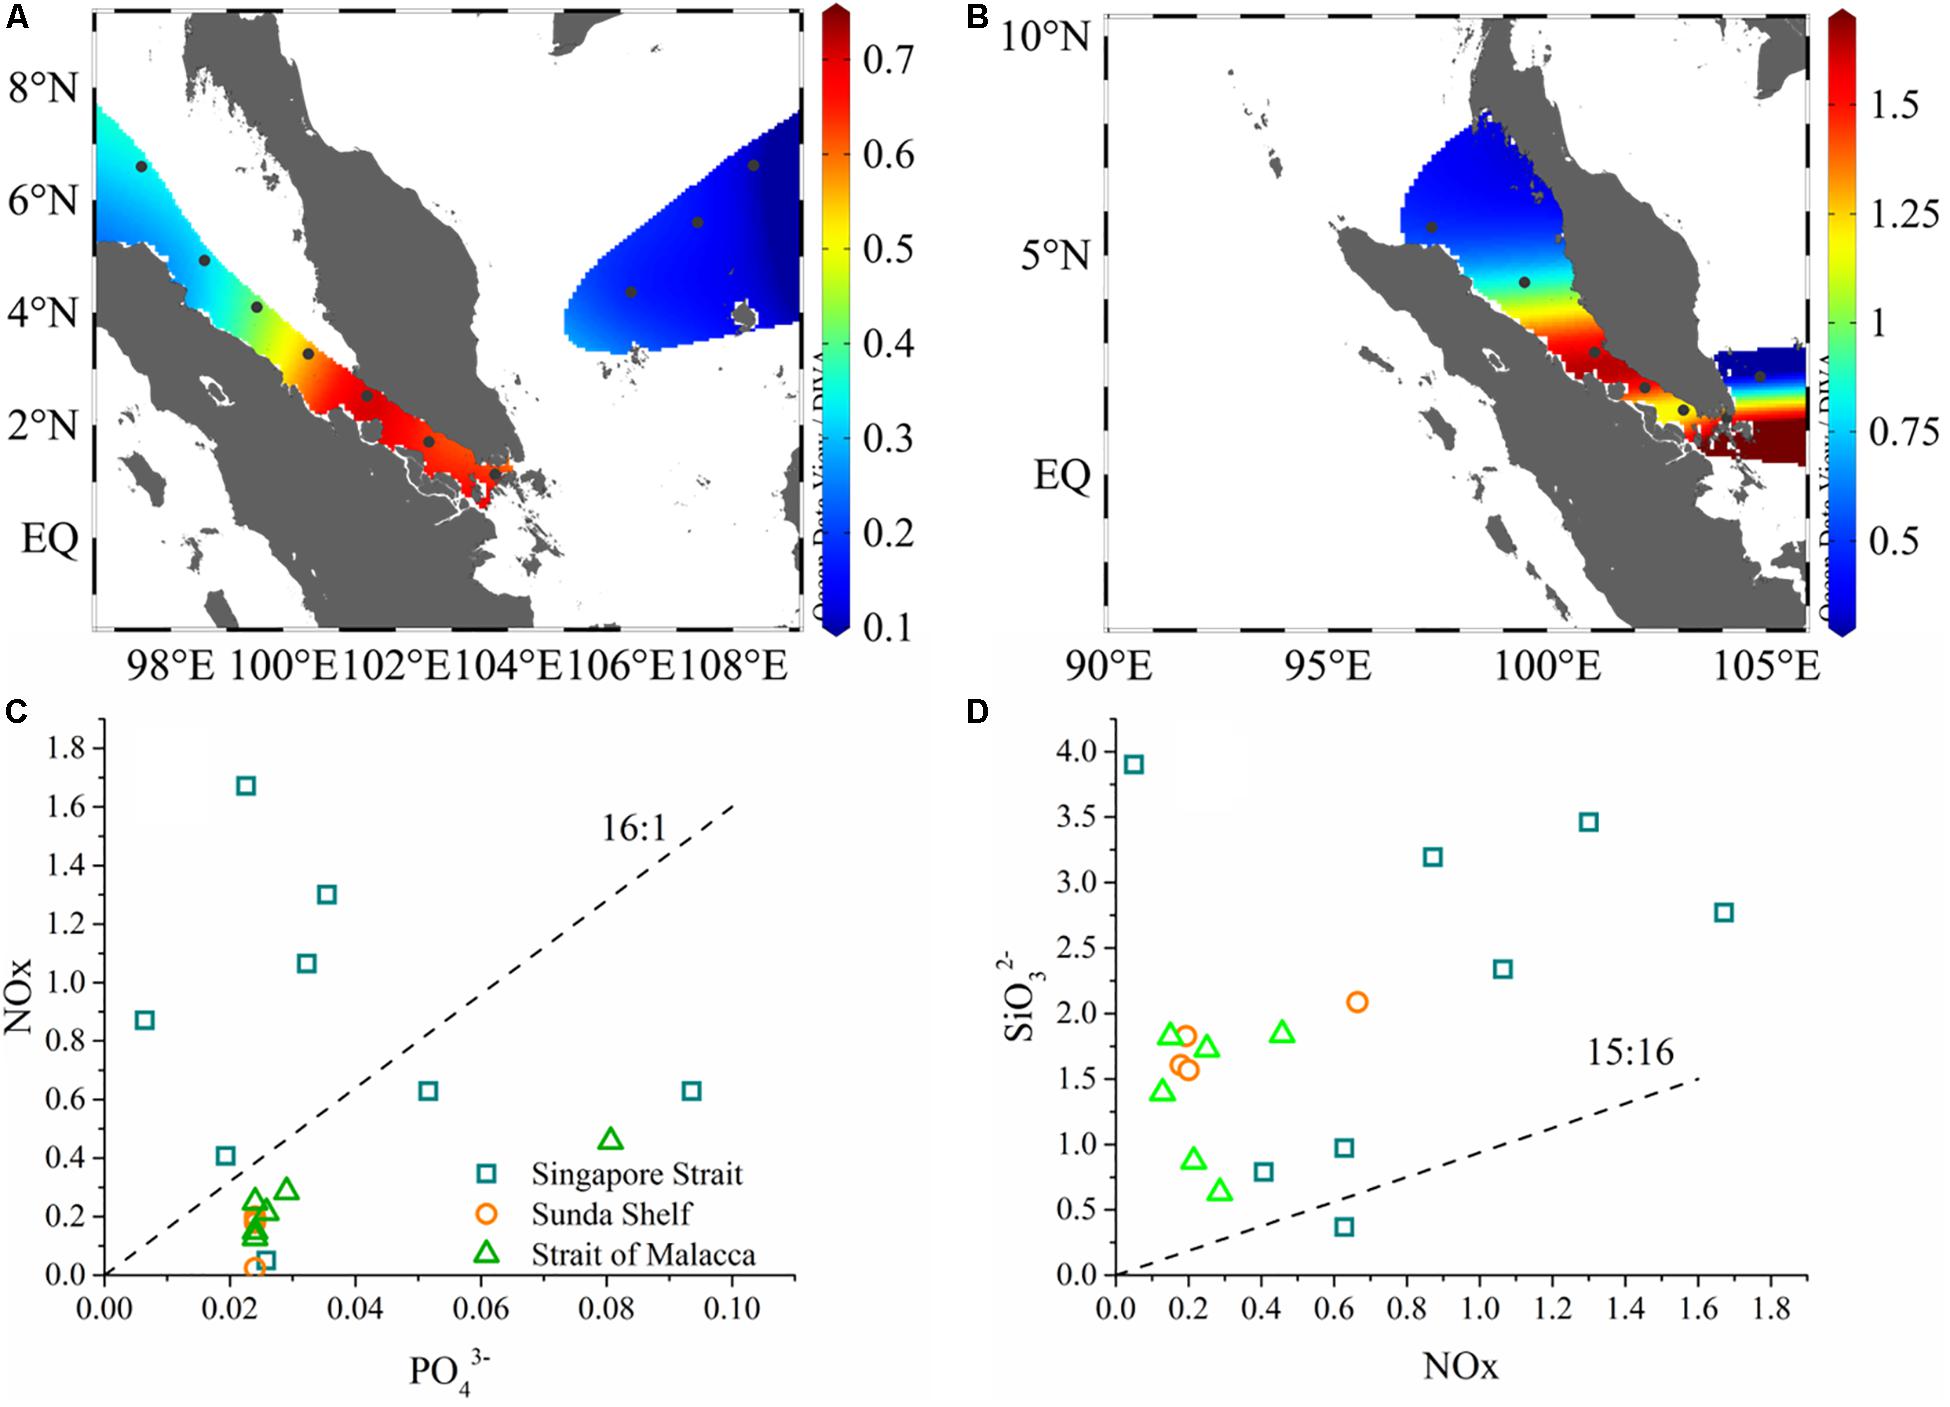
Figure 3. Horizontal distribution of chlorophyll a (A 2017, B 2018) and nutrient ratios (N:P, Si:N) (C,D) of two cruises.
In 2017 cruise, a total of 185 species were identified (Supplementary Table 1). Phytoplankton community was mainly composed of diatoms and dinoflagellates, and followed by cyanobacteria and chrysophytes. Common species were ranked based on dominance degree (Y) in Table 2. Diatom population was dominated by Thalassionema nitzschioides, Nitzschia spp., and Thalassiosira sp., etc. Dinoflagellates were predominantly dominated by Gymnodinium lohmannii and Prorocentrum lenticulatum. The maxima of dominance value was only 0.09. Diatoms and dinoflagellates accounted for 53.5 and 45.4% of total species number, respectively. In cyanobacteria, three groups were observed, including Trichodesmium spp., Richelia intracellularis, and Anabaenopsis sp. We recorded two species belonging to chrysophytes. Total cell abundance ranged from 83.6 to 4542.6 cells/L, with average value of 931.4 cells/L. As shown in Figure 4C, diatom contributed 19.4–98.2% (mean 65.8%) to total abundance, and dinoflagellate contributed 1.2–78.6% (mean 33.4%) to total abundance. The dominant diatom species, T. nitzschioides, Nitzschia spp., and Thalassiosira sp. were with an average abundance of 268.2, 97.9, and 68.2 cells/L. The predominant dinoflagellates, G. lohmannii and P. lenticulatum, attained 22.6 and 20 cells/L, respectively. The variation of abundance percentage among different regions was consistent with species number. The maxima of diatom abundance still appeared in SGS area. Cyanobacteria abundance was separately calculated, ranging 2.99–414.45 × 10³ cells/L (mean 106.25 × 10³ cells/L).
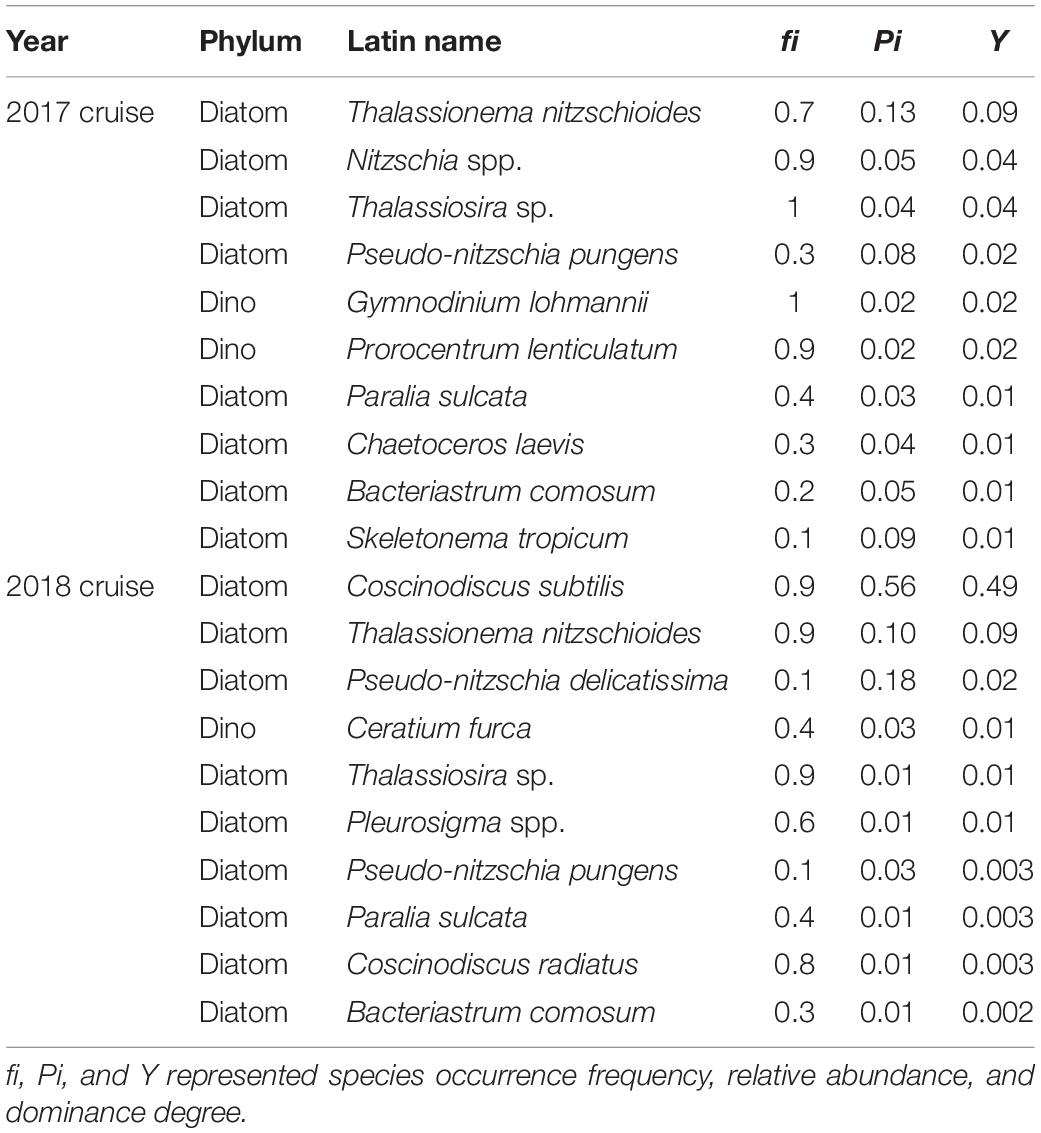
Table 2. List of 20 dominant species in two cruises.
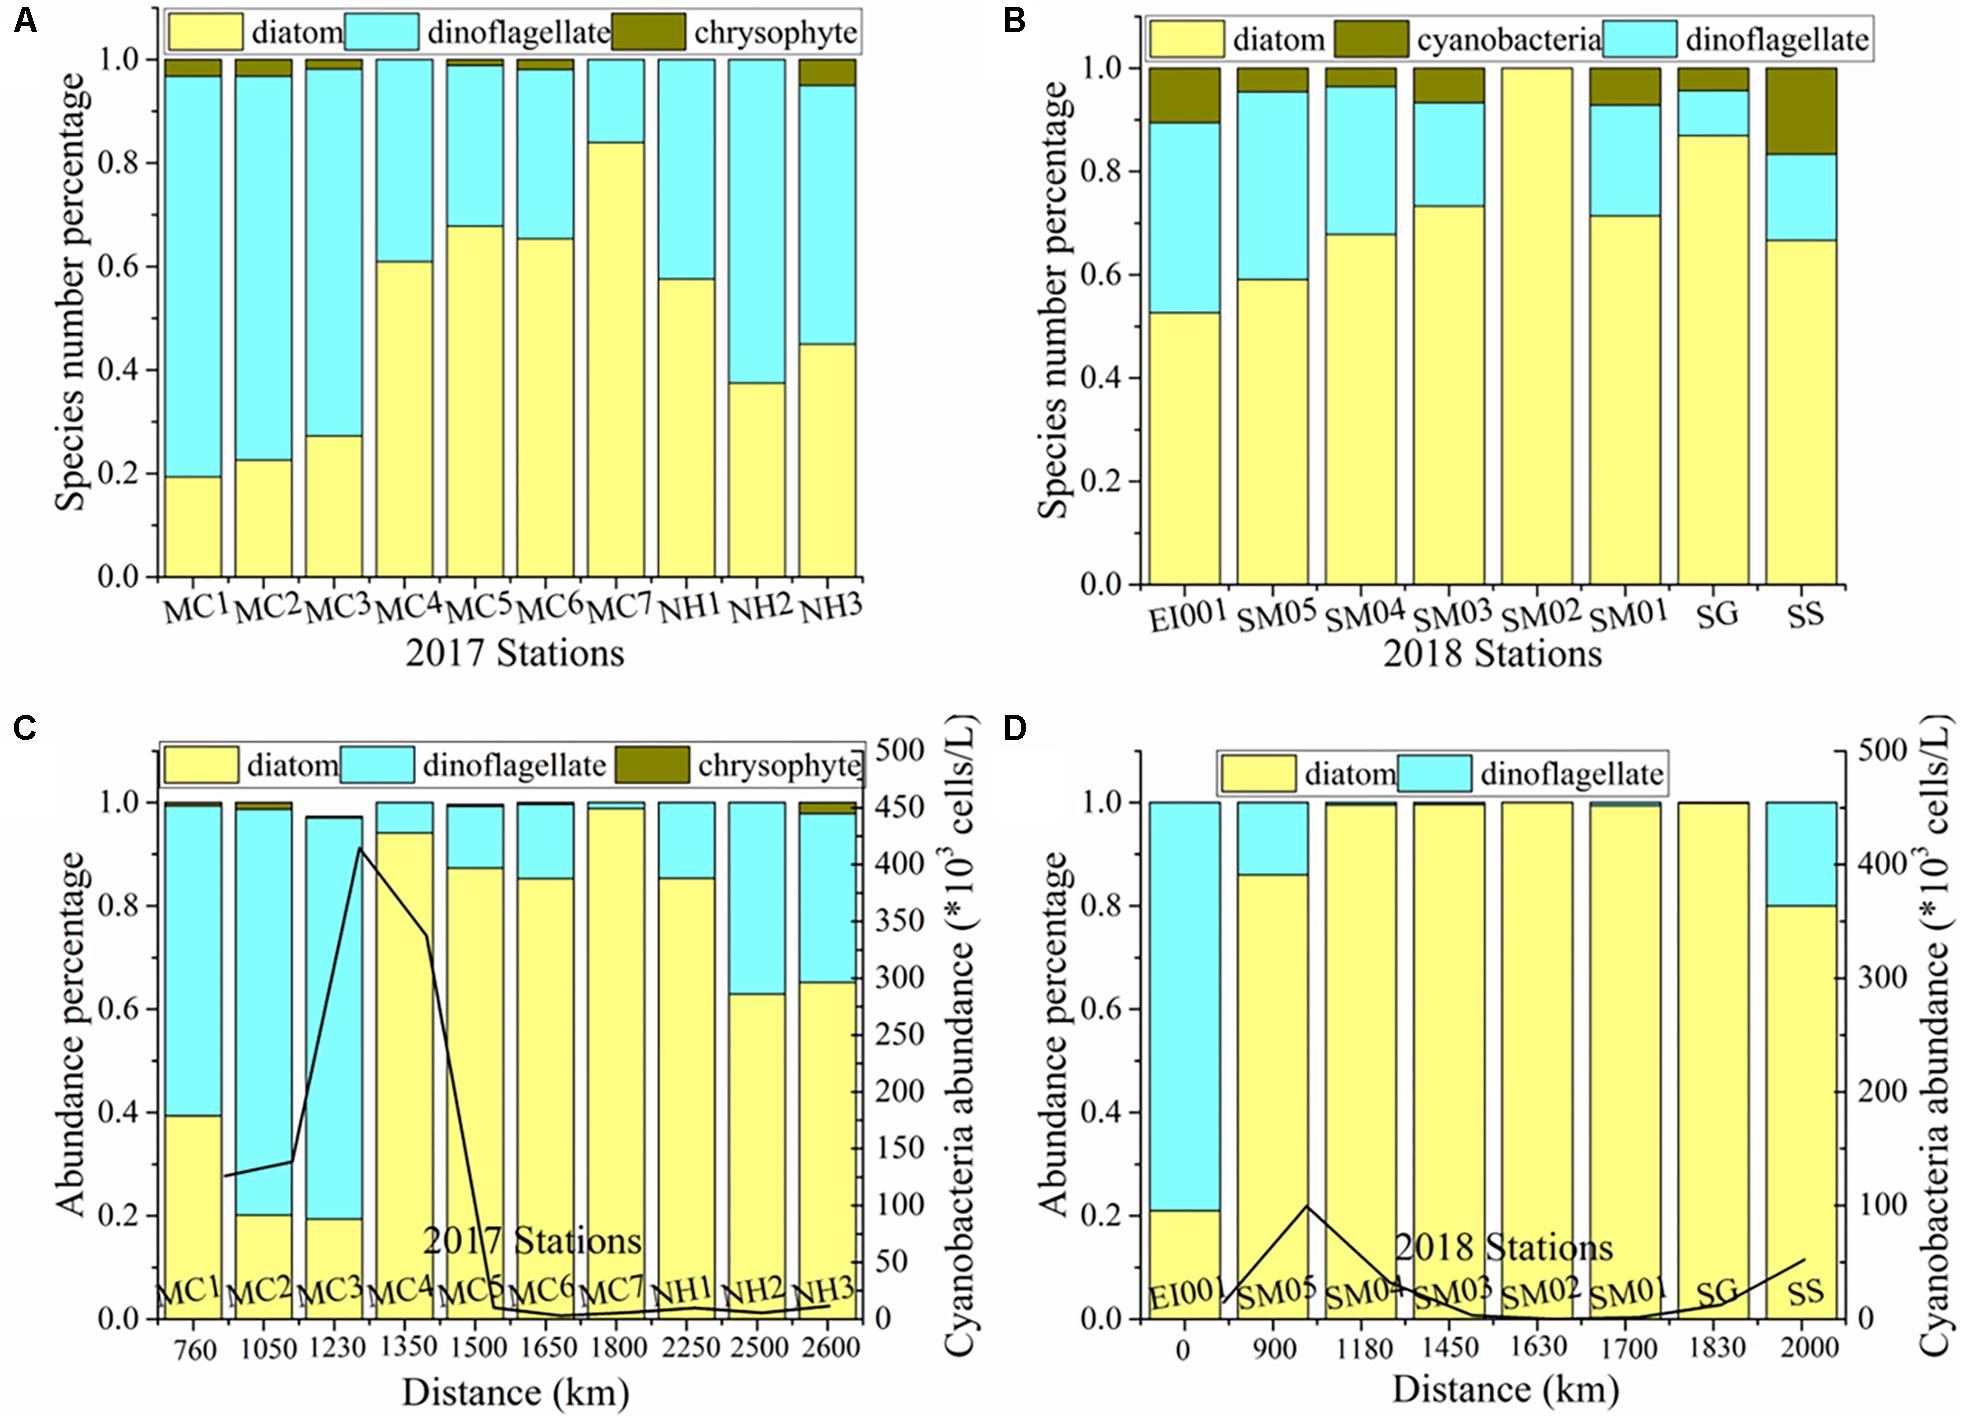
Figure 4. Phytoplankton species number percentage (A,B) and abundance percentage (C,D) among algae groups in each station of two cruises. Scaling bar is the geographical distance from St. EI001 (as an initial point).
In 2018 cruise, 61 species were identified (Supplementary Table 2), much lower than 2017 cruise. The whole community was basically dominated by diatoms, i.e., Coscinodiscus subtilis, T. nitzschioides, Pseudo-nitzschia delicatissima. Centric C. subtilis had highest dominance value (0.49). Ceratium furca exclusively controlled the dinoflagellate population. Diatoms and dinoflagellates contributed 63.9 and 32.8% to total species number, respectively. We observed two species in cyanobacteria., i.e., T. thiebaultii and R. intracellularis. From column chart of contribution percentage in individual station (Figure 4), it was notable that the proportion of diatom species number increased from the SM to SGS, and dinoflagellates were in an inversed condition (Figures 4A,B). Diatom proportion in SS was between that in SM and SGS. Total cell abundance ranged from 13 to 3018.1 cells/L, with average value of 1141.8 cells/L. As shown in Figure 4D, diatom contributed 21–100% (mean 85.7%) to total abundance, and dinoflagellate contributed 0–79% (mean 14.3%) to total abundance. Cyanobacteria abundance was lower in 2018, ranging from 0 to 99.58 × 10³ cells/L (mean 27.07 × 10³ cells/L). In summary of two cruises, dinoflagellates were major phytoplankton group in relatively open area, while diatoms mainly inhabited in narrow strait water.
Compound biodiversity indices based on different aspects of community structure were calculated in this study as shown in Table 3. We applied five common alpha-diversity indices aiming to describe the general traits of phytoplankton community: Shannon–Wiener (H′), Shannon evenness (J), Margalef (Dmg), Menhinick (DM), and Simpson index (D). The formulas were referred in the literature of Sun and Liu (2004). In 2017, the average value of H′, J, Dmg, DM, and D were 4.10, 0.78, 6.45, 1.84, and 0.10, respectively. As seen from their distribution pattern (Figure 5), higher value of H′, Dmg, and D occurred in SGS. The distribution of J value was totally contrary to H′ value. The distribution pattern of most indices was totally different with that in 2017, with the exception of Menhinick (DM) and Simpson index (D). The distribution pattern of DM and D was basically consistent in 2017 and 2018. In addition, we showed global beta-diversities. Overall, global beta-diversity values showed same annual variation with alpha-diversity values, which were lower in 2018 (Whittaker 2.63, Harrison 0.38, Cody 73) in comparison with 2017 (Whittaker 3.38, Harrison 0.38, Cody 260). Pairwise comparisons in all stations (Whittaker) were shown in Supplementary Tables 3, 4.
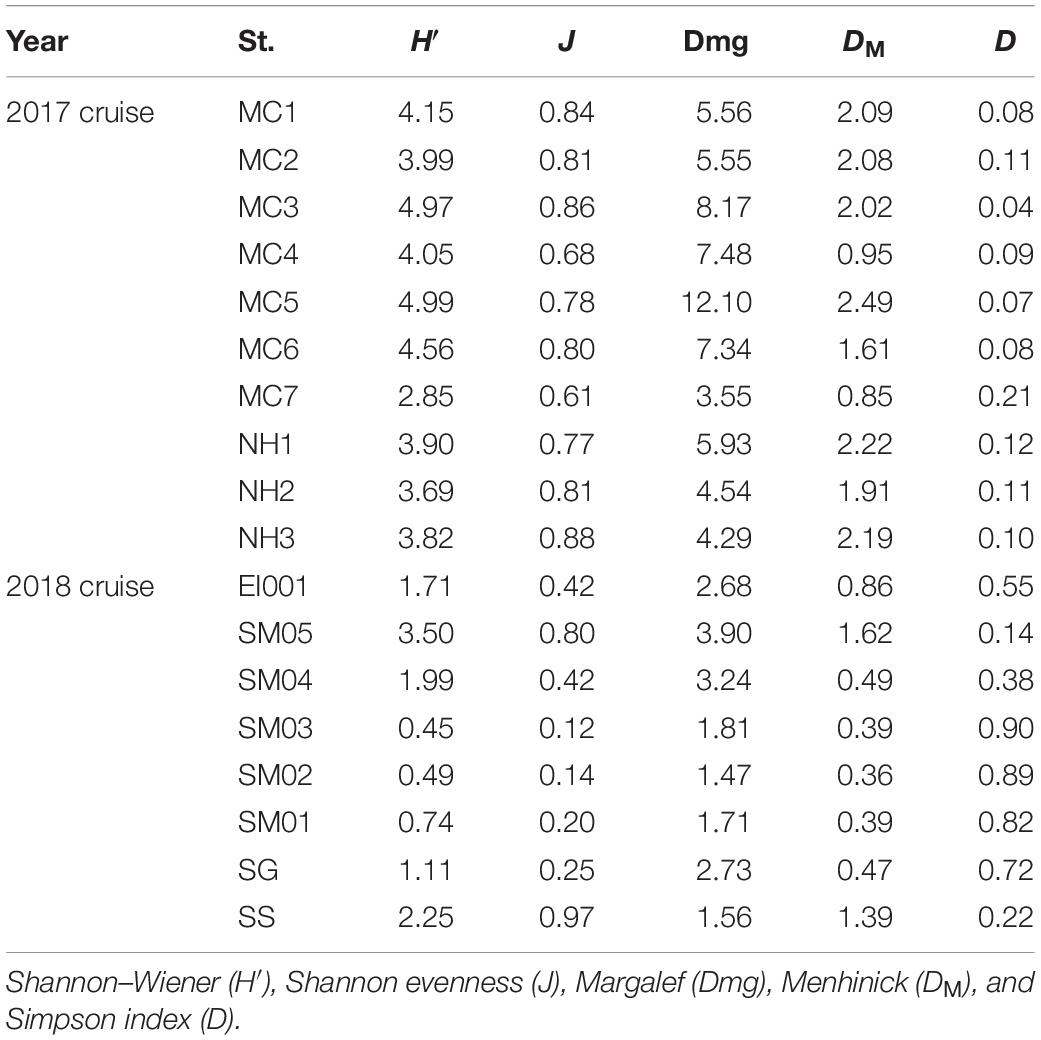
Table 3. Overview of biodiversity indices in phytoplankton community of two cruises.
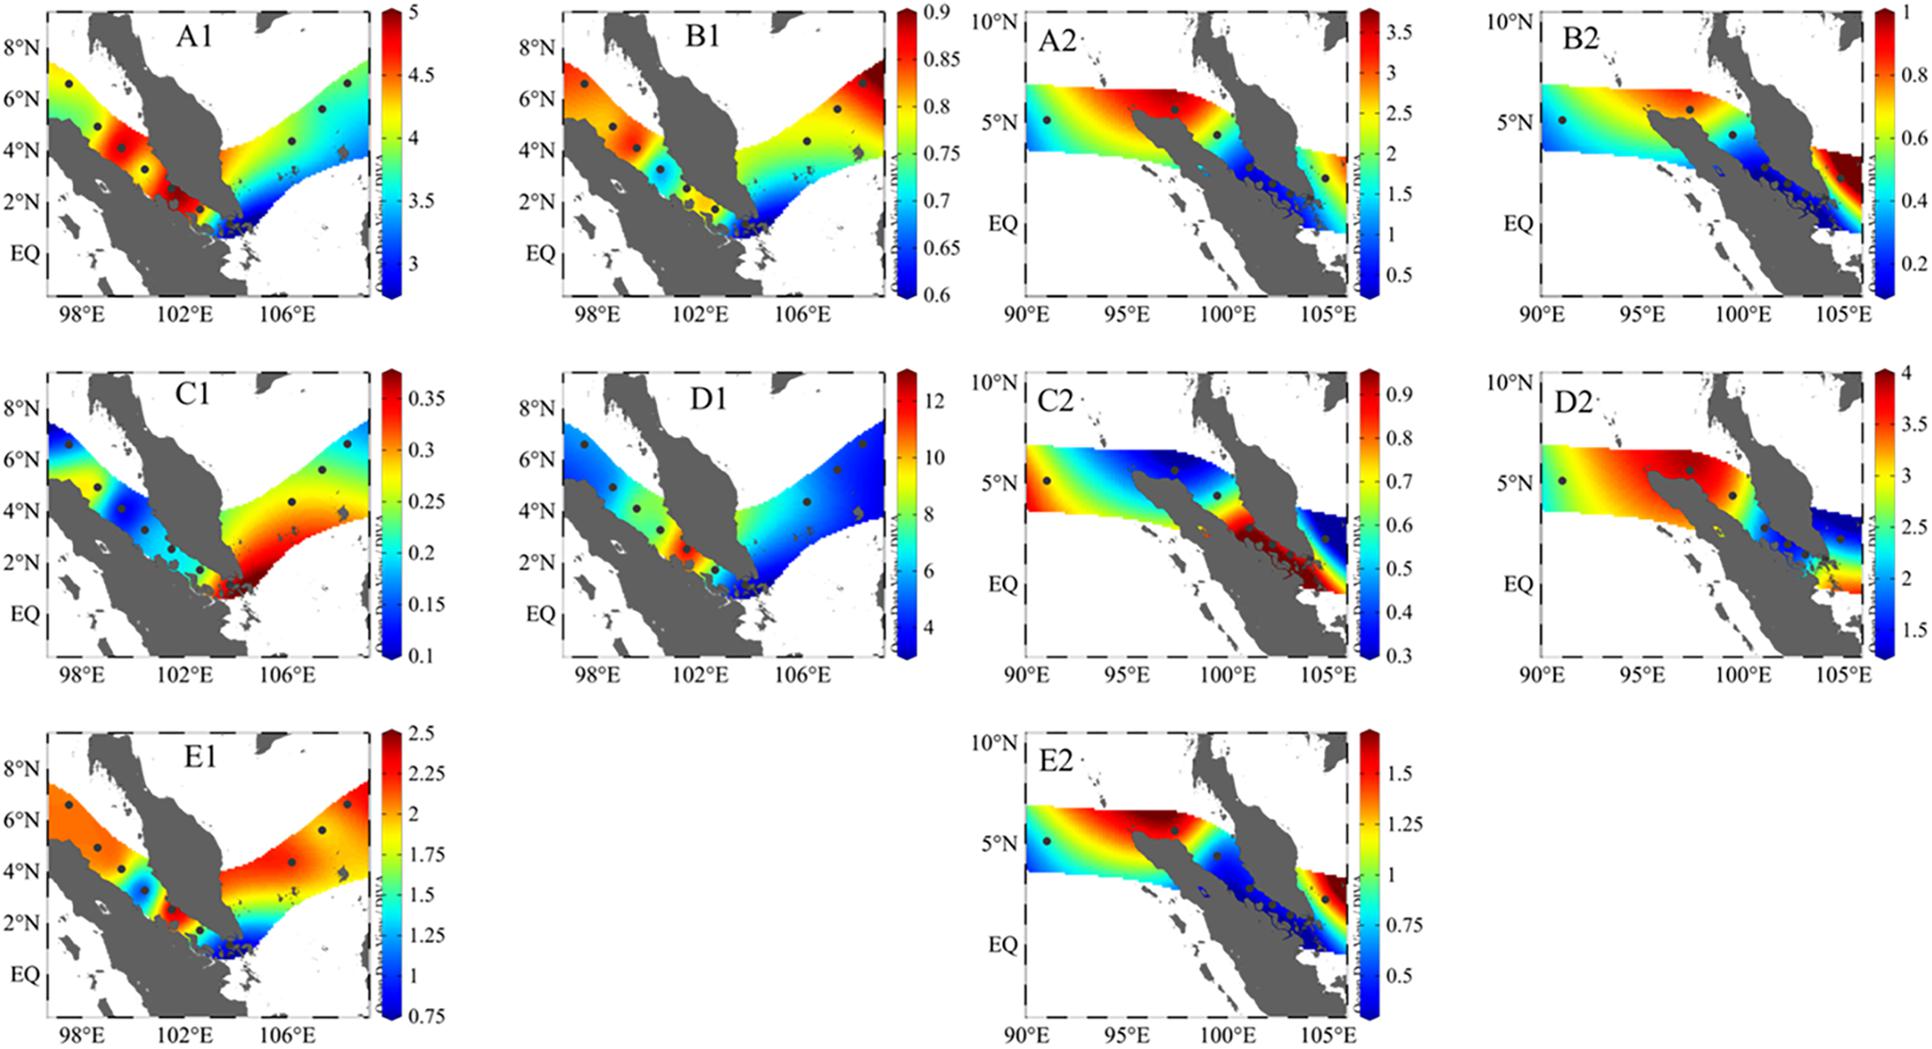
Figure 5. The distribution pattern of phytoplankton biodiversity indices in 2017 cruise (A1–E1) and 2018 cruise (A2–E2). Panels (A–E) Shannon–Wiener (H′), Shannon evenness (J), Margalef (Dmg), Menhinick (DM), and Simpson index (D).
The Spearman’s correlation analysis and CCA triplot were conducted to determine the influence of environmental parameters on different groups and specific dominant species (Figure 6). Total phytoplankton abundance showed absolutely negative correlation with salinity and positive correlation with chl a. Diatoms showed positive correlation to P-replete. Dinoflagellates inhabited in a prominently different environment, with lower NOx, chl a, and higher Si/N. Chrysophyte were less influenced by these factors. Cyanobacteria was significantly influenced by NOx and N:P ratio and positively correlated to temperature and phosphorus even with no significance. Then we analyzed the factors impact on specific dominant species in two cruises. As the most dominant diatom, T. nitzschioide (diatom1 in Figure 6) thrived in wide range of environmental gradients and was barely influenced by temperature, salinity, and nutrients (with lower scores in axis 1 and axis 2 were −0.44 and 0.20). Nitzschia spp. (diatom2) was keeping positive relation to NOx, P, and chl a. Thalassiosira sp. (diatom3) was both negatively associated with axis1 and axis2, while C. subtilis (diatom4) was in a totally reversed situation. P. delicatissima (diatom5) was greatly affected by environmental gradients along axis 2, specifically, it was negatively correlated to Si/N and Si. P. sulcata (diatom6) and C. laevis (diatom7) were extremely related to two axes. P. sulcata favored lower temperature with enriched nutrients. While C. laevis preferred higher temperature with lower N and P. There was a common feature in dominant dinoflagellates, the three species G. lohmannii, P. lenticulatum, and C. furca. (dino1–3) inhabited in surface oligotrophic water with stable structure, even with low scores (<0.6). For sample matrix, stations near SGS showed positive scores along axis 1, while stations near SM showed negative scores along axis 1 (scores not shown here).
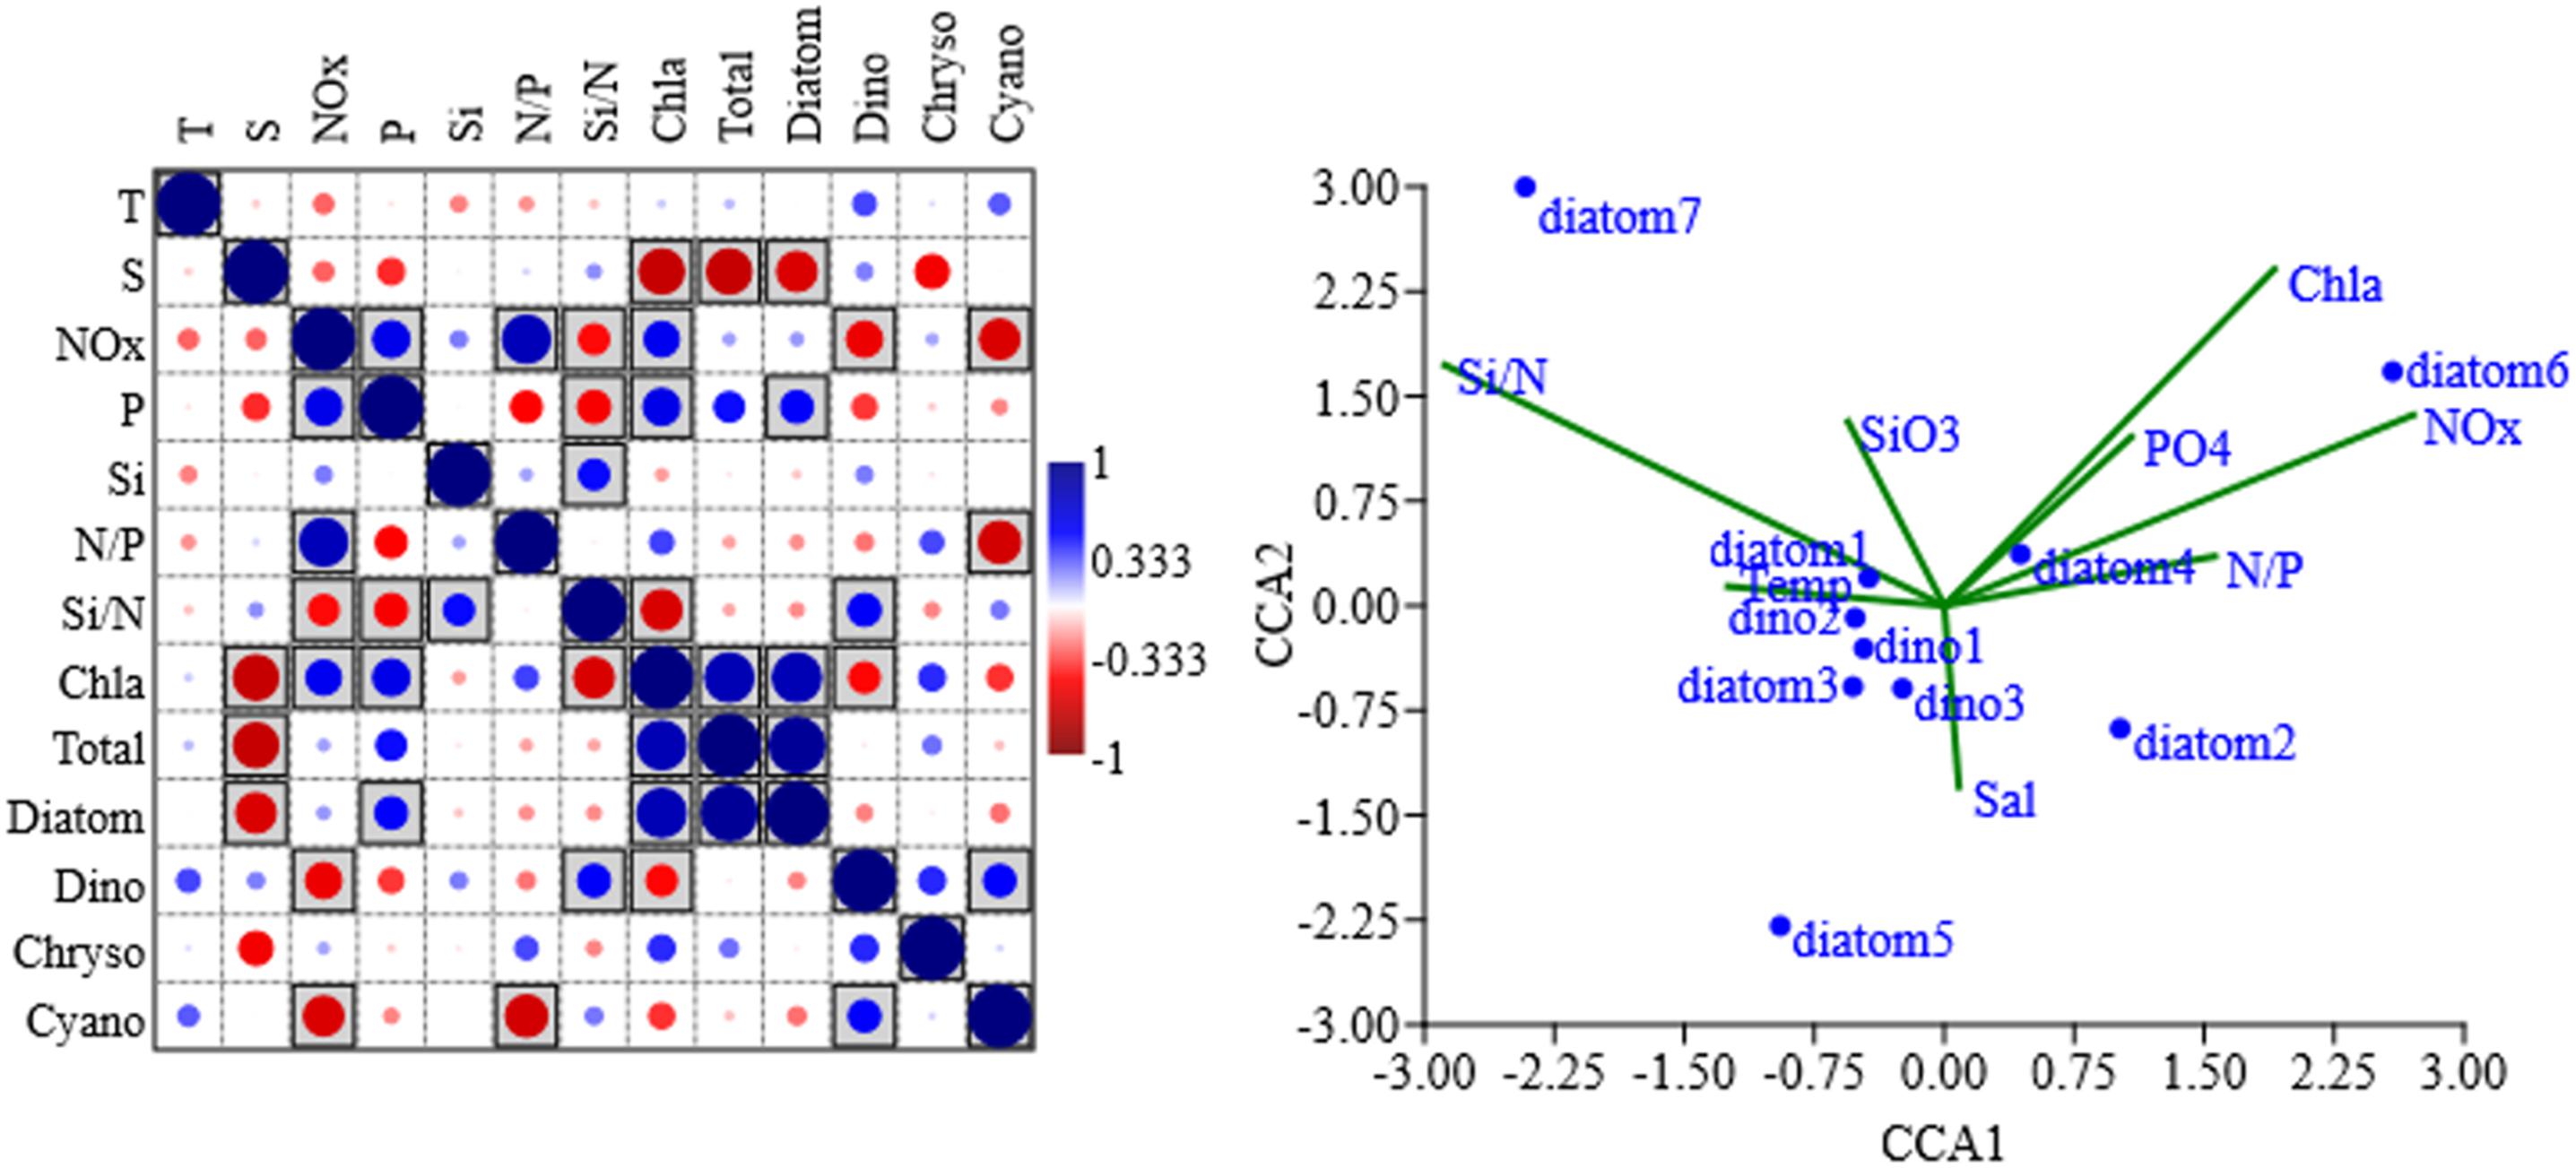
Figure 6. Spearman’ correlation between different algae groups and environment factors (Left) and CCA triplot of dominant species (Right). p < 0.05 in square box dot color and size represented correlation value; there were 10 response variables: diatom1–7 represent Thalassionema nitzschioides, Nitzschia spp., Thalassiosira sp., Coscinodiscus subtilis, Pseudo-nitzschia delicatissima, Paralia sulcata, Chaetoceros laevis, dino1–3 represent Gymnodinium lohmannii, Prorocentrum lenticulatum, Ceratium furca; eight explanatory variables: temperature (Temp), salinity (Sal), chlorophyll a (Chla), NOx, PO (PO4), SiO, N/P, Si/N. Sample and species score matrix in CCA and Spearman correlation matrix were shown in Supplementary Tables 5, 6, respectively.
In dynamic coastal environments, microphytoplankton was the remarkable competitors in comparison with picoplankton and nanoplankton (Gin et al., 2000). Total chl a biomass in present intermonsoon season was relatively lower (<2 μg/L) compared to the published monsoon season (summer and winter) (Gin et al., 2000). This may be the result of water stratification during intermonsoon period. Gin et al. (2000) reported that microphytoplankton of Singapore coastal water approximately contributed 60% of total chl a sizes in the case of <3 μg/L and this proportion would increase with enhanced total chl a standing stocks. As reported in early study, major spring bloom and minor winter bloom typically occurred in SGS, dominated by Chaetoceros and Coscinodiscus (Ah Kow, 1973). Recently, Trottet et al. (2018) emphasized the importance of resting strategy occurring in phytoplankton to Singapore coastal harmful blooms. From their point of view, Singapore blooms may be caused by the secondary growth of cysts which were flushed into the water by tidal force. Recently, toxic species within Pseudo-nitzschia genus in SM were considered as a research hotspot due to their noxious effects on aquatic organisms (Teng et al., 2014). We detected the toxigenic algae P. delicatissima and P. pungens in St. SM04, MC4, and MC5, respectively. More than 15 species in Pseudo-nitzschia genus can produce toxin (Fernandes et al., 2014). More and more frequent harmful blooms occurred in SM, intensive monitoring researches were carried out here (Lim et al., 2012; Teen et al., 2012). Singapore as the second largest port, potential invasive species from ship ballast water could impact local habitat destruction (Gollasch et al., 2000; Joachimsthal et al., 2004; Cooper et al., 2007; Trottet et al., 2018). Besides, Singapore experienced remarkable changes over the last centuries, man-made habitat, rapid economic development, considerably affected marine organisms and their biodiversity (Tan et al., 2016).
In our study, Chaetoceros only appeared in 2017, and Coscinodiscus subtilis was the most predominant species in St. SG of 2018. The minimum windforce and thus small water turbulence during the intermonsoon may be the reason for April/May phytoplankton bloom in SGS (Ah Kow, 1973). Besides, there was a notable decline of temperature and salinity near SGS (St. SM02, MC5) due to river discharge from Barumun and Perak Estuary (Wang et al., 2015). All the factors contributed to higher phytoplankton abundance in SGS. In this area, Rezai et al. (2003) reported a higher zooplankton biomass on account of river run-off and coastal mangrove forests (Rezai et al., 2003). In SM to SGS, as for phytoplankton regime, we found a shift from dinoflagellates to diatoms (increasing diatom proportion in Figure 4). Wang et al. (2015) analyzed the reason for enhanced diatom preponderance in Singapore coastal water, that was due to the increased pollution from land-based source and ship traffic in this narrow stretch. Higher nutrient (NOx and SiO) and chl a biomass were detected here (Table 1 and Figures 3A,B) and potential effects of nutrient limitation on phytoplankton were discussed here. The intruded water from southern SCS also had an influence on phytoplankton assemblage in SGS. And N-limitation was more severe in other regions except in SGS as indicated in Figure 3, leading to lower diatom percentage both in species richness and abundance. Considering the water exchange with Andaman Sea, it could have an impact on marine phytoplankton in SM region (Siswanto and Tanaka, 2014). All the factors enhanced the heterogeneity of phytoplankton distribution pattern.
Compared to diatoms, dinoflagellates should be less susceptible to physical and chemical factors (e.g., temperature and nutrients) (Xiao et al., 2017). Dinoflagellates were with high preponderance in stations around the SM. They tended to thrive in higher temperature with less nutrient concentration (Xiao et al., 2017). Therefore, dinoflagellates in SM stations occupied more than 50% of total phytoplankton abundance and species richness, especially in 2017 (Figure 4). Corresponding to surface N-limitation, higher temperature and a slight P-limitation, cyanobacteria thrived in SM. The relations to cyanobacteria was also reported by Wu et al. (2019). Their reported temperature, salinity, and P were controlling factors for diazotroph community in the eastern Indian Ocean. Cyanobacteria is one of the most abundant diazotrophs thriving in the upper oligotrophic ocean (Kong et al., 2011). We observed two N2 fixing groups in cyanobacteria: filamentous Trichodesmium spp. and symbiotic R. intracellularis (diatom–diazotroph symbioses). Those diazotroph species can utilize N2 in atmosphere and therefore did not depend on seawater nitrogen. As seen from the relations to physico-chemical variables in Spearman’s rank matrix, cyanobacteria and dinoflagellates had some overlaps in their ecological niches.
Different from the water system in SM and SGS, SS was characterized by relatively low temperature and high salinity (Figure 2). And all nutrient items were with low concentrations here. This regime resulted in higher proportion of picoplankton biomass, which was with resistance to oligotrophic condition (Turpin and Harrison, 1979). As proposed previously, in low-biomass SS stations, pico-sized biomass contributed >80% in all sized phytoplankton biomass (Wang et al., 2015). In our findings, diatoms and dinoflagellates were less competitive in SS as seen from their low absolute abundance. As a group, the phytoplankton situation here was similar with that in the northwestern SM. In Ke et al.’s (2014) study at the same survey season with ours, they observed low phytoplankton density and low ratios of diatoms to dinoflagellates (diat/dino < 5) occurring in SS compared to other regions in SCS. Similarly, in our study, diat/dino were as low as 3 (in 2017). In consideration of low sinking rate in dinoflagellates (Guo et al., 2016), we speculated that biological carbon pump had lower efficiency in SS than SM. As close geographic relations between SS and SCS, the oceanographic conditions in SCS have influence on SS. The surface-water circulation in SCS is affected by east Asian monsoon system (Wyrtki, 1961). In wet season (included our investigation period), surface current from SCS flow southward into Java Sea through Karimata Strait (Fang et al., 2012). Shallow upwelling signal was recorded at the rim area of SS in October to December (Chao et al., 1996). Generally, there are four major oceanic currents affecting the SS and southern SCS (Hu et al., 2000). Under the circumstance of monsoon system and water circulation, phytoplankton assemblages can propagate among different sectors in SCS, and further these will influence local marine ecosystem structure and functions.
Besides the regional factors on oceanographic condition and phytoplankton growth, anthropogenic perturbation and ocean–atmosphere interaction also impact phytoplankton dynamics in the SM given its geographic position between Indian Ocean and Pacific Ocean (Siswanto and Tanaka, 2014). As discussed in the final section, diatoms tended to survive in enriched cold water, while dinoflagellates and cyanobacteria were apt to oligotrophic warm water. While the shifts in phytoplankton community was not monotonous, with special climate events, they would experience some fluctuation. During the investigation period (March–May), positive Indian Ocean Dipole (IOD) and warm El Niño incident happened in 2017, and negative IOD and cold La Niña incident happened in 20182. During positive IOD and El Niño period, severe droughts induced wildfires introduced plenty of micro- and macro-nutrients into the water via atmospheric aerosol deposition (Abram et al., 2003). It undoubtedly provoked phytoplankton growth in SM. While the situation was totally different in negative IOD and La Niña year. Results showed that the abundance of cyanobacteria in 2017 was 3.9 times of 2018 (p = 0.17; t-test, two-tailed), corresponding to warm El Niño (positive IOD) events and cold La Niña (negative IOD) events. Under the process of global warming and anthropogenic eutrophication in the future ocean, modeling study showed that marine diatoms and dinoflagellates in coastal water would be restructured (Xiao et al., 2017). In their prediction, surface diatoms will be reduced by 19% and surface dinoflagellates will be enhanced by 60%. Response to climate fluctuation, from 2017 warm El Niño event to 2018 cold La Niña event, diatom abundance increased by 30% (p = 0.57; t-test, two-tailed), while dinoflagellates decreased by 71% (p = 0.03; t-test, two-tailed). Within diatoms, the centric form C. subtilis began to proliferate in 2018 cold year. Centric diatoms are more inclined to thrive in cold temperature than during early spring (Sommer et al., 1986). Differently, pennate diatoms are more competitive in warm and P-enriched eutrophic water than the cold-adapted centric diatoms (Sommer, 1989). Diatoms and dinoflagellates are distinctively different strategists, R-strategist and multiple-strategist, respectively (Brun et al., 2015). Higher N:P ratio was more beneficial to species with slow growth rate (e.g., dinoflagellates) (Glibert and Burkholder, 2011). The N:P ratio in 2017 was higher (42 ± 24) than that in 2018 (22 ± 11), therefore dinoflagellates were favored in 2017. The result shown here was coincident with the published model study in the coastal sea (East China Sea) (Xiao et al., 2017). As a group, the long-term global change process, special events, and nutrient ratio are all responsible for phytoplankton successions in marine ecosystem.
In the present investigation, we determined microscopic phytoplankton community structure, biodiversity indices, and nutrient conditions in the SM and SS during pre-summer monsoon periods of 2017 and 2018. The geological and oceanographic setting was remarkably different among SM, SG, and SS. From N:P and Si:N ratios, we could draw the conclusion that most stations in the study area were influenced by N-limitation. Diatoms, dinoflagellates, and filamentous cyanobacteria dominated the whole phytoplankton assemblages. The representatives of diatoms, dinoflagellates, and cyanobacteria were T. nitzschioides, C. furca, and Trichodesmium thiebaultii, respectively. We found a shift in phytoplankton assemblage structure from diatoms to dinoflagellates and cyanobacteria in response to local hydrology and potentially associated with global climate fluctuations (more observations are needed to confirm this effect). Comparing 2017 warm El Niño event (positive IOD) with 2018 cold La Niña event (negative IOD), cold-adapted diatom proportions increased by 30%, while warm-adapted dinoflagellates and cyanobacteria reduced by 71 and 75%. Our findings would deepen the insights of phytoplankton structure shifts in a series of narrow straits and had ecological implications for global climate anomaly incidents in the future research.
The raw data supporting the conclusions of this article will be made available by the authors, without undue reservation, to any qualified researcher.
JS designed the experimental scheme, article framework, and did the manuscript revision. HL wrote the manuscript. HL, CW, WX, XW, and YZ attended the cruises and did the sampling work. ST polished the manuscript language. GZ was responsible for nutrient measurement. XZ gave suggestive comments on this draft, revised the manuscript, and accomplished the radioactive isotope measurement. All authors read and approved the final manuscript to be published.
The present research work was funded by the National Natural Science Foundation of China (41876134, 41706184, 41676112, and 41276124) and the Science Fund for University Creative Research Groups in Tianjin (TD12-5003), the Tianjin 131 Innovation Team Program (20180314), and the Changjiang Scholar Program of Chinese Ministry of Education of China (T2014253) to JS. Data and samples were collected onboard of R/V “Shiyan I” implementing the open research cruise NORC2017-10 supported by the NSFC Shiptime Sharing Project.
The authors declare that the research was conducted in the absence of any commercial or financial relationships that could be construed as a potential conflict of interest.
We would like to thank Prof. Dongxiao Wang at South China Sea Institute of Oceanology of Chinese Academy of Sciences for sharing the temperature and salinity data.
The Supplementary Material for this article can be found online at: https://www.frontiersin.org/articles/10.3389/fmars.2020.00033/full#supplementary-material
Abram, N. J., Gagan, M. K., McCulloch, M. T., Chappell, J., and Hantoro, W. S. (2003). Coral reef death during the 1997 Indian Ocean dipole linked to Indonesian wildfires. Science 301, 952–955. doi: 10.1126/science.1083841
Ah Kow, T. (1973). Seasonal Distribution of the Plankton in Singapore Straits MBAI Special Publication Dedicated to Dr. NK Panikkar. Kochi: Central Marine Fisheries Research Institute.
Anderson, D. M., Cembella, A. D., and Hallegraeff, G. M. (2012). Progress in understanding harmful algal blooms: paradigm shifts and new technologies for research, monitoring, and management. Ann. Rev. Mar. Sci. 4, 143–176. doi: 10.1146/annurev-marine-120308-081121
Beltram, F. L., Lamb, R. W., Smith, F., and Witman, J. D. (2019). Rapid proliferation and impacts of cyanobacterial mats on Galapagos rocky reefs during the 2014–2017 El Niño Southern Oscillation. J. Exp. Mar. Biol. Ecol. 51, 18–26. doi: 10.1016/j.jembe.2019.03.007
Brun, P., Vogt, M., Payne, M. R., Gruber, N., O’Brien, C. J., Buitenhuis, E. T., et al. (2015). Ecological niches of open ocean phytoplankton taxa. Limnol. Oceanogr. 60, 1020–1038. doi: 10.1002/lno.10074
Chao, S.-Y., Shaw, P.-T., and Wu, S. Y. (1996). Deep water ventilation in the South China Sea. Deep Sea Res. Part I 43, 445–466. doi: 10.1016/0967-0637(96)00025-8
Cooper, W. J., Jones, A. C., Whitehead, R. F., and Zika, R. G. (2007). Sunlight-induced photochemical decay of oxidants in natural waters: implications in ballast water treatment. Environ. Sci. Technol. 41, 3728–3733. doi: 10.1021/es062975a
Dai, M., Wang, L., Guo, X., Zhai, W., Li, Q., He, B., et al. (2008). Nitrification and inorganic nitrogen distribution in a large perturbed river/estuarine system: the Pearl River Estuary, China. Biogeosciences 5, 1227–1244. doi: 10.5194/bg-5-1227-2008
Fang, G., Wang, G., Fang, Y., and Fang, W. (2012). A review on the South China Sea western boundary current. Acta Oceanol. Sin. 31, 1–10. doi: 10.1007/s13131-012-0231-y
Fernandes, L. F., Hubbard, K. A., Richlen, M. L., Smith, J., Bates, S. S., Ehrman, J., et al. (2014). Diversity and toxicity of the diatom pseudo-nitzschia peragallo in the Gulf of Maine, Northwestern Atlantic Ocean. Deep Sea Res. PT II 103, 139–162. doi: 10.1016/j.dsr2.2013.06.022
Gin, K. Y.-H., Lin, X., and Zhang, S. (2000). Dynamics and size structure of phytoplankton in the coastal waters of Singapore. J. Plankton Res. 22, 1465–1484. doi: 10.1093/plankt/22.8.1465
Glibert, P. M., and Burkholder, J. M. (2011). Harmful algal blooms and eutrophication:“strategies” for nutrient uptake and growth outside the Redfield comfort zone. Chin. J. Oceanol. Limnol. 29, 724–738. doi: 10.1007/s00343-011-0502-z
Glibert, P. M., Magnien, R., Lomas, M. W., Alexander, J., Fan, C., Haramoto, E., et al. (2001). Harmful algal blooms in the chesapeake and Coastal Bays of Maryland, USA: comparison of 1997, 1998, and 1999 events. Estuaries 24, 875–883. doi: 10.2307/1353178
Gollasch, S., Lenz, J., Dammer, M., and Andres, H. G. (2000). Survival of tropical ballast water organisms during a cruise from the Indian Ocean to the North Sea. J. Plankton Res. 22, 923–937. doi: 10.1093/plankt/22.5.923
Guo, S., Sun, J., Zhao, Q., Feng, Y., Huang, D., and Liu, S. (2016). Sinking rates of phytoplankton in the Changjiang (Yangtze River) estuary: a comparative study between prorocentrum dentatum and Skeletonema dorhnii bloom. J. Mar. Syst. 154, 5–14. doi: 10.1016/j.jmarsys.2015.07.003
Hu, J., Kawamura, H., Hong, H., and Qi, Y. (2000). A review on the currents in the South China Sea: seasonal circulation, south china sea warm current and kuroshio intrusion. J. Oceanogr. 56, 607–624.
Joachimsthal, E. L., Ivanov, V., Tay, S. T., and Tay, J. H. (2004). Bacteriological examination of ballast water in Singapore harbour by flow cytometry with FISH. Mar. Pollut. Bull. 49, 334–343. doi: 10.1016/j.marpolbul.2004.02.036
Ke, Z., Tan, Y., Huang, L., Zhang, J., and Lian, S. (2012). Relationship between phytoplankton composition and environmental factors in the surface waters of southern South China Sea in early summer of 2009. Acta Oceanol. Sin. 31, 109–119. doi: 10.1007/s13131-012-0211-2
Ke, Z., Tan, Y., Ma, Y., Huang, L., and Wang, S. (2014). Effects of surface current patterns on spatial variations of phytoplankton community and environmental factors in Sunda shelf. Cont. Shelf Res. 82, 119–127. doi: 10.1016/j.csr.2014.04.017
Kong, L., Jing, H., Kataoka, T., Sun, J., and Liu, H. (2011). Phylogenetic diversity and spatio-temporal distribution of nitrogenase genes (nifH) in the northern South China Sea. Aquat. Microb. Ecol. 65, 15–27. doi: 10.3354/ame01531
Li, G., Lin, Q., Shen, P., Ni, G., Song, X., Wang, S., et al. (2013). Variations in silicate concentration affecting photosynthetic carbon fixation by spring phytoplankton assemblages in surface water of the Strait of Malacca. Acta Oceanol. Sin. 32, 77–81. doi: 10.1007/s13131-013-0301-9
Lim, H.-C., Lim, P.-T., Su, S. N.-P., Teng, S.-T., and Leaw, C.-P. (2012). Genetic diversity of Pseudo-nitzschia brasiliana (Bacillariophyceae) from Malaysia. J. Appl. Phycol. 24, 1465–1475. doi: 10.1007/s10811-012-9803-7
Margalef, R. (1978). Life-forms of phytoplankton as survival alternatives in an unstable environment. Oceanol. Acta 1, 493–509.
Molengraaff, G. A. F., and Weber, M. (1921). On the relation between the pleistocene glacial period and the origin of the Sunda sea (Java and South China-sea), and its influence on the distribution of coralreefs and on the land-and freshwater fauna. Proc. K. Ned. Akad. Wet. C 23, 395–439.
Morel, F. M., and Price, N. (2003). The biogeochemical cycles of trace metals in the oceans. Science 300, 944–947. doi: 10.1126/science.1083545
Neukermans, G., Oziel, L., and Babin, M. (2018). Increased intrusion of warming Atlantic water leads to rapid expansion of temperate phytoplankton in the Arctic. Glob. Change Biol. 24, 2545–2553. doi: 10.1111/gcb.14075
Ooi, S., Samah, A., and Braesicke, P. (2013). Primary productivity and its variability in the equatorial South China Sea during the northeast monsoon. Atmos. Chem. Phys. Discus. 13, 21573–21608. doi: 10.5194/acpd-13-21573-22013
Pai, S.-C., Tsau, Y.-J., and Yang, T.-I. (2001). pH and buffering capacity problems involved in the determination of ammonia in saline water using the indophenol blue spectrophotometric method. Anal. Chim. Acta 434, 209–216. doi: 10.1016/S0003-2670(01)00851-0
Parsons, T. R., Maita, Y. R., and Lalli, C. M. (1984). A Manual of Chemical & Biological Methods for Sea Water Analysis. Oxford: Pergamin press, doi: 10.1007/s00343-016-5017-1
Razali, R. M., Leaw, C. P., Hong, C. L., Nyanti, L., Ishak, I., and Lim, P. T. (2015). Harmful microalgae assemblage in the aquaculture area of Aman Island, Northen Strait of Malacca. Malays. J. Sci. 34, 24–36. doi: 10.22452/mjs.vol34no1.3
Reynolds, C. S. (1997). Vegetation processes in the pelagic: a model for ecosystem theory. Excell. Ecol. 9, 70–71. doi: 10.2216/i0031-8884-37-1-70.1
Rezai, H., Yusoff, F. M., Kawamura, A., Arshad, A., and Othman, B. H. R. (2003). Zooplankton biomass in the straits of Malacca. Ind. J. Marin. 32, 222–225. doi: 10.1046/j.1365-2419.2003.00243.x
Siswanto, E., and Tanaka, K. (2014). Phytoplankton biomass dynamics in the strait of Malacca within the period of the SeaWiFS full mission: seasonal cycles, interannual variations and decadal-scale trends. Remote Sens. 6, 2718–2742. doi: 10.3390/rs6042718
Sommer, U. (1989). “The role of competition for resources in phytoplankton succession,” in Plankton Ecology. Brock/Springer Series in Contemporary Bioscience, ed. U. Sommer (Berlin: Springer).
Sommer, U., Gliwicz, Z. M., Lampert, W. I., and Duncan, A. (1986). The PEG-model of seasonal succession of planktonic events in fresh waters. Archiv. Fur. Hydrobiol. 106, 433–471.
Stattegger, K., Kuhnt, W., Wong, H., Bühring, C., Haft, C., Hanebuth, T., et al. (1997). Sequence Stratigraphy, Late Pleistocene-Holocene Sea Level Fluctuations and High-Resolution Record of the Post-Pleistocene Transgression On The Sunda Shelf. Cruise Report RV SONNE 115. New York, NY: Leibniz Information centre for science and Technology.
Sun, J., Li, X., Chen, J., and Guo, S. (2016). Progress in oceanic biological pump. Acta Oceanol. Sin. 38, 1–21. doi: 10.3969/j.issn.0253-4193.2016.04.001
Sun, J., and Liu, D. (2004). The application of diversity indices in marine phytoplankton studies. Acta Oceanol. Sin. 26, 62–75. doi: 10.3321/j.issn:0253-4193.2004.01.007
Szarek, R. (2001). Biodiversity and Biogeography of Recent Benthic Foraminiferal Assemblages in the South-Western South China Sea (Sunda Shelf). Kiel: Christian-Albrechts Universität Kiel.
Tan, K. S., Acerbi, E., and Lauro, F. M. (2016). Marine habitats and biodiversity of Singapore’s coastal waters: a review. Reg. Stud. Mar. Sci. 8, 340–352. doi: 10.1016/j.rsma.2016.01.008
Te, C., Natarajan, R., and Ross, S. (1998). Analysis of the state of the marine environment of the straits of Malacca and Singapore. Sing. J. Int. Comp. L. 2:323.
Teen, L. P., Gires, U., and Pin, L. C. (2012). Harmful algal blooms in malaysian waters. Sains Malays. 41, 1509–1515.
Teng, S. T., Lim, H. C., Lim, P. T., Dao, V. H., Bates, S. S., and Leaw, C. P. (2014). Pseudo-nitzschia kodamae sp. nov. (Bacillariophyceae), a toxigenic species from the strait of Malacca, Malaysia. Harmful Algae 34, 17–28. doi: 10.1016/j.hal.2014.02.005
Tkalich, P., Pang, W., and Sundarambal, P. (2002). “Hydrodynamics and eutrophication modelling for Singapore straits,” in Proceedings of 7th Workshop on Ocean Models for the APEC Region (WOM-7), Singapore.
Trottet, A., Wilson, B., Xin, G. S. W., George, C., Casten, L., Schmoker, C., et al. (2018). Resting stage of plankton diversity from singapore coastal water: implications for harmful algae blooms and coastal management. Environ. Manag. 61, 275–290. doi: 10.1007/s00267-017-0966-5
Turpin, D. H., and Harrison, P. J. (1979). Limiting nutrient patchiness and its role in phytoplankton ecology. J. Exp. Mar. Biol. Ecol. 39, 151–166. doi: 10.1016/0022-0981(79)90011-X
Uthermöhl, H. (1958). On the perfecting of quantitative phytoplankton method. Int. Assoc. Theor. Appl. Limnol. Commun. 9, 1–38.
Vineetha, G., Karati, K. K., Raveendran, T. V., Idrees Babu, K. K., Riyas, C., Muhsin, M. I., et al. (2018). Responses of the zooplankton community to peak and waning periods of El Nino 2015-2016 in Kavaratti reef ecosystem, northern Indian Ocean. Environ. Monit. Assess. 190:465. doi: 10.1007/s10661-018-6842-9
Wang, L., Leng, X., Sun, Q., Wang, D., Zhang, C., and Sun, J. (2015). The distribution of phytoplankton community structure in the Sunda shelf and the strait of Malacca during spring intermonsoon. Acta Oceanol. Sin. 37, 120–129.
Wu, C., Kan, J., Liu, H., Pujari, L., Guo, C., Wang, X., et al. (2019). Heterotrophic bacteria dominate the diazotrophic community in the eastern indian ocean (EIO) during pre-southwest monsoon. Microb. Ecol. 78, 804–819. doi: 10.1007/s00248-019-01355-1
Wyrtki, K. (1961). Physical Oceanography of the Southeast Asia Waters. NAGA Report. La Jolla, CA: University of California San Diego.
Xiao, W., Liu, X., Irwin, A. J., Laws, E., Wang, L., Chen, B., et al. (2017). Warming and eutrophication combine to restructure diatoms and dinoflagellates. Water Res. 128, 206–216. doi: 10.1016/j.watres.2017.10.051
Yusoff, F., Ichikawa, T., Matias, H., and Azhar, O. (2001). Total carbon, dissolved silica and chlorophyll a in the straits of Malacca. Curr. Res. Rev. 26, 168–178.
Keywords: phytoplankton, diatoms, dinoflagellates, Strait of Malacca, Sunda Shelf
Citation: Liu H, Wu C, Xu W, Wang X, Thangaraj S, Zhang G, Zhang X, Zhao Y and Sun J (2020) Surface Phytoplankton Assemblages and Controlling Factors in the Strait of Malacca and Sunda Shelf. Front. Mar. Sci. 7:33. doi: 10.3389/fmars.2020.00033
Received: 06 October 2019; Accepted: 20 January 2020;
Published: 14 February 2020.
Edited by:
Michael William Lomas, Bigelow Laboratory for Ocean Sciences, United StatesReviewed by:
Márcio Silva de Souza, Fundação Universidade Federal do Rio Grande, BrazilCopyright © 2020 Liu, Wu, Xu, Wang, Thangaraj, Zhang, Zhang, Zhao and Sun. This is an open-access article distributed under the terms of the Creative Commons Attribution License (CC BY). The use, distribution or reproduction in other forums is permitted, provided the original author(s) and the copyright owner(s) are credited and that the original publication in this journal is cited, in accordance with accepted academic practice. No use, distribution or reproduction is permitted which does not comply with these terms.
*Correspondence: Jun Sun, cGh5dG9wbGFua3RvbkAxNjMuY29t
Disclaimer: All claims expressed in this article are solely those of the authors and do not necessarily represent those of their affiliated organizations, or those of the publisher, the editors and the reviewers. Any product that may be evaluated in this article or claim that may be made by its manufacturer is not guaranteed or endorsed by the publisher.
Research integrity at Frontiers
Learn more about the work of our research integrity team to safeguard the quality of each article we publish.