 Chao Yang
 Xianpeng Su2,3
 Fang Wang
 Yunliang Lu
- 1School of Information Science and Engineering, Ocean University of China, Qingdao, China
- 2Key Laboratory of Mariculture, Ministry of Education, Ocean University of China, Qingdao, China
- 3Function Laboratory for Marine Fisheries Science and Food Production Processes, Qingdao National Laboratory for Marine Science and Technology, Qingdao, China
- 4Marine Science and Engineering College, Qingdao Agricultural University, Qingdao, China
Personality differences are an important part of animal behavior research and a potential factor affecting the physiochemical response of animals to stimuli. Therefore, accurate classification of personality has an impact on animal experiment research that cannot be ignored. However, no completely objective methods have been noticed hitherto to be employed in aquatic animal personality studies. To address this issue, we established a personality analysis method based on machine learning (PAML) to avoid the influence of subjective factors. Then we analyzed the personality changes of swimming crab Portunus trituberculatus exposed to external stimuli i.e., food deprivation. Results showed that the high-accuracy PAML method could provide a comprehensive understanding of crab personality classification. Based on PAML, the personality of P. trituberculatus was detected to change dynamically under stress. After analyzing three typical personality characteristics: boldness, activity, and hesitancy, we found that the stability of boldness was the strongest, which is the best single candidate for personality evaluation, while the activity changed greatly under stress. This study confirms that animal personality changes dynamically with external factors. Based on PAML, we can not only avoid subjective factors and improve classification accuracy, but also quantitatively trace the dynamic influence of external factors on aquatic animal personality.
1. Introduction
The ubiquitous personality differences among conspecific individuals can affect their behaviors such as struggles (Rudin and Briffa, 2011) and physiological response mechanisms (Careau et al., 2008), and therefore affect animal adaptation to the environment. However, in previous studies, the influence of personality differences on animals in nature or in the laboratory was not paid enough attention to. In this respect, scarce works are only noticed in pure animal behavior studies. This is speculated to be mainly related to the lack of personality classification criteria. Throughout the animal personality research work, due to the subjective factors, animal behavior research work often has “personality” differences. That is, the result of personality classification is highly depends on the subjective perspective of the researcher. The same data may end up with different classification results due to the different views which are often subjective. Therefore, eliminating the influence of subjective factors and establishing the classification criteria have become the key to studies on animal personality and environmental adaptation mechanism.
Machine learning based on solid statistical theory is an important method for data mining. It can make full use of the statistical characteristics of data and obtain more scientific results based on the inherent laws of data such as data distribution. It has been widely used in computer science (Jordan and Mitchell, 2015), biomedicine (Zou et al., 2017; Michael et al., 2018; Wainberg et al., 2018), etc. In recent years, the role of machine learning in animal behavior analysis has also received increasing attention (Valletta et al., 2017). For example, social network based on machine learning helped reveal the cooperative foraging relationship between adult birds of Corvus monedula and between adult birds and chicks (Valletta et al., 2017). A method based on decision tree and hidden Markov model can improve the recognition accuracy of dog static (e.g., sitting, standing, and lying) and dynamic (walking and climbing stairs) behaviors (Brugarolas et al., 2013). These studies confirm that machine learning methods can better understand the relationship between animal behaviors from complex multidimensional variables than classical methods (Valletta et al., 2017). Therefore, construction a standard method for personality classification based on machine learning is reasonable and convincing. Unfortunately, related studies are limited to terrestrial animals, and there are few reports in aquatic animals.
The large number of appendages endows crustacean with a rich behavior language. Therefore, crustaceans are ideal for studying aquatic animal behavior. The swimming crab Portunus trituberculatus, a crustacean species widely distributed in the Northwest Pacific, was used in this study. Based on the distribution of the data, unsupervised learning K-Means algorithm (Hartigan and Wong, 1979) is used to cluster crab personality into, for example, brave individuals and shy individuals. Animal personality has been reported to be environmentally dependent (Gherardi et al., 2013; Zhao and Feng, 2015) and food resource is an important external factor that affect animal behavior. Therefore, after clustering analysis, Support Vector Machine (SVM) (Burges, 1998) algorithm is further employed to analyze dynamic changes of the swimming crab personality following food deprivation. This study aims to provide a scientific reference for improving the objectivity and accuracy of aquatic animal personality recognition.
2. Materials and Methods
2.1. Ethics Statement
All animal experiments were conducted in accordance with the guidelines and approval of the respective Animal Research and Ethics Committees of Ocean University of China [Permit Number: 20141201 (http://www.gov.cn/gongbao/content/2011/content_1860757.htm)]. The field studies did not involve endangered or protected species.
2.2. Animal Collection and Maintenance
The experiment was conducted from July to August 2017 at the Key Laboratory of Mariculture, Ministry of Education, Ocean University of China, Qingdao, China. Swimming crabs were collected from the aquaculture facility in Jiaonan District, Qingdao, and were housed in individual aquaria (40.5 L, 45 × 30 × 30 cm) with filtered seawater at 24 ± 1°C and salinity 30. Crabs were allowed to acclimate for 2 weeks before the experiment. The photoperiod was 12 :12 h light: dark. The crabs were fed at 08:00 h every morning with Manila clams (Ruditapes philippinarum). After 3 h of feeding, feces and residue bait were removed to keep water quality. The seawater was exchanged once daily. The aquaria were continuously aerated.
2.3. Experimental Process and Behavior Information Collection
Using the personality behavior observation system established in our previous study (Su et al., 2019), behavior observations were carried out on acclimated swimming crabs at intermolt stage with normal feeding and complete appendages. The crabs were allowed to acclimate for 10 min in the shelter, and then the trapdoor was remotely opened, thus allowing the crabs to access the experimental area while the infrared cameras recorded their behaviors. We placed one swimming crab in each shelter. The trials were started at 08:00 h and were terminated after 24 h. A total of 88 swimming crabs were observed and photographed. After that experiment, the swimming crabs were starved, and personality behaviors were observed after 6 and 12 days of hunger. During the study, a quiet environment and evenly distributed light were provided, and the conditions of light and water temperature were the same as during the maintenance period. After the behavior observations were completed, the videos were analyzed using behavior analysis software (Etho Vision XT 10) to quantify the boldness, activity, and hesitancy of the individual crab according to our previous study (Su et al., 2019).
2.4. K-Means and SVM Analysis
2.4.1. K-Means
K-Means algorithm is a classical unsupervised clustering algorithm based on iterative solution in the field of machine learning (Hartigan and Wong, 1979). For the K-Means clustering algorithm, the key problem is to select the number of clusters. It is challenging to determine the number of clusters without precedent reference. In this case, the Elbow Method can be used to decide the appropriate number of clusters. Elbow Method aims to optimize the within-cluster Sum of Squared Error (SSE) based on the Euclidean distance to find the optimal k-value. A commonly used distance metric is the square of the Euclidean distance:
in the equation, x and y represent two different sample points, and n represents the dimension of the sample (the number of features).
The SSE calculation formula is as follows:
in the equation, k represents the number of cluster centers, Ci representing the i-th cluster center, and x is the sample point belonging to Ci. The smaller the SSE value, the smaller the gap within the cluster and the better the clustering effect. It is easy to understand that if the number of clustering center equals to the number of samples, the SSE is 0. But that is meaningless. So the optimal k is where the SSE decrease the most drastically. The relationship between the experimental data SSE and k in this study is shown in Figure 1.
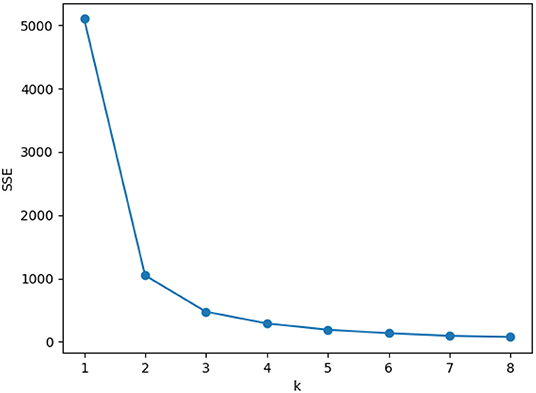
Figure 1. SSE and k relationship diagram. SSE decreases with the increasing number of k. The optimal k is where the SSE decreases the most drastically. In this diagram, the optimal k can be 2 or 3. According to our study, we choose 2 as the optimal k.
In this study, K-Means is applied to do cluster analysis based on the three personality characteristics of the boldness, hesitancy and activity of the swimming crabs separately. Then, considering all the personality characteristics simultaneously, K-Means is applied again for clustering analysis. Referring to the results of the Elbow Method (Figure 1), optimal cluster value k is determined to be 2. When all three factors are considered for clustering analysis simultaneously, Min-max normalization was processed to ensure that the transformed numerical range of the original data sequence is unified in the interval [0, 1], thereby eliminating the numerical difference between different personality characteristics. Because the clustering is based on the Euclidean distance, thus the numerical difference has influence on the clustering result. To avoid this difference, min-max normalization is necessary. Min-max normalization equation is as follows:
then the new sequence y1,y2,⋯ ,yn ∈ [0,1]. Once the clustering is finished, the SSE value is used as the score to evaluate the clustering effect.
2.4.2. SVM
After clustering by K-Means algorithm, each individual data of swimming crab is labeled. Then the data can be classified by supervised learning algorithm. In this way, the influence of each part on classification which is the weight of each factor is analyzed and quantified. Support Vector Machine (Burges, 1998), SVM for short, is a classical supervised learning algorithm. It has been widely used in various fields (Mohandes et al., 2004; Widodo and Yang, 2007) and been paid attention for improvement (Lin and Wang, 2002; Sun et al., 2018). For crab personality trait dataset D = (x1,y1), (x2,y2),⋯ , (xm,ym), SVM can be used to obtain a maximum-margin hyperplane, separating the samples into different personality groups based on the distance from the point to the hyperplane. The distance from the point to the hyperplane in space can be described by the following linear equation:
where W is the normal vector, which determines the direction of the hyperplane. b is the bias, which determines the distance between the hyperplane and the origin. Suppose the hyperplane can correctly classify the training samples, i.e., for training sample (xi,yi):
this formula is called the maximum interval hypothesis, which is equivalent to:
finding the closest point to the hyperplane is the first step for the algorithm. The distance between the point closest to the hyperplane is the margin, and the sample points which are closest to the hyperplane are called the Support Vector. Concretely, the margin can be calculated as the following formulation:
the optimization of the support vector machine is to maximize the margin, i.e., maxmargin(w,b). Since for a certain problem, it is often a certain value, so we need to optimize W that we want to get a γ, to make sure that:
through the analysis the specific values of W, the weight of each dimension for the classification hyperplane which means can be calculated the weight of each personality feature in the personality classification can be calculated.
3. Statistical Analysis
The experimental results in this study were expressed as mean ± standard deviation (Mean ± SD). The Friedman rank sum test was used to analyze the effect of hunger on personality characteristics. When the P-value of the experimental results is smaller than 0.05, the difference is statistically significant.
4. Results
4.1. Cluster Analysis and Dynamic Changes of the Swimming Crabs Based on Activity
Figure 2 showed the clustering results of the activity of swimming crabs in different starvation periods. In the figure, all data points were grouped into two categories according to the principle that the gaps within the cluster were small and the gaps between the clusters were large. The inter-cluster spacing based on activity clustering was similar under different starvation time conditions (Score = 328 for no starvation, 361 for 6 days starvation, 405 for 12 days starvation), and the ratio between different classifications was basically unchanged during the experiment (Figures 7D–F). Figure 2D showed that the activity of the crab significantly increased after starvation [χ2(2) = 14.68, P = 0.001], but the activity after 6 days starvation is similar to that after 12 days starvation.
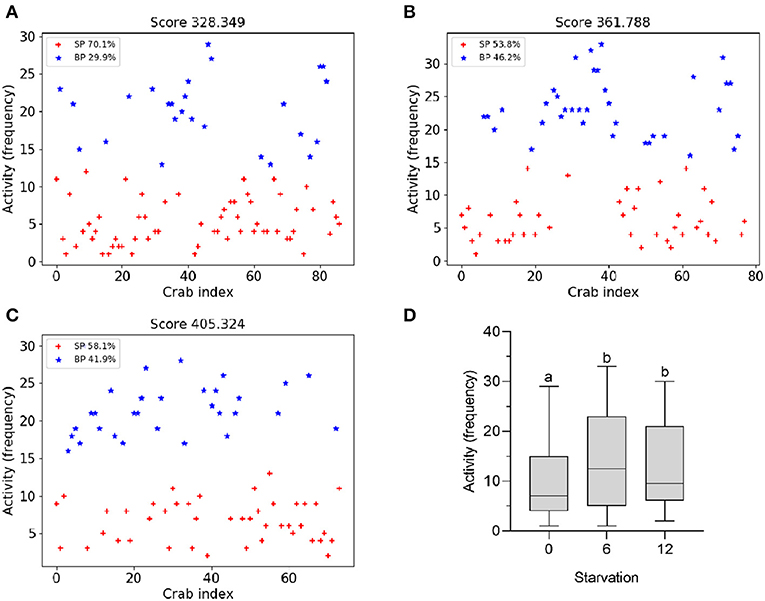
Figure 2. Clustering result based on activity. (A–C) Represent the clustering results after 0, 6, and 12 days of starvation, respectively. The score is the SSE value of each clustering result. (D) Shows the changes in activity under different starvation conditions. In the clustering graph based on three factors, since the data is normalized, the values of all the influencing factors are scaled to 0–1. BP represents brave individual and SP represents shy individual. The following is the same.
4.2. Cluster Analysis and Dynamic Changes of the Swimming Crabs Based on Boldness
In the different starvation periods, the swimming crabs were divided into two categories based on boldness (Figures 3A–C). The inter-cluster spacing based on boldness was different in different starvation conditions, and the score after starvation was (664.6 for 6 days starvation and 657.2 for 12 days starvation) higher than before starvation (398.4 for no starvation), and the proportion of the two personality categories changed slightly (Figures 7D–F). The starvation had no significant effect on the boldness of the swimming crabs [χ2(2) = 1.65, P = 0.439; Figure 3D].
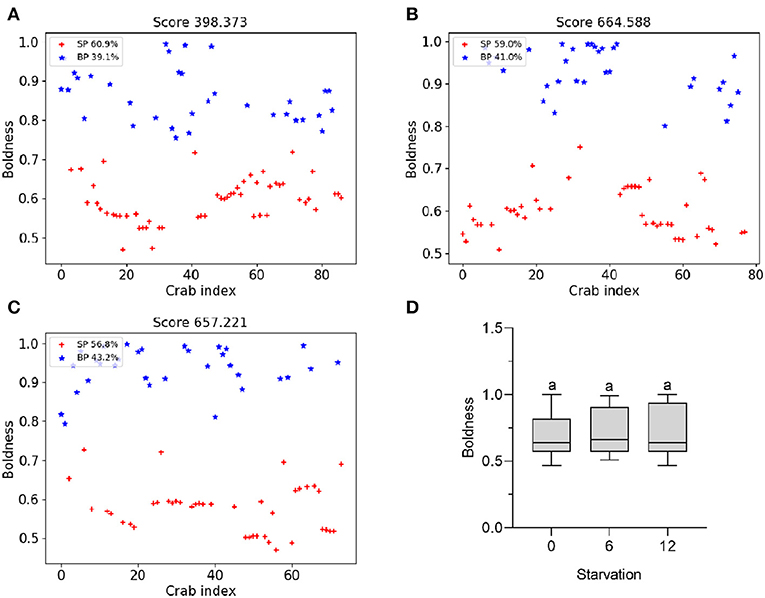
Figure 3. Clustering result based on boldness. (A) Result under 0 day starvation. (B) Result under 6 days starvation. (C) Result under 12 days starvation. (D) Changes in boldness under different starvation conditions.
4.3. Cluster Analysis and Dynamic Changes of the Swimming Crabs Based on Hesitancy
Figures 4A–C showed that the inter-cluster spacing based on hesitancy was quite different: the score for no starvation was 175.6, and the score for 6 days starvation and 12 days starvation was 89.7 and 192.6, respectively. The proportions of the two personality categories based on hesitancy remained essentially unchanged under different starvation conditions (Figures 7D–F). It is worth noticing that the proportion of two different personality categories are quite different from the results based on activity and boldness. It is mainly because that the distribution of the data is apparently different. Statistical analysis showed that starvation significantly affected the hesitancy of the swimming crabs [χ2(2) = 29.44, P < 0.001; Figure 4D]. The crab hesitancy at no starvation was significantly higher than hesitancy at 6 days starvation, but significantly lower than hesitancy at 12 days starvation, and the hesitancy at 6 days starvation was significantly lower than at hesitancy at 12 days starvation.
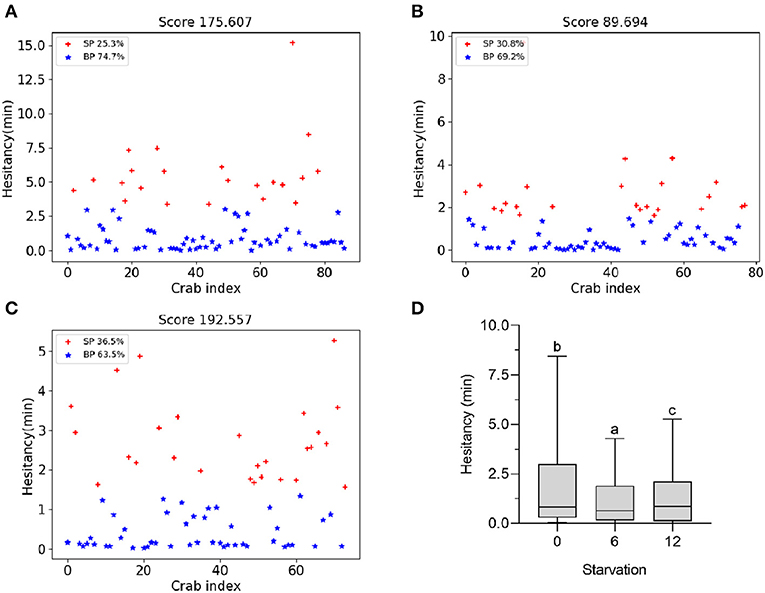
Figure 4. Clustering result based on hesitancy. (A) Result under 0 day starvation. (B) Result under 6 days starvation. (C) Result under 12 days starvation. (D) Changes in hesitancy under different starvation conditions.
4.4. Personality Cluster Analysis and Dynamic Changes of Swimming Crab
Among the different personality characteristics, the activity vs. hesitancy, boldness vs. hesitancy were negatively correlated, and the latter correlation increased at 6 and 12 days starvation, while the former correlation only increased at 12 days starvation (Table 1).
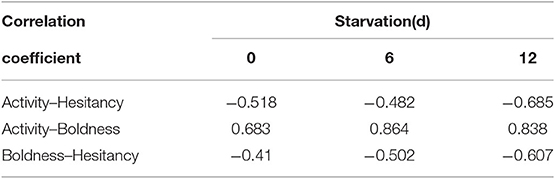
Table 1. Correlation analysis between different personality characteristics of swimming crab under starvation conditions.
We observed a positive correlation between boldness and activity. Under starvation conditions, the correlation between the two factors was enhanced, but the difference was extremely small at 6 and 12 days starvation.
The personality clustering analysis for swimming crabs is more objective when considering all the personality characteristics. The results of the personality classification of the swimming crabs were relatively different under different starvation conditions (Score = 143 for no starvation, 282 for 6 days starvation, 205 for 12 days starvation; Figure 5).
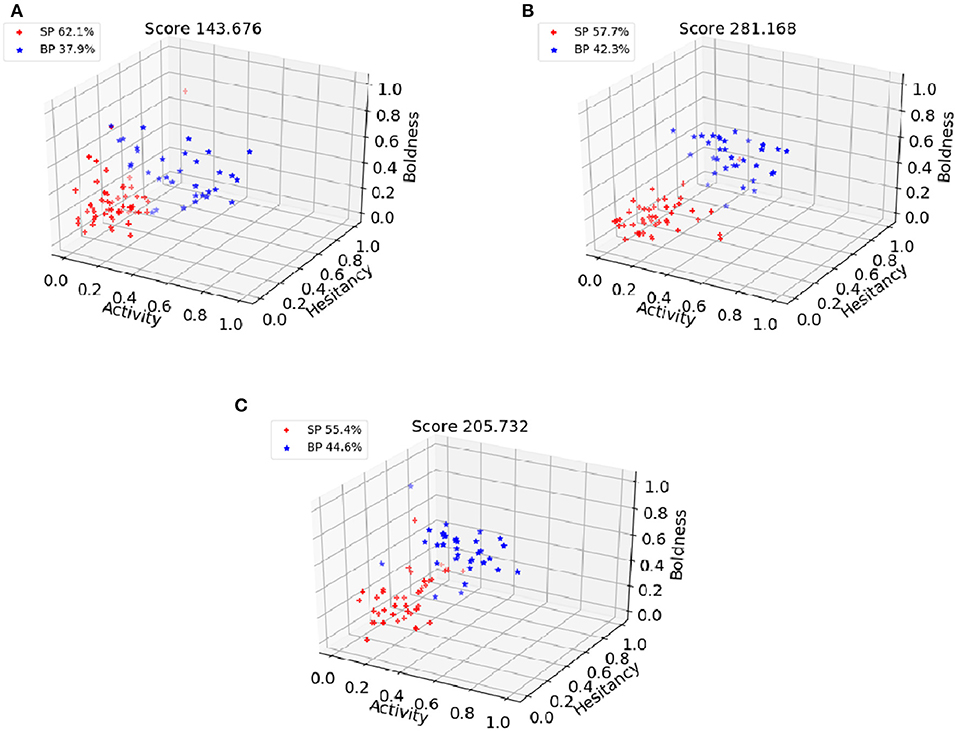
Figure 5. Clustering result based on three personality characteristics. (A) Result under 0 day starvation. (B) Result under 6 days starvation. (C) Result under 12 days starvation.
The results of SVM showed that boldness and activity were positively correlated with personality classification, while hesitancy was negatively correlated with personality classification (Figures 6A, 7A–C).
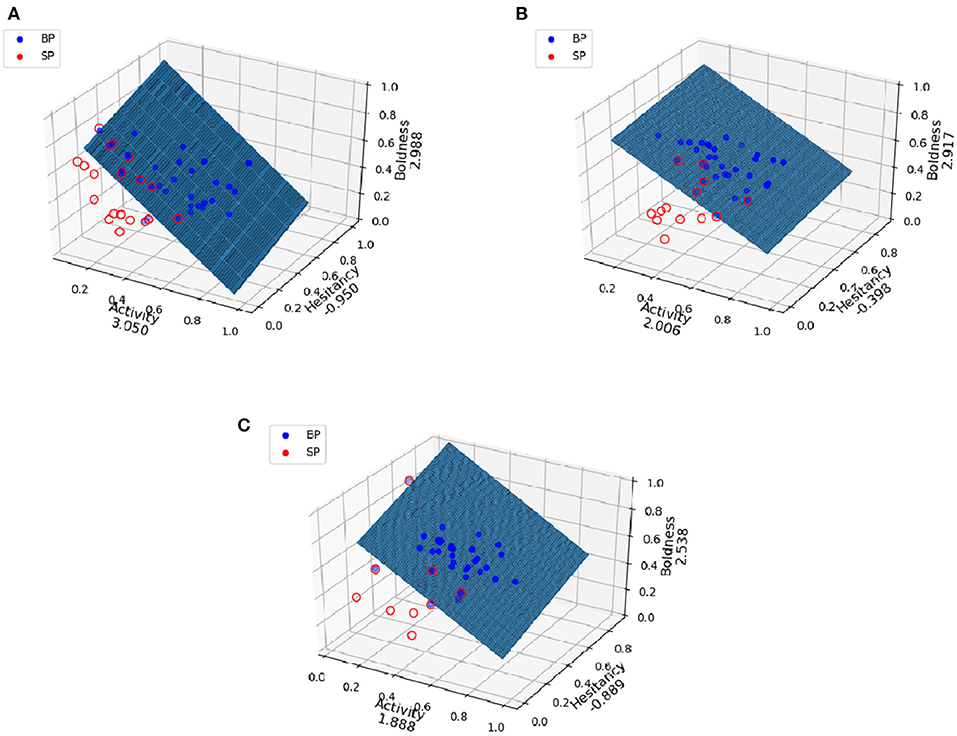
Figure 6. Analysis of the influence of the three factors on the swimming crabs personality classification based on SVM. (A–C) The results of analysis at 0, 6, and 12 days starvation. Each axis represents the corresponding factor and its weight or influence.
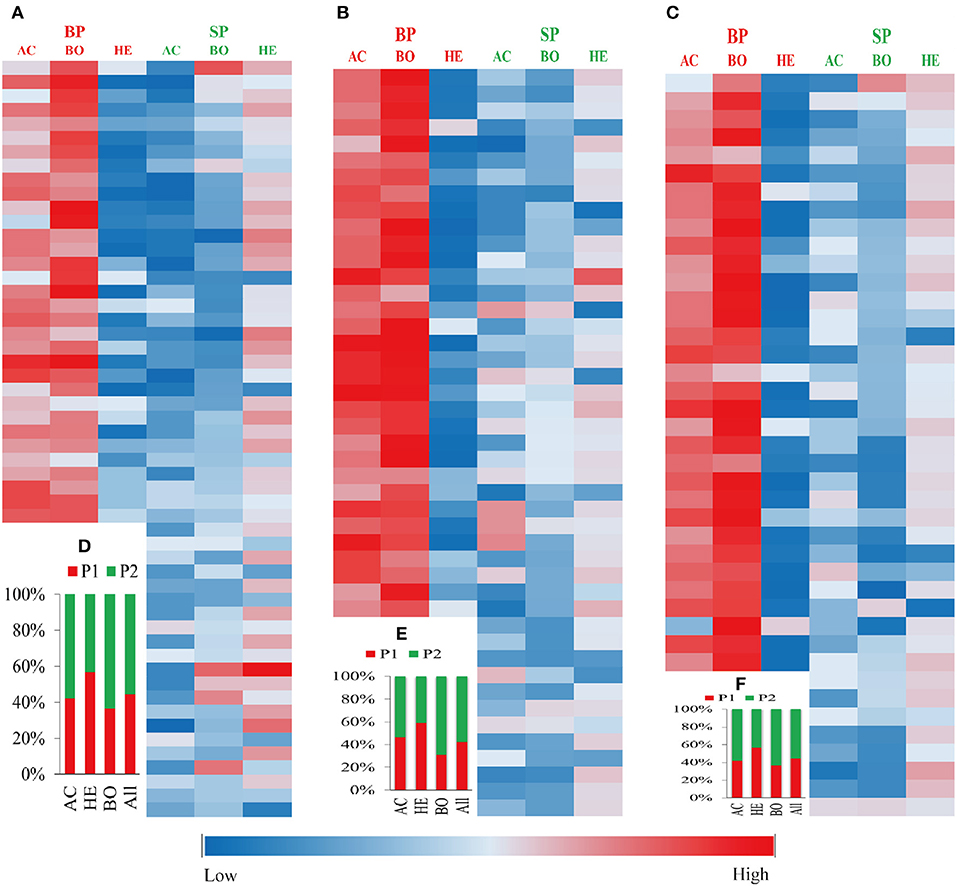
Figure 7. Relationship between personality classification and different personality characteristics of swimming crab. The result is based on the clustering considering all the three factors. P1 is the brave individual; P2 is the shy individual; AC is activity; HE is hesitancy; BO is boldness. (A–C) The results of starvation for 0, 6, and 12 days. Each square represents an individual animal. For a personality characteristic, the more the color tends to red, the stronger the personality characteristics numerically; the more the color tends to blue, the weaker the personality characteristics numerically. (D) Personality proportion under 0 day starvation. (E) Personality proportion under 6 days starvation. (F) Personality proportion under 12 days starvation.
With the starvation time prolonged, the weight of boldness in the classification of personality was relatively stable, while the weight of activity showed a downward trend, and the weight of hesitancy changed drastically, decreasing first and then increasing (Figures 6A–C).
5. Discussion
Personality researches are beneficial for understanding how animals adapt to the environment. For example, the boldness of animal is closely related to predation and avoidance (Biro and Dingemanse, 2009; Biro et al., 2009). This can also improve the ecological control measures and therefore guide production activity. Moreover, animal personality is closely related to laboratory research. Existing researches have shown that body metabolism (Careau et al., 2008; Guenther and Trillmich, 2015), neuroendocrine regulation and other stress capabilities (Archard et al., 2012; Zhao and Feng, 2015; Beekman and Jordan, 2017) are related to animal personality, which makes people wonder: in the animal-related research results, how important are the personality factors? Thus, accurate recognition of animal personality is an important basis for interpreting research results to reveal the physiological and ecological adaptation mechanisms of animals. Although scholars have paid attention to the relationship between animal behavior and physiological and ecological regulation, related studies especially on the aquatic animals remain scarce.
In this study, we explored the effects of machine learning-assisted animal behavior studies in the P. trituberculatus, representative of aquatic animals. It is verified that the PAML can reduce the subjectivity of animal personality recognition, and trace the dynamic changes of personality under external stress.
In previous personality studies, although some methods had been made to evaluate the characteristics such as boldness and activity, how to integrate these indicators to classify personality has always lacked objective criteria. In the past, some studies have carried out on personality classification based on the scores of key features (Zhang et al., 2017), but the evaluation of “intermediate zone” often has problems such as vague or subjective definition, which confines the significance of related works. To overcome this problem, in recent years, classical statistical methods, such as PCA and correlation analysis, have been used in more and more animal personality research (Brown et al., 2005; Moretz et al., 2007; Toms et al., 2010).
However, it should be pointed out that the PCA can only reduce the dimensionality of the original data, eliminate some factors with strong correlation, and analyze the factors with the most influence. In previous behavior classification studies, which has used PCA, were only based on reanalysis of PCA results (Visser et al., 2003). Correlation analysis simply describes the correlation between experimental data to describe the relationship between various aspects of the organism (Su et al., 2019), but cannot perform cluster analysis or quantitatively analyze multi-factor impacts. In contrast, the PAML method proposed in this study can conduct a more comprehensive and direct analysis of the original data based on K-Means and SVM, which not only realizes an objective classification of the personality types of the swimming crabs, but also can evaluate the influence of different personality characteristics on personality classification. The study found that with the increase of starvation time, the proportion of different crab personalities was quite different, indicating that the animal personality is dynamic rather than static when external factors change. Therefore, based on PAML, the conclusions of this study are more abundant and comprehensive than the classical statistical methods such as PCA. The PAML method can be expected to have more extensive application value.
Although evidences have shown a correlation between animal personality characteristics, such as boldness and activity, and predation/anti-predation ability (Toms et al., 2010), results of this study confirmed that the correlation between personality characteristics of swimming crabs was not stable. With the influence of the environment, the positive correlation between boldness and activity is weakened, and the correlation with hesitancy is enhanced. Taking these studies and our results all into consideration, it comes to that animal personality is environmentally dependent, and changes dynamically with environmental influence. Among the three personality characteristics in this study, the PAML method confirmed that boldness had the greatest contribution to personality classification and the highest stability, so it is suggested to be the best single candidate for personality evaluation. Since the level of activity is not only affected by predators, but also related to the body's metabolic capacity (Sih et al., 2004; Moretz et al., 2007), a great impact of starvation on activity can be expected. This viewpoint was confirmed by our results that as the starvation time prolonged, the activity of the crab significantly changed. Because the metabolic level of animals tends to change dramatically when environmental factors change (Uliano et al., 2010; de Souza et al., 2018; Madeira et al., 2018). Therefore, it can be further speculated that animal activity will also change significantly and thus will not have the ability to stabilize.
6. Conclusion
In this study, the personality characteristics of boldness, activity and hesitancy of P. trituberculatus are explored based on machine learning. The established method PAML can avoid subjectivity in personality classification. Comparing with classical method such as correlation analysis and PCA, PAML further improves the accuracy of classification and provide a more comprehensive insight into animal personality. Additionally, PAML can help monitor the starvation-induced dynamic changes of personality characteristics of P. trituberculatus. Among them, boldness has the highest and most stable contribution to personality classification, and it is the best single candidate for personality evaluation. Although this study preliminarily explores the differences between the PAML method and classical methods, it still needs further animal experiment verification, which will be carried out in our future works.
Data Availability Statement
The datasets generated for this study can be found in the Baidu Yun Disk (https://github.com/ChaoYang93/PAML).
Ethics Statement
All animal experiments were conducted in accordance with the guidelines and approval of the respective Animal Research and Ethics Committees of Ocean University of China (Permit Number: 20141201).
Author Contributions
CY done data analysis and part of the paper writing. DL and YL finished the rest of paper writing. XS done animal collection and maintenance as well as data collection. ZG helped CY for data analysis. FW was the major instructor.
Funding
This work was supported by the National Key Research and Development Plan (No. 2019YFD0900402), National Natural Science Foundation of China (No. 31972784), and Shandong Agricultural Major Application Technology Innovation Project (No. SD2019YY002).
Conflict of Interest
The authors declare that the research was conducted in the absence of any commercial or financial relationships that could be construed as a potential conflict of interest.
Acknowledgments
Thanks for all the colleagues in Ocean University of China that have helped us.
References
Archard, G. A., Earley, R. L., Hanninen, A. F., and Braithwaite, V. A. (2012). Correlated behaviour and stress physiology in fish exposed to different levels of predation pressure. Funct. Ecol. 26, 637–645. doi: 10.1111/j.1365-2435.2012.01968.x
Beekman, M., and Jordan, L. A. (2017). Does the field of animal personality provide any new insights for behavioral ecology? Behav. Ecol. 28, 617–623. doi: 10.1093/beheco/arx022
Biro, P. A., Beckmann, C., and Stamps, J. A. (2009). Small within-day increases in temperature affects boldness and alters personality in coral reef fish. Proc. R. Soc. B Biol. Sci. 277, 71–77. doi: 10.1098/rspb.2009.1346
Biro, P. A., and Dingemanse, N. J. (2009). Sampling bias resulting from animal personality. Trends Ecol. Evol. 24, 66–67. doi: 10.1016/j.tree.2008.11.001
Brown, C., Jones, F., and Braithwaite, V. (2005). In situ examination of boldness–shyness traits in the tropical poeciliid, brachyraphis episcopi. Anim. Behav. 70, 1003–1009. doi: 10.1016/j.anbehav.2004.12.022
Brugarolas, R., Loftin, R. T., Yang, P., Roberts, D. L., Sherman, B., and Bozkurt, A. (2013). “Behavior recognition based on machine learning algorithms for a wireless canine machine interface,” in 2013 IEEE International Conference on Body Sensor Networks (Cambridge, MA: IEEE), 1–5.
Burges, C. J. (1998). A tutorial on support vector machines for pattern recognition. Data Mining Knowl. Discov. 2, 121–167. doi: 10.1023/A:1009715923555
Careau, V., Thomas, D., Humphries, M., and Réale, D. (2008). Energy metabolism and animal personality. Oikos 117, 641–653. doi: 10.1111/j.0030-1299.2008.16513.x
de Souza, M. R. D. P., Herrerias, T., Zaleski, T., Forgati, M., Kandalski, P. K., Machado, C., et al. (2018). Heat stress in the heart and muscle of the antarctic fishes notothenia rossii and notothenia coriiceps: carbohydrate metabolism and antioxidant defence. Biochimie 146, 43–55. doi: 10.1016/j.biochi.2017.11.010
Gherardi, F., Coignet, A., Souty-Grosset, C., Spigoli, D., and Aquiloni, L. (2013). Climate warming and the agonistic behaviour of invasive crayfishes in e urope. Freshw. Biol. 58, 1958–1967. doi: 10.1111/fwb.12183
Guenther, A., and Trillmich, F. (2015). Within-litter differences in personality and physiology relate to size differences among siblings in cavies. Physiol. Behav. 145, 22–28. doi: 10.1016/j.physbeh.2015.03.026
Hartigan, J. A., and Wong, M. A. (1979). Algorithm as 136: a k-means clustering algorithm. J. R. Stat. Soc. Ser. C 28, 100–108. doi: 10.2307/2346830
Jordan, M. I., and Mitchell, T. M. (2015). Machine learning: trends, perspectives, and prospects. Science 349, 255–260. doi: 10.1126/science.aaa8415
Lin, C.-F., and Wang, S.-D. (2002). Fuzzy support vector machines. IEEE Trans. Neural Netw. 13, 464–471. doi: 10.1109/72.991432
Madeira, C., Leal, M. C., Diniz, M. S., Cabral, H. N., and Vinagre, C. (2018). Thermal stress and energy metabolism in two circumtropical decapod crustaceans: Responses to acute temperature events. Mar. Environ. Res. 141, 148–158. doi: 10.1016/j.marenvres.2018.08.015
Michael, K. Y., Ma, J., Fisher, J., Kreisberg, J. F., Raphael, B. J., and Ideker, T. (2018). Visible machine learning for biomedicine. Cell 173, 1562–1565. doi: 10.1016/j.cell.2018.05.056
Mohandes, M. A., Halawani, T. O., Rehman, S., and Hussain, A. A. (2004). Support vector machines for wind speed prediction. Renew. Energy 29, 939–947. doi: 10.1016/j.renene.2003.11.009
Moretz, J. A., Martins, E. P., and Robison, B. D. (2007). Behavioral syndromes and the evolution of correlated behavior in zebrafish. Behav. Ecol. 18, 556–562. doi: 10.1093/beheco/arm011
Rudin, F. S., and Briffa, M. (2011). Is boldness a resource-holding potential trait? Fighting prowess and changes in startle response in the sea anemone, actinia equina. Proc. R. Soc. B Biol. Sci. 279, 1904–1910. doi: 10.1098/rspb.2011.2418
Sih, A., Bell, A., and Johnson, J. C. (2004). Behavioral syndromes: an ecological and evolutionary overview. Trends Ecol. Evol. 19, 372–378. doi: 10.1016/j.tree.2004.04.009
Su, X., Sun, Y., Liu, D., Wang, F., Liu, J., and Zhu, B. (2019). Agonistic behaviour and energy metabolism of bold and shy swimming crabs portunus trituberculatus. J. Exp. Biol. 222:jeb188706. doi: 10.1242/jeb.188706
Sun, Z., Hu, K., Hu, T., Liu, J., and Zhu, K. (2018). Fast multi-label low-rank linearized SVM classification algorithm based on approximate extreme points. IEEE Access 6, 42319–42326. doi: 10.1109/ACCESS.2018.2854831
Toms, C. N., Echevarria, D. J., and Jouandot, D. J. (2010). A methodological review of personality-related studies in fish: focus on the shy-bold axis of behavior. Int. J. Compar. Psychol. 23, 1–25. Available online at: https://escholarship.org/uc/item/949413qt#author
Uliano, E., Cataldi, M., Carella, F., Migliaccio, O., Iaccarino, D., and Agnisola, C. (2010). Effects of acute changes in salinity and temperature on routine metabolism and nitrogen excretion in gambusia (Gambusia affinis) and zebrafish (Danio rerio). Compar. Biochem. Physiol. Part A Mol. Integr. Physiol. 157, 283–290. doi: 10.1016/j.cbpa.2010.07.019
Valletta, J. J., Torney, C., Kings, M., Thornton, A., and Madden, J. (2017). Applications of machine learning in animal behaviour studies. Anim. Behav. 124, 203–220. doi: 10.1016/j.anbehav.2016.12.005
Visser, E., Van Reenen, C., Engel, B., Schilder, M., Barneveld, A., and Blokhuis, H. (2003). The association between performance in show-jumping and personality traits earlier in life. Appl. Anim. Behav. Sci. 82, 279–295. doi: 10.1016/S0168-1591(03)00083-2
Wainberg, M., Merico, D., Delong, A., and Frey, B. J. (2018). Deep learning in biomedicine. Nat. Biotechnol. 36:829. doi: 10.1038/nbt.4233
Widodo, A., and Yang, B.-S. (2007). Support vector machine in machine condition monitoring and fault diagnosis. Mech. Syst. Signal Process. 21, 2560–2574. doi: 10.1016/j.ymssp.2006.12.007
Zhang, Q., Fu, S., and Xia, J. (2017). Recent progress on the personality of fish. Chinese J. Ecol. 12, 297–302. doi: 10.13292/j.1000-4890.201712.020
Zhao, D., and Feng, P. (2015). Temperature increase impacts personality traits in aquatic non-native species: implications for biological invasion under climate change. Curr. Zool. 61, 966–971. doi: 10.1093/czoolo/61.6.966
Keywords: Portunus trituberculatus, machine learning, clustering analysis, animal personality, dynamic change
Citation: Yang C, Su X, Liu D, Guo Z, Wang F and Lu Y (2020) A New Method of Aquatic Animal Personality Analysis Based on Machine Learning (PAML): Taking Swimming Crab Portunus trituberculatus as an Example. Front. Mar. Sci. 7:32. doi: 10.3389/fmars.2020.00032
Received: 05 December 2019; Accepted: 20 January 2020;
Published: 11 February 2020.
Edited by:
Jinghui Fang, Yellow Sea Fisheries Research Institute (CAFS), ChinaCopyright © 2020 Yang, Su, Liu, Guo, Wang and Lu. This is an open-access article distributed under the terms of the Creative Commons Attribution License (CC BY). The use, distribution or reproduction in other forums is permitted, provided the original author(s) and the copyright owner(s) are credited and that the original publication in this journal is cited, in accordance with accepted academic practice. No use, distribution or reproduction is permitted which does not comply with these terms.
*Correspondence: Fang Wang, d2FuZ2ZhbmcyNDlAb3VjLmVkdS5jbg==; Yunliang Lu, eXVuLjIwMDRAMTYzLmNvbQ==