 Timm Schoening
- GEOMAR Helmholtz Centre for Ocean Research Kiel, Kiel, Germany
Marine image analysis faces a multitude of challenges: data set size easily reaches Terabyte-scale; the underwater visual signal is often impaired to the point where information content becomes negligible; human interpreters are scarce and can only focus on subsets of the available data due to the annotation effort involved etc. Solutions to speed-up the analysis process have been presented in the literature in the form of semi-automation with artificial intelligence methods like machine learning. But the algorithms employed to automate the analysis commonly rely on large-scale compute infrastructure. So far, such an infrastructure has only been available on-shore. Here, a mobile compute cluster is presented to bring big image data analysis capabilities out to sea. The Sea-going High-Performance Compute Cluster (SHiPCC) units are mobile, robustly designed to operate with electrically impure ship-based power supplies and based on off-the-shelf computer hardware. Each unit comprises of up to eight compute nodes with graphics processing units for efficient image analysis and an internal storage to manage the big image data sets. The first SHiPCC unit has been successfully deployed at sea. It allowed us to extract semantic and quantitative information from a Terabyte-sized image data set within 1.5 h (a relative speedup of 97% compared to a single four-core CPU computer). Enabling such compute capability out at sea allows to include image-derived information into the cruise research plan, for example by determining promising sampling locations. The SHiPCC units are envisioned to generally improve the relevance and importance of optical imagery for marine science.
1. Introduction
Data science is becoming more important in many research domains and marine science is no exception. Artificial intelligence methods and visualization tools help to extract quantitative and semantic information from big data sets (Schoening et al., 2012, 2017). Traditional, desktop-style computer hardware is usually sufficiently powerful to apply such data science methods to data sets of kilobyte to megabyte size. Larger data sets at Gigabyte to multi-Terabyte-scale can be analyzed more efficiently by clusters of computers (Beloglazov et al., 2012). Those clusters can apply a selected algorithm to multiple data items in parallel by distributing the workload onto many compute nodes. Such clusters are usually operated by central computing centers of research institutes. They are commonly stationary, mounted in 19″ racks, cooled and may consist of tens of thousands of compute nodes. Their individual units are heavy and rely on a consistent power grid. Also, the main computing element is most often a Central Processing Unit (CPU) which can become a bottleneck for some algorithmic tasks. Especially in image and video analysis, many compute operations can be further parallelized efficiently with Graphics Processing Units (GPUs) (Mittal and Vetter, 2015). In the marine sciences, CPU and GPU compute clusters are most often used for climate simulations and other modeling tasks (Park and Latif, 2010). Nevertheless, those studies are shore-based and not time-critical. In case the data analysis has to be executed in near-realtime at sea, most existing compute clusters cannot be used. Data transfer to shore is bottlenecked even at the Gigabyte-scale by low internet bandwidth and transmission costs. Some vessels (e.g., RV Falkor) do have a CPU-based compute cluster on board but these cannot be flexibly deployed on other vessels and do not feature the efficiency of GPU clusters for image analysis (https://schmidtocean.org/technology/high-performance-computing/).
Thus, image analysis is currently conducted in the months and years after an expedition. Interesting features hidden in the data can only be further investigated subsequently during an additional expedition to the same area. In case of rapid processes or a high temporal variance of a process, a detected feature may be impossible to be investigated again (e.g., a large food fall like a whale carcass, a hydrothermal vent site, a tidally influenced gas seepage, a group of fauna showing coordinated behavior). Hence, near-realtime analysis is important when information contained in unstructured data sets like imagery shall guide further expedition actions. An example use case is an Autonomous Underwater Vehicle (AUV) imaging a large seafloor area at low resolution. If the obtained data could be analyzed by a compute cluster at sea to determine faunal abundance, hotspots in the abundance could then immediately be targeted by higher-resolution gear like a Remotely Operated Vehicle (ROV). Apart from such benefits when operating in a changing environment, image analysis at sea can similarly speed up traditional marine image based science. It can help with laser point detection (Schoening et al., 2015) to provide scaling information as well as plankton image vignetting toward identification (Robinson et al., 2017).
Here, the “Sea-going High-Performance Compute Cluster” (SHiPCC) is presented, to enable efficient and effective image and video analysis at sea. It is mobile, modular and GPU based, features a grid-independent power connection and provides storage capacity for tens of Terabytes of imagery. One SHiPCC unit has already been deployed at sea to determine methane bubble characteristics. It is expected to provide novel applications for image analysis and to increase the value and impact of image data for marine sciences.
In the following, section two presents the technical details of the system. Section three explains the application of the system to a real world use case at sea and section four discusses the status of the system and gives an outlook to future improvements.
2. Materials and Methods
High-performance image analysis can be conducted in a massively parallel manner. Hence the SHiPCC is designed in a single-instruction, multiple-data architecture (according to Flynn's taxonomy) with Ethernet-based shared storage. A high number of GPUs per CPU core was targeted. All IT hardware of the clusters is available commercially off-the-shelf from the consumer segment. The units are built to fit into standard aluminum boxes, commonly used for container transports in marine science. Furthermore the units can be connected directly to the main power grid of research vessels by filtering the electric current produced by the engines.
2.1. Hardware
All hardware components of a SHiPCC unit are shown in Figures 1B–J. The main elements of one unit are eight compact gaming computers equipped with GPUs that act as the compute nodes. These are ZOTAC Magnus EN1070 computers with an NVIDIA GeForce© GTX 1070 graphics card (mobile version) and an Intel Core i5-6400T processor (Quad-core, 2.2 GHz). In this setup, a single GPU is utilized by four CPU cores. Each node is equipped with a 500 GB SSD for local storage and 32 GB of main memory.
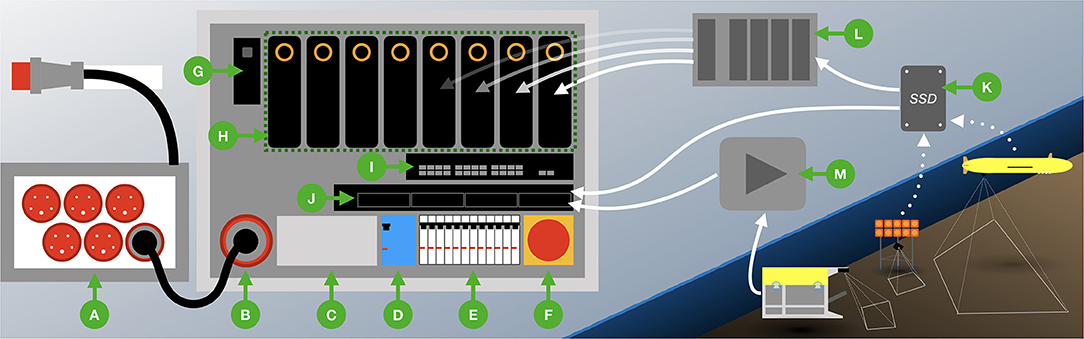
Figure 1. Depiction of a SHiPCC unit setup (B–J) and its power (A) and data (K–M) supply. A power distribution box (A), capable of providing energy to six SHiPCC units, connects to the ship's power grid and converts from 63A to 32A (400V). Each cluster unit has a 32A input (B), a filter to smooth the provided current (C) an FI fuse (D), several independent fuses for the compute components (E) and an emergency off-switch (F). Thus the control computer (G), the eight compute nodes conducting the actual computation with their eight individual GPUs and four CPU cores (H), the network switch (I) and the NAS (J) can be powered securely from the research vessel's main power grid. Data from untethered gear like AUVs or landers is retrieved by data medium (K). This data can either be directly transferred to the NAS or be multiplied by an external data duplication device (L). Multiplied data on several independent media can be connected to the compute nodes via USB to prevent costly data accesses over the internal Gigabit Ethernet network. Tethered gear like ROVs or towed telemetry systems can provide a live data feed, which a stream grabbing device (M) can store on the NAS. Each of the nodes has a Gigabit Ethernet connection to the NAS to read and write data.
One mini PC (Intel NUC7I3DNKE) serves as a gateway to the compute nodes and manages the required software packages. This PC does not run compute intensive tasks but provides tools like a web server, database and the image annotation software BIIGLE 2.0 (Langenkämper et al., 2017).
Large data storage is enabled by one Synology Rackstation RS815+ network attached storage (NAS) device, equipped with 24 TB of storage space. The NAS, the compute nodes and the gateway NUC are connected via a D-Link DGS-1210-16 Gigabit Ethernet switch.
Each node has an estimated compute performance of 10 GFlop/s per CPU and 6.5 TFlop/s per GPU. Hence, one SHiPCC unit of eight nodes has a combined compute performance of ca. 52 TFlop/s. The combined price of all components amounts to ca. 15,000 EUR for one unit (288 EUR/TFlop/s).
All hardware is mounted in a rigid aluminum frame (see Figure 2). The frame has an outer dimension of ca. 72 × 51 × 52 cm3 (WxHxD) with additional bumpers on the bottom and handles at the top that can be removed if necessary. One unit fits inside a Zarges K470 (40566) box and weighs 53 kg in total.
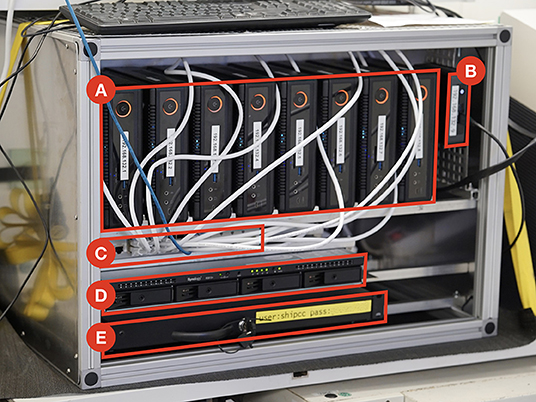
Figure 2. Setup of the one SHiPCC unit as deployed on cruise POS526 comprising eight compute nodes (A), one job scheduling control node (B), a Gigabit Ethernet switch (C), a four bay network attached storage of 24TB (D) and a drawer for further equipment like portable hard disks (E). The dimensions of one unit are 72 × 51 × 52 cm (W × H × D).
Electrical power has to be supplied by the research vessel. Each compute node is powered by a 180 W power supply. Including the network storage and network switch, the entire system would require four independent 16A power sockets which are rarely available in research labs at sea. Hence, the SHiPCC units can be connected directly to the raw power grid of the ship by a 32A power plug. When operating many units in parallel, a further power distribution box can be used (INDU-Electric 11400748, see Figure 1A). This box connects to a 63A outlet and provides six 32A sockets. The SHiPCC units feature a current filter (EPA NF-K-4-42), an internal RCBO, and independent fuses for all loads.
2.2. Software
All compute nodes and the gateway operate on Ubuntu Linux 18.04. They all feature NVIDIA CUDA, the GNU C compiler and Python. Hence, arbitrary, linux-enabled image analysis software can be compiled and executed.
The gateway hosts an apt package repository such that the compute nodes never have to be connected to the Internet. It also runs an Network Time Protocol (NTP) server to synchronize the clocks of all compute nodes. Furthermore, it provides a web interface to monitor the compute status and job results. At present, no job scheduling software is used as the system is likely to be operated by a single user.
2.3. Data Transfer
Data can be transferred to the compute nodes in three ways, as shown in Figures 1K,L. Most often a mobile storage device will be connected directly to the NAS for copying. From there, each compute node can access the data over the Gigabit network within the SHiPCC unit. A mobile storage device can also be multiplied by an external device first, creating copies to be connected to the individual nodes directly. This can be beneficial in case the network access would be too slow for the image analysis. For tethered systems that can provide a live stream, a video grabbing device is needed.
2.4. Deployment Usecase
The first SHiPCC unit was successfully deployed on research cruise POS526 with RV Poseidon in July 2018. It provided data storage capacity for five image data sets and three video data sets acquired during the cruise by AUV, towed cameras, stationary cameras attached to landers and a range of cameras operated by the manned submersible JAGO.
One data set of imagery was analyzed live at sea to determine methane bubble fluxes. Bubbles were imaged during several dives by the BubbleBox stereo camera system (Jordt et al., 2015) attached to JAGO. Several bubble streams were investigated, each yielding a separate image sequence. The data set was analyzed by a custom-built C++ program based on the GPU extensions of OpenCV to determine bubble sizes and bubble rising speeds. Individual bubbles were detected in each image by a four step procedure (see Figure 3). First, twenty of the images in a sequence were randomly selected and used to compute a median image for this sequence. This median image represents an empty frame without bubbles being visible (Figure 3B). Second, each image in the sequence was subtracted individually by the median image. This difference image shows high intensity values at pixels where bubbles occur and is close to zero at pixels without bubbles. Third, an intensity threshold was applied to create a binary image showing bubble candidate regions in each image (Figure 3C). Finally, each bubble candidate was segmented by a contour finding algorithm and subjected to a size threshold to remove candidates below and above meaningful size values (3–7,854 mm2 corresponding to a bubble radius of 1–50 mm).
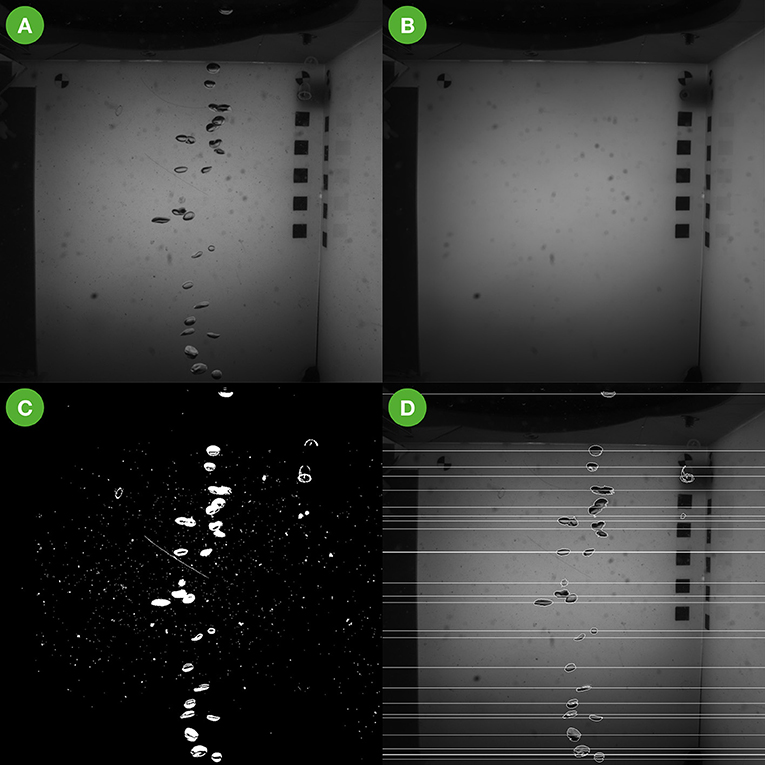
Figure 3. The bubble image processing pipeline executed on the SHiPCC during cruise POS526 as a demonstration of operability. In (A) an original image is shown as acquired by the BubbleBox. In (B) the median-filtered version is shown where only the background remains and the foreground (i.e., the bubbles) has been removed. (C) Shows the binarized subtraction of (B) from (A). Vertical bubble locations and outlines are marked in (D).
Bubble size was estimated by a known conversion factor of 5.7 px/mm for bubbles rising in the center of the BubbleBox. Bubble rising speed was estimated by linking bubble locations from subsequent images. Bubble locations detected in one image It were compared to detected locations in the next image It+1. A bubble detected in It+1 had to be within a 50 pixel search radius above any of the bubbles in It to be identified as that specific bubble. The upper bound of 50 pixels distance corresponds to ca. 8.8 mm distance traveled and thus a maximum expected rising speed of ca. 0.9 m/s. The distance an individual bubble traveled was combined with the known acquisition rate of the BubbleBox of 100 Hz to finally provide bubble rising speed estimates.
3. Results
Three units of the compute cluster are now available for deployment at sea (see section 4).
3.1. Rapid Bubble Size Estimation
Two JAGO dives with BubbleBox deployments provided ca. 1 TB of gray scale imagery representing eight individual bubble streams. Figure 3 shows an example image as acquired by the BubbleBox system during cruise POS526 and the images representing intermediate analysis steps toward the bubble size distribution and bubble volumes shown in Figure 4. In total, more than 900,000 images were analyzed by one SHiPCC unit of eight compute nodes within 99 min. On a single, four core, CPU computer the execution would have taken more than 2,900 min (2 days). This includes all computational steps on the CPU as well as GPU and data transfer times in between. 118,928 bubbles were detected, corresponding to a total volume of 144.5 L. The average bubble rising speed was determined as 0.25 m/s (± 0.01 m/s). This value is much smaller than the maximum expected rising speed applied in the bubble tracking heuristic.
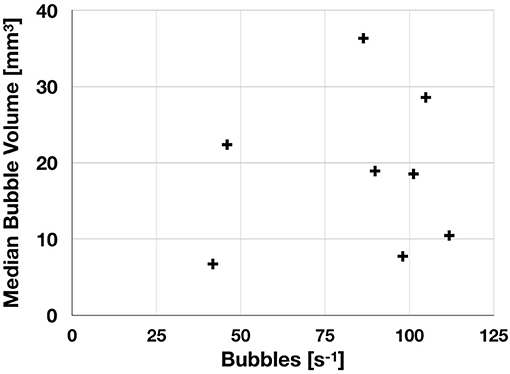
Figure 4. Results of the bubble detection as executed on the SHiPCC unit onboard RV Poseidon cruise POS526. Shown are the recorded bubbles per second vs. the median bubble volume. Each data point represents one bubble stream. Individual streams were measured at different locations.
The bubble use case was introduced here to show that the SHiPCC system is operable and has the capability of analyzing Terabytes of imagery at sea. Improved algorithms that exploit the capabilities of the BubbleBox stereo system are under development and will improve the accuracy of the bubble measurements.
4. Discussion
Common hardware for compute clusters is rack-mountable. Modern research vessels feature such racks in server rooms, used for ship operation hardware. In some cases those racks might be available for scientific computing gear. However, a review among the German vessels showed that additional hardware could not be installed on a per-cruise basis. This is partly due to space restrictions but mostly due to concerns regarding the safe operation of the vessels. Mobile 19 inch racks would have been an alternative mechanical design choice. They were neglected in favor of the presented scheme. Mainly, to adhere to the standard Zarges box format for marine scientific logistics while also maintaining the highest spatial yield.
We chose the SHiPCC setup—utilizing compact, commercial off-the-shelf desktop computers—to fulfill four goals: (i) create a system with few CPUs per GPU (ii) enable simple transport by using standard marine scientific transport casing (iii) achieve high computational performance per invested money and (iv) enable execution of software on x86 CPUs. We considered other computation hardware for our mobile image processing cluster (see Table 1). The NVIDIA DGX-1 was neglected as it features less GPUs per CPU (8 GPUs for 40 CPUs), is only rack-mountable and costs ca. 470 EUR / TFlop/s. A DGX-1 would also not have been affordable due to the total cost of 80,000 EUR per unit. A 19″ rack-mountable off-the-shelf solution (Dell R730, two NVIDIA Tesla K80 GPUs, two Intel E5-2640v4 CPUs) was neglected for the same reasons at costs of ca. 1,113 EUR / TFlop/s. A cluster of NVIDIA Jetson TX2 nodes was neglected as it requires special software and compilers due to its ARM CPUs and is also less cost-effective than the SHiPCC units at ca. 450 EUR/TFlop/s. Nevertheless, a cluster of Jetsons would likely be more energy-efficient than the SHiPCC units.
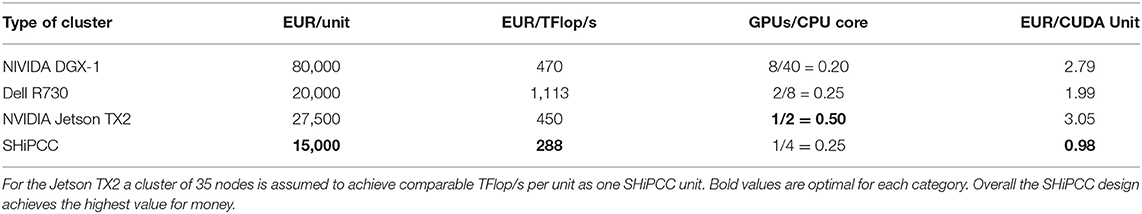
Table 1. Comparison of designs for a mobile compute cluster.
The full setup of three SHiPCC units, comprised of a total of 20 compute nodes achieves a theoretical performance of 130 TFlop/s. Assuming an image processing effort of 100 operations per pixel the SHiPCC could analyze 6.3 video streams in 4K resolution in real time. This theoretical capability will be limited by other factors like network bandwidth which can be circumvented by distributing the video signal over SDI and equipping each node with video grabbing hardware rather than using an Ethernet file stream.
Cooling of the cluster has been neglected in the design of the units. Each node manages the heat it creates by built-in copper coolers and active fans. The SHiPCC nodes are equipped with further, larger fans to distribute the heat away from the cluster frames. It is assumed that cooling for the SHiPCC nodes will be provided by the research vessel itself. Some vessels provide climatized server rooms where the nodes could be set up. In most cases, though, the compute cluster will be setup in a climatized lab room where the temperature can be adjusted to the required operations. At least for the medium and large German vessels, cooling power in the range of several hundreds of kilowatts is available. The heat created by the SHiPCC nodes can be neglected in those cases. A further choice would be containing a SHiPCC unit inside a climatized, mobile frame, which could be shipped as an additional piece of equipment in case no climatized labs are available.
At the moment, a total of three SHiPCC units have been built. Two are units as presented here, the third is a down-scaled mini-SHiPCC. It features only four compute nodes but has a total weight of less than 23 kg including the transport box. This enables transport of the system by standard air freight, making it useful not only for research cruises. To advance the system toward multi-user operations, a job scheduling software will be required. Commercial and open source solutions exist for this task but were neglected until now to keep the system simple to setup.
Within the full image analysis pipeline, from acquisition to understanding, there are many bottlenecks that require new tools and workflows (Schoening et al., 2018). Acquisition can only be sped-up by multiplying the number of acquisition devices. Interpretation is envisioned to be accelerated by machine learning methods and the compute power of systems like the SHiPCC units. Nevertheless, data transfer toward the analysis computers remains an impediment. By bringing the hardware out to sea, slow satellite connections are bypassed as well as the physical transport of hard disks to shore. For tethered systems, a live stream could be fed into a SHiPCC unit through video grabbing hardware. For untethered systems, one has to wait until the gear has been recovered and data been downloaded from the device. An immediate analysis of an ROV video stream is targeted for the next deployment of the SHiPCC units.
In summary, a new type of equipment for the marine sciences has been presented here. The Sea-going High-Performance Compute Cluster is specifically designed to conduct high-throughput image analysis on research vessels. Other use cases like at-sea oceanographic and biogeochemical modeling can be envisioned as these also operate on large volumes of gridded data that is subject to cell-wise operations that can efficiently be paralellized on GPUs. Using a SHiPCC unit on cruises will increase the impact of big data sets having just been acquired at sea. It provides the hardware basis for intelligent algorithms extracting quantitative and semantic information from these data sets efficiently and effectively. Such extracted information can streamline knowledge discovery, guide further sensor deployments and enables joint interpretation in the inspiring environment of a research team at sea.
Author Contributions
TS designed the equipment and obtained funding for it, developed the test algorithms, deployed the system at sea, and wrote this manuscript.
Funding
This project was funded by the Cluster of Excellence 80 The Future Ocean. The Future Ocean was funded within the framework of the Excellence Initiative by the Deutsche Forschungsgemeinschaft (DFG) on behalf of the German federal and state governments.
Conflict of Interest
The author declares that the research was conducted in the absence of any commercial or financial relationships that could be construed as a potential conflict of interest.
Acknowledgments
Special thanks go to the Technologie und Logistikzentrum (TLZ) of GEOMAR for their support in building the SHiPCC units. This is publication number 40 of the Deep Sea Monitoring Group at GEOMAR. We thank the three reviewers for their input to this improved manuscript.
References
Beloglazov, A., Abawajy, J., and Buyya, R. (2012). Energy-aware resource allocation heuristics for efficient management of data centers for cloud computing. Fut Generat Comput Syst. 28, 755–768. doi: 10.1016/j.future.2011.04.017
Jordt, A., Zelenka, C., von Deimling, J. S., Koch, R., and Köser, K. (2015). The bubble box: towards an automated visual sensor for 3d analysis and characterization of marine gas release sites. Sensors 15, 30716–30735. doi: 10.3390/s151229825
Langenkämper, D., Zurowietz, M., Schoening, T., and Nattkemper, T. W. (2017). Biigle 2.0-browsing and annotating large marine image collections. Front. Mar. Sci. 4:83. doi: 10.3389/fmars.2017.00083
Mittal, S., and Vetter, J. S. (2015). A survey of CPU-GPU heterogeneous computing techniques. ACM Comput. Surv. 47:69. doi: 10.1145/2788396
Park, W., and Latif, M. (2010). Pacific and Atlantic multidecadal variability in the kiel climate model. Geophys. Res. Lett. 37, 1–6. doi: 10.1029/2010GL045560
Robinson, K. L., Luo, J. Y., Sponaugle, S., Guigand, C., and Cowen, R. K. (2017). A tale of two crowds: public engagement in plankton classification. Front. Mar. Sci. 4:82. doi: 10.3389/fmars.2017.00082
Schoening, T., Bergmann, M., Ontrup, J., Taylor, J., Dannheim, J., Gutt, J., et al. (2012). Semi-automated image analysis for the assessment of megafaunal densities at the arctic deep-sea observatory HAUSGARTEN. PLoS ONE 7:e38179. doi: 10.1371/journal.pone.0038179
Schoening, T., Jones, D. O., and Greinert, J. (2017). Compact-morphology-based poly-metallic nodule delineation. Sci. Rep. 7:13338. doi: 10.1038/s41598-017-13335-x
Schoening, T., Köser, K., and Greinert, J. (2018). An acquisition, curation and management workflow for sustainable, terabyte-scale marine image analysis. Sci. Data 5:180181. doi: 10.1038/sdata.2018.181
Keywords: sea-going equipment, big data analysis, cluster computer, modular hardware, image analysis
Citation: Schoening T (2019) SHiPCC—A Sea-going High-Performance Compute Cluster for Image Analysis. Front. Mar. Sci. 6:736. doi: 10.3389/fmars.2019.00736
Received: 13 September 2018; Accepted: 12 November 2019;
Published: 27 November 2019.
Edited by:
Marlon R. Lewis, Dalhousie University, CanadaReviewed by:
Sparsh Mittal, Indian Institute of Technology Hyderabad, IndiaJann Paul Mattern, University of California, Santa Cruz, United States
Copyright © 2019 Schoening. This is an open-access article distributed under the terms of the Creative Commons Attribution License (CC BY). The use, distribution or reproduction in other forums is permitted, provided the original author(s) and the copyright owner(s) are credited and that the original publication in this journal is cited, in accordance with accepted academic practice. No use, distribution or reproduction is permitted which does not comply with these terms.
*Correspondence: Timm Schoening, dHNjaG9lbmluZ0BnZW9tYXIuZGU=