 Cheng He1†
 Xiaotong Wang
94% of researchers rate our articles as excellent or good
Learn more about the work of our research integrity team to safeguard the quality of each article we publish.
Find out more
ORIGINAL RESEARCH article
Front. Mar. Sci. , 16 October 2019
Sec. Marine Fisheries, Aquaculture and Living Resources
Volume 6 - 2019 | https://doi.org/10.3389/fmars.2019.00651
Yellow-brown spots are often observed on the inner shell surface of the clam Mactra veneriformis sampled in Binhai New Area, Lijin County, Shandong Province, China, negatively impacting its commercial value. In this study, Scanning electron microscopy-energy dispersive spectroscopy (SEM-EDS), X-ray diffraction (X-rd), laser Raman spectrum (LRS), and Fourier infrared spectrum scanning (FT-IR) were used to detect and analyze the composition of spots on the inner shell surface of these clams. Compared with shells without spots, the shells with spots showed significant differences in their silicon contents but no differences in the content of other basic elements; LRS and X- rd examination revealed that, in addition to calcium carbonate particles, there were traces of silica bonds; after the removal of calcium carbonate by using hydrochloric acid, the spectral trend of particles was similar to that of sea sand, which was consistent with the spectral characteristics of SiO2. Therefore, the spots on the inner shell surface of M. veneriformis are sea sand. These are likely to result from the increased sand content in seawater in the Yellow River Delta, whereby the grains of sand have fallen into the gap between the mantle and shell; thus, the sand becomes encased in the shells as they grow.
Mactra veneriformis (Lamellibranchia, Venerida, Mactridae), commonly known as the white clam, is a bivalve mollusk that lives in the tidal flats, subtidal zones, and shallow seas off the coasts of China, South Korea, and Japan. It has a high nutritional value, tender meat, and delicious taste, rendering it an economically important species (Fang et al., 2010). However, M. veneriformis in certain locations often have a large number of yellow-brown spots attached to their white inner shell surface (Figure 1), the cause of which is unclear.
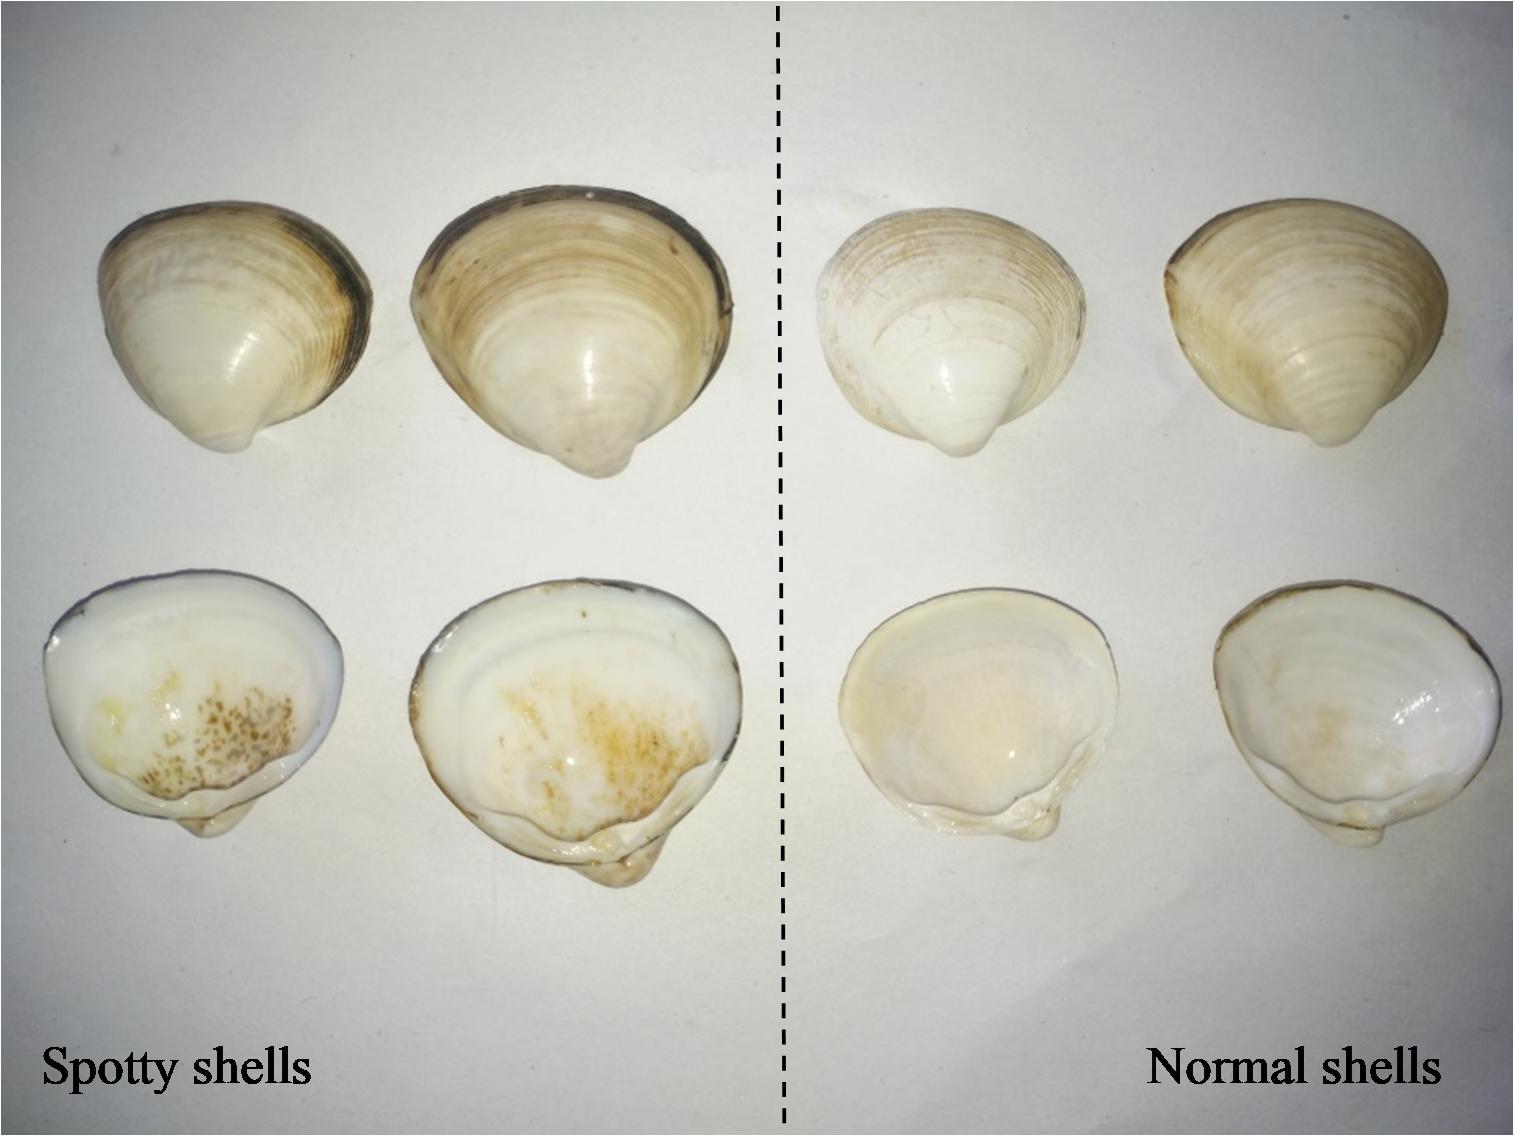
Figure 1. The examples of spotty shells and normal ones of Mactra veneriformis. Left, the clams with the yellow-brown spots on the inner shell surface; right, the normal clams.
The occurrence of such spots can negatively impact the economic return received from M. veneriformis. But, more importantly, the environment may have a negative impact on food safety (Haslberger, 2006; Seiber and Kleinschmidt, 2011). The growth and morphological characteristics of mollusk shells often reflect the environmental conditions in which the animals lived (Stephenson et al., 1986). Thus, this unusual shell appearance causes consumers to question the food safety of the mollusks themselves. Thus, it is important to understand the origins of these spots to determine their causes, be it environmental or a result of pollution, which could help us understand the interaction between the marine environment and organisms.
In this study, a series of methods [Scanning electron microscopy-energy dispersive spectroscopy (SEM-EDS), X-ray diffraction (X-rd), laser Raman spectrum (LRS), and Fourier infrared spectrum scanning (FT-IR)] were used to identify the components of the spots on the inner surface of M. veneriformis shells and, thus, to determine their cause.
Mactra veneriformis were sampled from Binhai New Area, Lijin County, Dongying City, Shandong Province, China (Figure 2). Each shell was opened by using a scalpel and the soft tissues were removed. The shells were cleaned with deionized water, and then placed in a draught drying cabinet at 80°C for 24 h (Hao et al., 2015). In order to eliminate the individual differences, the non-spotted sample and spotted sample were taken from the same shell. One shell was used in one experiment. We did three experiments with three shells in each detection method. At the same time, sea sand from seawater in the samples sites was collected, washed and dried.
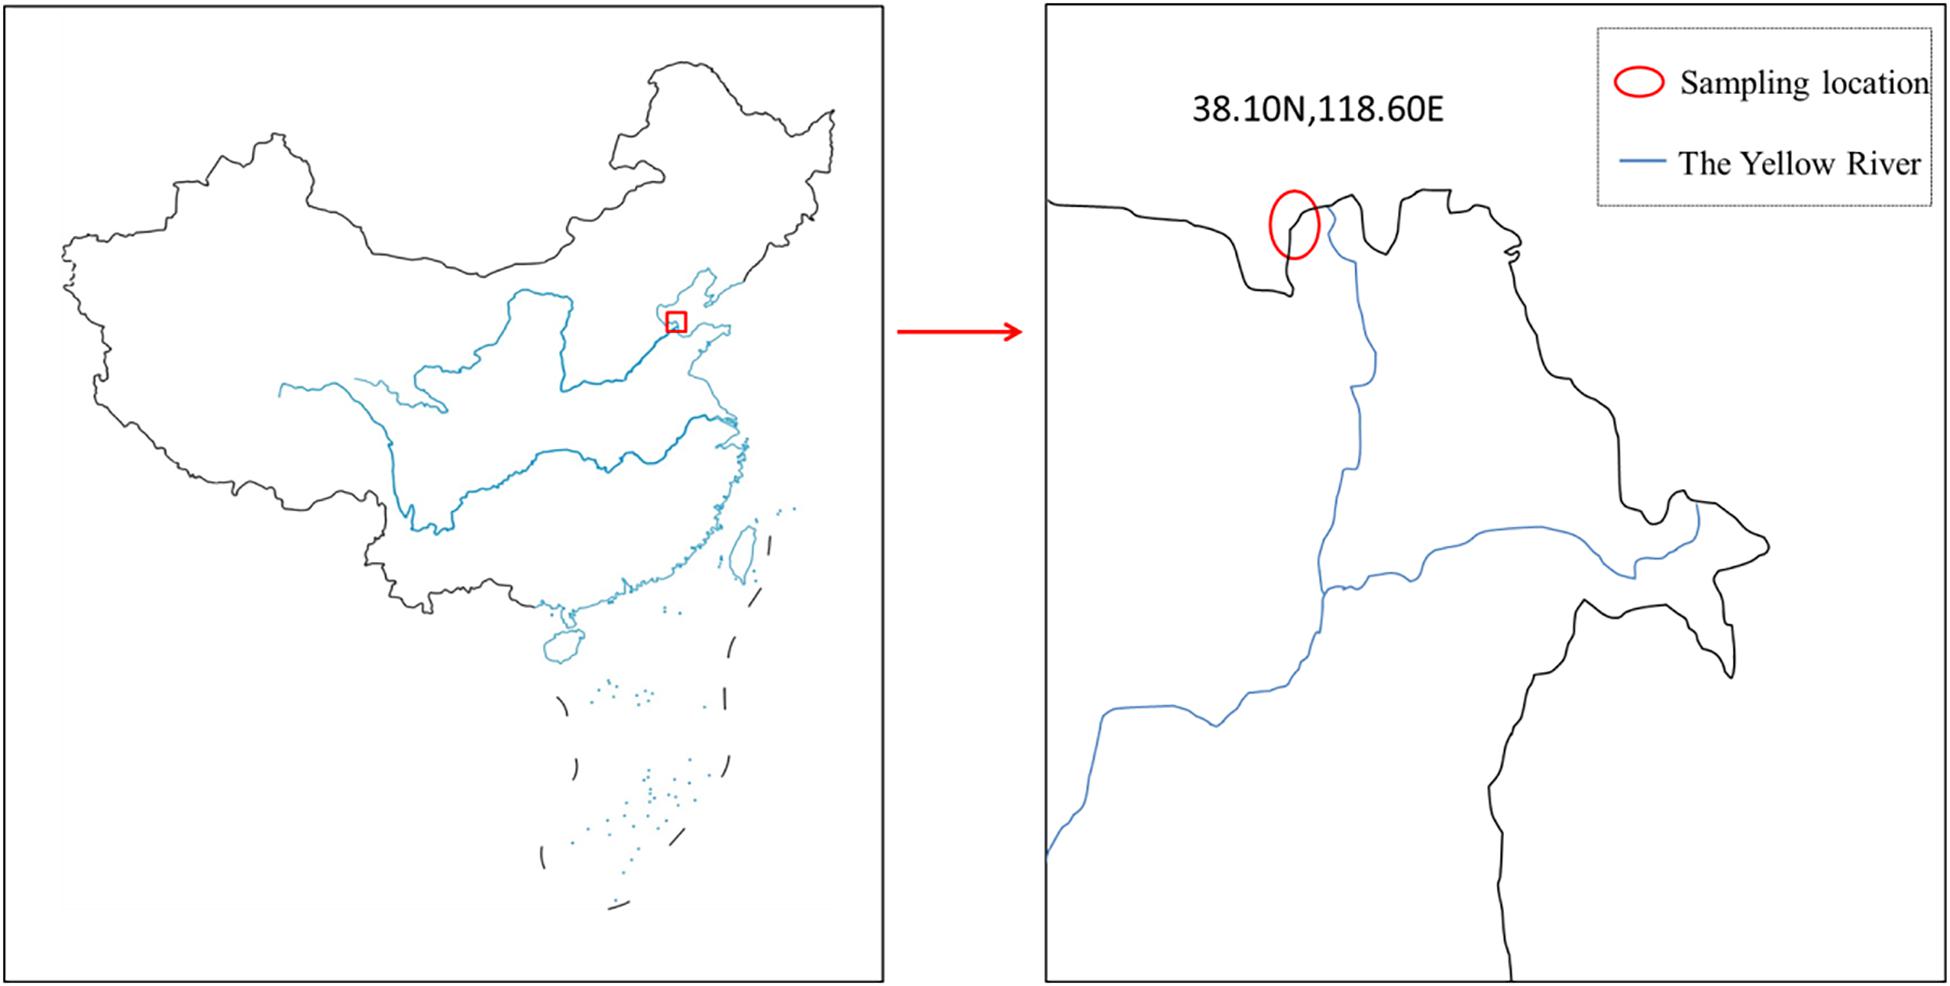
Figure 2. Location of the sample collection site in Yellow River Delta of China.
In order to decide the position and the mode of the spots on the shell, scalpels and microscopes were used to examine the attachment of spots on the inner surface of the shells and analyze their morphological structure of M. veneriformis.
Shell fragments with particles were randomly selected from the samples of shells (Figure 3). Area A was selected as the experimental sample area and area B was used as the control sample area. Each sample was cleaned three times with deionized water and dried in a constant temperature drying oven for another time, following the method of Huang et al. (2018). Gold was then sprayed onto the inner surface of each shell and examined using SEM-EDS (HITACHI-SU8010) to determine the element composition of the spots. The accelerating voltage was 15 KV and the working distance was 10 mm. Five visual fields were randomly selected from each group for comparison.
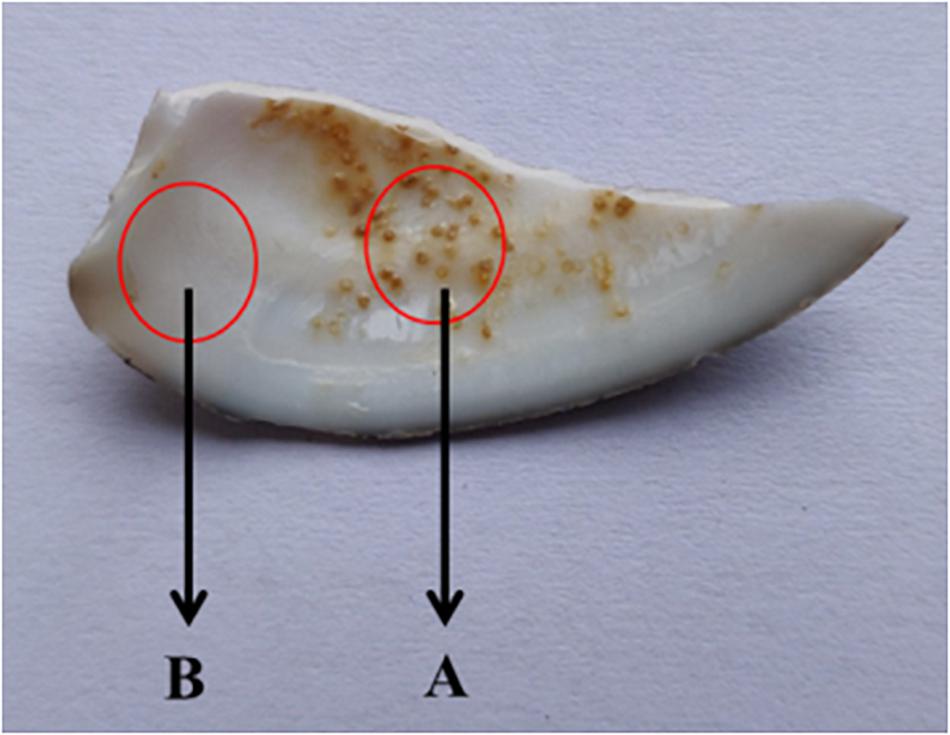
Figure 3. Schematic diagram of shell sampling. Area A was selected as the experimental sample area and area B was used as the control sample area.
Shell fragments with spots were randomly selected and prepared as described above (A in Figure 3). Normal shell fragments (B in Figure 3) were used as negative controls. Each shell fragment was ground into a powder using an agate mortar. A laser Raman spectrometer (LRS-3) was used to detect the Raman spectrums of samples. The positive control group was sea sand collected locally.
Shell fragments with spots were randomly selected (A in Figure 3) and ground into a powder. The powder was then subject to X-rd in the range of 22–90° using the following parameters: Cu target, accelerating voltage 30 KV and scanning speed 0.06°/sec. The results were exported and plotted with software Origin pro 8.0 (OriginLab, Northampton, MA, United States).
Calcium carbonate and other impurities soluble in hydrochloric acid were removed from shells with spots using 12 mol/L hydrochloric acid. The samples were centrifuged at 8000 × g for 10 min and the supernatant discarded. The precipitate was rinsed with deionized water five times and dried at room temperature. The precipitate was then mixed with potassium bromide in a ratio of 1:100. An agate mortar was used to grind the precipitate, which was then pressed into thin slices and subjected to Fourier infrared spectroscopy. Shells with spots not treated with hydrochloric acid were also tested, and sea sand was used as a positive control and normal shells as a negative control. The data were plotted with software Origin pro 8.0 (OriginLab, Northampton, MA, United States).
Anatomic microscopy showed that the spots were generally concentrated in the middle depression area of the shell, and there were almost no spots at the edge of the shell. The spots themselves are round or oval, and the color is mostly yellowish brown. Analyses revealed that the spots were not attached to, but embedded in the inner surface of the clam shell (Figure 4).
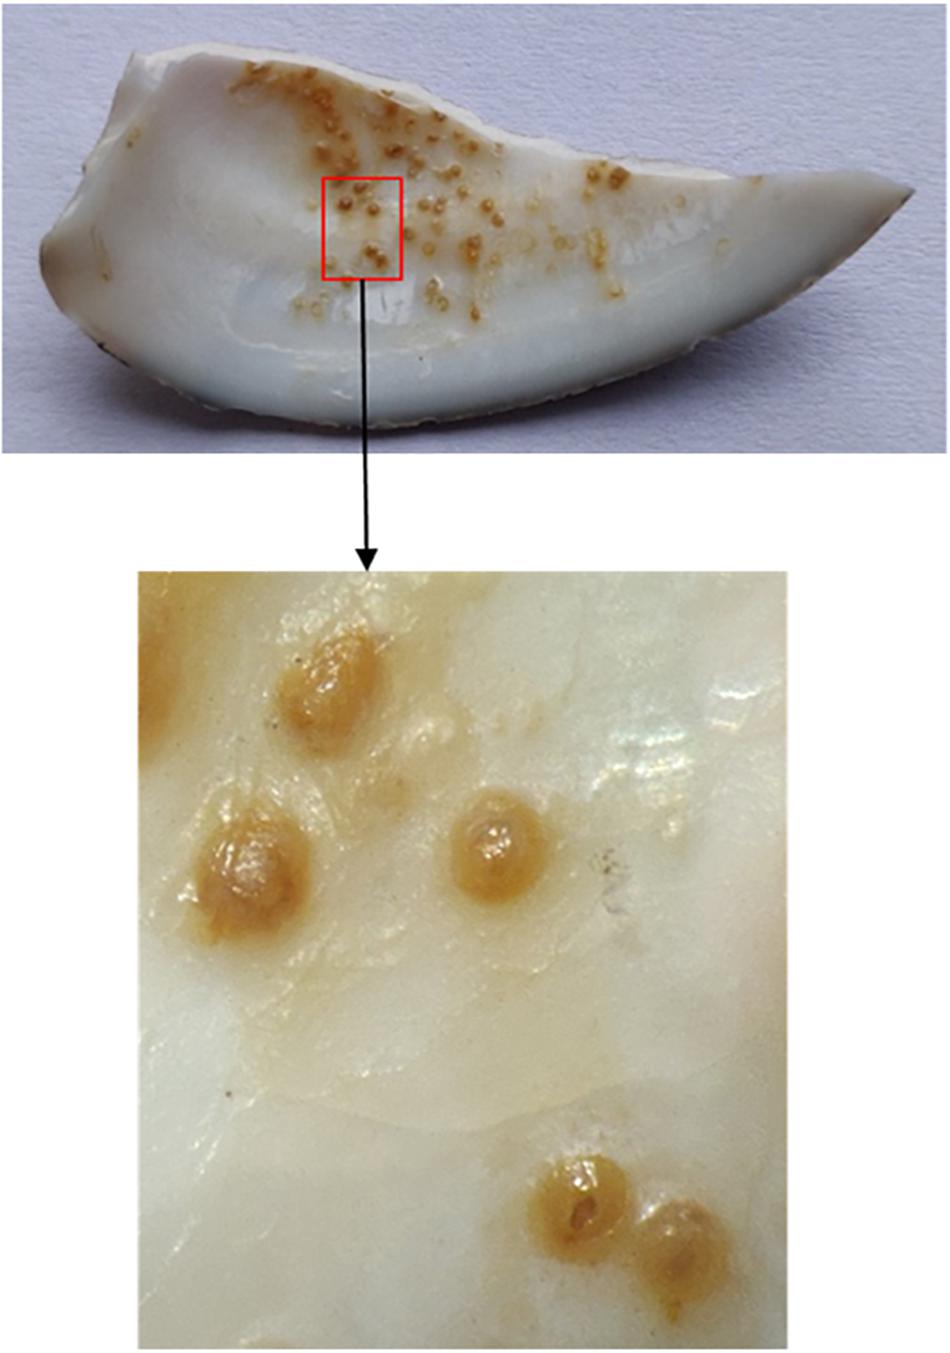
Figure 4. Microscopic pictures of spots. The image below is a larger version of the picture in the red box above.
Compared with normal shells, there were many granular protrusions on the inner surface of shells with spots (Figure 5). The results of the SEM-EDS are summarized in Table 1. The results showed that Ca, O, and C were the main elements in the two shell samples, whereas smaller concentrations of Na, F, Mg, and Al were detected. Si was not detected in the normal shell samples but in the spotted shell samples at 0.20 to 0.35%. Thus, the element composition of the two groups of shell were the same except for their Si content.
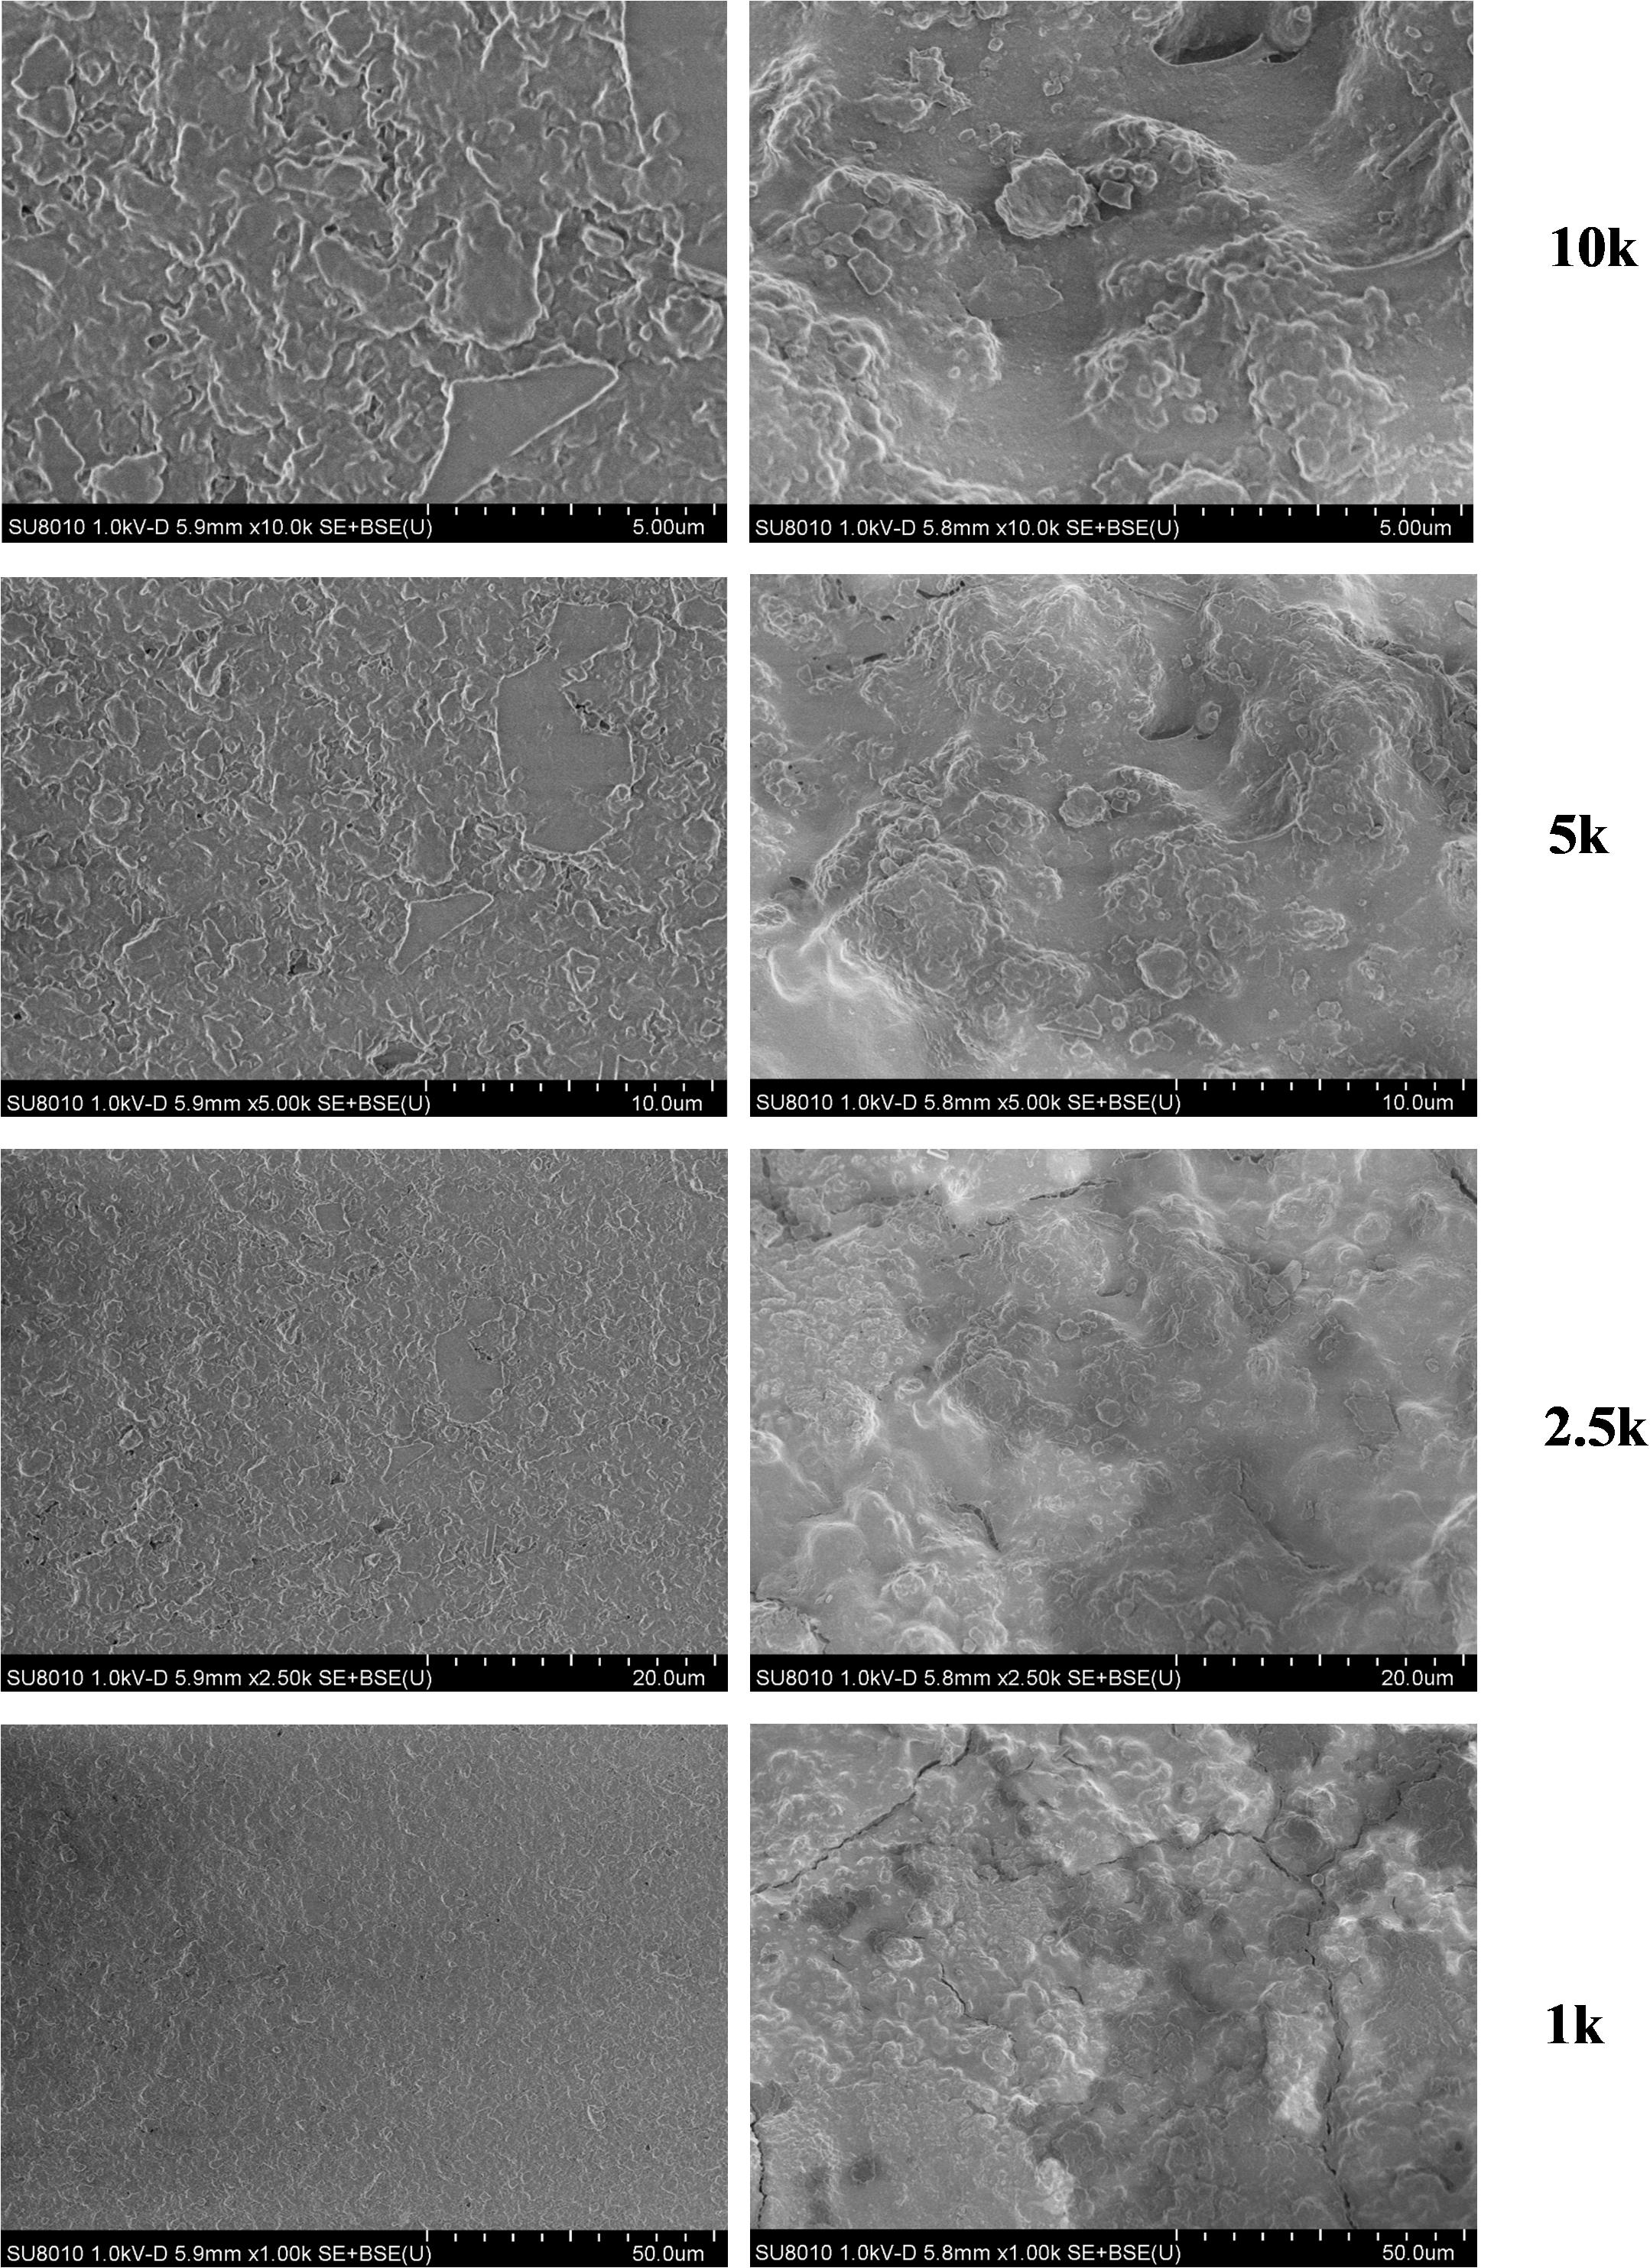
Figure 5. SEM photos of the inner surfaces of normal shells and shells with spots. 1k, 1000×; 2.5k, 2500×; 5k, 5000×; and 10k, 10,000× magnification.
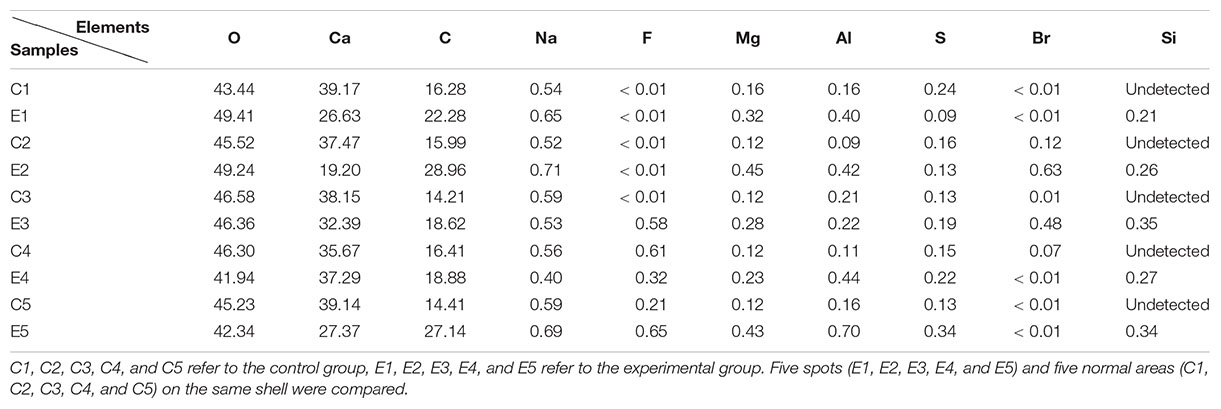
Table 1. SEM-EDS results of the inner surfaces of normal shells and shells with spots.
The results of laser Raman spectroscopy showed obvious differences among normal shells, shells with spots, and sand (Figure 6). The differences mainly occurred between 480–500 and 788 nm. Compared to the normal white shell (blue line), the curve of the spots (red line) is more consistent with the curve of the sand (green line). They were at the same peak at 480 and 788 nm. The white shell, on the other hand, did not peak at 480 and 788 nm, but peaked at about 495 and 800 nm. Both shells with spots and sand had common absorption peaks similar to Raman spectral characteristics reported previously for SiO2 crystals (Ye, 2008), whereas normal shells did not. Therefore, shells with spots contained SiO2.
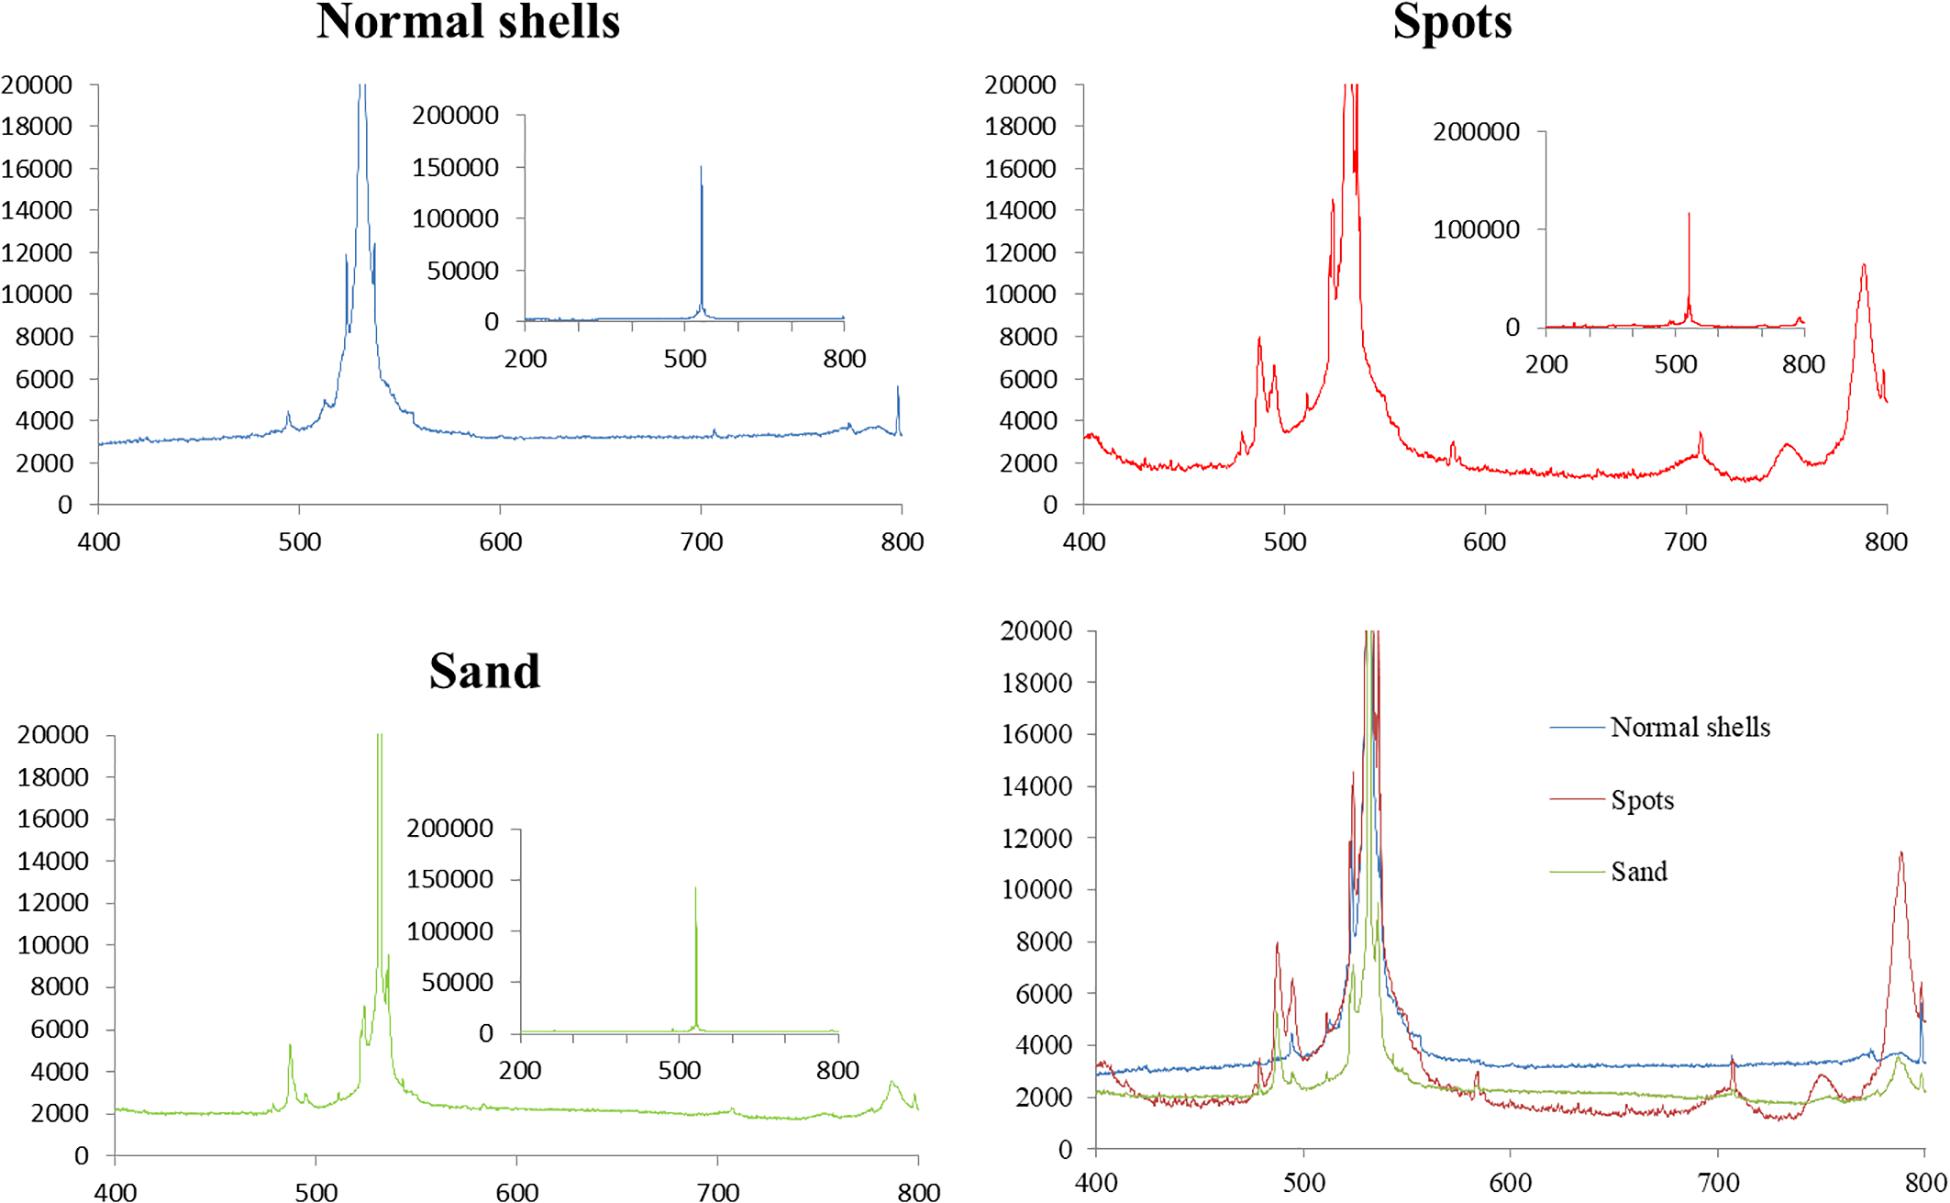
Figure 6. Results of laser Raman spectroscopic analysis of normal shells, shells with spots, and sand.
As shown by the results of X-rd (Figure 7), crystal plane spacing d = 3.34 Å (diffraction angle 2θ = 26.68) was the diffraction characteristic peak of SiO2, which is consistent with the reported characteristic peaks of quartz (SiO2) structures (Leite et al., 2000; Marinoni and Broekmans, 2013). In this Figure, two peaks of CaCO3 (2θ = 26.1 and 2θ = 27.1) were very high, hinting that the content of CaCO3 was very high. The low peak of SiO2 might be because the diffraction peaks of rare substances (in this case SiO2) are easily covered by stronger peaks (in this case, CaCO3), which was consistent with the laser Raman spectroscopy results.
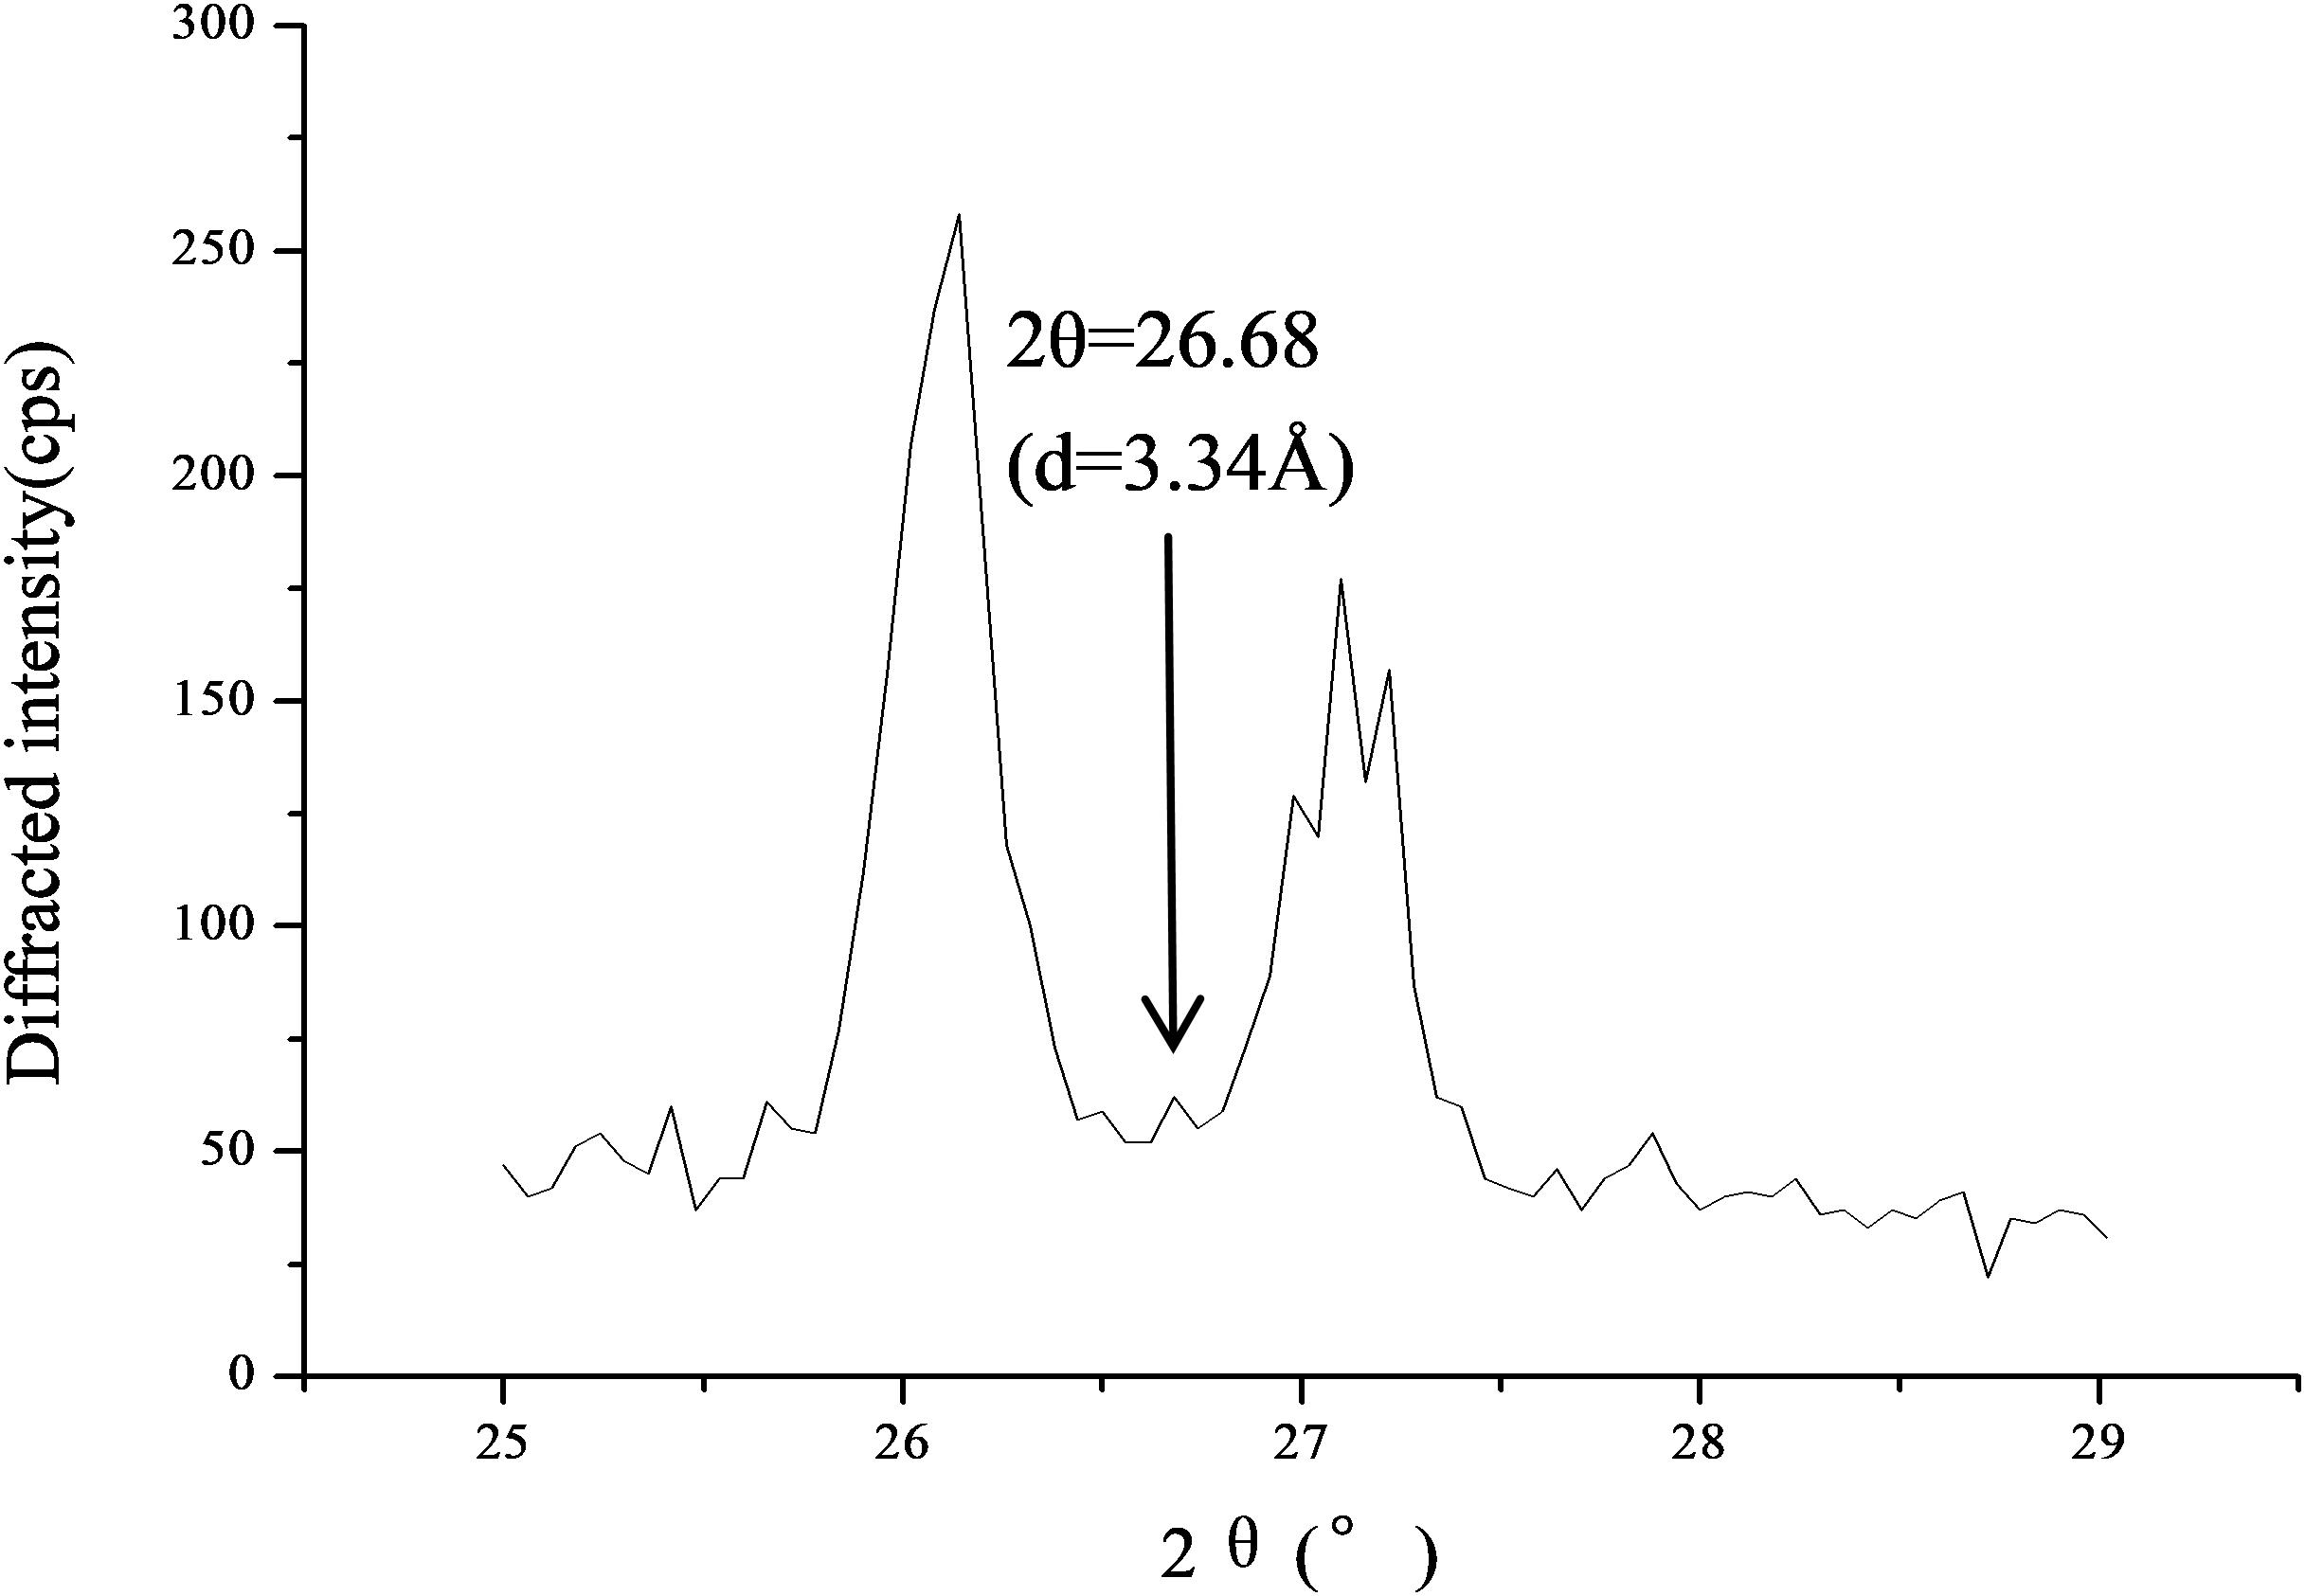
Figure 7. X-ray diffraction pattern of shells with spots.
According to the infrared spectra shown in Figure 8, the infrared spectrum curve of the shell spots was similar to that of normal shells. The strongest peaks of the shell spots and the normal shells appeared near 1463 cm, which are formed by the vibrational stretching of carbonate (Huang et al., 2012). This result is consistent with the SEM-EDS results that showed that calcium carbonate formed the main component of the shells with spots. In addition, according to the formation of spots attached to the inner shell surface, amorphous calcium carbonate (ACC) might be the predominant type of calcium carbonate in the brown-yellow spots (Huang et al., 2018). Interestingly, compared with normal shell samples, the infrared spectra of shell spots treated with hydrochloric acid were significantly different. The curve characteristics were similar to those of sand, with an obvious absorption peak at 1080∼1100 cm–1, belonging to the Si-O tensile and Si-O-Si bending vibration peak (Chen et al., 2011), which was consistent with the recognized characteristic peak of SiO2 (Lippincott et al., 1958; Boyd and Wilson, 1982). These results indicated that the main component of shell spots treated with hydrochloric acid was similar to that of sand.
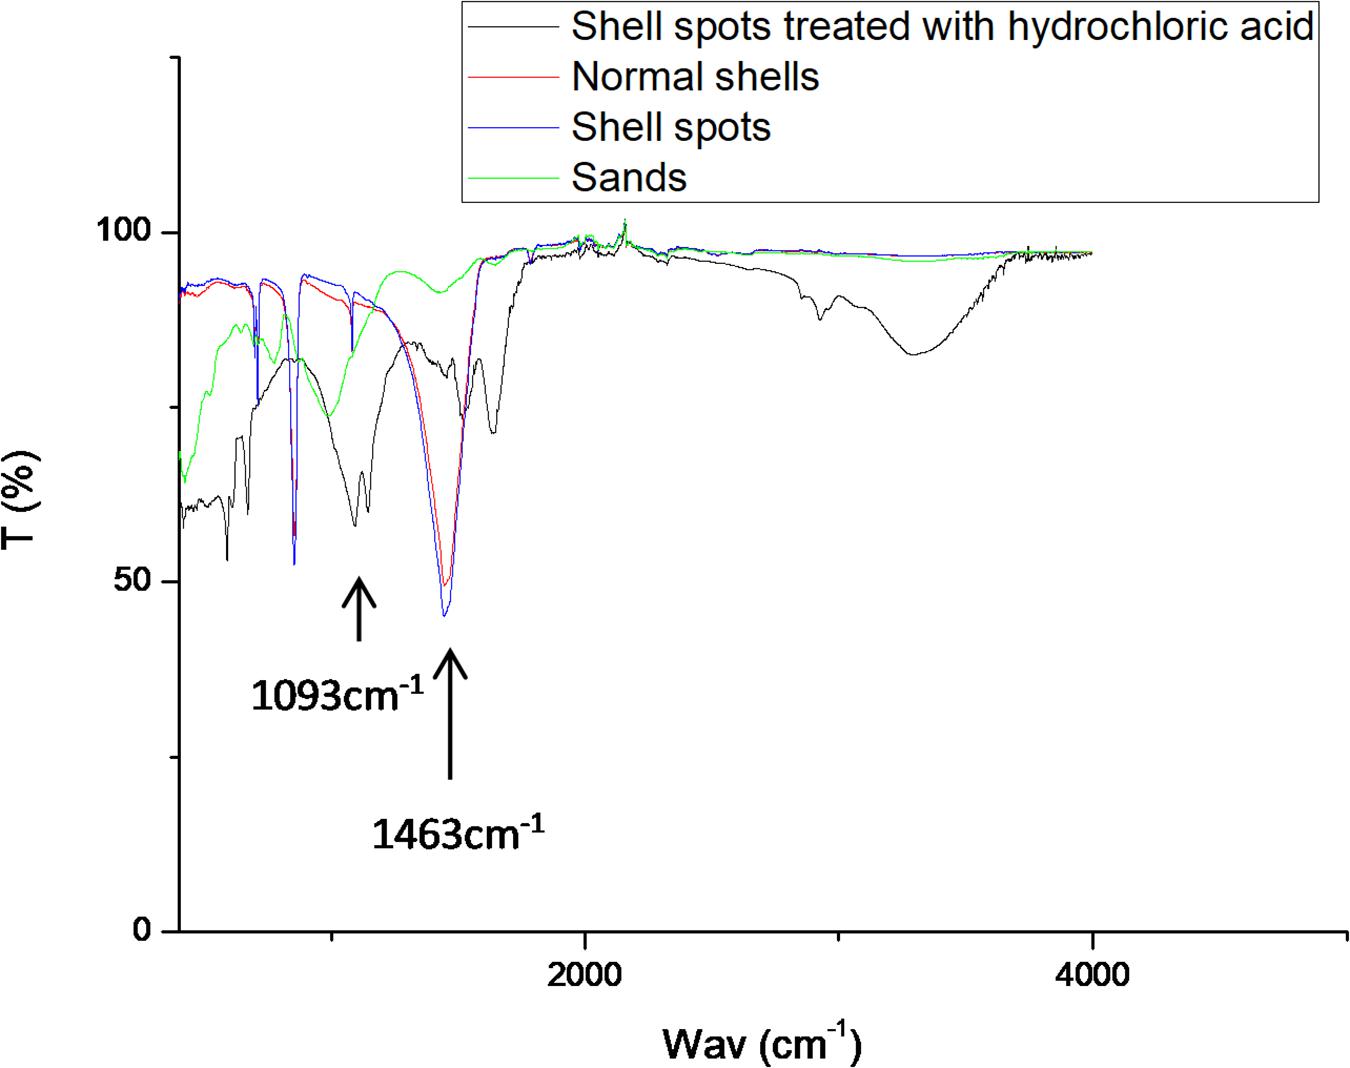
Figure 8. Infrared spectra results of shell spots treated with hydrochloric acid, normal shells, shell spots, and sands.
Element analysis is the most important initial step in material identification. Kai et al. (2011) performed a rapid qualitative determination of air pollution particles using SEM-EDS and pointed out that energy spectrum could effectively determine the composition of particles. The energy spectrum in the current study showed that CaCO3 was the main component of shells with spots, however, the significant difference in Si content compared with normal shells suggested that the presence of spots was linked to Si. In the natural environment, SiO2 is the most common and stable state of Si; thus, we hypothesize that the yellow-brown spots in the shells are grains of sand from the sea. The X-rd results showed thousands of material identification peaks, which might be the result of the variety of complex substances in the samples themselves (Shishonok et al., 2016), which is a known problem in the X-ray detection of biological samples. The characteristic peaks of several SiO2 crystals were found (Figure 6), but were not obvious. This might be because the Si content is low and the characteristic peaks were covered by the main peaks representing CaO3. However, the range of peaks characteristic of Si were revealed following amplification by laser Raman spectroscopy. Differences between shells with spots and normal shells were found, such as the bending vibration peak of Si-O bond, which indicated that SiO2 crystals were present in shells with spots.
To further confirm the composition of shell spots, acid treatment was carried out. Hydrochloric acid does not react with SiO2, whereas CaCO3 are dissolved by hydrochloric acid; thus, any SiO2 hidden in shells can be exposed and, thus, be easily detected. As hypothesized, the infrared spectra of spots after acid digestion were consistent with those of sand, and the characteristic peaks of Si-O-Si curves were obvious, also consistent with that of SiO2. Therefore, the spots on the inner surface of M. veneriformis shell were a mixture of sand (SiO2) and calcium carbonate.
The source of the sand can be hypothesized based on the sampling location and lifestyle habits of clams. Clam samples were collected in the waters of the Yellow River delta in Dongying City, at the mouth of the Yellow River. The clam larvae were bred in a laboratory under artificial conditions. When clams were transferred from their original breeding sites to the Yellow River delta, their living environment changed significantly, including its salinity, temperature, and water pressure. Therefore, clams have to adapt to the changes in their environment (Yuan et al., 2000), which can cause some physical dysfunctions in the larvae themselves.
The inflow of Yellow River water is the main reason for the increased sand content in the local marine aquaculture environment. After the Yellow River sediment enters the sea, most of it will be naturally deposited, whereas some of the suspended load will be adsorbed by plankton (Kirk, 2010). Similar to other bivalves, M. veneriformis are filter-feeders. Filter feeding is a low-level mechanical physical selection of food and, therefore, clams are likely to take in grains of sand of an appropriate size into their pallial cavity, which are then deposited in the inner shell. Compared with sea water in other coastal areas, the inflow of Yellow River results in the sea water in this region containing a high concentration of colloids (Benoit et al., 1994; Martin and Dai, 1995), which would increase the suspension property of sand.
Shell formation involves the thickening of the inner surface of shell and extension of the shell edge. The inner membrane of the mantle is responsible for thickening the inner surface of the shell, whereas the edge of the mantle is responsible for extending the shell edge. Thus, given the large amount of suspended sand in sea water in the Yellow River delta, M. veneriformis might filter food mixed with grains of sand into its body, resulting in some sand grains becoming attached to the inner surface of the shell, and gradually being covered with calcium carbonate deposits, sealing the sand grains within the inner surface of the shell, forming the spots. Calm shells may be prone to embed sand spots in the area where water turbidity is significantly higher.
Therefore, the yellow-brown spots on the inner shell surface of M. veneriformis are a mixture of sand and calcium carbonate, and possibly formed by the sand grains that enter mantle cavity and then embed into the shells. These spots may be not caused by pollution, but by environmental factors.
All datasets generated for this study are included in the manuscript/supplementary files.
Ethical review and approval was not required for the animal study because Mactra veneriformis is not an endangered or protected species and is not a vertebrate.
XTW conceived and designed the experiments. CH, WY, and QJ performed the experiments. BZ and LW analyzed the data. BZ, WG, and XNW contributed the reagents, materials, and analysis tools. XTW, CH, and WY wrote the manuscript. All authors reviewed the manuscript.
This study was supported by National Key R&D Programmes of China (No. 2018YFD0901400), the National Natural Science Foundation of China (Nos. 41876193 and 41906088), the Key R&D Program of Shandong Province, China (No. 2018GHY115027), the Special Funds for Taishan Scholars Program of Shandong Province, China (No. tsqn201812094), the Natural Science Foundation of Shandong Province, China (No. ZR2019MC002), the Fine Agricultural Breeds Project of Shandong Province, China (2019LZGC020), the Modern Agricultural Industry Technology System of Shandong Province, China (SDAIT-14-03), and the Key R&D Program of Yantai City, China (No. 2017ZH054).
The authors declare that the research was conducted in the absence of any commercial or financial relationships that could be construed as a potential conflict of interest.
Benoit, G., Oktay-Marshall, S. D., Ii, A. C., Hood, E. M., Coleman, C. H., Corapcioglu, M. O., et al. (1994). Partitioning of Cu, Pb, Ag, Zn, Fe, Al, and Mn between filter-retained particles, colloids, and solution in six texas estuaries. Mar. Chem. 45, 307–336. doi: 10.1016/0304-4203(94)90076-0
Boyd, I. W., and Wilson, J. I. B. (1982). A study of thin silicon dioxide films using infrared absorption techniques. J. Appl. Phys. 53, 4166–4172. doi: 10.1063/1.331239
Chen, H. S., Sun, Z. Y., and Shao, J. C. (2011). Investigation on FT-IR spectroscopy for eight different sources of SiO_2. Bull. Chin. Ceramic Soc. 30, 934–937.
Fang, Y., Yang, H., Wang, T., Liu, B., Zhao, H., and Chen, M. (2010). Metallothionein and superoxide dismutase responses to sublethal cadmium exposure in the clam mactra veneriformis. Comp. Biochem. Physiol. Toxicol. Pharmacol. 151, 325–333. doi: 10.1016/j.cbpc.2009.12.005
Hao, S., Hou, X., Wei, L., Li, J., Li, Z., and Wang, X. (2015). Extraction and identification of the pigment in the adductor muscle scar of pacific oyster crassostrea gigas. PLoS One 10:e0142439. doi: 10.1371/journal.pone.0142439
Haslberger, A. G. (2006). Need for an “integrated safety assessment” of GMOs, linking food safety and environmental considerations. J. Agric Food Chem. 54, 3173–3180. doi: 10.1021/jf0511650
Huang, C. Y., Chen, Q. X., Xiong, Z. Y., Feng, Y. J., Li, Y. Q., and Wang, H. (2012). Investigation on the infrared absorption spectrum of pearl and nacre. Adv. Mate. Res. 528, 156–159. doi: 10.4028/www.scientific.net/amr.528.156
Huang, J., Liu, C., Xie, L., and Zhang, R. (2018). Amorphous calcium carbonate: a precursor phase for aragonite in shell disease of the pearl oyster. Biochem. Biophys. Res. Commun. 497, 102–107. doi: 10.1016/j.bbrc.2018.02.031
Kai, W., Lundkvist, J., Seisenbaeva, G., and Kessler, V. (2011). New tabletop SEM-EDS-based approach for cost-efficient monitoring of airborne particulate matter. Environ. Poll. 159, 311–318. doi: 10.1016/j.envpol.2010.08.024
Kirk, K. L. (2010). Suspended clay reduces daphnia feeding rate. Freshwater Biol. 25, 357–365. doi: 10.1016/j.chemosphere.2015.12.037
Leite, S. Q. M., Colodete, C. H. A., Dieguez, L. C., and San Gil, R. A. S. (2000). Extração de ferro de esmectita brasileira com emprego do método ditionito-citrato-bicarbonato. Química Nova 23, 297–302. doi: 10.1590/s0100-40422000000300002
Lippincott, E. R., Valkenburg, A. V., and Weir, C. E. (1958). Infrared studies on polymorphs of silicon dioxide and germanium dioxide. J. Res. Nat. Bureau Stand. 61, 61–70.
Marinoni, N., and Broekmans, M. A. T. M. (2013). Microstructure of selected aggregate quartz by XRD, and a critical review of the crystallinity index. Cement Concrete Res. 54, 215–225. doi: 10.1016/j.cemconres.2013.08.007
Martin, J. M., and Dai, M. H. (1995). Significance of colloids in the biogeochemical cycling of organic carbon and trace metals in the venice lagoon (Italy). Limnol. Oceanogr. 40, 119–131. doi: 10.4319/lo.1995.40.1.0119
Seiber, J. N., and Kleinschmidt, L. A. (2011). Contributions of pesticide residue chemistry to improving food and environmental safety: past and present accomplishments and future challenges. J. Agric Food Chem. 59, 7536–7543. doi: 10.1021/jf103902t
Shishonok, E. M., Luhin, V. G., and Steeds, J. W. (2016). XRD doping control of light-emitting cbn with a large size mismatch between the dopant and intrinsic atoms. World J. Eng. Technol. 04, 174–185. doi: 10.4236/wjet.2016.43d021
Stephenson, M., Smith, D. R., Goetel, J., Icnikawa, G., and Martin, M. (1986). Growth abnormalities in mussels and oysters from areas with high levels of tributyltin in san diego bay oceans 86. Organ. Symp. 4-5, 1246–1251.
Ye, W. U. (2008). How to Identify the Group of Silicon Dioxide by Raman Spectrum. Yunnan: Yunnan University.
Keywords: Yellow River Delta, Mactra veneriformis, shell spots, biomineralization, SEM-EDS, X-ray diffraction, laser Raman spectrum, Fourier infrared spectrum scanning
Citation: He C, Zhang B, Wei L, Yu W, Jiang Q, Wang X, Guo W and Wang X (2019) Silicon Dioxide (SiO2) Is the Most Important Component of Spots on the Inner Surface of Mactra veneriformis Shells. Front. Mar. Sci. 6:651. doi: 10.3389/fmars.2019.00651
Received: 02 August 2019; Accepted: 04 October 2019;
Published: 16 October 2019.
Edited by:
Libin Zhang, Chinese Academy of Sciences, ChinaReviewed by:
Vengatesen Thiyagarajan, The University of Hong Kong, Hong KongCopyright © 2019 He, Zhang, Wei, Yu, Jiang, Wang, Guo and Wang. This is an open-access article distributed under the terms of the Creative Commons Attribution License (CC BY). The use, distribution or reproduction in other forums is permitted, provided the original author(s) and the copyright owner(s) are credited and that the original publication in this journal is cited, in accordance with accepted academic practice. No use, distribution or reproduction is permitted which does not comply with these terms.
*Correspondence: Xiaotong Wang, d2FuZ3hpYW90b25nOTk5QDE2My5jb20=
†These authors have contributed equally to this work
Disclaimer: All claims expressed in this article are solely those of the authors and do not necessarily represent those of their affiliated organizations, or those of the publisher, the editors and the reviewers. Any product that may be evaluated in this article or claim that may be made by its manufacturer is not guaranteed or endorsed by the publisher.
Research integrity at Frontiers
Learn more about the work of our research integrity team to safeguard the quality of each article we publish.