 Sharon L. Walker
 Edward T. Baker
 John E. Lupton3
 Joseph A. Resing
- 1NOAA/Pacific Marine Environmental Lab, Seattle, WA, United States
- 2University of Washington-JISAO and NOAA/PMEL, Seattle, WA, United States
- 3NOAA/Pacific Marine Environmental Lab, Newport, OR, United States
Extensive deep (>1500 m) non-hydrothermal ash-rich plumes were present in the water column surrounding West Mata submarine volcano (NE Lau basin) during eruptive phases, but were absent when West Mata was quiescent. Deep ash plumes were chemically distinct from hydrothermal plumes originating at West Mata and other hydrothermal sources in the region, and were dominated by very fine shards compositionally similar to the lava erupting at the ∼1200 m summit with morphologies indicative of magma degassing and shattering. Deep ash plume layers occurred at variable water depths (and distances above the seafloor) and were transported by local currents to 10s of km from West Mata. We interpret these deep ash plumes to be syn-eruptively generated ash transported downslope via sediment gravity flows of varying magnitudes, runout distances, and liftoff densities. Final deposition of individual particles will be by settling from suspension (i.e., fallout deposits). The mechanism for initiating gravity flows is uncertain, but their spatial and temporal distribution suggests that eruption column collapse and/or mobilization of unstable volcaniclasts accumulating on steep slopes during the eruption are likely sources. Turbidity within the deep ash plumes decreased by 80% over a 3 week period in 2017, suggesting the eruption that created a new deposit, constrained between March 2016 and November 2017, was likely active as recently as a few weeks to months prior to the FK171110 expedition. Similar deep ash plumes have been observed surrounding other erupting submarine volcanoes. This pattern of syn-eruptive dispersal suggests that fine ash does not have to be lofted high into the water column in event plumes, or enter the ocean from subaerial sources, to be dispersed by local currents and contribute to fallout deposits in regional and distal sediments, which may appear as cryptotephra or thin ash layers if the ash supply exceeds pelagic sedimentation rates; deposits that are often attributed to subaerial eruptions alone. These results also suggest that the presence of deep ash plumes surrounding a submarine volcanic edifice, along with a magmatic-hydrothermal plume above the summit, may be a valuable diagnostic exploration tool for identifying active, or very recently active, submarine eruptions.
Introduction
The majority of volcanic activity on Earth occurs on the ocean floor (Crisp, 1984; White et al., 2003), yet the processes that connect deep-sea (>500 m) eruption dynamics to resulting volcaniclastic deposits, especially to the fine fractions of the sedimentary record, are rarely studied in real time due to the considerable challenges of detecting and accessing unpredictable events at remote seafloor locations (Baker et al., 2012; Rubin et al., 2012). As a result, conceptual models infer submarine eruption processes, volcaniclast transport and deposition, and the eruptive histories and evolution of volcanic regions by characterizing deposits on the seafloor (e.g., Head and Wilson, 2003; Clague et al., 2009; Watt et al., 2019), in volcaniclastic layers in marine sediment cores (e.g., Sigurdsson et al., 1980; Hawkins et al., 1994; Schindlbeck et al., 2013; Cassidy et al., 2014), and ancient deposits now accessible on land (e.g., Cashman and Fiske, 1991; White et al., 2003; Németh et al., 2008; Allen and McPhie, 2009; Cas and Giordano, 2014), These methods typically focus on visible deposits that range from millimeters to >100 m in thickness.
Volcaniclastic aprons on the flanks of volcanic islands and submarine volcanoes have morphological textures, bedforms, and internal structures that indicate mobilization and deposition by large-scale sediment gravity flows of either primary or reworked material on proximal-to-regional scales (e.g., Wright, 1996; Chadwick et al., 2005; Embley et al., 2014b; Pope et al., 2018) (see Appendix A of Walker et al., 2008 and Supplementary Table S1 for review of terminology used here). Sediment gravity flows, however, encompass a wide range of flow types, particle sizes and concentration, and mechanisms for initiating and maintaining the flow. Many factors can be determined from the characteristics of resulting deposits (e.g., Middleton and Hampton, 1976; Fisher, 1983; Mulder and Alexander, 2001; Manville and Wilson, 2004), but care must be taken to avoid misinterpretations (Cassidy et al., 2014).
Fine and very fine volcanic ash fallout deposits occur globally as visible layers in marine sediments and have long been used as chronological markers of significant explosive subaerial eruptions (e.g., Austin et al., 2014, and references therein). Despite recent direct observations of explosive deep sea eruptions (Chadwick et al., 2008; Deardorff et al., 2011; Resing et al., 2011), and known mechanical processes for producing fine ash that are not depth-limited (e.g., Cas and Simmons, 2018, and references therein), potential submarine volcanic sources for distal fallout deposits are often minimized or ignored due to predicted limitations on fine ash production by confining pressures in the deep sea and/or physical properties of seawater that would inhibit long-distance transport of explosively launched volcaniclasts in the submarine environment (e.g., Clift and Lee, 1998; Head and Wilson, 2003; Cas and Simmons, 2018). Instead, fine ash deposits that are located more than a few kilometers from potential submarine volcanic sources are often categorized as reworked turbidites since gravity flows are well-known to transport sediments 10s of km over even relatively gentle slopes (e.g., Middleton and Hampton, 1976; Dade and Huppert, 1995). Yet, it can be difficult to distinguish the distal reaches of volcanic turbidites from fallout deposits, regardless of a subaerial or submarine source (Cassidy et al., 2014; Gill et al., 2018; Watt et al., 2019).
Methods for separating and characterizing cryptotephra (very small “invisible” volcaniclasts in low concentrations that do not form discrete layers) in sediment cores (e.g., Blockley et al., 2005; McCanta et al., 2015) have improved recognition of the contribution of submarine volcanism to fine ash fallout deposits in sediments. Gill et al. (2018), reevaluated very fine sediment units (muds and mudstones) previously considered hemi-pelagic background sediments in Izu rear arc cores (Tamura et al., 2015) and found they were actually >75% very fine ash sourced from regional submarine volcanoes deeper than 1000 m. Still, many studies conclude cryptotephra in marine sediments are the distal and ultra-distal fallout deposits from subaerial eruptions (e.g., Lowe, 2011, 2014), and dismiss the likelihood of submarine volcanic sources, even when some ashes cannot be geochemically correlated with known subaerial events and multiple submarine volcanoes are located in the region (Kohn and Glasby, 1978; Pillans and Wright, 1992; Scudder et al., 2009, 2014). This is likely due to the limited amount of data from potential submarine sources that would be necessary to confirm correlations (Shane et al., 2006).
Fallout deposits from recent, documented submarine eruptions have been sampled at mid-ocean ridges (Clague et al., 2009), including at depths exceeding 4000 m (Sohn et al., 2008; Barreyre et al., 2011), where unconsolidated volcaniclastic ash and sand with morphologies indicating strombolian or hawaiian (lava fountain) eruption styles were found draped atop lava flows or mixed within pelagic sediments. Dispersal distances of 5–10 km from known or presumed vents were much further than predicted by the Head and Wilson (2003) momentum-driven model for these eruptive styles. Clague et al. (2009) and Barreyre et al. (2011) invoke entrainment of volcaniclasts into buoyant event plumes, which rise high into the water column above eruptive vents (Baker, 1995, 1998; Baker et al., 2011), and subsequent settling from suspension as the primary mechanism for transport to the fallout deposits they sampled. However, Barreyre et al. (2011) also found that their model results significantly underestimated the dispersal distances of the ash deposits they mapped, even though they experimentally measured settling velocities of individual particles, applied local water column stratification parameters and current speeds, and assumed entrainment in high-energy event plumes (with rise heights as great as 2500 m above the seafloor).
The serendipitous discovery, in 2008, of an explosive and effusive volcanic eruption at the ∼1200 m deep summit of West Mata, a submarine volcano located in the NE Lau basin, led to a multi-year, multi-parameter time series at a persistently active, deep, rear-arc submarine volcano. This was the second deep-sea eruption to be directly observed, the first being NW Rota-1 in the Mariana arc where an explosive strombolian eruption, at ∼550 m water depth, was also nearly continuous for several years (Embley et al., 2006; Resing et al., 2007; Chadwick et al., 2008, 2012, 2014; Walker et al., 2008; Butterfield et al., 2011; Deardorff et al., 2011; Dziak et al., 2012; Schnur et al., 2017). As with NW Rota-1, the eruption at West Mata has been documented by direct Remotely Operated Vehicle (ROV) observations and video recordings (Resing et al., 2011), analyses of magmatic-hydrothermal plume chemistry (Baumberger et al., 2014), hydroacoustic monitoring (Bohnenstiehl et al., 2014; Caplan-Auerbach et al., 2014; Dziak et al., 2015), and repeat bathymetric surveys (Clague et al., 2011; Embley et al., 2014a; Chadwick et al., 2019). This paper describes the multi-year record of regional water column surveys that mapped episodic, widely distributed, volcanically sourced, deep (i.e., deeper than the eruptive vents at the summit of West Mata) particle plumes (“deep ash plumes”) that were chemically distinct from hydrothermally sourced plumes, and closely associated with periods of eruptive activity at West Mata.
The plumes described here are similar to eruption-fed, laterally dispersing, particle plumes comprising very fine, fresh glass shards and bubble wall fragments, and devoid of magmatic-hydrothermal components that have been found in the water column, at depths deeper than eruptive vents, surrounding other explosively erupting submarine volcanoes [i.e., Kavachi (Solomon Islands, Baker et al., 2002), NW Rota-1 (Mariana arc, Walker et al., 2008), Monowai (Kermadec arc, Walker et al., 2010), and others (Supplementary Table S2)]. At NW Rota-1, anhydrite crystals in the deep ash plumes provided evidence that these plumes had originated at the eruptive vents near the summit at ∼550 m and traveled rapidly downslope before dispersing laterally to arrive at the depths (∼600 to >2000 m) and distances where they were found (Walker et al., 2008). Based on the inventory of horizontally dispersing ash suspended in the water column surrounding NW Rota-1, as much as 0.7–3.5 × 10⁸ kg of fine ash (equivalent to 0.4–2.0 × 10⁵ m3) could be delivered per year to regional and distal fallout deposits. Individual particles might travel 10s to 100s of kilometers before settling out of the water column depending on particle size, the distance of the laterally dispersing deep ash plume layer above the seafloor, and local current speeds. An eruption column collapse observed near the vent (Figure 3 of Walker et al., 2008; Figure 7 and Movie 7 of Chadwick et al., 20081) and small-scale grain flows easily triggered by ROV movements, showed that (a) mobilization of unstable material accumulating on the steep slopes, and (b) eruption column collapse and base surges were likely mechanisms for initiating sediment gravity flows that delivered fine ash produced by the explosive eruption to the deep ash plumes.
Geologic Setting and Recent Eruptive History at West Mata Volcano
Extensive hydrothermal activity in the NE Lau basin was suspected when Lupton et al. (2004) described a regional 3He plume near Samoa that was distinct from the 3He signal advecting 6000 km across the Pacific from the East Pacific Rise. Since then, several expeditions have explored the area and found a remarkably diverse collection of volcanic and hydrothermal sites in this region (Embley et al., 2009; Kim et al., 2009; Baker et al., 2019). Among the sites discovered was West Mata volcano, the largest and most active edifice in a cluster of nine similarly-shaped boninite volcanoes located in the rear-arc portion of the tectonically complex NE Lau basin (Figure 1). West Mata lies ∼20 km west of the active Tofua volcanic arc, 40 km east of the back-arc NE Lau Spreading Center (NELSC), and 30 km south of the east-west portion of the Tonga trench. The Mata volcanoes are surrounded by a depression with deepening bathymetry (by ∼400–700 m) toward the trench to the north. This bathymetric depression is generally defined by the 2500 m contour (Figures 1, 2), and for the purposes of this study we call it the Mata Depression (MD). The bases of the Mata volcanoes are at depths ranging from ∼2600 m at East Mata to >3000 m around the North Matas. The summit of West Mata is ∼1200 m water depth, while the summit of East Mata volcano, 8 km to the east, is ∼1270 m. The North Mata volcanoes, which are more closely spaced than West and East Mata, lie 7–20 km northwest of West Mata and the summits are significantly deeper (1830 to 2680 m below sea level). All but two of the Mata group volcanoes (Taha and Nima) are hydrothermally active.
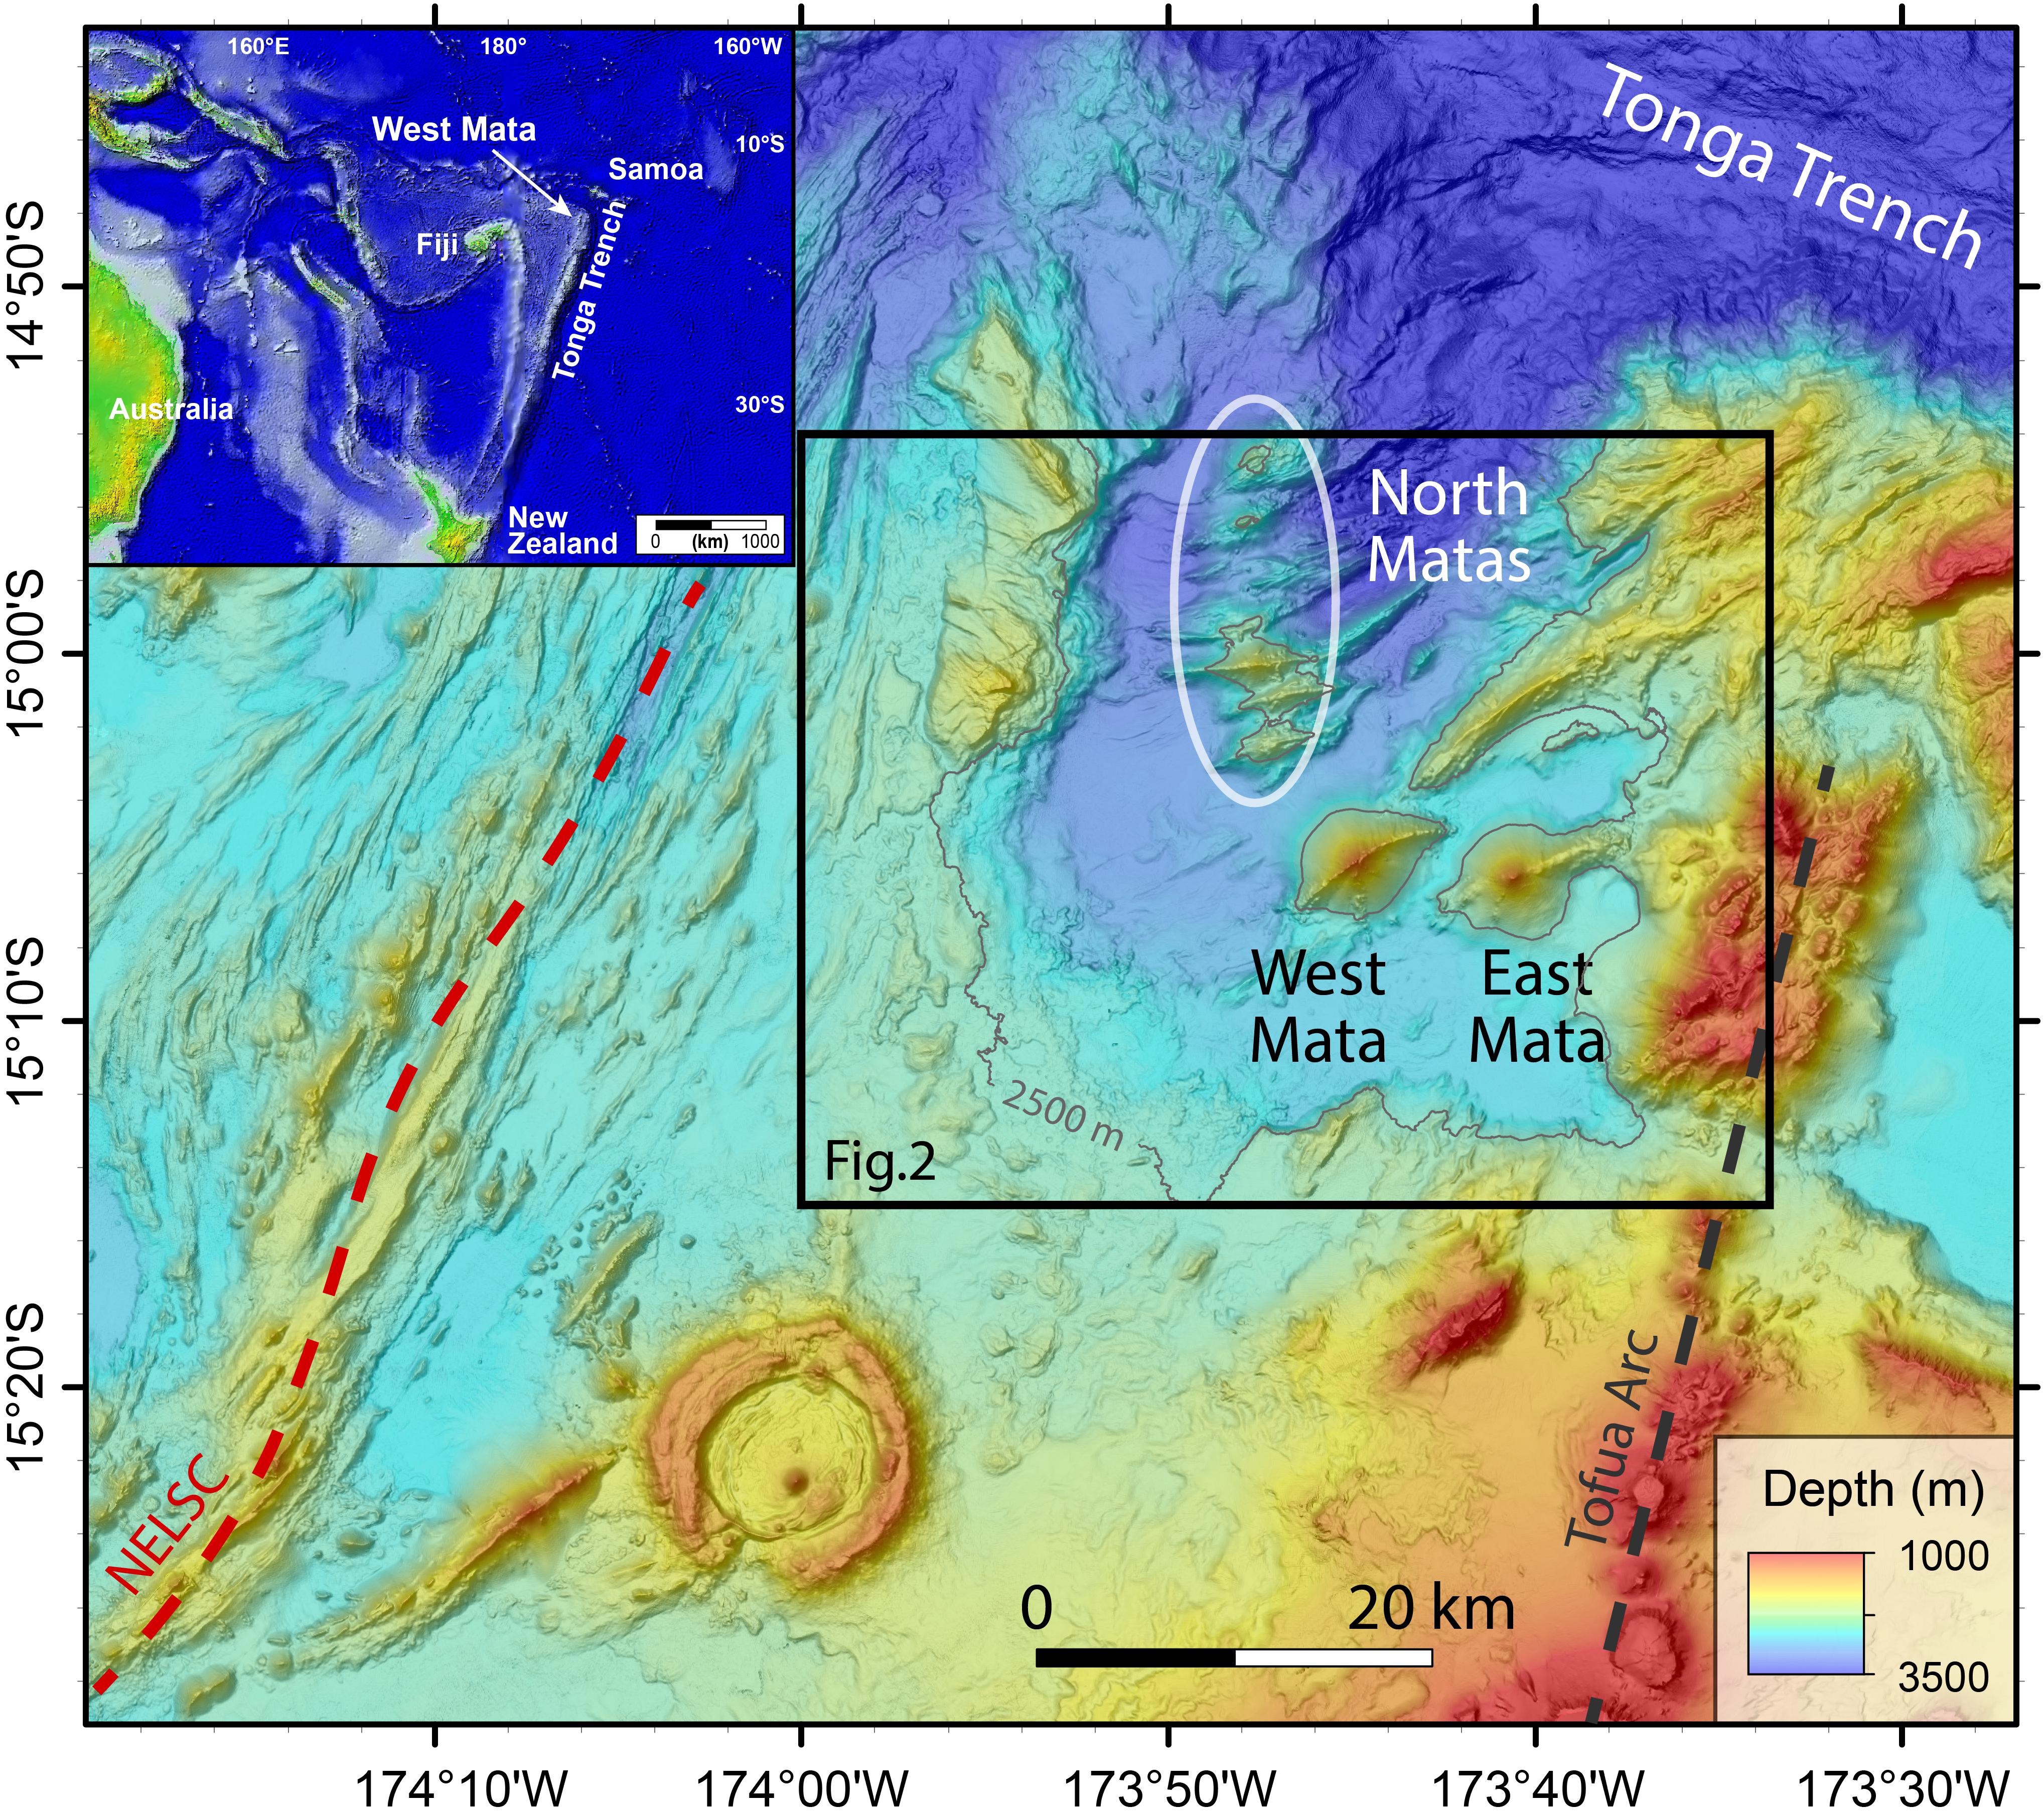
Figure 1. Regional map of the NE Lau basin showing location of West Mata, East Mata and the North Mata volcanoes relative to the Tofua volcanic arc (gray dashed line), NELSC (red dashed line), and Tonga trench (labeled). The black box outlines the area of the map in Figure 2. Inset shows location of the region in the Southwest Pacific Ocean. See Figure 4 for North Mata volcano names. The 2500 m depth contour (solid gray line, shown only within the black box) generally defines the Mata Depression (MD).
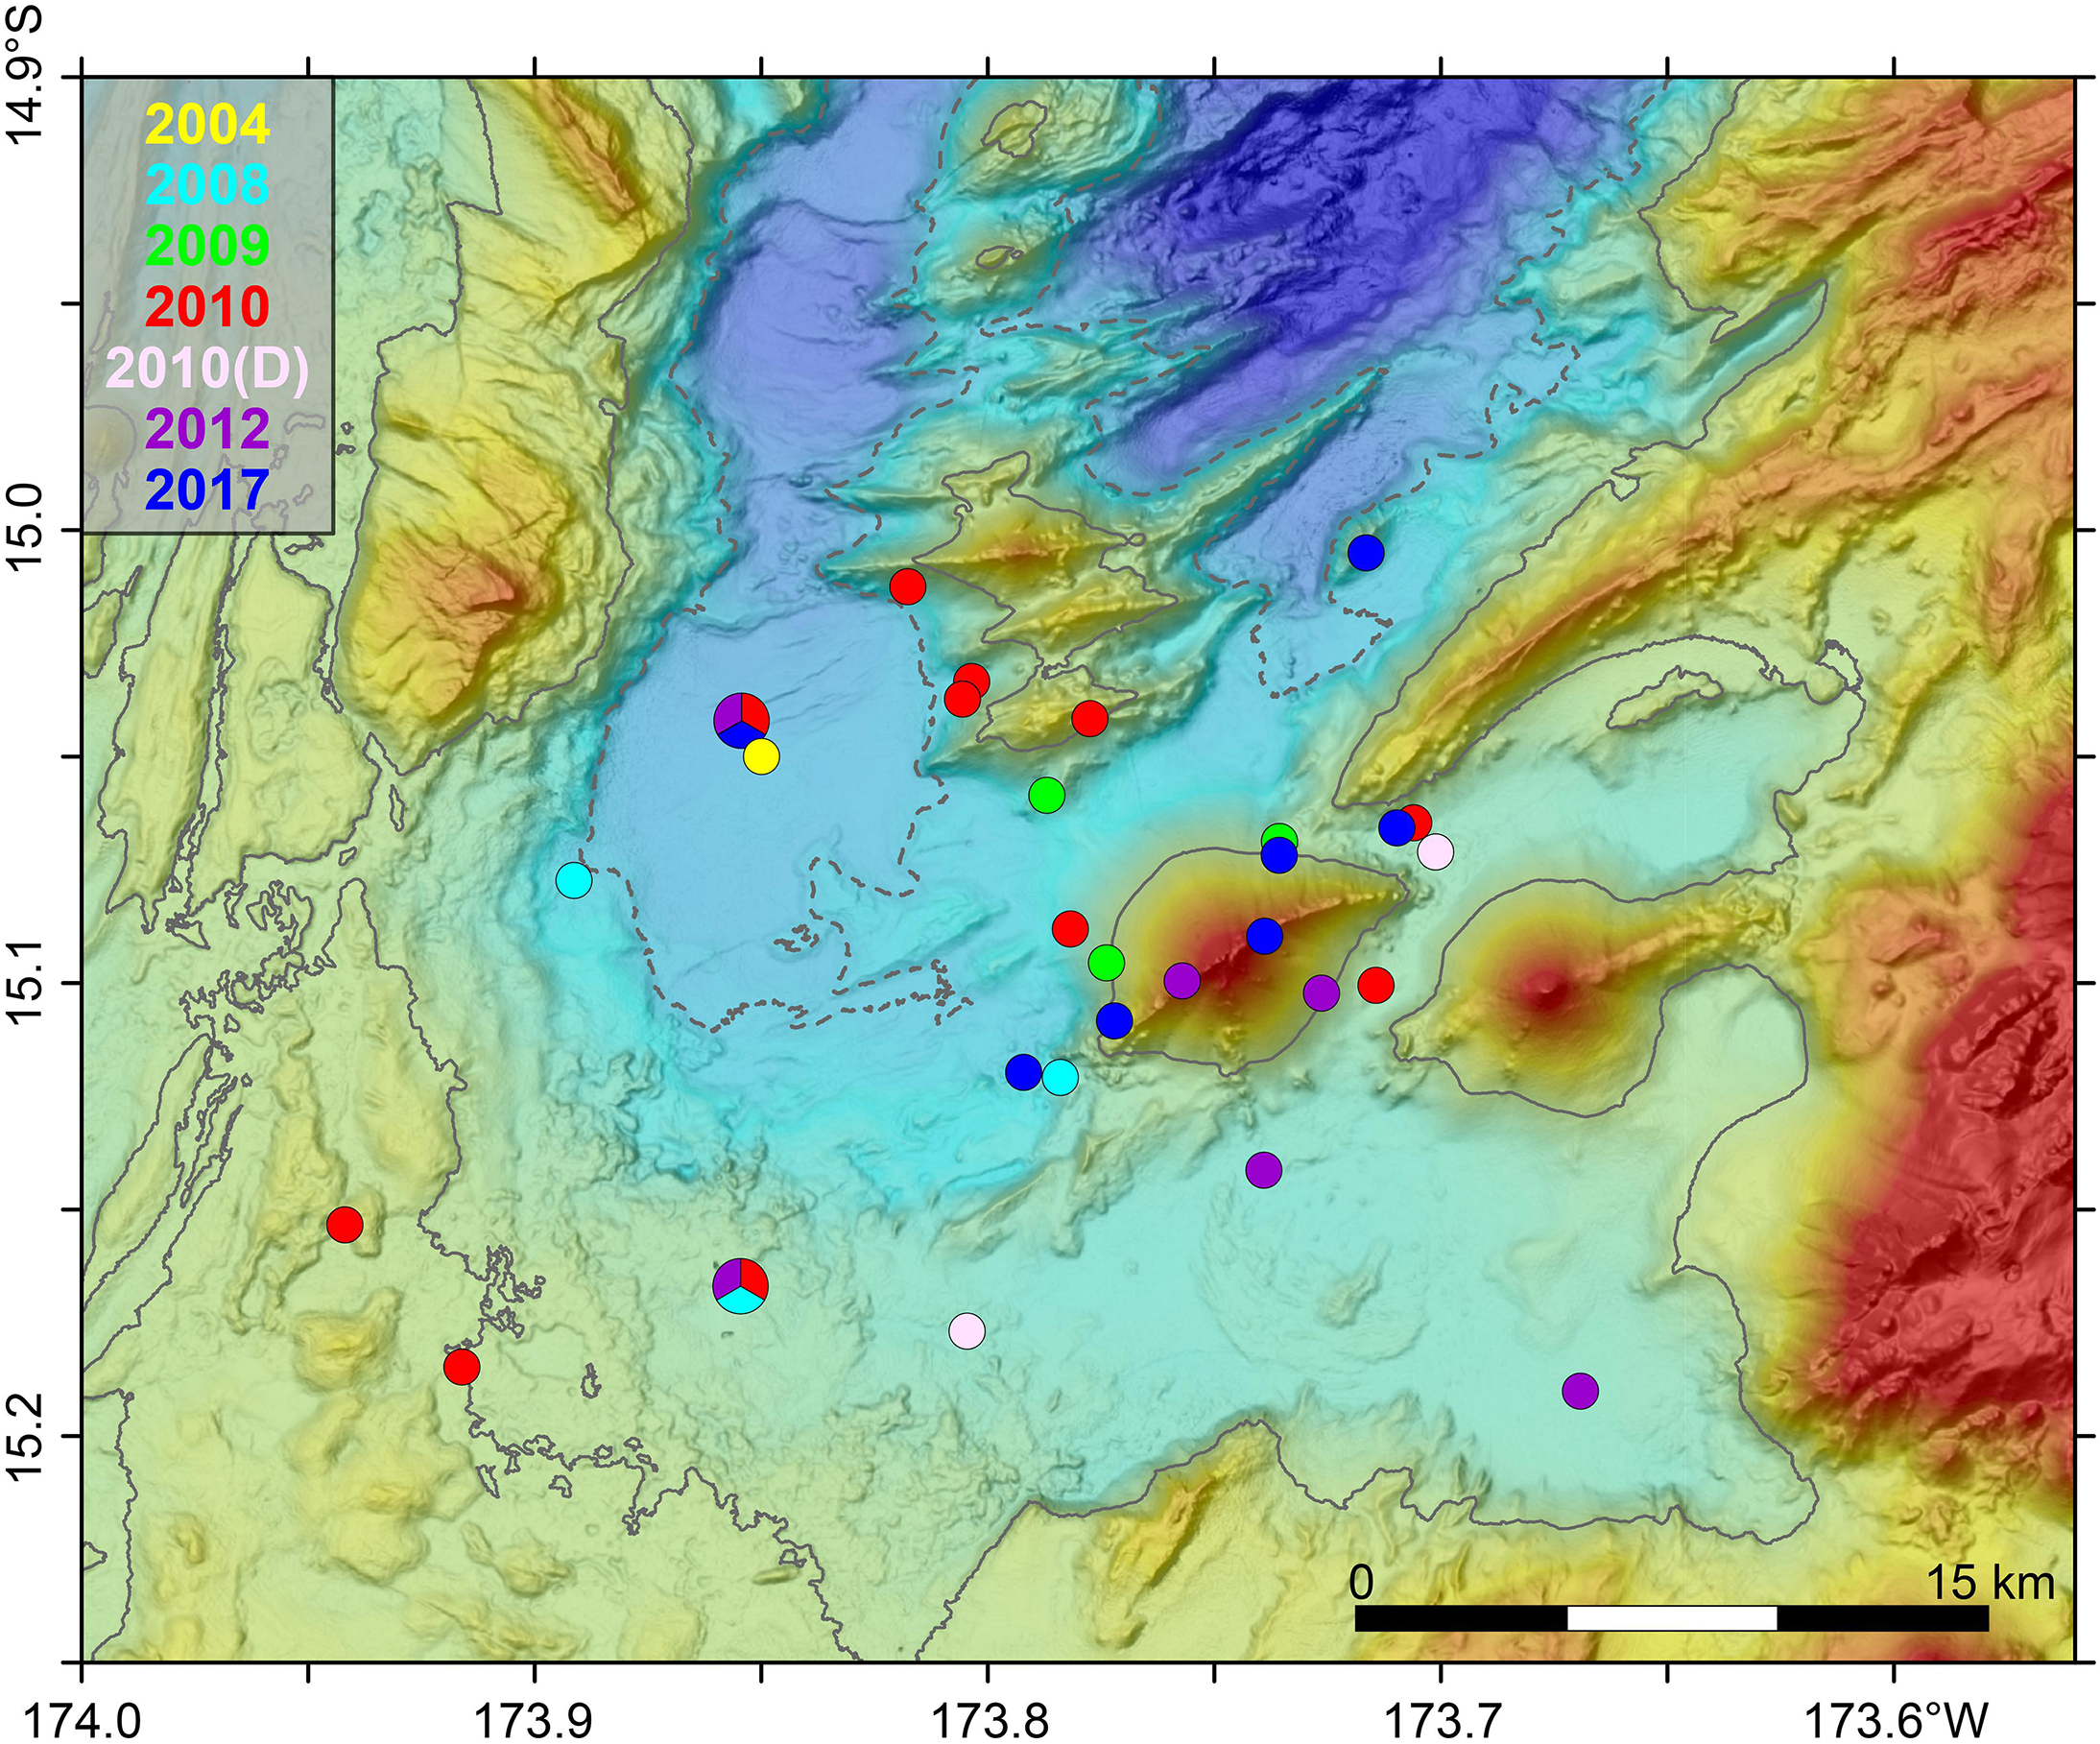
Figure 2. Station locations for all profiles (2004 through 2017) used in this study. Symbol color indicates year. Larger multi-color symbols indicate station locations that were repeated in more than 1 year, with colors indicating which years that location was sampled. Depth contour intervals are: solid gray line = 2500 m, dashed gray line = 3000 m. See Supplementary Figure S1 for each location labeled with station name, and Supplementary Table S4 for a list of station locations. For CTD tows, only the initial downcast (↓) or final upcast (↑) was used, as indicated by arrows in labels for Figure 3 and Supplementary Figure S1.
West Mata was one of two sites discovered to be erupting during a 2008 expedition aimed at systematically surveying the water column throughout the NE Lau basin for evidence of hydrothermal activity (Baker et al., 2011, 2019; Resing et al., 2011). The eruption at West Mata was indicated by: (1) an unusually intense magmatic-hydrothermal plume rising more than 170 m above the summit with significant anomalies of temperature, turbidity, and oxidation–reduction potential (ORP), (2) high concentrations of magmatic gasses (3He, CO2, and SO2) and total dissolvable Fe and Mn, (3) extremely high concentrations of dissolved H2 (>14,000 nM) from the interaction of seawater and/or magmatic water with molten rock (Sansone and Resing, 1995), and (4) numerous sharp-edged mineral/glass shards (Baker et al., 2011; Resing et al., 2011; Baumberger et al., 2014).
Subsequent expeditions to West Mata with ROVs (2009 and 2012) resulted in direct observations of explosive and effusive eruptive activity at summit vents in 2009 (Resing et al., 2011), and that the eruptive phase appeared to have completely subsided by the time of the 2012 expedition (Baumberger et al., 2014; Embley et al., 2014a). Evidence for continued explosive activity through 2010 and 2011 came from repeat bathymetric surveys, hydroacoustic monitoring (see below) and plume sampling (Baumberger et al., 2014; and this work).
Hydroacoustic monitoring between January 2009 and August 2011 provided insight into the long-term intensity and duration of eruptive activity at West Mata volcano. Moored hydrophones recorded sounds from lava bubble bursts, explosive and degassing events, and landslides (Bohnenstiehl et al., 2014; Caplan-Auerbach et al., 2014; Dziak et al., 2015). The activity was nearly continuous through 2009, with a noticeable increase after the September 29, 2009 great Samoan earthquake, then becoming less intense and more sporadic during 2010 until there was a complete absence of explosions by mid-2011. Effusive activity, which may be too quiet for detection by the moored hydrophones, probably continued a while longer (Dziak et al., 2015), but no new eruptive deposits >10 m were detected between the repeat bathymetric surveys of November 2011 and September 2012 (Embley et al., 2014a). Consistent with these data, observations during ROV dives in September 2012 showed the volcano to be quiescent, though hydrothermal venting persisted (Baumberger et al., 2014; Embley et al., 2014a; Baker et al., 2019).
Cycles of constructional deposition and mass wasting at West Mata were demonstrated by Clague et al. (2011) and Embley et al. (2014a) through analyses of repeat bathymetric surveys. The six time periods spanned by seven different multibeam surveys from 1996 to 2012 showed growth, destruction, or both, on the summit, flanks and at the southwest base of West Mata. The volume of new deposits ranged from 3.5 × 10⁵ to 7.6 × 10⁷ m3, adding a total of 1.5 × 10⁸ m3 between 1996 and 2012 (Embley et al., 2014a). Pit craters formed at the eruptive vent sites, and a landslide (extending ∼1 km from the summit down to ∼1900 m on the east flank) occurred between December 2010 and November 2011, accounting for most of the measurable losses. This landslide created a gouge as deep as 68 m near the summit. No estimate was made of the total volume removed, but 8.4 × 10⁵ m3 of this material was re-deposited downslope at depths between ∼1950–2400 m in a layer 10–20 m thick (Embley et al., 2014a).
Additional multibeam bathymetric surveys in March 2016 and November 2017 extend the time series beyond September 2012, and show that West Mata continued to be episodically active (Chadwick et al., 2019). Deposits emplaced during the 2012–2016 interval (total volume = 37.6 × 10⁶ m3) were located near the summit on the northeast flank, where lava flows partially infilled the previous east landslide area, and at the base of the edifice beyond the northeast rift zone (Chadwick et al., 2019). Of particular relevance to this study is an additional deposit (30–70 m thick) that erupted during the 2016–2017 interval, originating at the south edge of the ENE rift zone at ∼1530 m and extending downslope toward the east to a depth of 2530 m. Chadwick et al. (2019) used high resolution bathymetry and photographs from AUV surveys, and direct observations from ROV dives to describe this new deposit (total volume = 14 × 106 m3) as a series of overlapping, steep-sided, flat-topped plateaus made up of pillow lavas thickly overlain by coarse tephra near the eruptive vents (∼1530 m water depth), transitioning to a hummocky lobe of pillow lavas thinly dusted with tephra 300–600 m distant from the vents (∼1775–1900 m water depth), below which volcaniclastic deposits having smooth bathymetric texture extend at least 2.2 km downslope (to 2530 m depth). Bacterial mats were present on the tephra overlying the lava flows at shallower depths, and temperatures a few degrees above ambient were measured to ∼10 cm depth within these tephra deposits.
Materials and Methods
Plumes surveys were completed using conductivity-temperature-depth (CTD) vertical cast and/or tow-yo operations (Baker et al., 1995; Baker et al., 2016) utilizing a Seabird 9-11plus CTD system with integrated sensors for turbidity (measured by optical backscatter) and ORP, along with a rosette of 21 19-L Niskin bottles to collect discrete water samples. Cruises and station locations in 2004, 2008, 2009, 2010, 2012, and 2017 are summarized in Supplementary Tables S3, S4, respectively. Miniature Autonomous Plume Recorders (MAPR), which use the same turbidity and ORP sensors as the CTD, were added to the CTD wire to extend the vertical range during tows in 2009, to camera tows and dredges to supplement the CTD data in 2010, and to the AUV Sentry and ROV SuBastian for high-resolution near-bottom surveys in 2017. Figure 2 shows the locations of CTD profiles used in this study.
Turbidity anomalies are reported as dimensionless Nephelometric Turbidity Units (American Public Health Association, 1985) above the regional background (ΔNTU). The ORP sensor detects reduced hydrothermal chemical species (e.g., dissolved Fe2+, H2, sulfides) that oxidize rapidly in dispersing neutrally-buoyant hydrothermal plumes (Walker et al., 2007). ORP signals confirm that a source is (a) hydrothermal, and (b) relatively nearby [i.e., within ∼1–2 km, depending on vent source strength and local current speeds (Baker et al., 2016)]. ORP anomalies are identified by a negative change in potential (E, mV) and are expressed as either the time derivative (dE/dt, mV) that shows a greater change than the ambient drift over time, or as the magnitude of the overall drop in value for any given signal (ΔE, mV). Discrete water samples were selected by monitoring the turbidity and ORP data in real time to obtain plume and non-plume (background) water. Samples were analyzed for helium isotopes (3He and 4He, presented here as δ(3He)%) (see Supplementary Table S5) at the NOAA/PMEL Helium Isotope Laboratory (Newport, OR, United States) (Lupton, 1990), bulk particulate elemental composition by x-ray fluorescence spectrometry (XRF) (Feely et al., 1991), and the morphology of individual particles by scanning electron microscopy (SEM) (Resing et al., 2011).
Results
Hydrothermal vs. Non-hydrothermal Plume Sources
The magmatic-hydrothermal plume from the summit of West Mata was widely dispersed throughout the study area, demonstrated here by ΔNTU and δ(3He)% anomalies within the 1000–1270 m depth range (Figure 3), to distances of at least 20 km from the summit (Figure 2 and Supplementary Figure S1). Other shallow sites in the region can be eliminated as the source for this widespread plume due to excessive distance (>40 km) from the MD, different source depth than West Mata (i.e., Niua, the northernmost volcano on the Tofua volcanic arc), or having weak anomalies characteristic of low-temperature diffuse venting that would not be expected to extend beyond ∼1–2 km from the source (i.e., East Mata) (Baker et al., 2019). The characteristics of this plume have been described in detail elsewhere (Resing et al., 2011; Baumberger et al., 2014), including observations of how key components changed over time as the eruption evolved.
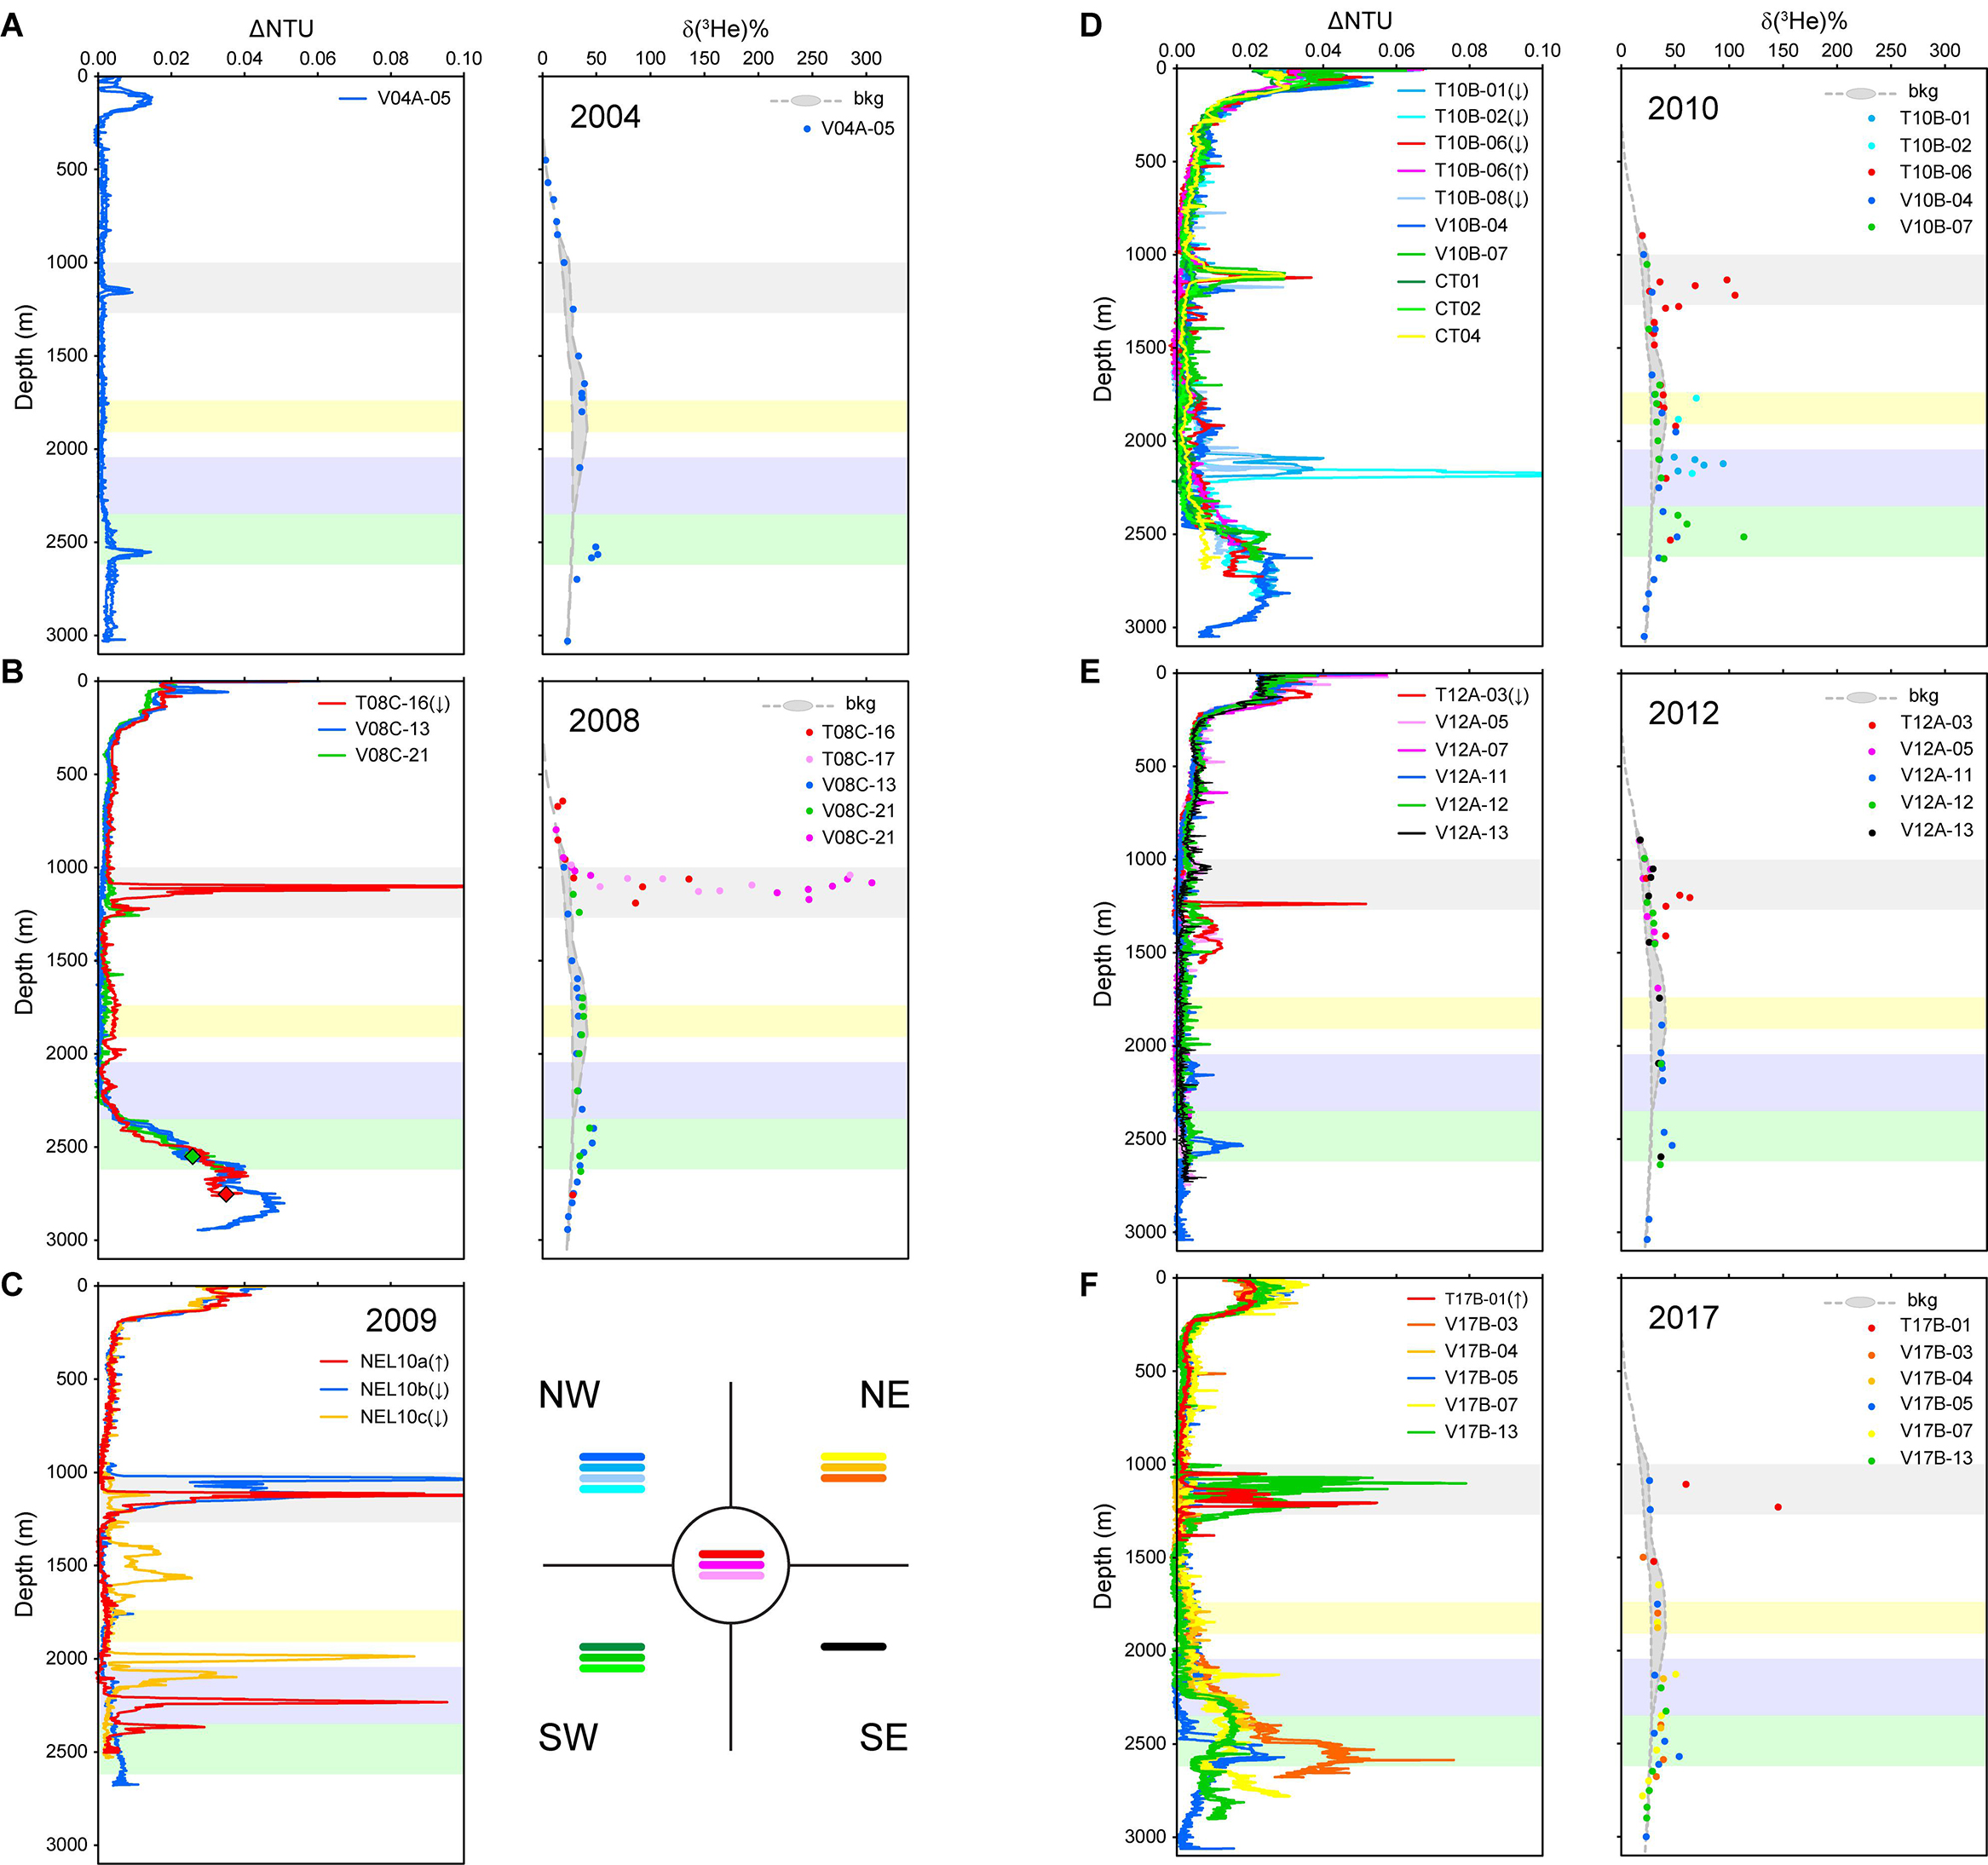
Figure 3. ΔNTU and δ(3He)% profiles for all years. δ(3He)% background (gray) shows the range of values typical of the regional “Samoa plume” of Lupton et al. (2004). Color bands show depth ranges where hydrothermal plumes from the summit of West Mata (gray) and the North Mata volcanoes are found (from Figure 4: yellow = Tolu, blue = Ua, and green = Fa/Ono/Fitu). (A) ΔNTU and δ(3He)% profiles from 2004; (B) ΔNTU and δ(3He)% profiles from 2008, diamond symbols show locations of samples shown in Figure 6; (C) ΔNTU and δ(3He)% profiles from 2009; (D) ΔNTU and δ(3He)% profiles from 2010 (May); (E) ΔNTU and δ(3He)% profiles from 2012; (F) ΔNTU and δ(3He)% profiles from 2017. No δ(3He)% is available for 2009, so 3c (right side) shows the color scheme used in all years to indicate the relative proximity or direction of each profile from West Mata (red/pinks = closest to West Mata summit, blues = NW quadrant, greens = SW quadrant, black = SE quadrant, yellow/gold/orange = NE quadrant).
The distribution of particle plumes in the deep (>1500 m) MD water column were highly variable between 2004 and 2017 (Figure 3). The single profile from 2004 indicated that there was at least one unidentified (at that time) deep hydrothermal source in the MD. The North Mata volcanoes were explored systematically in May 2010 by CTD and camera tows (Figure 4), which found all but two of the volcanoes in this group were hydrothermally active (Baker et al., 2019). ROV dives in 2012 and 2017 located high temperature vent fields on all of the North Mata volcanoes except Taha (only extinct chimneys found) and Nima (inactive, no ROV explorations) (Embley et al., 2013; Rubin et al., 2018). To date, the North Mata vent sites are the only known hydrothermal sources deeper than 2000 m in the NE Lau basin north of ∼15°30′ S and east of the NELSC (Baker et al., 2019). Due to the close spacing of the edifices, plumes sourced at any one of the North Mata volcanoes may extend to their neighbors, but hydrothermal plumes from the North Mata volcanoes can be distinguished from the widespread turbidity anomalies throughout the surrounding MD because: (1) they cluster into three prominent depth ranges (1740–1910 m for plumes from Tolu; 2045–2350 m for plumes from Ua; and 2350–2620 m for plumes from Fa, Ono, and Fitu); and (2) they have coincident ΔNTU, ORP, and δ(3He)% anomalies that are relatively consistent from year to year (Figure 4). Each site is known to have a combination of high-temperature focused venting, diffuse venting, and vent fields at multiple depths (Embley et al., 2013; Rubin et al., 2018), resulting in relatively broad ranges for plume rise heights (20–350 m) (Baker et al., 2019).
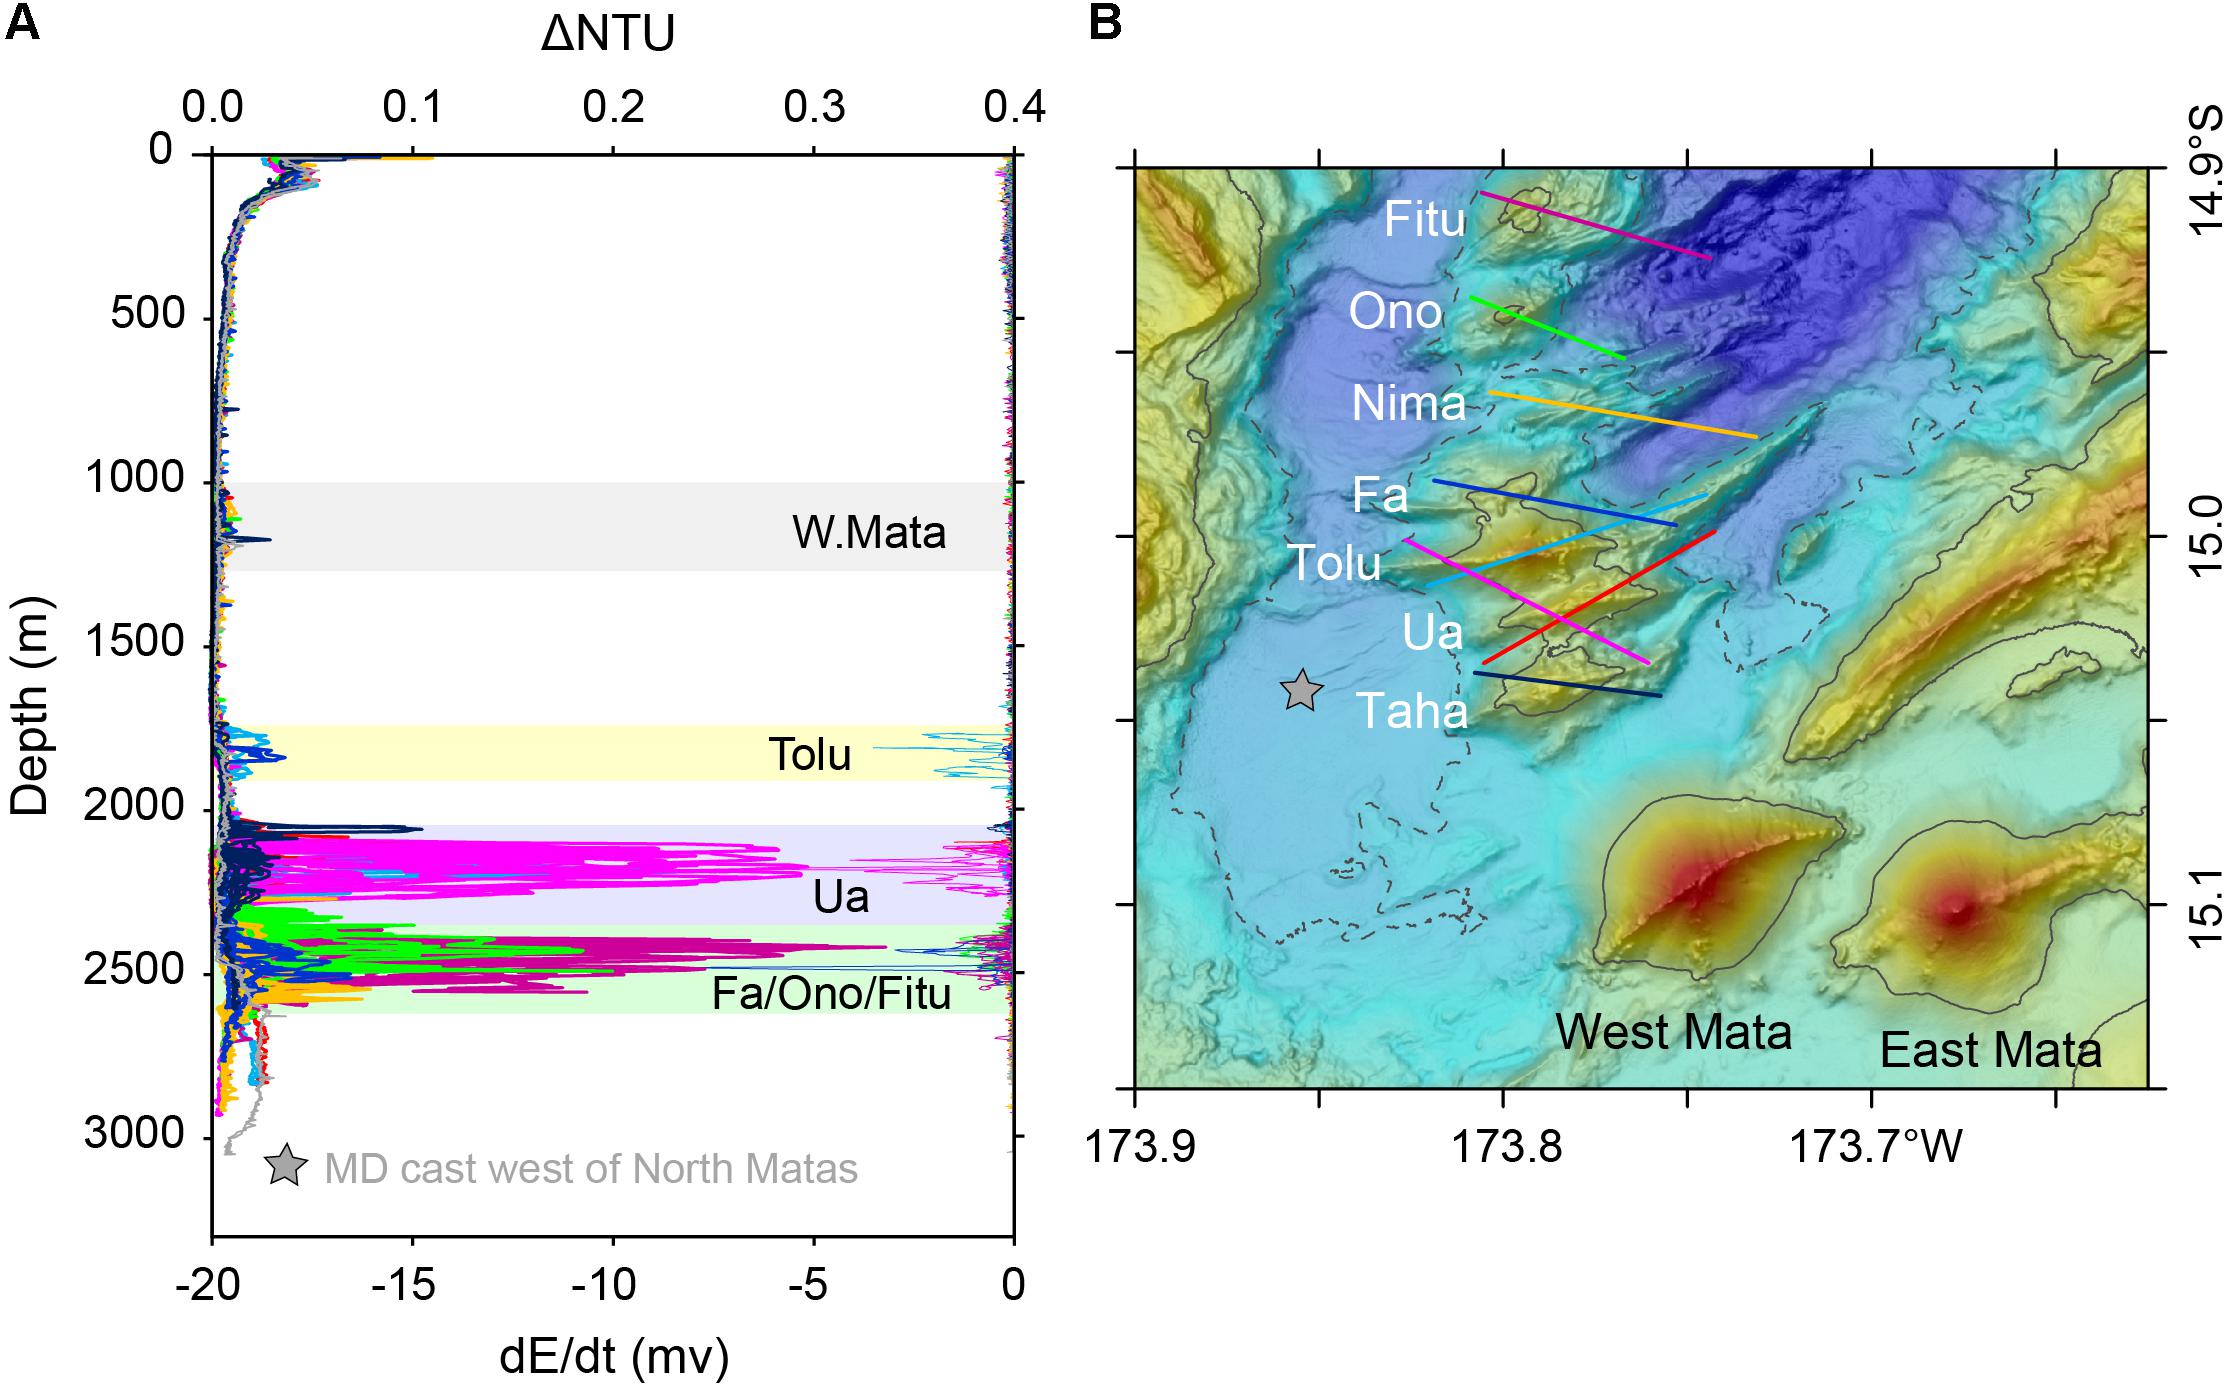
Figure 4. 2010 North Mata hydrothermal plume profiles. (A) ΔNTU (left side, top axis) and dE/dt (right side, bottom axis) profiles from CTD tows over the North Mata volcanos; (B) map of North Mata CTD tow tracklines. Colors of tracklines in (B) correspond to profile line colors in (A).
The profiles throughout the MD (Figure 3) were enriched in δ(3He)% only at the West Mata summit plume depth (1000–1270 m) or within the depth ranges of the North Mata hydrothermal plumes. Turbidity anomalies deeper than 2600 m consistently had background δ(3He)% values in all years despite highly variable ΔNTU, which suggests a non-hydrothermal source of particles creates the deep turbidity layers throughout the MD, overprinting the hydrothermal signal from the North Matas.
The Fe/Si ratio of particles in the deep plumes was distinctly different from that of the hydrothermal particles found in the West Mata summit plume (Figure 5). Hydrothermal particles are typically highly enriched in iron. In contrast, the particles from the deep plumes had high amounts of Si with Fe/Si ratios similar to boninite, the primitive andesite lava type that was erupting at West Mata (Resing et al., 2011). SEM analyses of the deep particles showed they were dominated by fine non-vesicular ash shards with sharp-edges and conchoidal fractures (Figure 6), establishing a strong similarity to the deep ash plumes found surrounding other actively erupting submarine volcanoes (Supplementary Table S2), and thus linking these plumes to the syn-eruptive production of fine ash by the explosive and effusive eruption at West Mata.
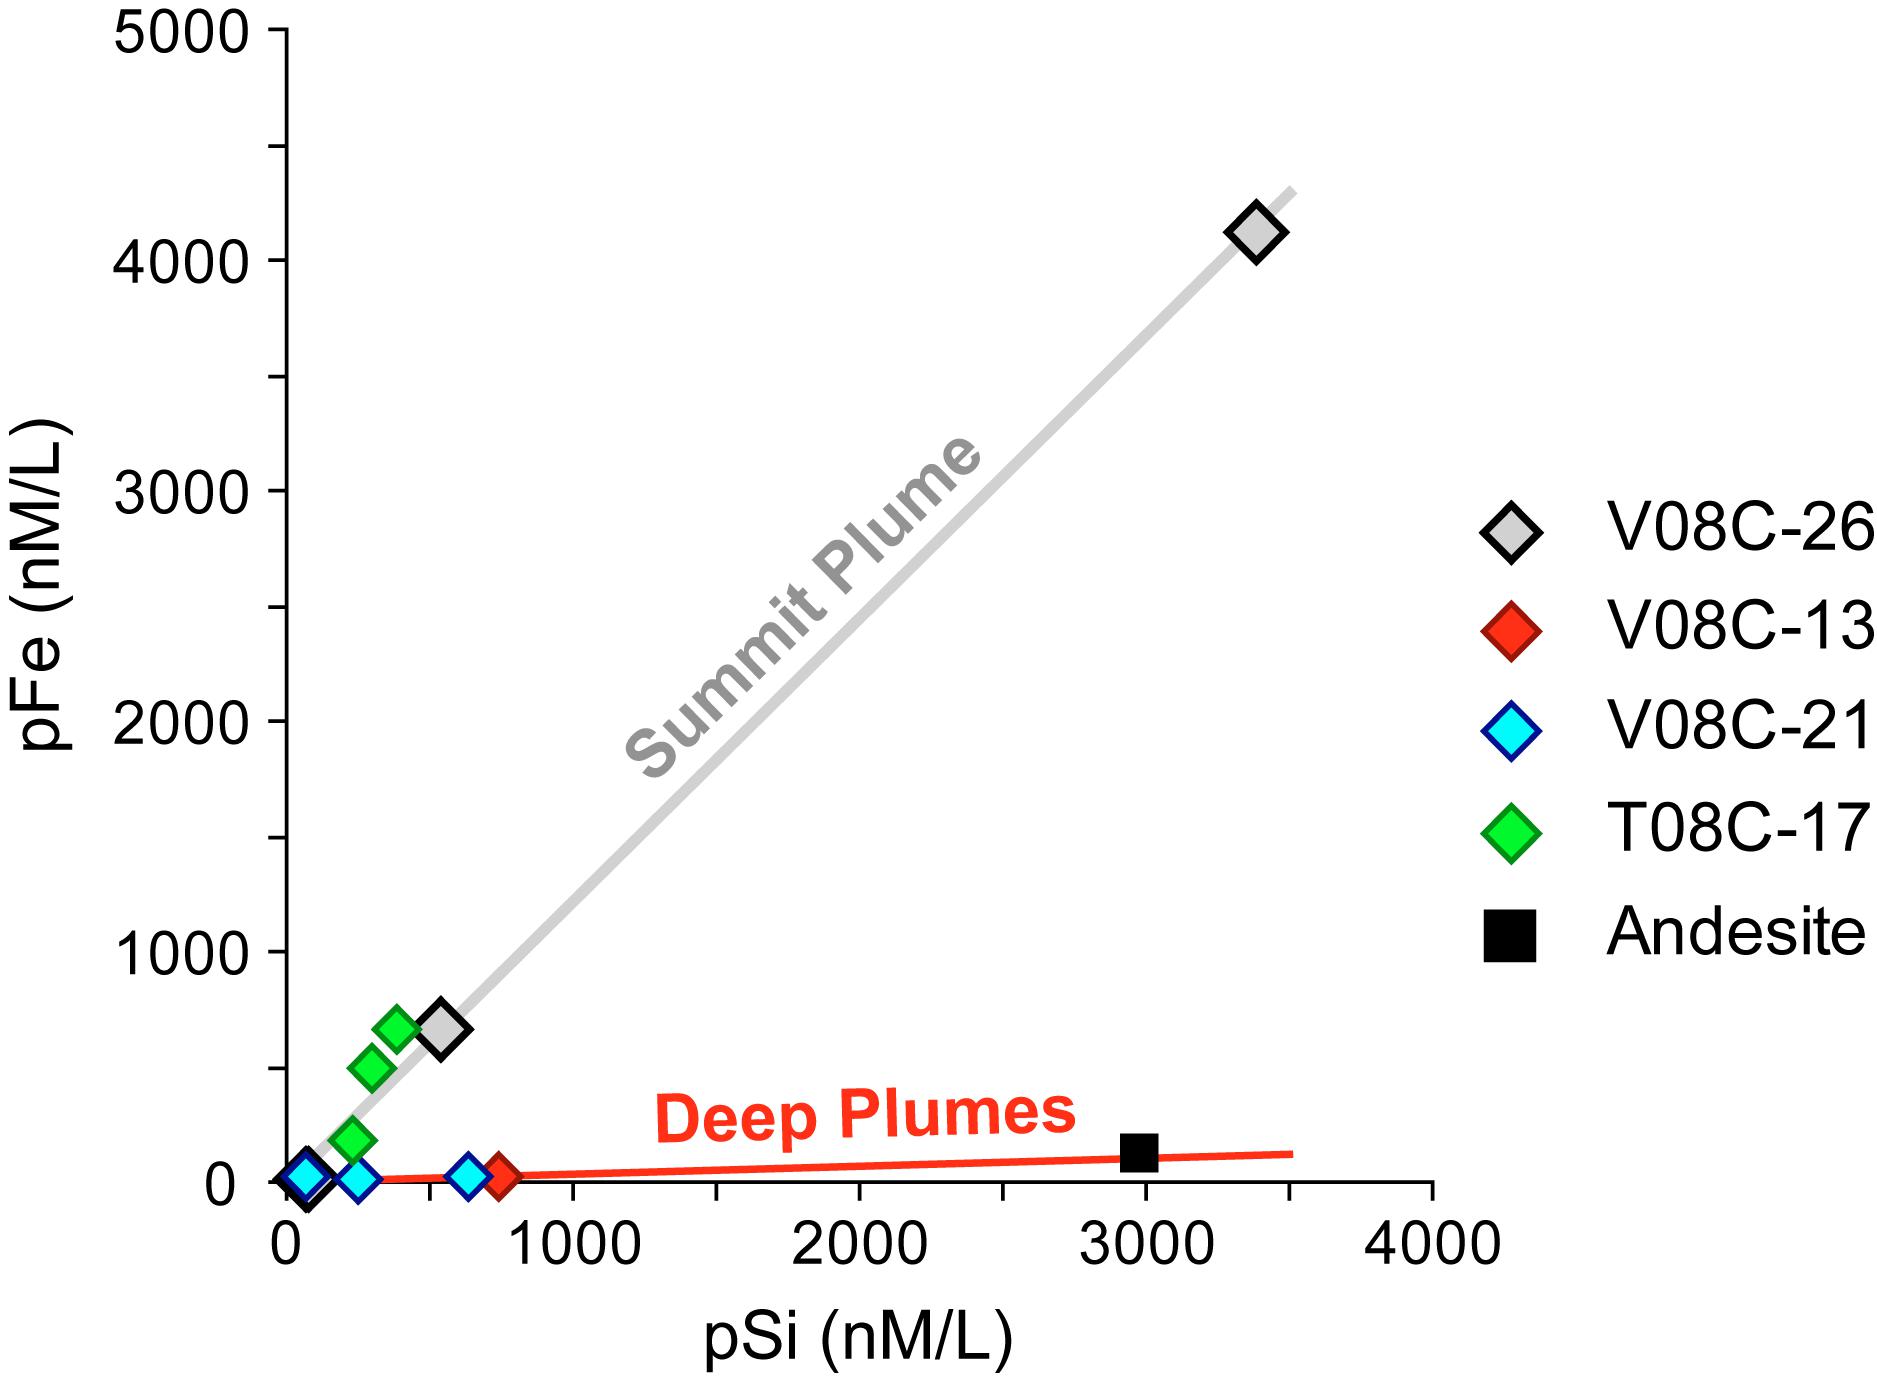
Figure 5. Fe/Si ratio of particulates from deep ash plumes compared to magmatic-hydrothermal plumes from over the summit of West Mata.
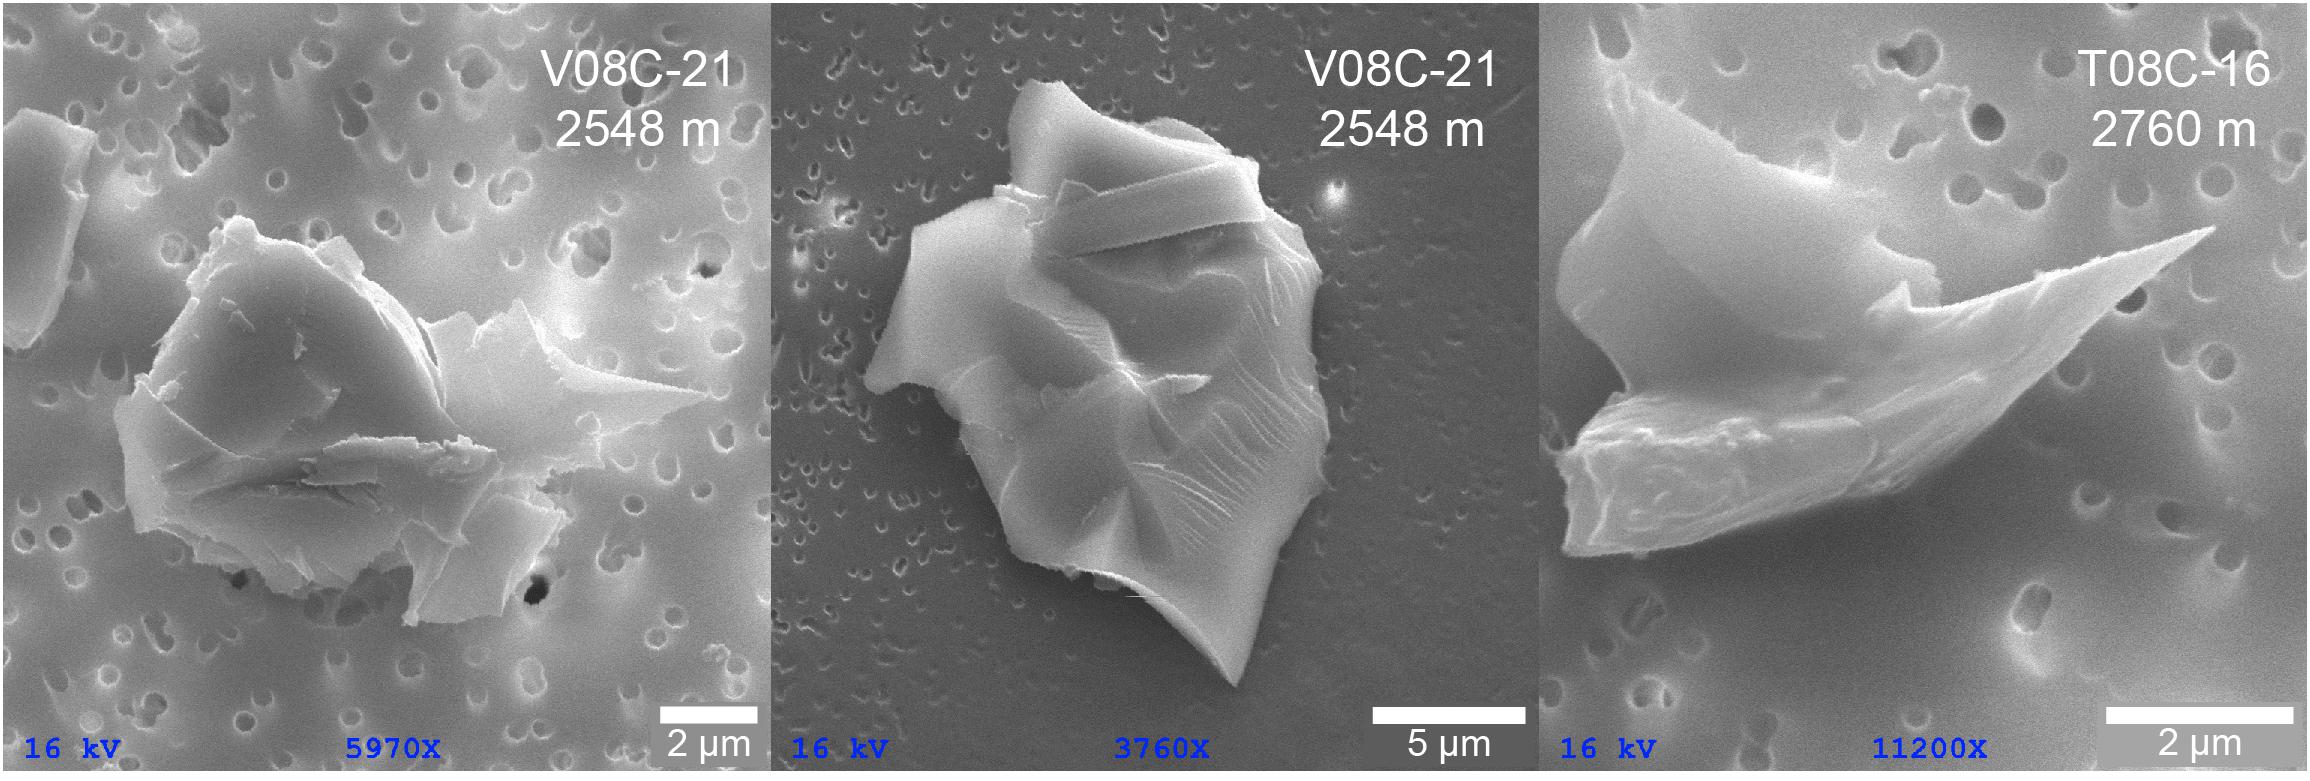
Figure 6. SEM images of shards in deep plumes. Sample depths are shown by diamond symbols in Figure 3B.
Distribution Patterns of Deep Particle Plumes
In addition to their composition, the distribution of the deep (>1500 m) particle plumes described here supports the interpretation that they are clouds of fine ash fed by the explosive eruption and downslope movement of volcaniclastic material accumulating on steep (∼30°) slopes below the summit of West Mata where the observed eruptive vents were located (∼1150–1200 m).
In 2008, the upper limits of the deep turbidity layers (Figure 3B) were similar whether located at the base of West Mata (red line) or 15 km distant (blue and green lines) (Supplementary Figure S1). Deep ΔNTU increased from background values at 2230 m (∼600 m above the seafloor at the deepest profile) to ΔNTU = 0.040 at 2630 m, and reached a maximum (ΔNTU = 0.050) between 2750 and 2830 m (∼150 m above the seafloor at the deepest profile). The shallower casts (red and green lines) do not show the deepest turbidity maximum because they were limited by the depth of the seafloor. Presumably, if the bathymetry had not been limiting, the plume would have extended to those locations as well. These three casts were located only to the west and southwest of West Mata, so we cannot tell if the plume dispersed equally in all directions, but the near-uniformity of the plume at 5 to 20 km from the slope break at the base of West Mata is consistent with radial dispersal of a sediment gravity flow (Simpson, 1987; Dade and Huppert, 1995; Walker et al., 2008) that originated at West Mata.
In 2010 (Figure 3D), the profiles to the northwest (blue lines) and southwest (green lines) again show relatively minor differences in the upper limits of the deep plume, with the downward extent apparently limited by the depth of the seafloor for the shallower casts regardless of distance from West Mata (Supplementary Figure S1). However, the profile at the northeast base of West Mata (yellow line) has noticeably lower ΔNTU values compared to the profile at the southwest base (red line; ΔNTUmax = 0.007 and 0.020, respectively). This is consistent with the more complex bathymetry to the north and east of West Mata having some directional control on the distribution of an ash cloud from a sediment gravity flow, and is also consistent with ash originating at the north side of the rift zone, west of the summit, where the “PIII Eruptives” deposit was emplaced between May 2009 and May 2010 (see Figure 8 of Embley et al., 2014a).
Profiles from 2009 (Figure 3C and Supplementary Figure S1) differ from the other years in that two casts (red and gold lines) had multiple, but thinner, turbidity layers between 1400 and 2400 m with highly variable intensity (ranging from ΔNTUmax = 0.010 at 1660 m to 0.100 at 2230 m). None of these layers had corresponding ORP signals. We note that these casts were located at the southwest (red) and northeast (gold) base of West Mata, and that the most distant profile (∼6 km to the northwest; blue line) showed only a very slight increase in turbidity (ΔNTUmax = 0.007) deeper than 2100 m. We know from direct observations during ROV dives (Resing et al., 2011) and moored hydrophones (Resing et al., 2011; Bohnenstiehl et al., 2014) that the eruption at the summit was nearly continuous during this timeframe, so these layers may indicate eruption column collapse, earlier stages of sediment gravity flows or runout and liftoff of multiple events of varying magnitude that had not yet had time to laterally spread very far beyond the flanks of West Mata. Alternatively, we also know from the repeat bathymetric surveys (Embley et al., 2014a) that ∼2 × 10⁶ m3 of new material was added to the southwest rift zone within two depth ranges (1400–1700 and 1900–2100 m) sometime between May 2009 and May 2010 (the “PIII WSWRZ eruptives and downslope deposits” shown in Figure 3C of Embley et al., 2014a). Unfortunately, there were no water samples from these plume layers to evaluate whether any of them had a magmatic-hydrothermal component that might suggest their source was concurrent eruptive activity at those depths. However, the absence of any ORP anomalies strongly suggests these particle plumes were fed by the ongoing eruption at the summit.
Plume mapping in 2017 included CTD vertical casts and tow-yo’s, with the addition of a MAPR to AUV Sentry missions (November 11-19) and ROV SuBastian dives 2–3 weeks later (November 27–December 7). The Sentry missions flew 70 m above the seafloor while acquiring high-resolution bathymetry data, and 5 m above the seafloor during more spatially limited photo surveys (Figure 7) (Chadwick et al., 2019). Widespread turbidity anomalies surrounded the base of West Mata, primarily to the east and northeast where ΔNTUmax >0.050 (Figures 3F, 7 and Supplementary Movie S1). Full water depth profiles shared similar characteristics to other years in that (a) ORP anomalies were not coincident with ΔNTU other than for the West Mata summit and North Mata magmatic-hydrothermal plumes, and (b) the upper limit of the deep ΔNTU layer in all profiles increased similarly from 2000 to 2500 m (except for the profile ∼14 km to the northwest which showed only slight increases in ΔNTU below the 2550 m North Mata plume). The deep plume surrounding the base of West Mata was asymmetrically distributed to the east and northeast, with limited transport to the northwest, which suggested these plumes were related to the most recent (2016–2017) eruption (Chadwick et al., 2019) that added 1.4 × 10⁷ m3 of effusive lava flows and downslope volcaniclastic deposits on the southeast flank sometime between March 2016 and November 2017, and that the plume distribution was inhibited by the more complex bathymetry to the east of West Mata. Some ORP signals were detected at 70 m above the seafloor directly over the recent (2012–2017) eruption sites but appear to be unrelated to the broader deep ash plume. Hydrothermal staining, warm temperatures within overlying volcaniclastic deposits, and bacterial mats were observed at these locations during ROV SuBastian dives, confirming the lava flows emplaced between 2012 and 2017 were still cooling (Chadwick et al., 2019).
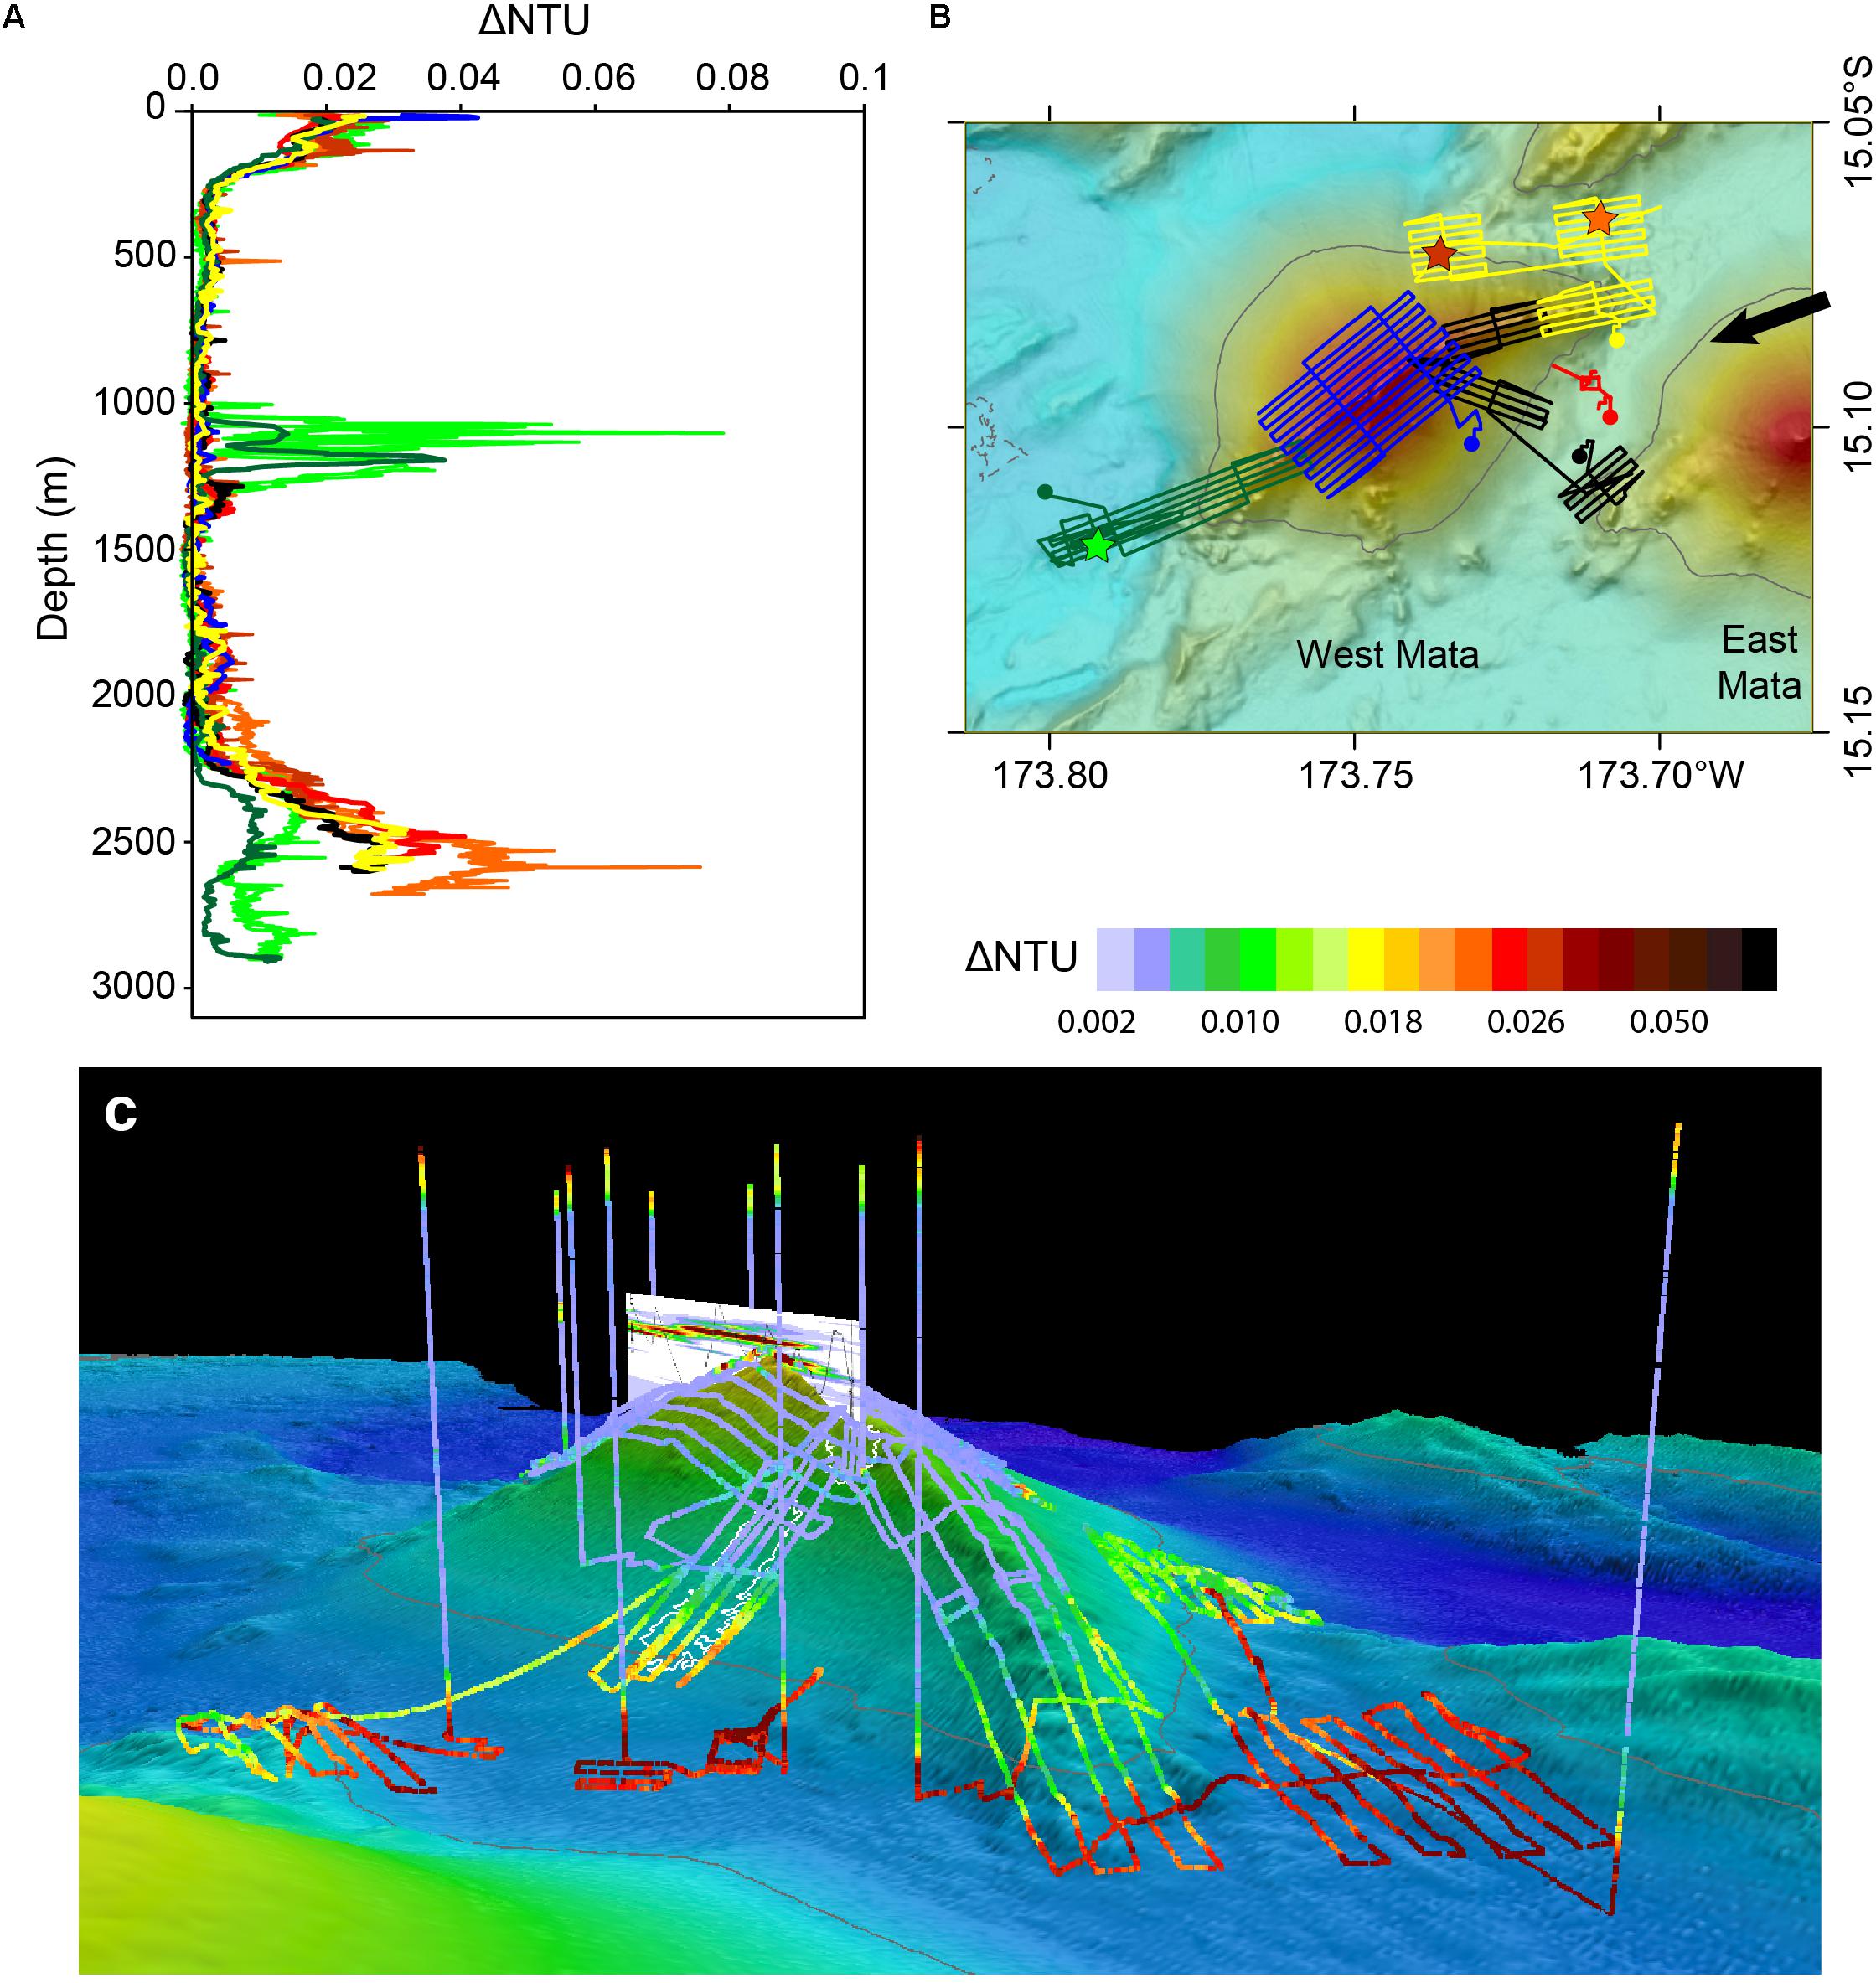
Figure 7. MAPR data from AUV Sentry dives. (A) MAPR ΔNTU profiles compared to similarly located CTD profiles; (B) map with Sentry tracklines. Dots show MAPR profile locations (initial descent for each Sentry dive), stars show CTD locations. Colors in (B) match profile line colors in (A); (C) 3-d image of MAPR ΔNTU at 70 m above bottom during Sentry dives viewed from the northeast (arrow in B shows orientation for this view). The 2016–2017 new deposit is outlined in white on the SE slope of West Mata. Vertical panel above the summit of West Mata shows the plume above the summit (CTD tow T17B-01) dispersing toward the southwest. See also Supplementary Movie S1 for a virtual tour of the plumes surrounding West Mata.
Short-Term Variability of Deep Plumes
Two of the plume surveys conducted between 2004 and 2012 were separated by as little as 6–7 months and show that the distribution of these deep ash plumes can be significantly different, or completely disappear, over that time interval.
Deep plumes were present in both the November 2008 and May 2009 surveys, but their intensity and depth ranges were dramatically different (Figure 3). West Mata was known to be continuously erupting throughout that period (Resing et al., 2011), though no deposits or losses thicker than 10 m were identified by bathymetry differencing.
Two profiles from December 2010 extended deeper than 2500 m for comparison with the May 2010 profiles (Figure 8A): V10B-07 (gray) and D11 (red) were both located ∼10–12 km southwest of West Mata (Supplementary Figure S1). The December profiles had background turbidity at the West Mata summit plume depth and negligible ΔNTU (<0.004) below 2500 m. Hydroacoustic monitoring showed that explosive activity at West Mata was robust during the May 2010 expedition, but had declined significantly by December 2010 (Dziak et al., 2015).
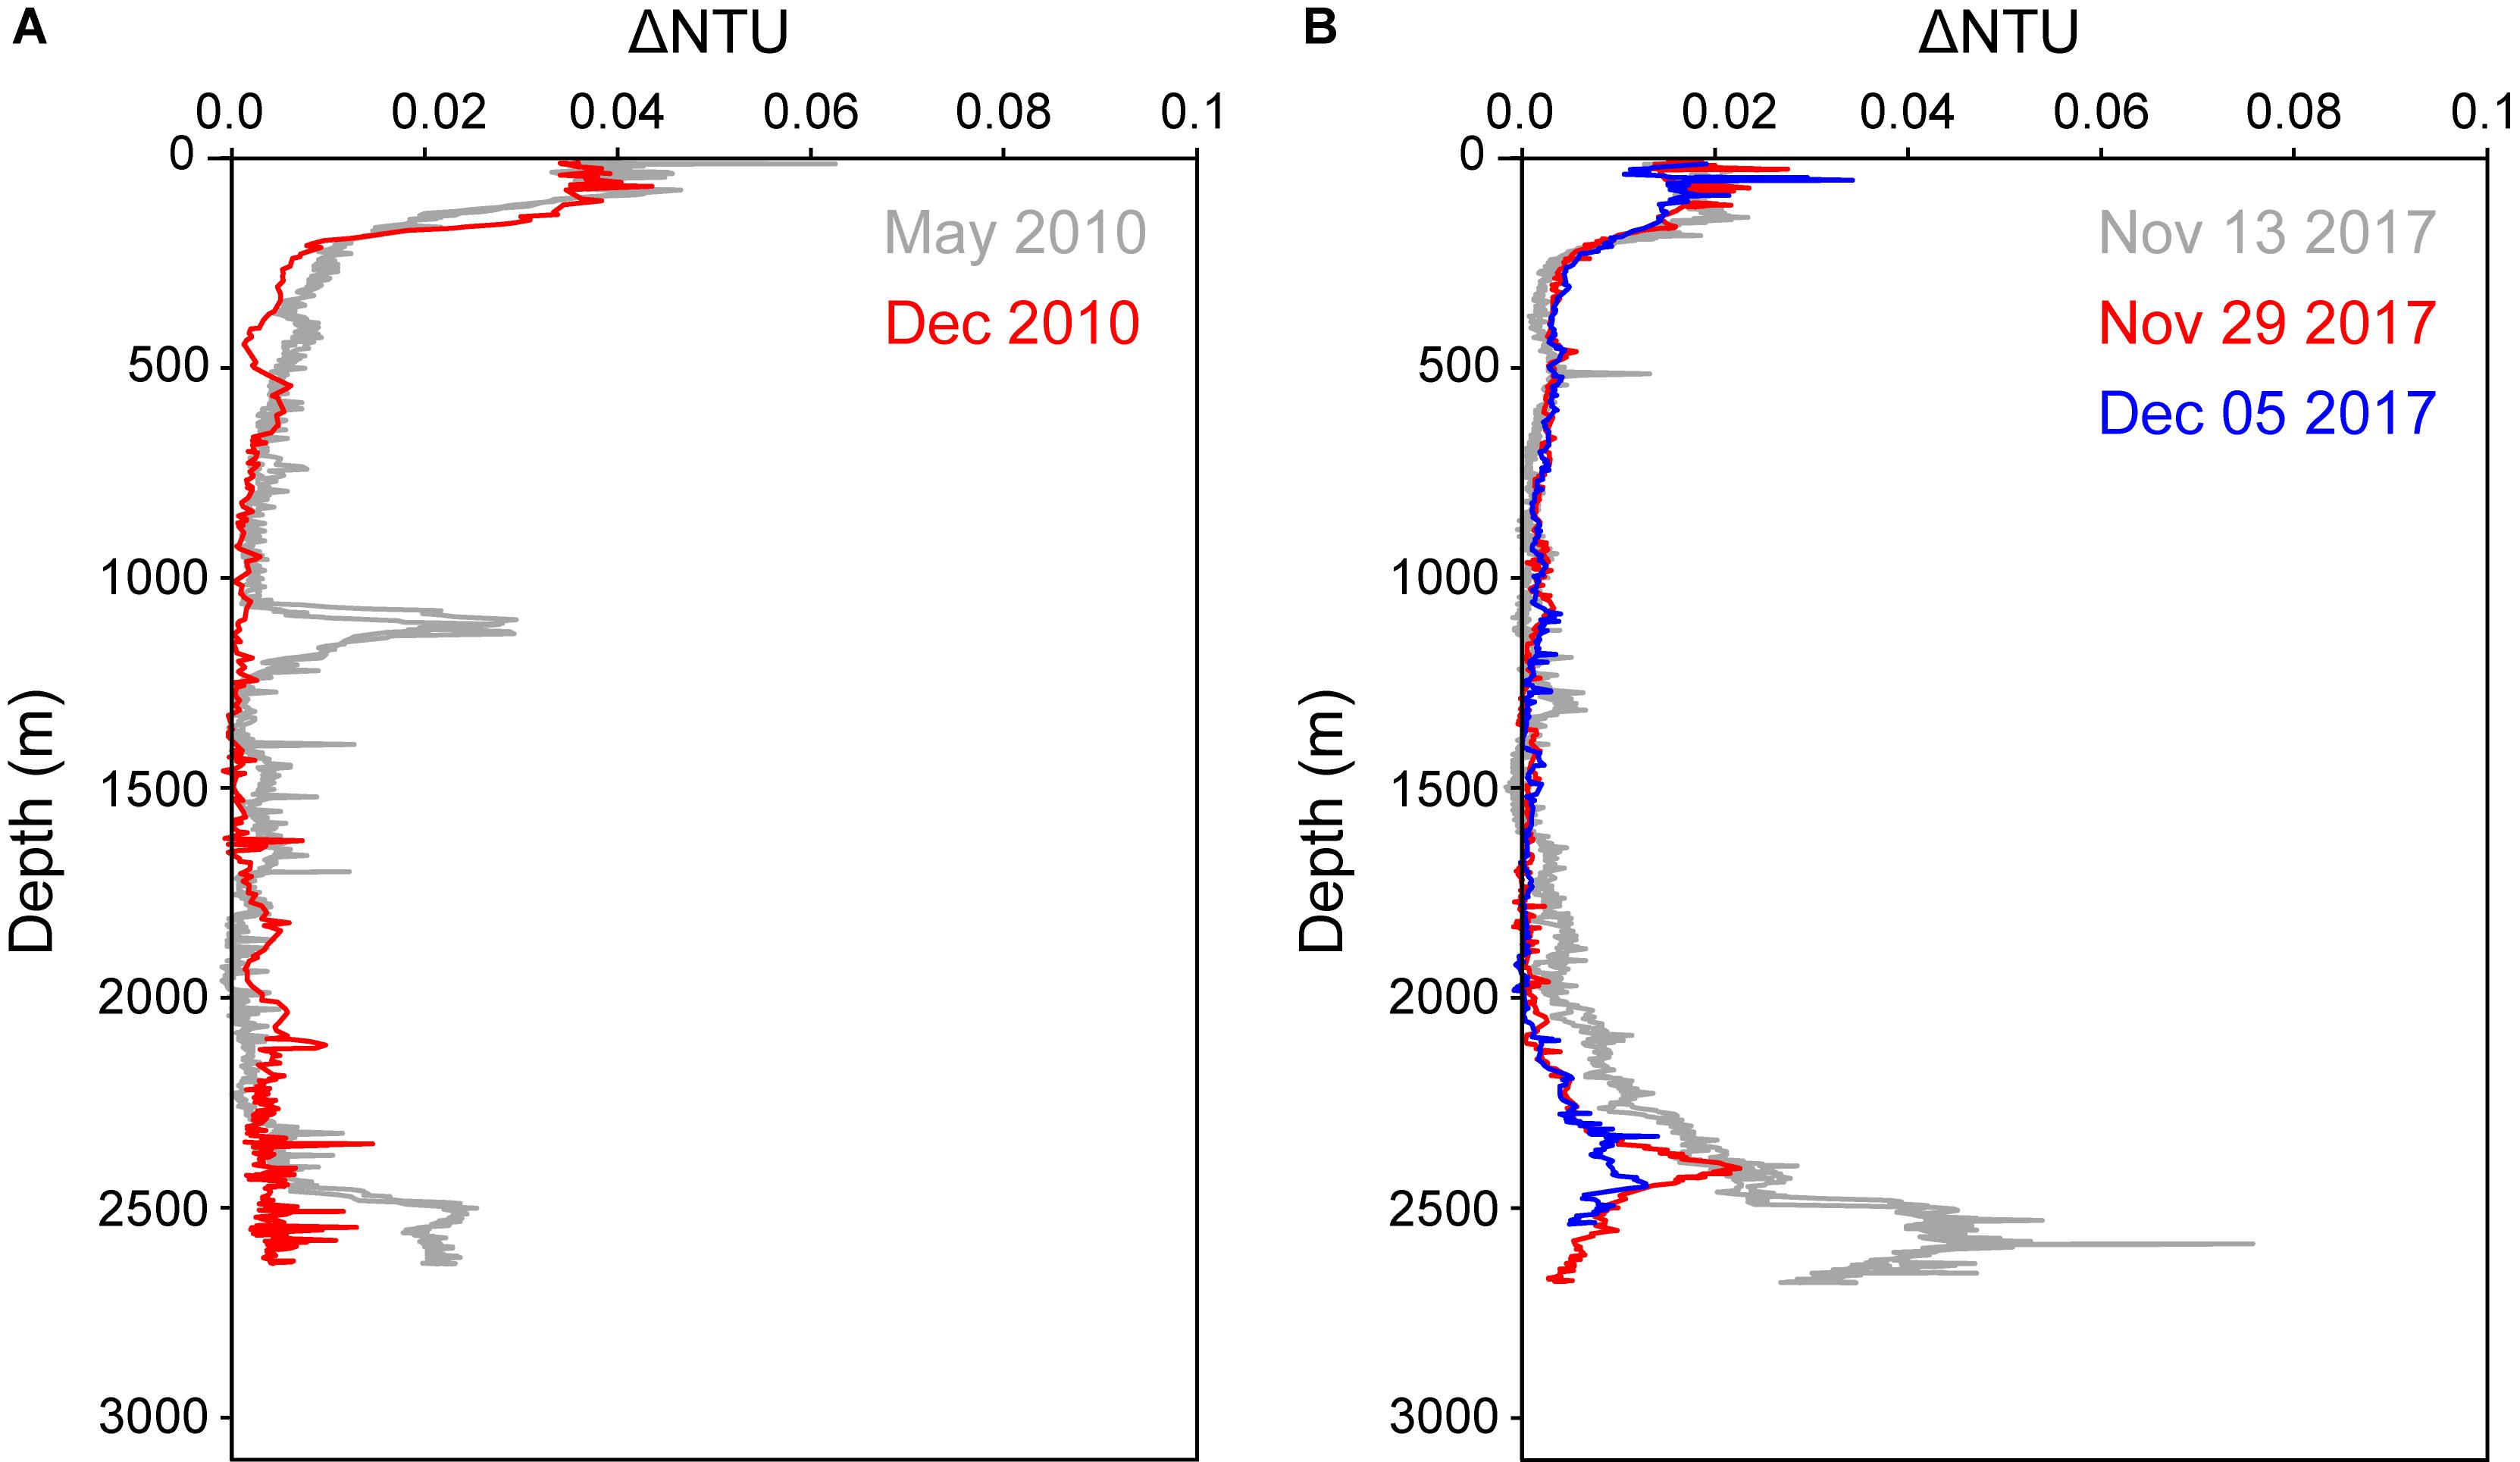
Figure 8. Short-term variability of deep plume turbidity over time: (A) May 2010 compared to December 2010; (B) repeat profiles over 25 days in November/December 2017.
In 2017, CTD casts, AUV Sentry dives, and ROV SuBastian dives provided repeat profiles at the northeast base of West Mata separated in time by up to 25 days (Figure 8B). The profiles showed turbidity deeper than 2500 m decreased from ΔNTUmax >0.050 on November 13 to <0.007 3 weeks later on December 5. Eruptive activity was not directly observed during the ROV dives in 2017 (see Supplementary Figures S1–S5 of Chadwick et al., 2019 for ROV dive tracklines), but the diminishing plume has implications for when the eruption that formed the 2016–2017 deposit occurred, and will be discussed below.
Discussion
The physiochemical characteristics and distribution patterns of the deep ash plumes throughout the MD surrounding West Mata can be compared to similar plumes found surrounding other volcanically active submarine volcanoes (Kavachi, Baker et al., 2002; NW Rota-1, Walker et al., 2008; Monowai, Walker et al., 2010; Supplementary Table S2). The MD plumes were also episodic, dominated by fine fresh volcaniclastic ash, devoid of typical hydrothermal tracers, extended laterally to distances of at least 15–20 km, and had particle concentration maximums at multiple depths below the West Mata eruptive vents and above the seafloor. Similar to the other sites, deep ash plumes in the MD were present during known eruptive periods and absent during known quiescent periods, so we interpret them to be volcaniclastic ash produced by the eruption at West Mata with subsequent downslope and lateral transport through the surrounding MD via sediment gravity flows with variable intensity, runout and liftoff dynamics. The variable height of the turbidity maximum above the seafloor can be attributed variable depths where a sediment gravity flow might detach (liftoff) from the slope of West Mata, the variable depth of the seafloor surrounding West Mata (i.e., a neutrally buoyant plume will disperse laterally on an isopycnal surface regardless of seafloor depth), or a dispersal path across bathymetric features that might obstruct the plume at deeper depths. In contrast to NW Rota-1, West Mata is surrounded by more complex bathymetry, especially to the northeast and east, which appears to exert some directional control on the distribution of the deep ash plumes and limits the horizontal distance they can spread in those directions.
The ephemeral nature of these plumes allows us to infer the status of eruptive activity during years when ROV observations or acoustic monitoring were not available. Profiles in years when West Mata was known to be actively erupting (2008, 2009, and 2010) all have significant deep ash plumes, while the profiles in 2012, when West Mata was volcanically quiescent, show only hydrothermal plume layers from chronic venting from the North Matas and the summit of West Mata. The 2004 profile, located 13 km to the northeast of West Mata, is essentially identical to the similarly located 2012 profile (blue lines in Figures 3A,E, respectively), and has only small plume layers at the West Mata summit and North Mata hydrothermal plume depths [elevated δ(3He)% was associated with the North Mata plume; but note the thin West Mata summit plume depth was not sampled in 2004]. The absence of deep ash plume layers suggests that West Mata was hydrothermally active but not erupting within several months prior to February 2004, and the PI eruptives identified by Embley et al. (2014a) were emplaced either sometime after February 2004 or many months before.
The 2017 expedition was interesting in that deep ash plumes were present, but no eruptive activity was observed during ROV dives. We know from bathymetric survey differencing that an eruption occurred sometime between March 2016 and November 2017 that added 14 × 106 m3 of new material to the southeast side of the ENE rift zone and flank of West Mata (from ∼1530 to 2530 m). During ROV dives, volcaniclastic sand and ash that was generated during the eruption was found draped over the lava flows near the eruptive vents, and the deeper volcaniclastic deposits (up to ∼30 m thick) were consistent with eruptive products moving further down the steep slopes by gravity (Chadwick et al., 2019).
Based on the rate that ΔNTU in the plumes at the northeast base of West Mata decreased over a 25 day period, we can estimate how recently the eruption that formed the 2016–2017 deposit may have occurred. Suspended mass concentration, Cm, is a linear function of ΔNTU (Cm = a∗ΔNTU, where a ranges from 0.3 to 1.2 mg/L, dependent on particle size and composition) (Baker et al., 2001; Dziak et al., 2015). We assume the ash to be very fine aluminosilicates (<5 μm) as was the case for the previous samples from West Mata deep ash plumes, and was not replenished during the sample interval. This results in an estimate of 4.5–18.2 g/m2 of ash in the water column deeper than 1600 m on November 13, which decreased to 0.9–3.6 g/m2 on December 05, a total loss of 80%, with an average loss rate of 3% (0.15–0.6 g/m2) per day to either lateral transport or settling from suspension. This suggests that a plume similar to what was seen on November 13 could last for 8–121 days if not replenished, and implies that the eruption that caused the new lava flow and downslope deposits occurred within weeks to a few months prior to the FK171110 expedition in November 2017. These results also suggest that the presence of deep ash plumes surrounding a submarine volcanic edifice, along with a magmatic-hydrothermal plume above the summit, may be a valuable exploration tool for identifying an active, or very recently active, submarine eruption.
Little is known with certainty about how sediment gravity flows originated at West Mata. Models (e.g., Cashman and Fiske, 1991; Head and Wilson, 2003) acknowledge eruption column collapse or remobilization of accumulated volcaniclasts on unstable slopes as likely mechanisms, and both were observed at NW Rota-1, but it is unclear which may be more important. Both NW Rota-1 and West Mata are mostly conical edifices with steep (>30°) slopes. The hydroacoustic records at each site documented large and small landslides during active periods (Chadwick et al., 2012; Caplan-Auerbach et al., 2014), sometimes occurring as frequently as 35 times per day and lasting from 10s of seconds to minutes (Caplan-Auerbach et al., 2014). A turbidity sensor, moored at 2230 m as part of the December 2009–April 2010 hydrophone deployments ∼5 km south of West Mata, showed spikes in turbidity every week or so that lasted on the order of 1–2 weeks (Caplan-Auerbach et al., 2014; Dziak et al., 2015), consistent with our estimate of the duration of deep plumes. These data show no clear correlation with either explosive activity or landslides, but both were common during the entire period. One particularly intense turbidity maximum appeared ∼2 days after a month-long period of increased explosive activity subsided, leading the authors to favor slope failure of accumulated volcaniclastic debris as the mechanism for mobilizing fine ash into the water column (Dziak et al., 2015). However, shard morphology, including sharp points and non-rounded edges (Figure 6), suggests they were generated during explosive eruptions, and were not extensively reworked or subject to substantial particle-particle collisions during transport (Wohletz and Krinsley, 1982; Mattsson, 2010; Jordan et al., 2014). ΔNTU maximums and coherent plume layers at variable distances above the seafloor suggest detachment from deepening slopes (liftoff) and lateral dispersal on isopycnal surfaces rather than elutriation from the dilute outer regions of a ground-hugging density flow.
The profiles from 2008 to 2010 (Figures 3B,D) suggest turbidity was relatively uniform throughout the MD at the time of those surveys. We estimate the ash load in the water column (>2230 m in 2008 and >2450 m in 2010) to be 6–24 g/m2 on that day in 2008 and 3–13 g/m2 in 2010, for a total of ∼1–6 × 10⁶ kg over an area of ∼250 × 106 m2, or a daily supply of 500–4000 m3 of ash available for deposition in the MD or transport to more distal locations [based on wet density of ∼1.5 g/cm3 for vitrious sediments from the NE Lau basin (Lavoie et al., 1994)]. This supply of ash may not be sufficient to form a discrete ash layer in sediments, which are commonly interpreted as tephrochronologic markers of specific eruptions, but these data demonstrate a process whereby ash from low to moderately sized (7.8 × 10⁶ m3/yr; Chadwick et al., 2019) multi-year eruptions at West Mata can be regularly replenished in the water column, and transported by local currents for deposition as thin or possibly invisible fallout deposits in regional and distal sediments. This process is consistent with the interpretation of Scudder et al. (2014) that eruption frequency rather than size is a more important contributor to the cryptotephra record in sediment cores near the Izu arc.
Conclusion
Deep ash plume layers in the water column surrounding West Mata demonstrate a mode of syn-eruptive transport for fine ash generated by a submarine explosive eruption that can contribute to fallout deposits at distances greater than have previously been predicted. The temporal and spatial distribution of fine ash in coherent layers along isopycnal surfaces deeper than the eruptive vents suggests emplacement into the water column via sediment gravity flows of varying magnitudes, runout distances, and liftoff densities. After further dispersal by local currents, the ash will contribute to regional and distal sediments via settling of individual particles, which may appear as cryptotephra, or thin ash layers if the ash supply exceeds pelagic sedimentation rates.
To date, only two active eruptions deeper than 500 m water depth have been directly observed in the world’s oceans: NW Rota-1 in the Mariana arc (Embley et al., 2006; Chadwick et al., 2008; Deardorff et al., 2011), and West Mata in the NE Lau basin (Resing et al., 2011). Both of these sites erupted explosively with relatively low eruption rates (0.4–8.8 × 10⁵ m3/yr at NW Rota-1 and 7.8 × 10⁶ m3/yr at West Mata) of multi-year duration (Chadwick et al., 2008; Clague et al., 2011; Embley et al., 2014a; Schnur et al., 2017; Chadwick et al., 2019) that transferred a significant amount of ash into suspension in the surrounding water column, often at 100s of meters above the seafloor, where it was transported laterally 10s of km from the volcanic edifices. While these eruptions contributed to the construction of deposits on the steep slopes and occasional slope failure, the presence of deep ash plumes was correlated strongly with the ongoing low to moderately sized eruptions, which suggests that large landslides are not a prerequisite for generating these plume layers.
These observations demonstrate the significance of submarine volcanism to fallout or cryptotephra deposits at regional, and perhaps more distal (where bathymetric barriers are absent) scales, and show that fallout and cryptotephra deposits from submarine eruptions do not require ash to be lofted high into the water column by event plumes rising buoyantly above an eruptive vent, or large-scale landslides and mass wasting, to be transported laterally to more distal sediments. The NE Lau basin has diverse lava types along the volcanic arc, in the back arc, and along the back arc spreading centers (Lupton et al., 2015; Embley and Rubin, 2018). Improved geochemical techniques for separating and characterizing cryptotephra preserved in the sediment record would likely provide valuable insight into the evolution and volcanic history of the region, including the contribution from the large number of submarine volcanoes located here.
Future studies that seek to more thoroughly understand deep submarine eruption processes, the potential hazards they pose, and their impacts to the ocean environment, hydrothermal systems, and chemosynthetic ecosystems, will depend on improved exploration and event detection capabilities. In addition to recognizing the characteristic event plumes rising into the water column above actively erupting sites, widespread ash plumes dispersing at depths deeper than eruptive vents can be diagnostic of ongoing, or very recent, eruptions.
Data Availability Statement
Data is available in the Supplementary Material [δ(3He)% (Supplementary Table S5)], from the Rolling Deck Repository (R2R), and upon request from the author (see Supplementary Table S3).
Author Contributions
SW and EB collected the data at sea. SW processed and analyzed the CTD and MAPR data, wrote the manuscript, and made the figures and tables. JL provided the helium data. JR provided the bulk particulate chemistry data and SEM photos.
Funding
This work was supported by the NOAA/PMEL Earth-Ocean Interactions Program, the Joint Institute for the Study of the Atmosphere and Ocean (JISAO) under NOAA Cooperative Agreements NA11OAR4320091 and NA10OAR4320148, the NOAA Office of Exploration and Research, the National Science Foundation (OCE0930025, OCE0934660, and OCE15-38121), and the Schmidt Ocean Institute (FK171110).
Conflict of Interest
The authors declare that the research was conducted in the absence of any commercial or financial relationships that could be construed as a potential conflict of interest.
Acknowledgments
We thank the numerous colleagues, AUV Sentry and ROV teams, and ship mates and crewmembers who worked with us as we explored the NE Lau Basin; the chief scientists (R. Embley, W. Chadwick, J. Lupton, J. Resing, and K. Rubin) all assured the field work was a success. We also thank T. Baumberger and C. Wilkinson for helium sample analyses, S. Merle for providing bathymetry grids and maps used in the figures, and N. Buck for particulate sample collection and analyses. We also thank Nautilus Minerals, Inc. for providing access to the proprietary data; and the two reviewers who provided valuable comments to improve the manuscript. PMEL contribution number 4950.
Supplementary Material
The Supplementary Material for this article can be found online at: https://www.frontiersin.org/articles/10.3389/fmars.2019.00593/full#supplementary-material
Footnotes
References
Allen, S. R., and McPhie, J. (2009). Products of neptunian eruptions. Geology 37, 639–642. doi: 10.1130/g30007a.1
American Public Health Association. (1985). Standard Methods for the Examination of Water and Wastewater, 16th Edn (Washington, D.C: American Public Health Association), 1268.
Austin, W., Abbott, P., Davies, S., Pearce, N., and Wastegård, S. (2014). Marine tephrochronology: an introduction to tracing time in the ocean. Geol. Soc. Lond. Spec. Publ. 398, 1–5. doi: 10.1144/sp398.12
Baker, E. T. (1995). “Characteristics of hydrothermal discharge following a magmatic intrusion,” in Hydrothermal Vents and Processes, eds L. M. Parson, C. L. Walker, and D. R. Dixon (Piccadilly: Geological Society London, Special Publication), 65–76. doi: 10.1144/gsl.sp.1995.087.01.06
Baker, E. T. (1998). Patterns of event and chronic hydrothermal venting following a magmatic intrusion: new perspectives from the 1996 gorda ridge eruption. Deep Sea Res. Pt. II 45, 2599–2618. doi: 10.1016/s0967-0645(98)00085-x
Baker, E. T., Chadwick, W. W. Jr., Cowen, J. P., Dziak, R. P., Rubin, K. H., and Fornari, D. J. (2012). Hydrothermal discharge during submarine eruptions: the importance of detection, response, and new technology. Oceanography 25, 128–141. doi: 10.5670/oceanog.2012.11
Baker, E. T., German, C. R., and Elderfield, H. (1995). “Hydrothermal plumes over spreading-center axes: global distributions and geological inferences,” in Seafloor Hydrothermal Systems: Physical, Chemical, Biological, and Geological Interactions, Geophys. Monogr. Ser, Vol. 91, eds S. Humphris, R. Zierenberg, L. S. Mullineaux, and R. Thomson (Washington, D. C: American Geophysical Union), 47–71. doi: 10.1029/gm091p0047
Baker, E. T., Lupton, J. E., Resing, J. A., Baumberger, T., Lilley, M. D., Walker, S. L., et al. (2011). Unique event plumes from a 2008 eruption on the northeast lau spreading center. Geochem. Geophys. Geosyst. 12, Q0AF02. doi: 10.1029/2011GC003725
Baker, E. T., Massoth, G. J., de Ronde, C. E. J., Lupton, J. E., and McInnes, B. I. A. (2002). Observations and sampling of an ongoing subsurface eruption of Kavachi volcano, Solomon Islands, may 2000. Geology 30, 975–978.
Baker, E. T., Resing, J. A., Haymon, R. M., Tunnicliffe, V., Lavelle, J. W., Martinez, F., et al. (2016). How many vent fields? New estimates of vent field populations on ocean ridges from precise mapping of hydrothermal discharge locations. Earth Planet. Sci. Lett. 449, 186–196. doi: 10.1016/j.epsl.2016.05.031
Baker, E. T., Tennant, D. A., Feely, R. A., Lebon, G. T., and Walker, S. L. (2001). Field and laboratory studies on the effect of particle size and composition on optical backscattering measurements in hydrothermal plumes. Deep Sea Res. Pt. I 48, 593–604. doi: 10.1016/S0967-0637(00)00011-X
Baker, E. T., Walker, S. L., Massoth, G. J., and Resing, J. A. (2019). The NE Lau basin: widespread and abundant hydrothermal venting in the back-arc region behind a superfast subduction zone. Front. Mar. Sci. 6:382. doi: 10.3389/fmars.2019.00382
Barreyre, T., Soule, S. A., and Sohn, R. A. (2011). Dispersal of volcaniclasts during deep-sea eruptions: settling velocities and entrainment in buoyant seawater plumes. J. Volcanol. Geoth. Res. 205, 84–93. doi: 10.1016/j.jvolgeores.2011.05.006
Baumberger, T., Lilley, M. D., Resing, J. A., Lupton, J. E., Baker, E. T., Butterfield, D. A., et al. (2014). Understanding a submarine eruption through time series hydrothermal plume sampling of dissolved and particulate constituents: west mata, 2008-2012. Geochem. Geophys. Geosyst. 15, 4631–4650. doi: 10.1002/2014gc005460
Blockley, S. P. E., Pyne-O’Donnell, S. D. F., Lowe, J. J., Matthews, I. P., Stone, A., Pollard, A. M., et al. (2005). A new and less destructive laboratory procedure for the physical separation of distal glass tephra shards from sediments. Quat. Sci. Rev. 24, 1952–1960. doi: 10.1016/j.quascirev.2004.12.008
Bohnenstiehl, D. R., Dziak, R. P., Matsumoto, H., and Conder, J. (2014). Acoustic response of submarine volcanoes in the tofua arc and northern lau basin to two great earthquakes. Geophys. J. Int. 196, 1657–1675. doi: 10.1093/gji/ggt472
Butterfield, D. A., Nakamura, K., Takano, B., Lilley, M. D., Lupton, J. E., Resing, J. A., et al. (2011). High SO2 flux, sulfur accumulation, and gas fractionation at an erupting submarine volcano. Geology 39, 803–806. doi: 10.1130/g31901.1
Caplan-Auerbach, J., Dziak, R. P., Bohnenstiehl, D. R., Chadwick, W. W., and Lau, T.-K. (2014). Hydroacoustic investigation of submarine landslides at west mata volcano, lau basin. Geophys. Res. Lett. 41, 5927–5934. doi: 10.1002/2014gl060964
Cas, R. A. F., and Giordano, G. (2014). Submarine volcanism: a review of the constraints, processes and products, and relevance to the Cabo de Gata volcanic succession. Ital. J. Geosci. 133, 362–377. doi: 10.3301/ijg.2014.46
Cas, R. A. F., and Simmons, J. M. (2018). Why deep-water eruptions are So different from subaerial eruptions. Front. Earth Sci. 6:198. doi: 10.3389/feart.2018.00198
Cashman, K. V., and Fiske, R. S. (1991). Fallout of pyroclastic debris from submarine volcanic eruptions. Science 253, 275–280. doi: 10.1126/science.253.5017.275
Cassidy, M., Watt, S. F. L., Palmer, M. R., Trofimovs, J., Symons, W. O., Maclachlan, S. E., et al. (2014). Construction of volcanic records from marine sediment cores: a review and case study (Monserrat, West Indies). Earth Sci. Rev. 138, 137–155. doi: 10.1016/j.earscirev.2014.08.008
Chadwick, W. W. Jr., Cashman, K. V., Embley, R. W., Matsumoto, H., Dziak, R. P., de Ronde, C. E. J., et al. (2008). Direct video and hydrophone observations of submarine explosive eruptions at NW Rota-1 volcano, mariana arc. J. Geophys. Res. 113:B08S10. doi: 10.1029/2007JB005215
Chadwick, W. W. Jr., Dziak, R. P., Haxel, J. H., Embley, R. W., and Matsumoto, H. (2012). Submarine landslide triggered by volcanic eruption recorded by in situ hydrophone. Geology 40, 51–54. doi: 10.1130/G32495.1
Chadwick, W. W. Jr., Embley, R. W., Johnson, P. D., Merle, S. G., Ristau, S., and Bobbitt, A. (2005). The submarine flanks of anatahan volcano, commonwealth of the northern mariana islands. J. Volcanol. Geoth. Res. 146, 8–25. doi: 10.1016/j.jvolgeores.2004.11.032
Chadwick, W. W. Jr., Merle, S. G., Buck, N. J., Lavelle, J. W., Resing, J. A., and Ferrini, V. (2014). Imaging of CO2 bubble plumes above an erupting submarine volcano, NW Rota-1, mariana arc. Geochem. Geophys. Geosyst. 15, 4325–4342. doi: 10.1002/2014GC005543
Chadwick, W. W. Jr., Rubin, K. H., Merle, S. G., Bobbitt, A. M., Kwasnitschka, T., and Embley, R. W. (2019). Recent eruptions between 2012 and 2018 discovered at West Mata submarine volcano (NE Lau basin, SW Pacific) and characterized by new ship, AUV, and ROV data. Front. Mar. Sci. 6:495. doi: 10.3389/fmars.2019.00495
Clague, D. A., Paduan, J. B., Caress, D. W., Thomas, H., Chadwick, W. W. Jr., and Merle, S. G. (2011). Volcanic morphology of west mata volcano, NE lau basin, based on high-resolution bathymetry and depth changes. Geochem. Geophys. Geosyst. 12:QOAF03. doi: 10.1029/2011GC003791
Clague, D. A., Paduan, J. B., and Davis, A. S. (2009). Widespread strombolian eruptions of mid-ocean ridge basalt. J. Volcanol. Geoth. Res. 180, 171–188. doi: 10.1016/j.jvolgeores.2008.08.007
Clift, P. D., and Lee, J. (1998). Temporal evolution of the mariana arc during rifting of the mariana trough traced through the volcaniclastic record. I. Arc 7, 496–512. doi: 10.1046/j.1440-1738.1998.00206.x
Crisp, J. A. (1984). Rates of magma emplacement and volcanic output. J. Volcanol. Geoth. Res. 20, 177–211. doi: 10.1016/0377-0273(84)90039-8
Dade, W. B., and Huppert, H. E. (1995). Runout and fine-sediment deposits of axisymmetric turbidity currents. J. Geophys. Res. 100, 18597–18609.
Deardorff, N. D., Cashman, K. V., and Chadwick, W. W. Jr. (2011). Observations of eruptive plume dynamics and pyroclastic deposits from submarine explosive eruptions at NW Rota-1, mariana arc. J. Volcanol. Geoth. Res. 202, 47–59. doi: 10.1016/j.jvolgeores.2011.01.003
Dziak, R. P., Baker, E. T., Shaw, A. M., Bohnenstiehl, D. R., Chadwick, W. W. Jr., Haxel, J. H., et al. (2012). Flux measurements of explosive degassing using a year-long hydroacoustic record at an erupting submarine volcano. Geochem. Geophys. Geosyst. 13, Q0AF07. doi: 10.1029/2012GC004211
Dziak, R. P., Bohnenstiehl, D. R., Baker, E. T., Matsumoto, H., Caplan-Auerbach, J., Embley, R. W., et al. (2015). Long-term explosive degassing and debris flow activity at west mata submarine volcano. Geophys. Res. Lett. 42, 1480–1487. doi: 10.1002/2014GL062603
Embley, R. W., Chadwick, W. W. Jr., Baker, E. T., Butterfield, D. A., Resing, J. A., de Ronde, C. E. J., et al. (2006). Long-term eruptive activity at a submarine arc volcano. Nature 441, 494–497. doi: 10.1038/nature04762
Embley, R. W., Merle, S. G., Baker, E. T., Rubin, K. H., Lupton, J. E., Resing, J. A., et al. (2014a). Eruptive modes and hiatus of volcanism at west mata seamount:, NE lau basin: 1996–2012. Geochem. Geophys. Geosyst. 15, 4093–4115. doi: 10.1002/2014GC005387
Embley, R. W., Tamura, Y., Merle, S. G., Sato, T., Oshizuka, O., and Chadwick, W. W.Jr., et al. (2014b). Eruption of south sarigan seamount, northern mariana islands: insights into hazards from submarine volcanic eruptions. Oceanography 27, 24–31. doi: 10.5670/oceanog.2014.37
Embley, R. W., Merle, S. G., Lupton, J. E., Resing, J. A., Baker, E. T., Lilley, M. D., et al. (2009). “Extensive and diverse submarine volcanism and hydrothermal activity in the NE lau basin,” in Proceedings of the American Geophysical Union, Fall Meeting 2009 (Washington, DC).
Embley, R. W., Resing, J. A., Tebo, B., Baker, E. T., Butterfield, D. A., Chadwick, W., et al. (2013). “Hyperactive hydrothermal activity in the NE Lau basin revealed by ROV dives,” in Proceedings of the Abstract V21C-2738 Presented at 2013 Fall Meeting (San Francisco: American Geophysical Union).
Embley, R. W., and Rubin, K. (2018). Extensive young silicic volcanism produces large deep submarine lava flows in the NE lau basin. Bull. Volcanol. 80:36.
Feely, R. A., Massoth, G. J., and Lebon, G. T. (1991). Sampling of marine particulate matter and analysis by x-ray fluorescence spectrometry. Mar. Part. 63, 251–257. doi: 10.1029/gm063p0251
Gill, J. B., Bongiolo, E. M., Miyazaki, T., Hamelin, C., Jutzeler, M., DeBari, M. S., et al. (2018). Tuffaceous mud is a volumetrically important volcaniclastic facies of submarine arc volcanism and record of climate change. Geochem. Geophys. Geosyst. 19, 1217–1243. doi: 10.1002/2017gc007300
Hawkins, J., Parson, L., and Allan, J. (1994). “Introduction to the scientific results of leg 135: lau basin–tonga ridge drilling transect,” in Proceedings of the Ocean Drilling Program, Scientific Results (College Station, TX: Ocean Drilling Program), 3–5.
Head, J. W. III, and Wilson, L. (2003). Deep submarine pyroclastic eruptions: theory and predicted landforms and deposits. J. Volcanol. Geoth. Res. 121, 155–193. doi: 10.1016/s0377-0273(02)00425-0
Jordan, S. C., Dürig, T., Cas, R. A. F., and Zimanowski, B. (2014). Processes controlling the shape of ash particles: results of statistical IPA. J. Volcanol. Geoth. Res. 288, 19–27. doi: 10.1016/j.jvolgeores.2014.09.012
Kim, J., Son, S.-K., Son, J.-W., Kim, K.-H., Shim, W. J., Kim, C. H., et al. (2009). Venting sites along the fonualei and northeast lau spreading centers and evidence of hydrothermal activity at an off-axis caldera in the northeastern lau basin. Geochem. J. 43, 1–13. doi: 10.2343/geochemj.0.0164
Kohn, B. P., and Glasby, G. P. (1978). Tephra distribution and sedimentation rates in the bay of plenty, New Zealand. N. Z. J. Geol. Geophys. 21, 49–70. doi: 10.1080/00288306.1978.10420721
Lavoie, D. L., Bruns, T. R., and Fischer, K. M. (1994). “Geotechnical and logging evidence for underconsolidation of lau basin sediments: rapid sedimentation vs. fluid flow,” in Proceedings of the Ocean Drilling Program, Scientific Results (College Station, TX: Ocean Drilling Program), 787–795.
Lowe, D. J. (2011). Tephrochronology and its application: a review. Quat. Geochronol. 6, 107–153. doi: 10.1016/j.quageo.2010.08.003
Lowe, D. J. (2014). “Marine tephrochronology: a personal perspective,” in Marine Tephrochronology, eds W. E. N. Austin, P. M. Abbott, S. M. Davies, N. J. G. Pearce, and S. Wastegård (Piccadilly: Geological Society Special Publications), 7–19. doi: 10.1144/sp398.11
Lupton, J., Rubin, K. H., Arculus, R., Lilley, M. D., Butterfield, D. A., Resing, J. A., et al. (2015). Helium isotope, C/3He, and Ba-Nb-Ti signatures in the northern lau basin: distinguishing arc, back-arc, and hotspot affinities. Geochem. Geophys. Geosyst. 16, 1133–1155. doi: 10.1002/2014GC005625
Lupton, J. E. (1990). Water column hydrothermal plumes on the Juan de Fuca ridge. J. Geophys. Res. 95, 12829–12842. doi: 10.1029/JB095iB08p12829
Lupton, J. E., Pyle, D. G., Jenkins, W. J., Greene, R., and Evans, L. (2004). Evidence for an extensive hydrothermal plume in the Tonga-Fiji region of the south pacific. Geochem. Geophys. Geosyst. 5:Q01003.
Manville, V., and Wilson, C. J. N. (2004). Vertical density currents: a review of their potential role in the deposition and interpretation of deep-sea ash layers. J. Geol. Soc. Lond. 161, 947–958. doi: 10.1144/0016-764903-067
Mattsson, H. B. (2010). Textural variation in juvenile pyroclasts from an emergent, Surtseyan-type, volcanic eruption: the Capelas tuff cone, São Miguel (Azores). J. Volcanol. Geoth. Res. 189, 81–91. doi: 10.1016/j.jvolgeores.2009.10.007
McCanta, M. C., Hatfield, R. G., Thomson, B. J., Hook, S. J., and Fisher, E. (2015). Identifying cryptotephra units using correlated rapid, nondestructive methods: VSWIR spectroscopy, X-ray fluorescence, and magnetic susceptibility. Geochem. Geophys. Geosyst. 16, 4029–4056. doi: 10.1002/2015gc005913
Middleton, G. V., and Hampton, M. A. (1976). “Subaqueous sediment transport and deposition by sediment gravity flows,” in Marine Sediment Transport and Environmental Management, eds D. J. Stanley, and D. J. P. Swift, (New York, NY: Wiley), 197–218.
Mulder, T., and Alexander, J. (2001). The physical character of subaqueous sedimentary density flows and their deposits. Sedimentology 48, 269–299. doi: 10.1046/j.1365-3091.2001.00360.x
Németh, K., Pécskay, Z., Martin, U., Gméling, K., Molnár, F., and Cronin, S. J. (2008). Hyaloclastites, peperites and soft-sediment deformation textures of a shallow subaqueous miocene rhyolitit dome-cryptodome complex, Pálháza,Hungary. Geol. Soc. Lond. Spec. Publ. 302, 63–86. doi: 10.1144/sp302.5
Pillans, B., and Wright, I. (1992). Late quaternary tephrostratigraphy from the southern havre trough - bay of plenty, northeast New Zealand. N. Z. J. Geol. Geophys. 35, 129–143. doi: 10.1080/00288306.1992.9514507
Pope, E. L., Jutzeler, M., Cartigny, M. J. B., Shreeve, J., Talling, P. J., Wright, I. C., et al. (2018). Origin of spectacular fields of submarine sediment waves around volcanic islands. Earth Planet. Sci. Lett. 493, 12–23.
Resing, J. A., Lebon, G., Baker, E. T., Lupton, J. E., Embley, R. W., Massoth, G. J., et al. (2007). Venting of acid-sulfate fluids in a high-sulfidation setting at NW Rota-1 submarine volcano on the mariana arc. Econ. Geol. 102, 1047–1061. doi: 10.2113/gsecongeo.102.6.1047
Resing, J. A., Rubin, K. H., Embley, R. W., Lupton, J. E., Baker, E. T., Dziak, R. P., et al. (2011). Active submarine eruption of boninite in the northeastern lau basin. Nat. Geosci. 4, 799–806. doi: 10.1038/ngeo1275
Rubin, K. H., Chadwick, W. W. Jr., Embley, R. W., Merle, S. G., Shank, T. M., Cho, W., et al. (2018). “Exploration of the mata submarine volcano group reveals volcano-tectonic-hydrothermal links,” in Proccedings of the Abstract V14A-08 presented at 2018 Fall Meeting (Washington, DC: AGU), 10–14.
Rubin, K. H., Soule, S. A., Chadwick, W. W. Jr., Fornari, D. J., Clague, D. A., Embley, R. W., et al. (2012). Volcanic eruptions in the deep sea. Oceanography 25, 142–157.
Sansone, F. J., and Resing, J. A. (1995). Hydrography and geochemistry of sea-surface hydrothermal plumes resulting from Hawaiian coastal volcanism. J. Geophys. Res. 100, 13555–13569.
Schindlbeck, J. C., Kutterolf, S., Freundt, A., Scudder, R. P., Pickering, K. T., and Murray, R. W. (2013). Emplacement processes of submarine volcaniclastic deposits (IODP Site C0011, Nankai Trough). Mar. Geol. 343, 115–124. doi: 10.1016/j.margeo.2013.06.017
Schnur, S. R., Chadwick, W. W. Jr., Embley, R. W., Ferrini, V. L., de Ronde, C. E. J., Cashman, K. V., et al. (2017). A decade of volcanic construction and destruction at the summit of NW Rota-1 seamount: 2004 2014. J. Geophys. Res. 122, 1558–1584.
Scudder, R. P., Murray, R. W., and Plank, T. (2009). Dispersed ash in deeply buried sediment from the northwest Pacific Ocean: an example from the Izu–Bonin arc (ODP Site 1149). Earth Planet. Sci. Lett. 284, 639–648. doi: 10.1016/j.epsl.2009.05.037
Scudder, R. P., Murray, R. W., Schindlbeck, J. C., Kutterolf, S., Hauff, F., and McKinley, C. C. (2014). Regional-scale input of dispersed and discrete volcanic ash to the Izu-Bonin and mariana subduction zones. Geochem. Geophys. Geosyst. 15, 4369–4379. doi: 10.1002/2014gc005561
Shane, P., Sikes, E. L., and Guilderson, T. P. (2006). Tephra beds in deep-sea cores off northern New Zealand: implications for the history of Taupo Volcanic Zone, Mayor Island and White Island volcanoes. J. Volcanol. Geoth. Res. 154, 276–290. doi: 10.1016/j.jvolgeores.2006.03.021
Sigurdsson, H., Sparks, R. S. J., Carey, S. N., and Huang, T. C. (1980). Volcanogenic sedimentation in the lesser antilles arc. J. Geol. 88, 523–540. doi: 10.1086/628542
Simpson, J. E. (1987). Gravity Currents in the Environment and the Laboratory. Chichester: Ellis Horwood.
Sohn, R. A., Willis, C., Humphris, S., Shank, T. M., Singh, H., Edmonds, H. N., et al. (2008). Explosive volcanism on the ultraslow-spreading gakkel ridge, arctic ocean. Nature 453, 1236–1238. doi: 10.1038/nature07075
Tamura, Y., Busby, C. J., Blum, P., Guèrin, G., Andrews, G. D. M., Barker, A. K., et al. (2015). “Site U1437,” in Proceedings of the International Ocean Discovery Program, Expedition 350: Izu-Bonin-Mariana Rear Arc (College Station, TX: International Ocean Discovery Program), doi: 10.14379/iodp.proc.350.104.2015
Walker, S. L., Baker, E. T., Leybourne, M., de Ronde, C. E. R., Greene, R., Faure, K., et al. (2010). “Transport of fine ash through the water column at erupting volcanoes: monowai cone, Kermadec-Tonga arc,” in Proccedings of the Abstract T13B-2193 Presented at 2010 Fall Meeting (San Francisco, CA: AGU).
Walker, S. L., Baker, E. T., Resing, J. A., Chadwick, W. W. Jr., Lebon, G. T., Lupton, J., et al. (2008). Eruption-fed particle plumes and volcaniclastic deposits at a submarine volcano: NW Rota-1, Mariana arc. J. Geophys. Res. 113:B08S11.
Walker, S. L., Baker, E. T., Resing, J. A., Nakamura, K., and McLain, P. D. (2007). “A new tool for detecting hydrothermal plumes: an ORP sensor for the PMEL MAPR,”in Proceedings of the AGU Fall Meeting Abstracts (Washington, D.C: American Geophysical Union), 753
Watt, S. F. L., Karstens, J., Micallef, A., Berndt, C., Urlaub, M., Ray, M., et al. (2019). From Catastrophic collapse to multi-phrase deposition: flow transformation, seafloor interaction and triggered eruption following a volcanic-island landslide. Earth Planet. Sci. Lett. 517, 135–147. doi: 10.1016/j.epsl.2019.04.024
White, J. D. L., Smellie, J. L., and Clague, D. A. (2003). “Introduction. A deductive outline and typical overview of subaqueous explosive volcanism,” in Submarine Explosive Volcanism, eds J. D. L. White, J. L. Smellie, and D. A. Clague (Washington, DC: American Geophysical Union, Geophysical Monograph), 1–23. doi: 10.1029/140gm01
Wohletz, K. H., and Krinsley, D. H. (1982). Scanning electron microscopy of basaltic hydromagmatic ash. Los Alamos National Laboratory Report, LA-UR 82-1433. Tempe, AZ: Arizona State University.
Keywords: submarine volcano, explosive eruption, ash plume, hydrothermal plume, cryptotephra, ash dispersal, exploration, fallout deposit
Citation: Walker SL, Baker ET, Lupton JE and Resing JA (2019) Patterns of Fine Ash Dispersal Related to Volcanic Activity at West Mata Volcano, NE Lau Basin. Front. Mar. Sci. 6:593. doi: 10.3389/fmars.2019.00593
Received: 01 April 2019; Accepted: 05 September 2019;
Published: 26 September 2019.
Edited by:
Diva Amon, Natural History Museum, United KingdomReviewed by:
Karoly Nemeth, Massey University, New ZealandSebastian Watt, University of Birmingham, United Kingdom
Copyright © 2019 Walker, Baker, Lupton and Resing. This is an open-access article distributed under the terms of the Creative Commons Attribution License (CC BY). The use, distribution or reproduction in other forums is permitted, provided the original author(s) and the copyright owner(s) are credited and that the original publication in this journal is cited, in accordance with accepted academic practice. No use, distribution or reproduction is permitted which does not comply with these terms.
*Correspondence: Sharon L. Walker, U2hhcm9uLkwuV2Fsa2VyQG5vYWEuZ292