 Laura A. Fiorentino
 Robert Heitsenrether1
- 1Ocean Systems Test and Evaluation Program, Center for Operational Oceanographic Products and Services, National Oceanographic and Atmospheric Administration, Chesapeake, VA, United States
- 2Lynker Technologies, Leesburg, VA, United States
Currently the NOAA Center for Operational Oceanographic Products and Services (CO-OPS) is transitioning the primary water level sensor at most NWLON stations, from an acoustic ranging system, to microwave radars. With no stilling well and higher resolution of the open sea surface, microwave radars have the potential to provide real-time wave measurements at NWLON sites. Radar sensors at tide stations may offer a low cost, convenient way to increase nearshore wave observational coverage throughout the U.S. to support navigational safety and ocean research applications. Here we present the results of a field study, comparing wave height measurements from four radar water level sensors, with two different signal types (pulse and continuous wave swept frequency modulation-CWFM). A nearby bottom acoustic wave and current sensor is used as a reference. An overview of field setup and sensors will be presented, along with an analysis of performance capabilities of each radar sensor. The study includes results from two successive field tests. In the first, we examine the performance from a pulse microwave radar (WaterLOG H-3611) and two CWFM (Miros SM-94 and Miros SM-140). While both types of radars tracked significant wave height well over the test period, the pulse radar had less success resolving high frequency wind wave energy and showed a high level of noise toward the low frequency end of the spectrum. The pulse WaterLOG radar limitations were most apparent during times of high winds and locally developing seas. The CWFM radars demonstrated greater capability to resolve those higher frequency energies, while avoiding low frequency noise. The initial field test results motivated a second field test, focused on the comparison of wave height measurements from two pulse radar water level sensors, the WaterLOG H3611 and the Endress and Hauser Micropilot FMR240. Significant wave height measurements from both radar water level sensors compared well to reference AWAC measurements over the test period, but once again the WaterLOG radar did not adequately resolve wind wave energy in high frequency bands and showed a high level of noise toward the low frequency end of the spectrum. The E+H radar demonstrated greater capability to resolve those higher frequency energies while avoiding the low frequency aliasing issue observed in the WaterLOG.
1. Introduction
The National Oceanic and Atmospheric Administration (NOAA) National Ocean Service (NOS) Center for Operational Oceanographic Products and Services (CO-OPS) maintains and develops the National Water Level Observation Network (NWLON), which consists of over 200 long-term stations that provide real-time water level observations across coasts in the U.S. The primary water level measurement system at most stations is an acoustic ranging water level sensor. In 2012 CO-OPS began to transition NWLON station sensors from acoustic to microwave radar water level sensors, which provide many benefits, including lower costs, less maintenance and support, and improved measurements (Park et al., 2014).
Adding real-time wave measurements to the CO-OPS observatory network has been discussed for several years in accordance with the NOAA IOOS National Operational Wave Observation Plan (NOAA and USACE, 2009), as there is a critical need to increase spatial coverage of nearshore wave observations across the U.S. Currently, NOAA CO-OPS does not maintain any of its own operational wave measurement systems. Wave information disseminated via NOAA Physical Oceanographic Real-Time Systems (PORTS) comes from the Scripps Institute of Oceanography (SIO) Coastal Data Information Program (CDIP) Datawell buoys, located nearby PORTS systems. Consistent wave height measurements at multiple NWLON stations along the coast of the U.S. would be useful to port and shipping managers, ocean modelers, and others in the transportation, city management, and scientific communities. Additionally, employing the same single sensor to simultaneously measure both surface gravity waves and longer average water levels, offers an efficient system design and significant savings in costs.
The acoustic sensors used at NWLON stations in the past were not well-suited for direct wave measurements due to resonance and dampening from the protective well (Park et al., 2014). Furthermore, a pressure drop created from currents across the well opening can decrease the water level (Park et al., 2014). The use of radar water level sensors presents the potential opportunity to measure waves directly, as they are non-contact sensors that require no well infrastructure and measure the open sea surface directly (Pérez et al., 2014). All radar sensors reviewed in this study are specified to have beams with a 10° spreading angle, resulting in a measurement footprint at the sea surface ranging from 1.1 to 1.5 m, based on the conditions at the study site (MIROS, NDa,N; Xylem-YSI, ND). Additionally, all sensors are specified to be capable of 1 Hz sampling. Based on these, radar sensors should have the spatial and temporal resolution necessary to simultaneously measure waves and the average sea level.
While previous studies have utilized high frequency water level observations from NWLON stations to derive statistics to serve as a proxy for wave conditions (Sweet, 2016), few studies have presented wave height measured directly from radar water level sensors. Although vendors of commercial off the shelf available radar water level sensors advertise and offer this capability, and scientists in the international sea level monitoring community have been using radars to simultaneously measure waves and water levels, there is little available information provided in the literature on research into their accuracy and performance. Ewans et al. (2014) show that a SAAB WaveRadar, CWFM radar compares well to radar signal modeling. They also present results from a field experiment in which they compare the radar to a Datawell wave buoy 3 km away. Only significant wave height comparisons are presented, and the authors acknowledge the need for more detailed studies. Pérez Gómez (2014) presents details of Spain's updated sea level monitoring and forecast system REDMAR, whose stations are equipped with Miros CWFM microwave radars. They provide simultaneous sea level results and wave parameters. This work does not provide information on any performance evaluations on the wave measuring capabilities of the radar. Furthermore, both of these references use CWFM microwave radars to measure wave parameters and there are no known sources that provide information on the use of pulse radars for wave measurements.
From 2008 to 2012, CO-OPS conducted a series of extensive laboratory and field tests to assess the long-term water level monitoring capability of several different make/model radar sensors, to evaluate the suitability for use throughout the NWLON. Results identified a pulse type radar as best suited for CO-OPS water level monitoring applications (Heitsenrether and Davis, 2011). Since 2012, all radar sensors installed at NWLON sites have been of the pulse type. CO-OPS' test results for monitoring long term water levels (at 6 min sampling and averaging rate) found no significant difference in measurement accuracy between pulse and CWFM radar, however pulse radar is typically significantly less expensive and has a much lower power draw than the CWFM.
We present the results of two field studies comparing wave height measurements from four radar water level sensors. The first study consisted of three radar water level sensors (one pulse and two continuous wave swept frequency modulation-CWFM). A nearby bottom acoustic wave and current meter was used as a reference. An overview of field setup and sensors will be presented, along with an analysis of the performance capabilities of each sensor. All three radars tracked significant wave height well over the test period, though initial results indicate that the WaterLOG pulse radar is less successful in resolving high frequency wind wave energy. The CWFM radars demonstrate greater capability in resolving those higher frequency energies as well as eliminating low frequency aliasing.
Results from the first initial test suggest that some component of the WaterLOG's internal processing reduces the sensor's potential measurement resolution. This particular sensor is equipped with an SDI-12 interface and an associated layer of additional, proprietary software. Although this SDI-12 interface offers many benefits for real-time water level measurement system applications, the additional layer of software and processing results in uncertainty in lower level data cycles and affects temporal resolution. The purpose of the second field test is to better understand the effects of the WaterLOG's SDI-12 interface and to explore potential improvements to pulse radar wave measurements when the SDI-12 is not present. In this test, we field tested the same type of instrument without the added layer of processing, the Endress+Hauser Micropilot M FMR240. The FMR240 outputs currents from 4 to 20 mA with a linear relationship to measured ranges. A simple, linear function is used to convert current output to range in meters in an external data logger.
We present the results of our second ongoing study on the use of microwave radar water level sensors for wave measurements, with a focus on the comparison of wave height measurements from two pulse radar water level sensors, the WaterLOG H3611 and the Endress+Hauser Micropilot M FMR240. The nearby bottom acoustic wave and current sensor is again used as a reference. An overview of the second field setup and sensors will be presented, along with an analysis of performance capabilities of each radar sensor.
2. Methods
2.1. Field Site and Setup
For both of the reported field tests, the test radar sensors were installed alongside an existing NWLON station on the US Army Corps of Engineers (USACE) Field Research Facility pier in Duck, NC (Figure 1). Duck, NC is representative of the type of open ocean NWLON site where the addition nearshore wave observations would be valued by a variety of end users. The site experiences a broad range of wave conditions, relative to east U.S. coastal sites, and the research facility maintains a continuous source of reference wave measurements. For both field tests, radar sensors were installed toward the very end of the pier, approximately 0.5 km offshore, on the south facing side. Sensors were mounted side by side, and securely attached to the pier railing at a location between pylings and with a clear view of the sea surface below. They were located approximately 8.5 m above the water surface, resulting in an approximate beam width of 1.5 m at the water surface. The average water depth at that location of the pier was 6–7 m. Radar range to sea surface measurements were collected at a sampling rate of 1 Hz and recorded using a Sutron Xpert data logger. Based on the 1 Hz sample rate and the radars' 1.5 m beam width at the sea surface (based on the 10° beam spreading angle), each sensor should have the temporal and spatial resolution to resolve surface gravity waves in the area. For example, using the shallow water dispersion relation, a surface gravity wave with a wavelength twice the radar's beam width, 3 m, will have a period of 1.39 s. As the majority of waves in the area of interest have a period of 2 s, the sensors specifications are sufficient to measure them.
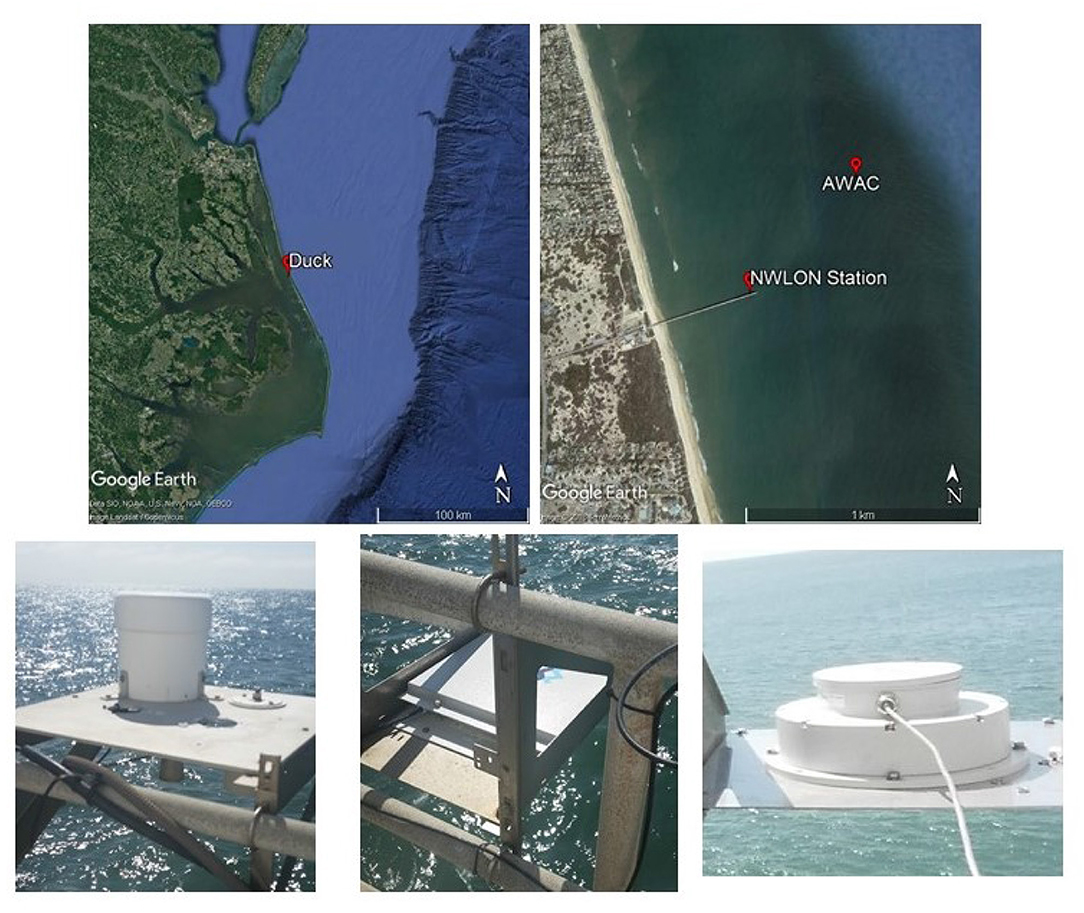
Figure 1. (Top) Map of the location of both field tests, Duck, NC.; (Bottom left) WaterLOG radar; (Bottom middle) Miros SM-094; (Bottom right) Miros SM-140.
The USACE operates an array of bottom mounted Nortek acoustic wave and current profilers (AWAC) along a series of different isobaths through the surf zone at the facility, and one was used as a reference. Unfortunately, AWACs at the 5 and 6 m isobaths were not operational throughout the radar sensor test period presented here. The closest available reference AWAC is located approximately 0.8 km from the radar sensors on the pier, is at an average depth of 11.41 m, and operates with an acoustic center frequency of 1 MHz. Given the depth differences between the locations of the selected reference AWAC and the test radar water level sensors, we acknowledge that some difference in wave observations between the two may be a result of changing conditions associated with shoaling of the waves over the cross-shore depth gradient. Regardless, we feel that for hourly spectra and bulk parameters, conditions at the 11.4 m isobath in general will be reasonably close to conditions near the end of the pier where the test radar sensors reside, and that in comparison to this, AWAC will provide a useful, first indication of radar sensor wave measurement performance. A comparison of significant wave height and average spectra over a sample time period, for which both the 5 and 11 m AWACs were operational, resulted in an average significant wave height difference of 2 cm and supports this assumption. Our hope is that results from this study will motivate continuing work that will support a more ideal test setup, with reference wave sensors better collocated with test radar sensors. The NWLON station at Duck is also equipped with a meteorological station that includes a pair of RM Young propeller anemometers that measure winds at a 6 min period.
2.2. Instrumentation—Field Test I
Three sensors were evaluated during this study, the WaterLOG H-3611 pulse radar and the Miros SM-094 and SM-140 Rangefinder CWFM radars. The WaterLOG H-3611 employs a 26 GHz pulse signal to measure range to surface from the time of flight between a transmitted and received signal. It has a beam spreading angle of 10°, a pulse period of 280 ns, and a pulse width of 0.8 ns. This is the particular model radar sensor that is currently being installed at NWLON stations. The Miros SM-094 Rangefinder and its latest model replacement, the SM-140, are continuous wave frequency modulated (CWFM) microwave radars that use a triangular frequency modulation to measure the range to surface. A beat frequency is generated by mixing the transmitted and echo signals and used to compute the distance from the sensor to the target. Both the SM-094 and SM-140 have a frequency of 9.4–9.8 GHz and a beam-spreading angle of 10°. Miros Rangefinders are currently used on NOAA PORTS Air-Gap bridge clearance systems, in part for their long-range measurement capability (Bushnell et al., 2005). Although the focus of this study is to evaluate the wave measurement capability of the pulse type radars that are being implemented throughout NWLON, spare Miros Rangefinder units were readily available and easily integrated into the field test platform. Inclusion provides additional reference observations and a chance to compare results to those from previous CWFM studies.
2.3. Instrumentation—Field Test II
For the second field test, the WaterLOG H-3611 remained installed and the Endress+Hauser MicropilotM FMR240 (E+H) was added, installed directly alongside the existing WaterLOG (Figure 8). Both sensors employ the identical time-of-flight principle to measure range and share the following signal characteristics: 26 GHz frequency, 280 ns pulse period, 0.8 ns pulse width, and a 10° beam spreading angle. The H-3611 is a water level sensor with SDI-12 serial output and a specialized interface for NOAA water level applications. The E+H Micropilot is the 4–20 mA base sensor of the WaterLOG, without the SDI-12 interface and proprietary processing software. Measurements used for this study include 121 days when data from both radar sensors as well as the reference AWAC were available between 16 April 2018 and 12 July 2018.
2.4. Wave Parameter Calculations
Measurements used for this study, from both field tests, include only times when all radar sensors as well as the reference AWAC were available. Large gaps in data, particularly in the E+H during the second test were due to intermittent data logger and power issues and are not representative of radar sensor performance (Figures 2, 9).
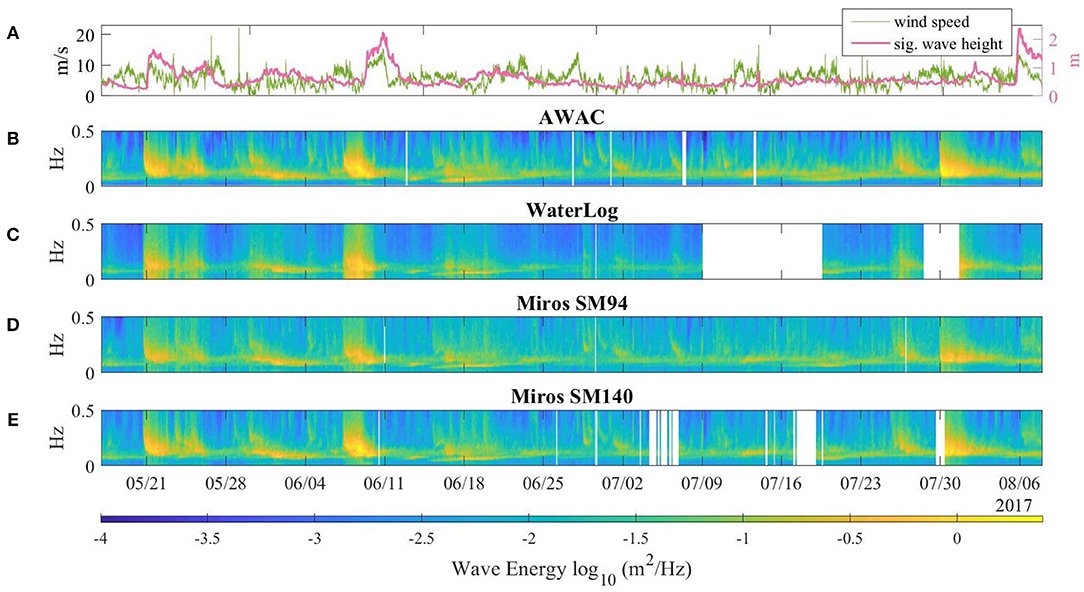
Figure 2. (A) Wind speed in m/s from Duck, NC NWLON station (green), significant wave height from AWAC (pink); (B) Non-direction energy spectra from USACE FRF AWAC; (C) Non-direction energy spectra from WaterLOG H-3611; (D) Non-direction energy spectra from Miros SM-094 Rangefinder; (E) Non-direction energy spectra from Miros SM-140 Rangefinder.
Hourly power spectral densities (PSD) were computed for each sensor using the first 2,048 1 Hz samples at the top of each hour. Each hourly ensemble of 2,048 samples was wild point edited by removing raw range to surface points outside of 4–20 m in order to exclude random spikes. The samples were then detrended, and the power spectral density was computed using the Welch FFT approximation (pwelch function in Mathworks MATLAB) with an NFFT length of 64, a Hamming window and a 50% window overlap. Significant wave height is estimated as , where m0 is the area under the power spectral density curve [the variance of surface elevation (zero moment)] in the frequency band from 0.0156 to 0.5 Hz.
AWAC spectra and bulk wave parameters are calculated with USACE developed algorithms that combine 4 Hz sea surface height measurements from the sensor's Acoustic Surface Tracking beam (AST) and near surface orbital velocities (UV) computed from its three oblique current profiling beams (AST-UV). Sea surface height from the AWAC's pressure sensor is used if AST measurements do not pass an automated quality check. USACE processed AWAC spectra covers 50 0.01 Hz spaced frequency bands, ranging from 0.01 to 0.5 Hz.
Detailed radar versus AWAC wave measurement comparisons presented in the following section include separate comparisons of the swell and wind wave components of spectral estimates. To separate wind waves and swell, we used the 1D wave spectral method proposed by Hwang et al. (2012), which is a modification of the steepness method of Wang and Hwang (2001). This partitioning technique uses the wave frequency spectrum to determine a separation frequency that distinguishes wind waves from sea swell. We use the power spectral density of the AWAC to compute a time series of separation frequencies (fs). These fs are used when separating swell and wind waves for the AWAC and three radars.
Hwang defines the separation frequency as
where fm1 is the peak frequency of the spectrum integration function
and m, the nth moment for the wave spectrum, is defined as:
3. Results, Field Test One
Results from field test one include 68 days when data from both radar sensors as well as the reference AWAC were all available between 17 May 2017 and 8 August 2017.
During the test period, the site experienced a range of wave conditions, with varying combinations of wind-sea and swell. The reference AWAC measurements indicate that significant wave heights ranged from 0.2 to 2.4 m, and the NWLON meteorological station on site indicated several high windstorm events, where wind speeds exceeded 10 m/s for more than 20 h (Figure 2A). A qualitative look at the wave energy spectra for each sensor (Figures 2B–D) shows comparable results throughout the time series over a range of conditions.
The average power spectral densities for all sensors throughout the experiment are shown in Figure 3. All four sensors have an energy peak centered near 0.12 Hz. The peak of the Miros SM-140 is about 16% lower than that of the AWAC. The Miros SM-094 and WaterLOG are 33 and 41% lower than the AWAC, respectively, indicating resolution issues. Also, in the WaterLOG average spectrum, we see energy near 0.016 Hz, which is likely low frequency noise that may result from poor resolution and aliasing of higher frequency wave energy.
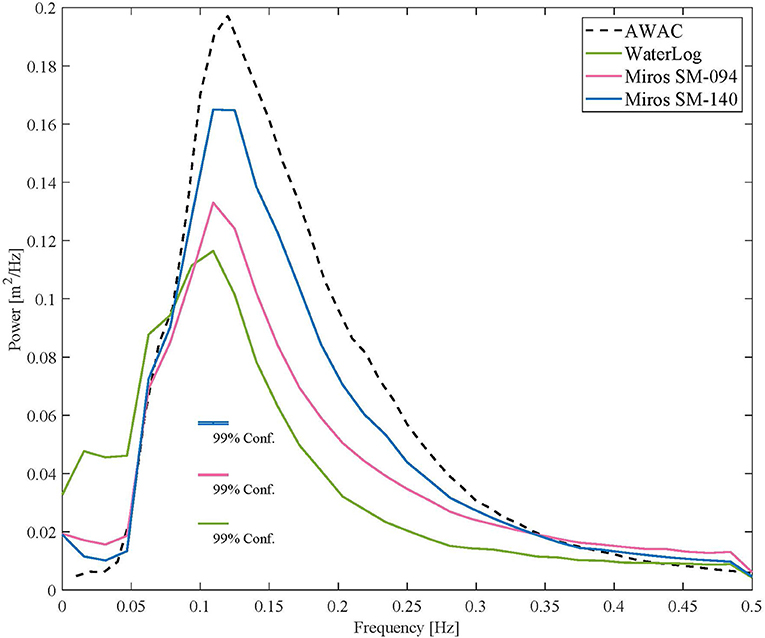
Figure 3. Average power spectral density for each sensor: AWAC (black), WaterLOG (green), Miros SM-094 (pink), Miros SM-140 (blue) [17 May 2017–9 August 2017].
Figure 4 provides two examples of individual, hourly spectra from each sensor, one during a swell dominated sea with low wind speeds (Figure 4A) and another during a high wind event with a local wind wave dominated sea (Figure 4B). Again, results that reveal wave energy resolution issues, particularly with the WaterLOG radar. During the low wind event with swell dominated seas (average 4.9 m/s), the AWAC and both Miros sensors show two distinct peaks, near 0.08 and 0.22 Hz. Conversely, the WaterLOG sensor only resolves the 0.08 Hz peak and not the 0.22 Hz peak (Figure 4A). Figure 4B shows an example of a higher wind event (average 9.5 m/s). The Miros SM-140 is in good agreement with the AWAC, which measured an energy peak around 0.2 Hz. The Miros SM-094 has a slightly reduced spectral level at this peak. Again, the PSD of the WaterLOG does not show a true peak near 0.2 Hz and lower frequency peak appears near 0.016 Hz. Again, this is most likely noise that may result from aliasing of higher frequency energy.
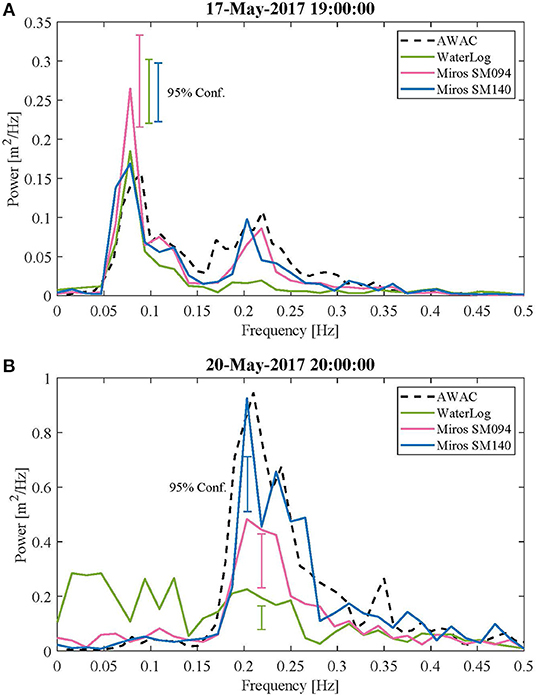
Figure 4. Power spectral density for each sensor [AWAC (black), WaterLOG (green), Miros SM-094 (pink), Miros SM-140 (blue)] during a low wind event (A) and a high wind event (B).
While the CWFM sensors provide consistent results for all frequencies, the pulse radar results vary across different frequency bands, during different sea states. It is useful to partition results to examine spectral energy comparisons for different wave environments. To do this we find time periods within our data that are dominated by either wind or swell. Swell (or wind) dominated seas were defined as those in which the energy on either side of the separation frequency fs [1] comprised more than 85% of the total energy. The average spectral densities for swell dominated seas, which are comprised of 173 hourly samples, are shown in Figure 5A. Here the CWFM sensors are in good agreement with the AWAC, while the WaterLOG only underestimates the energy peak by about 25%. We see an even greater disparity in the average spectra of the wind-wave dominated seas, about 52% (Figure 5B). This suggests that the pulse radar, operating at one Hz, is not capable of resolving high frequency wave energy but is more capable of measuring swell.
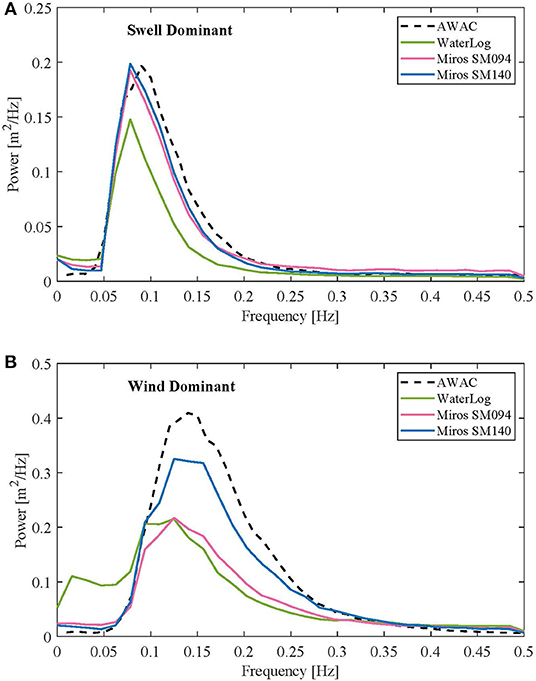
Figure 5. Average spectral density for each sensor [AWAC (black), WaterLOG (green), Miros SM-094 (pink), Miros SM-140 (blue)] during swell dominant seas (A) and wind-wave dominant seas (B).
Next we compare the bulk wave parameters (Figure 6, Table 1, top). The WaterLOG consistently underestimates the significant wave height. The Miros SM-094 shows good agreement for waves under 1 m, but then underestimates larger waves. The best results are found from the Miros SM-140. There is good and consistent agreement throughout. Mean period comparisons are similar to those of significant wave height. The WaterLOG overestimates the mean wave period and the Miros SM-094 and Miros SM-140 perform better.
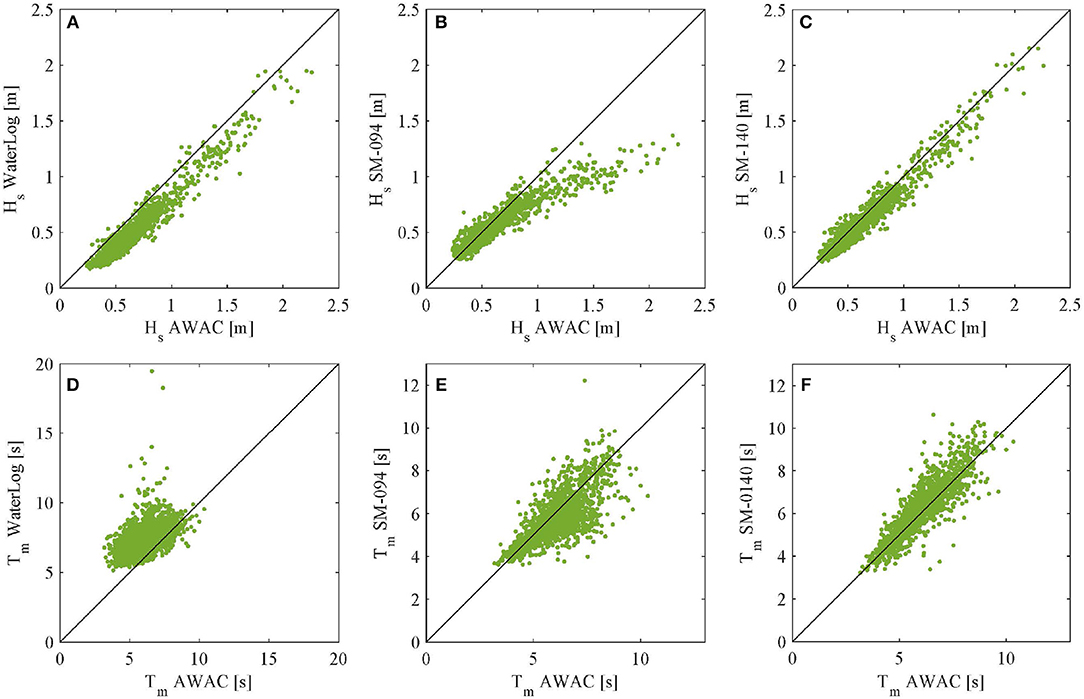
Figure 6. Comparisons of significant wave height (A–C) and mean period (D–F) for each test sensor (left: WaterLOG, middle: Miros SM-094, right: Miros SM-140) to the reference AWAC [17 May 2017–9 August 2017].
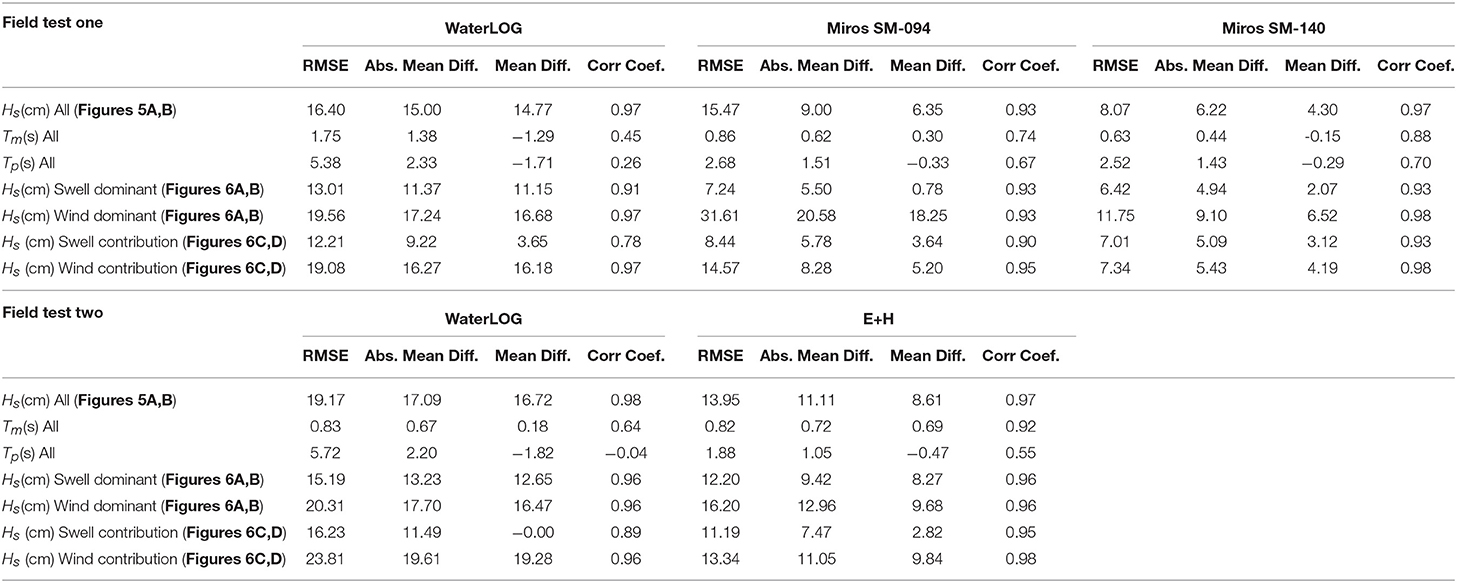
Table 1. Wave parameters.
Based on the spectral analysis, one would expect the significant wave height results from the pulse radar to be considerably worse than those shown in Figure 6A. So again, we wish to partition data to examine individual results during different wave environments. First we separate significant wave height results based on sea state type, during times of swell or wind dominated seas (Figures 7A–C). There is no discernible difference in radar versus AWAC Hm0 comparisons for the two sea types, aside from the what one would expect to see in the Miros SM-094, based on unpartitioned results in Figure 6B. The error increases significantly when the reference AWAC's Hm0 exceeds 1 m.
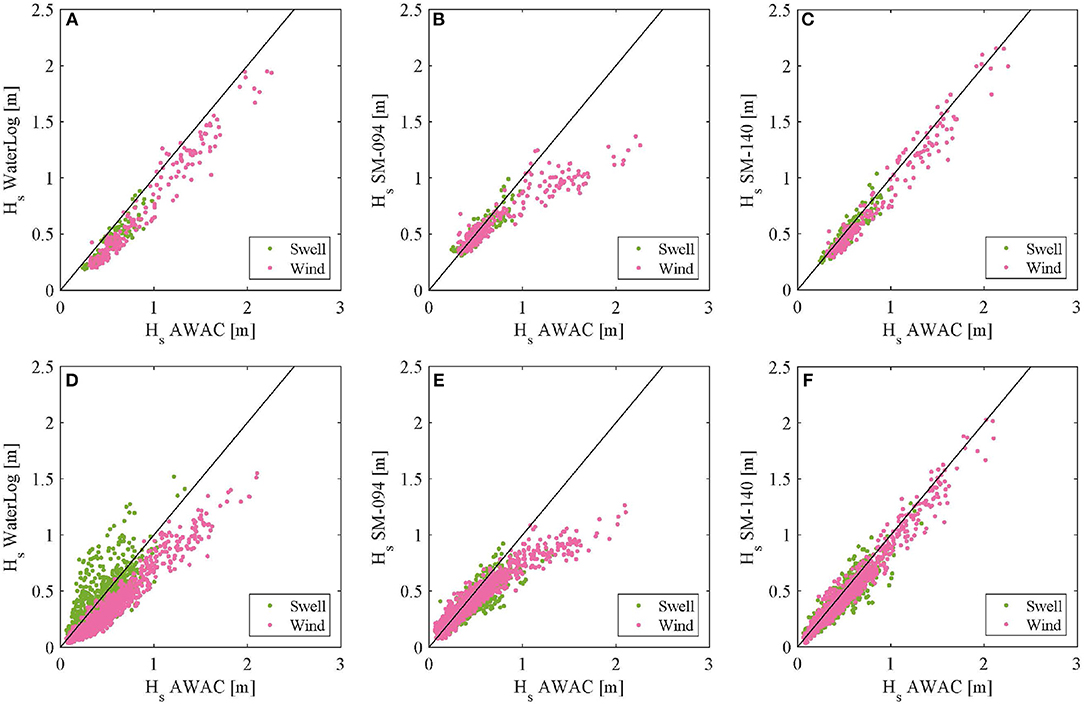
Figure 7. (A–C) Comparison of significant wave height during swell and wind dominant seas for each sensor (left: WaterLOG, middle: Miros SM-094, right: Miros SM-140) to the AWAC; (D–F) Comparison of contribution of swell and wind to significant wave height for each sensor (left: WaterLOG, middle: Miros SM-094, right: Miros SM-140) to the AWAC.
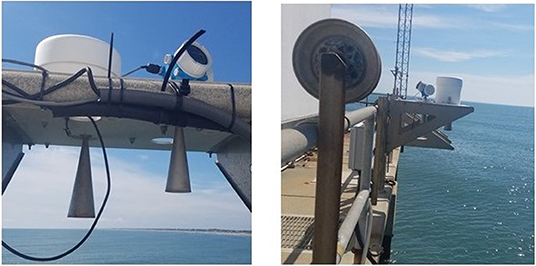
Figure 8. Photographs of radars: WaterLOG (left) E+H (right) in left photo.
Next we partition the spectral energy in the frequency domain for each hourly spectrum and then recompute two integral Hm0 values for each hourly sample, using energy in the swell and the wind frequency bands. The method described above in section 2.3 is used to find the swell and wind separation frequency fs [1], then we find , where the m0 is the area under the energy curve on either side of fs. Results in Figures 7D–F indicate no significant difference between the Miros SM-140 versus the reference AWAC comparisons for Hs and Hw. However, results for the WaterLOG show an average of 3.65 cm underestimation of Hs but can reach up to 57.8 cm over estimation. The WaterLOG underestimated the Hw by an average of 16.18 cm and up to 76.34 cm. This combination of extreme over estimation of swell and underestimation of wind waves explains why Hm0 comparisons between the WaterLOG and AWAC in Figure 7A do not look as bad as one would expect, given the WaterLOG's inability to resolve wind wave energy at frequencies 0.2 Hz and higher. Hm0 calculated for the WaterLOG as includes the integration of bogus low frequency energy. Based on these features of the WaterLOG PSD, resulting Hm0 values should not be considered an accurate representation of true wave conditions, even if results compare reasonably well with the reference AWAC at times.
4. Results, Field Test Two
Results from field test one include 55 days when data from both radar sensors as well as the reference AWAC were all available between 16 April 2018 and 26 July 2018.
The site again experienced a range of wave conditions, with varying combinations of wind-sea and swell. Wind speeds from the co-located NWLON meteorological station averaged about 5.4 m/s and reached up to 18.5 m/s during several prolonged wind events (Figure 9A). The significant wave heights during the test period ranged from 0.2 to 2.9 m. Qualitatively, the wave energy spectral results from the pulse radars and the AWAC compare well throughout the time series (Figures 9B–D).
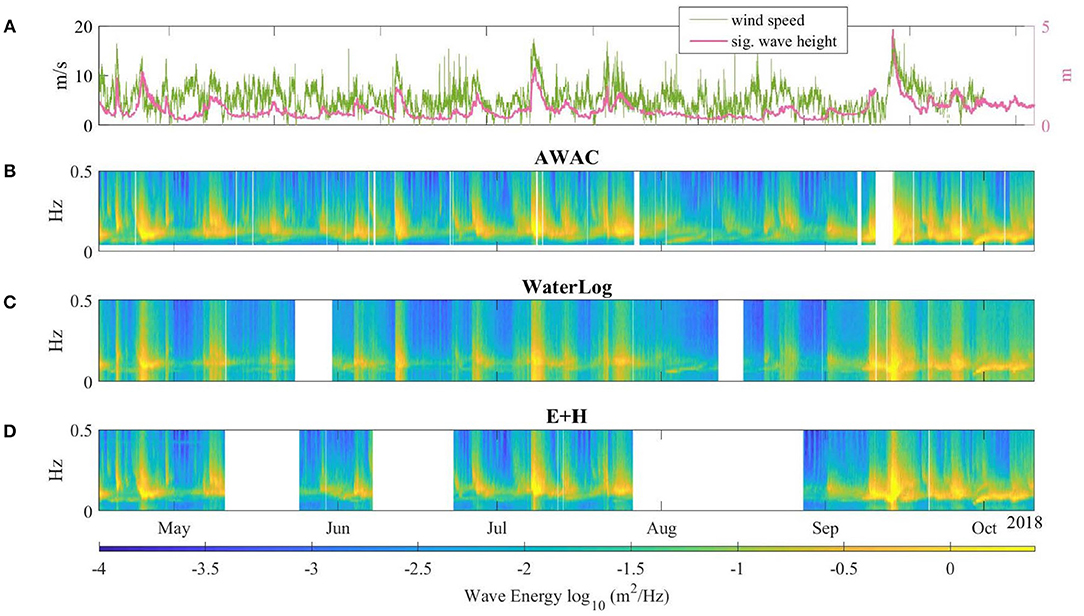
Figure 9. (A) Wind speed in m/s from Duck, NC NWLON station (green), significant wave height from AWAC (pink); (B) Non-directional energy spectra from USACE FRF AWAC; (C) Non-direction energy spectra from WaterLOG H-3611; (D) Non-direction energy spectra from E+H Micropilot.
The average power spectral density for each sensor is shown in Figure 10. The energy peak for both radars and the reference AWAC are all centered near 0.11 Hz. The WaterLOG results are expected and comparable to those of the first field test. The energy peak of the WaterLOG (at 0.0938) is approximately 33% less than that of the AWAC (at 0.1075), and we see low frequency noise between 0 and 0.08 Hz. Conversely, the average power spectral density of the E+H compares better to the AWAC throughout the frequency range, and no lower frequency noise is present. At most it underestimates wave energy by about 10%. Analysis of individual hourly spectra reaffirms that the E+H sensor, without the WaterLOG SDI-12 interface does not have the same shortcomings as its counterpart. The E+H does not have noise in low frequencies and its peaks match well to those of the AWAC (Figure 11A). For instances in which there are multiple energy peaks, the E+H does not underestimate those in higher frequencies (Figure 11B).
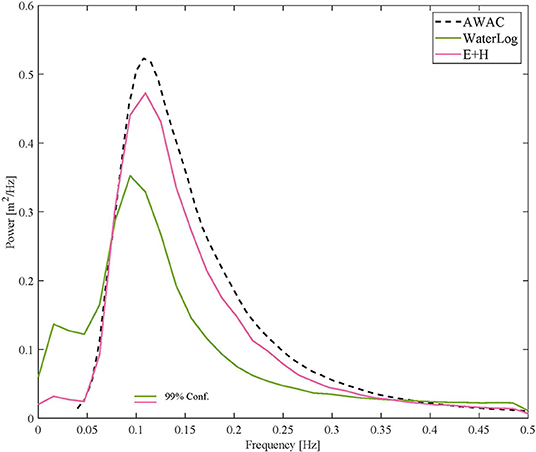
Figure 10. Average power spectral density for each sensor [AWAC (black), WaterLOG (green), Endress+Hauser (pink)] [16 April 2018–10 October 2018].
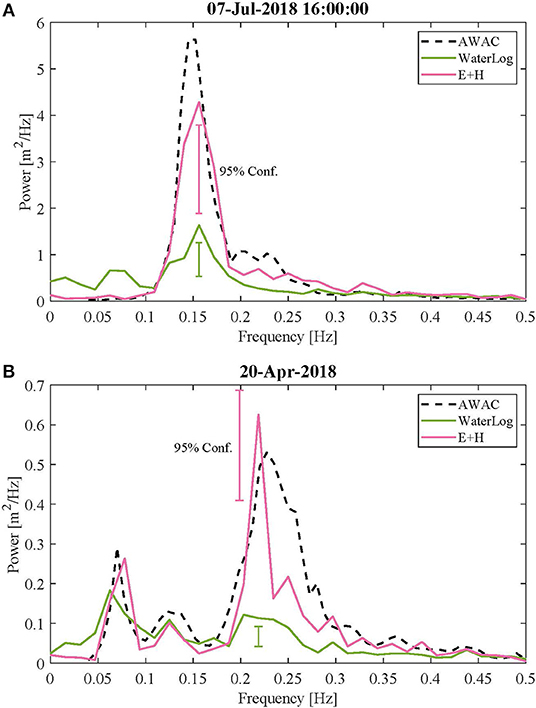
Figure 11. Average spectral density for each sensor [AWAC (black), WaterLOG (green), Endress+Hauser (pink)] during one peak event (A) and two peaks events (B).
In the first field test, the WaterLOG results varied across different frequency bands and over different wind and swell dominated wave conditions. We partitioned results to examine spectral energy comparisons from the different wave environments and found that the WaterLOG underestimated the energy peak to a much greater degree in wind-wave dominated seas. Also, the false low frequency energy only appeared in the wind-wave seas. It performed better in swell dominated conditions. For the second field test, we again perform the wave partition to find swell and wind dominated seas as defined by those in which the energy (based on reference AWAC) on either side of the separation frequency fs comprised more than 85% of the total energy (Figure 12). Again, the WaterLOG performs better in swell dominated environments, where it is more successful in resolving the high-energy peak and has less noise in the lower frequencies. The E+H compares well to the AWAC during both sea states.
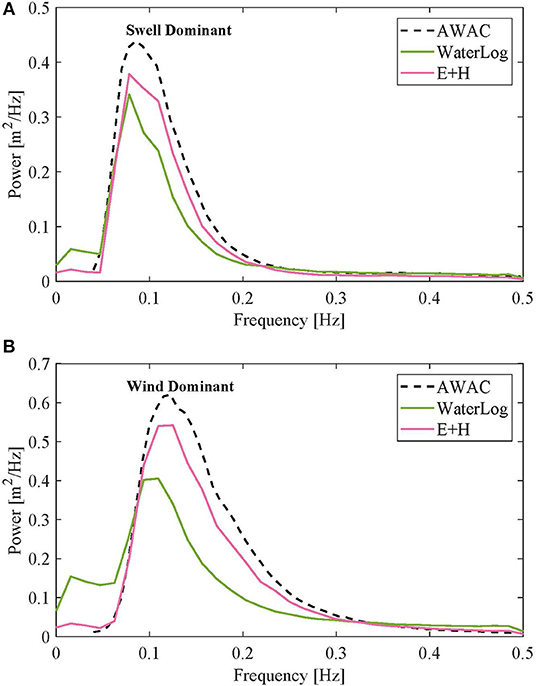
Figure 12. Average spectral density for each sensor [AWAC (black), WaterLOG (green), Endress+Hauser (pink)] during swell dominant seas (A) and wind-wave dominant seas (B).
Next we examine the wave bulk parameters for each sensor (Figure 13, Table 1, bottom). In the past field study, the WaterLOG consistently underestimated significant wave height and had higher peak periods than the AWAC. As expected, results from the second field test show similar performance. The average difference between the significant wave height of the WaterLOG compared to that of the AWAC was 16.72 cm and the average difference of the peak period was −1.82 s. The E+H, on the other hand, is more successful and provides measurements that coincide well with those of the AWAC. Significant wave height measurements are, on average, 8.61 cm less than those of the reference sensor. And the average difference in peak period is −0.47 s. This is an improvement of significant wave height and peak period 49 and 74%, respectively.
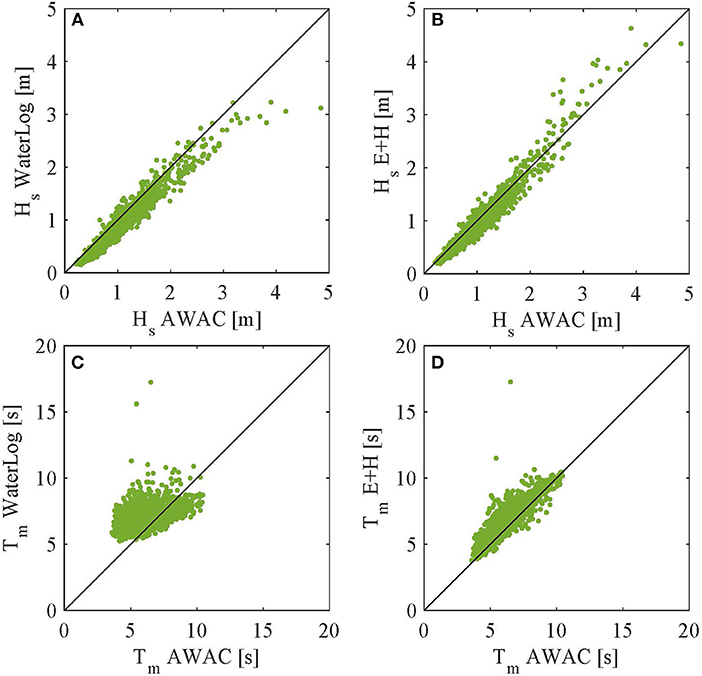
Figure 13. Comparisons of significant wave height (A,B) and mean period (C,D) for each test sensor [AWAC (black), WaterLOG (green), Endress+Hauser (pink)] to the reference AWAC [16 April 2018–10 October 2018].
In the first field test we discovered that the significant wave height computed as an integral of the spectra from the WaterLOG sensor results were misleading due to the noise in low frequencies and low energy peaks. To determine if the same problem occurs in the E+H, we looked at wave parameters from swell and wind-waves. Using the partitioned wave energy from earlier, we looked at significant wave height during swell dominated seas compared to those from wind dominated seas. The results for both sensors show no noticeable difference during either sea state (Figures 14A,B). The E+H just slightly underestimates the significant wave height (by an average of 8.27 cm in swell dominant seas and 9.68 cm in wind dominant seas), and the WaterLOG underestimates it more, in both wind and swell (12.65 and 16.47 cm, respectively).
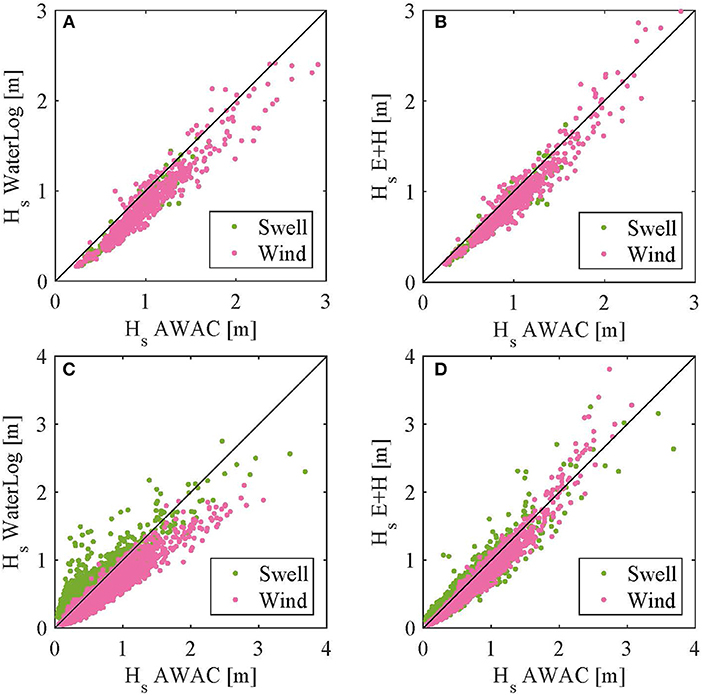
Figure 14. (A,B) Comparison of significant wave height during swell and wind dominant seas for each sensor [AWAC (black), WaterLOG (green), Endress+Hauser (pink)]; (C,D) Comparison of contribution of swell and wind to significant wave height for each sensor [AWAC (black), WaterLOG (green), Endress+Hauser (pink)].
Next we looked at all data samples but partitioned the contribution of the swell and wind into significant wave heights (Hs and Hw). To do this, the method described above in section 2.3 was used to find the swell and wind separation frequency fs (1), then the portion of significant wave height resulting from each wave type was calculated as , where the m0 is the area under the energy curve on either side of fs. Now we see a more distinct difference between the two sensors (Figures 14C,D). Hs measurements from the WaterLOG are on average 1.1 cm (12.23 cm average of absolute value) and as much as 40 cm higher than the AWAC. The wind contribution is on average 21.21 cm (21.93 cm absolute value) lower than the reference. The E+H measurements are more consistent between each type of wave influence. The significant wave height contribution from swell is on average 2.88 cm lower than the AWAC (6.97 cm absolute value). The significant wave height contribution from wind is on average 10.17 cm lower than the AWAC (11.34 cm absolute value).
5. Conclusions
NOAA's recent transition to radar water level sensors across the NWLON network offers a potential opportunity to add wave measurements to existing NOAA coastal observatories. An increase in real-time wave information across the coastal U.S. would provide critical support to safe navigation and resulting data archives would be valuable for coastal engineering and oceanographic research applications.
The first of two field tests conducted by CO-OPS at the Duck, NC NWLON station indicate that the higher cost, higher power Miros SM-140 CWFM radar sensor outperformed the pulse type radar water level sensor that is currently being transitioned across NWLON, the WaterLOG H3611. Although CO-OPS' primary interest in this study is in the wave measurement performance of pulse type radar sensors, results presented here indicate that the Miros SM-140 hourly power spectral density and significant wave heights compared very well with those of the reference AWAC throughout the majority of the test. These results provide additional support to other organizations currently using the Miros CWFM sensor for wave measurements.
Although the WaterLOG H3611 has served NOAA well for several years, providing 6 min average sea level measurements at many different coastal sites, and its technical specifications indicating adequate spatial and temporal resolution to resolve surface gravity waves of interest, the sensor's hourly power spectral density and bulk wave parameters often compared poorly to those of the reference AWAC. During times when the AWAC and Miros power spectral density indicated a significant level of energy in the higher frequency, local wind-sea band, the WaterLOG was unable to resolve that energy and showed corresponding low frequency noise, possibly due to aliasing. Furthermore, derived values of significant wave height, based on the area under the power spectral density curve are misleading due to the integration of aliased low frequency noise.
The second field test conducted at the Duck, NWLON station yielded very promising results for a different 26 GHz pulse radar water level sensor with key specifications and a principal of operation identical to those of the WaterLOG, the Endress + Hauser FMR240. The E+H FMR240 is essentially the same radar sensor as the WaterLOG H3611, but without the SDI12 interface and the associated added layer of proprietary processing software. In the second field test, the H3611 produced results consistent with the first test. Again, this sensor did not adequately resolve energy at higher wind-sea frequencies and PSDs showed elevated levels of low frequency noise. The E+H radar sensor however showed significantly improved wave measurement results, and yielded excellent comparisons to the AWAC. On average, the E+H even compared more closely to the AWAC than the Miros SM140 sensor during the first test. The E+H hourly power spectral density indicates that this sensor adequately resolves both swell and wind-sea energy during all conditions, both in swell and wind dominated seas. No low frequency noise was detected in any of the E+H hourly PSD, indicating this sensor avoided the apparent resolution issues that the WaterLOG experienced during both field tests. Some slightly lower E+H PSD levels compared to the AWAC are likely due to the physical distance between the two sensors, a phenomenon that should be more closely examined in future work. The root mean squared error and average differences of the E+H versus AWAC Hm0 values (13.95 and 8.61 cm, respectively) are both significantly less than the corresponding values for the WaterLOG vs. AWAC comparison (19.17 and 16.72 cm). The improved E+H sensor results may indicate some additional temporal filtering, or reduction in higher temporal resolution resulting from the WaterLOG sensor's added SDI12 interface.
Based on these initial, promising results, CO-OPS will continue to maintain field testing with the E+H FMR240 radar at the Duck, NC NWLON station to capture a longer data set and wider variety of wave conditions. CO-OPS also plan to establish an additional, E+H FMR240 based field test platform at one of CO-OPS Pacific coast NWLON sites, to gather results in an additional type of coastal wave environment. Continued testing will involve close coordination with partner operating sites to ensure a closer collocation of reference and test sensors, resulting in improved wave measurement comparisons. More extensive field test results will be presented in subsequent work along with an analysis on the impact of distance between the reference and test sensors. Additionally, CO-OPS plan to share and discuss results with radar sensor vendors to ensure future sensor designs reduce unnecessary filtering beyond 1 Hz, and that sensors are capable of temporally resolving all physical processes of interest.
Author Contributions
All authors were involved in the instrumentation setup and installation. Data analysis was conducted by LF. The manuscript was written by LF, with input from RH.
Conflict of Interest
The authors declare that the research was conducted in the absence of any commercial or financial relationships that could be construed as a potential conflict of interest.
Acknowledgments
We thank Kent Hathaway and others at the USACE Field Research Facility in Duck, NC for assistance and use of their AWAC data. We also thank the rest of our team, Winston Hensley, Eric Breuer, and Scott Mowery for their support.
References
Bushnell, M., Bosley, K., and Mero, T. (2005). Microwave Air Gap-Bridge Clearance Sensor Test, Evaluation, and Implementation Report. NOAA.
Ewans, K., Feld, G., and Jonathan, P. (2014). On wave radar measurement. Ocean Dyn. 64, 1281–1303. doi: 10.1007/s10236-014-0742-5
Heitsenrether, R, and Davis, E. (2011). Test and Evaluation Report: Limited Acceptance of the Design Analysis Waterlog? h-3611i Microwave Radar Water Level Sensor. NOAA.
Hwang, P. A., Ocampo-Torres, F. J., and GarcíNava, H. (2012). Wind sea and swell separation of 1D wave spectrum by a spectrum integration method. J. Atmos. Ocean. Technol. 29, 116–128. doi: 10.1175/JTECH-D-11-00075.1
MIROS (NDb). Specification Sheet, SM-140 Rangefinder. MIROS. Available online at: https://www.miros-group.com/wp-content/uploads/2019/04/Miros-RangeFinder-Datasheet.pdf.
NOAA and USACE (2009). A National Operational Wave Observation Plan. Report, National Atmospheric and Oceanic Administation and US Army Corps of Engineers.
Park, J., Heitsenrether, R., and Sweet, W. (2014). Water level and wave height estimates at noaa tide stations from acoustic and microwave sensors. J. Atmos. Ocean. Technol. 31, 2294–2308. doi: 10.1175/JTECH-D-14-00021.1
Pérez Gómez, B. (2014). Design and Implementation of an Operational Sea Level Monitoring and Forecasting System for the Spanish Coast (Thesis). Universidad De Cantabria, Santander, Spain.
Pérez, B., E Ávarez Fanjul, E., Pérez, S., de Alfonso, M., and Vela, J. (2014). Use of tide gauge data in operational oceanography and sea level hazard warning systems. J. Oper. Oceanogr. 6, 1–18. doi: 10.1080/1755876X.2013.11020147
Sweet, W. (2016). “New ways to measure waves and their effects at noaa tide gauges,” in American Geophysical Union, Ocean Sciences Meeting 2016, Abstract EC24C-1127 (New Orleans, LA).
Keywords: microwave radar, waves, water level, pulse radar, significant wave height
Citation: Fiorentino LA, Heitsenrether R and Krug W (2019) Wave Measurements From Radar Tide Gauges. Front. Mar. Sci. 6:586. doi: 10.3389/fmars.2019.00586
Received: 15 November 2018; Accepted: 05 September 2019;
Published: 01 October 2019.
Edited by:
Leonard Pace, Schmidt Ocean Institute, United StatesReviewed by:
Joseph Park, United States Department of the Interior, United StatesPhilip Thompson, University of Hawaii, United States
Copyright © 2019 Fiorentino, Heitsenrether and Krug. This is an open-access article distributed under the terms of the Creative Commons Attribution License (CC BY). The use, distribution or reproduction in other forums is permitted, provided the original author(s) and the copyright owner(s) are credited and that the original publication in this journal is cited, in accordance with accepted academic practice. No use, distribution or reproduction is permitted which does not comply with these terms.
*Correspondence: Laura A. Fiorentino, bGF1cmEuZmlvcmVudGlub0Bub2FhLmdvdg==