 Maria Vernet
 Ingrid H. Ellingsen
 Lena Seuthe
 Dag Slagstad
 Mattias R. Cape
 Patricia A. Matrai
95% of researchers rate our articles as excellent or good
Learn more about the work of our research integrity team to safeguard the quality of each article we publish.
Find out more
ORIGINAL RESEARCH article
Front. Mar. Sci. , 27 September 2019
Sec. Marine Ecosystem Ecology
Volume 6 - 2019 | https://doi.org/10.3389/fmars.2019.00583
This article is part of the Research Topic Carbon Bridge to the Arctic View all 20 articles
Northwards flowing Atlantic waters transport heat, nutrients, and organic carbon in the form of zooplankton into the eastern Greenland Sea and Fram Strait. Less is known of the contribution of phytoplankton advection in this current, the Atlantic Water Inflow (AWI) spanning from the North Atlantic to the Arctic Ocean. The in situ and advected primary production was estimated using the physical-biological coupled SINMOD model over a region bounded by northern Norway coast (along the Norwegian Atlantic Current, NAC), the West Spitsbergen Current (WSC) and the entrance to the Arctic Ocean in northern Fram Strait. The simulation results show that changes in phytoplankton biomass at any one location along the AWI are supported primarily by advection. This advection is 5–50 times higher than the biomass photosynthesized in situ, seasonally variable, with minimum contribution in June, at the time of maximum in situ primary production. Advection in the NAC transports phytoplankton biomass from areas of higher production in the south, contributing to the maintenance of phytoplankton productivity further north. In situ productivity further decreases north of Svalbard Archipelago, at the entrance to the Arctic Ocean. Excess in situ annual production in northern WSC is exported to the Arctic Ocean during the growth season (April to September). The balance between in situ and advected primary production defines three main regions along the AWI, presumably modulated by the spatial and temporal variability of copepod grazing. As the sea ice reduces its annual extent and warmer waters enter the Arctic Ocean, ecological characteristics of the ice-free WSC with its AWI signature could extend north and east of Svalbard and into the central Arctic. Advection thus constitutes an important link connecting marine ecosystems of the Arctic and Atlantic Ocean, mainly at the gateways.
The northward movement of Atlantic Water from the North Atlantic into the Arctic Ocean constitutes a major pathway of ocean circulation, contributing to transports of heat and salt into the Arctic with implications for the physical structure of the Arctic Ocean (Rudels et al., 2004, 2005, 2015). Atlantic Water advected along this pathway undergoes cooling and freshening as it is transported northwards along the western coast of Norway, across the Barents Sea Opening (BO), and west of the Svalbard Archipelago before finally entering the Arctic Basin north of Svalbard (NSv) (Figure 1a; Walczowski et al., 2012). In the north, the West Spitsbergen Current (WSC) is a rather complex circulation feature. North of 79°N, the current contains two separate warm cores that follow different isobaths. The western core moves north west of the Yermak Plateau and north of 80°N; part of this current detaches from the Yermak Plateau and enters the Fram Strait recirculation (Aagaard et al., 1987; Marnela et al., 2013). The inside branch follows the shelf break into the Arctic Ocean; past northwestern Spitsbergen, this water mass loses heat. Together with some freshening, this process converts the Atlantic water into Arctic Intermediate water within ∼600 km of the Fram Strait.
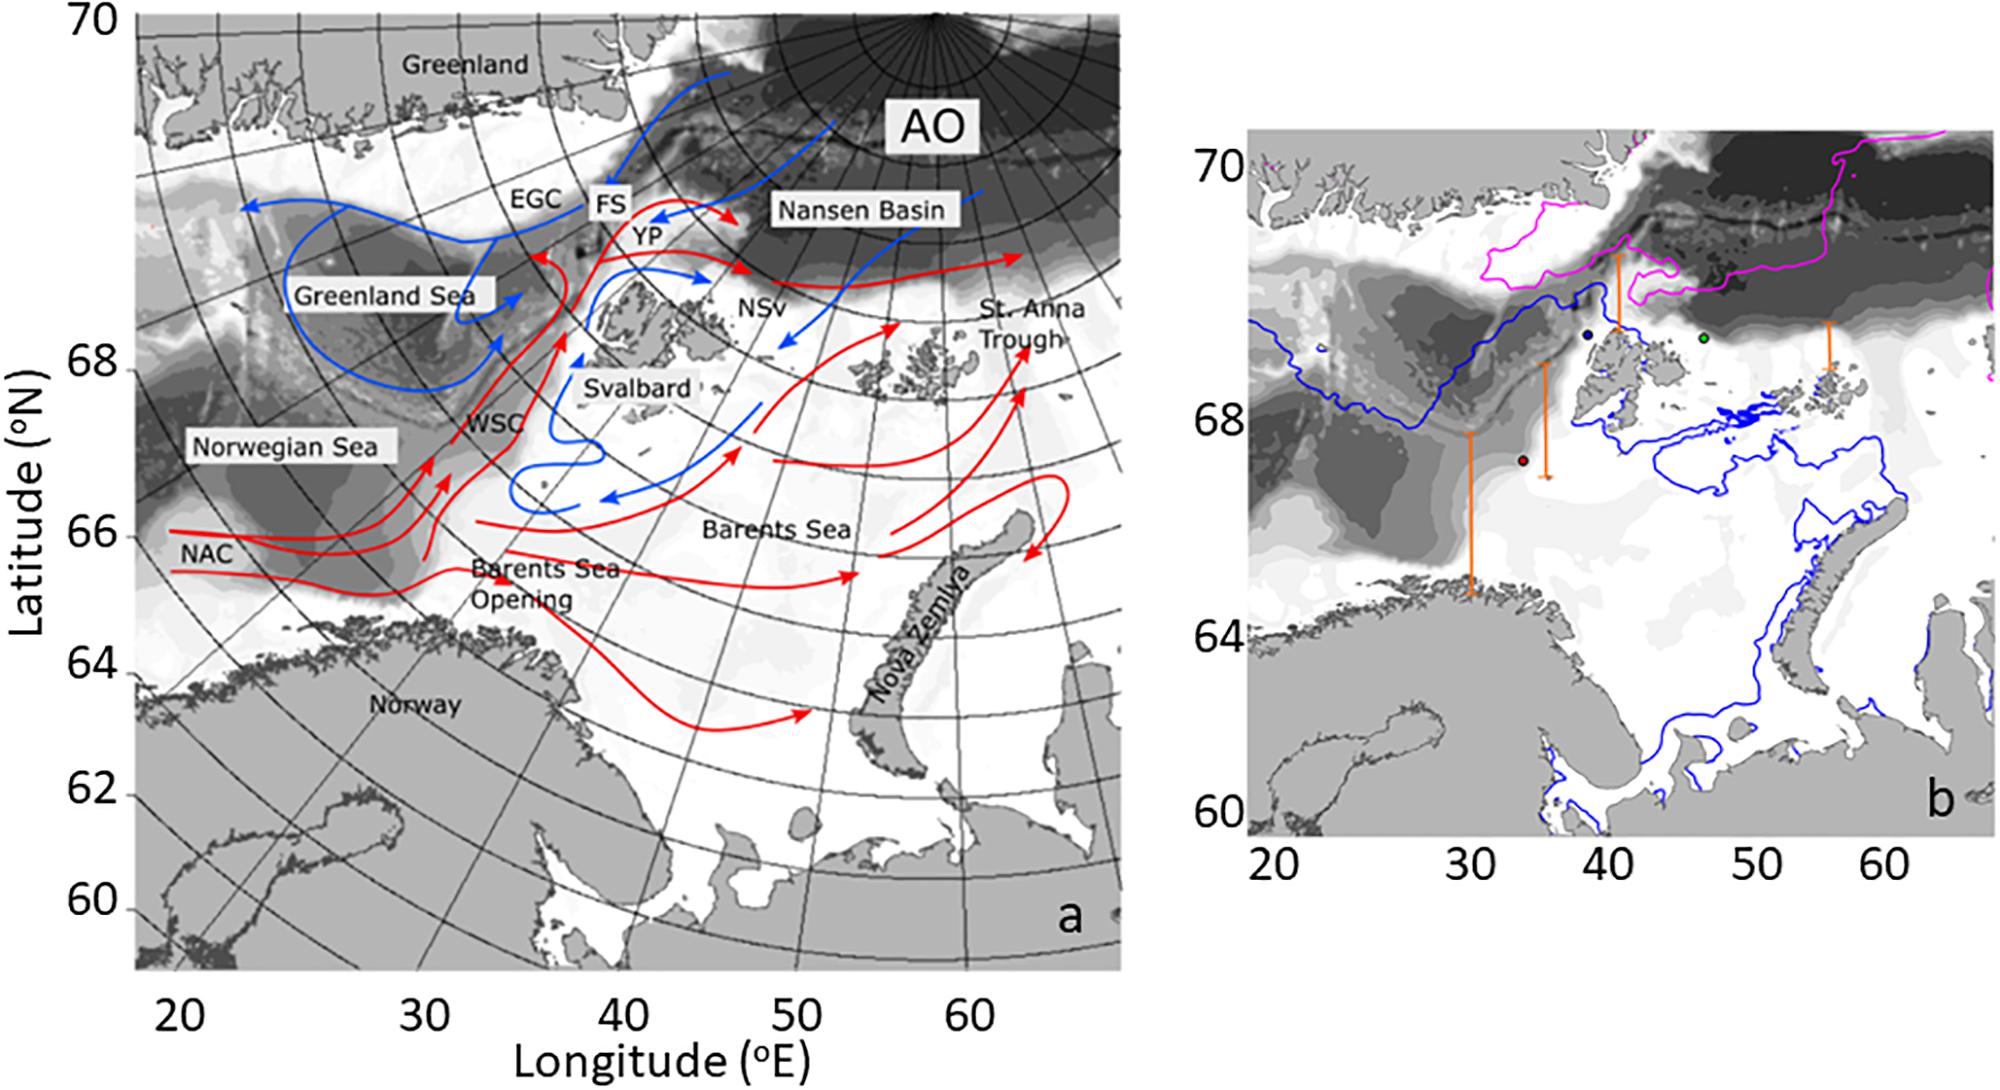
Figure 1. (a) Main oceanographic features of the study area, including currents. The Atlantic water inflow (AWI) from the Norwegian Atlantic current (NAC) to the Barents sea opening (BO), the West Spitsbergen current (WSC), the area North of Svalbard (NSv), the Yermak Plateau (YP), Fram Strait (FS), the East Greenland current (EGC), and the Arctic Ocean (AO). Warm currents are depicted in red and cold currents in blue. (b) Map of the study area depicting sea ice extent in May (blue line) and September (pink line) of 2012. Four transects along the AWI (orange) depict the locations where phytoplankton carbon flux was estimated (see Table 1) and the dots correspond to locations where NCP (see Figure 8) was calculated.
The WSC flow has seasonal variability, with maximum in winter and minimum in summer. At 78° 50′ N, before entering the Arctic, the WSC delivers 6.6 ±0.4 Sv of water (average 1997 – 2010), 45% of which is >2°C in temperature. Overall, the mean temperature of the WSC is 3.1 ±0.1°C (Beszczynska-Möller et al., 2012) and characterized by salinity of ∼35 (Rudels et al., 1994). Two-thirds of the heat transported north of 78°N flowing through the Fram Strait is lost by the westward transport and sea surface cooling; the other third is injected into the Arctic Ocean (Kawasaki and Hasumi, 2016). In addition to an interannual variability with 5 – 6-year cycles, the Atlantic Water has a 20-year warming trend at 150 – 900 m depth, with exceptionally high temperatures in the decade of the 2000’s (Polyakov et al., 2012).
With the Atlantic Water Inflow (AWI) from Norway’s coast into the Arctic Ocean, phytoplankton are transported northward through 14 degrees of latitude where shorter days and lower sun angle progressively delay the onset of primary productivity (Longhurst, 2010). Phytoplankton biomass values in these northern latitudes can vary by a factor >100× between winter [0.1 mg chlorophyll a (chla) m–3] and summer (>10 mg chla m–3) (Nöthig et al., 2015), with maximum biomass accumulation during boreal spring and summer, the period of minimum water transport. The average primary production in this European sector of the Arctic Ocean from 1995 to 2007 was estimated at >100 g C m–2 yr–1, with the seasonal Sea Ice Zone contributing 30–100 g C m–2 yr–1 and the Perennial Ice Zone <30 g C m–2 yr–1 (Wassmann et al., 2010).
The Central Arctic Ocean pelagic ecosystem is net heterotrophic, and relies on a net input of organic matter from southerly latitudes to survive (Olli et al., 2007). In this way, advection constitutes an important link of the marine ecosystems of the Arctic Ocean with the Atlantic and Pacific Oceans, from nutrients to plankton to marine mammals, in particular at the gateways (Wassmann et al., 2015; Hunt et al., 2016). Popova et al. (2013) estimated that about 20% of the Arctic Ocean primary production is supported by advective processes with simulations linking nutrient-rich Pacific and Atlantic waters to the subsurface chlorophyll maximum in the central Arctic Ocean on a timescale of 15–20 years and with deep advective enrichment of nutrients occurring on a timescale of 5–6 years. Ocean connectivity has been examined further with respect to zooplankton communities. The supply of zooplankton by advection from the Atlantic Ocean is 2–3 times larger than from the Pacific Ocean; most abundant is the boreal copepod Calanus finmarchicus (Carstensen et al., 2012). Local consumption reduces the influence that advected zooplankton biomass has in the Amerasian Arctic sector while having a basin-scale influence in the European sector of the Kara, Laptev and East Siberian Seas (Grebmeier et al., 2015). C. finmarchicus originates from the North Atlantic, with adult populations reproducing successfully in the Norwegian Sea, where they develop and are transported north in the following spring and summer (Basedow et al., 2018). By the end of the summer and during winter, C. finmarchicus goes into diapause, migrating below the Norwegian Current-WSC to 600–1000 m depth (Kosobokova and Hopcroft, 2010). This zooplankter cannot reproduce when introduced to Arctic waters and disappears after a few months, where it is replaced by Calanus glacialis, a polar shelf- associated overwintering species, that is transported further into the Arctic shelf along the AWI boundary current (Kosobokova, 2012; Wassmann et al., 2015). Less is known about the influence of advection of phytoplankton on carbon cycling and/or planktonic ecology.
While physical processes associated with AWI into the Arctic have been the subject of extensive study (Pérez-Hernández et al., 2017), the implications of water mass advection and transformation for primary producers at the bottom of the food web remain poorly examined. In particular, potential changes in the biomass and productivity of phytoplankton communities as they are advected along the AWI, from northern Norway into the Arctic Ocean NSv, and the contributions of these changes to local carbon cycling along the pathway have not been investigated. The benefits that the current provides to the phytoplankton productivity and losses in this region remain unknown. This study attempts to answer the following questions: What is the contribution of advection to phytoplankton primary production along the AWI? How much carbon is available from locally produced and advected phytoplankton and how do their relative contributions vary spatially during the growth season? Using a well-tested model for Arctic plankton (Babin et al., 2015; Lee et al., 2016), we have addressed these questions from a community and ecosystem perspective (Wassmann et al., 2006, 2010, 2015). Furthermore, we provide a context of the potential changes in carbon cycling in this transition region at a time of warming northward water flow.
The phytoplankton dynamics along the AWI to the Arctic Ocean was studied with the physically-biologically coupled, nested 3D SINMOD model configurations with a 4 km horizontal grid size and with 61 vertical layers. The vertical level thickness increases from 5–10 m near the surface to 500 m below 1000 m. SINMOD is a fully coupled hydrodynamic-ice-chemical-biological model system. A comprehensive description of the physical and ecosystem and food web model is found in Slagstad and McClimans (2005) and Wassmann et al. (2006). A short description is given here. The hydrodynamic component of the model system, which is responsible for calculating the basic physical properties of the ocean like velocity, water temperature and pressure, is based on the so-called primitive Navier–Stokes equations and established on a z-grid (Slagstad and McClimans, 2005; Slagstad et al., 2015).
The model is forced by atmospheric data: wind, heat exchange, tides and freshwater run-off from land [for more details see Slagstad and McClimans (2005)]. The ice model is similar to that of Hibler (1979) and has two state variables, ice thickness and ice concentration, and allows ice interaction to depend on these. The ice momentum equation is solved together with an equation for the ice internal stress, using the elastic-viscous-plastic (EVP) dynamical model of Hunke and Dukowicz (1997). The model simulates changes in ice mass and fraction of open water due to advection, deformation and thermodynamics effects. Initial values of temperature and salinity were taken from World Ocean Circulation Experiment (WOCE) Global Data Resource Version 3.01 using a spin-up phase of 26 years prior to the start of the simulation in this work. A comprehensive description of the WOCE data system can be found in Lindstrom and Legier (2001).
The model is forced by atmospheric output from the European Center for Medium-Range Weather Forecasts (ECMWF) reanalysis data from 2012. The model is also forced with freshwater fluxes (river discharges and diffuse run-off from land). Freshwater run-off along the Norwegian coast and in the Barents Sea is based on data from simulations by the Norwegian Water Resources and Energy Directorate2. The simulations were performed using a version of the HBV-model in 1 km horizontal resolution (Beldring et al., 2003; Dankers and Middelkoop, 2008). For Arctic rivers, data are obtained from R-ArcticNet (Vörösmarty et al., 1996, 1998) available through http://www.r-arcticnet.sr.unh.edu/v4.0/main.html. Boundary conditions for biological, chemical and physical states are produced by a large-scale model with 20 km horizontal resolution. This includes tidal forcing. The large-scale model runs with a total of eight tidal components based on data from the TPXO 7.2 model of global ocean tides3.
The ecosystem module is formulated in an Eulerian framework and includes state variables for nutrients (nitrate - NO3, ammonium - NH4, and silicate - SiO4), the microbial loop, heterotrophic nanoflagellates, diatoms and autotrophic flagellates, ciliates and two key mesozooplankters: the Atlantic C. finmarchicus and the arctic C. glacialis. SINMOD calculates Gross Primary Production (GPP), new production (NP), the f-ratio (NP/GPP) and secondary production of the two mesozooplankton species. For details of the biological model, see Wassmann et al. (2006). The model contains additional compartments for sinking detritus (fast and slow), dissolved organic carbon and the sediment.
The SINMOD model has been validated with field data (Wassmann et al., 2006; Ellingsen et al., 2008; Slagstad et al., 2011) where parameterization of the different variables can be found. The SINMOD model was found to be one of the best models to estimate primary production in the Arctic Ocean during an inter-comparison among ocean biogeochemical coupled models and Earth system models (Lee et al., 2016), as well as with satellite-derived primary production algorithms (Babin et al., 2015).
In each grid cell, phytoplankton are modeled in the 50 m surface layer of the water as:
where B is Biomass, t is time in days, GPP is Gross Primary Production, or total carbon uptake by phytoplankton through photosynthetic process; Respiration is phytoplankton biomass lost as CO2; Excretion is the production of Dissolved Organic Matter (DOC) released by phytoplankton; Grazing is phytoplankton consumption by zooplankton, both micro- and meso-zooplankton; and Sinking is diatoms lost from the 50-m surface layer as vertical sedimentation by cell flocculation and cell death; Export loss is accounted for in Sinking and Grazing and not included in calculations, all in units of carbon, g C m–2 d–1. The model output is in units of Nitrogen, converted to carbon using a constant C:N ratio of 7.6, average data from the Barents Sea (Reigstad et al., 2002). Sinking is only related to phytoplankton cells, a slow export of organic carbon from the surface layer. On the other hand, Export of organic matter (Figure 2) comprises mostly the sedimentation of zooplankton fecal pellets and molts, considered to be a fast export. The model does include a module on the microbial loop where bacteria consume DOC from phytoplankton excretion and are predated upon by nanoflagellates. The model does not consider viruses as a separate compartment or cell lysis as a separate process (Wassmann et al., 2006); all phytoplankton cell death not related to grazing is included as Sinking out of the 50-m surface layer, which constitutes a portion of population mortality. DOC production from phytoplankton, expressed as Excretion, includes DOC from viral lysis, not expected to be high in polar waters (Agustí and Duarte, 2013; Mojica et al., 2016).
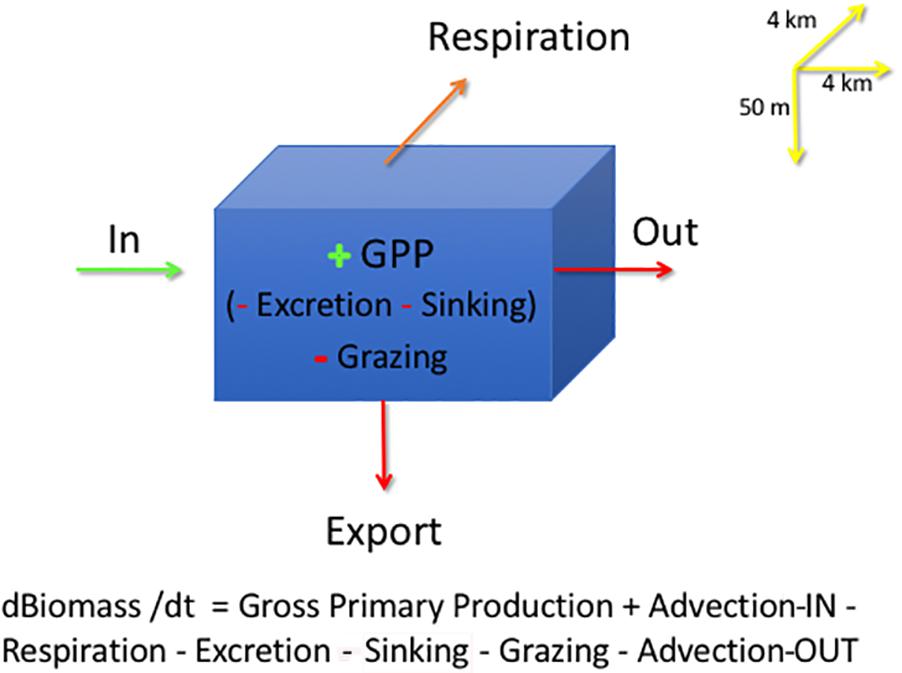
Figure 2. SINMOD model grid cell describing the main phytoplankton processes: Advection is depicted as import (Biomass-IN) and output (Biomass-OUT), Gross Primary Production (GPP), Grazing, Excretion, Respiration and Sinking. Input terms are in green, as g C m–2 d–1 and loss terms in red, with the same units. All model output is expressed in units of phytoplankton carbon. The model grid is 4 km × 4 km in x-y and by 50 m in depth. Upstream advection is depicted as Advection-IN and downstream advection by Advection-OUT.
Model results are for the year 2012, a year of minimum sea ice extent in the Arctic Ocean (Figure 1b; Stroeve and Notz, 2018), maximizing ice-free primary production in the West and NSv Archipelago. These rates are calculated for a 6-month period during the growth season, from April to September, and are considered representative of yearly estimates (Wassmann et al., 2010). Several experiments were performed to determine the contribution of (a) phytoplankton biomass advection to local primary production, (b) phytoplankton growth parameters, (c) the relative importance of phytoplankton biomass advection on in situ phytoplankton production at each grid cell, and (d) the balance between sources and sinks of biomass as a function of advection. Model experiments are explained in each corresponding section of the “Results.” The SINMOD model was run and the variables of interest saved as output and later mapped within the domain of interest. Results are shown as maps in units of phytoplankton carbon and as tables with discrete values at fixed points along the AWI. The results are presented and discussed only for the AWI, from the NAC to the BO, the WSC and the area NSv (Figure 1a). The remaining data are shown to give context to the phytoplankton dynamics observed in the AWI.
Gross Primary Production relates to the total amount of organic carbon newly incorporated by photosynthesis, thus an index of production. As this process is based on the existing phytoplankton biomass, it depends on the physiological response of high-latitude microalgae to irradiance, temperature and inorganic nutrients within the surface mixed layer. Mapping the average GPP during the boreal growth season, from April to September, as calculated by the SINMOD model (Eq. 1), we observe a range spanning from 40 to 160 g C m–2 6mo–1 (Figure 3a). Along the AWI, a gradient in GPP is observed, where close to the Norwegian shelf gross production is ∼160 g C m–2 6mo–1, maintaining high rates of ∼140 g C m–2 6mo–1 toward the BO. West of Svalbard, on the WSC, GPP is on average ∼120 g C m–2 6mo–1, decreasing to ∼60 g C m–2 6mo–1 in the NSv. These GPP annual rates are within estimates extrapolated from field samples with low March production and high June production (Vernet et al., 1998). Based on the decreasing rates of GPP toward the north, three regions can be defined along the AWI: NAC including the BO, the WSC and the NSv. However, it is notable that the WSC shows higher seasonal production than surrounding waters in the Greenland Sea and also NSv along the shelf break in the Arctic Ocean, in comparison to the Nansen Basin (Figure 1a). Superimposed on the spatial variability in GPP, there is a strong seasonality (Supplementary Figure S1 and Supplementary Table S1). GPP starts earlier in the Norwegian shelf, reaches a maximum everywhere in June, decreasing in July, with exception of the regions influenced by the AWI where GPP remains high. By September, GPP is <15 g C m–2 mo–1. Thus, the contribution of the AWI to regional GPP is most pronounced early and late in the growth season.
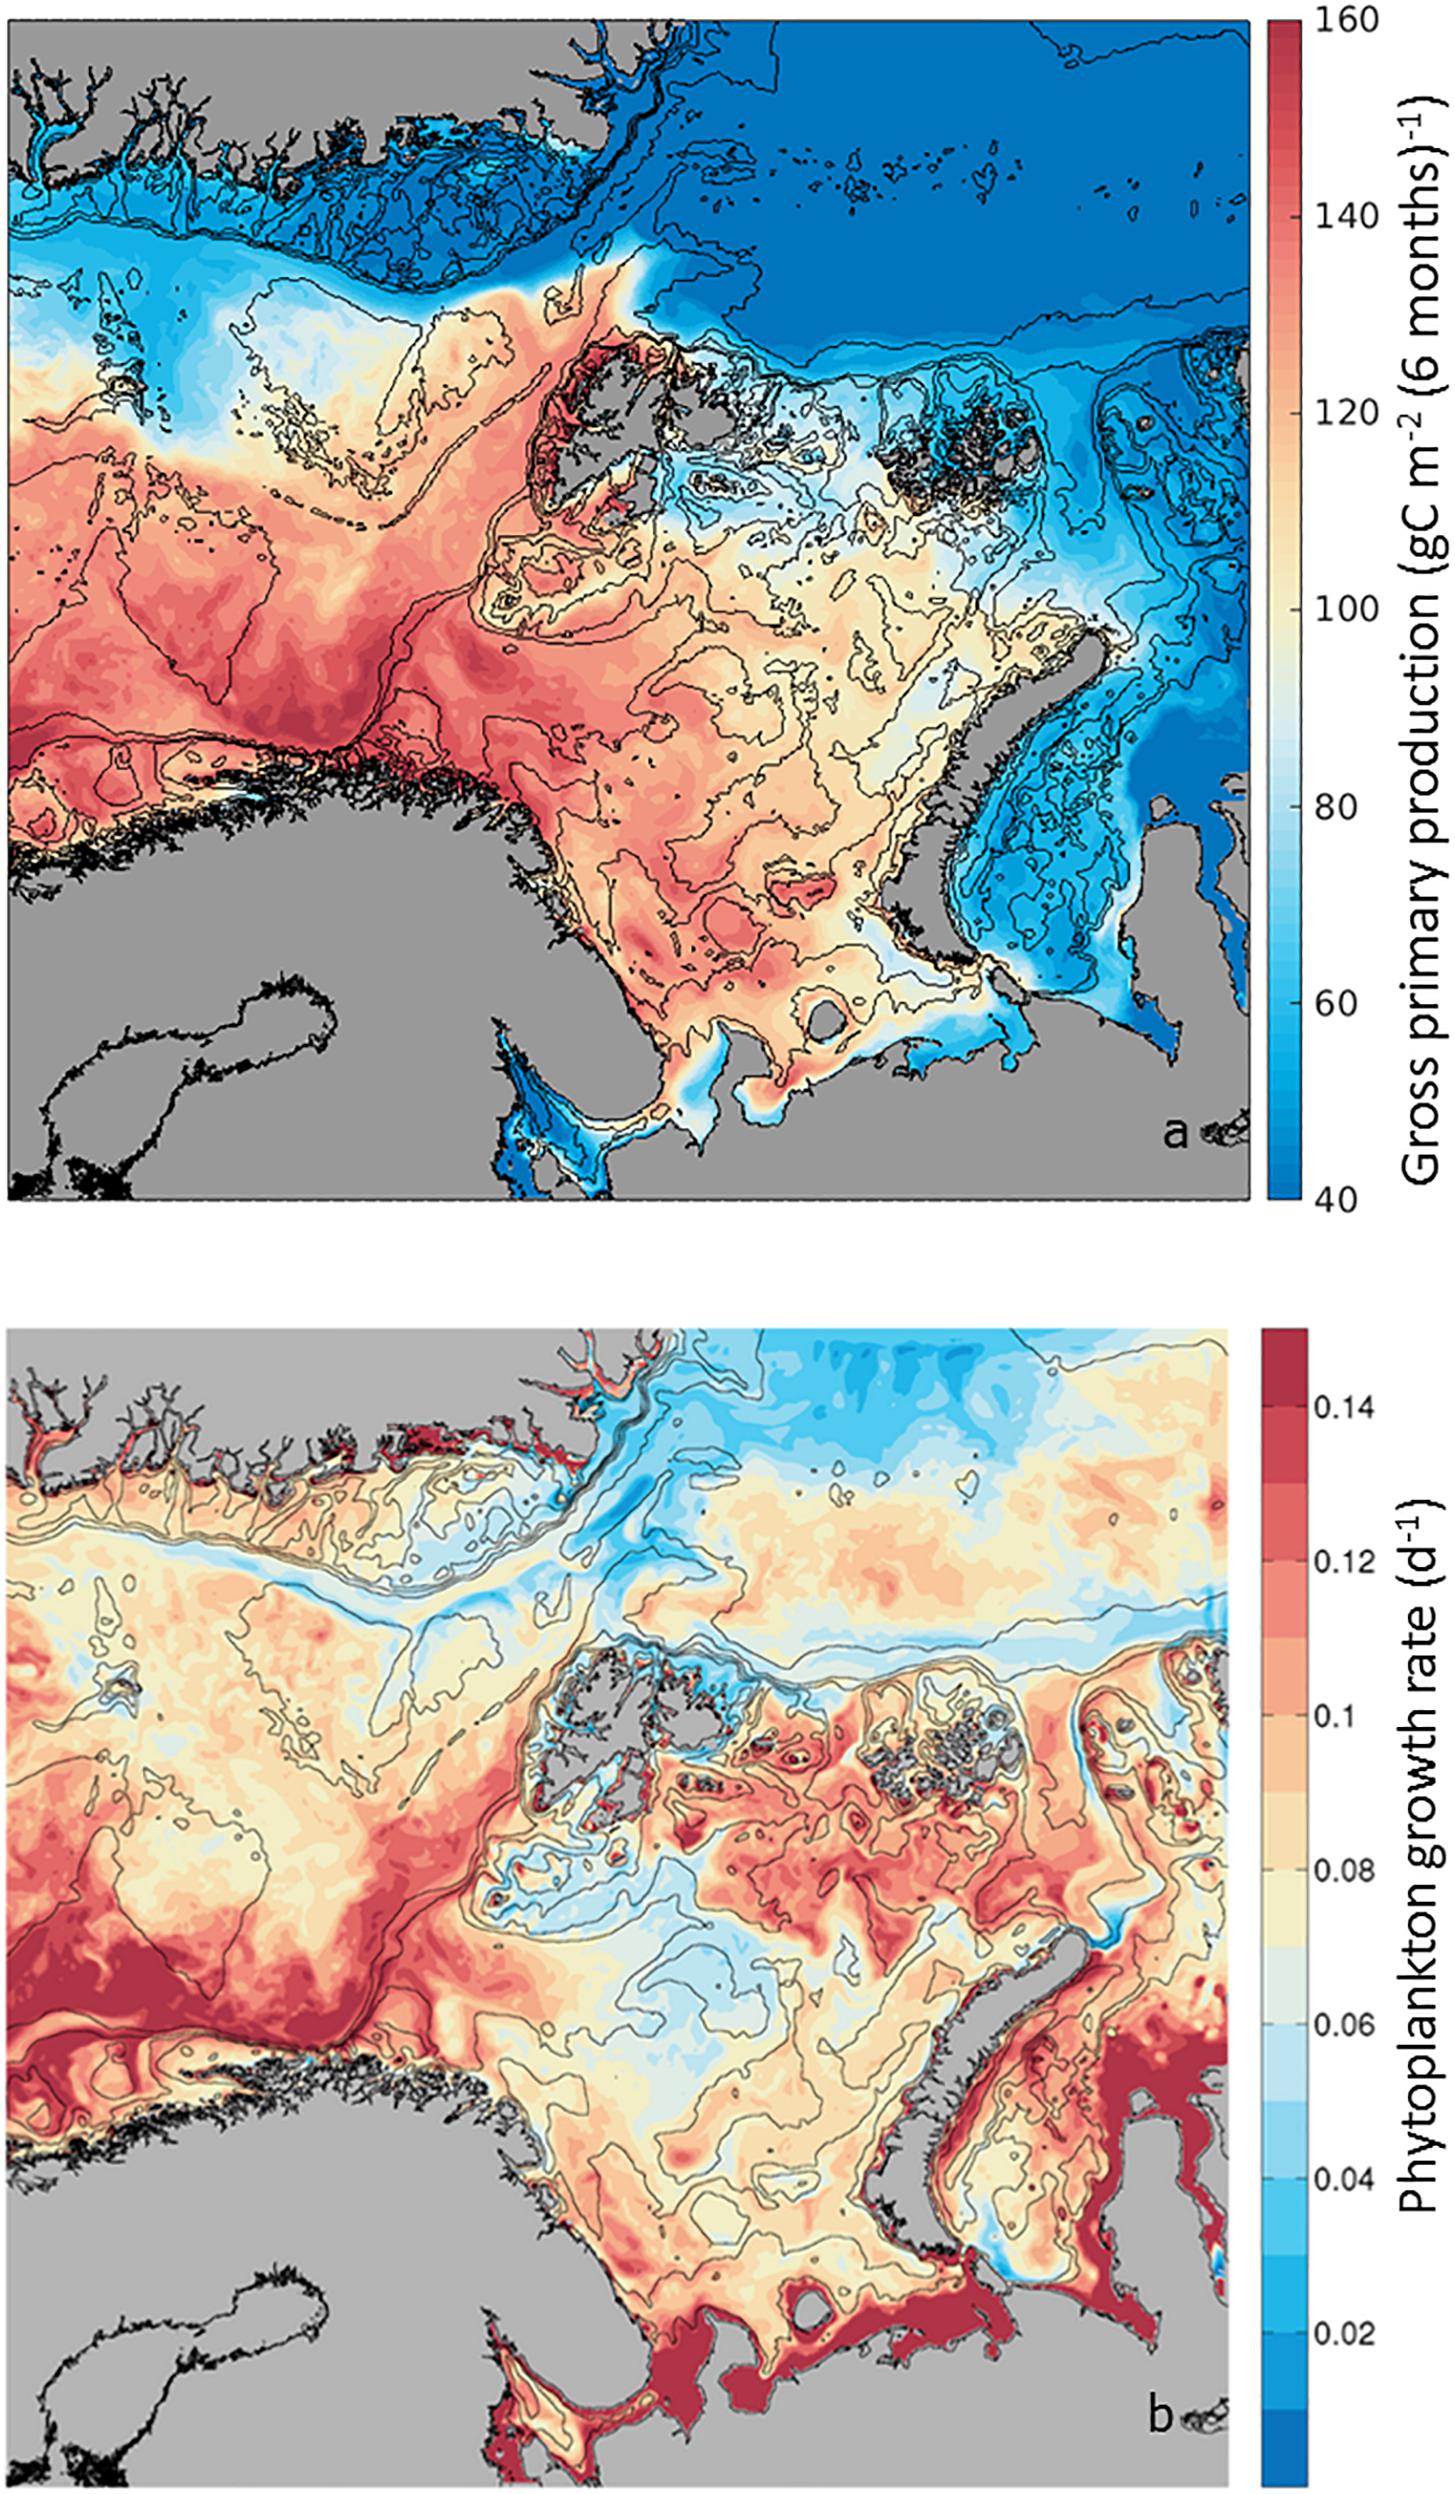
Figure 3. (a) Seasonal phytoplankton Gross Primary Production (GPP) estimated as g C m–2 6mo−1 from April to September 2012. Low production (in blue) and high production (in red), from 20 to 200 g C m–2 6mo−1) for the study area. (b) Phytoplankton growth rate (d–1) calculated in the SINMOD model as Net Primary Production/Biomass. Range of values from 0.02 d–1 to 0.14 d–1. Note that in the literature (GPP-Respiration) is also considered phytoplankton primary production, also known as Net PP or NPP (e.g., Matrai et al., 2011).
In addition to GPP, phytoplankton Growth Rate (μ) gives an indication of the speed of phytoplankton population renewal within the upper 50-m layer of the water column. The model simulations provide a unique opportunity to estimate this variable along the AWI, as carbon-specific net primary production within each model grid cell, or (GPP – Respiration)/Biomass (Figure 2) in units of d–1. This is a difficult parameter to measure in the field, as phytoplankton biomass in units of carbon is often contaminated by bacteria and other heterotrophs. The modeled rates are within the range expected for seasonal ly averaged field samples in high-latitude environments, e.g., 0.22 d–1 to 0.40 d–1 (Garibotti et al., 2003). For the 6-month productive period (Figure 3b and Supplementary Table S2), between April and September, average growth rates varied from 0.02 d–1 to 0.15 d–1, with highest rates found in the NAC and remaining high along the WSC. Growth rates decreased in the NSv to intermediate values (∼0.1 d–1), although these remained higher than surrounding waters of the Nansen Basin in the Arctic Ocean and in the central Barents Sea (∼0.02 d–1).
Phytoplankton Biomass at any given location along the AWI can increase by transport from another location and/or from in situ growth processes (Supplementary Table S3). In the field, assessments of in situ primary production concurrent to advection estimates of primary production are challenging. Here, we use the model’s output to understand the possible effect of advection to phytoplankton processes by estimating phytoplankton Residence Time. For each model cell, we calculate the ratio of in situ biomass to phytoplankton advected into the grid cell, in units of days [d] (Biomass/Advection-IN, Figure 2). Residence Time represents the time a particle spends within the model grid cell of 4 km × 4 km × 50 m, from the time it enters (Advection-IN) to the time it leaves (Advection-OUT), in relation to the concentration of particles within a single model grid cell (Biomass). This variable is sensitive to the model grid cell size, thus, this experiment provides only relative comparisons among locations.
When the spatial distribution of phytoplankton Residence Time in each location is mapped, we observe consistently lower residence time along currents, such as the northward AWI where the average time of phytoplankton Residence Time at each location is shorter than elsewhere by a factor of ∼5 or more (Figure 4). Within the flow, phytoplankton is carried north relatively fast and the Residence Time is limited to 0.05 days to 0.3 days, while phytoplankton biomass lasts 1 day or more in the open ocean. These numbers compare favorably with transport from a WSC current speed of 0.1 to 0.3 m s–1 (Kolås, 2017). Comparing this Residence Time map to the distribution of GPP in Figure 3a, it suggests that the low Residence Time in the currents is mainly due to high advection of phytoplankton biomass as in situ GPP changes only by a factor of 2 or 3.
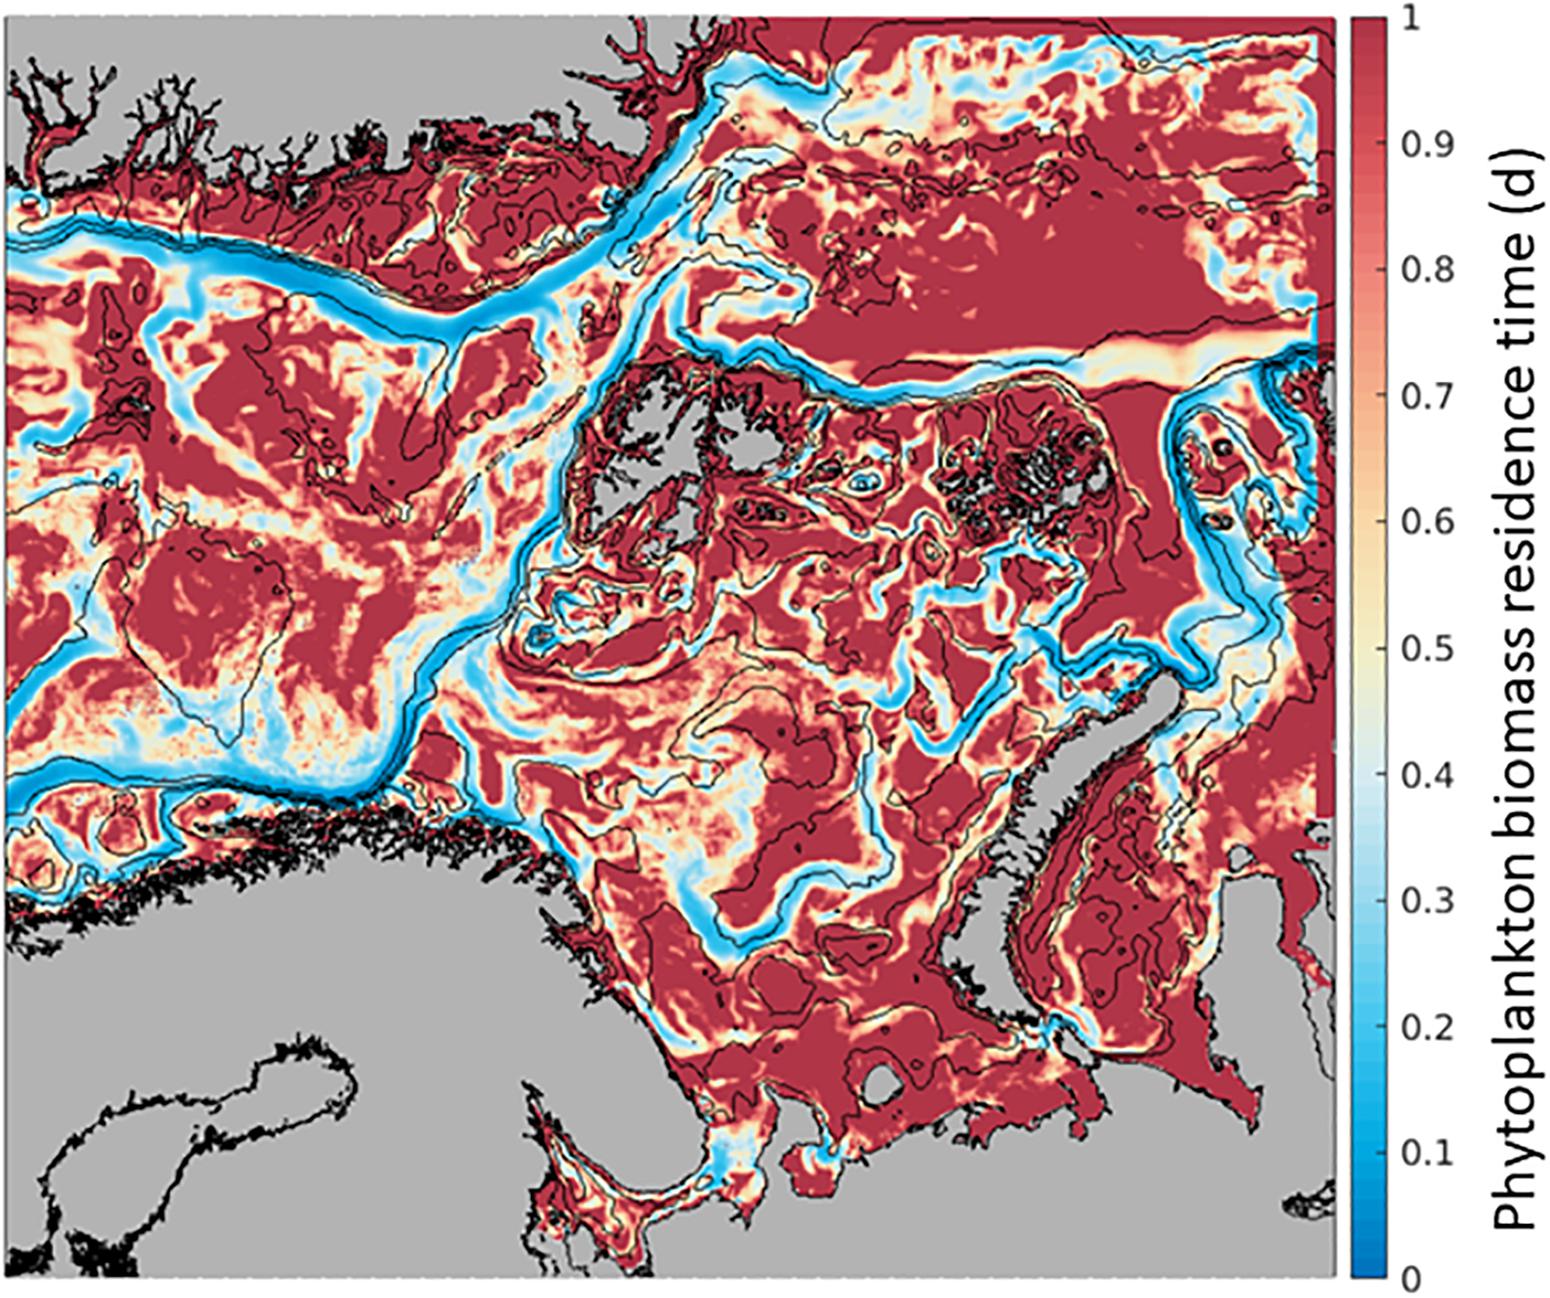
Figure 4. Phytoplankton residence time (mean over 6 months, April-September. 2012) within the 4 km × 4 km × 50 m SINMOD model grid cell where lower values (blue) indicate shorter time of phytoplankton carbon biomass within the cell and higher values (red), a longer time of the phytoplankton carbon biomass within the cell. In units of days, calculated as Biomass within the grid cell/Biomass advected In.
An alternative to estimating the effect of advection on phytoplankton processes along the AWI is to turn off GPP at a certain location and observe the downstream distribution of phytoplankton biomass (B). In this way, we can estimate the Persistence of phytoplankton, defined as the time (in days) that a parcel of phytoplankton with B > 0 is transported downstream from the location where GPP = 0. In this experiment, advection and loss processes remain >0. The loss of phytoplankton biomass is then due to the consumption by grazing, respiration, DOC excretion and cell sinking, such that the downstream biomass from where GPP is set to zero is estimated as dB/dt = 0 – Respiration – Sinking – DOC Excretion – Grazing + Advection-IN – Advection-OUT (Figure 2). The extent of phytoplankton biomass loss after GPP was turned off is shown for three locations in Figure 5. When the spatial distribution of phytoplankton Persistence in each model grid cell is mapped, biomass (as %) that remains in the WSC is compared to the location where GPP was cut-off. The contour in each panel shows the distance traveled by 20% of the original biomass or the location where 80% of the initial phytoplankton carbon is lost. Notably, phytoplankton biomass along the AWI reaches longer distances than elsewhere in the study domain. However, there is spatial variability: phytoplankton biomass persists longer (i.e., travels farther) in the AWI waters at the entrance of the BO (∼300 km), decreasing to 200 km south of Svalbard and decreasing further to ∼150 km at the entrance to the Arctic Ocean, regardless of time between July and August. Such dispersal distances are typical for larval transport of benthic, sessile organisms and a variety of fish (50–150 km) with large ocean currents being major pathways of larval dispersal (Cowen et al., 2006, 2007; Treml et al., 2008), enriching population abundance, genetic diversity, persistence and resilience.
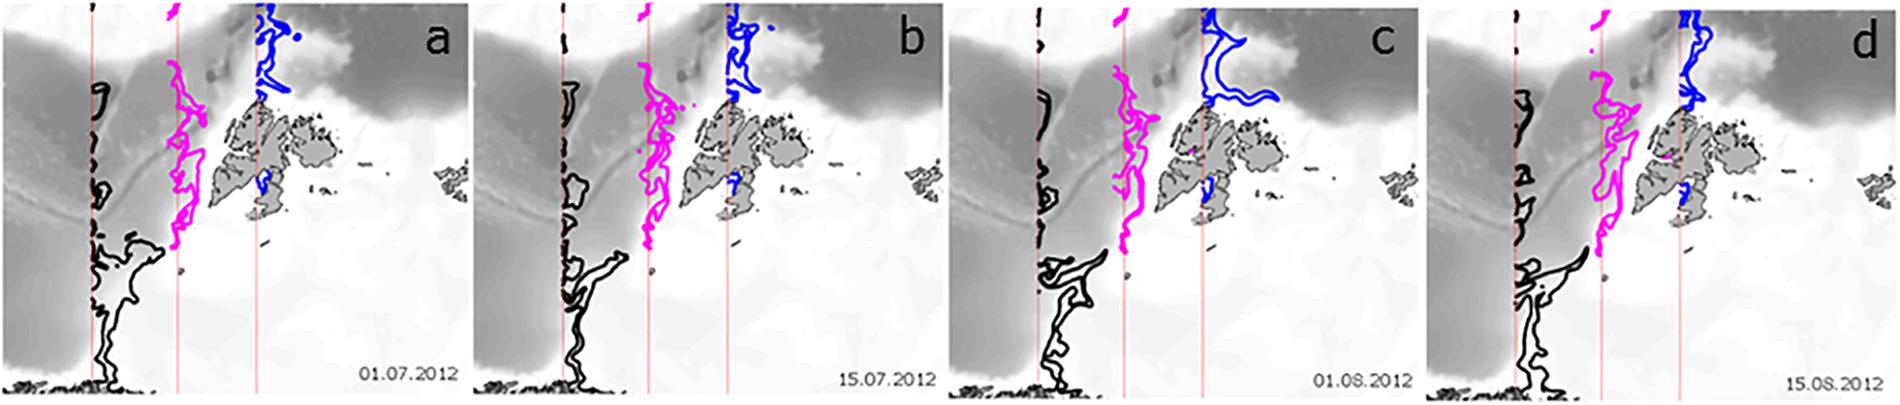
Figure 5. Persistence of summer phytoplankton biomass along the Atlantic Water Inflow after GPP is turned off. The three locations are depicted with the vertical red lines (see also orange transect lines in Figure 1b). The thick lines depict the locations where 20% of the initial biomass is retained, after GPP = 0, from the NW Norway (black), Barents Opening (pink) and NW Svalbard (blue) for (a) 1 July, (b) 15 July, (c) 1 August and (d) 15 August 2012.
Given that Biomass at any given location can increase by transport from another location or from local processes, we calculated the ratio of phytoplankton advected (into a grid cell) per unit of in situ GPP (Advection-IN/GPP, Figure 2). This unitless ratio indicates what proportion of the biomass in any given location originated from advection (mg C m–2 d–1) and how much from local photosynthesis (mg C m–2 d–1). When the spatial distribution of the ratio in each model grid cell is mapped, the values are always positive, indicating advection of phytoplankton is greater than, or equal to, in situ GPP in our region of interest (Figure 6). For the growth season, the ratio, that is the contribution of biomass by advection, is maximum along the currents on average, with ratios of up to 40 indicating a much larger contribution of advected phytoplankton compared to contribution of carbon by in situ primary production. This large contribution of biomass by advection of phytoplankton is similar in the NAC, the BO and NSv, although ratios are somewhat lower (∼30X) in the WSC. Similarly, the East Greenland Current, west of the Fram Strait and Greenland Sea, and the Santa Ana Trough region, located north of Nova Zemlya in the Arctic Ocean, exhibit a high contribution of advection to GPP.
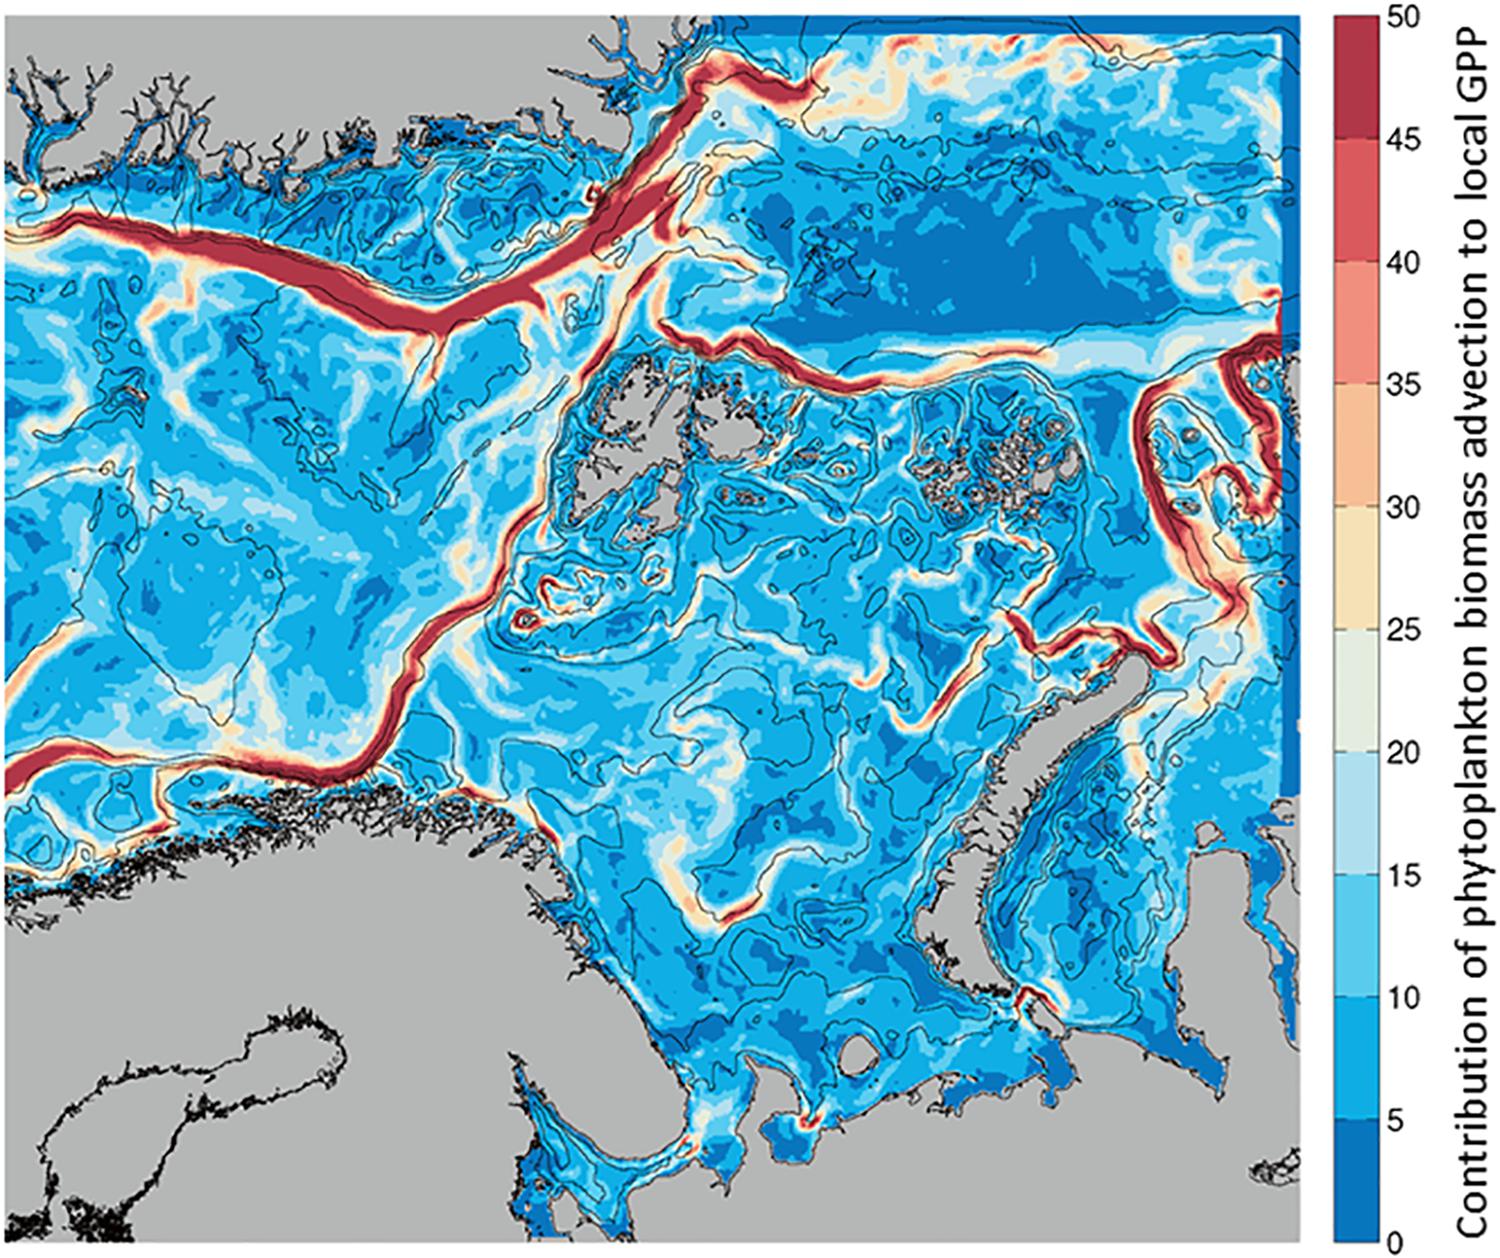
Figure 6. Average contribution of Phytoplankton Biomass Advection to local Gross Primary Production estimated as Biomass advected IN/GPP (no units), from April to September. Low contribution of advection (blue) to high (red) from 0 to 50 times higher Phytoplankton Advection than local GPP.
The relative balance between advected and locally produced biomass at each location has a strong seasonality (Supplementary Figure S2). When GPP is low, as in the beginning and end of the growth season, the ratio is intermediate (10 – 20), as presumably advected biomass is also low. During the spring bloom (May), when in situ production is high, the ratio is lowest (sometimes <5), indicating the local production is closer to the advected biomass, in particular in the WSC. Advection of biomass becomes more important as local productivity lessens later in the summer. In August, the ratio is highest (∼50), i.e., advection brings phytoplankton carbon from the productive regions of the south toward the north at a time when GPP is low. In the NSv, the importance of advected biomass is highest also late in the growth season, in August and September.
If phytoplankton biomass is being advected along the AWI current, how much carbon is being transported at any given location? The transport of phytoplankton carbon biomass and water through sections along the advective pathway was calculated (Advection-OUT for biomass, Figure 2) and integrated for the growth period (from April to September). We defined four sections along the AWI to examine potential changes in transport occurring from south to north (Figure 1b). These sections have variable lengths as they were set to be representative of all northward transport that varies along the current due to topography (Hansen et al., 2008). As there is no objective measure of water and carbon flow, these transects are meant to give a semi-quantitative estimate of south-to-north changes in fluxes.
A decrease in phytoplankton biomass transport was observed from the NAC to the NSv that can be considered a net loss of biomass toward the north (Table 1 and Supplementary Table S3). In northern Norway (the southernmost section), the flow carries 2.31 ± 1.06 Tg C 6mo–1 of phytoplankton carbon during the growth season. As the current flows northward, 0.97 Tg C 6mo–1 is advected eastward to the Barents Sea, whereas 1.18 ± 0.07 Tg C 6mo–1 is advected northward toward the south of Spitsbergen. Transport of carbon decreases to 0.76 ± 0.19 Tg C 6mo–1 over the Yermak Plateau, north of the Svalbard Archipelago at the entrance of the Arctic Ocean and to 0.36 Tg C 6mo–1 along the NSv. As a result, the AWI entering the Arctic Ocean continental slope transports only a sixth of the phytoplankton biomass advected out of the NAC. Some of the simulated biomass is likely transported toward the Greenland Sea, given that in this area, AW water returns southward south of 80°N, due to the eddy-driven recirculation toward the west (e.g., Marnela et al., 2013; Hattermann et al., 2016; Wekerle et al., 2017). Thus, we expect a fraction of phytoplankton carbon to enter this westerly recirculation, in agreement with the decrease of phytoplankton carbon from NW Svalbard to north of Barents Sea, from 0.76 Tg C 6mo−1 to 0.36 Tg C 6mo−1 (Table 1). The high seasonal variability in carbon flux in any region is attributed in part to the seasonal variability in water transport within the AWI, with summer water transport half that in winter (0.2 Sv vs. 0.4 Sv, respectively; Beszczynska-Möller et al., 2012). Furthermore, copepod grazing in the NAC is highest at the time of reproduction in early spring, affecting carbon export out of this region.
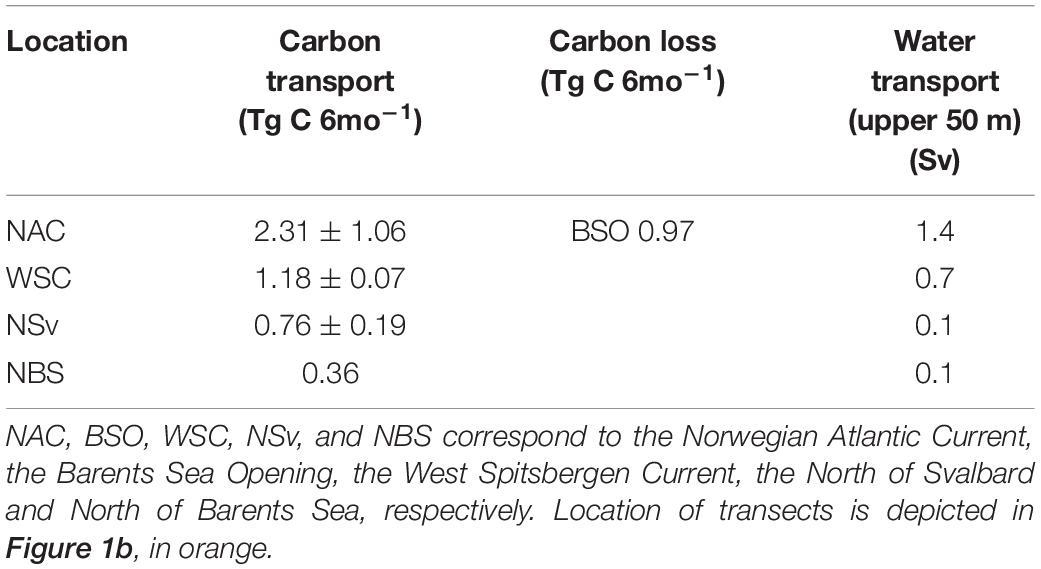
Table 1. Carbon in Tg C 6mo–1 (average ± standard deviation) and water (Sv) within the upper 50-m of the water column transported northwards by the Atlantic Water Inflow at different locations spanning 11 degrees of latitude from northern Norway to southern Arctic Ocean.
Due to the variability of advected and in situ production of biomass at any given location (Figure 6 and Supplementary Figure S2), what is the net carbon balance between phytoplankton production and loss rates at each location along the AWI? A positive carbon balance between these processes would indicate a net accumulation of phytoplankton biomass due to in situ processes while a negative one relates to net loss. If we define total Net Carbon Production (NCP) as the difference between Phytoplankton production and Phytoplankton losses (NCP = GPP – Respiration – Sinking – DOC Excretion – Grazing) for each location (or model grid cell, Figure 2), NCP is >0 in areas and times where in situ input terms are higher than the in situ losses (and vice versa). Areas of NCP >0 indicate excess carbon production that can be considered “exportable” phytoplankton biomass (Jönsson et al., 2011), either to depth or advected northward/eastward.
Mapping the NCP during the growth season along the AWI, we find phytoplankton biomass accumulation (∼20 g C m–2 6mo–1) in the BSO and the northern WSC, and a net loss of phytoplankton in the NAC and over the Yarmak Plateau (∼−15 g C m–2 6mo–1; Figure 7 and Supplementary Table S4). A slightly positive biomass accumulation of ∼ 5 g C m–2 6mo–1 is visible in the NSv area. Looking at a time evolution of NCP from April to September (Supplementary Figure S3), there is a strong seasonal signal for NCP in NW Svalbard that is dominated by the spring bloom in May. In June, the NAC and the BO are dominated by carbon losses; nonetheless, the WSC remains productive overall. By the end of the summer season, the whole region has become dominated by net carbon losses, indicating higher consumption than production. The overall seasonal signal west of Svalbard (Figure 7) is positive due to the high NCP in May and June that is not compensated by in situ losses later in the season.
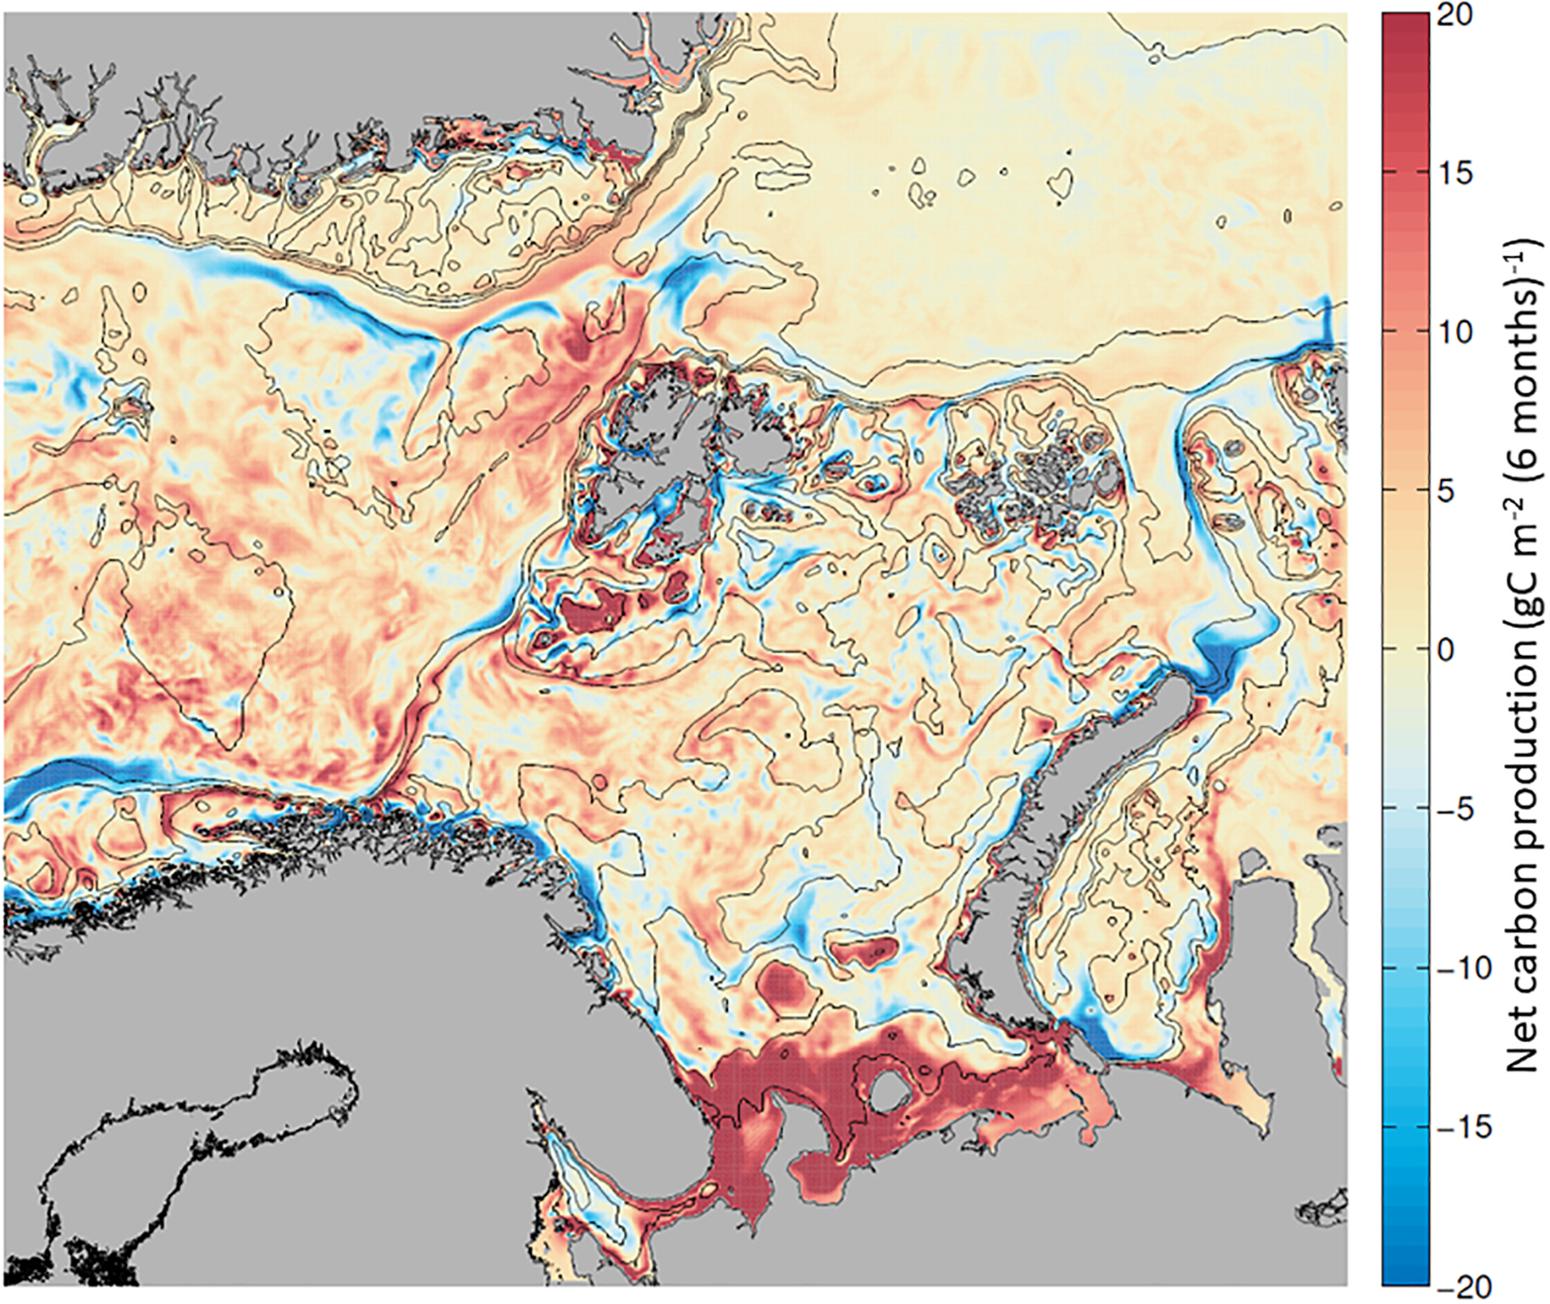
Figure 7. Net carbon production (NCP), calculated as the balance between in situ production (GPP) and in situ carbon losses (respiration, DOC excretion, sinking and grazing), calculated for each grid cell and mapped. Positive NCP (in red) and net carbon losses (in blue) from + 20 to –20 g C m–2 6mo–1, between April and September 2012.
A major question in the Arctic region concerns the changes in the Arctic Seas and their effect on the connectivity with the Central Arctic Ocean. The most active of these connections is the AWI from the North Atlantic to the Nansen Basin, an eastern boundary current well known for bringing heat and nutrients to high latitudes (e.g., Dickson et al., 2008 and refs. therein, Hofmann et al., 2011). Water masses and their biological and chemical constituents advected in eastern boundary currents such as the AWI are subject to transformation along their transit from temperate to polar waters (Saloranta and Haugan, 2004; Longhurst, 2010). We can expect local biological processes to take place at every location, through photosynthesis (bottom-up processes) and the interactions of the food web components (top-down processes). Furthermore, phytoplankton are exposed to ever changing environmental conditions, as light and nutrients change with latitude (Torres-Valdés et al., 2013). The series of experiments performed with the SINMOD model in this study provides insights into the transformation of the phytoplankton biomass from Northern Norway to the entrance to the Arctic Ocean and the role of advection for phytoplankton productivity and ecosystem processes along this pathway.
The year 2012 was ideal to perform the model experiments for two main reasons: first, it was a year of unusually low sea-ice extent in the Arctic Ocean, providing a glimpse of future conditions as sea ice extent continues to decline (Polyakov et al., 2017; Stroeve and Notz, 2018). Second, there is interest in understanding ecological processes in the NSv area, at the entrance of the AWI into the Arctic Ocean, particularly with respect to the potential development of cod fisheries in this region (Haug et al., 2017). Conditions observed in 2012 reflected the open-water fraction of this northern region, particularly during springtime when sea ice drift normally covers the northern Fram Strait (Lind et al., 2018). In this study, we address the central question: how are primary production processes affected by advection of phytoplankton carbon in the AWI and what are the consequences for the pelagic ecosystem? As all variables and processes from the model are in units of phytoplankton carbon, we can infer answers to these questions.
At the entrance of the Arctic Ocean, and in most Arctic Seas, sea ice edge blooms are considered critical to annual productivity (e.g., Sakshaug, 1993; Carmack and Wassmann, 2006; Wassmann and Reigstad, 2011). Sea ice retreat in NSv is predicted to regionally increase GPP (Slagstad et al., 2015), and longer ice-free periods have increased total Arctic productivity by 47% between 1997 and 2015 (estimated from remote sensing and close to NPP = GPP –Respiration, as in Figure 2; Kahru et al., 2016). Advection of phytoplankton (Carbon Transport, Table 1) along the AWI is expected to have a positive effect on GPP rates in ice-free waters. Results from this study suggest a ∼100% GPP increase in the WSC. For example, the waters west of Svalbard influenced by the AWI produce ∼120 g C m–2 yr–1 while waters of the Greenland Sea toward the west only produce ∼60–80 g C m–2 yr–1 (Figure 3a). As the transport of phytoplankton arrives to the ice edge in the WSC or NSv, it is expected to enhance the ice-edge blooms as well.
Integrated primary production rates in open waters of the Arctic Ocean, estimated from remote sensing and closer to Net PP (or GPP-Respiration in Figure 2), are approximately 100 g C m–2 yr–1 (Arrigo and van Dijken, 2015; IOCCG, 2015), with production supported by winter nitrogen concentrations of 5–12 μM NO3 (Codispoti et al., 2013). Known standing stocks of available nitrogen in the Arctic are not enough to support the annual Arctic Ocean production (Tremblay et al., 2015), meaning additional sources, either from advection or from diffusive processes, are required. Diffusion of nitrate from deep waters through the pycnocline has recently been estimated at 0.2 – 2.0 mmol N m–2 d–1 in the NSv area during the growth season, equivalent to an excess 1.3 nM per day in a 15-m summer mixed layer (Randelhoff et al., 2015, 2018). This diffusive nitrate input is expected to support 31 g C m–2 yr–1 (Randelhoff et al., 2015). However, deep-sea O2 demand is higher than can be supported by local GPP (Boetius et al., 2013). This imbalance between supply and demand suggests organic carbon is advected into the Central Arctic Ocean. Similarly, food web modeling concludes that the Central Arctic Ocean is heterotrophic, with organic carbon being imported into the system to meet zooplankton and fish needs (Olli et al., 2007). Compared to 127–136 Tg C yr–1 photosynthesized each year for the Nordic Seas/Nansen Basin and Barents Sea regions, as defined by Arrigo and van Dijken (2015; but see IOCCG, 2015), the SINMOD simulations suggest an advection via the N. Atlantic into the Arctic Ocean of phytoplankton carbon of 0.76 Tg C yr–1 (Table 1). This is a conservative estimate, considering it does not account for winter carbon advection.
Similar to physical and chemical seawater properties, phytoplankton abundance and physiology along the AWI present a gradient from South to North. The waters of the AWI cool and freshen on their transit north. However, due to their fast movement, they maintain higher heat and salt content than surrounding waters of the Norwegian and Greenland Seas (Lind and Ingvaldsen, 2012). Similarly, nutrients are imported from the North Atlantic and are transported north (Carmack and Wassmann, 2006). It is now known that zooplankton from temperate oceans are also advected northward, specifically the copepod C. finmarchicus (Wassmann et al., 2015, 2019). However, phytoplankton and zooplankton carbon have an overall net loss toward the north, albeit with regional variability (Figure 7 and Supplementary Figure S3), indicating that on average, in AWI waters, carbon losses exceed production northwards (Table 1, Ellingsen et al., 2008; Weydmann et al., 2014).
A small percentage of the biomass generated in the entire Norwegian Sea, 2.31 Tg C (6mo)–1 (Table 1), or 2.4% of the 78 Tg C (6mo)–1 produced (as per SINMOD, data not shown), is free to be advected north. From there, the phytoplankton biomass decreases to the entrance of the Arctic Ocean by 85% to 0.76 Tg C. This decrease can be attributed to two concurrent effects: primary production rates (GPP) diminish northward as irradiance decreases (Figure 3a) while grazing by macro- and microzooplankton remains more constant (Banse, 1995; Wassmann et al., 2010). High microzooplankton grazing in the AWI has been measured in NSv where a large portion of local primary production is consumed in situ (Lavrentyev et al., 2019). Other loss factors contribute to carbon decrease, such as phytoplankton respiration that increases toward the north, where respiration in the summer, during 24-h light, was found to be 10-fold higher than in the dark (Mesa et al., 2017).
There is an abrupt change in simulated production-related processes in the AWI as it enters the Arctic Ocean into NSv (Figure 3a). Although the modified Atlantic water that can be found along the Arctic shelf break maintains higher production than surrounding waters, NSv primary production is 30% lower in relation to the WSC. The decrease in primary productivity at this interface is attributed to higher concentrations of sea ice, decreased light availability and increased stratification by meltwater annually, resulting in less nutrient availability after the spring bloom (Harrison et al., 2013; Tremblay et al., 2015). In contrast, the WSC features deep mixing in winter bringing up nutrients to surface waters (Appen et al., 2016). When these waters are affected by sea ice cover and later by meltwater input, increased stratification limits phytoplankton access to the deep nutrients only after the spring bloom. In the absence of sea ice, the stratification is less pronounced, enhancing access to deep nutrients. Lower stratification can increase diffusion of nutrients through the thermocline by ten-fold, from 0.1 to 2.0 mmol NO3 m–2 d–1 (Randelhoff et al., 2016, 2017). These processes are similar to the difference in stratification affecting productivity in ice-covered northern versus ice-free southern waters of the Barents Sea (Rey and Loeng, 1985).
Increased GPP in the WSC relative to the Fram Strait approximates trends observed for secondary production (Supplementary Figure S4a, Wassmann et al., 2010). This high productivity results in a net positive annual carbon production, or ∼15 g C m–2 yr–1 (or ∼12.5%), that is available for transport elsewhere in spring and summer (Figure 7). Along with ∼2/3 of the waters from the WSC recycling into the Fram Strait (Hattermann et al., 2016; Wekerle et al., 2017), the remaining phytoplankton carbon (∼5 g C m2 yr−1) is likely transported east, toward the Arctic Ocean, via a branch north of the Yermak Plateau or directly into the slope waters of NSv (Figure 6; Beszczynska-Möller et al., 2012). This advective source adds up to 0.76 T g C yr–1 (Table 1) of live phytoplankton cells that can sustain additional GPP. With an efficiency of ∼0.5 mg C (mg chla–1) h–1 for the phytoplankton in the euphotic zone (Vernet et al., 1998) and an average seasonal C:chla ratio of ∼53 (Wassmann et al., 2006; Vernet et al., 2017; Paulsen et al., 2018), 23.1 Tg C yr–1 are supported by advected phytoplankton in the NSv, i.e., the same order of magnitude of the simulated annual GPP in NSv (60 g C yr–1; Figure 3a) or the 30 g C yr–1 estimated from nitrate input through the summer pycnocline (Randelhoff et al., 2015). This estimate underlines the importance of advection to in situ production (Figure 4). However, any calculation of this type is sensitive to the average parameters extracted from the literature and deserves further study (Lind et al., 2018).
The AWI transports phytoplankton biomass from a southern location to a more northern one. Upon arrival, the biomass can synthesize new carbon in response to local conditions of light and nutrient availability (i.e., GPP). If we consider bulk quantities, the transport along the current is such that at least 20% of the biomass is maintained by advection for 75 – 250 km (Figure 5). With a growth rate of 0.1 d–1 or a doubling time of 7 days (Figure 3b) and a Residence Time of 0.2 days (Figure 4), an average phytoplankton cell takes ∼1 day to travel 20 km (equivalent to five model grid boxes), which translates into a cell division cycle within 140 km (Nelson and Brand, 1979). Hence, the current can disperse phytoplankton beyond its location of growth and move biomass to areas of lower local primary production, increasing productivity toward the north.
Adding to the mechanical advection of cells northward, the AWI provides an environment that enhances phytoplankton growth and physiology. Higher growth rates are observed within the current, in comparison to areas of same latitude toward the west. Growth in the AWI can reach ∼0.14 d–1, decreasing to ∼0.08 d–1 in the Greenland Sea (Figure 3b). Several factors could account for this enhancement. Temperatures in the AWI are higher, increasing metabolism (Eppley, 1972; Huot et al., 2013; Chen, 2015). Enhanced grazing, associated with advected microzooplankton and C. finmarchicus (Gluchowska et al., 2017), is also known to benefit phytoplankton growth, through nutrient recycling and mortality of unhealthy cells (Michel et al., 2015).
Enhanced physiology affects the phenology of the primary production. Two main regions along the AWI show that the timing of phytoplankton growth is altered in such a way as to result in a longer productive season: the spring (May) bloom starts earlier in the NAC in comparison to the Norwegian and Greenland Seas where peak productivity is delayed until June (Supplementary Figure S1). In the absence of sea ice, early productivity implies a better use of light within the current, though it is likely that the NAC may replenish its nutrient load sooner due to its shallower nature and proximity to coastal processes (Sætre, 2007; Pacariz et al., 2016; but see Johnson et al., 2013). In addition, advection, by bringing carbon to the north, enables productivity (GPP) in the WSC as late as September, extending the growth season. This results in better use of the seasonally available nutrients contributing to the overall annual GPP.
Overall, there is no consistency of NCP in space and time along the AWI, suggesting the timing of the different components of the system within is not synchronous. Considering the AWI from western Norway to the Arctic Ocean, we mentioned before that NCP defines three main regions: the NAC extending to the southern BO, the WSC including the northern portion of the BO and the waters in NSv. The decrease in primary productivity toward the north (Figure 3a) is likely determined by bottom-up controls of shortening day length and mixed-layer depth dynamics, as mentioned above in section “South-to-North Phytoplankton Carbon Gradient,” as well as by decreasing grazing pressure, as zooplankton biomass experiences losses toward the north (Supplementary Figure S4, Ellingsen et al., 2008; see section “Input of Carbon to the Arctic Ocean”). For example, NW of Svalbard, the WSC current features an accumulation of carbon as the phytoplankton input exceeds the loss terms for May and June, resulting in a NCP >0 for the growth season (Figure 7 and Supplementary Figure S3). Similarly, the GPP in the NAC is high (120 g C m–2 yr–1, Figure 3a), resulting in another region with net harvestable phytoplankton biomass in the system. Seasonally, the NCP shows variability in all the regions; it is most variable in the NAC, with two periods of negative NCP, one in May-beginning of June and one in Ju ly-August, following periods of positive NCP (Figure 8 and Supplementary Figure S3). The WSC shows similar dynamics on NCP, with a lag of ∼1 month. In contrast, NSv switches from a positive NCP in mid-June to negative for the remainder of the growth season.
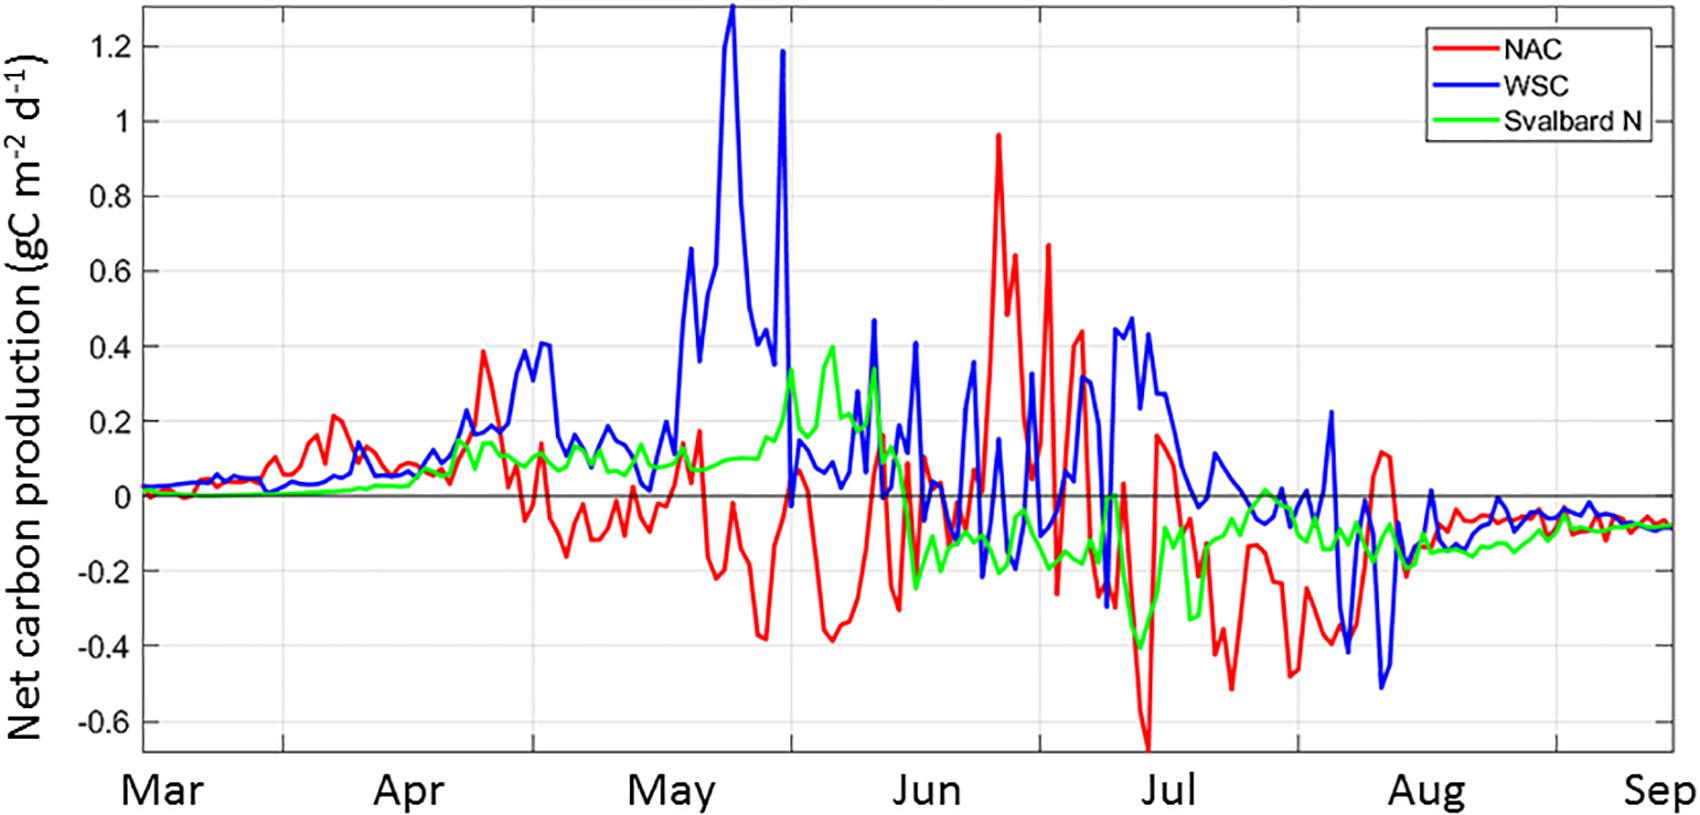
Figure 8. The spatial and temporal variability of Net Carbon Production (NCP) from March to September for three regions along the Atlantic Water Inflow: the Norwegian Atlantic Current (NAC, red), the West Spitsbergen Current, (WSC, blue) and North of Svalbard (Svalbard N or NSv, green) for the year 2012. Representative locations for these three regions are indicated in Figure 1b.
The NCP, expressed as the carbon balance between GPP and loss terms for each location (Eq.1, Figure 2), and mapped in Figure 7 and Supplementary Figure S3, can also be expressed in terms of advection. If dB/dt = 0, and if the system is assumed in balance for 1 day, then any excess production will generate phytoplankton biomass that can then be advected out of a given location. In this way, the net advection north, calculated as the difference between import and export of carbon to/from a location, is equal to the NCP. If advection of phytoplankton provides 5–50 times more biomass than local production along the AWI (Figure 4), this import is maximum at times of low GPP (see section “South-to-North Phytoplankton Carbon Gradient”). The AWI water flow, in its seasonal variability, decreases by half in summer, at the time of highest GPP (Beszczynska-Möller et al., 2012). In comparison, the seasonal variability of GPP is 1,000-fold, from an average <3 mg C m–2 d–1 in winter to >1 g C m–2 d–1 during the spring bloom (Vernet et al., 1998) and is expected to dominate the phytoplankton advection. During early spring and fall, when GPP rates are intermediate, the current flow must have a disproportionate role in moving phytoplankton biomass from the NAC toward the north, not only to feed the zooplankton being advected, but also for birds, benthic filter feeders and fishes (Kwasniewski et al., 2012). Furthermore, advected phytoplankton carbon can provide a more constant supply, reducing any short-term variability of local productivity. In summary, copepod biomass in northern latitudes, such as the NSv and food availability to benthic feeders and fish populations in western and northern waters of the Svalbard Archipelago, are partly maintained by the advection of phytoplankton biomass that can be consumed directly, or by supporting increased in situ GPP resulting from this advection of biomass.
Phytoplankton production is dependent on environmental factors and biomass concentration (e.g., light and nutrient availability, sea ice conditions and the amount of chlorophyll a available to photosynthesize, Dierssen et al., 2000) while zooplankton abundance and physiology are more dependent on internal population dynamics, such as periods of reproduction and diapause (Basedow et al., 2018). These zooplankton processes, in turn, control grazing pressure on phytoplankton, influencing B and GPP spatial and temporal variability (Figure 3 and Supplementary Figure S4).
Accounting for the dynamics and life history of C. finmarchicus, the most abundant grazer in the AWI, can also help explain the variability observed in NCP (Figure 7). C. finmarchicus is a temperate copepod that can be transported northward from the North Atlantic (Wassmann et al., 2015; Basedow et al., 2018). The southern NAC contains overwintering C. finmarchicus that are ready to start grazing at the onset of light in April followed by GPP initiation (Hirche, 1996). The grazing pressure generates a negative NCP (blue in Supplementary Figure S3). The larvae and adults are moved north with the current (Wassmann et al., 2019) and maintain a high grazing pressure (Supplementary Figure S4a), resulting in negative NCP in NW Norway and southern BO in June (Supplementary Figure S3). Along the NAC, grazing pressure from C. finmarchicus continues to consume available phytoplankton carbon (Figure 8 and Supplementary Figure S3), despite the negative NCP concurrent with the highest GPP rates in May and June. Spatially, 50% of the simulated zooplankton biomass in the WSC is reported as found in NSv where the cohort from the southern NAC enters diapause 6 months later, in September (Wassmann et al., 2019). Despite this loss, the modified AWI waters arriving to the Arctic shelf break in NSv are shown to have twice the zooplankton biomass than in the Nansen Basin, and hence can exert twice the grazing pressure on GPP, resulting in twice the secondary production (Supplementary Figure S4b). The presence of C. glacialis, an Arctic copepod, is expected to start exerting grazing pressure as the cooler AWI waters reach NSv (Svensen et al., 2019). Similar to C. finmarchicus, this species also depends on the spring bloom, now associated to the ice edge, to reproduce and develop (Søreide et al., 2010; Daase et al., 2013).
As already indicated, phytoplankton biomass accumulates when GPP exceeds grazing, establishing a positive NCP, as other loss terms in the model are calculated as percentage of GPP (Banse, 1995; Wassmann et al., 2006). In this way, NCP in NSv waters becomes positive in mid-April, when the spring diatom bloom occurs (Figure 8). At this time of the year, microzooplankton are not able to consume all diatoms (Lavrentyev et al., 2019). In June, grazing increases. Grazing by C. finmarchicus is 13%, by C. glacialis is 2%, and 20% by ciliates (Ellingsen et al., 2008), in agreement with recent field data (Reigstad et al., pers. comm., Paulsen et al., 2018; Lavrentyev et al., 2019; Sanz-Martin et al., 2019; Svensen et al., 2019). Such processes result in an accumulation of phytoplankton biomass in the NSv area until mid-June, when the new copepod cohort arrives. By July, and further into August and September, grazing exceeds GPP and generates a net carbon loss from mid- June to the end of phytoplankton growth season.
Despite their proximity, the AWI waters in northern WSC present a contrasting scenario to the NSv region, for both GPP (Figure 3a) and NCP (Figure 7), as discussed earlier. As the waters cool in their transit north, we can expect C. finmarchicus grazing pressure to decrease in relation to GPP due to a temperature-controlled delay in grazing pressure, combined with the diminishing zooplankton biomass. In northern WSC, the net loss starts in July (Supplementary Figure S3), after the arrival of the new C. finmarchicus cohort (Kosobokova and Hopcroft, 2010). In this region, C. glacialis abundance is still relatively low, estimated at 100-fold lower than C. finmarchicus (Wassmann et al., 2019). This scenario is similar to the decoupling between primary and secondary production observed in advected waters of the Chukchi Sea, where low temperatures delay the peak of secondary production (Grebmeier et al., 2015). A decrease in grazing pressure, allowing for GPP to exceed the loss terms for phytoplankton, may also result from C. finmarchicus ingesting microzooplankton, such that photosynthesizing flagellates can bloom, as observed in field and mesocosm experiments (Verity et al., 1999; Irigoien et al., 2005; Löder et al., 2011).
Most of the estimates of primary production, either from field observations, remote sensing, or estimates from models (e.g., SINMOD Figure 3), provide in situ rates that translate into new biomass becoming available for consumption or dispersal. These approaches do not differentiate between the carbon produced locally and the carbon brought in by, or lost to, a current, although alternative methods to account for the effect of advection are becoming available (Jönsson et al., 2011; de Verneil and Franks, 2015). By differentiating between biomass advected into a location and the rate of local production, we have shown that the bulk of the simulated production in the AWI is maintained by advection (Figure 7). By defining new variables based on model output, we provide first-time evidence that in absence of advection, local production would be decreased by half in this region. The importance of the strength of the AWI cannot be discounted in assessments of sub-Arctic Ocean health and productivity.
The benefit of the AWI flow for primary production in the eastern Fram Strait is expressed over different time scales. GPP rates are higher in the WSC on annual time scales where, as noted before, the production is higher than in neighboring Greenland Sea (Figure 3) and its importance increases with latitude. However, the enhanced GPP by the AWI flow is more noticeable on (sub-annual) seasonal time scales, with maximum effect in early spring and late summer (see April and August in Supplementary Figure S1), due mainly to advective processes before and after the peak in June productivity (Supplementary Figure S2).
The entrainment of phytoplankton in the AWI facilitates its dispersal and increases its connectivity between sub-Arctic and Arctic regions (or domains, Wassmann et al., 2015; Moore et al., 2018), as shown for larval stages elsewhere (Cowen et al., 2006). Advection is one of the main processes involved in connectivity (Treml et al., 2008). Defining ocean connectivity as the probability that water parcels from one location have advected to another site over a given time interval (Mitarai et al., 2009), this study has shown higher connectivity, expressed as shorter residence time, along the AWI than in surrounding waters of the Greenland Sea (Figure 5). The global surface ocean is emerging as highly interconnected with waters from the Atlantic Ocean taking a median time of 6.4 ± 2.2 years to reach the Arctic (Jönsson and Watson, 2016). Along a main oceanic current such as the AWI, the transport time from NAC to NSv is shortened considerably to a few months, as indicated by the consumption of the local NSv productivity by the arrival of the new C. finmarchicus cohort in mid-July (Figure 8; Svensen et al., 2019; Wassmann et al., 2019). In this way, this study provides a first glimpse of the degree of interconnectivity from the Norwegian Sea to the Arctic Ocean through the balance between local processes and phytoplankton seasonal evolution driven principally by advection in this sub-Arctic region.
The degree of connectivity can also be assessed in relation to a species growth rate, which can be considered an intrinsic organismal residence time within a population. In the case of the AWI, phytoplankton persistence of up to 250 km (Figure 6), combined with a simulated growth rate of 0.1 d–1 (Figure 4), suggests about two cell cycles are necessary to travel that distance (see also section “Effect of Advection on Phytoplankton Ecology”). In the ∼2,000 km from NAC to Svalbard (Wassmann et al., 2019), this translates to approximately ∼16 cell divisions from April to July. For longer lived organisms, such as C. finmarchicus, the cohort reaching NSv in mid-July originated in April in the NAC (Wassmann et al., 2019) and is equivalent to one reproductive cycle. The difference in phytoplankton vs. zooplankton residence times in the AWI suggests that phytoplankton can have an expanded ability to adapt when transported from temperate to Arctic waters, not only as a result of their increased plasticity in relation to zooplankton but also by having more opportunities to evolve, i.e., 16 times more. Thus, we can predict higher resiliency in phytoplankton (Pancic et al., 2015).
Changes in climate are further expected to affect dispersal and connectivity among locations (Lett et al., 2010). For phytoplankton, enhanced current temperature can increase specific growth rates (Figure 4), shortening the time of dispersal per cell by advection, or a decrease in Persistence (Figure 6); this would result in higher in situ GPP in relation to advection (Figure 7). Other factors could compensate, such as the survival of temperate zooplankton species reaching and reproducing in northern latitudes, as seen for the amphipod Thermistos compressa (Schröter et al., 2019) and C. finmarchicus copepodites (Gluchowska et al., 2017), or increasing zooplankton grazing rate (Lett et al., 2010). Although no trends in zooplankton abundance or biomass are recorded for the surface waters (0–60 m) of the WSC in a 14-year time series (Carstensen et al., 2019), C. finmarchicus becomes an increasing proportion of zooplankton biomass reaching the Barents Sea in warmer years (Gluchowska et al., 2017). Expansion of North Atlantic temperate phytoplankton species into the Arctic will be enhanced by the warming AWI flow (Polyakov et al., 2012), as a highway facilitating transport into higher latitudes within seasonal timescales, as observed in 2014 by the presence of unusually abundant Synechococcus sp. in NSv during summer (Paulsen et al., 2016).
Several interesting conclusions have arisen from this modeling study, indicating advection contributes to phytoplankton biomass and production in the North Svalbard area and to the transport of autotrophic plankton from the northern Norway coastal region to the gateway to the Arctic Ocean, supporting the importance of field studies to parameterize and test modeling predictions in this transition region (Slagstad et al., 2015).
Specifically:
1. Advection of phytoplankton provides 5–50 times more biomass than local production along the Atlantic Water Inflow, suggesting the planktonic foodweb in the area is constantly fed during the growth season.
2. A high phytoplankton growth rate is maintained along the AWI, in comparison to open ocean regions west of the WSC, suggesting that the physical, chemical and biological processes within the current provide an environment for healthy phytoplankton.
3. Overall, there is no consistency of NCP in space and time along the AWI, suggesting the timing of the different components of the system within the current is not synchronous. Variability in zooplankton grazing is the most likely source of variability in NCP.
4. Advection extends phytoplankton biomass further north at the end of the summer, i.e., August and September, likely initiating blooms toward the north, and providing food for local benthic and fish populations in polar and sub-polar ecosystems.
5. The model predicts net import of phytoplankton biomass into the Arctic Ocean as it is produced in the system west of Svalbard. ∼15 g C m–2 (6mo)–1 (or ∼12.5%) of GPP can be exported from the WSC annually, either to the Arctic or recirculated.
MV organized the project, participated in experimental design, interpreted the results, and wrote the manuscript. IE was in charge of model results, contributed with experimental design, interpreted the results and revised the manuscript. LS contributed with experimental design, interpreted the results, and revised the manuscript. DS revised model results, contributed with experimental design, and interpreted the results. MC interpreted the results and revised the manuscript. PM interpreted the results, revised and edited the manuscript and figures.
This work was supported in part by a Carbon Bridge Project No. 226415 (Polar Program under the Research Council of Norway), a NASA Ocean Biology & Biogeochemistry grant (NNX10AG04G and 80NSSC18K0081 to PM and MV), a fellowship from Hanse-Wissenchaftskolleg, Delmenhorst, Germany and a United States National Science Foundation grant PLR-1443705 to MV.
The authors declare that the research was conducted in the absence of any commercial or financial relationships that could be construed as a potential conflict of interest.
We thank Paul Wassmann, Marit Reigstad, Camilla Svensen for discussions on Arctic ecology, and B. Jack Pan for help with the references.
The Supplementary Material for this article can be found online at: https://www.frontiersin.org/articles/10.3389/fmars.2019.00583/full#supplementary-material
Aagaard, K., Foldvik, A., and Hillman, S. (1987). The west spitsbergen current: disposition and water mass transformation. J. Geophys. Res. Oceans 92, 3778–3784.
Agustí, S., and Duarte, C. M. (2013). Phytoplankton lysis predicts dissolved organic carbon release in marine plankton communities. Biogeosciences 10, 1259–1264. doi: 10.5194/bg-10-1259-2013
Appen, W.-J. V., Schauer, U., Hattermann, T., and Beszczynska-Möller, A. (2016). Seasonal cycle of mesoscale instability of the West Spitsbergen Current. J. Phys. Oceanogr. 46, 1231–1254. doi: 10.1175/jpo-d-15-0184.1
Arrigo, K. R., and van Dijken, G. L. (2015). Continued increases in Arctic Ocean primary production. Prog. Oceanogr. 136, 60–70. doi: 10.1016/j.pocean.2015.05.002
Babin, M., Bélanger, S., Ellingsen, I., Forest, A., Le Fouest, V., Lacour, T., et al. (2015). Estimation of primary production in the Arctic Ocean using ocean colour remote sensing and coupled physical–biological models: strengths, limitations and how they compare. Prog. Oceanogr. 139, 197–220. doi: 10.1016/j.pocean.2015.08.008
Banse, K. (1995). Zooplankton: pivotal role in the control of ocean production: I. Biomass and production. ICES J. Mar. Sci. 52, 265–277. doi: 10.1016/1054-3139(95)80043-3
Basedow, S. L., Sundfjord, A., von Appen, W.-J., Halvorsen, E., Kwasniewski, S., and Reigstad, M. (2018). Seasonal variation in transport of zooplankton into the Arctic Basin through the Atlantic gateway, Fram Strait. Front. Mar. Sci. 5:194. doi: 10.3389/fmars.2018.00194
Beldring, S., Engeland, K., Roald, L. A., Sælthun, N. R., and Voksø, A. (2003). Estimation of parameters in a distributed precipitation-runoff model for Norway. Hydrol. Earth Syst. Sci. 7, 304–316. doi: 10.5194/hess-7-304-2003
Beszczynska-Möller, A., Fahrbach, E., Schauer, U., and Hansen, E. (2012). Variability in Atlantic water temperature and transport at the entrance to the Arctic Ocean, 1997–2010. ICES J. Mar. Sci. 69, 852–863. doi: 10.1093/icesjms/fss056
Boetius, A., Albrecht, S., Bakker, K., Bienhold, C., Felden, J., Fernández-Méndez, M., et al. (2013). Export of algal biomass from the melting Arctic sea ice. Science 339, 1430–1432. doi: 10.1126/science.1231346
Carmack, E., and Wassmann, P. (2006). Food webs and physical–biological coupling on pan-Arctic shelves: unifying concepts and comprehensive perspectives. Prog. Oceanogr. 71, 446–477. doi: 10.1016/j.pocean.2006.10.004
Carstensen, J., Olszewska, A., and Kwasniewski, S. (2019). Summer mesozooplankton biomass distribution in the West Spitsbergen Current (2001-2014). Front. Mar. Sci. 6:202. doi: 10.3389/fmars.2019.00202
Carstensen, J., Weydmann, A., Olszewska, A., and Kwaśniewski, S. (2012). Effects of environmental conditions on the biomass of Calanus spp. in the Nordic Seas. J. Plankton Res. 34, 951–966. doi: 10.1093/plankt/fbs059
Chen, B. (2015). Patterns of thermal limits of phytoplankton. J. Plankton Res. 37, 285–292. doi: 10.1093/plankt/fbv009
Codispoti, L., Kelly, V., Thessen, A., Matrai, P., Suttles, S., Hill, V., et al. (2013). Synthesis of primary production in the Arctic Ocean: III. Nitrate and phosphate based estimates of net community production. Prog. Oceanogr. 110, 126–150. doi: 10.1007/s00300-019-02533-0
Cowen, R. K., Gawarkiewicz, G., Pineda, J., Thorrold, S. R., and Werner, F. E. (2007). Population connectivity in marine systems: an overview. Oceanography 20, 14–21. doi: 10.5670/oceanog.2007.26
Cowen, R. K., Paris, C. B., and Srinivasan, A. (2006). Scaling of connectivity in marine populations. Science 311, 522–527. doi: 10.1126/science.1122039
Daase, M., Falk-Petersen, S., Varpe, Ø., Darnis, G., Søreide, J. E., Wold, A., et al. (2013). Timing of reproductive events in the marine copepod Calanus glacialis: a pan-Arctic perspective. Can. J. Fish. Aquat. Sci. 70, 871–884. doi: 10.1139/cjfas-2012-0401
Dankers, R., and Middelkoop, H. (2008). River discharge and freshwater runoff to the Barents Sea under present and future climate conditions. Clim. Change 87, 131–153. doi: 10.1007/s10584-007-9349-x
de Verneil, A., and Franks, P. J. S. (2015). A pseudo-Lagrangian method for remapping ocean biogeochemical tracer data: calculation of net Chl-a growth rates. J. Geophys. Res. Oceans 120, 4962–4979. doi: 10.1002/2015jc010898
Dickson, B., Meincke, J., and Rhines, P. (2008). “Arctic–subarctic ocean fluxes: defining the role of the northern seas in climate,” in Arctic–Subarctic Ocean Fluxes, eds R. R. Dickson, J. Meincke, and P. Rhines (Dordrecht: Springer), 1–13. doi: 10.1007/978-1-4020-6774-7_1
Dierssen, H. M., Vernet, M., and Smith, R. C. (2000). Optimizing models for remotely estimating primary production in Antarctic coastal waters. Antarct. Sci. 12, 20–32. doi: 10.1017/s0954102000000043
Ellingsen, I. H., Dalpadado, P., Slagstad, D., and Loeng, H. (2008). Impact of climatic change on the biological production in the Barents Sea. Clim. Change 87, 155–175. doi: 10.1007/s10584-007-9369-6
Garibotti, I. A., Vernet, M., Kozlowski, W. A., and Ferrario, M. E. (2003). Composition and biomass of phytoplankton assemblages in coastal Antarctic waters: a comparison of chemotaxonomic and microscopic analyses. Mar. Ecol. Prog. Ser. 247, 27–42. doi: 10.3354/meps247027
Gluchowska, M., Dalpadado, P., Beszczynska-Möller, A., Olszewska, A., Ingvaldsen, R. B., and Kwasniewski, S. (2017). Interannual zooplankton variability in the main pathways of the Atlantic water flow into the Arctic Ocean (Fram Strait and Barents Sea branches). ICES J. Mar. Sci. 74, 1921–1936. doi: 10.1093/icesjms/fsx033
Grebmeier, J. M., Bluhm, B. A., Cooper, L. W., Danielson, S. L., Arrigo, K. R., Blanchard, A. L., et al. (2015). Ecosystem characteristics and processes facilitating persistent macrobenthic biomass hotspots and associated benthivory in the Pacific Arctic. Prog. Oceanogr. 136, 92–114. doi: 10.1016/j.pocean.2015.05.006
Hansen, B., Østerhus, S., Turrell, W. R., Jónsson, S., Valdimarsson, H., Hátún, H., et al. (2008). “The inflow of Atlantic water, heat, and salt to the nordic seas across the Greenland–Scotland ridge,” in Arctic–Subarctic Ocean Fluxes, eds R. R. Dickson, J. Meincke, and P. Rhines (Dordrecht: Springer), 15–43. doi: 10.1007/978-1-4020-6774-7_2
Harrison, W. G., Borsheim, K. Y., Li, W. K. W., Maillet, G. L., Pepin, P., Sakshaug, E., et al. (2013). Phytoplankton production and growth regulation in the Subarctic North Atlantic: a comparative study of the Labrador Sea-Labrador/Newfoundland shelves and Barents/Norwegian/Greenland seas and shelves. Prog. Oceanogr. 114, 26–45. doi: 10.1016/j.pocean.2013.05.003
Hattermann, T., Isachsen, P. E., von Appen, W. J., Albretsen, J., and Sundfjord, A. (2016). Eddy-driven recirculation of Atlantic Water in Fram Strait. Geophys. Res. Lett. 43, 3406–3414. doi: 10.1002/2016gl068323
Haug, T., Bogstad, B., Chierici, M., Gjøsæter, H., Hallfredsson, E. H., Høines, Å. S., et al. (2017). Future harvest of living resources in the Arctic Ocean north of the Nordic and Barents Seas: a review of possibilities and constraints. Fish. Res. 188, 38–57. doi: 10.1016/j.fishres.2016.12.002
Hibler, W. III (1979). A dynamic thermodynamic sea ice model. J. Phys. Oceanogr. 9, 815–846. doi: 10.1175/1520-0485(1979)009<0815:adtsim>2.0.co;2
Hirche, H.-J. (1996). Diapause in the marine copepod, Calanus finmarchicus—a review. Ophelia 44, 129–143. doi: 10.1080/00785326.1995.10429843
Hofmann, M., Worm, B., Rahmstorf, S., and Schellnhuber, H. (2011). Declining ocean chlorophyll under unabated anthropogenic CO2 emissions. Environ. Res. Lett. 6:034035. doi: 10.1088/1748-9326/6/3/034035
Hunke, E., and Dukowicz, J. (1997). An elastic–viscous–plastic model for sea ice dynamics. J. Phys. Oceanogr. 27, 1849–1867. doi: 10.1175/1520-0485(1997)027<1849:aevpmf>2.0.co;2
Hunt, G. L. Jr., Drinkwater, K. F., Arrigo, K., Berge, J., Daly, K. L., Danielson, S., et al. (2016). Advection in polar and sub-polar environments: impacts on high latitude marine ecosystems. Prog. Oceanogr. 149, 40–81. doi: 10.1016/j.pocean.2016.10.004
Huot, Y., Babin, M., and Bruyant, F. (2013). Photosynthetic parameters in the Beaufort Sea in relation to the phytoplankton community structure. Biogeosciences 10, 3445–3454. doi: 10.5194/bg-10-3445-2013
IOCCG (2015). “Ocean Colour Remote Sensing in Polar Seas,” in IOCCG Report Series, No. 16, eds M. Babin, K. Arrigo, S. Beìlanger, and M.-H. Forget (Dartmouth: International Ocean Colour Coordinating Group).
Irigoien, X., Flynn, K., and Harris, R. (2005). Phytoplankton blooms: a ‘loophole’in microzooplankton grazing impact? J. Plankton Res. 27, 313–321. doi: 10.1093/plankt/fbi011
Johnson, C., Inall, M., and Häkkinen, S. (2013). Declining nutrient concentrations in the northeast Atlantic as a result of a weakening Subpolar Gyre. Deep Sea Res. Part I Oceanogr. Res. Pap. 82, 95–107. doi: 10.1016/j.dsr.2013.08.007
Jönsson, B. F., Salisbury, J. E., and Mahadevan, A. (2011). Large variability in continental shelf production of phytoplankton carbon revealed by satellite. Biogeoscienes 8, 1213–1223. doi: 10.5194/bg-8-1213-2011
Jönsson, B. F., and Watson, J. R. (2016). The time scales of global surface-ocean connectivity. Nat. Commum. 7:11239. doi: 10.1038/ncomms11239
Kahru, M., Lee, Z., Mitchell, B. G., and Nevison, C. D. (2016). Effects of sea ice cover on satellite-detected primary production in the Arctic Ocean. Biol. Lett. 12:20160223. doi: 10.1098/rsbl.2016.0223
Kawasaki, T., and Hasumi, H. (2016). The inflow of Atlantic water at the Fram Strait and its interannual variability. J. Geophys. Res. Oceans 121, 502–519. doi: 10.1002/2015jc011375
Kolås, E. (2017). The Svalbard Branch of the West Spitsbergen Current: Hydrography, transport and mixing. Master’s thesis, Physical Oceanography, University of Bergen, Bergen.
Kosobokova, K. (2012). Zooplankton of the Arctic Ocean: Community Structure, Ecology, Spatial Distribution. Moscow: GEOS, 272.
Kosobokova, K. N., and Hopcroft, R. R. (2010). Diversity and vertical distribution of mesozooplankton in the Arctic’s Canada Basin. Deep Sea Res. II Top. Stud. Oceanogr. 57, 96–110. doi: 10.1016/j.dsr2.2009.08.009
Kwasniewski, S., Gluchowska, M., Walkusz, W., Karnovsky, N. J., Jakubas, D., Wojczulanis-Jakubas, K., et al. (2012). Interannual changes in zooplankton on the West Spitsbergen Shelf in relation to hydrography and their consequences for the diet of planktivorous seabirds. ICES J. Mar. Sci. 69, 890–901. doi: 10.1093/icesjms/fss076
Lavrentyev, P. J., Franzé, G., and Moore, F. B. (2019). Microzooplankton distribution and dynamics in the eastern Fram Strait and the Arctic Ocean in May and August 2014. Front. Mar. Sci. 6:264. doi: 10.3389/fmars.2019.00264
Lee, Y. J., Matrai, P. A., Friedrichs, M. A., Saba, V. S., Aumont, O., Babin, M., et al. (2016). Net primary productivity estimates and environmental variables in the Arctic Ocean: an assessment of coupled physical-biogeochemical models. J. Geophys. Res. Oceans 121, 8635–8669. doi: 10.1002/2016jc011993
Lett, C., Ayata, S.-D., Huret, M., and Irisson, J.-O. (2010). Biophysical modelling to investigate the effects of climate change on marine population dispersal and connectivity. Prog. Oceanogr. 87, 106–113. doi: 10.1016/j.pocean.2010.09.005
Lind, S., and Ingvaldsen, R. B. (2012). Variability and impacts of Atlantic Water entering the Barents Sea from the north. Deep Sea Res. Oceanogr. Res. Pap. 62, 70–88. doi: 10.1016/j.dsr.2011.12.007
Lind, S., Ingvaldsen, R. B., and Furevik, T. (2018). Arctic warming hotspot in the northern Barents Sea linked to declining sea-ice import. Nat. Clim. Change 8:634. doi: 10.1038/s41558-018-0205-y
Lindstrom, E. J., and Legier, D. M. (2001). “Developing the WOCE global data system,” in Ocean Circulation and Climate International Geophysics, Vol. 77, eds G. Siedler, J. Church, and J. Gould (Cambridge, MA: Academic Press), 181–190. doi: 10.1016/s0074-6142(01)80118-2
Löder, M. G., Meunier, C., Wiltshire, K. H., Boersma, M., and Aberle, N. (2011). The role of ciliates, heterotrophic dinoflagellates and copepods in structuring spring plankton communities at Helgoland Roads, North Sea. Mar. Biol. 158, 1551–1580. doi: 10.1007/s00227-011-1670-2
Marnela, M., Rudels, B., Houssais, M. N., Beszczynska-Möller, A., and Eriksson, P. B. (2013). Recirculation in the Fram Strait and transports of water in and north of the Fram Strait derived from CTD data. Ocean Sci. 9, 499–519. doi: 10.5194/os-9-499-2013
Matrai, P. A., Olson, E., Suttle, S., Hill, V., Codispoti, L. A., Light, B., et al. (2011). Synthesis of primary production in the Arctic Ocean: I. Surface waters, 1954-2007. Progr. Oceanogr. 110, 93–106. doi: 10.1016/j.pocean.2012.11.004
Mesa, E., Delgado-Huertas, A., Carrillo-de-Albornoz, P., García-Corral, L. S., Sanz-Martín, M., Wassmann, P., et al. (2017). Continuous daylight in the high-Arctic summer supports high plankton respiration rates compared to those supported in the dark. Sci. Rep. 7:1247. doi: 10.1038/s41598-017-01203-7
Michel, C., Hamilton, J., Hansen, E., Barber, D., Reigstad, M., Iacozza, J., et al. (2015). Arctic Ocean outflow shelves in the changing Arctic: a review and perspectives. Prog. Oceanogr. 139, 66–88. doi: 10.1016/j.pocean.2015.08.007
Mitarai, S., Siegel, D. A., Watson, J. R., Dong, C., and McWilliams, J. C. (2009). Quantifying connectivity in the coastal ocean with application to the Southern California Bight. J. Geophys. Res. Oceans 114:C10026. doi: 10.1029/2008JC005166
Mojica, K. D., Huisman, J., Wilhelm, S. W., and Brussaard, C. P. (2016). Latitudinal variation in virus-induced mortality of phytoplankton across the North Atlantic Ocean. ISME J. 10:500. doi: 10.1038/ismej.2015.130
Moore, S. E., Stabeno, P. J., Grebmeier, J. M., and Okkonen, S. R. (2018). The Arctic Marine Pulses Model: linking annual oceanographic processes to contiguous ecological domains in the Pacific Arctic. Deep Sea Res. II Top. Stud. Oceanogr. 152, 8–21. doi: 10.1016/j.dsr2.2016.10.011
Nelson, D. M., and Brand, L. E. (1979). Cell division periodicity in 13 species of marine phytoplankton on a light: dark cycle 1. J. Phycol. 15, 67–75. doi: 10.1111/j.1529-8817.1979.tb02964.x
Nöthig, E.-M., Bracher, A., Engel, A., Metfies, K., Niehoff, B., Peeken, I., et al. (2015). Summertime plankton ecology in Fram Strait—a compilation of long-and short-term observations. Polar Res. 34:23349. doi: 10.3402/polar.v34.23349
Olli, K., Wassmann, P., Reigstad, M., Ratkova, T. N., Arashkevich, E., Pasternak, A., et al. (2007). The fate of production in the central Arctic Ocean–top–down regulation by zooplankton expatriates? Prog. Oceanogr. 72, 84–113. doi: 10.1016/j.pocean.2006.08.002
Pacariz, S. V., Hátún, H., Jacobsen, J. A., Johnson, C., Eliasen, S., and Rey, F. (2016). Nutrient-driven poleward expansion of the Northeast Atlantic mackerel (Scomber scombrus) stock: a new hypothesis. Elem. Sci. Anth. 4:000105. doi: 10.12952/journal.elementa.000105
Pancic, M., Hansen, P. J., Tammilehto, A., and Lundholm, N. (2015). Resilience to temperature and pH in a future climate change scenario in six strains of the polar diatom Fragilariopsis cylindrus. Biogeosciences 12, 4235–4244. doi: 10.5194/bg-12-4235-2015
Paulsen, M. L., Doré, H., Garczarek, L., Seuthe, L., Müller, O., Sandaa, R.-A., et al. (2016). Synechococcus in the Atlantic gateway to the Arctic Ocean. Front. Mar. Sci. 3:191. doi: 10.3389/fmars.2016.00191
Paulsen, M. L., Seuthe, L., Reigstad, M., Larsen, A., Cape, M. R., and Vernet, M. (2018). Asynchronous accumulation of organic carbon and nitrogen in the Atlantic gateway to the Arctic Ocean. Front. Mar. Sci. 5:416. doi: 10.3389/fmars.2018.00416
Pérez-Hernández, M. D., Pickart, R. S., Pavlov, V., Våge, K., Ingvaldsen, R., Sundfjord, A., et al. (2017). The atlantic water boundary current north of svalbard in late summer. J. Geophys. Res. Oceans 122, 2269–2290. doi: 10.1002/2016jc012486
Polyakov, I. V., Pnyushkov, A. V., Alkire, M. B., Ashik, I. M., Baumann, T. M., Carmack, E. C., et al. (2017). Greater role for Atlantic inflows on sea-ice loss in the Eurasian Basin of the Arctic Ocean. Science 356, 285–291. doi: 10.1126/science.aai8204
Polyakov, I. V., Pnyushkov, A. V., and Timokhov, L. A. (2012). Warming of the Intermediate Atlantic Water of the Arctic Ocean in the 2000s. J. Clim. 25, 8362–8370. doi: 10.1175/jcli-d-12-00266.1
Popova, E., Yool, A., Aksenov, Y., and Coward, A. (2013). Role of advection in Arctic Ocean lower trophic dynamics: a modeling perspective. J. Geophys. Res. Oceans 118, 1571–1586. doi: 10.1002/jgrc.20126
Randelhoff, A., Fer, I., and Sundfjord, A. (2017). Turbulent upper-ocean mixing affected by meltwater layers during Arctic summer. J. Phys. Oceanogr. 47, 835–853. doi: 10.1175/jpo-d-16-0200.1
Randelhoff, A., Fer, I., Sundfjord, A., Tremblay, J. É., and Reigstad, M. (2016). Vertical fluxes of nitrate in the seasonal nitracline of the Atlantic sector of the Arctic Ocean. J. Geophys. Res. Oceans 121, 5282–5295. doi: 10.1002/2016jc011779
Randelhoff, A., Reigstad, M., Chierici, M., Sundfjord, A., Ivanov, V., Cape, M., et al. (2018). Seasonality of the physical and biogeochemical hydrography in the inflow to the Arctic Ocean Through Fram Strait. Front. Mar. Sci. 5:224. doi: 10.3389/fmars.2018.00224
Randelhoff, A., Sundfjord, A., and Reigstad, M. (2015). Seasonal variability and fluxes of nitrate in the surface waters over the Arctic shelf slope. Geophys. Res. Lett. 42, 3442–3449. doi: 10.1002/2015gl063655
Reigstad, M., Wassmann, P., Riser, C. W., Øygarden, S., and Rey, F. (2002). Variations in hydrography, nutrients and chlorophyll a in the marginal ice-zone and the central Barents Sea. J. Mar. Syst. 38, 9–29. doi: 10.1016/s0924-7963(02)00167-7
Rey, F., and Loeng, H. (1985). “The influence of ice and hydrographic conditions on the development of phytoplankton in the Barents Sea,” in Marine Biology of Polar Regions and Effects of Stress on Marine Organisms, eds J. S. Gray and M. E. Christensen (New York, NY: John Wiley and Sons), 49–63.
Rudels, B., Bjork, G., Nilsson, J., Winsor, P., Lake, I., and Nohr, C. (2005). The interaction between waters from the Arctic Ocean and the Nordic Seas north of Fram Strait and along the East Greenland Current: results from the Arctic Ocean-02 Oden expedition. J. Mar. Syst. 55, 1–30. doi: 10.1016/j.jmarsys.2004.06.008
Rudels, B., Jones, E. P., Anderson, L. G., and Kattner, G. (1994). “On the intermediate depth waters of the Arctic Ocean,” in The Polar Oceans and Their Role in Shaping the Global Environment, Vol. 85, eds O. M. Johannessen, R. D. Muench, and J. E. Overland (Washington, DC: AGU), 33–46. doi: 10.1029/gm085p0033
Rudels, B., Jones, E. P., Schauer, U., and Eriksson, P. (2004). Atlantic sources of the Arctic Ocean surface and halocline waters. Polar Res. 23, 181–208. doi: 10.1021/acs.est.7b00788
Rudels, B., Korhonen, M., Schauer, U., Pisarev, S., Rabe, B., and Wisotzki, A. (2015). Circulation and transformation of Atlantic water in the Eurasian Basin and the contribution of the Fram Strait inflow branch to the Arctic Ocean heat budget. Prog. Oceanogr. 132, 128–152. doi: 10.1016/j.pocean.2014.04.003
Sakshaug, E. (1993). The relationship between phytoplankton growth rate and production with emphasis on respiration and excretion. ICES Mar. Sci. Symp. 197, 63–68.
Saloranta, T. M., and Haugan, P. M. (2004). Northward cooling and freshening of the warm core of the West spitsbergen current. Polar Res. 23, 79–88. doi: 10.3402/polar.v23i1.6268
Sanz-Martín, M., Vernet, M., Cape, M. R., Mesa, E., Delgado-Huertas, A., Reigstad, M., et al. (2019). Relationship between carbon- and oxygen-based primary productivity in the Arctic Ocean, Svalbard Archipelago. Front. Mar. Sci. 6:468. doi: 10.3389/fmars.2019.00468
Schröter, F., Havermans, C., Kraft, A., Knüppel, N., Beszczynska-Möller, A., Bauerfelnd, E., et al. (2019). Pelagic amphipods in the eastern Fram Strait with continuing presence of Thermisto compressa based on sediment trap time series. Front. Mar. Sci. 6:311. doi: 10.3389/fmars.2019.00311
Slagstad, D., Ellingsen, I., and Wassmann, P. (2011). Evaluating primary and secondary production in an Arctic Ocean void of summer sea ice: an experimental simulation approach. Prog. Oceanogr. 90, 117–131. doi: 10.1016/j.pocean.2011.02.009
Slagstad, D., and McClimans, T. A. (2005). Modeling the ecosystem dynamics of the Barents Sea including the marginal ice zone: I. Physical and chemical oceanography. J. Mar. Syst. 58, 1–18. doi: 10.1016/j.jmarsys.2005.05.005
Slagstad, D., Wassmann, P. F., and Ellingsen, I. (2015). Physical constrains and productivity in the future Arctic Ocean. Front. Mar. Sci. 2:85. doi: 10.3389/fmars.2015.00085
Søreide, J. E., Leu, E., Berge, J., Graeve, M., and Falk-Petersen, S. (2010). Timing of blooms, algal food quality and Calanus glacialis reproduction and growth in a changing Arctic. Glob. Change Biol. 16, 3154–3163.
Stroeve, J., and Notz, D. (2018). Changing state of Arctic sea ice across all seasons. Environ. Res. Lett. 13:103001. doi: 10.1371/journal.pone.0131246
Svensen, C., Halvorsen, E., Vernet, M., Franzè, G., Dmoch, K., Lavrentyev, P. J., et al. (2019). Zooplankton communities associated with new and regenerated primary production in the Atlantic inflow north of Svalbard. Front. Mar. Sci. 6:293. doi: 10.3389/fmars.2019.00293
Sætre, R. (2007). The Norwegian Coastal Current: Oceanography and Climate. Trondheim: Akademika Publishing.
Torres-Valdés, S., Tsubouchi, T., Bacon, S., Naveira-Garabato, A. C., Sanders, R., McLaughlin, F. A., et al. (2013). Export of nutrients from the Arctic Ocean. J. Geophys. Res. Oceans 118, 1625–1644. doi: 10.1002/jgrc.20063
Tremblay, J. -É., Anderson, L. G., Matrai, P., Coupel, P., Bélanger, S., Michel, C., et al. (2015). Global and regional drivers of nutrient supply, primary production and CO2 drawdown in the changing Arctic Ocean. Prog. Oceanogr. 139, 171–196. doi: 10.1016/j.pocean.2015.08.009
Treml, E. A., Halpin, P. N., Urban, D. L., and Pratson, L. F. (2008). Modeling population connectivity by ocean currents, a graph-theoretic approach for marine conservation. Landsc. Ecol. 23, 19–36. doi: 10.1007/s10980-007-9138-y
Verity, P. G., Wassmann, P., Ratkova, T. N., Andreassen, I. J., Nordby, E., and Høisæter, T. (1999). Seasonal patterns in composition and biomass of autotrophic and heterotrophic nano-and microplankton communities on the north Norwegian shelf. Sarsia 84, 265–277. doi: 10.1080/00364827.1999.10420431
Vernet, M., Matrai, P. A., and Andreassen, I. (1998). Synthesis of particulate and extracellular carbon by phytoplankton at the marginal ice zone in the Barents Sea. J. Geophys. Res. Oceans 103, 1023–1037. doi: 10.1029/97jc02288
Vernet, M., Richardson, T. L., Metfies, K., Nöthig, E.-M., and Peeken, I. (2017). Models of plankton community changes during a warm water anomaly in arctic waters show altered trophic pathways with minimal changes in carbon export. Front. Mar. Sci. 4:160. doi: 10.3389/fmars.2017.00160
Vörösmarty, C., Fekete, B., and Tucker, B. (1996). River Discharge Database, Version 1.0 (RivDIS v1. 0), Volumes 0 through 6. A Contribution to IHP-V Theme: 1. Technical Documents in Hydrology Series. Paris: UNESCO.
Vörösmarty, C., Fekete, B., and Tucker, B. (1998). River Discharge Database, Version 1.1 (RivDIS v1. 0 Supplement). Durham, NH: Institute for the Study of Earth, Oceans, and Space, University of New Hampshire.
Walczowski, W., Piechura, J., Goszczko, I., and Wieczorek, P. (2012). Changes in Atlantic water properties: an important factor in the European Arctic marine climate. ICES J. Mar. Sci. 69, 864–869. doi: 10.1093/icesjms/fss068
Wassmann, P., Kosobokova, K., Slagstad, D., Drinkwater, K., Hopcroft, R., Moore, S., et al. (2015). The contiguous domains of Arctic Ocean advection: trails of life and death. Prog. Oceanogr. 139, 42–65. doi: 10.1016/j.pocean.2015.06.011
Wassmann, P., and Reigstad, M. (2011). Future Arctic Ocean seasonal ice zones and implications for pelagic-benthic coupling. Oceanography 24, 220–231. doi: 10.5670/oceanog.2011.74
Wassmann, P., Slagstad, D., and Ellingsen, I. (2010). Primary production and climatic variability in the European sector of the Arctic Ocean prior to 2007: preliminary results. Polar Biol. 33, 1641–1650. doi: 10.1007/s00300-010-0839-3
Wassmann, P., Slagstad, D., and Ellingsen, I. (2019). Advection of mesozooplankton into the northern Svalbard shelf region. Front. Mar. Sci. 6:458. doi: 10.3389/fmars.2019.00458
Wassmann, P., Slagstad, D., Riser, C. W., and Reigstad, M. (2006). Modelling the ecosystem dynamics of the Barents Sea including the marginal ice zone: II. Carbon flux and interannual variability. J. Mar. Syst. 59, 1–24. doi: 10.1016/j.jmarsys.2005.05.006
Wekerle, C., Wang, Q., Danilov, S., Schourup-Kristensen, V., von Appen, W. J., and Jung, T. (2017). Atlantic Water in the Nordic Seas: locally eddy-permitting ocean simulation in a global setup. J. Geophys. Res. Oceans 122, 914–940. doi: 10.1002/2016jc012121
Keywords: advection, phytoplankton, carbon, Atlantic water inflow, Arctic Ocean, Fram Strait, West Spitsbergen Current
Citation: Vernet M, Ellingsen IH, Seuthe L, Slagstad D, Cape MR and Matrai PA (2019) Influence of Phytoplankton Advection on the Productivity Along the Atlantic Water Inflow to the Arctic Ocean. Front. Mar. Sci. 6:583. doi: 10.3389/fmars.2019.00583
Received: 29 November 2018; Accepted: 03 September 2019;
Published: 27 September 2019.
Edited by:
Alberto Basset, University of Salento, ItalyReviewed by:
Kemal Can Bizsel, Dokuz Eylül University, TurkeyCopyright © 2019 Vernet, Ellingsen, Seuthe, Slagstad, Cape and Matrai. This is an open-access article distributed under the terms of the Creative Commons Attribution License (CC BY). The use, distribution or reproduction in other forums is permitted, provided the original author(s) and the copyright owner(s) are credited and that the original publication in this journal is cited, in accordance with accepted academic practice. No use, distribution or reproduction is permitted which does not comply with these terms.
*Correspondence: Maria Vernet, bXZlcm5ldEB1Y3NkLmVkdQ==
Disclaimer: All claims expressed in this article are solely those of the authors and do not necessarily represent those of their affiliated organizations, or those of the publisher, the editors and the reviewers. Any product that may be evaluated in this article or claim that may be made by its manufacturer is not guaranteed or endorsed by the publisher.
Research integrity at Frontiers
Learn more about the work of our research integrity team to safeguard the quality of each article we publish.